Article

Distributed Representation for Assembly Code

Department of Information Sciences, Tokyo University of Science, Yamazaki, Chiba 278-8510, Japan
*
Authors to whom correspondence should be addressed.
Computers 2023, 12(11), 222; https://doi.org/10.3390/computers12110222
Submission received: 11 August 2023 / Revised: 25 October 2023 / Accepted: 25 October 2023 / Published: 1 November 2023
(This article belongs to the Special Issue Best Practices, Challenges and Opportunities in Software Engineering)

Abstract

:
In recent years, the number of similar software products with many common parts has been increasing due to the reuse and plagiarism of source code in the software development process. Pattern matching, which is an existing method for detecting similarity, cannot detect the similarities between these software products and other programs. It is necessary, for example, to detect similarities based on commonalities in both functionality and control structures. At the same time, detailed software analysis requires manual reverse engineering. Therefore, technologies that automatically identify similarities among the arge amounts of code present in software products in advance can reduce these oads. In this paper, we propose a representation earning model to extract feature expressions from assembly code obtained by statically analyzing such code to determine the similarity between software products. We use assembly code to eliminate the dependence on the existence of source code or differences in development anguage. The proposed approach makes use of Asm2Vec, an existing method, that is capable of generating a vector representation that captures the semantics of assembly code. The proposed method also incorporates information on the program control structure. The control structure can be represented by graph data. Thus, we use graph embedding, a graph vector representation method, to generate a representation vector that reflects both the semantics and the control structure of the assembly code. In our experiments, we generated expression vectors from multiple programs and used clustering to verify the accuracy of the approach in classifying similar programs into the same cluster. The proposed method outperforms existing methods that only consider semantics in both accuracy and execution time.

1. Introduction

In recent years, technologies for determining software similarity have been attracting attention. This is due to the increase in the number of variants of malware that have been modified from existing malware and the increase in the number of similar software products that share common functions and control structures through the reuse and theft of source code [1]. These variants of malware and similar software products cannot be detected by existing matching methods. Therefore, it is necessary to conduct reverse engineering analysis to identify the similarities in function and control structure. However, reverse engineering requires manual work, and dynamic analysis of actual behavior requires an analysis environment such as a sandbox [2]. Therefore, by automatically identifying similarities between software products from static analysis results in advance, the software products that need to be reverse engineered can be selected and the manual workload can be greatly reduced.
There are two approaches to detecting similarities between different programs, one is targeting source code and the other is targeting binaries. In source-code-targeted approaches, code clones, which are pieces of code that match or are similar to each other in the source code, are used [3,4]. Methods for detecting code clones include detecting matching or similar sequences of characters or ines [5,6], matching or similar sequences of tokens [7,8], and matching or similar abstract syntax trees [9]. However, this approach requires source code, and software source code is not always available. It may also be dependent on coding style and the development anguage.
Binary-targeted approaches include binary difference comparison and similarity digests. The binary difference comparison approach extracts and compares the common parts or differences between two input binaries. For example, the ength of the ongest common segment (LCS [10]) of an executable code sequence can be determined using a method that graphs the control structure of a program and compares these features [11]. However, while binary difference comparison can reduce the number of analysis targets by extracting differences between two binaries, it is unsuitable for comparing arge amounts of data at the same time due to its characteristics. A similarity digest is a data digest that preserves the similarity of the input; typical methods include ssdeep [12] and sdhash [13]. Since ssdeep generates digests while dividing the input string, partial comparisons between inputs are possible. Meanwhile, sdhash can compare the features it retains with a Bloom filter that stores the features extracted from the input string. However, while similarity digests can handle arge amounts of data simultaneously, their output is often a variable-length string. For ease of comparison and applicability to other tasks, the output should be a fixed-length vector representation.
In this study, as a method for detecting similarities between different software products and programs, we use a distributed representation of assembly code obtained by statically analyzing the executable code of software products and programs. Distributed representation is a method for embedding discrete objects, such as inguistic symbols, into a vector space and representing them as real-valued vectors; typical methods include Word2Vec [14] for words, Doc2Vec [15] for sentences, and Code2Vec for snippets of program code [16]. In the proposed method, the assembly code and the control flow graph (CFG) (Figure 1), which represents the control structure of the program based on the assembly code, are represented as vectors using a distributed representation of graph data known as graph embedding [17,18,19,20,21], which is a distributed representation of graph data. This enables a fixed-length vector representation that reflects the meaning and control structure of the target. If the semantics and control structures of different programs are similar, the generated vectors will be close in vector space. This allows the comparison of expression vectors to identify similar software products and programs. In addition, by using assembly code obtained from executable code, the approach is not dependent on the existence of source code or a common development anguage by the target software products. In our experiments, we evaluate the proposed method by classifying the obtained expression vectors among programs derived from a single program that have partial modifications to the source code of that program but no significant differences in the overall control flow.

2. Related Works

2.1. Representation Learning Model for Assembly Code

Asm2Vec [22] is an assembly code representation earning model created by Ding et al. In this study, Ding et al. used an expression earning model based on the syntax of assembly code examples to detect assembly functions in the same source code that have been changed in syntax or control structure by compiler options or obfuscation as clones based on semantic similarity.
Asm2Vec earns a representation of assembly code based on the PV-DM model [15]. In contrast to plain text, which is placed sequentially, here, assembly code contains a specific syntax and a structure different from the text. Therefore, Ding et al. represent the assembly code of each assembly function in CFG, and create multiple sequences based on its syntax. First, the approach selectively expands the calling function for a function call instruction in an assembly function. Second, for the caller-extended CFGs obtained, sequences are created by the following two methods:

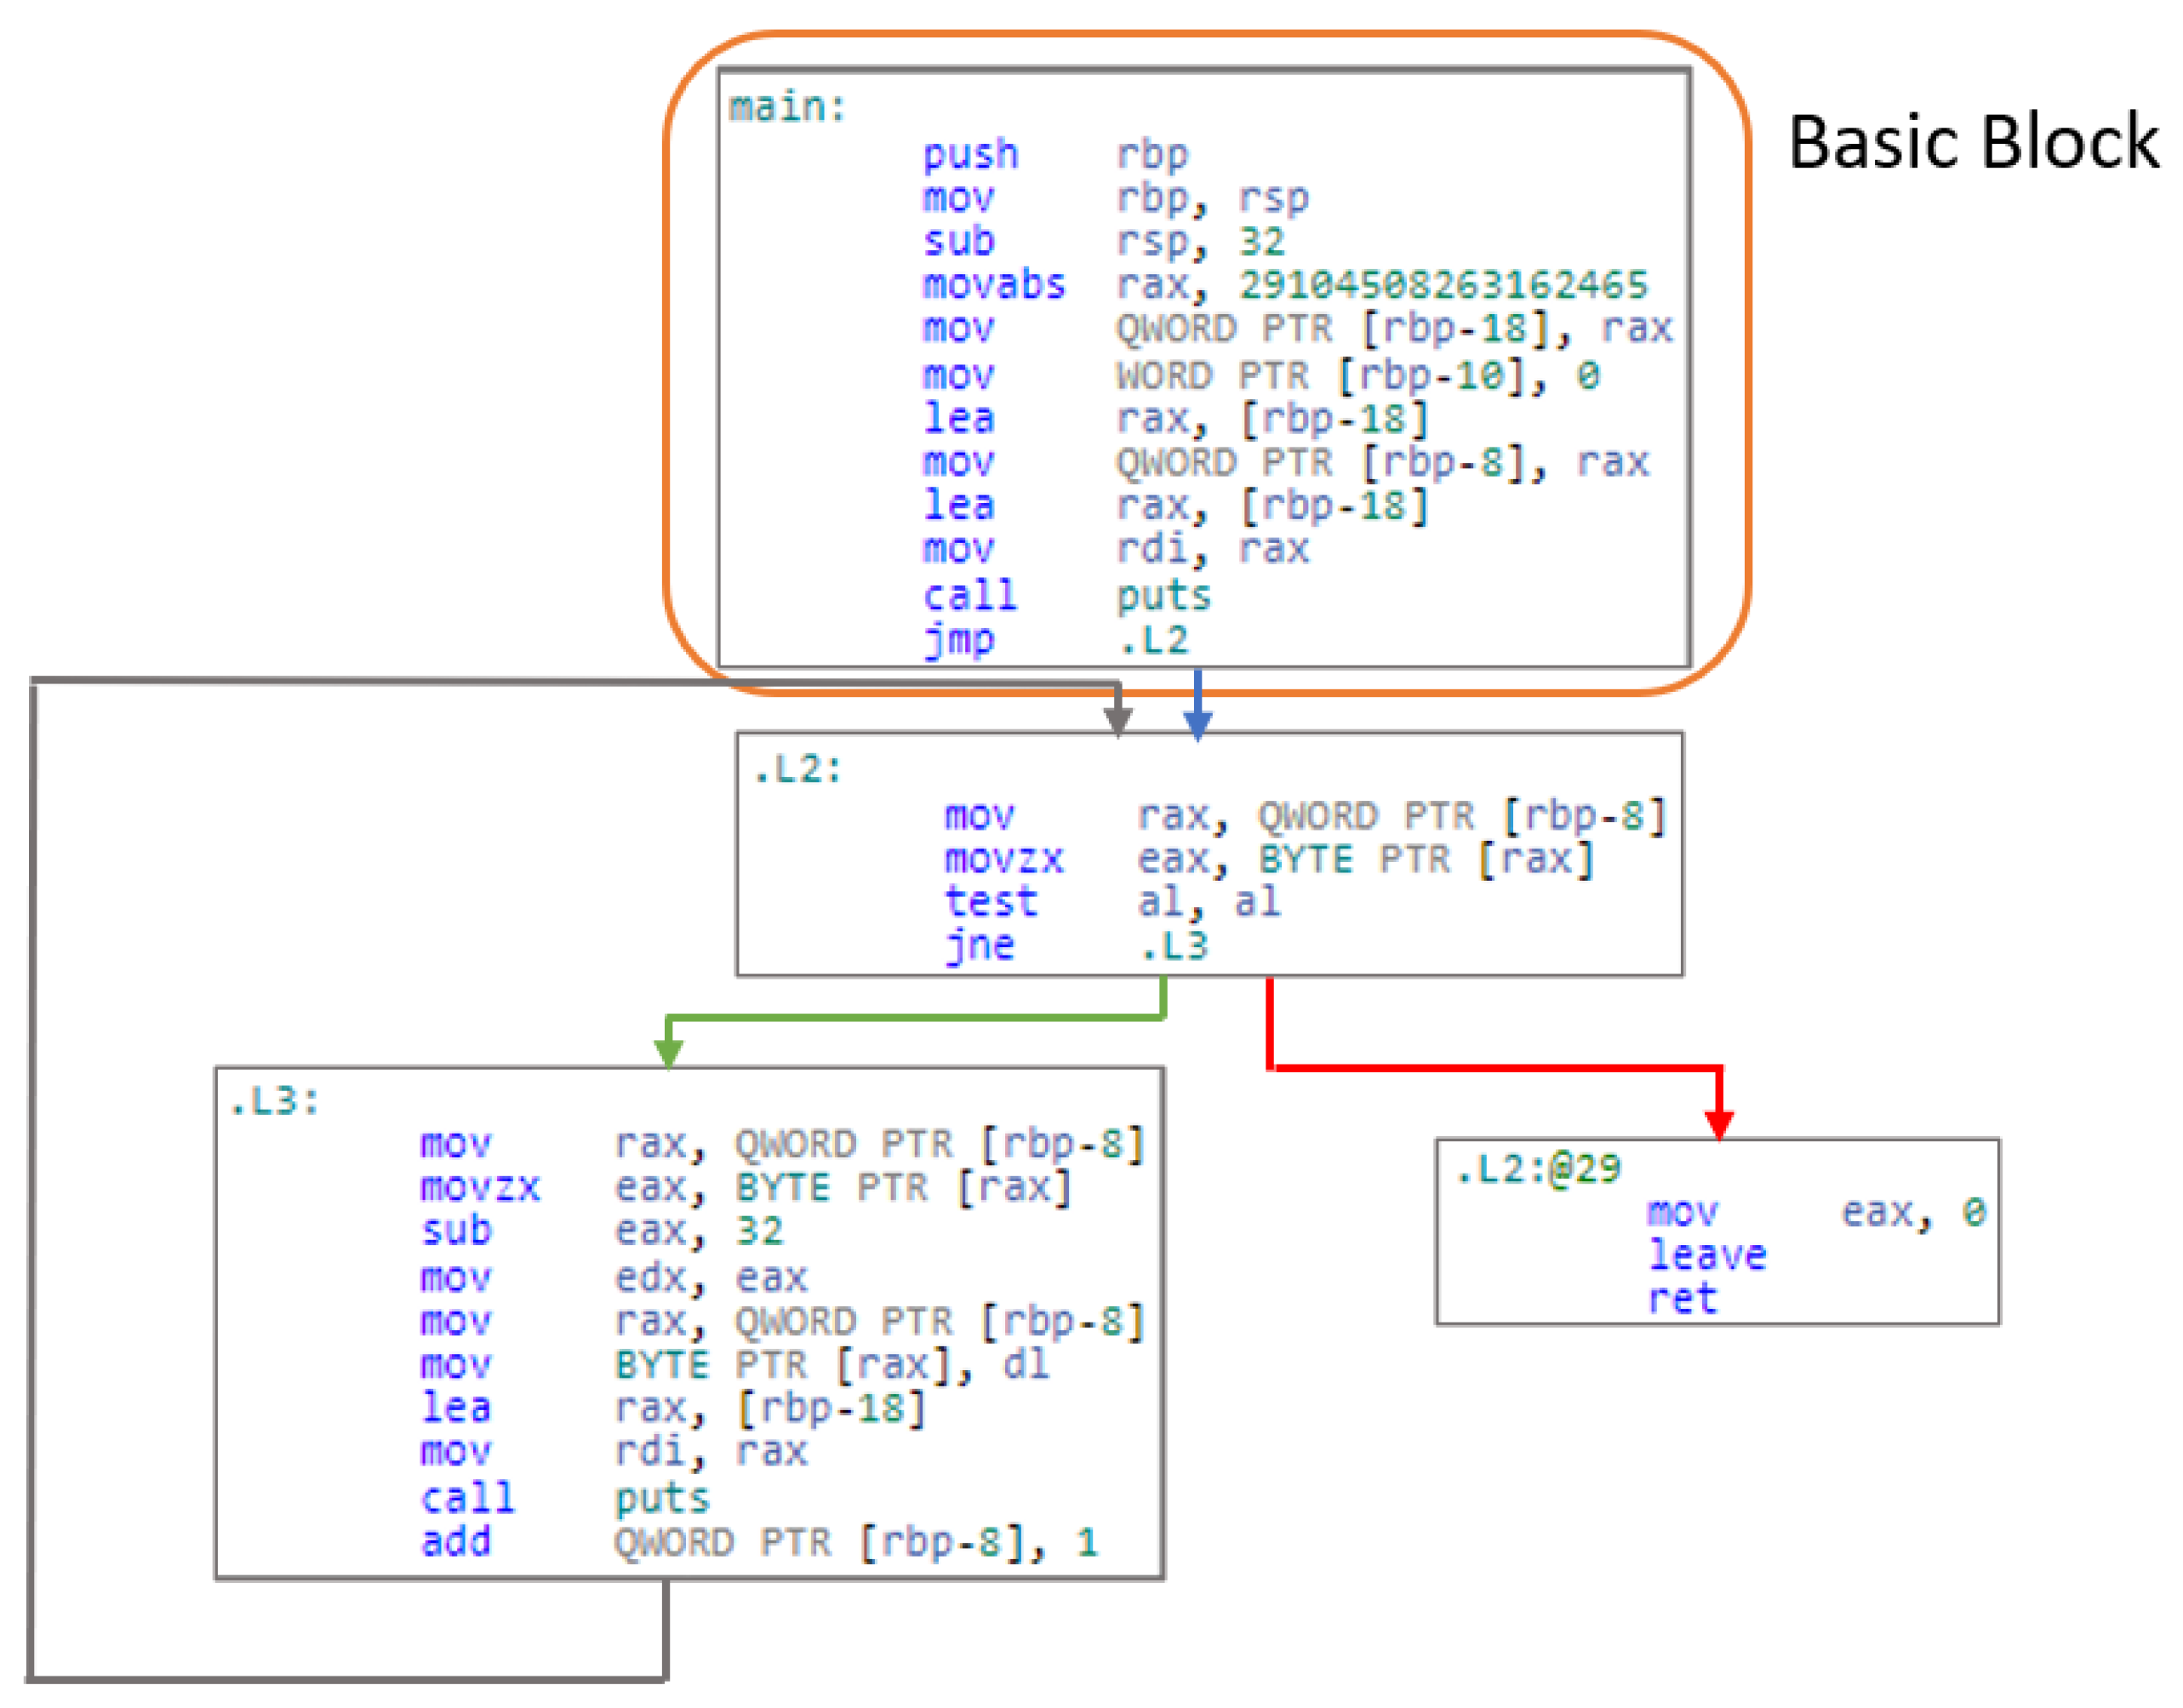
2.1.1. Edge Coverage

In edge coverage, edges are sampled randomly until all the edges of the CFG are covered, and the assembly code of the basic blocks at both ends are concatenated to create a sequence.

2.1.2. Random Walks

Random walks randomly select movable blocks starting from the entrance block and follow the CFG. The assembly code of the passed blocks are concatenated to make a sequence.
The repository R P contains the assembly functions used to train the embedding. After creating a sequence for each function in the repository R P , a neural network is used to maximize the next og probability over the entire repository R P .
R = R P S ( f s ) I ( s e q i ) T ( i n j ) f s s e q i i n j t c log P ( t c | f s , i n j 1 , i n j + 1 )
S ( f s ) = s e q [ 1 : i ] , f s R P I ( s e q i ) = i n [ 1 : j ] , s e q i S ( f s ) T ( i n j ) = O P ( i n j ) | | A ( i n j ) , i n j I ( s e q i ) t c T ( i n j )
  • RP: A repository containing the assembly functions;
  • S ( f s ) : Set of sequences generated from the function f s in the repository RP;
  • I ( s e q i ) : Set of instructions contained in the i-th sequence s e q i of function f s ;
  • T ( i n j ) : Set of tokens (operands and opcodes) contained in the j-th instruction i n j of the sequence s e q i ;
  • O P ( i n j ) : Opcode of instruction i n j ;
  • A ( i n j ) : Set of operands in instruction i n j ;
  • t c : Current target token in instruction i n j .
Equation (1) represents the og probability of detecting a token t c at the current instruction i n j from adjacent instructions i n j 1 , i n j + 1 for each sequence s e q i of the assembly function f s , in order. Maximizing this value means predicting the current instruction from the embedding vector of the assembly function and adjacent instructions (Figure 2). Using this model, Asm2Vec enables the creation of a distributed representation that captures the semantics of pieces of assembly code. If the embedding vector of the token t is v t R d , then instruction i is treated as a concatenation of tokens, and the embedding vector is v i R 2 × d , and the embedding vector of function f s is θ f s R 2 × d . Furthermore, d is a parameter specified by the user and represents the dimension of the embedding.

3. Proposed Method

3.1. Overview

In many cases, similar programs derived from one program have only partial modifications, additions, or deletions from the original source code. The proposed method aims for vector representations that are similar between programs that have many of these common parts.
Asm2Vec uses a representation earning model based on the syntax of assembly code to realize a distributed representation that captures the semantics of the code. In contrast, in a static random walk, it is difficult to create a sequence that correctly reflects the number of oop processes, actual behaviors such as I/O-based processing, and the overall control structure. In addition, the accuracy and stability of the results depend on the number of random walks, and increasing the number of random walks may increase the execution time. Therefore, because CFGs are similar between similar programs with only partial modifications, the proposed method solves these problems through embedding and graph embedding for basic blocks and creating a distributed representation method for assembly code that enables comparison of semantic and structural similarities. In this study, we use only non-obfuscated assembly code. This maintains the integrity of the control flow and the basic blocks of the assembly code.

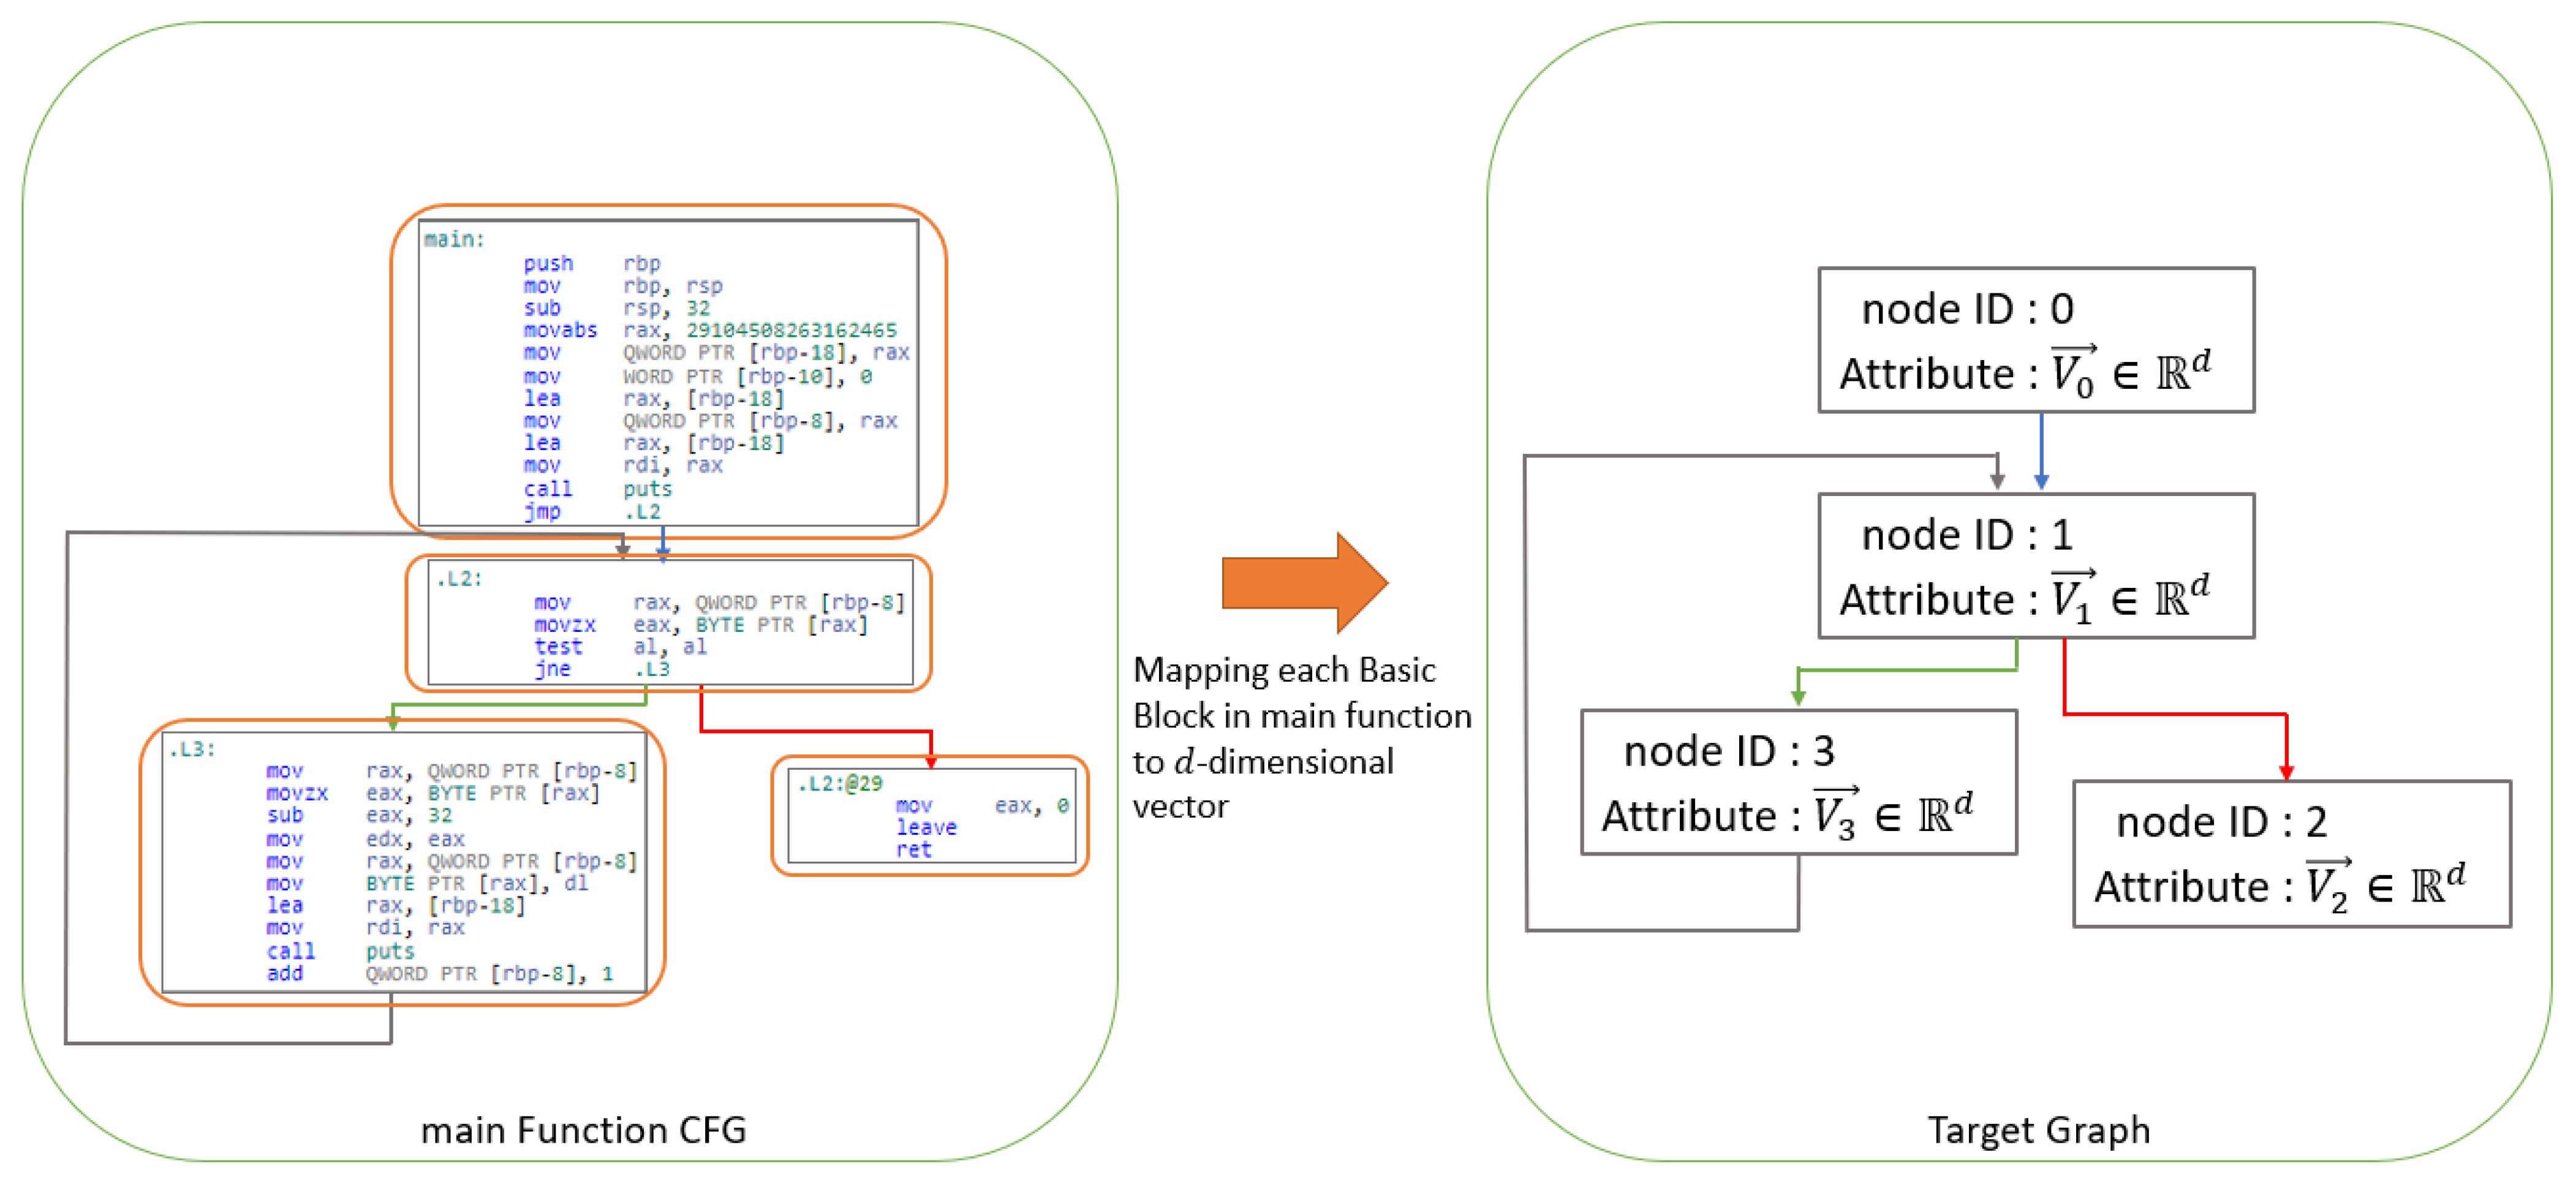
3.2. Generate Target Graph

In this study, the entire executable code of the program is the target of embedding. The following steps are then used to generate the graph to be embedded from the assembly code:

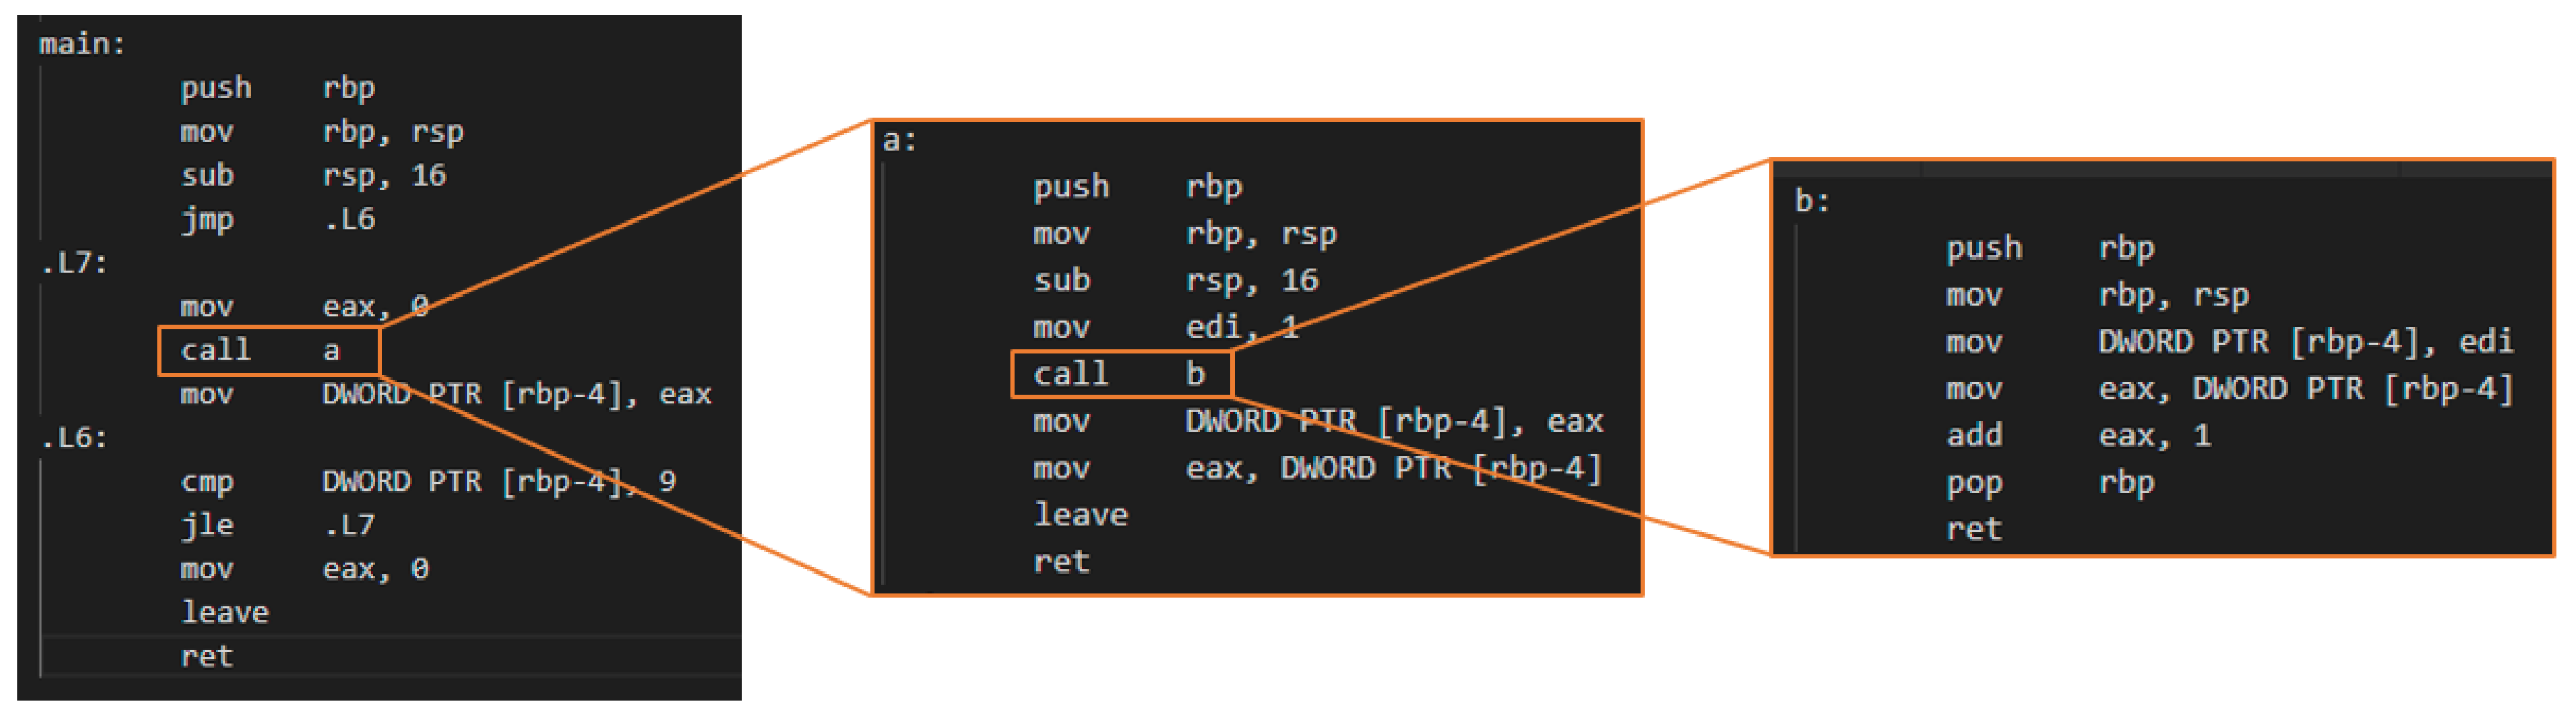
3.2.1. Function Call Expansion of Main Routine (Main Function)

In the main function, function calls are expanded recursively, and the function call instruction is replaced with the destination (Figure 3). The recursive function may be expanded no more than once. Standard ibrary functions are not expanded as they have sufficient semantics for earning embedding and only user-defined functions that exist in the executable code are targeted.

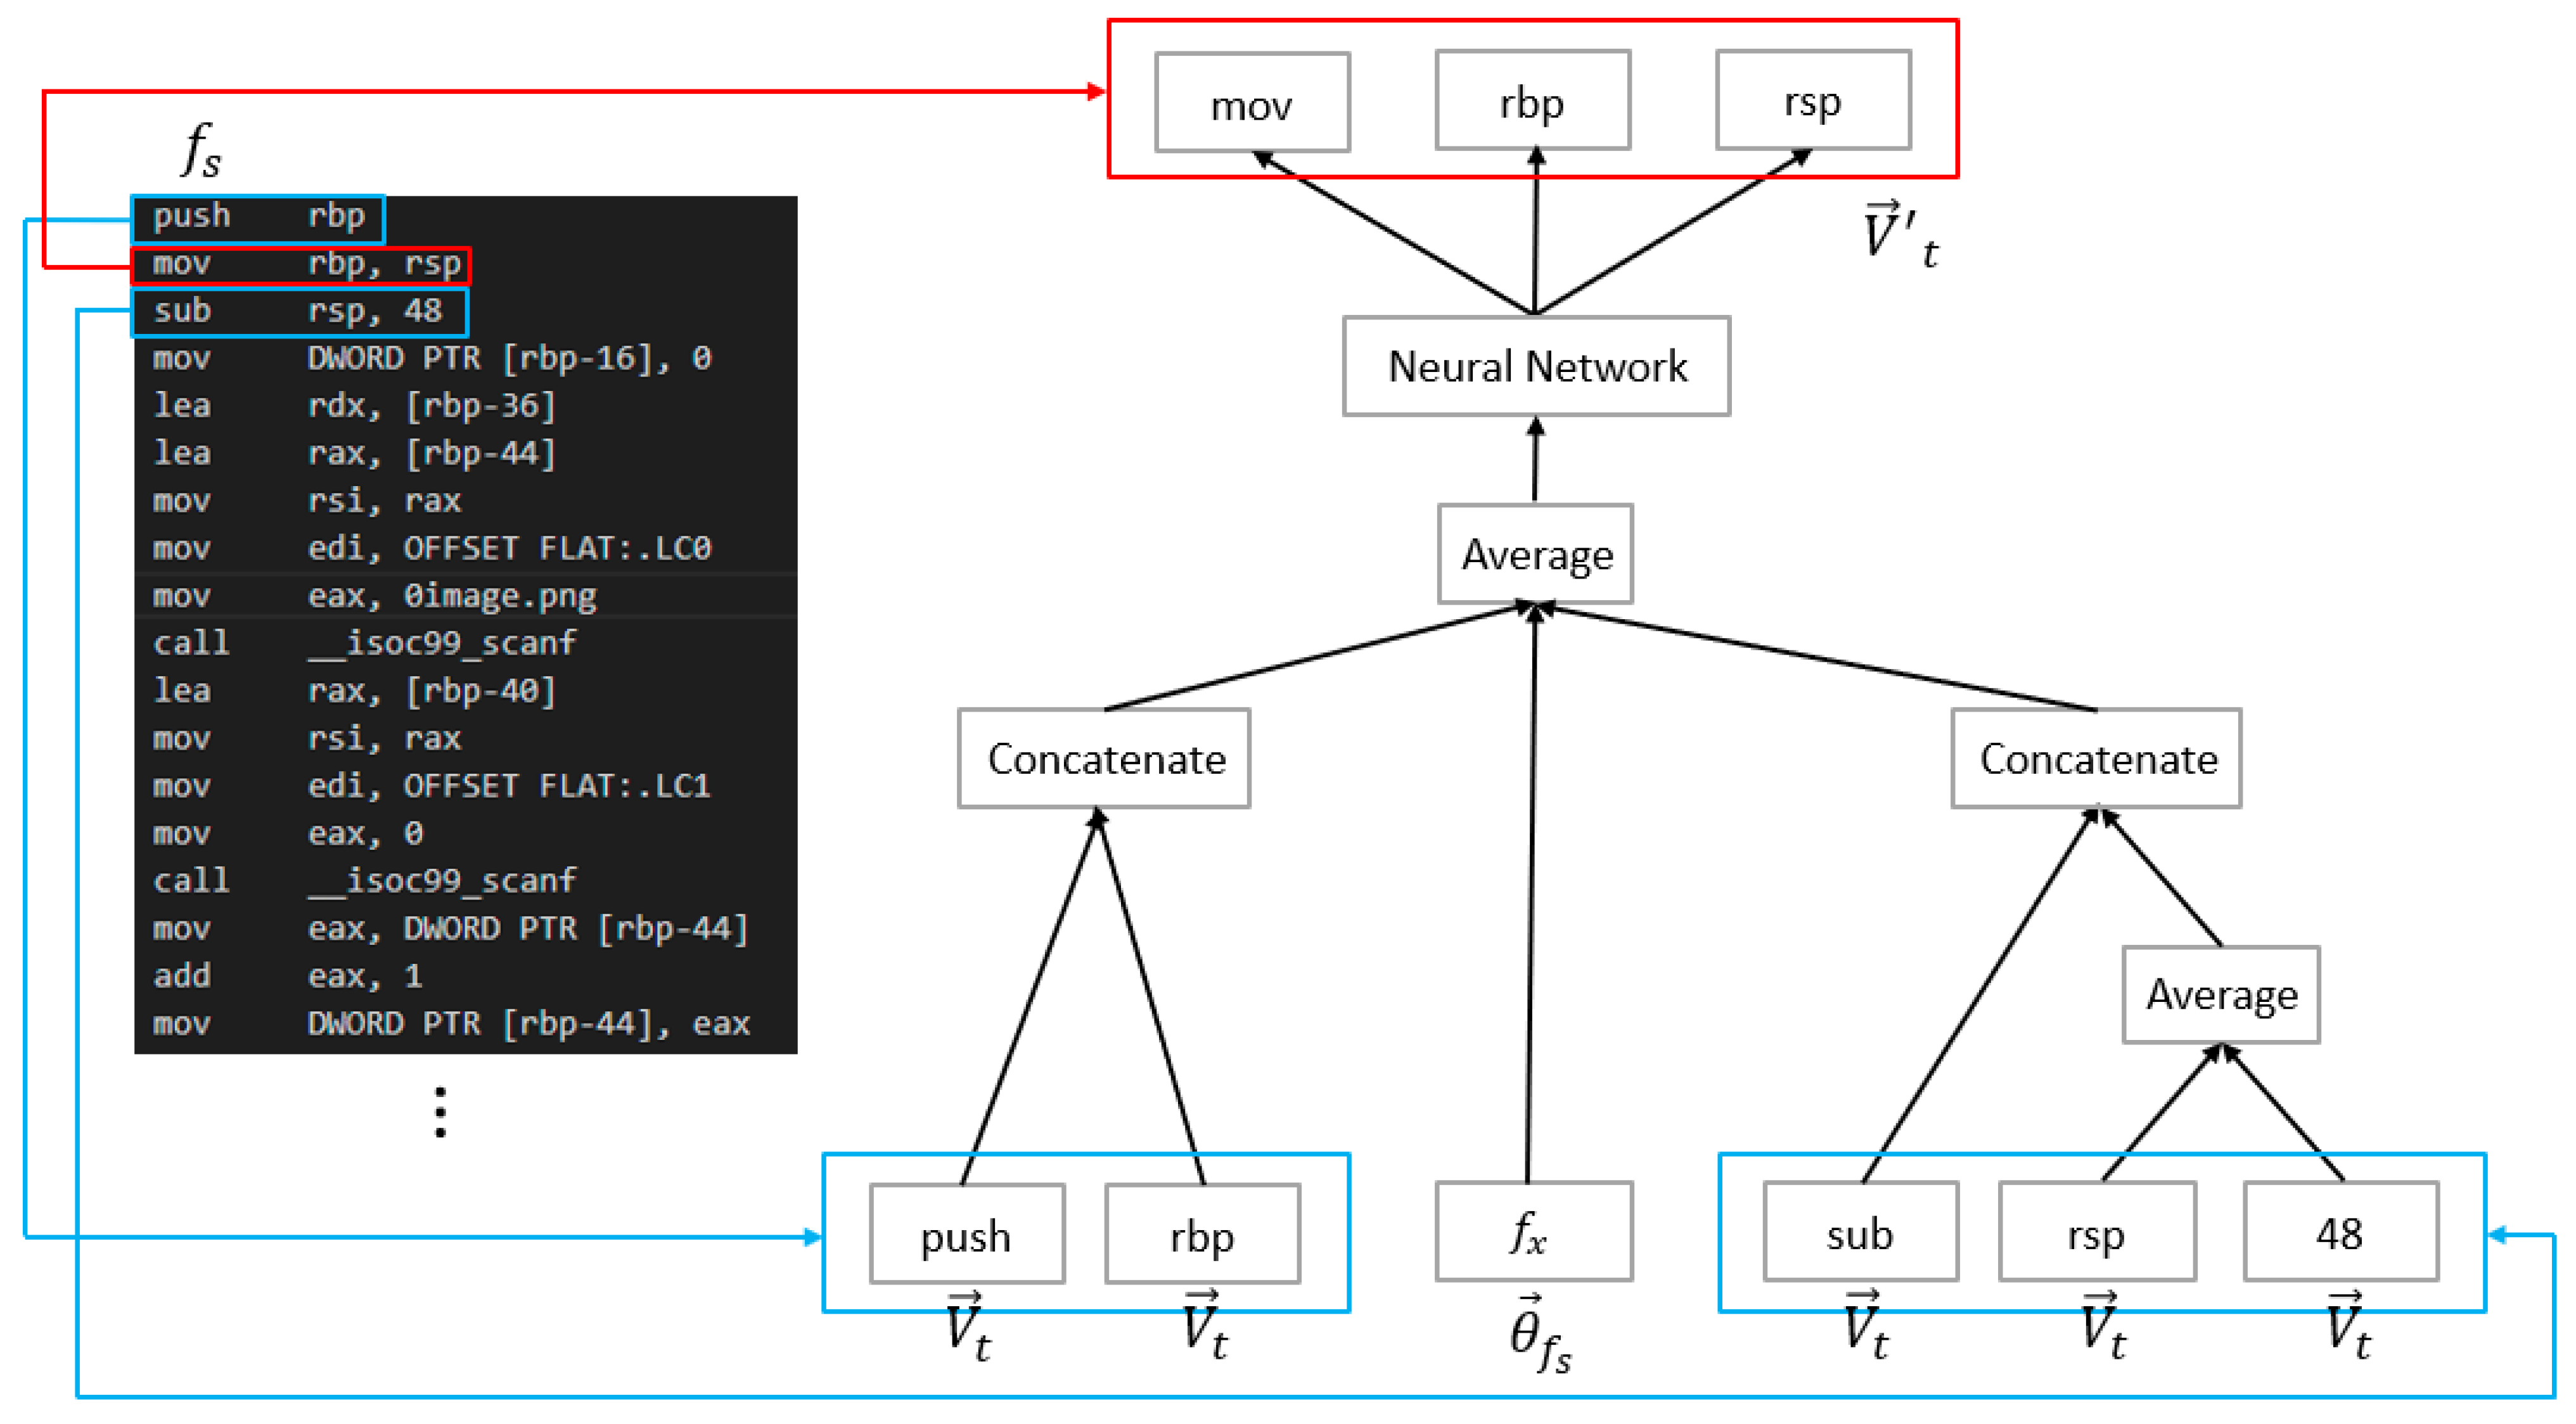
3.2.2. Vector Representation of Each Basic Block of the Main Function

Using Asm2Vec, we obtain a vector representation of the d-dimension for each basic block of the CFG of the main function that expands the function call. As the basic block does not contain branches or branch destinations and each instruction is placed in order, it can be treated as a sequence without randomness. Figure 4 shows the target graph of the CFG of the main function thus obtained. Herein, each node of the CFG has a d-dimensional vector representation of the basic block.

3.3. Graph Embedding Methods

The target graph to be embedded is a directed graph where each node has a vector of dimension d as an attribute. We use the vector representation method of this graph generated using FEATHER [23].

3.3.1. FEATHER

FEATHER [23] is a node-embedding method, created by Rozemberczki et al. that uses a complex functional characteristic function [24] with random walk probability weights to represent the feature distribution near a node. The characteristic function is a function that shows the characteristics of the distribution of a random variable and is an analog of the Fourier transform of the probability density.
FEATHER has the following features:
  • It is possible to embed three types of information into the hybrid: neighbor node information, structural roles, and node attributes (metadata possessed by the nodes);
  • The resulting vector representation of each node can be used as a representation of the entire graph by pooling it with a permutation-invariant function.
Based on these features, we obtain the representation vectors of the nodes of the target graph using FEATHER. Then, we calculate the representation vector of the whole graph using the arithmetic mean of the vectors as a pooling function. This is used as a distributed representation of the assembly code.
The following is the procedure for embedding a node.

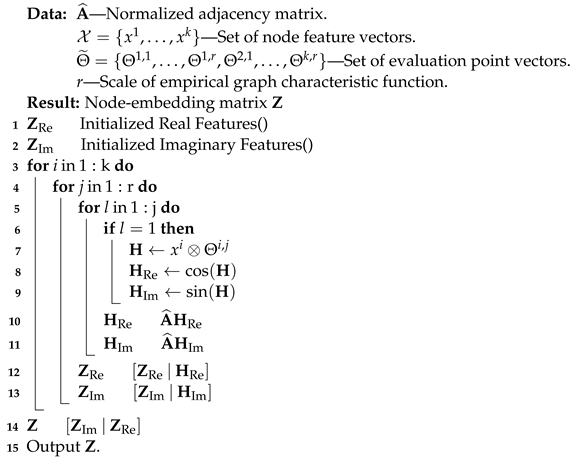
3.3.2. Characteristic Functions and Node-Embedding on Graphs in FEATHER

There is an attributed graph, G = ( V , E ) . The nodes of G have a random variable X defined as a feature vector X R | V | , where X v is the feature vector of node v V . When the distribution of this feature is described in the neighborhood of u V , the characteristic function of X of the source node u at the characteristic function evaluation point θ R is defined by the following equation, where i is an imaginary unit:
E [ e i θ X | G , u ] = w V P ( w | u ) · e i θ X w
In Equation (2), the affiliation probability P ( w | u ) represents the strength of the relationship between the source node u and the target node w V . The real and imaginary parts of Equation (2) are defined by the following equations, respectively.
Re ( E [ e i θ X | G , u ] ) = w V P ( w | u ) cos ( θ X w )
Im ( E [ e i θ X | G , u ] ) = w V P ( w | u ) sin ( θ X w )
Here, u and w are parameterized by the transition probabilities of random walks on the r scale. Let { v j , v j + 1 , , v j + r } be a sequence of nodes in a random walk on G. When describing the distribution of features in the neighborhood of u V reachable by a random walk (r scale) from u to r steps, we define each by the real and imaginary parts of the characteristic function as follows:
Re ( E [ e i θ X | G , u , r ] ) = w V P ( v j + r = w | v j = u ) cos ( θ X w )
Im ( E [ e i θ X | G , u , r ] ) = w V P ( v j + r = w | v j = u ) sin ( θ X w )
where P ( v j + r = w | v j = u ) = P ( w | u ) in Equations (5) and (6) is the probability that a random walk starting from source node u will reach target node w within r steps. If the adjacency matrix of G is A and the order matrix is D , the normalized adjacency matrix is defined as A ^ = D 1 A . For a pair of source and target nodes u , w and a scale r, P ( v j + r = w | v j = u ) can be represented by the r power of the normalized adjacency matrix. That is, A ^ u , w r = P ( v j + r = w | v j = u ) . From this we obtain the following equation:
Re ( E [ e i θ X | G , u , r ] ) = w V A ^ u , w r cos ( θ X w )
Im ( E [ e i θ X | G , u , r ] ) = w V A ^ u , w r sin ( θ X w )
The characteristic functions expressed in Equations (7) and (8) have the following properties
  • The real part is an even function and the imaginary part is a radix;
  • The range of both parts is [ 1 , 1 ] ;
  • Nodes with different structural roles have different characteristic functions.
For efficient computation, we extract d points from the domain of the characteristic function and evaluate the characteristic function at the point described by the evaluation point vector Θ R d . We define the r-scaled random walk weight characteristic function of the entire graph as the complex matrix-valued function C F ( G , X , Θ , r ) C | V | × d . The real and imaginary parts of this function are described by the following matrix-valued functions, respectively:
Re ( C F ( G , X , Θ , r ) ) = A ^ r cos ( X Θ )
Im ( C F ( G , X , Θ , r ) ) = A ^ r sin ( X Θ )
Each of these matrices corresponds to a node, and if two rows are similar, it means that the corresponding nodes have similar distributions in scale r. This describes the feature distribution around the node.
Next, the algorithm evaluates the characteristic function of the graph at all scales up to r for each node and each feature when there are k node features, that is, when the set of node features is defined as X = { X 1 , , X k } , the following Algorithm 1 evaluates the characteristic function of the graph at all scales up to r for each node and each feature. For simplicity, each value of the characteristic function evaluation vector Θ i , r R d , i { 1 , , k } are assumed to be the same.
1.
Initialize the real part Z Re and imaginary part Z Im of the embedding (lines 1 and 2);
2.
Repeat for each of the k different node features on a scale up to r (lines 3 and 4);
3.
At the first scale, compute the outer product H of the feature under consideration and the corresponding evaluation point vectors (lines 6 and 7);
4.
Take the cosine and sine of H (lines 8 and 9);
5.
Using the normalized adjacency matrix, compute the real part H Re and imaginary part H Im of the characteristic function evaluation (lines 10 and 11);
6.
Add matrices to the real and imaginary parts of the embedding (lines 12 and 13);
7.
Once the characteristic function of each feature is evaluated for each scale, concatenate and return the real and imaginary parts of the embedding (lines 14 and 15).
Algorithm 1: Node-embedding algorithm on FEATHER.
Computers 12 00222 i001

3.3.3. Pooling of Each Node

The real and imaginary parts of the mean pooled r-scale random-walk-weighted characteristic function are defined by the following equation:
Re ( E [ e i θ X | G , u , r ] ) = u V w V A ^ u , w r cos ( θ X w ) | V |
Im ( E [ e i θ X | G , u , r ] ) = u V w V A ^ u , w r sin ( θ X w ) | V |
The functions expressed in Equations (11) and (12) allow characterization and comparison based on the structural properties of the entire graph.

4. Experiment and Results

4.1. Experiment Overview

In our experiments, we use an experimental dataset to classify similar programs and evaluate the results. The experimental dataset consists of assembly code generated from the publicly available solution source code of the programming contest “Kyopuro tenkei 90 mon [25]”. The solution code for the same problem by the same author have many common parts due to reuse, and their control flows are similar. Therefore, we perform K-means clustering with cos similarity as the distance function on the set of expression vectors obtained from the experimental dataset, and measure the accuracy with which the solutions of the same creator are classified into the same cluster.

4.2. Experimental Data Sets

The experimental dataset consists of 32 assembly source files generated from the solution code.
Each assembly source file is written in assembly code and named according to the following naming convention:
  • One capital alphabet etter to indicate the solution creator;
  • Issue no.;
  • Sequential numbers for multiple solutions;
  • File extension (.s).
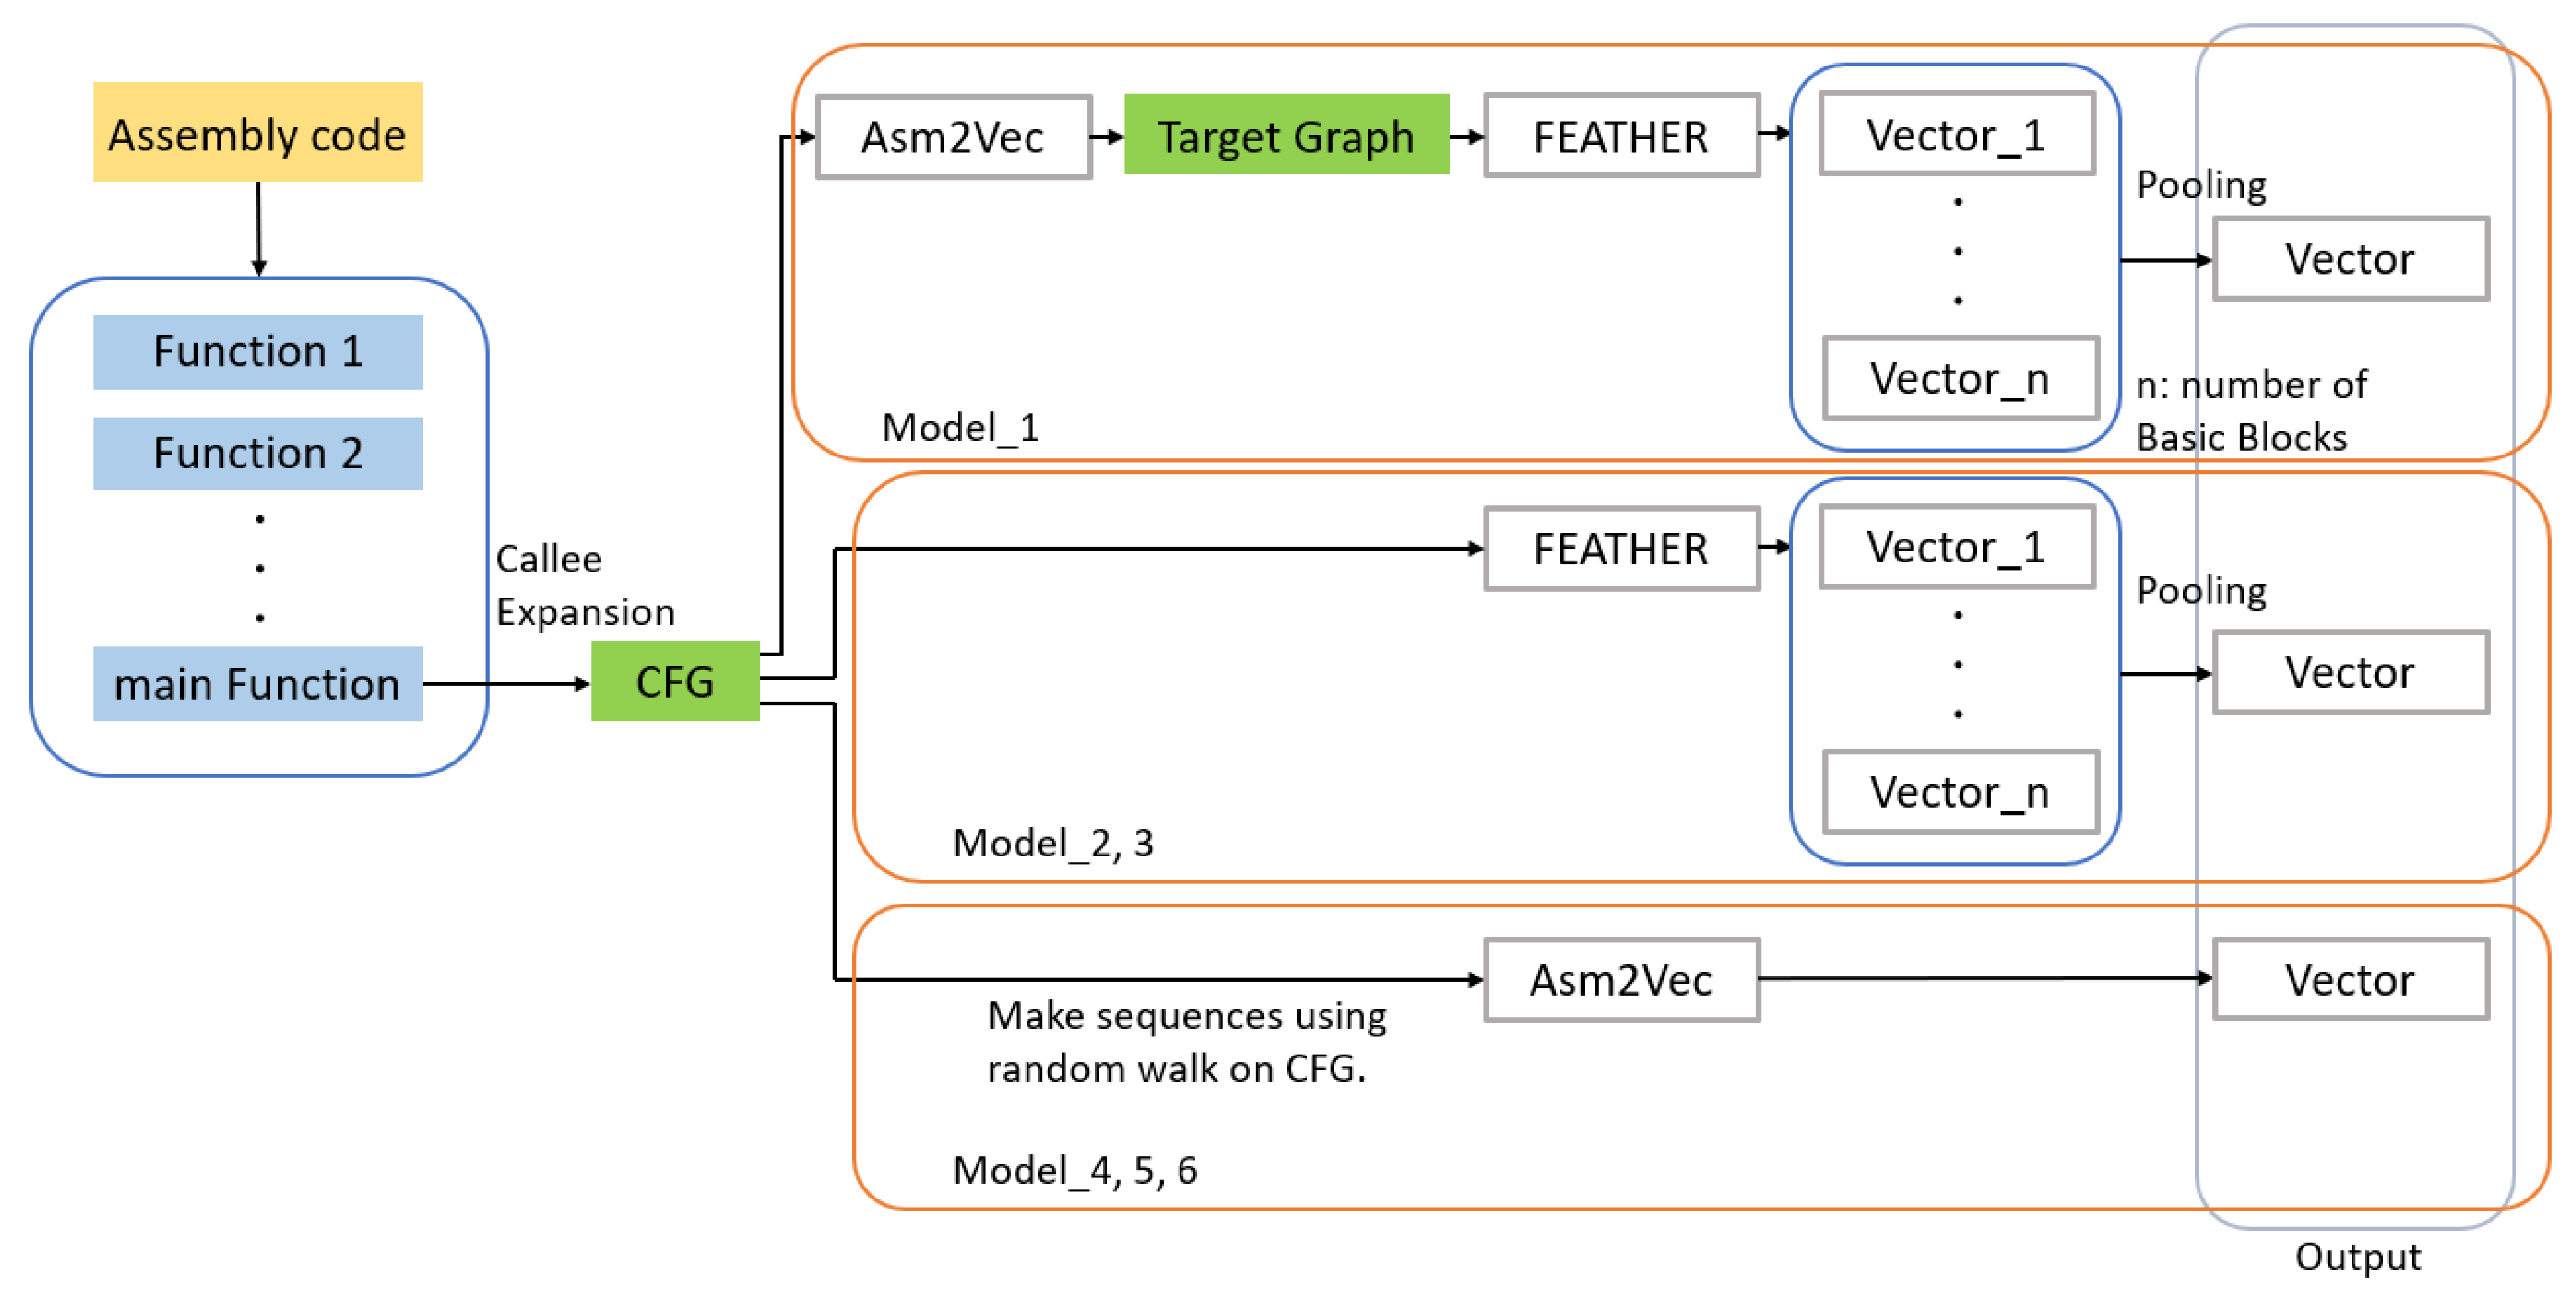
Each assembly code is output from the source code of the solution method written in C, using the x-86-64gcc12.2 compiler, without using any compiler options.
Each value in Table 1 is the similarity between the assembly code of each file in the dataset, expressed by the following equation.
Similarity : S = ( 1 Normalized Levenshtein distance )
The Levenshtein distance [26] is defined as the minimum number of steps required to transform one string into another by inserting, deleting, or replacing a single character in one of the two strings, and is the distance that indicates the difference between the two strings. The normalized Levenshtein distance is normalized to a value between 0 and 1 by dividing the Levenshtein distance by the number of characters in the onger of the two strings. Similarity S takes a value between 0 and 1 and represents the degree of agreement between the two strings.
From Table 1, it can be seen that the similarity between the assembly code generated from the solutions of the same author is higher than that of different authors, and the solutions of the same author are similar.

4.3. Used Models

The following models(Table 2 and Table 3) are used in the experiments (Figure 5). All these models take as input the CFG of the calling expanded main function in each assembly file.
1.
Model_1
  • Embedded target: CFG with node attributes;
    Each node has the following node features:
    • Node neighborhood: Normalized adjacent matrix;
    • Structural information: Logarithmic transformation of the order of each node and clustering coefficients;
    • Node attribute: 400-dimensional (each token: 200 dimensions) representation vector obtained from the corresponding basic block using Asm2Vec (Reduced to 16 dimensions using the Python ibrary Scikit-Learn’s Truncated SVD [27]).
  • Embedding method: Pooling on the arithmetic mean after each node embedding using FEATHER;
  • Embedded dimension: 4000-dimensional;
  • Number of evaluation points Θ : 25;
  • Scale of random walk r: 5.
2.
Model_2
  • Embedded target: CFG without node attribute;
    Each node has the following node features:
    • Node neighborhood: Normalized adjacent matrix;
    • Structural information: Logarithmic transformation of the order of each node and clustering coefficients.
  • Embedding method: Pooling on the arithmetic mean after each node embedding using FEATHER;
  • Embedded dimension: 500-dimensional;
  • Number of evaluation points Θ : 25;
  • Scale of random walk r: 5.
3.
Model_3
  • Embedded target: CFG without node attribute;
    Each node has the following node features:
    • Node neighborhood: Normalized adjacent matrix;
    • Structural information: Logarithmic transformation of the order of each node and clustering coefficients.
  • Embedding method: Pooling on the arithmetic mean after each node embedding using FEATHER;
  • Embedded dimension: 4000-dimensional;
  • Number of evaluation points Θ : 25;
  • Scale of random walk r: 40.
4.
Model_4
  • Embedded target: Assembly Code;
  • Embedding Method: Asm2Vec;
  • Embedded dimension: 500-dimensional(each token: 250-dimensional);
  • Number of random walks n: 10.
5.
Model_5
  • Embedded target: Assembly Code;
  • Embedding Method: Asm2Vec;
  • Embedded dimension: 4000-dimensional(each token: 2000-dimensional);
  • Number of random walks n: 10.
6.
Model_6
  • Embedded target: Assembly Code;
  • Embedding Method: Asm2Vec;
  • Embedded dimension: 500-dimensional (each token: 250-dimensional);
  • Number of random walks n: 50.
The clustering coefficients are a measure of the ratio of edges between adjacent nodes of a node, and the higher the average of the cluster coefficients of all nodes in a graph, the denser the network. The following equation expresses the cluster coefficient c u of a node u in an edge-unweighted graph.
c u = 2 T ( u ) d e g ( u ) ( d e g ( u ) 1 )
  • d e g ( u ) : Order of u;
  • T ( u ) : Number of triangles formed by connecting u and the edges of adjacent nodes
For all Asm2Vec training, the number of iterations is 10. The exit condition of the random walk in Asm2Vec is the arrival at the exit block of the CFG or the arrival at the basic block that has already been passed.

4.4. Evaluation Index

We evaluate whether the proposed method can embed vectors generated from similar programs in close proximity in the vector space.
The following are used as evaluation indices.

4.4.1. Precision Measure and Recall Measure

To evaluate the clustering results, we calculate precision and recall measure over pairs of cluster elements [28]. Precision and recall measure are expressed by the following equations:
p r e c i s i o n = T P T P + F P
r e c a l l = T P T P + F N
  • T P : Number of pairs of elements with the same abel that are classified into the same cluster as a result of clustering;
  • F P : Number of pairs of elements with different abels that are classified into the same cluster as a result of clustering;
  • F N : Number of pairs of elements with the same abel that are classified into different clusters as a result of clustering.
Precision is calculated as the fraction of pairs correctly put in the same cluster, and recall is the fraction of actual pairs that were identified.

4.4.2. Normalized Mutual Information

The amount of information H ( U ) , H ( V ) for objects U and V with the same N elements is expressed by the following equations:
H ( U ) = i = 1 | U | P ( i ) log ( P ( i ) )
H ( V ) = j = 1 | V | P ( j ) log ( P ( j ) )
P ( i ) = | U i | N , P ( j ) = | V j | N
When the probability that a randomly selected object is classified into both classes U i and V j is P ( i , j ) = | U i V j | / N , the mutual information M I ( U , V ) and normalized mutual information N M I ( U , V ) are expressed as follows:
M I ( U , V ) = i = 1 | U | j = 1 | V | P ( i , j ) log ( P ( i , j ) P ( i ) P ( j ) )
N M I ( U , V ) = M I ( U , V ) mean ( H ( U ) , H ( V ) )
Mutual information content is a function that measures the agreement between two assignments, ignoring permutations, and normalized mutual information content is the normalized mutual information content with the score scaled between 0 (no mutual information) and 1 (perfect correlation). This index evaluates how well the expected number of clusters and the number of elements in each cluster agree with the correct answer.

4.4.3. Execution Time

The execution time is the elapsed time from the input of the CFG of the main function to the output of the clustering result.

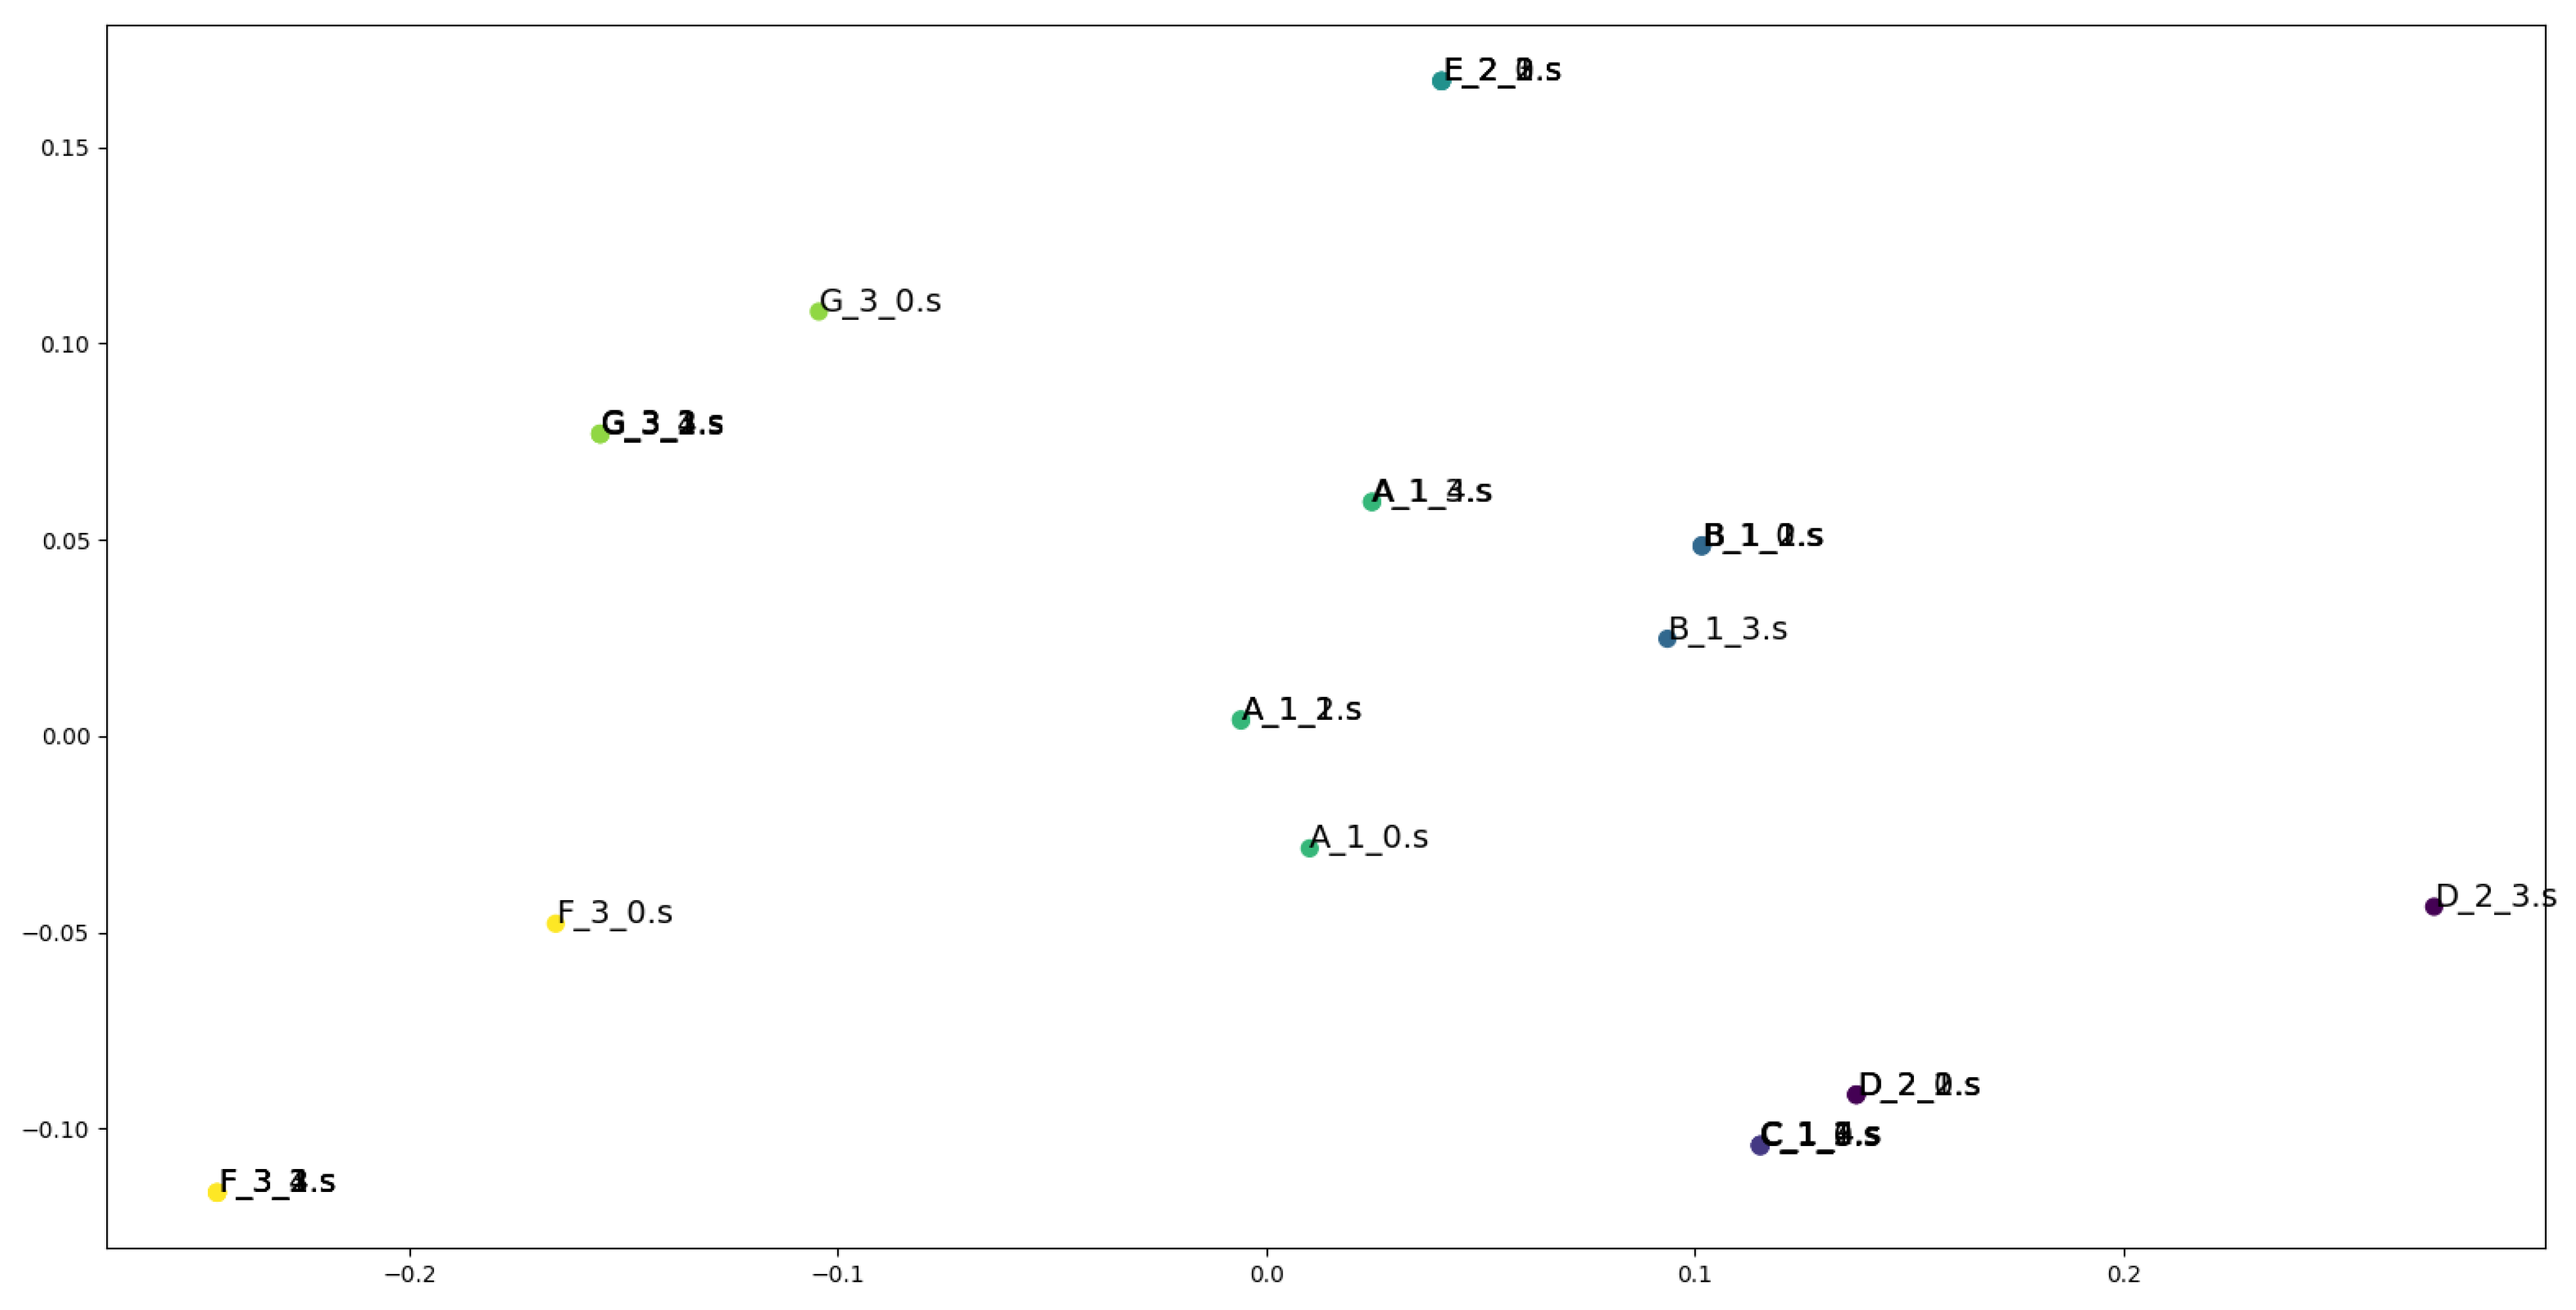
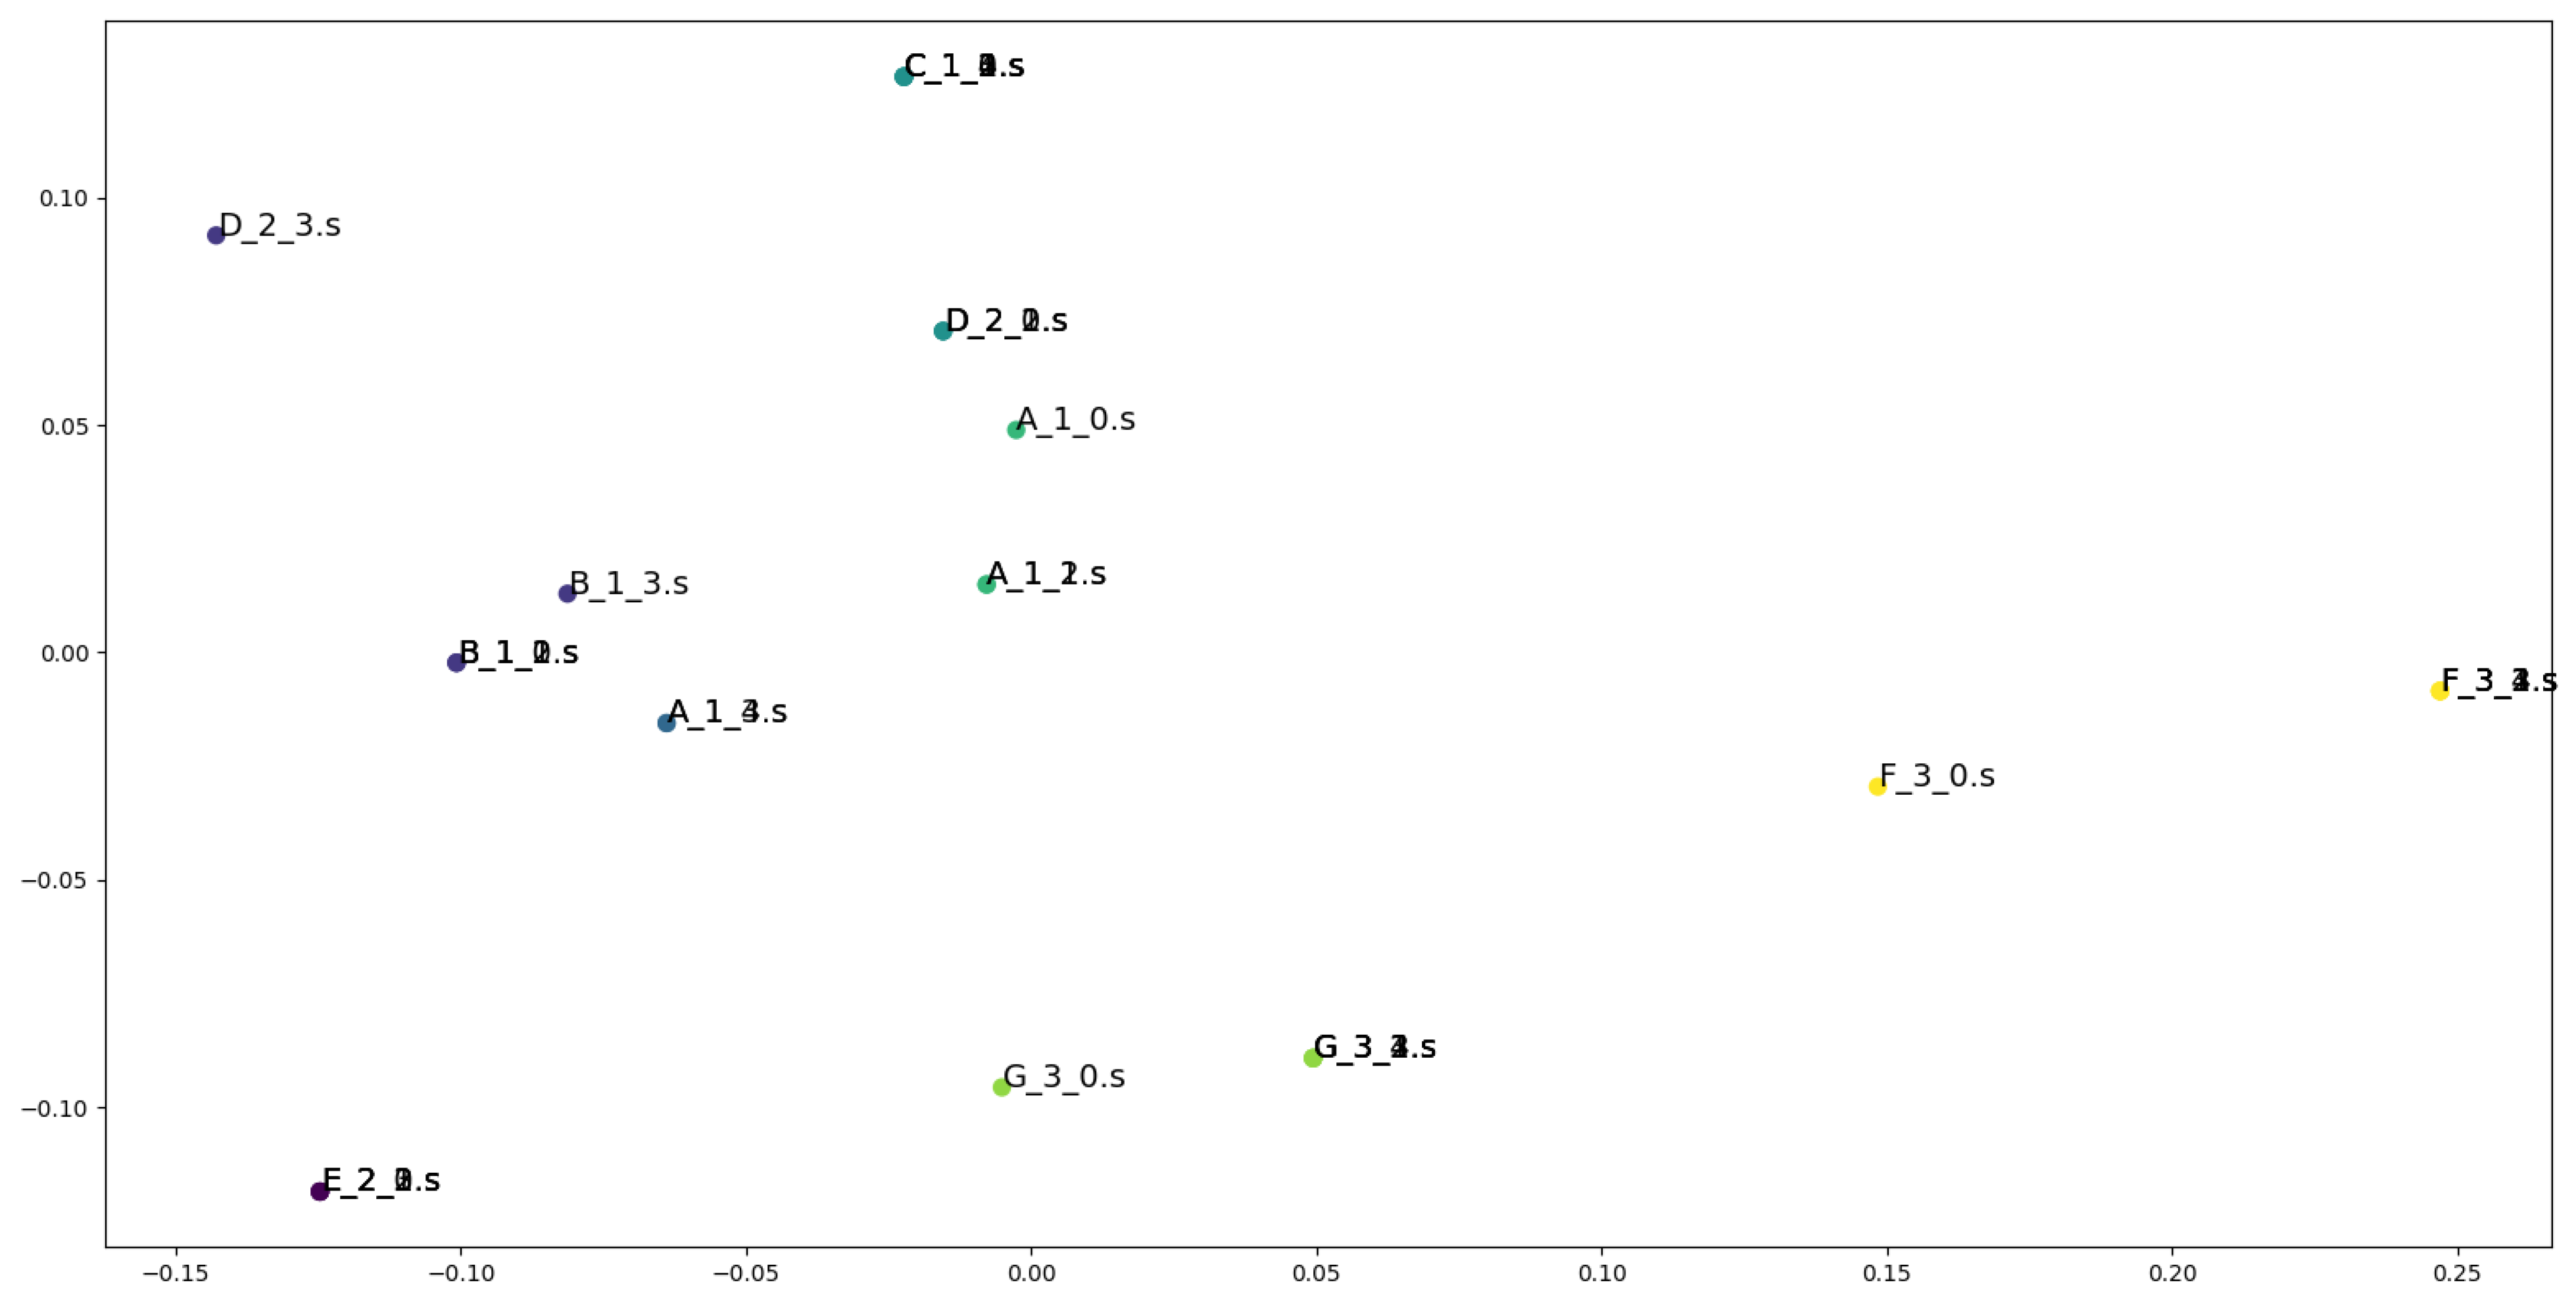
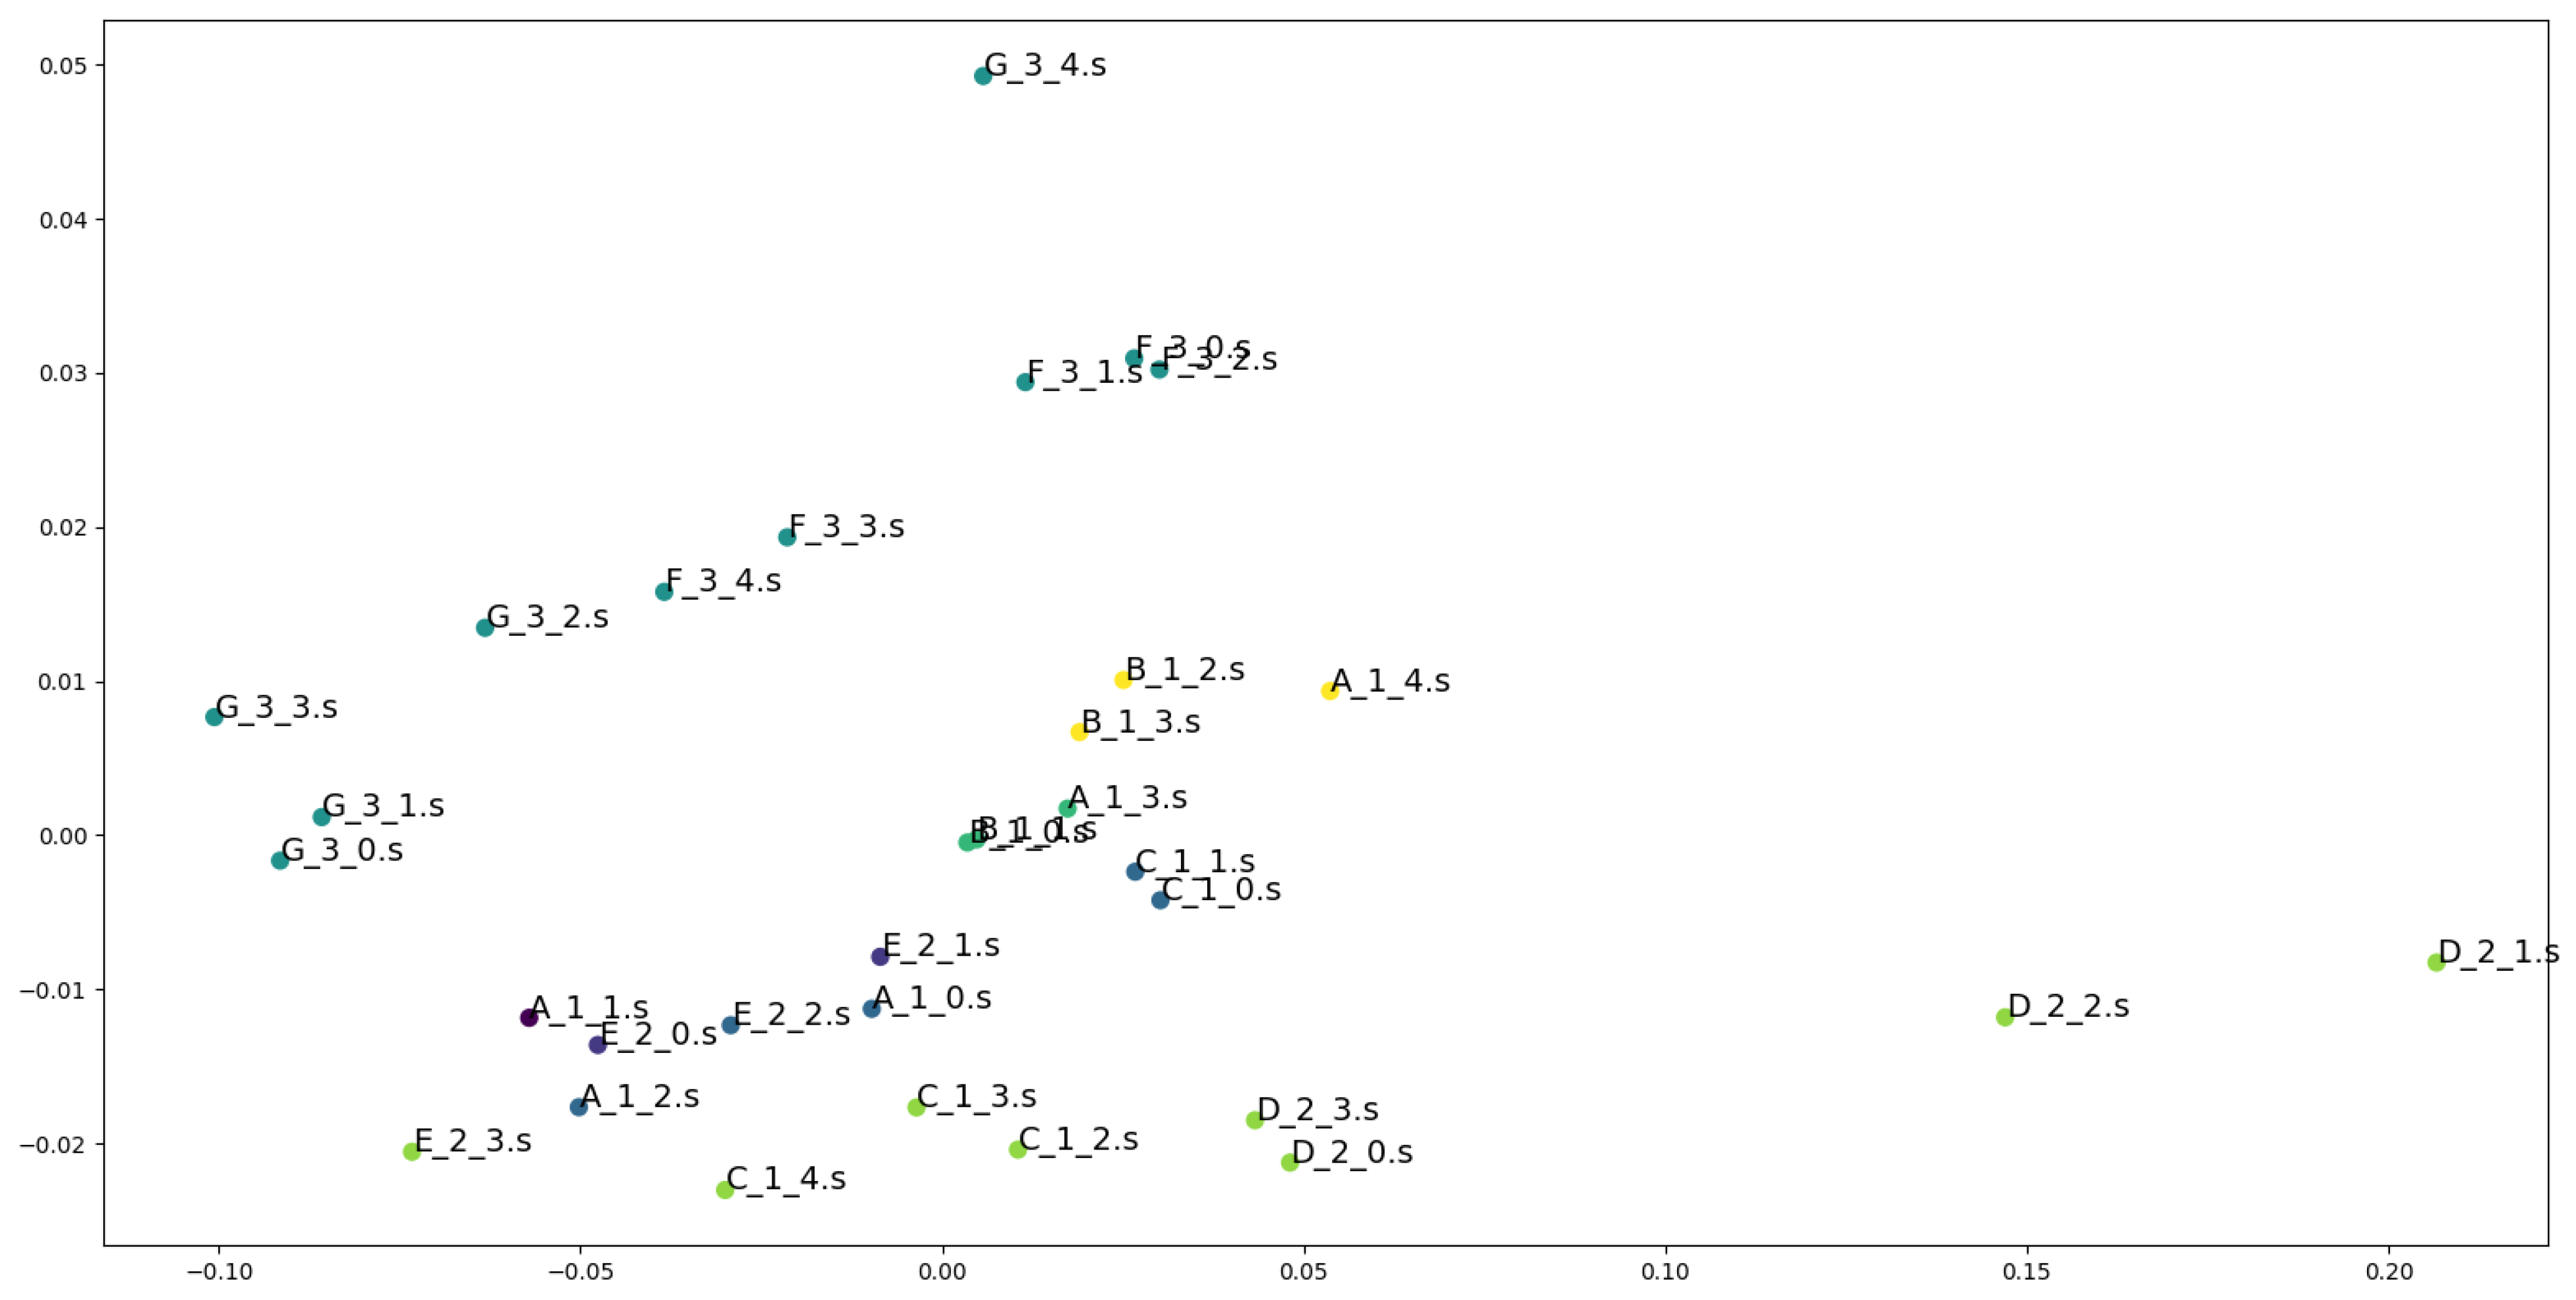
4.5. Results of the Experiments

Table 4 shows the results of clustering with the number of clusters k = 7 . Each value is the average of five runs.
From Table 4, it can be seen that the proposed method, Model_1, has the highest values for the precision measure, the recall measure, and the amount of normalized mutual information; while, in terms of execution time, Model_2 was the fastest.

5. Evaluation and Discussion

As the results presented in Table 4 show, the proposed method, Model_1, has the highest values for the precision measure, the recall measure, and the amount of normalized mutual information. The results also show that the desired clustering results are obtained. This means that, with the proposed method, the representation vectors of similar pieces of assembly code are mapped most closely in the vector space. Furthermore, in each model, the recall measure was higher than the precision measure. This is because the False Negative (FN) value was ower than the False Positive (FP) value in each case. This means that cases in which elements of the same cluster are missed are ess ikely to occur than cases in which elements of different clusters are detected incorrectly.
Figure 6, Figure 7 and Figure 8 visualize the most frequent results among the clustering results of Model_1, Model_3, and Model_4. Each representation vector is dimensionally reduced to two dimensions using principal component analysis, and plotted with coloring for each cluster. From the results of Model_4 and 5, Asm2Vec did not show a significant performance change between 500 and 2000 embedding dimensions, and Model_1, 2, and 3 outperformed the random-walk-based Asm2Vec in all indices for the same embedding dimensions. Comparison between Model_4 and Model_6 shows that increasing the number of random walk sequences improves performance, but increases the execution time roughly approximately inearly. Asm2Vec was used to retrieve the attributes in Model_1, and embedding by basic blocks can be performed in a shorter time than embedding from the whole CFG. Thus, applying graph embedding to CFGs for the classification of similar programs whose overall control flow is not significantly changed, as carried out in this experiment, is effective.
We also compared Model_1, 2, and 3. A comparison of the results of Model_1 and Model_3 shows that adding attributes to the nodes and incorporating them into the embedding process results in better embedding than in the case where only the information obtained from the graph (neighborhood and structural information) is considered. Meanwhile, the extraction of attributes and their dimension reduction increase the execution time significantly. In addition, from the comparison between Model_2 and Model_3, it can be seen that the accuracy of embedding can be improved by increasing the random walk scale r in FEATHER, as more neighborhood and structural information can be incorporated. Here, in FEATHER, when the number of node features is multiplied by n and the scale is multiplied by m, the dimension of embedding becomes n × m times arger. As the embedding dimension increases, the number of computations required for comparison between representation vectors increases, which may increase the time required for comparison or make comparison difficult. Therefore, when increasing the scale r in a graph with node attributes, it is important to appropriately reduce the dimension of the node feature matrix.
One of the concerns of the proposed method is that Asm2Vec, which is used to extract node attributes, is designed for a single assembly anguage and cannot be applied to different architectures. Therefore, in terms of execution time and generality, embedding without considering node attributes may be superior in some cases.
Thus, the proposed method can identify similar programs with similar source code that have not undergone major changes in the control flow. Furthermore, the recall measure has a higher value than the precision measure, which is useful in situations where we want to reduce oversights rather than false positives. Thus, the proposed approach can be used to detect source code copying and variants of malware derived from existing malware.

6. Conclusions

In this study, we created a distributed representation method of assembly code that can be used to detect similar programs and software products, the occurence of which has increased in recent times due to source code reuse and plagiarism. The proposed method combines Asm2Vec, an existing assembly code distributed representation method, with FEATHER, a graph embedding method, based on the fact that the CFG of each program is similar between similar programs. Asm2Vec performs embedding based on a earning model based on the syntax of assembly code, capturing the semantics of assembly code. FEATHER is also capable of hybrid embedding that incorporates information on neighboring nodes of the graph, structural information, and metadata possessed by each node. Therefore, we used Asm2Vec to create a vector representation of the basic blocks corresponding to each node of the CFG, and FEATHER and a vector representation of the graph with these basic blocks as node attributes. In the experiment, we performed vector representation of the assembly code generated from solution code submitted to a programming contest using multiple distributed representation methods including the proposed method. Next, we performed clustering of the obtained representation vectors to measure the ratio of solutions by the same creator that are classified into the same cluster. Then, we used precision measure, recall measure, and normalized mutual information as evaluation indices of clustering accuracy. The experimental results show that the clustering accuracy and execution time of the proposed method are better than those of the random-walk-based Asm2Vec, indicating the effectiveness of graph embedding. Furthermore, the recall measure was higher than the precision measure. Thus, the proposed method can determine similarity based on the semantics and control structure of software and programs, independent of the existence of source code or the use of different development anguages. This approach can be applied to identify variants of malware derived from existing malware or plagiarized software. However, it should be noted that assembly code is always required to generate CFGs and acquire node attributes; thus, if accurate assembly code cannot be obtained due to software obfuscation, the proposed method will not work correctly. In the future, we will implement obfuscation measures and validate the utility of the proposed approach with more data.

Author Contributions

Conceptualization, K.Y., K.S. and T.M.; methodology, K.Y., K.S. and T.M.; software, K.Y.; validation, K.Y.; formal analysis, K.Y.; investigation, K.Y.; data curation, K.Y.; writing—original draft preparation, K.Y.; writing—review and editing, K.Y.; supervision, T.M. All authors have read and agreed to the published version of the manuscript.

Funding

This research received no external funding.

Data Availability Statement

All data has been present in main text.

Conflicts of Interest

The authors declare no conflict of interest.

References

  1. M-Trends Report. 2020. Available online: https://www.mandiant.com/sites/default/files/2021-09/mtrends-2020.pdf (accessed on 24 March 2023).
  2. Yuta, T.; Terada, M.; Matsuki, T.; Kasama, T.; Araki, S.; Hatada, M. Datasets for Anti-Malware Research. SIG Tech. Rep. 2018, 38, 1–8. [Google Scholar]
  3. Yamamoto, T.; Matsushita, M.; Kamiya, T.; Inoue, K. Similarity Metric CSR Using Code Clone Detection Tool. Softw. Sci. 2001, 101, 25–32. [Google Scholar]
  4. Okahara, S.; Manabe, Y.; Yamauchi, H.; Monden, A.; Matsumoto, K.; Inoue, K. Experimentally Deriving Probability of Program Piracy based on Length of Code Clone. IEICE Tech. Rep. 2008, 108, 7–11. [Google Scholar]
  5. Basit, H.A.; Puglisi, S.J.; Smyth, W.F.; Turpin, A. Efficient token based clone detection with flexible tokenization. In Proceedings of the 6th Joint Meeting of the European Software Engineering Conference and the ACM SIGSOFT International Symposium on Foundations of Software Engineering, Dubrovnik, Croatia, 3–7 September 2007; pp. 513–516. [Google Scholar]
  6. Selim, G.m.k.; Foo, K.C.; Zou, Y. Enhancing Source-Based Clone Detection Using Intermediate Representation. In Proceedings of the 17th Working Conference on Reverse Engineering, Beverly, MA, USA, 13–16 October 2010; pp. 227–236. [Google Scholar]
  7. Gode, N.; Koschke, R. Incremental Clone Detection. In Proceedings of the 13th European Conference on Software Maintenance and Reengineering, Kaiserslautern, Germany, 24–27 March 2009; pp. 219–228. [Google Scholar]
  8. Hummel, B.; Jürgens, E.; Heinemann, L.; Conradt, M. Index-based code clone detection: Incremental, distributed, scalable. In Proceedings of the 26th IEEE International Conference on Software Maintenance, Timisoara, Romania, 12–18 September 2010; pp. 1–9. [Google Scholar]
  9. Chilowicz, M.; Duris, É.; Roussel, G. Syntax tree finger printing for source code similarity detection. In Proceedings of the 17th IEEE International Conference on Program Comprehension, Vancouver, BC, Canada, 17–19 May 2009; pp. 243–247. [Google Scholar]
  10. Iwamura, M.; Itoh, M.; Muraoka, Y. Automatic malware classification system based on similarity of machine code instructions. Inf. Process. Soc. Jpn. 2010, 51, 1–11. [Google Scholar]
  11. Flake, H. Structural Comparison of Executable Objects. In Proceedings of the Detection of Intrusions and Malware and Vulnerability Assessment (DIMVA 2004), Dortmund, Germany, 6–7 July 2004; pp. 161–173. [Google Scholar]
  12. Kornblum, J. Identifying almost identical files using context triggered piecewise hashing. Digit. Investig. 2006, 3, 91–97. [Google Scholar] [CrossRef]
  13. Roussev, V.; Quates, C. Content triage with similarity digests: The M57 case study. Digit. Investig. 2012, 9, S60–S68. [Google Scholar] [CrossRef]
  14. Mikolov, T.; Sutskever, I.; Chen, K.; Corrado, G.S.; Dean, J. Distributed Representations of Words and Phrases and Their Compositionality. In Proceedings of the 26th International Conference on Neural Information Processing Systems, Lake Tahoe, NA, USA, 5–10 December 2013. [Google Scholar]
  15. Le, Q.; Mikolov, T. Distributed representations of sentences anddocuments. In Proceedings of the 31st International Conference on International Conference on Machine Learning, Beijing, China, 21–26 June 2014. [Google Scholar]
  16. Alon, U.; Zilberstein, M.; Levy, O.; Yahav, E. code2vec: Learning Distributed Representations of Code. Proc. ACM Program. Lang. 2018, 3, 1–29. [Google Scholar] [CrossRef]
  17. Perozzi, B.; Al-Rfou, R.; Skiena, S. Deepwalk: Online earning of social representations. In Proceedings of the 20th ACM SIGKDD International Conference on Knowledge Discovery and Data Mining, New York, NY, USA, 24–27 August 2014; pp. 701–710. [Google Scholar]
  18. Grover, A.; Leskovec, J. node2vec: Scalable feature earning for networks. In Proceedings of the 22nd ACM SIGKDD International Conference on Nowledge Discovery and Data Mining, San Francisco, CA, USA, 13–17 August 2016; pp. 855–864. [Google Scholar]
  19. Ahmed, N.K.; Rossi, R.; Lee, J.B.; Willke, T.L.; Zhou, R.; Kong, X.; Eldardiry, H. Learning role-based graph embeddings. arXiv 2018, arXiv:1802.02896. [Google Scholar]
  20. Liao, L.; He, X.; Zhang, H.; Chua, T. Attributed social network embedding. IEEE Trans. Knowl. Data Eng. 2018, 30, 2257–2270. [Google Scholar] [CrossRef]
  21. Narayanan, A.; Chandramohan, M.; Venkatesan, R.; Chen, L.; Liu, Y.; Jaiswal, S. graph2vec: Learning Distributed Representations of Graphs. arXiv 2017, arXiv:1707.05005. [Google Scholar]
  22. Ding, S.H.H.; Fung, B.C.M.; Charland, P. Asm2Vec: Boosting Static Representation Robustness for Binary Clone Search against Code Obfuscation and Compiler Optimization. In Proceedings of the IEEE Symposium on Security and Privacy, San Francisco, CA, USA, 19–23 May 2019. [Google Scholar]
  23. Rozemberczki, B.; Sarkar, R. Characteristic Functions on Graphs: Birds of a Feather, from Statistical Descriptors to Parametric Models. In Proceedings of the CIKM ’20: Proceedings of the 29th ACM International Conference on Information & Knowledge Management, Virtual Event, Ireland, 19–23 October 2020; pp. 1325–1334. [Google Scholar]
  24. DasGupta, A. Characteristic functions and applications. In Probability for Statistics and Machine Learning; Springer: New York, NY, USA, 2011; pp. 292–322. [Google Scholar]
  25. Kyopuro Tenkei 90 Mon. Available online: https://atcoder.jp/contests/typical90 (accessed on 24 March 2023).
  26. Levenshtein, V.I. Binary codes capable of correcting deletions, insertions, and reversals. Sov. Phys. Dokl. 1966, 10, 707–710. [Google Scholar]
  27. Halko, N.; Martinsson, P.-G.; Tropp, J.A. Finding structure with randomness: Probabilistic algorithms for constructing approximate matrix decompositions. Siam Rev. 2011, 53, 217–288. [Google Scholar] [CrossRef]
  28. Banerjee, A.; Krumpelman, C.; Ghosh, J.; Basu, S.; Mooney, R.J. Model-based overlapping clustering. In Proceedings of the KDD ’05: Proceedings of the Eleventh ACM SIGKDD International Conference on Knowledge Discovery in Data Mining, Chicago, IL, USA, 21–24 August 2005; pp. 532–537. [Google Scholar]
Figure 1. Control Flow Graph.
Computers 12 00222 g001
Figure 2. Representation earning model of Asm2Vec.
Computers 12 00222 g002
Figure 3. Recursive call expansion.
Computers 12 00222 g003
Figure 4. Generate target graph from CFG of the main function.
Computers 12 00222 g004
Figure 5. Flow of each model.
Computers 12 00222 g005
Figure 6. Visualization of the most frequent results in Model_1. Dots of the same color are in the same cluster.
Computers 12 00222 g006
Figure 7. Visualization of the most frequent results in Model_3. Dots of the same color are in the same cluster.
Computers 12 00222 g007
Figure 8. Visualization of the most frequent results in Model_4. Dots of the same color are in the same cluster.
Computers 12 00222 g008
Table 1. Similarity of the assembly code for each file in the data set.
A_1_0.sB_1_0.sC_1_0.sD_2_0.sE_2_0.sF_3_0.sG_3_0.s
A_1_0.s1.00.590.710.650.560.660.64
A_1_1.s0.950.600.710.650.570.660.63
A_1_2.s0.930.600.710.650.570.660.63
A_1_3.s0.860.590.730.640.500.650.65
A_1_4.s0.850.590.740.640.500.650.65
B_1_0.s0.591.00.580.600.510.560.55
B_1_1.s0.591.00.580.600.510.560.55
B_1_2.s0.570.920.560.580.480.560.53
B_1_3.s0.570.880.550.570.490.530.53
C_1_0.s0.710.581.00.660.490.640.64
C_1_1.s0.700.580.990.660.490.640.64
C_1_2.s0.720.580.980.660.500.640.64
C_1_3.s0.710.570.960.650.490.630.63
C_1_4.s0.720.580.980.660.510.650.64
D_2_0.s0.650.600.661.00.500.610.61
D_2_1.s0.650.600.660.990.500.610.61
D_2_2.s0.650.600.660.990.500.610.61
D_2_3.s0.650.590.650.970.510.610.60
E_2_0.s0.560.510.490.501.00.540.50
E_2_1.s0.550.500.500.500.930.530.49
E_2_2.s0.550.500.500.500.930.540.49
E_2_3.s0.540.510.490.500.970.530.50
F_3_0.s0.660.560.640.610.541.00.77
F_3_1.s0.670.560.640.600.550.980.79
F_3_2.s0.660.560.630.610.550.940.77
F_3_3.s0.670.560.640.610.550.950.78
F_3_4.s0.670.560.640.610.550.950.78
G_3_0.s0.640.550.640.610.500.771.0
G_3_1.s0.650.550.640.610.510.780.98
G_3_2.s0.650.560.630.610.500.760.95
G_3_3.s0.650.560.640.610.510.770.96
G_3_4.s0.640.540.640.600.490.770.96
Bolded numbers in the table indicate the similarity of assembly codes generated from the same author’s solution, which is higher than the others.
Table 2. Details of each model (Model_1, 2, 3).
Model_1Model_2Model_3
Embedded targetCFG with node attributesCFG without node attributeCFG without node attribute
Embedding methodFEATHERFEATHERFEATHER
Embedded dimension40005004000
Number of evaluation points252525
Scale of random walk5540
Table 3. Details of each model (Model_4, 5, 6).
Model_4Model_5Model_6
Embedded targetAssembly CodeAssembly CodeAssembly Code
Embedding methodAsm2VecAsm2VecAsm2Vec
Embedded dimension5004000500
Number of random walks101050
Table 4. Results of the experiments.
Model_1Model_2Model_3Model_4Model_5Model_6
Precision measure0.850.790.8120.5070.5060.621
Recall measure0.9290.8440.8620.6350.6330.707
Normalized Mutual Information0.9540.8950.9290.6570.6730.785
Execution time (s)35.2390.03590.0657153.044462.574774.089
Disclaimer/Publisher’s Note: The statements, opinions and data contained in all publications are solely those of the individual author(s) and contributor(s) and not of MDPI and/or the editor(s). MDPI and/or the editor(s) disclaim responsibility for any injury to people or property resulting from any ideas, methods, instructions or products referred to in the content.

