Article

Detecting Breast Tumors in Tomosynthesis Images Utilizing Deep Learning-Based Dynamic Ensemble Approach

1
Department of Computer Engineering and Mathematics, Universitat Rovira i Virgili, 43007 Tarragona, Spain
2
Gaist Solutions Ltd., Skipton BD23 2TZ, UK
3
Precision Medicine Centre of Excellence, School of Medicine, Dentistry and Biomedical Sciences, Queen’s University Belfast, Belfast BT7 1NN, UK
4
Department of Electrical Engineering, Aswan University, Aswan 81528, Egypt
*
Author to whom correspondence should be addressed.
Computers 2023, 12(11), 220; https://doi.org/10.3390/computers12110220
Submission received: 12 September 2023 / Revised: 19 October 2023 / Accepted: 23 October 2023 / Published: 30 October 2023
(This article belongs to the Special Issue Artificial Intelligence in Control)

Abstract

:
Digital breast tomosynthesis (DBT) stands out as a highly robust screening technique capable of enhancing the rate at which breast cancer is detected. It also addresses certain limitations that are inherent to mammography. Nonetheless, the process of manually examining numerous DBT slices per case is notably time-intensive. To address this, computer-aided detection (CAD) systems based on deep learning have emerged, aiming to automatically identify breast tumors within DBT images. However, the current CAD systems are hindered by a variety of challenges. These challenges encompass the diversity observed in breast density, as well as the varied shapes, sizes, and locations of breast lesions. To counteract these limitations, we propose a novel method for detecting breast tumors within DBT images. This method relies on a potent dynamic ensemble technique, along with robust individual breast tumor detectors (IBTDs). The proposed dynamic ensemble technique utilizes a deep neural network to select the optimal IBTD for detecting breast tumors, based on the characteristics of the input DBT image. The developed individual breast tumor detectors hinge on resilient deep-learning architectures and inventive data augmentation methods. This study introduces two data augmentation strategies, namely channel replication and channel concatenation. These data augmentation methods are employed to surmount the scarcity of available data and to replicate diverse scenarios encompassing variations in breast density, as well as the shapes, sizes, and locations of breast lesions. This enhances the detection capabilities of each IBTD. The effectiveness of the proposed method is evaluated against two state-of-the-art ensemble techniques, namely non-maximum suppression (NMS) and weighted boxes fusion (WBF), finding that the proposed ensemble method achieves the best results with an F1-score of 84.96% when tested on a publicly accessible DBT dataset. When evaluated across different modalities such as breast mammography, the proposed method consistently attains superior tumor detection outcomes.

1. Introduction

Breast malignancy stands as a prevalent and impactful variant of cancer afflicting women, contributing significantly to the global burden of cancer-related fatalities [1]. Timely identification of the disease is pivotal in enhancing the prospects of effective therapeutic interventions and favorable survival outcomes [2]. Accurate cancer detection poses numerous challenges, including the complexity of tumor identification in the early stages, potential variability in imaging modalities, and the need for an accurate and timely diagnosis. Mammography and breast ultrasonography (BUS) are the prevailing techniques employed for diagnosing breast cancer. Nevertheless, the heightened breast density often diminishes the sensitivity and specificity of breast lesion detection within mammographic and BUS images due to the presence of densely compacted fibro-glandular tissue in the breast. This limitation emerges due to the reliance on two-dimensional (2D) imaging modalities in these contexts [3].
In an attempt to surmount the challenge of tissue superposition and overlapping, which can obscure or mask breast lesions within mammographic images, the advent of Digital Breast Tomosynthesis (DBT) has brought forth a three-dimensional (3D) tool for breast cancer screening [4]. DBT operates by capturing a set of individual mammographic images while rotating the X-ray tube at various angles around a stationary compressed breast. Subsequent software processing of these images yields a sequence of high-resolution 3D slices that convey depth-related information [5]. This 3D rendering considerably mitigates the influence of dense tissues, consequently enhancing the rate of breast lesion detection in contrast to conventional mammography and BUS images [6]. Therefore, DBT presents a viable avenue for early breast cancer detection and diagnosis.
While DBT effectively addresses the challenge of tissue superposition intrinsic to mammography, it introduces fresh complexities into clinical procedures [5]. The need to assess a greater number of slices per breast volume amplifies the intricacy of radiologists’ workflow. This intricacy can be compounded by the augmented level of physician involvement in the interpretation process as the number of slices available for assessment increases. In this context, Computer-Aided Detection (CAD) systems have demonstrated their potential to ameliorate radiologists’ performance and alleviate the clinical intricacies introduced by DBT [7].
Numerous CAD systems rooted in deep learning have emerged over recent years, aiming to autonomously discern, segment, and classify breast tumors within DBT data. The integration of deep learning techniques facilitates the extraction of meaningful features directly from DBT images, circumventing the necessity for manual feature engineering. This approach streamlines the detection, segmentation, and classification processes for breast tumors within an end-to-end framework. As an illustration, Lai et al. [8] introduced a technique for segmenting breast tumors in DBT images using a U-Net architecture. Their approach comprises six stages encompassing data pre-processing, patch extraction, data augmentation, U-Net-based segmentation, a voting phase, and post-processing. Initial data pre-processing involved applying a top-hat transform to heighten the contrast between tumor regions and the background tissue. Subsequently, the images were partitioned into patches and subjected to 90-degree rotations to expand the pool of available data for patch extraction and augmentation. The U-Net model, boasting 23 layers, was leveraged for pixel-wise segmentation across the entire image. During the voting stage, probabilistic forecasts for each slice were generated using the U-Net model. These predictions were then fused into a final image label through one of various voting strategies. The ultimate step encompassed the imposition of volumetric constraints to eliminate small clusters erroneously identified as breast masses.
In a similar vein, Samala et al. [9] introduced a CAD system designed to classify breast masses within DBT images, utilizing a deep convolutional neural network (DCNN) integrated with transfer learning from mammography data. The DCNN architecture featured four convolutional layers and three fully connected (FC) layers. Initially, the network was trained on mammography data. Subsequently, the weights within the first three convolutional layers were frozen, while the last convolutional layer and the FC layers were initialized randomly and further trained on DBT images. Evaluation on a proprietary dataset demonstrated that the transfer learning approach boosted classification accuracy by 9%.
Limited research endeavors have been directed towards the detection and segmentation of breast tumors within DBT images. As an example, Fan et al. [10] introduced a deep learning strategy grounded in convolutional neural networks (CNNs), employing the Faster Region-Based Convolutional Neural Network (R-CNN) for the purpose of mass detection in DBT images. The proposed methodology encompassed three distinct modules: (1) Module A undertook the preprocessing of DBT z-stack images, (2) Module B harnessed the efficiency of the Faster R-CNN model to detect masses, and (3) Module C was dedicated to amalgamating the detection outcomes from successive 2D slices into a comprehensive 3D DBT volume. The efficacy of this CAD system was evaluated on a private DBT dataset, yielding notable performance results with an Area Under the Curve (AUC) of 92%.
Moreover, in a subsequent work [11], Fan et al. continued their exploration by introducing a deep learning framework founded on a 3D variant of the Mask-RCNN model, specifically designed for mass detection and segmentation within DBT images. This model employed a ResNet-Feature Pyramid Network (ResNet-FPN) as its foundational architecture. The ResNet-FPN efficiently extracted features across diverse scales, which were subsequently integrated within the Feature Pyramid Network (FPN). The region proposal network (RPN) was responsible for generating bounding boxes for input images. In parallel, segmentation masks for each region of interest (ROI) were generated via the mask branch of the fully convolutional network (FCN). Through comprehensive evaluation, Fan et al. [11] showcased notable enhancements in performance when compared to their preceding work, particularly on the same DBT dataset.
Lotter et al. [12] introduced a sophisticated deep learning model in a three-stage configuration, tailored for the purpose of breast lesion detection within mammographic and DBT images. In the initial stage, a pre-trained ResNet model was fine-tuned using digital mammogram patches to facilitate lesion classification. Subsequently, this trained ResNet served as the foundational architecture for the RetinaNet detection model, which was further refined in the second stage to achieve accurate lesion localization. The third stage encompassed two segments: (1) In segment A, the utilization of multiple-instance learning (MIL) facilitated mammogram image classification; and (2) in segment B, the application of MIL facilitated the classification of optimized 2D images extracted from DBT data. The model’s performance was meticulously assessed through a proprietary dataset, yielding notable outcomes with an AUC of 94.5%.
In a parallel trajectory, Buda et al. [13] introduced a comprehensive, publicly accessible DBT image dataset aimed at fostering the development and evaluation of artificial intelligence algorithms for breast cancer screening. Additionally, they formulated a foundational deep-learning model for the detection of masses and architectural distortions within DBT images. This model was constructed as a singular-stage CNN network founded on the YOLO architecture, catered to 2D object detection, and underpinned by a DenseNet backbone. Various loss functions were assessed, including binary cross-entropy, weighted binary cross-entropy, focal loss, and reduced focal loss. The investigation revealed that the model’s optimal performance was achieved using the focal loss function with an AUC score of 0.69 and sensitivity of 67%.
Furthermore, Hossain et al. [14] proposed a novel algorithm for detecting breast lesions within DBT images, integrating false positive (FP) instances from non-annotated images as a novel form of data augmentation. The authors employed the YOLOv5 model as the foundational network and trained it using verified ground truth samples to identify actionable false positives within non-annotated images, which were subsequently harnessed as augmented samples. The baseline model was then refined through fine-tuning on the augmented dataset, which included the actionable false positive findings. The outcomes stemming from experiments on a publicly accessible dataset showcased the substantial value of actionable false positive findings in enhancing lesion detection algorithms, subsequently leading to a significant improvement in lesion detection performance.
Notably, the CAD systems discussed above have made significant efforts to address the issue of breast tumor detection within DBT images, and several challenges continue to hinder the effectiveness of CAD systems designed for this purpose. These challenges encompass a wide range of breast lesion shapes, locations, sizes, and variations in breast density, as visually depicted in Figure 1. Furthermore, the limited availability of annotated DBT images for training tumor detectors presents another obstacle that impedes the progress of CAD systems tailored specifically for DBT applications.
In an effort to address these challenges, this study presents a promising approach for detecting breast tumors in digital breast tomosynthesis (DBT) images. The approach leverages a dynamic ensemble technique and resilient individual breast tumor detectors. The proposed dynamic ensemble technique relies on a deep neural network that decides the optimal IBTD to detect breast tumors based on the characteristics of the input DBT image. In this study, we constructed sturdy individual breast tumor detectors (referred to as IBTDs) using diverse deep learning architectures, specifically Faster R-CNN [15], RetinaNet [16], YOLOv5 [17], YOLOv7 [18], and YOLOv8 [19]. To surmount the limitations of available data and enhance the detection performance of each IBTD, we employed two data augmentation methods: channel replication and channel concatenation. These techniques simulate various scenarios of breast density, as well as shapes, sizes, and locations of breast lesions.
The contributions of this paper encompass:
  • Proposing a dynamic ensemble technique for DBT-based breast tumor detection. Depending on the characteristics of the input DBT image, the dynamic ensemble technique selects an appropriate individual breast tumor detector for the detection task.
  • Introduction of two data augmentation strategies—channel replication and channel concatenation. These techniques mitigate data scarcity and enhance the detection capabilities of each individual breast tumor detector.
  • A comprehensive experimental investigation was carried out using a publicly accessible DBT dataset to illustrate the effectiveness of the proposed methodology. Furthermore, this paper includes comparative assessments with established ensemble techniques, specifically non-maximum suppression (NMS) [20] and weighted boxes fusion (WBF) [21].
  • Study the efficacy of the proposed approach for breast cancer detection across various modalities, such as breast mammography. Our findings indicate that the proposed method consistently outperforms alternative techniques, yielding superior results.
The organization of this manuscript is outlined as follows. Section 2 delineates the detailed exposition of the proposed detection methodology. In Section 3, the experimental outcomes are presented and subsequently discussed. Section 4 encapsulates the conclusions drawn from the study and offers insights into potential avenues for future research endeavors.

2. Methodology

This section presents a comprehensive overview of our breast lesion detection method for DBT images. As shown in Figure 2, our proposed framework consists of an ensemble model that takes in the input DBT image and outputs the corresponding label of one of the three individual detection models (label 1 for IBTD#1, label 2 for IBTD#2, and label 3 for IBTD#3) based on the image’s characteristics. The selected IBTD model is then utilized to detect the breast tumor. We describe each of these components in the following subsections.

2.1. Proposed Ensemble Technique

Figure 3 illustrates the workflow of the proposed dynamic ensemble, designed to autonomously select the optimal detection model from a set of robust breast tumor detection models (IBTDs) based on the characteristics of the input DBT image. This selection process has been formalized as a classification task.
In this approach, we employ the top k IBTD models, signifying the models with the highest accuracy, to train the ResNet-50 CNN model [22] to determine the most suitable IBTD for a given input DBT image. In the illustrated example within Figure 3, there are three labels (k = 3), each directly associated with a specific IBTD model: Label (1) designates the highest-performing IBTD model, which is the model with the highest accuracy among the top three IBTD models, Label (2) corresponds to the second-best IBTD model, and Label (3) is attributed to the third-best IBTD model.
Table 1 provides an overview of the dataset’s structure used to train the IBTD label prediction model. To construct this dataset, we identified the top three IBTD models, those with the highest accuracy. For each image in the training set, we calculated the detection accuracy of each IBTD model and assigned an IBTD label (1), (2), or (3), corresponding to the model with the highest accuracy.
Subsequent to the ensemble model’s training phase, each DBT image was inputted into the ensemble model to determine the optimal IBTD for detecting breast tumors. Once the suitable IBTD has been selected, it is applied to predict bounding box coordinates containing the tumor regions. These bounding boxes furnish information encompassing the potential object class, a coordinate list represented by [x1, y1, x2, y2], and a confidence score indicative of the model’s certainty regarding the object’s presence.

2.2. Developing Robust Individual Breast Tumor Detection (IBTD) Models

Figure 4 illustrates the steps of constructing the individual detection models tailored to the task of breast lesion detection. This type of implementation typically consists of a deep convolutional neural network (CNN) model that processes an input image and outputs a set of bounding boxes and class labels for the objects presented in the input image. The CNN is typically trained using a large dataset of annotated images, where each image has been labeled with the coordinates of the objects in the image and their corresponding class labels. However, due to the lack of annotated DBT images, we utilized effective data augmentation techniques to increase the limited available annotated DBT images. To develop robust IBTD models, we employed five of the most prevalent and effective deep learning-based object detection architectures—Faster R-CNN [15], RetinaNet [16], YOLOv5 [17], YOLOv7 [18], and YOLOv8 [19].

2.2.1. Data Augmentation Techniques

Indeed, the performance of deep learning models is significantly influenced by the size of the training set, which typically requires manual annotation by expert radiologists [23]. However, manual annotation is a laborious and time-consuming task, leading to limitations in the availability of publicly accessible medical image datasets. This challenge is especially pronounced in the context of DBT image analysis, where the creation of large datasets is further complicated by privacy and legal considerations.
In this study, we utilized two effective data augmentation techniques: channel replication (Ch-Rep) and channel concatenation (Ch-Conc). These augmentation techniques involve various geometric transformations, including flipping, translation, and shearing. Additionally, we incorporated two image intensity transformations: gamma correction and contrast-limited adaptive histogram equalization (CLAHE).
These data augmentation techniques significantly contribute to enhancing the diversity and robustness of the training dataset for deep learning models. They simulate different scenarios of breast density, lesion shapes, sizes, locations, and image characteristics, allowing the model to generalize better and perform well on a wide range of real-world cases.

2.2.2. Image Geometric and an Image Intensity Transformations

Here, we explain the geometric and pixel-wise transformations used in the context of breast tumor detection in DBT images. The following three geometric transformations are used in this study to simulate the variations of breast lesion shapes, sizes, and locations.
  • Image flipping: This transformation generates a mirror image of an image with both horizontal or vertical axes. In our case, which involves breast images, we chose to flip all images in the training set horizontally as the horizontal axis is preferred over the vertical axis when considering the mirror direction of the breast in DBT images.
  • Image translation: This transformation applies to prevent positional bias. This transformation involves shifting the entire image by a specified translation vector in a particular direction. This helps the network learn properties that are invariant to location rather than being focused on features present in a single spatial position. In the case of DBT, the translation of images can generate suitable augmented images. An image that is translated in the coordinate system undergoes the equations:
    x = x + x T y = y + y T
    where x , y , x, and y are the coordinates of a pixel in the new image and the coordinates of the original, respectively. The distance of which the pixel is translated in every direction is denoted by x T and y T , respectively.
  • Image shearing: It is a geometric transformation that skews an image along one axis while keeping the other axis unchanged. It is typically represented mathematically by a 2 × 2 transformation matrix that contains elements representing the amount of shearing along the x and y axes. In 2-D images, a shear transformation simply maps a pair of input pixel coordinates ( x , y ) to a pair of output coordinates ( u , v ) in the form of
    u = x + a × y v = y
    where a is the shear factor that represents the amount of shearing applied along the x-axis. The shearing transformation can be used to create a new set of training images by changing the orientation of the objects in the image, helping the model to learn features that are invariant to orientation.
In this study, we employed two image intensity transformations to simulate the variations of breast density and DBT image contrast.
  • Gamma Correction: It is an image intensity transformation that is used to adjust the brightness and contrast of an image. It is a way to adjust the relationship between the input image pixel intensities and the output pixel intensities. It can be defined by the following power-law expression:
    I γ = I s γ
    where I γ is the output image for gamma correction and γ is the gamma correction factor. We used image gamma correction as image data augmentation to generate new training images with varied brightness and contrast levels. This was done to simulate different radiation dose ratios that can result from varying acquisition parameters in DBT imaging, helping the model to learn features that are invariant to changes in brightness and contrast.
  • CLAHE—Contrast limited adaptive histogram equalization: This transformation is a popular image enhancement technique used to improve the visibility of low contrast structures in an image [24]. This method equalizes the histogram of the image to enhance the overall contrast of the image. It is a type of adaptive histogram equalization specifically designed to avoid over-amplifying noise or other image artifacts. The CLAHE method divides the image into small overlapping blocks, computes the histogram for each block, and then applies histogram equalization to each block independently. The equalization process is limited by a parameter called clip limit, which sets a threshold on the maximum amount of contrast stretching that can occur in a given sub-region. To calculate the clip limit for the CLAHE algorithm, we used Equation (4).
    c l i p l i m i t = W × H L 1 + α 100 S max 1
    where W × H is the number of pixels in each histogram calculated region, L is the number of gray scales, α is a clip factor, and S m a x is the maximum allowable slope. However, S m a x should be set to four for still X-ray images.

2.2.3. Channel-Replication (Ch-Rep) Data Augmentation Technique

Channel-Replication (Ch-Rep) data augmentation technique entails horizontally flipping all images in the training set and then creating new samples for each original and flipped image through the application of translation and shearing geometric transformations. Subsequently, pixel-wise gamma correction and CLAHE enhancement, with a γ value of 0.5 and an α value of 1, respectively, were applied to the generated images, resulting in the generation of 18 additional samples from each image in the training set.
After the operations of Ch-Rep data augmentation technique, each image is transformed into a three-channel image by concatenating the original and replicated images with their various transformations. Figure 5 presents examples of images generated using the Ch-Rep augmentation technique.
The use of Ch-Rep data augmentation technique results in a dataset with a significantly increased number of images, each exhibiting different breast density, lesion shapes, sizes, and locations. The diversity introduced by these transformations helps the deep learning model learn to recognize tumors under various conditions.

2.2.4. Ch-Con—Channel-Concatenation Data Augmentation Technique

The Channel-Concatenation data augmentation technique employed an innovative 3-channel augmentation method that concatenates the image with two post-processed images, as proposed in [25]. With this augmentation technique, instead of concatenating three duplicated grayscale images, we utilized two filtered images ( I γ with γ = 0.5 and I c l a h e with α = 1 ) for concatenation with the grayscale image I g . This process generated a new 3-channel image, denoted as I, as illustrated in Equation (5).
I = C o n c a t ( I g , I γ , I c l a h e )
In this context, I, I g , I γ , and I c l a h e represent the output images, images after gamma correction, and images after CLAHE equalization, respectively. This process resulted in the creation of six additional samples from each image in the training set.
Figure 6 shows sample images generated using the Ch-Con data augmentation technique. Ch-Con produces a dataset with 3-channel images, and each channel carries different information. The combination of the original grayscale image and the two post-processed images provides a rich dataset that reflects variations in breast density and image contrast. This aids in training the model to detect tumors under different conditions.

2.2.5. Developing IBTDs Based on Robust Deep Learning Object Detection Architectures

The deep learning-based breast tumor detection model in our study employs various object detection algorithms, each associated with different deep learning architectures. Specifically, in this study we developed efficient IBTDs based on five advanced deep learning architectures: Faster R-CNN [15], RetinaNet [16], YOLOv5 [17], YOLOv7 [18], and YOLOv8 [19]. Below, we briefly introduce these object detection architectures.
  • Faster R-CNN [15]: This well-established object detection architecture has found extensive application in diverse fields of computer vision, such as surveillance systems, pulmonary nodule detection, and breast cancer and brain tumor detection. Employing a two-stage approach, it comprises four pivotal components. It commences with a Convolutional Neural Network (CNN) to derive feature maps from the input image. Subsequently, a Region Proposal Network (RPN) generates region proposals on these feature maps. These proposals undergo classification to distinguish the object from the background, followed by a regression step to refine the object’s position via bounding box regression. The implementation of Faster R-CNN can be found at https://pytorch.org/vision/main/models/faster_rcnn.html, accessed on 22 October 2023.
  • RetinaNet [16]: This single-stage object detection architecture serves as an alternative to two-stage methods like Faster R-CNN. It amalgamates object classification and bounding box regression into a singular network, utilizing anchor boxes to manage diverse object scales and aspect ratios. Anchor boxes are assigned to actual objects based on Intersection-over-Union (IoU). Training employs a focal loss function that emphasizes challenging samples. Known for efficiency, RetinaNet requires that only one passes through the network. The implementation of Faster R-CNN can be found at https://pytorch.org/vision/main/models/retinanet.html, accessed on 22 October 2023.
  • YOLOv5 [17]: A state-of-the-art real-time object detection architecture renowned for its speed and accuracy. Embracing a single-stage, anchor-free approach, YOLOv5 processes entire images in a single forward pass, directly predicting object bounding boxes and class probabilities. Improvements over previous iterations include cross-stage partial connections for preserving high-level semantic information and a new anchor-free detection mechanism.
  • YOLOv7 [18]: Integrating architectural enhancements and novel techniques, YOLOv7 aims to boost robustness and accuracy. It introduces a new feature extraction network, modified loss function, and set-based learning approach that exploits inter-object relationships. A multi-scale training strategy further enhances its performance.
  • YOLOv8 [19]: A recent architecture aiming to enhance speed and accuracy. It adopts a new backbone network (CSPDarknet53) and introduces an anchor-free detection head. Bounding box predictions are made in a pixel-wise manner, and feature pyramid networks aid in recognizing objects of varying sizes.
The implementations of YOLOv5, YOLOv7, and YOLOv8 can be found at https://github.com/ultralytics, accessed on 22 October 2023. All models have been implemented in the Pytorch framework. It is noteworthy that Faster R-CNN’s loss function combines classification and bounding box regression losses using cross-entropy and smooth L1 loss, respectively. YOLO models employ three losses: classification, localization (based on IoU), and confidence (cross-entropy).
Our ablation study begins with a basic detection model for each architecture, serving as a reference for their performance in detecting breast lesions in DBT images. We individually trained each detector by augmenting the training set through horizontal image flipping. We also assessed the efficacy of the proposed Ch-Rep and Ch-Conc data augmentation techniques in enhancing the IBTD models’ performance for breast tumor detection.

2.3. Implementation Details and Parameter Setting

The flowchart depicted in Figure 7 illustrates the sequential steps entailed in constructing our breast lesion detection framework, which is founded upon the dynamic ensemble technique. The initial phase involves the development of the Individual Breast Tumor Detection (IBTD) model, as explained in Section 2.2.
It should be noted that the number of labels corresponds to the number of individual models, specifically the Individual Breast Tumor Detection (IBTD) models, employed in building the ensemble. In this study, we leveraged the top three IBTD models to form the ensemble model, resulting in a total of three labels. Utilizing these top three IBTD models, we trained the ResNet-50 model to determine the most suitable IBTD for a given input DBT image. This selection process has been formalized as a classification task. In this context, there exist three labels, each directly associated with a specific IBTD model:
  • Label (1) designates the top-performing IBTD model, Faster R-CNN, which is the model with the highest accuracy among the top three IBTD models.
  • Label (2) corresponds to the second-best IBTD model, RetinaNet.
  • Label (3) is attributed to the third-best IBTD model, YOLOv5.
For each DBT image within the training dataset, we recorded the IBTD label associated with the highest detection accuracy. This information was then employed to construct the training data used to educate the ResNet-50 classifier, as detailed in Table 1.
In the subsequent stage, the ResNet50 model is trained to select the most suitable IBTD model for the detection of breast tumors, predicated upon the characteristics inherent in the input images.
The original DBT image size was 1890 × 2457 . To reduce computational complexity, we resized the DBT images to 640 × 640 . It is worth noting that all of the detection models were optimized using the SGD algorithm with various learning rates ( l r ) ranging from 5 × 10 3 to 1 × 10 2 , finding that the best results were achieved with l r = 1 × 10 3 . To mitigate the risk of overfitting, which can arise due to the limited training data, all models were trained for a modest 50 epochs with a mini-batch size of 8 images.
To ensure fair comparisons, the evaluated models were trained using the same DBT dataset and tested on the same DBT test dataset. Our methods were developed using the Python programming language, and all experiments were conducted on a 64-bit Ubuntu operating system with a 3.6 GHz Intel Core i7 processor, 32 GB of RAM, and an Nvidia RTX3080 graphics card with 10 GB of video RAM, utilizing the PyTorch framework.

3. Experimental Results and Discussion

3.1. Dataset

This study utilized the DBTex challenge dataset [13,26], which is the sole publicly accessible DBT image dataset. The dataset includes 1000 breast tomosynthesis scans from 985 patients. It is worth noting that not all DBT images in the BTex challenge dataset have annotations. Specifically, ground-truth bounding boxes are available for 208 DBT images from 101 patients. Among these 208 DBT images, there are 224 tumors, indicating that some images contain more than one tumor.
The dataset was partitioned in a patient-wise random manner, as shown in Table 2, with 70% of the patients designated for training and the remaining 30% for testing. This division yielded 145 images for the training set and 63 images for the testing set. To train the baseline models, we chose to augment the training set by horizontally flipping the images. The same training sets generated through Ch-Conc and Ch-Rep augmentation techniques, were used to establish the IBTD labels. It is important to highlight that the test set, consisting of 63 images, was exclusively used to evaluate the performance of the proposed ensemble.
As detailed in Section 2.2.1, the Ch-Rep data augmentation method produced a total of 18 samples for each image in the training set, resulting in an expanded dataset comprising 2610 images, each associated with 2880 tumor bounding box annotations. In the case of the Ch-Conc data augmentation method, an additional s i x samples were generated for each image within the training set, culminating in a dataset of 870 images, encompassing 960 tumor bounding box annotations for training.

3.2. Evaluation Metrics

To assess the effectiveness of the proposed method, we utilized standard evaluation metrics widely used for object detection models [27], including accuracy, precision, recall, and F1-score. Accuracy, which is the most commonly used and reliable metric for evaluating breast tumor detection methods, can be defined as follows:
A c c u r a c y = T P + T N T P + F P + T N + F N
where true positive ( T P ) refers to the number of accurately detected tumors, true negative ( T N ) represents the number of correctly detected non-lesions or backgrounds, false positive ( F P ) indicates the number of backgrounds wrongly identified as tumors, and false negative ( F N ) denotes the number of tumors incorrectly identified as backgrounds.
Precision is the degree of exactness of the model in identifying only relevant objects, specifically breast tumors in this case. It is measured as the percentage of correct positive predictions. Recall, also known as sensitivity, refers to a model’s ability to identify all relevant cases or true positive rate and is measured as the percentage of true positives detected among all relevant ground truths. Precision and recall can be expressed as:
P r e c i s i o n = T P T P + F P R e c a l l = T P T P + F N
The F1-score combines precision and recall. It is the harmonic mean of precision and recall. It is computed as follows:
F 1 s c o r e = 2 × p r e c i s i o n × r e c a l l p r e c i s i o n + r e c a l l

3.3. Experimental Results

Table 3 provides the results of the baseline breast tumor detection models based on the Faster R-CNN, RetinaNet, YOLOv5, YOLOv7, and YOLOv8 architectures. These models were trained on a dataset that included horizontally flipped versions of the original DBT images.
Based on the results, it was observed that the Faster R-CNN architecture outperformed the other baseline models in the detection of breast lesions. This superiority was attributed to the region proposal network (RPN), which facilitated Faster R-CNN in generating Region of Interest (ROI) proposals more efficiently compared to other methods. Furthermore, RetinaNet demonstrated promising results, outperforming all YOLO-based breast tumor detection models across all evaluation metrics.
However, it is worth noting that the YOLO architectures possessed an advantage in terms of speed and simplicity, as they could directly predict both bounding boxes and class probabilities from entire breast DBT images in a single pass. In contrast, the RetinaNet architectures involved an additional step of classifying proposal regions before predicting the bounding boxes and class probabilities for each region. This additional step enhanced the precision of the RetinaNet architecture but also made it slower and more complex.
In summary, these findings suggest that the Faster R-CNN and RetinaNet object detection architectures may be better suited for DBT images, with Faster R-CNN showcasing top performance and RetinaNet offering enhanced precision despite increased complexity.
Table 4 tabulates the results of the breast tumor detection models based on the Faster R-CNN, RetinaNet, YOLOv5, and YOLOv7 architectures with the Ch-Rep data augmentation technique.
Comparing the values in Table 4 to those in Table 3, it can be concluded that utilizing the Ch-Rep training set for deep learning-based detectors can result in significant enhancements across all metrics for all the evaluated models. Specifically, the Faster R-CNN-based IBTD model demonstrated an increased detection accuracy of 3%, accompanied by notable improvements in precision, true positive rate (TPR), and F1-score, which rose by 6%, 3%, and 3%, respectively. Similarly, the RetinaNet-based IBTD model exhibited a remarkable 13% surge in detection accuracy, with its TPR experiencing a substantial boost of 34%. These improvements led to a notable 25% enhancement in F1-score by reducing the number of false negatives.
In contrast, the YOLO-based IBTD models achieved a lower detection accuracy, registering figures of 62.79%, 63.91%, and 60.74% for versions 5, 7, and 8, respectively. Nonetheless, they consistently outperformed their baseline models, indicating that an increase in the number of training samples can significantly enhance their detection performance.
Table 5 presents the results of the breast tumor detection models with the Ch-Conc data augmentation technique.
Upon examination of Table 5 in conjunction with Table 3 and Table 4, it became evident that the Ch-Conc data augmentation method can outperform both the Ch-Rep data augmentation method and the baseline models, even with a smaller set of training samples. This serves as a clear indication that the proposed Ch-Conc data augmentation method enhances the quality of the generated DBT images by incorporating valuable features and information, ultimately leading to heightened detection accuracy.
For instance, the Faster R-CNN-based IBTD model achieved a detection accuracy that was 4% higher than that obtained using the Ch-Rep method and 7% superior to the baseline model. Furthermore, this model exhibited precision and recall rates of 93.75% and 70.31%, respectively, resulting in a substantial 8% improvement in the F1-score in comparison to the baseline.
Upon analyzing the RetinaNet-based IBTD model, it becomes evident that the detection accuracy has improved by 14% compared to the baseline model, surpassing the 13% increase achieved with the Ch-Rep data augmentation technique. Although the precision was slightly lower than that of the baseline IBTD models at 86.54%, the RetinaNet-based IBTD model achieved a notably higher true positive rate (TPR) at 70.31%. This led to a substantial improvement in the F1-score, which increased by 27% compared to the baseline model and by 2% compared to the Ch-Rep method.
Transitioning to the YOLO-based IBTD models, it is apparent that the YOLOv5-based IBTD model has achieved an increased accuracy of 68.18%, which is 6% higher than the accuracy obtained using the Ch-Rep data augmentation technique. The YOLOv5-based IBTD model has also exhibited improvements in TPR and F1-score. In addition, YOLOv8 demonstrated better accuracy with a 4% and 8% increase compared to the baseline and Ch-Rep, respectively, while showing improvements in both TPR and F1-score.
However, the YOLOv7-based IBTD model outperformed the baseline model but achieved lower performance than the Ch-Rep data augmentation technique. This indicates that the number of training samples significantly impacts the performance of the YOLOv7-based IBTD model.
Based on the analysis above, it can be inferred that the utilization of the Ch-Conc augmentation technique can result in significant improvements in breast lesion detection compared to Ch-Rep. Furthermore, the IBTD models based on the Faster R-CNN, RetinaNet, and YOLOv5 object detection architectures exhibited promising detection accuracy. Therefore, we chose these models to construct the proposed ensemble.
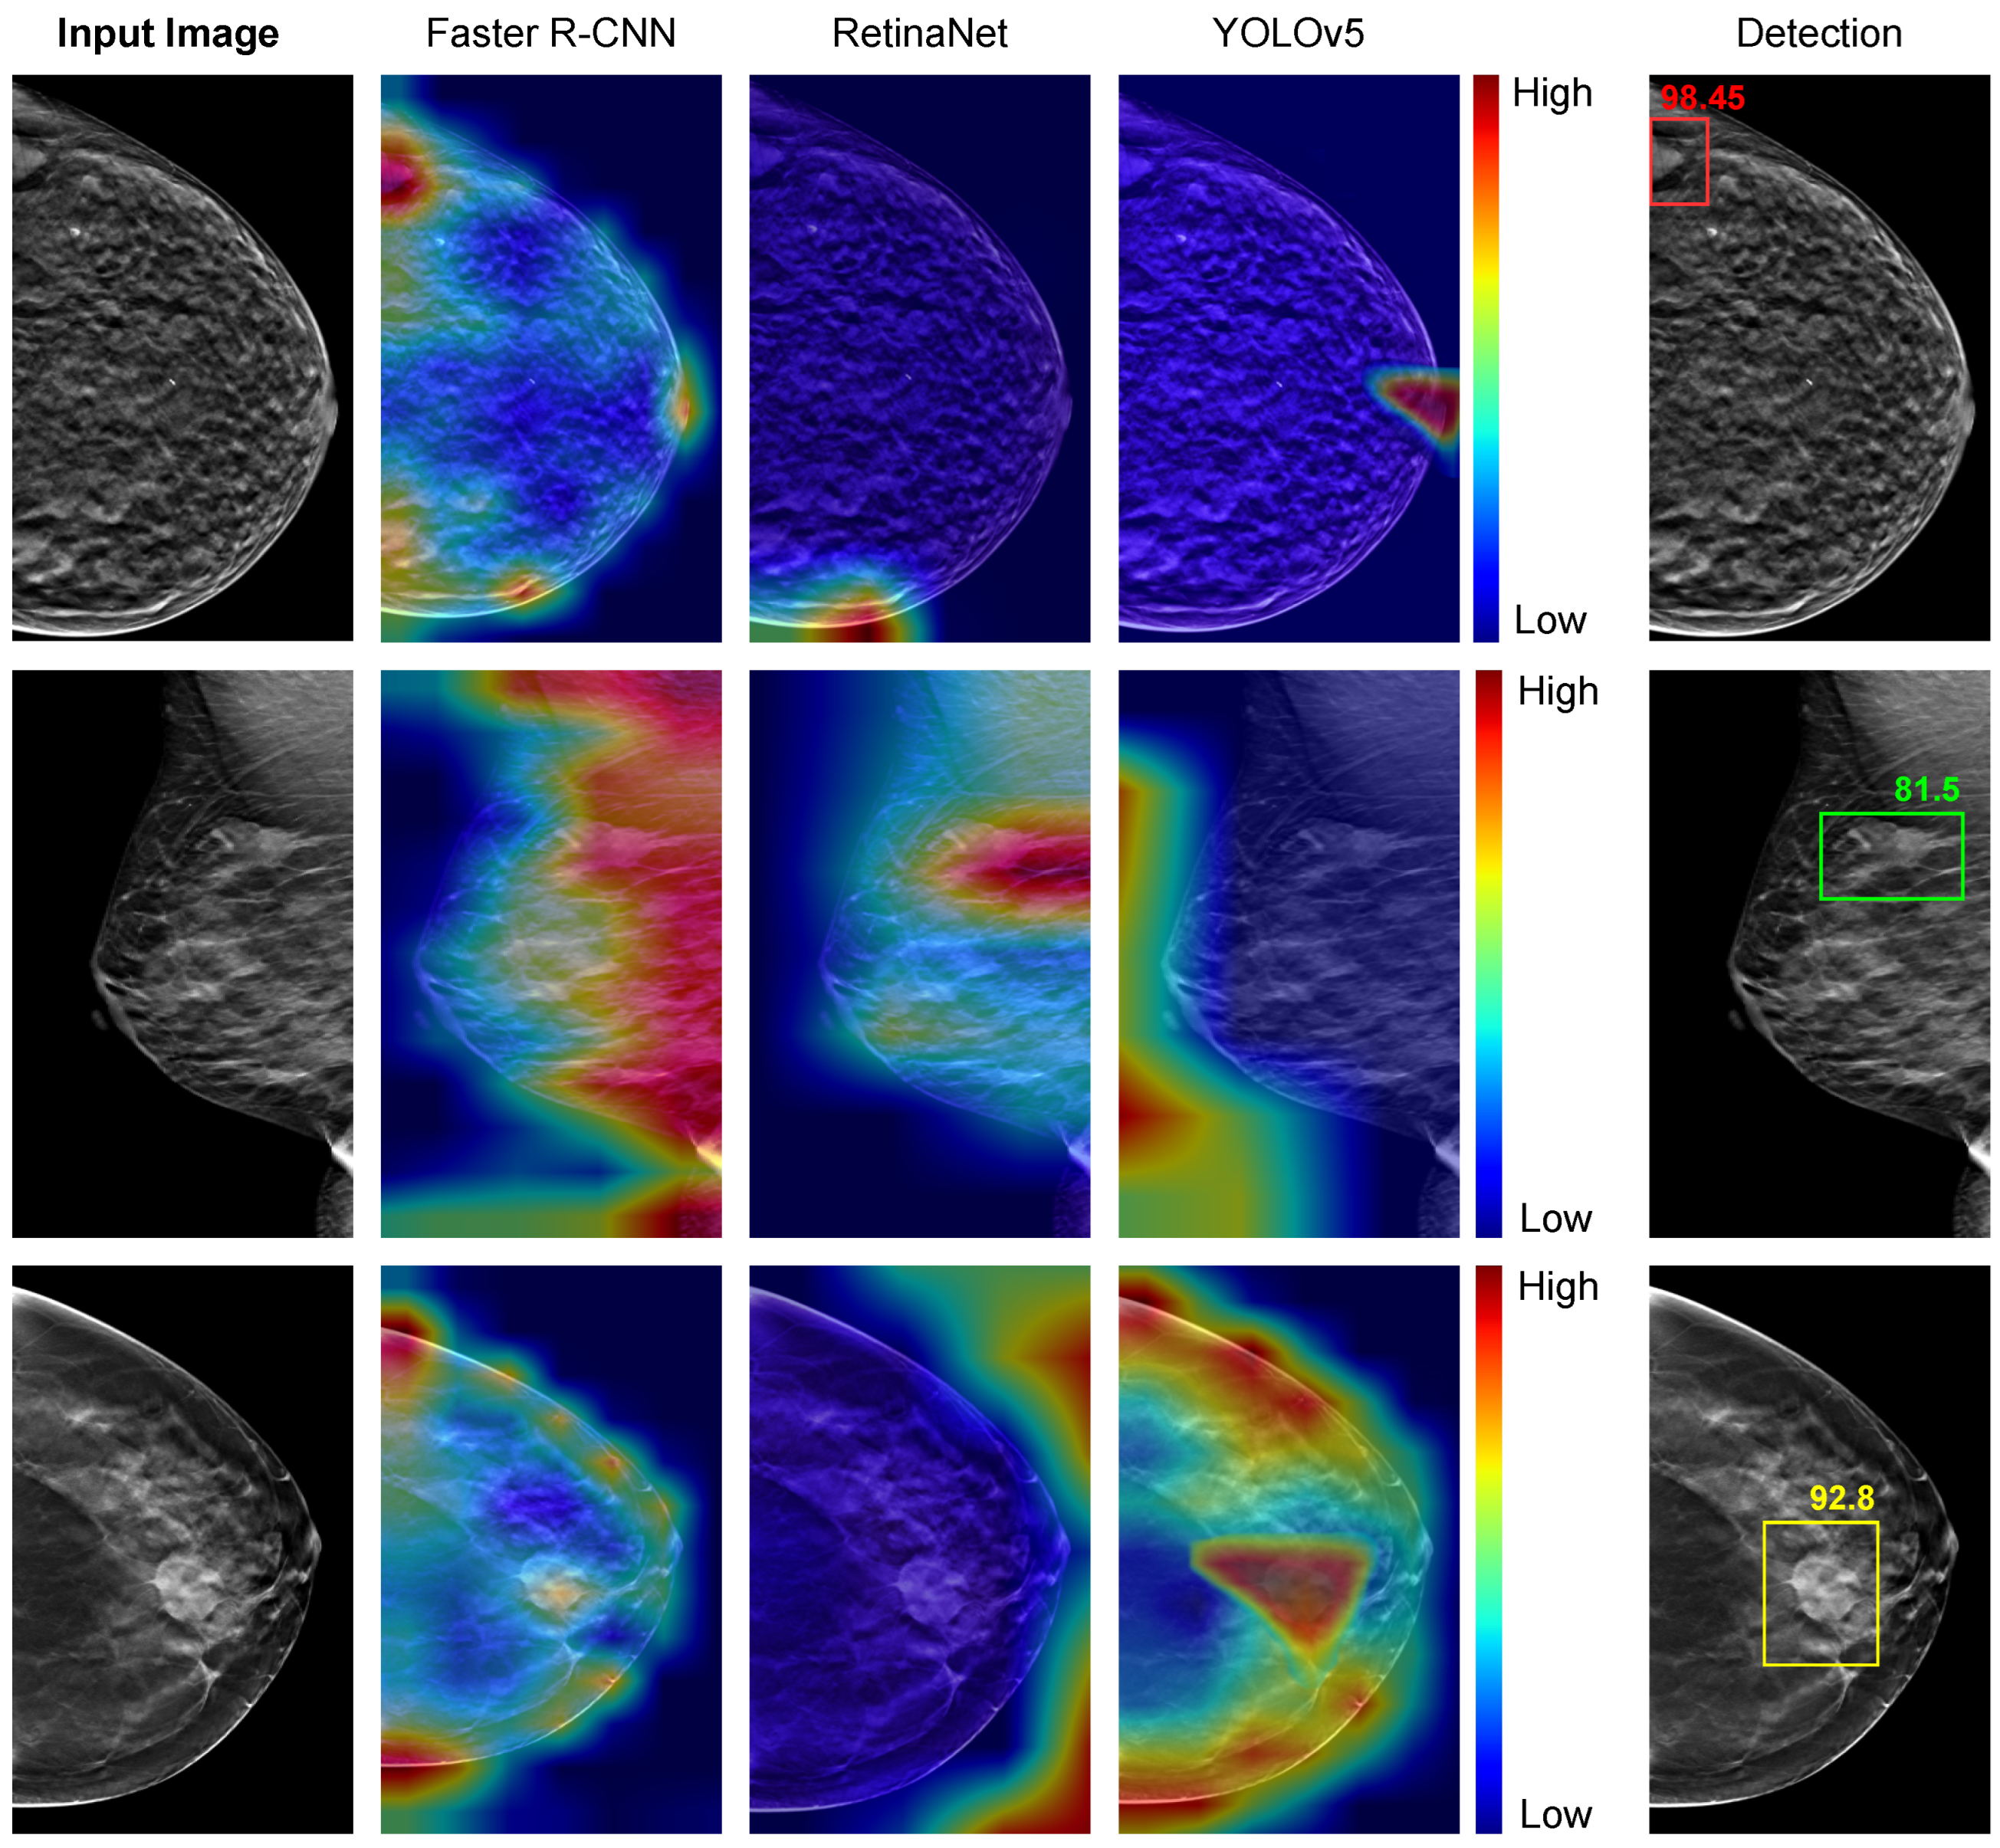
Figure 8 presents the visual representation of the detection models trained using the Ch-Conc approach with the Grad-CAM technique. The image is highlighted in red for pixels that highly contribute to detecting tumors and blue for pixels with minimal impact on the detector’s decisions. The fifth column displays the most accurate detection outcomes, with the Faster-RCNN-based IBTD model output box highlighted in red, the RetinaNet-based IBTD model output box in green, and the YOLOv5-based IBTD model output box in yellow.
For the DBT image in the top row, which shows a small tumor situated at the left edge of the image, the Faster R-CNN-based IBTD model exhibits an appropriate activation response, whereas the RetinaNet-based IBTD and YOLOv5-based IBTD fail to detect the tumor accurately. In the second row, the RetinaNet-based IBTD model successfully detects a tumor with an irregular shape, whereas the Faster R-CNN-based IBTD model produces a false positive response covering a large area, and YOLOv5-based IBTD fails to detect the tumor at all. Finally, in the third row, with a large and circular tumor, only the YOLOv5-based IBTD detector produces an accurate activation for the tumor, while RetinaNet-based IBTD fails entirely and Faster R-CNN yields false positive results.
After carefully examining the results of the various IBTD detectors, we found that each one excels at identifying tumors with well-defined boundaries. However, when it comes to detecting tumors with fuzzy borders and low contrast, some detectors could not identify them accurately. Therefore, ensembling these individual IBTD detectors is a powerful technique in order to obtain better detection results by taking advantage of the excellence of each detector.
Table 6 presents the breast tumor detection results of the proposed ensemble method compared to the two most common object detection ensemble methods, including non-maximum suppression (NMS) [20] and weighted boxes fusion (WBF) [21].
The NMS technique [20] is a post-processing technique commonly used in object detection tasks to eliminate duplicate or redundant bounding boxes generated by the detection model. In an ensemble setting, NMS can be applied to merge the output of multiple object detection models into a final set of non-overlapping bounding boxes. This was achieved by first sorting the bounding boxes according to their detection confidence scores, then iterating through the boxes in decreasing order of confidence and discarding any boxes that have an intersection-over-union (IoU) overlap greater than a predefined threshold with higher-scoring boxes. The Weighted Box Fusion (WBF) ensemble technique [21] is a popular post-processing technique used in object detection tasks to combine the outputs of multiple detection models into a final set of non-overlapping bounding boxes. Unlike NMS, which simply selects the highest-scoring box and discards the rest, WBF assigns weights to each box based on its detection confidence and its intersection-over-union (IoU) overlap with other boxes. The final box for each object is then computed as a weighted average of the individual boxes, with the weights proportional to the product of their confidence and their IoU overlaps. WBF has been shown to be effective in reducing false positives and increasing the recall of object detection models, especially in cases where individual models have different strengths and weaknesses. However, it requires more computational resources than NMS and may be less suitable for real-time applications.
After analyzing the experimental results, we found that using ensemble methods led to a slight improvement in accuracy of around 1–3% compared to the top-performing individual models. However, our proposed method outperformed the other techniques and achieved an impressive accuracy of 86.72%. Additionally, our approach achieved an F1 score of 84.96%, indicating that it can accurately detect breast tumors with minimal false positive and false negative samples. This significant performance improvement resulted in a 5% increase in the F1 score compared to the best individual detector.
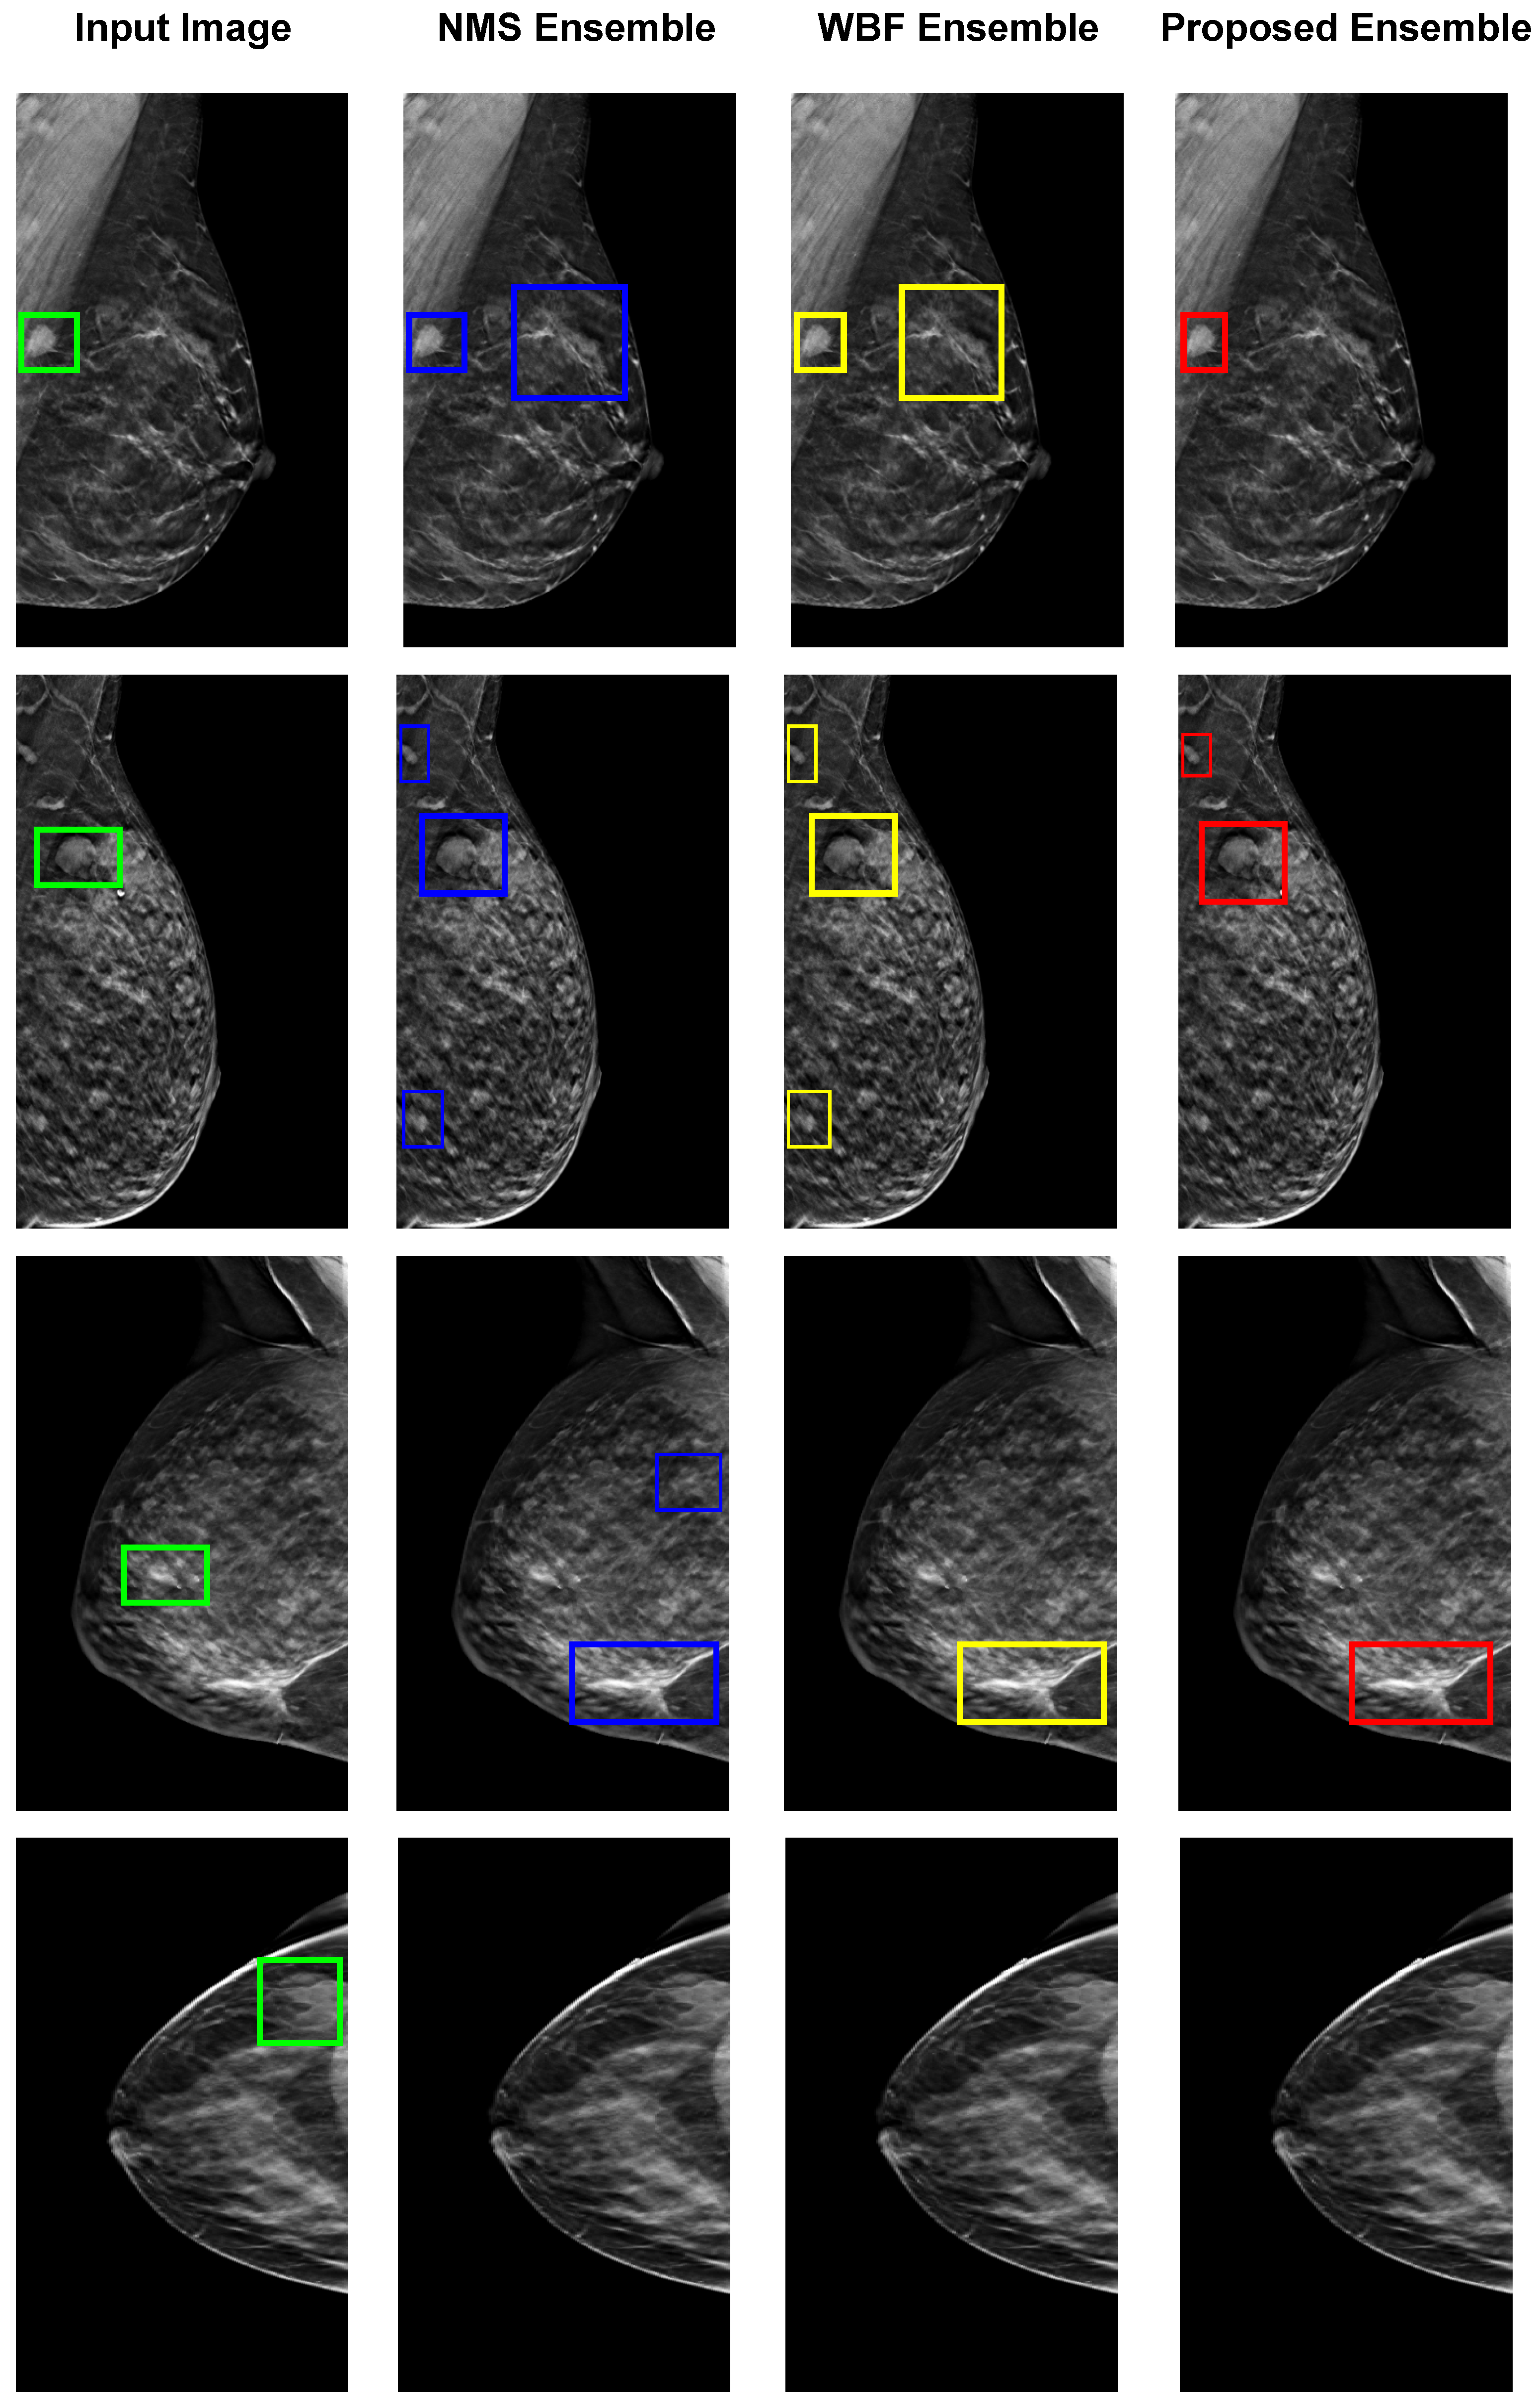
Figure 9 illustrates the four examples of images of breast tumor detection using different ensemble methods, including NMS, WBF, and the proposed ensemble. The top row demonstrates that the proposed ensemble method only accurately detects the tumor with dense, bright tissue region compared to the given input images. However, the other ensemble NMS and WBF methods produce false positives by detecting the fuzzy boundaries of healthy tissues. The proposed ensemble method is effective in such cases, relying on the best detection model for each input image. The second and third rows show false positive results from all individual models, which affect both NMS and WBF methods, but the proposed ensemble has minimal false positives. In the last rows, none of the individual detection models produce correct detections, resulting in no outputs from the ensemble methods. The proposed technique shows some limitations for these specific cases but is performed better than the others.

3.4. Analyzing the Complexity of the Proposed Method

The proposed ensemble approach not only excels in detection accuracy but also boasts a competitive edge in terms of computational complexity when juxtaposed with alternative ensemble methods. In the case of NMS and WBF ensemble strategies, the generation of tumor bounding boxes necessitates the activation of all individual detection models (IBTDs) before constructing the ensemble outcome. To elucidate, all three IBTD models must be executed to procure bounding boxes, which are subsequently subjected to NMS and WBF for ensemble formation, culminating in the final breast tumor detection outcome. Contrary to existing ensemble techniques such as NMS and WBF, our proposed ensemble mechanism distinguishes itself by selecting a singular IBTD model for tumor bounding box generation with every input DBT image. Consequently, the throughput of our approach surpasses that of the other evaluated methods.
Importantly, the computational complexity of the ensemble breast tumor detection model escalates with the augmentation of parameters within individual breast tumor detection models. Within our study, individual models founded on Faster-RCNN, RetinaNet, and YOLO deep learning architectures encompass 43 million, 36 million, and 7 million parameters, respectively. Employing NMS and WBF entails the simultaneous operation of Faster-RCNN, RetinaNet, and YOLO tumor detection models, leading to a cumulative computational complexity approximating the summation of the three models’ parameters—equivalent to 86 million parameters.
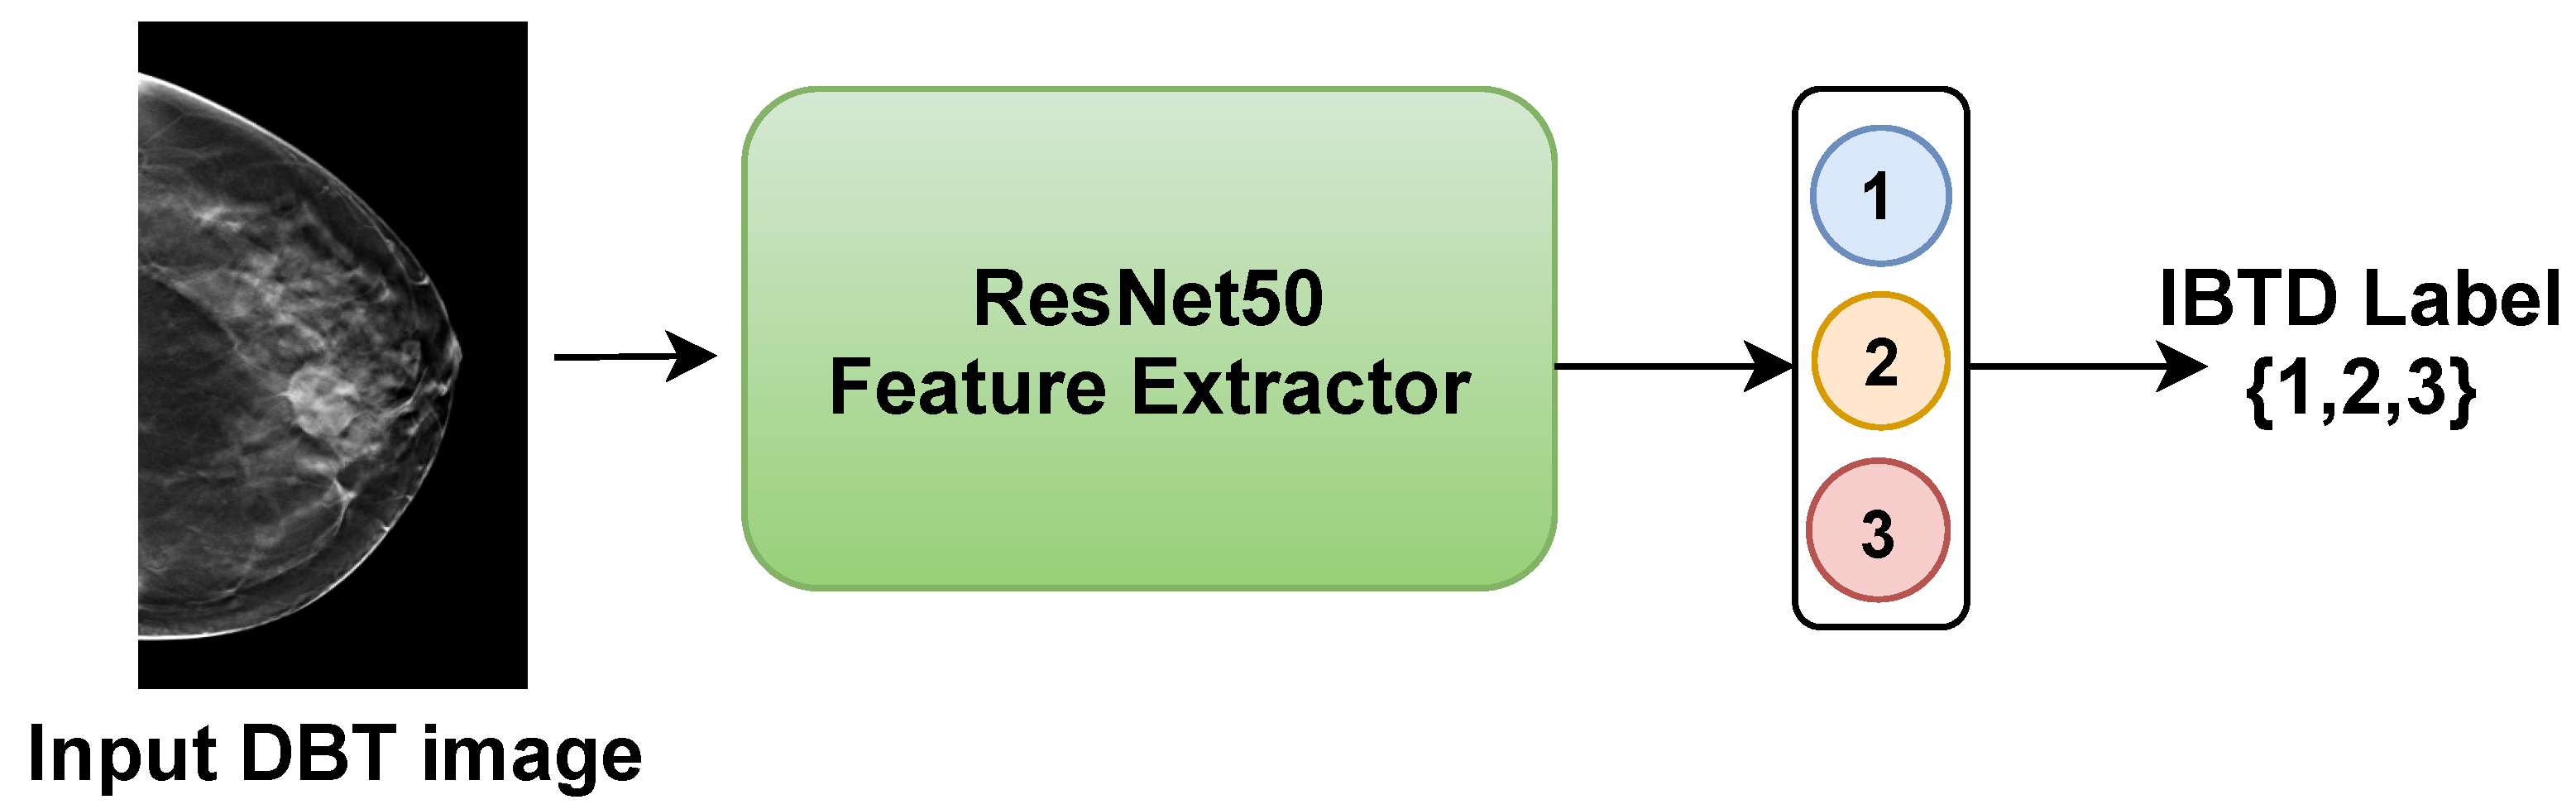
In contrast, our proposed ensemble technique requires the activation of only one among Faster-RCNN, RetinaNet, and YOLO tumor detection models, along with the parameters of ResNet50 (24 million parameters). In the optimal scenario for a given DBT image, our ensemble opts for the YOLO-based tumor detection model, resulting in a computational complexity totaling 31 million parameters. In a less favorable case, our ensemble selects the Faster-RCNN-based tumor detection model (the most resource-intensive), contributing to a total computational complexity of 67 million parameters.

3.5. Evaluating the Proposed Method on the Breast Mammography Modality

To further corroborate the efficacy of the proposed ensemble approach, we conducted evaluations using another breast imaging modality, namely breast mammography. Our assessment focused on the performance of the proposed method using the INbreast dataset [28]. It contains a total of 410 images from 115 women. It is a valuable resource for research that focuses on mammogram images for breast cancer detection and diagnosis and has been used in several studies to develop and evaluate new methods for breast cancer imaging, including computer-aided detection (CAD) systems.
Table 7 presents the evaluation results of the individual baseline models based on Faster-RCNN, RetinaNet, and YOLOv5, the ensemble methods (NMS and WBF), and the proposed ensemble method for the INbreast dataset.
The proposed ensemble technique exhibited marked superiority over all examined ensemble methods, thereby elevating detection accuracy beyond the capabilities of baseline models. It is noteworthy that conventional ensemble methods (NMS and WBF) proved incapable of augmenting detection performance due to the adverse impact of false positives from individual models on the final ensemble outcomes. However, our ensemble approach outperformed these conventional methods, highlighting the efficacy of model selection tailored to each input DBT image. Our ensemble method achieved an accuracy of 88.64%, surpassing the top-performing RetinaNet model (best baseline) by a margin of two percentage points. Additionally, it attained an f1-score of 87.81%, marking a remarkable 12% advancement over the WBF ensemble technique.
One of the limitations of this study is the reliance on the DBTex challenge dataset, the only publicly accessible database for Digital Breast Tomosynthesis (DBT) images, which poses constraints on the model’s generalizability due to its relatively limited size and diversity. In addition, the quality of annotations within the dataset could influence the model’s performance, yet details about the annotation process, such as inter-rater reliability and quality control measures, are not provided.

4. Conclusions and Future Work

This paper introduces a novel and efficient dynamic ensemble method for detecting breast tumors within digital breast tomosynthesis (DBT) images. The method primarily relies on a sophisticated deep neural network that identifies the most suitable individual breast tumor detector (IBTD) based on specific characteristics inherent to the input DBT image. The study further develops these effective IBTD models using popular architectures such as Faster R-CNN, RetinaNet, and YOLOv5, thus forming the foundation for the ensemble model.
Notably, the paper highlights the successful application of the channel concatenation augmentation technique, which improves the performance of the baseline breast tumor detection models better than the channel replication augmentation technique, even when the training dataset is relatively limited. The experimental results, conducted on the publicly available DBTex DBT dataset, reveal a substantial enhancement in the accuracy and F1-scores of the breast tumor detection models based on the YOLO architecture, showing an impressive improvement of approximately 17%. Additionally, the F1-score of the Faster R-CNN-based model exhibits a noteworthy 3% enhancement.
Most significantly, the proposed dynamic ensemble method achieves an impressive detection accuracy of 86%, surpassing the performance of the best individual breast tumor detection model by a notable margin of 10%. This advancement in the field of breast tumor detection in DBT images demonstrates the promising potential of the dynamic ensemble approach, setting a new benchmark for future research in this domain.
In comparison to two contemporary ensemble techniques, namely non-maximum suppression (NMS) and weighted boxes fusion (WBF), it was revealed that the dynamic ensemble method proposed in this paper exhibits superior detection accuracy, surpassing WBF by 3% and NMS by 1.5%. Notably, a thorough analysis of computational complexity highlights the significant advantage of the proposed method in terms of computational efficiency when compared to both WBF and NMS techniques.
The findings of this research indicate a promising direction for future work, with a focus on integrating the proposed ensemble technique with an automated approach for estimating the malignancy of breast tumors in DBT images. Specifically, the developed detection method will be harnessed to extract regions within the DBT images that contain tumors, subsequently utilizing a deep learning-based model for estimating malignancy. This integration aims to provide accurate malignancy scores for the identified tumors, thereby facilitating more comprehensive and effective diagnostic capabilities within the field of breast tumor detection in DBT images.

Author Contributions

Conceptualization, L.H., A.S. and M.A.-N.; methodology, L.H., A.S. and M.A.-N.; software, L.H.; validation, L.H., A.S., V.K.S. and M.A.-N.; formal analysis, L.H., A.S., V.K.S. and M.A.-N.; investigation, L.H., A.S. and M.A.-N.; resources, D.P. and M.A.-N.; data curation, L.H. and M.A.-N.; writing—original draft preparation, L.H., A.S., V.K.S. and M.A.-N.; writing—review and editing, L.H., A.S., V.K.S., D.P. and M.A.-N.; visualization, L.H., A.S., V.K.S. and M.A.-N.; supervision, D.P. and M.A.-N.; project administration, D.P. and M.A.-N.; funding acquisition, D.P. and M.A.-N. All authors have read and agreed to the published version of the manuscript.

Funding

The Spanish Government partly supported this research through Project TED2021-130081B-C21, Project PDC2022-133383-I00, and Project PID2019-105789RB-I00.

Institutional Review Board Statement

Not applicable.

Informed Consent Statement

Not applicable.

Data Availability Statement

In our study, we used the DBTex challenge dataset [13] and the INbreast dataset [28]. The DBTex is publicly available at https://www.aapm.org/GrandChallenge/DBTex2/, accessed on 22 October 2023. The INbreast dataset is publicly available at https://www.kaggle.com/datasets/tommyngx/inbreast2012, accessed on 22 October 2023.

Conflicts of Interest

The authors declare no conflict of interest.

References

  1. Azamjah, N.; Soltan-Zadeh, Y.; Zayeri, F. Global Trend of Breast Cancer Mortality Rate: A 25-Year Study. Asian Pac. J. Cancer Prev. 2019, 20, 2015–2020. [Google Scholar] [CrossRef] [PubMed]
  2. Cheng, H.; Shan, J.; Ju, W.; Guo, Y.; Zhang, L. Automated breast cancer detection and classification using ultrasound images: A survey. Pattern Recognit. 2010, 43, 299–317. [Google Scholar] [CrossRef]
  3. Devolli-Disha, E.; Manxhuka-Kërliu, S.; Ymeri, H.; Kutllovci, A. Comparative accuracy of mammography and ultrasound in women with breast symptoms according to age and breast density. Bosn. J. Basic Med. Sci. 2009, 9, 131–136. [Google Scholar] [CrossRef] [PubMed]
  4. Dobbins, J.T.; Godfrey, D.J. Digital X-ray tomosynthesis: Current state of the art and clinical potential. Phys. Med. Biol. 2003, 48, R65–R106. [Google Scholar] [CrossRef] [PubMed]
  5. Helvie, M.A. Digital mammography imaging: Breast tomosynthesis and advanced applications. Radiol. Clin. N. Am. 2010, 48, 917–929. [Google Scholar] [CrossRef] [PubMed]
  6. Greenberg, J.S.; Javitt, M.C.; Katzen, J.; Michael, S.; Holland, A.E. Clinical Performance Metrics of 3D Digital Breast Tomosynthesis Compared With 2D Digital Mammography for Breast Cancer Screening in Community Practice. Am. J. Roentgenol. 2014, 203, 687–693. [Google Scholar] [CrossRef] [PubMed]
  7. Chan, H.P.; Wei, J.; Zhang, Y.; Helvie, M.A.; Moore, R.H.; Sahiner, B.; Hadjiiski, L.; Kopans, D.B. Computer-aided detection of masses in digital tomosynthesis mammography: Comparison of three approaches. Med. Phys. 2008, 35, 4087–4095. [Google Scholar] [CrossRef] [PubMed]
  8. Lai, X.; Yang, W.; Li, R. DBT Masses Automatic Segmentation Using U-Net Neural Networks. Comput. Math. Methods Med. 2020, 2020, 7156165. [Google Scholar] [CrossRef] [PubMed]
  9. Samala, R.K.; Chan, H.P.; Hadjiiski, L.; Helvie, M.A.; Wei, J.; Cha, K. Mass detection in digital breast tomosynthesis: Deep convolutional neural network with transfer learning from mammography. Med. Phys. 2016, 43, 6654–6666. [Google Scholar] [CrossRef] [PubMed]
  10. Fan, M.; Li, Y.; Zheng, S.; Peng, W.; Tang, W.; Li, L. Computer-aided detection of mass in digital breast tomosynthesis using a faster region-based convolutional neural network. Methods 2019, 166, 103–111. [Google Scholar] [CrossRef] [PubMed]
  11. Fan, M.; Zheng, H.; Zheng, S.; You, C.; Gu, Y.; Gao, X.; Peng, W.; Li, L. Mass Detection and Segmentation in Digital Breast Tomosynthesis Using 3D-Mask Region-Based Convolutional Neural Network: A Comparative Analysis. Front. Mol. Biosci. 2020, 7, 599333. [Google Scholar] [CrossRef] [PubMed]
  12. Lotter, W.; Diab, A.R.; Haslam, B.; Kim, J.G.; Grisot, G.; Wu, E.; Wu, K.; Onieva, J.O.; Boyer, Y.; Boxerman, J.L.; et al. Robust breast cancer detection in mammography and digital breast tomosynthesis using an annotation-efficient deep learning approach. Nat. Med. 2021, 27, 244–249. [Google Scholar] [CrossRef] [PubMed]
  13. Buda, M.; Saha, A.; Walsh, R.; Ghate, S.; Li, N.; Swiecicki, A.; Lo, J.Y.; Mazurowski, M.A. Breast Cancer Screening—Digital Breast Tomosynthesis (Breast-Cancer-Screening-DBT) [Data set]. The Cancer Imaging Archive. [CrossRef]
  14. Hossain, M.B.; Nishikawa, R.M.; Lee, J. Developing breast lesion detection algorithms for digital breast tomosynthesis: Leveraging false positive findings. Med. Phys. 2022, 49, 7596–7608. [Google Scholar] [CrossRef] [PubMed]
  15. Ren, S.; He, K.; Girshick, R.; Sun, J. Faster R-CNN: Towards Real-Time Object Detection with Region Proposal Networks. IEEE Trans. Pattern Anal. Mach. Intell. 2017, 39, 1137–1149. [Google Scholar] [CrossRef]
  16. Lin, T.Y.; Goyal, P.; Girshick, R.; He, K.; Dollar, P. Focal Loss for Dense Object Detection. IEEE Trans. Pattern Anal. Mach. Intell. 2020, 42, 318–327. [Google Scholar] [CrossRef] [PubMed]
  17. Jocher, G.; Chaurasia, A.; Stoken, A.; Borovec, J.; Kwon, Y.; Michael, K.; Xie, T.; Fang, J.; Yifu, Z.; Wong, C.; et al. ultralytics/yolov5: v7.0-YOLOv5 SOTA Realtime Instance Segmentation. 2021. Available online: https://github.com/ultralytics/yolov5/discussions/10258 (accessed on 22 October 2023). [CrossRef]
  18. Wang, C.Y.; Bochkovskiy, A.; Liao, H.Y.M. YOLOv7: Trainable bag-of-freebies sets new state-of-the-art for real-time object detectors. arXiv 2022, arXiv:2207.02696. [Google Scholar] [CrossRef]
  19. Jocher, G.; Chaurasia, A.; Qiu, J. YOLOv8 by Ultralytics. 2023. Available online: https://github.com/ultralytics/ultralytics (accessed on 22 October 2023).
  20. Felzenszwalb, P.F.; Girshick, R.B.; McAllester, D.; Ramanan, D. Object Detection with Discriminatively Trained Part-Based Models. IEEE Trans. Pattern Anal. Mach. Intell. 2010, 32, 1627–1645. [Google Scholar] [CrossRef] [PubMed]
  21. Solovyev, R.; Wang, W.; Gabruseva, T. Weighted boxes fusion: Ensembling boxes from different object detection models. Image Vis. Comput. 2021, 107, 104117. [Google Scholar] [CrossRef]
  22. He, K.; Zhang, X.; Ren, S.; Sun, J. Deep Residual Learning for Image Recognition. In Proceedings of the 2016 IEEE Conference on Computer Vision and Pattern Recognition (CVPR), Las Vegas, NV, USA, 27–30 June 2016; pp. 770–778. [Google Scholar] [CrossRef]
  23. Oza, P.; Sharma, P.; Patel, S.; Adedoyin, F.; Bruno, A. Image Augmentation Techniques for Mammogram Analysis. J. Imaging 2022, 8, 141. [Google Scholar] [CrossRef] [PubMed]
  24. Koonsanit, K.; Thongvigitmanee, S.; Pongnapang, N.; Thajchayapong, P. Image enhancement on digital X-ray images using N-CLAHE. In Proceedings of the 2017 10th Biomedical Engineering International Conference (BMEiCON), Hokkaido, Japan, 31 August–2 September 2017; pp. 1–4. [Google Scholar] [CrossRef]
  25. Hassan, L.; Abdel-Nasser, M.; Saleh, A.; Puig, D. Lesion Detection in Breast Tomosynthesis Using Efficient Deep Learning and Data Augmentation Techniques. In Frontiers in Artificial Intelligence and Applications; IOS Press: Amsterdam, The Netherlands, 2021. [Google Scholar] [CrossRef]
  26. SPIE-AAPM-NCI DAIR Digital Breast Tomosynthesis Lesion Detection Challenge. Available online: https://www.aapm.org/GrandChallenge/DBTex2/ (accessed on 24 January 2023).
  27. Padilla, R.; Netto, S.L.; da Silva, E.A.B. A Survey on Performance Metrics for Object-Detection Algorithms. In Proceedings of the 2020 International Conference on Systems, Signals and Image Processing (IWSSIP), Niterói, Brazil, 1–3 July 2020; pp. 237–242. [Google Scholar] [CrossRef]
  28. Available online: https://www.kaggle.com/datasets/tommyngx/inbreast2012 (accessed on 4 October 2023).
Figure 1. Illustrations from DBT instances highlight the diversity found in breast lesions. In these instances, differences in tumor sizes are marked with green bounding boxes, variations in shapes are indicated by blue bounding boxes, and fluctuations in breast density are represented by yellow bounding boxes.
Computers 12 00220 g001
Figure 2. The framework of the proposed ensemble technique for breast lesion detection in DBT images involves feeding the input DBT into the dynamic ensemble. Within this ensemble, the deep CNN network (ResNet50) is trained to select the most suitable Individual Breast Tumor Detection (IBTD) model based on the characteristics of the input DBT image, ensuring accurate breast tumor detection. The numbers 1, 2, and 3 stand for the label of each IBTD model. The detected tumor is indicated by the red rectangular bounding box.
Computers 12 00220 g002
Figure 3. In the workflow of the proposed dynamic ensemble, the ResNet-50 model is trained to autonomously select the breast tumor detection model (IBTD) based on the characteristics of the input DBT images to detect breast tumors.
Computers 12 00220 g003
Figure 4. The framework for developing robust individual breast tumor detection models (IBTDs). The detected tumor is indicated by the red rectangular bounding box.
Computers 12 00220 g004
Figure 5. Examples of the Channel-Replication (Ch-Rep) data augmentation technique applied to DBT images. The augmented images have three channels, achieved by concatenating three replicated images of the resulting grayscale image, each processed with a single color channel.
Computers 12 00220 g005
Figure 6. Examples of the Channel-Concatenation (Ch-Con) data augmentation technique applied to DBT images. In this approach, the image is concatenated with two post-processed images.
Computers 12 00220 g006
Figure 7. The flowchart depicts the sequential stages in the creation of the proposed ensemble approach for the detection of breast lesions in Digital Breast Tomosynthesis (DBT) images.
Computers 12 00220 g007
Figure 8. Grad-CAM explanations from the individual detection models for DBT images. It is worth mentioning that the intensity of the red color indicates the areas where the model focuses more when making the final prediction. In contrast, blue represents less significant regions or pixels. In the fifth column, Faster-RCNN detection is represented by red bounding boxes, RetinaNet detection is indicated by green bounding boxes, and YOLOv5 detection is marked by yellow bounding boxes.
Computers 12 00220 g008
Figure 9. Visual explanations of tumor detection predictions produced by the non-maximum suppression (NMS) [20] and weighted boxes fusion (WBF) [21] ensemble methods and proposed ensemble. The first column includes the input DBT image, and the green bounding boxes stand for the ground-truth (the correct location of tumors). In the second column, NMS Ensemble detection is represented by blue bounding boxes. In the third column, WBF Ensemble detection is indicated by yellow bounding boxes. In the fourth column, the proposed ensemble detection is marked by red bounding boxes.
Computers 12 00220 g009
Table 1. Data structure used to train the proposed ensemble model.
InputIBTD Label
I12
I21
I32
I43
In1
Table 2. Overview of the DBT image dataset for the proposed breast tumor detection framework.
No. of PatientsNo. of ImagesBaselineCh-Rep AugmentationCh-Conc Augmentation
Train set701452902610870
Test set3163636363
Total1012083532673933
Table 3. Results of the baseline breast tumor detection models (IBTD#1, IBTD#2, IBTD#3, IBTD#4, and IBTD#5) based the Faster R-CNN, RetinaNet, YOLOv5, YOLOv7 and YOLOv8 architectures.
Accuracy (%)Precision (%)Recall (TPR) (%)F1-Score (%)
Faster R-CNN (IBTD#1)76.6480.7765.6372.41
RetinaNet (IBTD#2)66.4195.6934.3850.57
YOLOv5 (IBTD#3)60.7476.0028.7941.76
YOLOv7 (IBTD#4)55.1298.9910.9419.72
YOLOv8 (IBTD#5)56.1583.3315.3825.97
Table 4. Results of the breast tumor detection models (IBTD#1, IBTD#2, IBTD#3, IBTD#4, and IBTD#5) based the Faster R-CNN, RetinaNet, YOLOv5, YOLOv7, and YOLOv8 architectures with the Ch-Rep data augmentation technique.
Accuracy (%)Precision (%)Recall (TPR) (%)F1-Score (%)
Faster R-CNN (IBTD#1)79.8586.2768.7576.52
RetinaNet (IBTD#2)79.2684.6268.7575.86
YOLOv5 (IBTD#3)62.7987.5032.8047.71
YOLOv7 (IBTD#4)63.9181.4833.8547.83
YOLOv8 (IBTD#5)60.7473.0829.2341.76
Table 5. Results of the breast tumor detection models (IBTD#1, IBTD#2, IBTD#3, IBTD#4, and IBTD#5) based the Faster R-CNN, RetinaNet, YOLOv5, YOLOv7, and YOLOv8 architectures with the Ch-Conc data augmentation technique.
Accuracy (%)Precision (%)Recall (TPR) (%)F1-Score (%)
Faster R-CNN (IBTD#1)83.0893.7570.3180.36
RetinaNet (IBTD#2)80.6086.5470.3177.59
YOLOv5 (IBTD#3)68.1885.2442.1954.40
YOLOv7 (IBTD#4)60.2868.7532.3544.00
YOLOv8 (IBTD#5)64.1468.1844.1253.57
Table 6. Comparing the proposed ensemble technique with two existing ensemble techniques: non-maximum suppression (NMS) [20] and weighted boxes fusion (WBF) [21]. The best results are highlighted in bold.
Accuracy (%)Precision (%)Recall (TPR) (%)F1-Score (%)
NMS [20]85.0787.9379.6983.61
WBF [21]83.8285.0079.6982.26
Proposed ensemble86.7297.9675.0084.96
Table 7. Evaluating the proposed method on the mammographic INbreast dataset [28]. The best results are highlighted in bold.
Accuracy (%)Precision (%)Recall (TPR) (%)F1-Score (%)
Faster R-CNN75.5275.0068.1871.43
RetinaNet86.1196.7768.1880.00
YOLOv579.0080.0048.4860.38
NMS ensemble76.2470.0079.5574.47
WBF ensemble76.4769.2381.8275.00
Proposed ensemble88.6494.7481.8287.81
Disclaimer/Publisher’s Note: The statements, opinions and data contained in all publications are solely those of the individual author(s) and contributor(s) and not of MDPI and/or the editor(s). MDPI and/or the editor(s) disclaim responsibility for any injury to people or property resulting from any ideas, methods, instructions or products referred to in the content.

