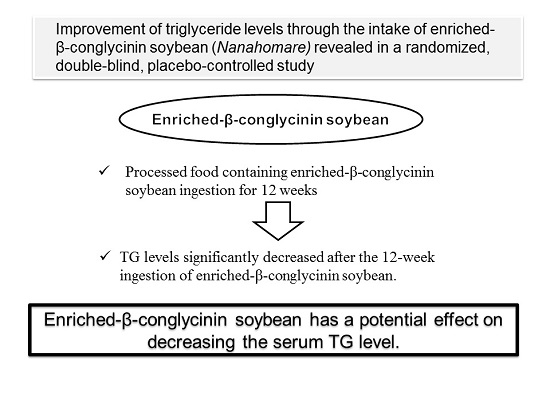
Improvement of Triglyceride Levels through the Intake of Enriched-β-Conglycinin Soybean (Nanahomare) Revealed in a Randomized, Double-Blind, Placebo-Controlled Study

 ,
,
Abstract
:
1. Introduction
2. Materials and Methods
2.1. Subjects
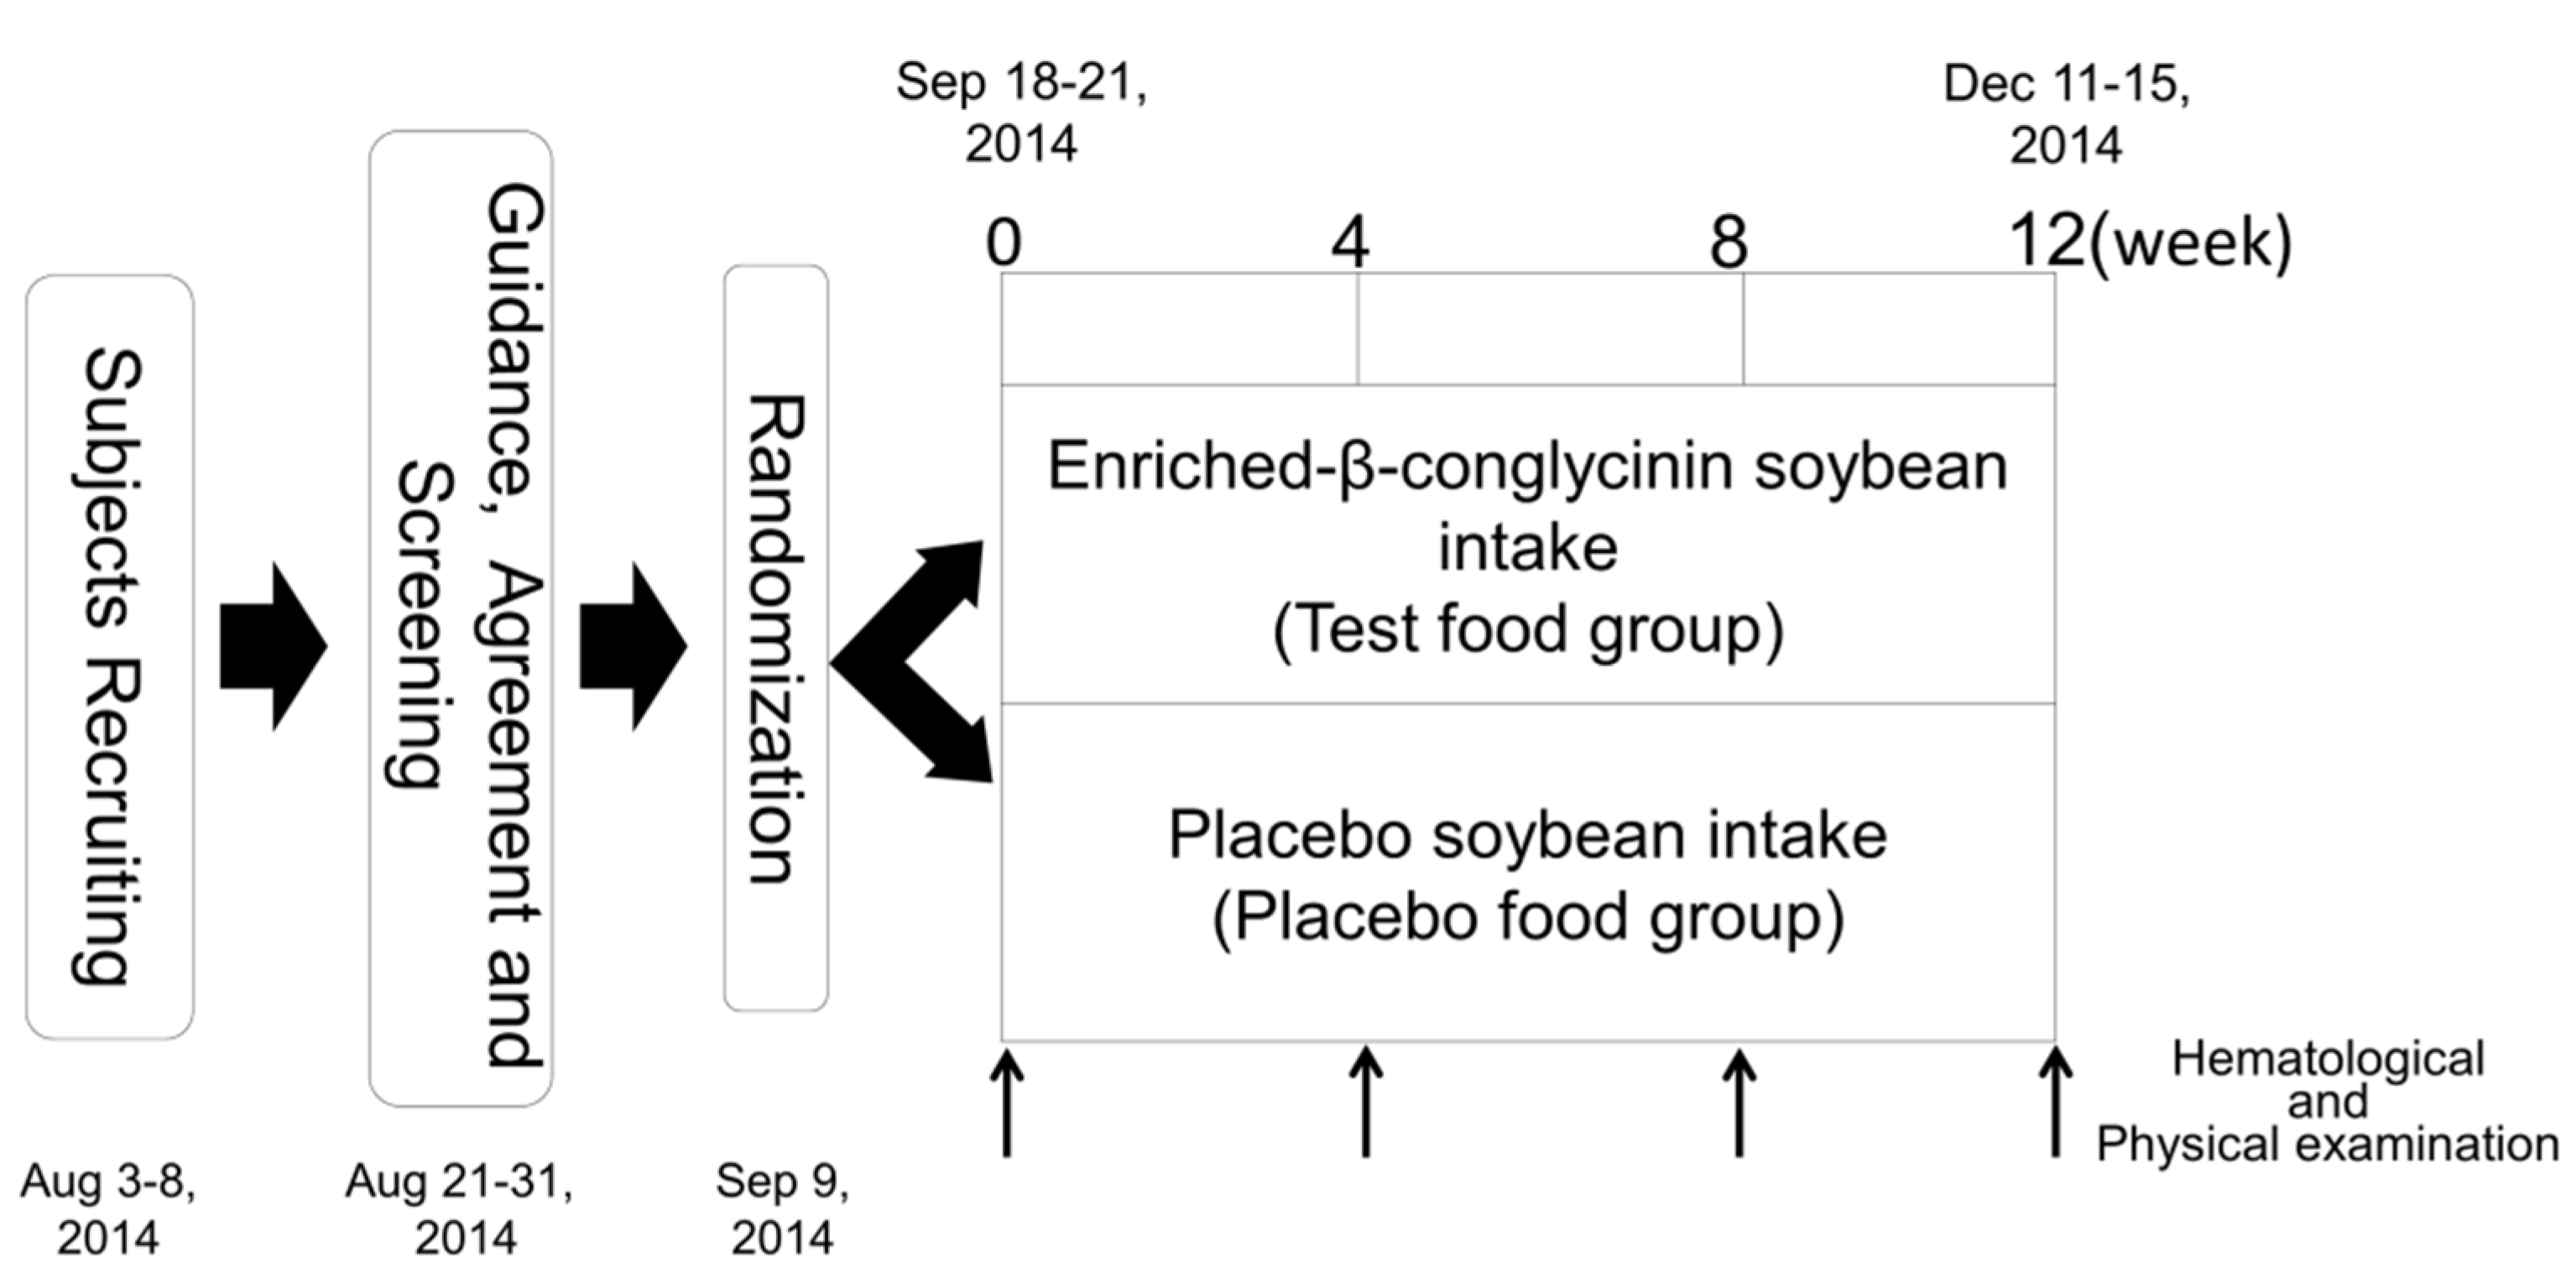
2.2. Study Design
2.3. Test Meals
2.4. Physical and Hematological Examination
2.5. Ethics
2.6. Sample Size
2.7. Statistical Analysis
3. Results
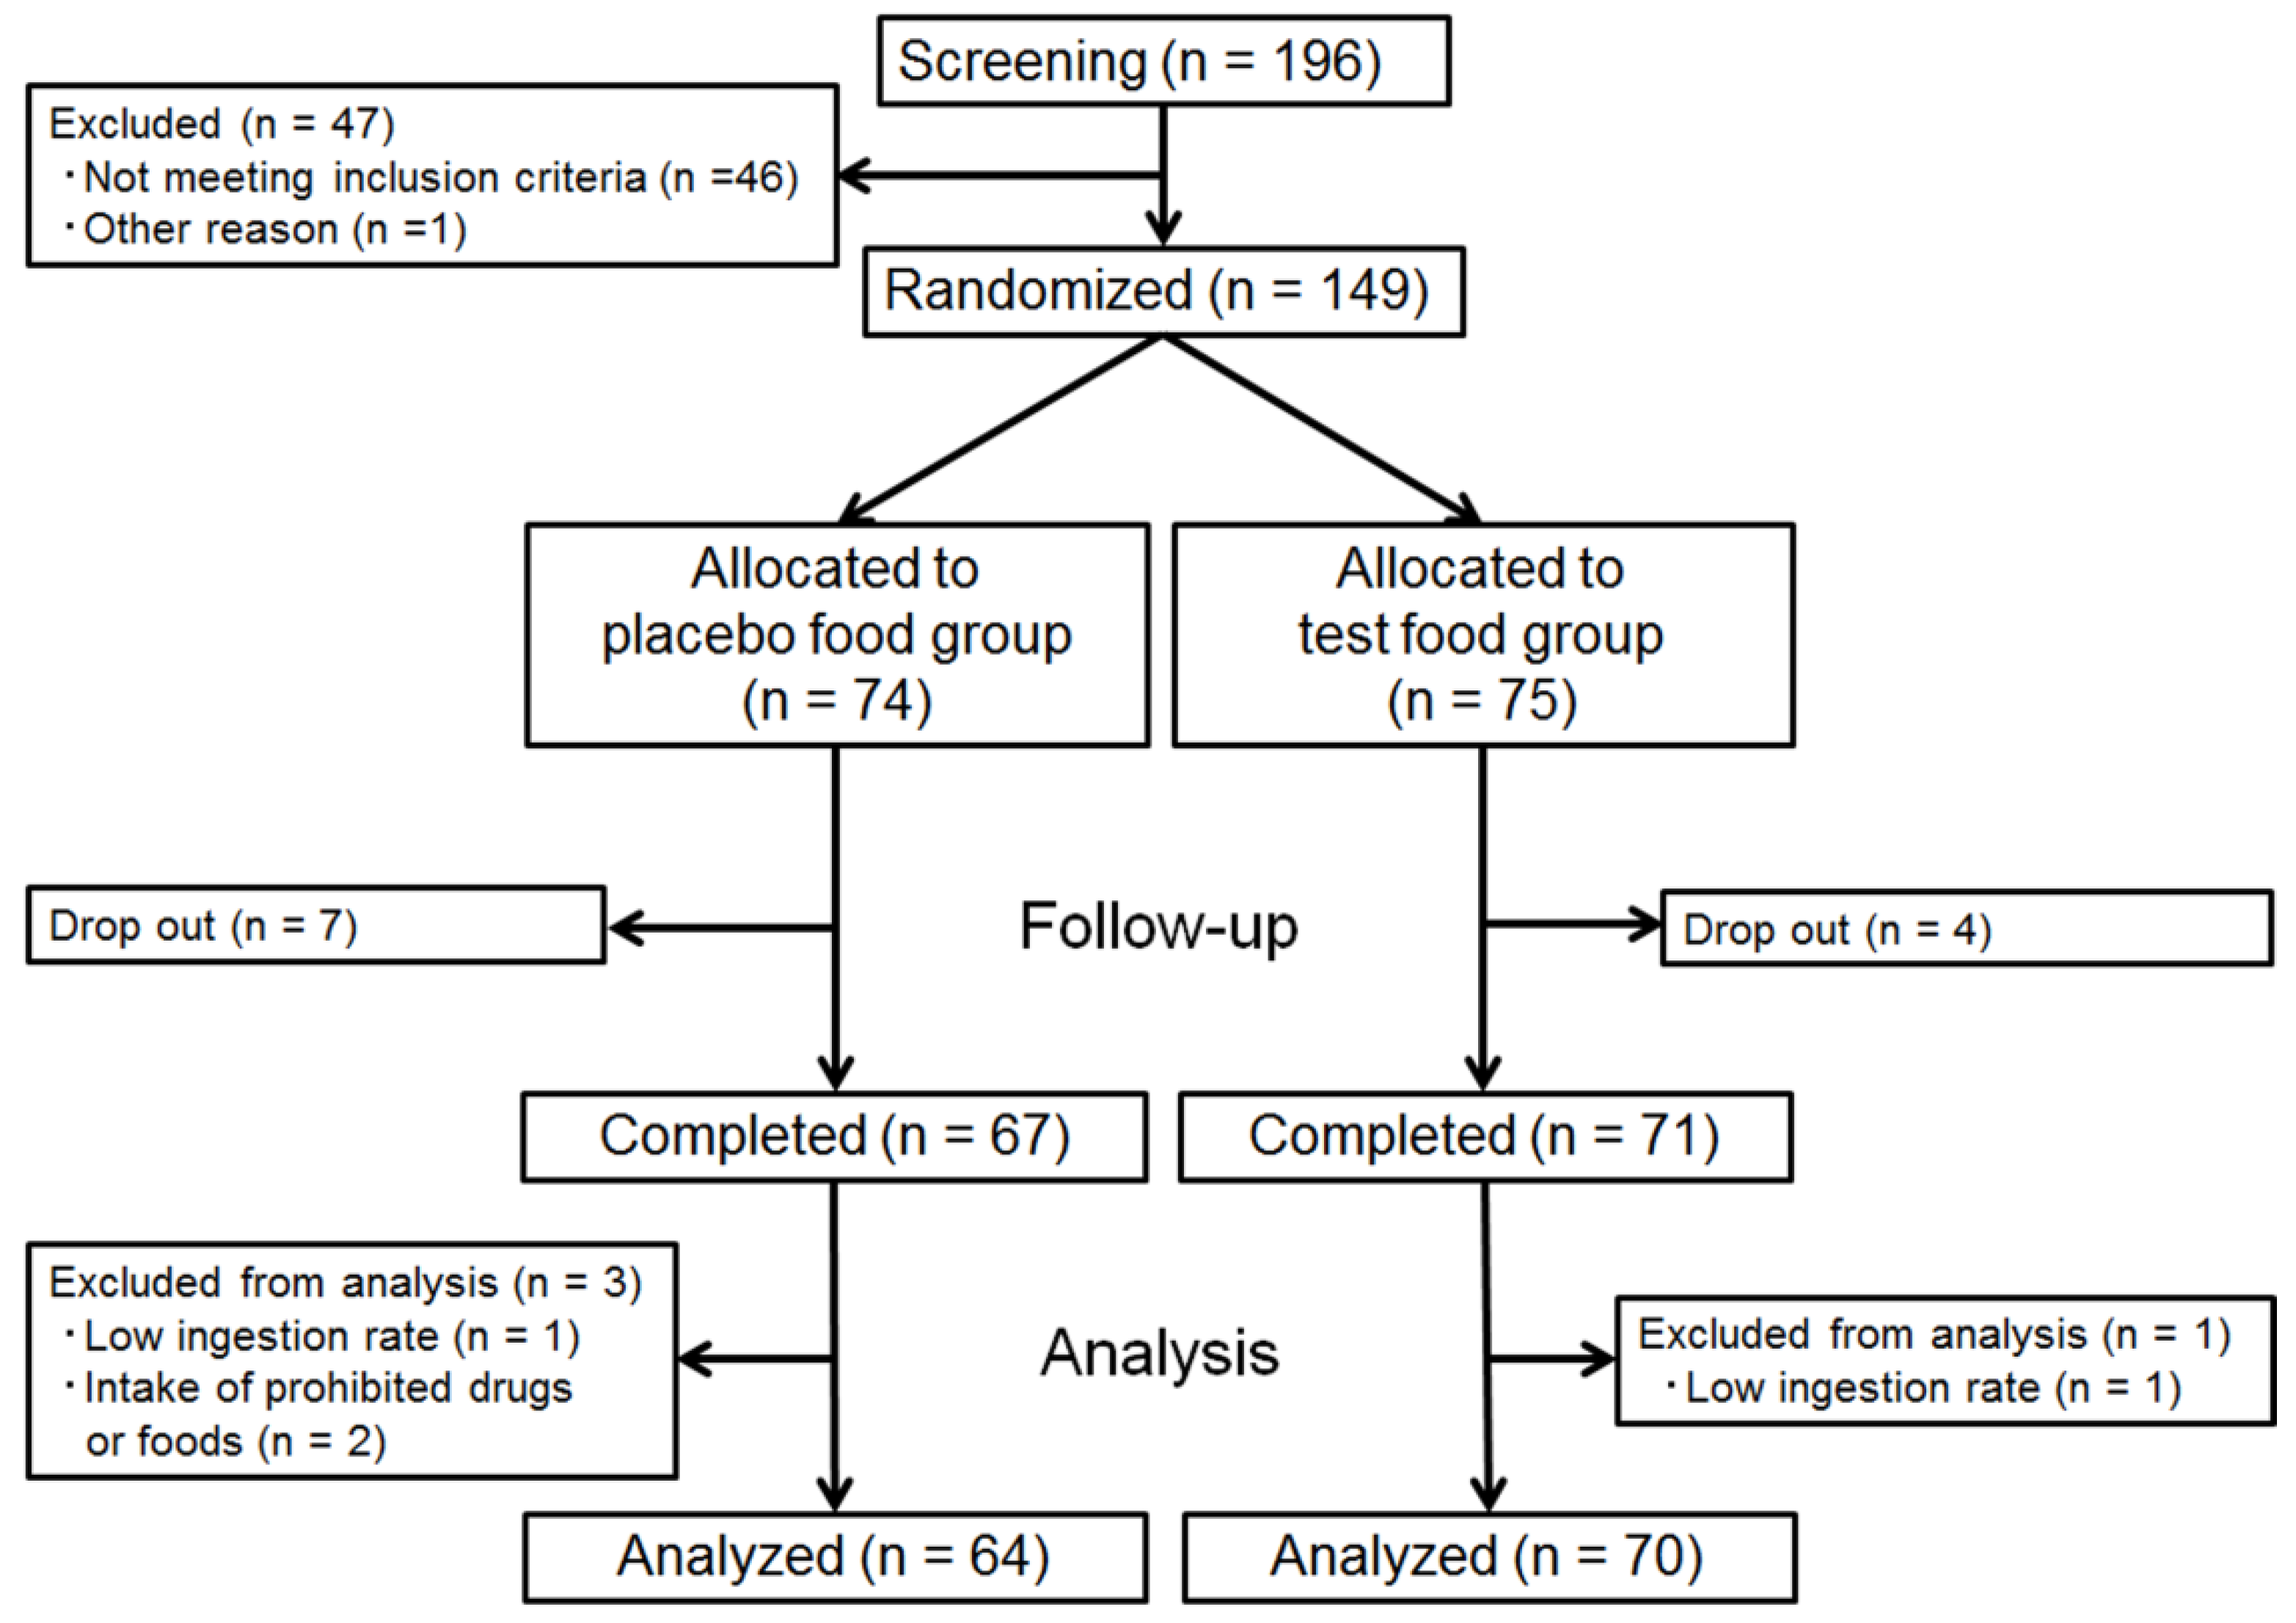
3.1. Subject Dropouts and Exclusions, and Characteristics
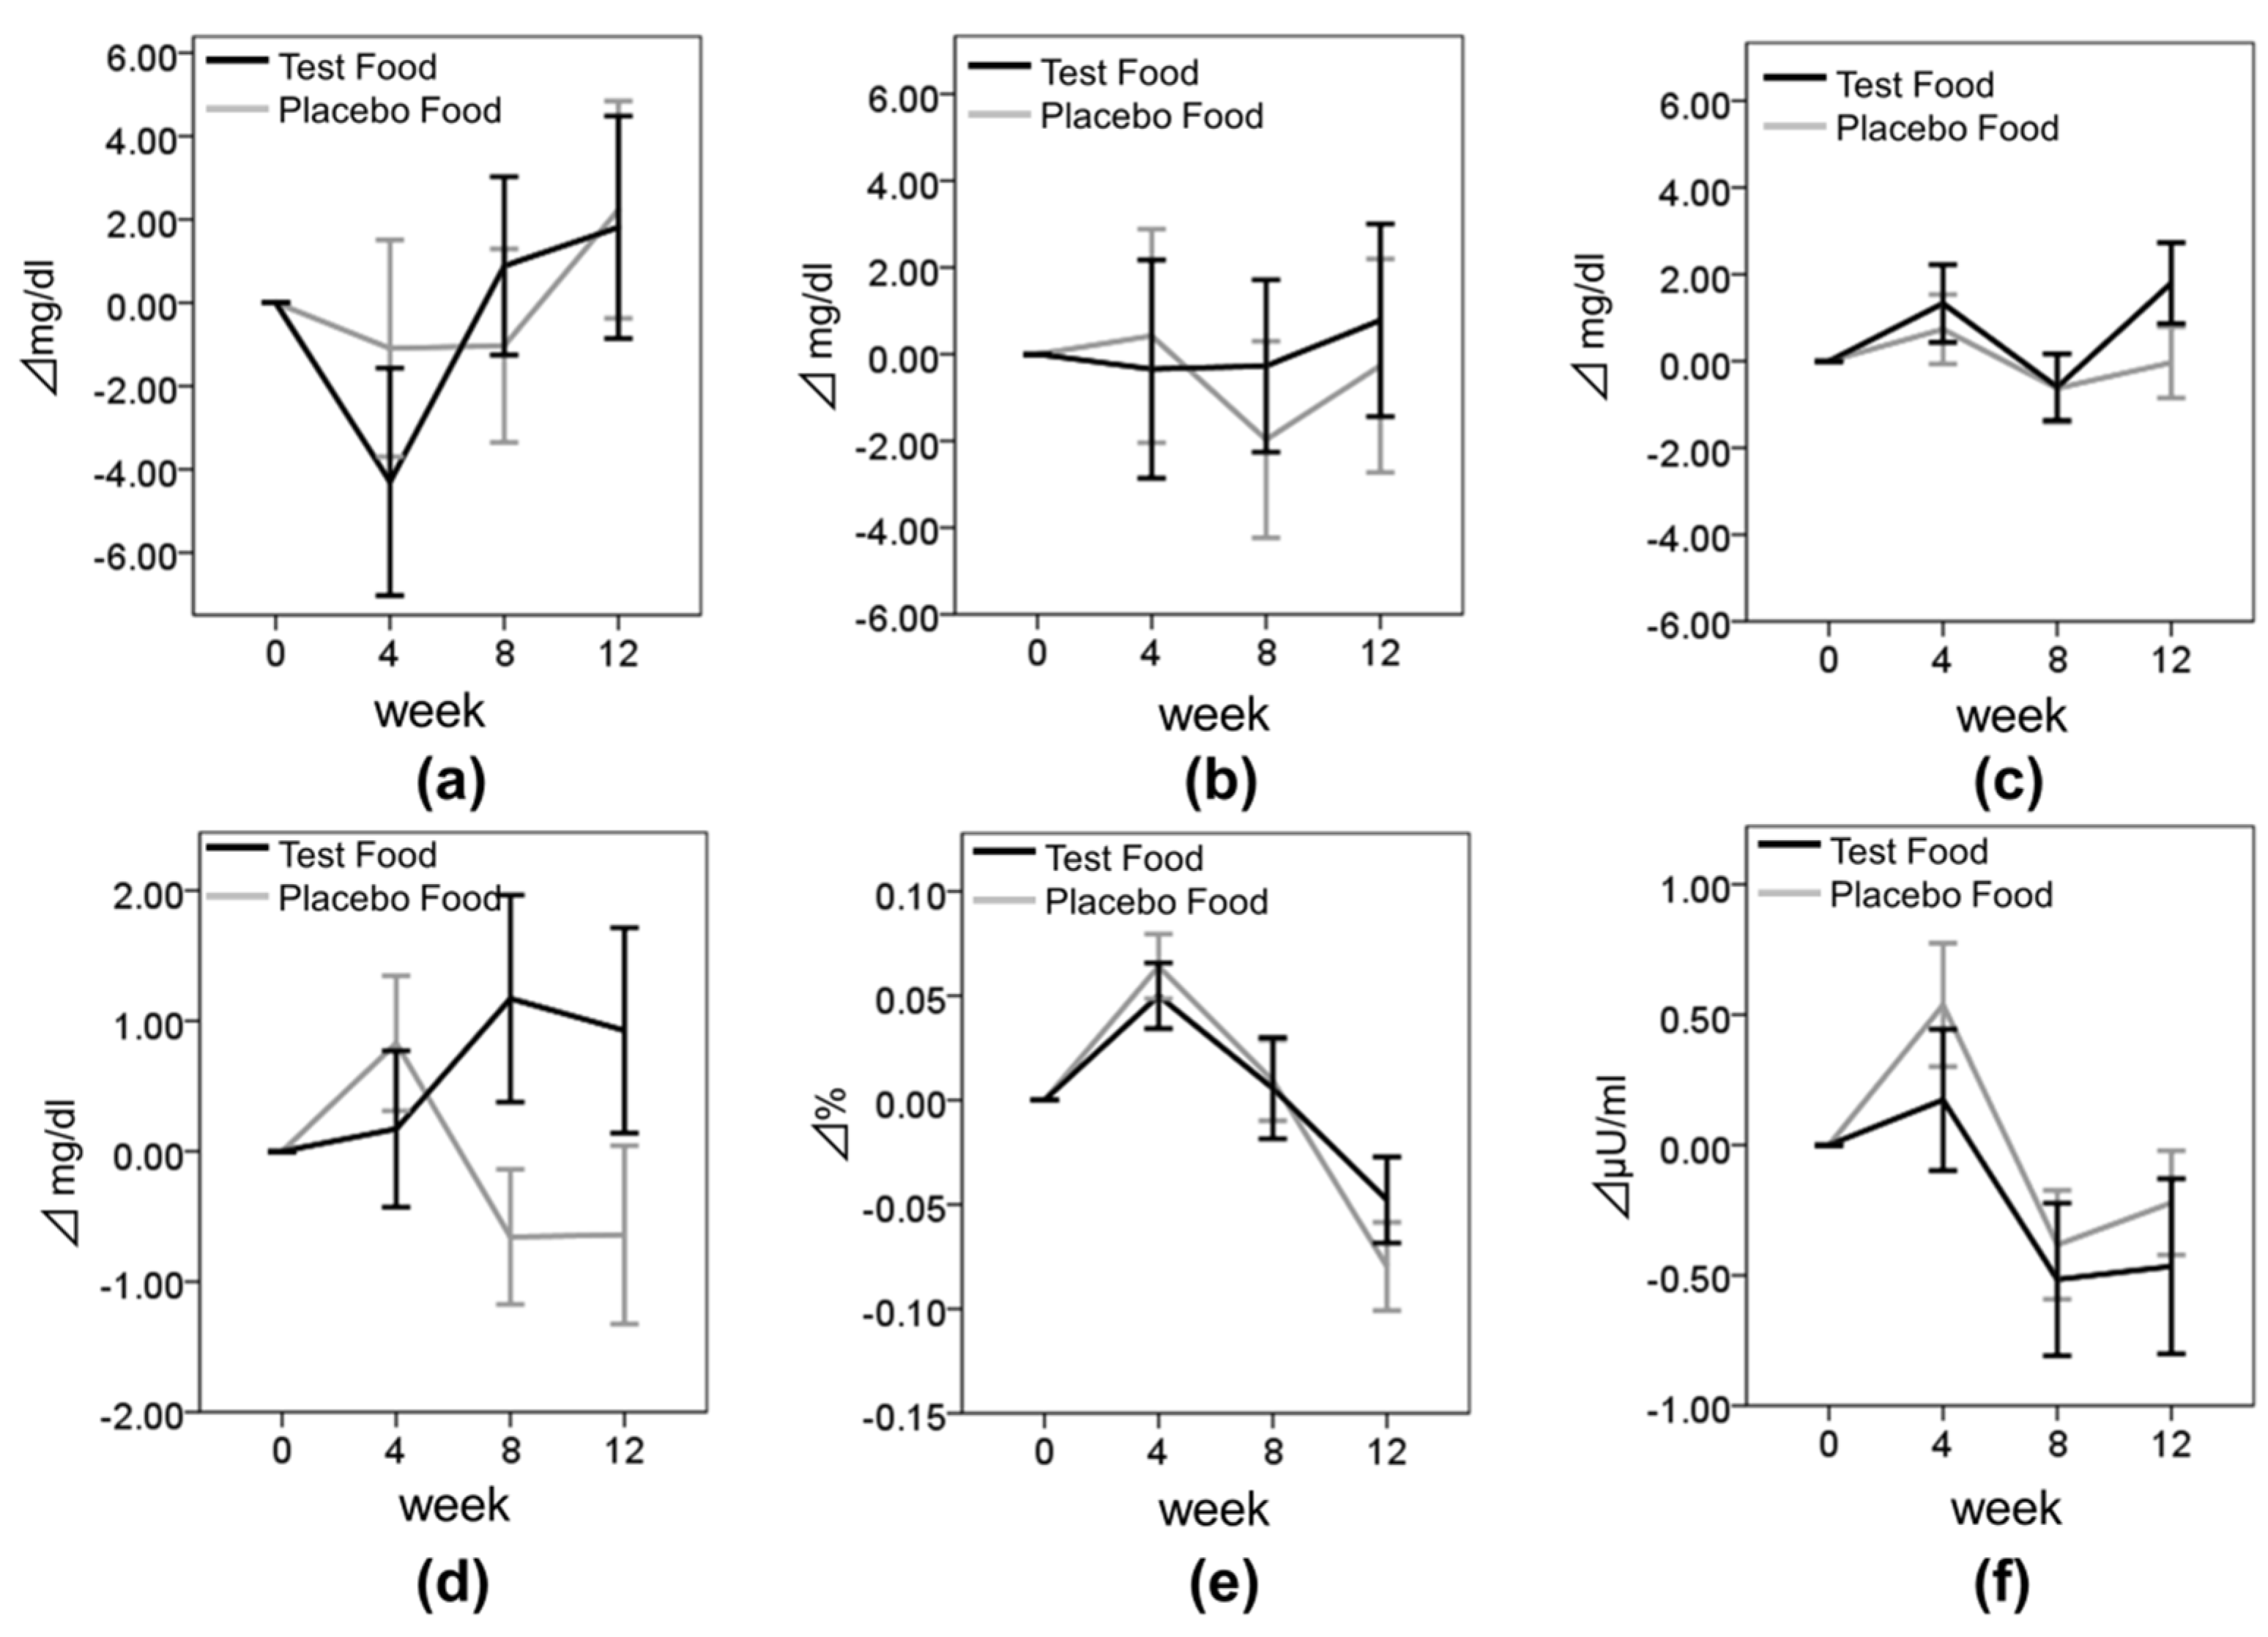
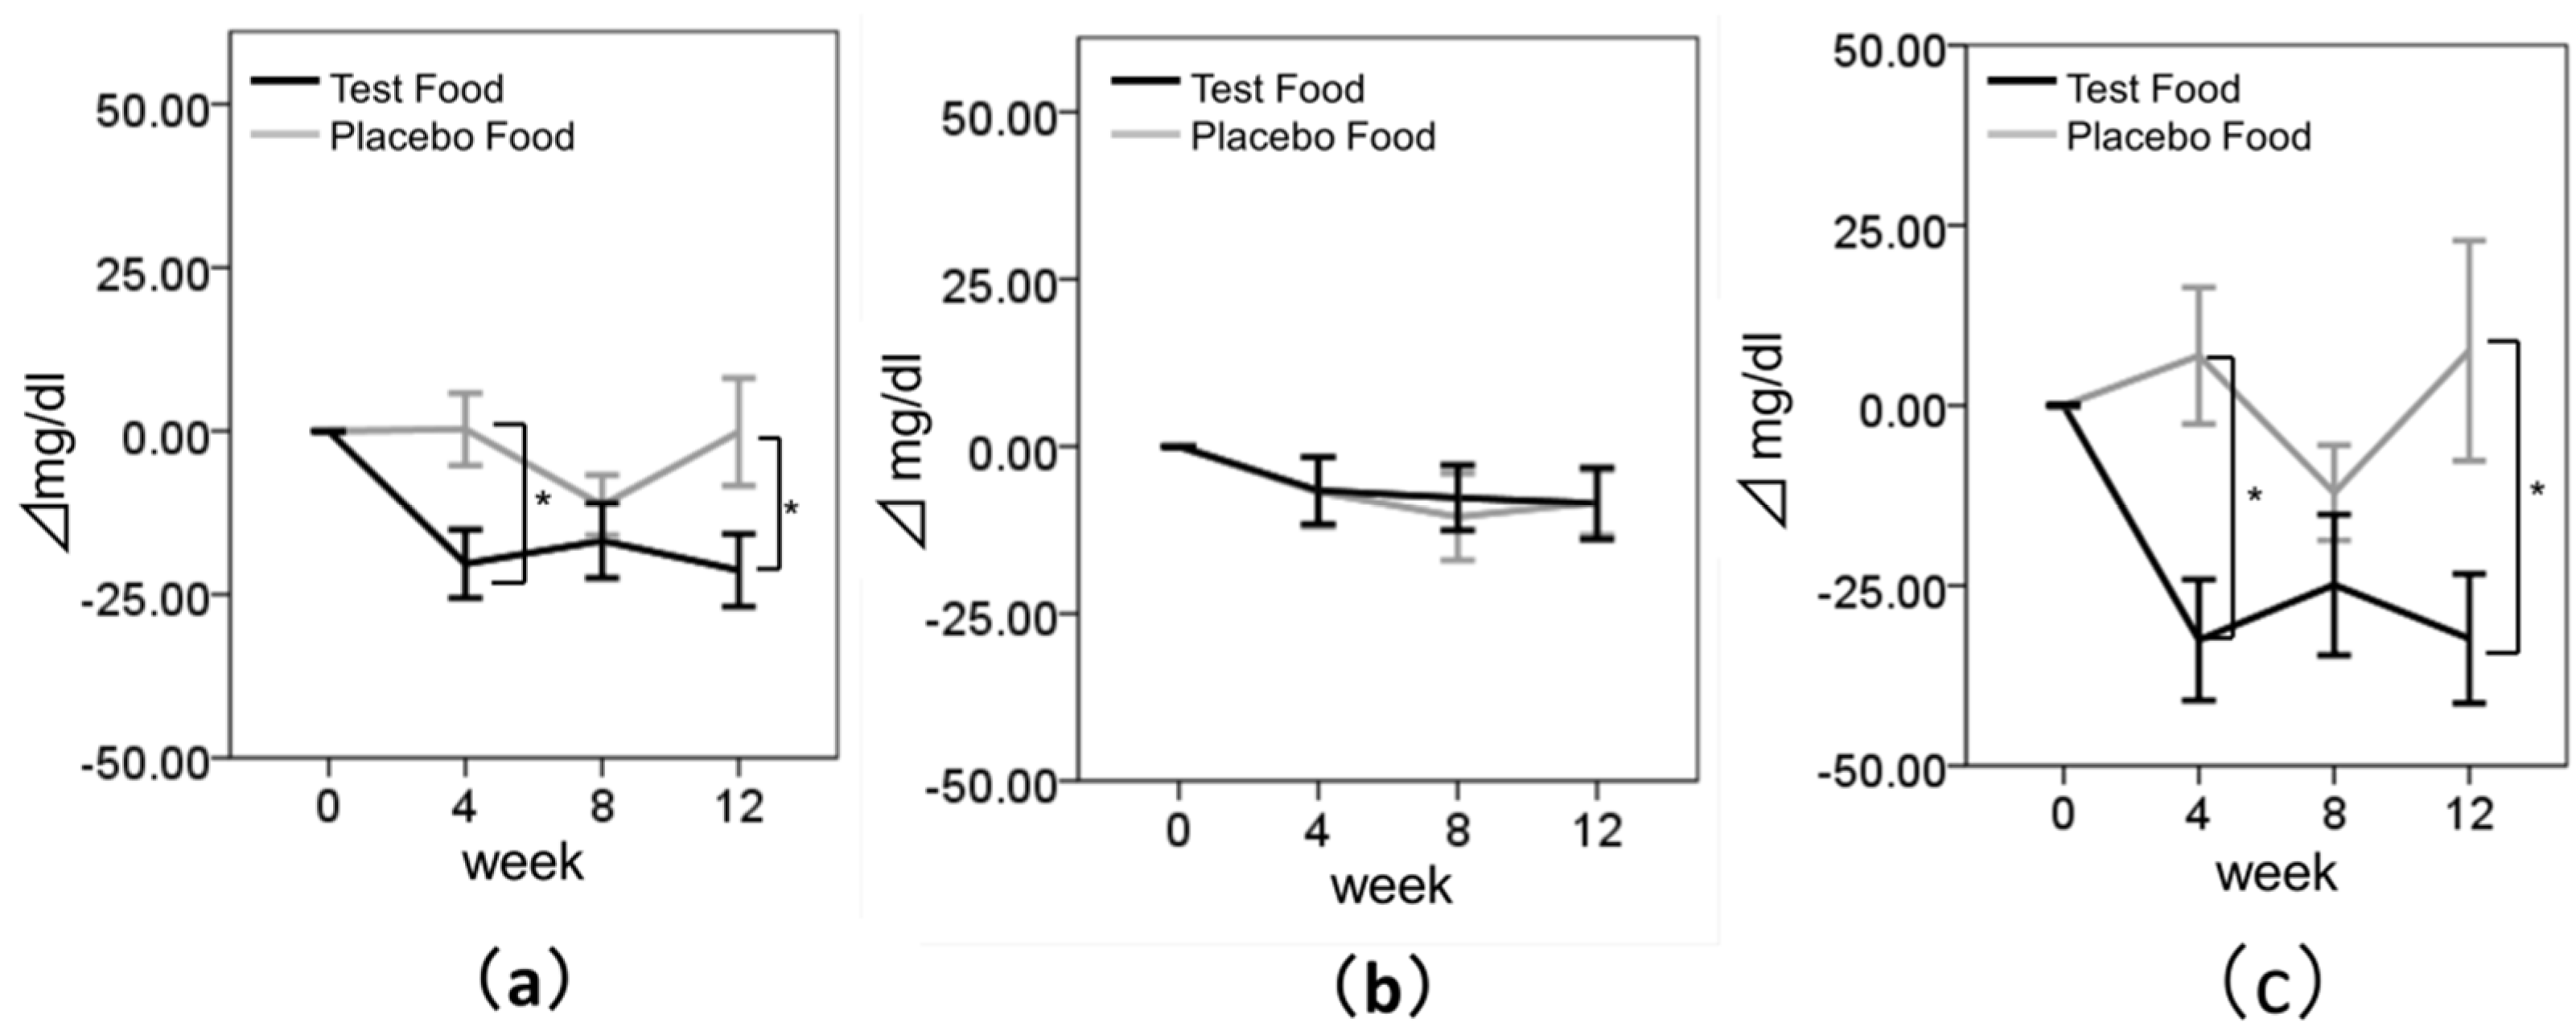
3.2. Effect of Enriched-β-conglycinin Soybean on TG
3.3. Effect of Enriched-β-Conglycinin Soybean on the Other Lipid Metabolism and Blood Glucose Metabolism Parameters
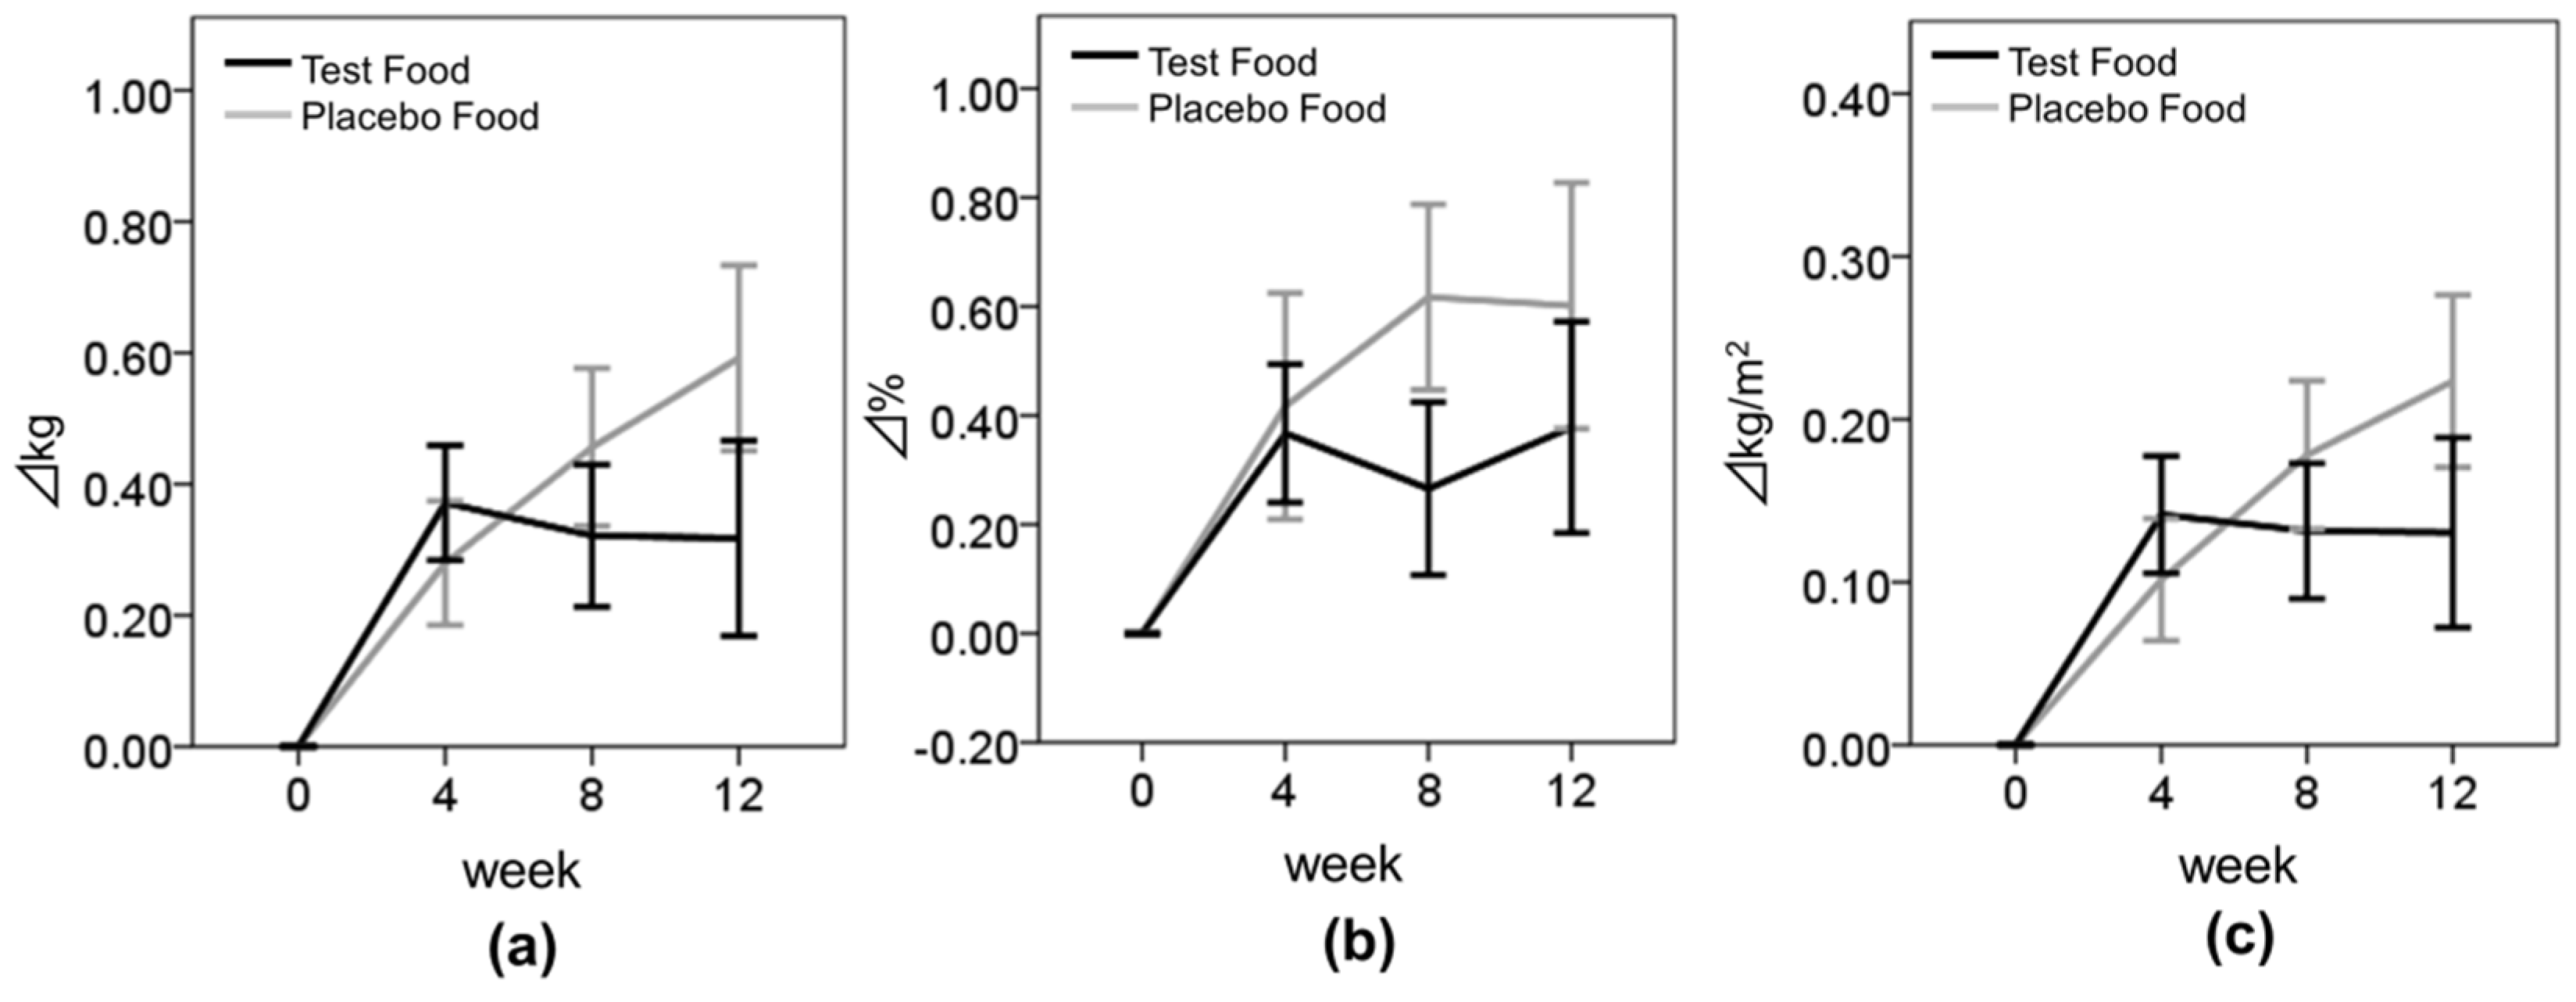
3.4. Effect of Enriched-β-Conglycinin Soybean on Body Composition
3.5. Levels of Biomarkers of CBC, Liver and Renal Function, BP, and Adverse Events
4. Discussion
Supplementary Materials
Acknowledgments
Author Contributions
Conflicts of Interest
Abbreviations
| ALP | alkaline phosphatase |
| ALT | alanine aminotransferase |
| AST | aspartate aminotransferase |
| BFR | body fat ratio |
| BMI | body mass index |
| BP | blood pressure |
| BUN | blood urea nitrogen |
| BW | body weight |
| CBC | complete blood count |
| CHD | coronary heart disease |
| CRE | creatinine |
| CVD | cardiovascular disease |
| FPG | fasting plasma glucose |
| γ-GTP | gamma glutamyl transpeptidase |
| HbA1c | hemoglobin A1c |
| Hb | hemoglobin |
| HDL-C | high density lipoprotein cholesterol |
| Ht | hematocrit |
| LDH | lactate dehydrogenase |
| LDL-C | low-density lipoprotein cholesterol |
| Plt | platelet count |
| RBC | red blood cells |
| TC | total cholesterol |
| TG | triglyceride |
| UA | uric acid |
| WBC | white blood cells |
References
- Tanaka, T.; Okamura, T. Blood cholesterol level and risk of stroke in community-based or worksite cohort studies: A review of Japanese cohort studies in the past 20 years. Keio J. Med. 2012, 61, 79–88. [Google Scholar] [CrossRef] [PubMed]
- Teramoto, T.; Sasaki, J.; Ishibashi, S.; Birou, S.; Daida, H.; Dohi, S.; Egusa, G.; Hiro, T.; Hirobe, K.; Iida, M.; et al. Diagnosis of atherosclerosis. Executive Summary of the Japan Atherosclerosis Society (JAS) Guidelines for the Diagnosis and Prevention of Atherosclerotic Cardiovascular Diseases in Japan—2012 Version. J. Atheroscler. Thromb. 2014, 21, 296–298. [Google Scholar] [CrossRef] [PubMed]
- Messina, M. Insights gained from 20 years of soy research. J. Nutr. 2010, 140, 2289S–2295S. [Google Scholar] [CrossRef] [PubMed]
- Choi, M.S.; Ryu, R.; Seo, Y.R.; Jeong, T.S.; Shin, D.H.; Park, Y.B.; Kim, S.R.; Jung, U.J. The beneficial effect of soybean (Glycine max (L.) Merr.) leaf extracts in adults with prediabetes: A randomized placebo controlled trial. Food Funct. 2014, 5, 1621–1630. [Google Scholar] [CrossRef] [PubMed]
- Cederroth, C.R.; Nef, S. Soy, phytoestrogens and metabolism: A review. Mol. Cell. Endocrinol. 2009, 304, 30–42. [Google Scholar] [CrossRef] [PubMed]
- Yamori, Y. Worldwide epidemic of obesity: Hope for Japanese diets. Clin. Exp. Pharmacol. Physiol. 2004, 31, S2–S4. [Google Scholar] [CrossRef] [PubMed]
- Dang, Z.C.; Lowik, C. Dose-dependent effects of phytoestrogens on bone. Trends Endocrinol. Metab. 2005, 16, 207–213. [Google Scholar] [CrossRef] [PubMed]
- Velasquez, M.T.; Bhathena, S.J. Role of dietary soy protein in obesity. Int. J. Med. Sci. 2007, 4, 72–82. [Google Scholar] [CrossRef] [PubMed]
- Anderson, J.W.; Johnstone, B.M.; Cook-Newell, M.E. Meta-analysis of the effects of soy protein intake on serum lipids. N. Engl. J. Med. 1995, 333, 276–282. [Google Scholar] [CrossRef] [PubMed]
- Dotzel, M.M.; Food and Drug Administration. Food labeling: Health claims; soy protein and coronary heart disease. Fed. Regist. 1999, 64, 57700–57733. [Google Scholar]
- Gianazza, E.; Eberini, I.; Arnoldi, A.; Wait, R.; Sirtori, C.R. A proteomic investigation of isolated soy proteins with variable effects in experimental and clinical studies. J. Nutr. 2003, 133, 9–14. [Google Scholar] [PubMed]
- Tachibana, N.; Iwaoka, Y.; Hirotsuka, M.; Horio, F.; Kohno, M. β-conglycinin lowers very-low-density lipoprotein-triglyceride levels by increasing adiponectin and insulin sensitivity in rats. Biosci. Biotechnol. Biochem. 2010, 74, 1250–1255. [Google Scholar] [CrossRef] [PubMed]
- Ferreira, E.S.; Silva, M.A.; Demonte, A.; Neves, V.A. β-conglycinin combined with fenofibrate or rosuvastatin have exerted distinct hypocholesterolemic effects in rats. Lipids Health Dis. 2012, 11, 11. [Google Scholar] [CrossRef] [PubMed]
- Aoyama, T.; Kohno, M.; Saito, T.; Fukui, K.; Takamatsu, K.; Yamamoto, T.; Hashimoto, Y.; Hirotsuka, M.; Kito, M. Reduction by phytate-reduced soybean beta-conglycinin of plasma triglyceride level of young and adult rats. Biosci. Biotechnol. Biochem. 2001, 65, 1071–1075. [Google Scholar] [CrossRef] [PubMed]
- Baba, T.; Ueda, A.; Kohno, M.; Fukui, K.; Miyazaki, C.; Hirotsuka, M.; Ishinaga, M. Effects of soybean beta-conglycinin on body fat ratio and serum lipid levels in healthy volunteers of female university students. J. Nutr. Sci. Vitaminol. (Tokyo) 2004, 50, 26–31. [Google Scholar] [CrossRef] [PubMed]
- Kohno, M.; Takeda, R.; Hori, Y.; Shimizu, R.; Watanabe, Y. Effects of Soybean β-Conglycinin on lmprovements of Glucose and Lipid Metabolism: Clinical Trial. Pharmacometrics 2012, 82, 59–65. (In Japanese) [Google Scholar]
- Ogawa, T.; Tayama, E.; Kitamura, K.; Kaizuma, N. Genetic improvement of seed storage proteins using three variant alleles of 7S globulin subunits in soybean (Glycine max L.). Jpn. Soc. Breed. 1989, 39, 137–147. [Google Scholar] [CrossRef]
- Kohno, M.; Hirotsuka, M.; Kito, M.; Matsuzawa, Y. Decreases in serum triacylglycerol and visceral fat mediated by dietary soybean β-conglycinin. J. Atheroscler. Thromb. 2006, 13, 247–255. [Google Scholar] [CrossRef] [PubMed]
- Hara, Y.; Moriguchi, S.; Kusumoto, A.; Nakai, M.; Ono, Y.; Abe, K.; Ohta, H.; Shibata, H.; Egawa, K. Suppressive effect of Oolong tea polymerized polyphenols-enriched oolong tea on Postprandial serum triglyceride elevation. Jpn. Pharmacol. Ther. 2004, 32, 335–342. (In Japanese) [Google Scholar]
- Duranti, M.; Lovati, M.R.; Dani, V.; Barbiroli, A.; Scarafoni, A.; Castiglioni, S.; Ponzone, C.; Morazzoni, P. The α′ subunit from soybean 7S globulin lowers plasma lipids and upregulates liver β-VLDL receptors in rats fed a hypercholesterolemic diet. J. Nutr. 2004, 134, 1334–1339. [Google Scholar] [PubMed]
- Fukui, K.; Kojima, M.; Tachibana, N.; Kohno, M.; Takamatsu, K.; Hirotsuka, M.; Kito, M. Effects of soybean β-conglycinin on hepatic lipid metabolism and fecal lipid excretion in normal adult rats. Biosci. Biotechnol. Biochem. 2004, 68, 1153–1155. [Google Scholar] [CrossRef] [PubMed]
- Moriyama, T.; Kishimoto, K.; Nagai, K.; Urade, R.; Ogawa, T.; Utsumi, S.; Maruyama, N.; Maebuchi, M. Soybean β-conglycinin diet suppresses serum triglyceride levels in normal and genetically obese mice by induction of β-oxidation, downregulation of fatty acid synthase, and inhibition of triglyceride absorption. Biosci. Biotechnol. Biochem. 2004, 68, 352–359. [Google Scholar] [CrossRef] [PubMed]
- Leblanc, V.; Bégin, C.; Hudon, A.M.; Royer, M.M.; Corneau, L.; Dodin, S.; Lemieux, S. Gender differences in the long-term effects of a nutritional intervention program promoting the Mediterranean diet: Changes in dietary intakes, eating behaviors, anthropometric and metabolic variables. Nutr. J. 2014, 13, 107. [Google Scholar] [CrossRef] [PubMed]
- Murase, T.; Nagasawa, A.; Suzuki, J.; Hase, T.; Tokimitsu, I. Beneficial effects of tea catechins on diet-induced obesity: Stimulation of lipid catabolism in the liver. Int. J. Obes. Relat. Metab. Disord. 2002, 26, 1459–64. [Google Scholar] [CrossRef] [PubMed]
- Dulloo, A.G.; Duret, C.; Rohrer, D.; Girardier, L.; Mensi, N.; Fathi, M.; Chantre, P.; Vandermander, J. Efficacy of a green tea extract rich in catechin polyphenols and caffeine in increasing 24-h energy expenditure and fat oxidation in humans. Am. J. Clin. Nutr. 1999, 70, 1040–1045. [Google Scholar] [PubMed]


| Enriched-β-conglycinin Soybean Containing Food (Test Meal) | Low-β-conglycinin Soybean Containing Food (Placebo Meal) | |||||
|---|---|---|---|---|---|---|
| Flakes (21 g) | Soy Milk (200 mL) | Steamed Soybeans (42 g) | Flakes (21 g) | Soy Milk (200 mL) | Steamed Soybeans (42 g) | |
| Calories (kcal) | 89.5 | 110 | 74 | 89.5 | 112 | 74 |
| Water (g) | 1.7 | 176.8 | 24.6 | 1.7 | 176.6 | 24.6 |
| Proteins (g) | 7.5 | 8.8 | 6.7 | 7.5 | 9.6 | 6.7 |
| Lipids (g) | 4.6 | 6.0 | 3.9 | 4.6 | 6.0 | 3.9 |
| Carbohydrates (g) | 6.2 | 7.0 | 2.2 | 6.2 | 6.8 | 2.2 |
| Ash (g) | 1.0 | 1.4 | 1 | 1.0 | 1.2 | 1 |
| Sodium (mg) | 1.0 | 1.6 | 105 | 1.0 | 2.2 | 105 |
| β-conglycinin (g) | 3.44 | 4.04 | 0.66 | 0.11 | 0.62 | 0.12 |
| Characteristic | Test Group | Placebo Group | p |
|---|---|---|---|
| Subjects, n | 70 | 64 | – |
| Males, n (%) | 21 (30.00%) | 20 (31.25%) | 0.875 |
| Age, years | 52.84 ± 10.18 | 52.17 ± 10.45 | 0.707 |
| Height, cm | 160.17 ± 8.37 | 160.59 ± 7.56 | 0.763 |
| Body weight, kg | 57.43 ± 12.11 | 59.53 ± 11.96 | 0.316 |
| Body mass index, kg/m2 | 22.28 ± 3.90 | 22.98 ± 3.67 | 0.288 |
| Body fat ratio, % | 28.07 ± 7.62 | 29.38 ± 7.21 | 0.307 |
| Triglyceride, mg/dL | 112.81 ± 43.09 | 113.72 ± 47.42 | 0.908 |
| Value | Change in Value | Time × Group, p | |||||||
|---|---|---|---|---|---|---|---|---|---|
| Week 0 | Week 4 | Week 8 | Week 12 | From Baseline to Week 4 | From Baseline to Week 8 | From Baseline to Week 12 | |||
| TG in all subjects (mg/dL) | Test | 129.04 ± 67.37 | 108.73 ± 42.97 | 112.27 ± 51.86 | 107.49 ± 53.34 | −20.31 ± 43.74 | −16.77 ± 47.75 | −21.30 ± 46.21 | 0.063 |
| Placebo | 120.72 ± 47.88 | 120.98 ± 59.60 | 109.38 ± 48.58 | 120.58 ± 70.58 | 0.27 ± 44.13 | −11.34 ± 36.81 | −0.14 ± 65.83 | ||
| p | 0.035* | 0.466 | 0.041* | ||||||
| TG in lower-TG subjects (TG < 100 mg/dL at baseline) (mg/dL) | Test | 86.12 ± 27.48 | 79.52 ± 20.88 | 78.45 ± 23.43 | 75.72 ± 23.23 | −6.61 ± 28.79 | −7.67 ± 28.00 | −8.53 ± 30.27 | 0.667 |
| Placebo | 91.87 ± 34.49 | 85.06 ± 22.71 | 81.35 ± 27.46 | 83.48 ± 23.40 | −6.81 ± 28.79 | −10.52 ± 36.15 | −8.39 ± 27.11 | ||
| p | 0.721 | 0.893 | 0.587 | ||||||
| TG in higher-TG subjects (TG ≥ 100 mg/dL at baseline) (mg/dL) | Test | 167.32 ± 69.51 | 134.78 ± 40.88 | 142.43 ± 51.80 | 134.97 ± 56.88 | −32.54 ± 51.03 | −24.89 ± 59.40 | −32.35 ± 54.53 | 0.075 |
| Placebo | 147.82 ± 42.82 | 154.73 ± 63.91 | 135.70 ± 49.64 | 155.42 ± 81.91 | 6.91 ± 54.44 | −12.12 ± 37.97 | 7.61 ± 87.83 | ||
| p | 0.010* | 0.757 | 0.030* | ||||||
| TC (mg/dL) | Test | 219.77 ± 37.49 | 215.47 ± 36.63 | 220.66 ± 35.16 | 222.04 ± 36.45 | −4.30 ± 22.86 | 0.89 ± 17.89 | 1.81 ± 22.19 | 0.409 |
| Placebo | 228.00 ± 36.71 | 226.91 ± 37.31 | 226.97 ± 36.55 | 230.23 ± 35.64 | −1.09 ± 20.82 | −1.03 ± 18.60 | 2.23 ± 20.87 | ||
| p | 0.399 | 0.544 | 0.910 | ||||||
| LDL-C (mg/dL) | Test | 138.66 ± 33.26 | 138.31 ± 36.56 | 138.39 ± 33.06 | 139.94 ± 32.29 | −0.34 ± 21.07 | −0.27 ± 16.62 | 0.78 ± 18.45 | 0.746 |
| Placebo | 146.09 ± 37.51 | 146.52 ± 38.28 | 144.13 ± 35.29 | 145.83 ± 34.83 | 0.42 ± 19.70 | −1.97 ± 18.13 | −0.27 ± 19.70 | ||
| p | 0.829 | 0.573 | 0.752 | ||||||
| HDL-C (mg/dL) | Test | 66.86 ± 16.41 | 68.19 ± 17.36 | 66.26 ± 18.12 | 68.67 ± 18.73 | 1.33 ± 7.49 | −0.60 ± 6.43 | 1.80 ± 7.75 | 0.276 |
| Placebo | 68.45 ± 17.21 | 69.19 ± 17.21 | 67.83 ± 17.81 | 68.42 ± 17.78 | 0.73 ± 6.39 | −0.63 ± 6.36 | −0.03 ± 6.56 | ||
| p | 0.624 | 0.982 | 0.146 | ||||||
| FPG (mg/dL) | Test | 88.67 ± 16.41 | 88.84 ± 17.36 | 89.84 ± 18.12 | 89.67 ± 18.73 | 0.17 ± 5.02 | 1.17 ± 6.64 | 0.93 ± 6.54 | 0.013 * |
| Placebo | 88.69 ± 17.21 | 89.52 ± 17.21 | 88.03 ± 17.81 | 88.05 ± 17.78 | 0.83 ± 4.14 | −0.66 ± 4.15 | −0.64 ± 5.48 | ||
| p | 0.413 | 0.061 | 0.138 | ||||||
| HbA1c (%) | Test | 5.34 ± 0.43 | 5.39 ± 0.41 | 5.35 ± 0.42 | 5.30 ± 0.40 | 0.05 ± 0.13 | 0.01 ± 0.20 | −0.05 ± 0.17 | 0.104 |
| Placebo | 5.36 ± 0.40 | 5.42 ± 0.39 | 5.37 ± 0.37 | 5.28 ± 0.40 | 0.06 ± 0.12 | 0.01 ± 0.15 | −0.08 ± 0.17 | ||
| p | 0.526 | 0.907 | 0.283 | ||||||
| Insulin (μU/mL) | Test | 4.23 ± 4.09 | 4.40 ± 4.32 | 3.71 ± 2.76 | 3.78 ± 2.93 | 0.17 ± 2.27 | −0.52 ± 2.45 | −0.47 ± 2.79 | 0.155 |
| Placebo | 4.08 ± 2.18 | 4.61 ± 2.83 | 3.69 ± 2.51 | 3.85 ± 2.08 | 0.54 ± 1.90 | −0.38 ± 1.67 | −0.22 ± 1.60 | ||
| p | 0.317 | 0.717 | 0.542 | ||||||
| BW (kg) | Test | 57.43 ± 12.00 | 57.80 ± 12.03 | 57.75 ± 12.06 | 57.81 ± 12.00 | 0.37 ± 0.73 | 0.32 ± 0.91 | 0.32 ± 1.24 | 0.037 * |
| Placebo | 59.52 ± 12.10 | 59.80 ± 12.15 | 59.98 ± 12.23 | 60.12 ± 12.53 | 0.28 ± 0.76 | 0.46 ± 0.96 | 0.59 ± 1.13 | ||
| p | 0.477 | 0.405 | 0.184 | ||||||
| BFR (%) | Test | 28.27 ± 7.62 | 28.63 ± 7.66 | 28.53 ± 7.72 | 28.59 ± 7.82 | 0.37 ± 1.06 | 0.27 ± 1.33 | 0.38 ± 1.61 | 0.443 |
| Placebo | 29.59 ± 7.34 | 30.01 ± 7.14 | 30.21 ± 7.18 | 30.19 ± 7.57 | 0.42 ± 1.66 | 0.62 ± 1.36 | 0.60 ± 1.81 | ||
| p | 0.834 | 0.133 | 0.453 | ||||||
| BMI (kg/m2) | Test | 22.29 ± 3.86 | 22.43 ± 3.85 | 22.42 ± 3.89 | 22.44 ± 3.89 | 0.14 ± 0.30 | 0.13 ± 0.35 | 0.13 ± 0.48 | 0.054 |
| Placebo | 22.99 ± 3.75 | 23.09 ± 3.73 | 23.17 ± 3.77 | 23.22 ± 3.89 | 0.10 ± 0.30 | 0.18 ± 0.36 | 0.22 ± 0.42 | ||
| p | 0.444 | 0.449 | 0.242 | ||||||
| Improved Subjects n (%) | Unimproved Subjects n (%) | p | ||
|---|---|---|---|---|
| TG in all subjects | Test | 47 (67%) | 23 (33%) | 0.265 |
| Placebo | 37 (58%) | 27 (42%) | ||
| TG in lower-TG subjects (TG < 100 mg/dL at baseline) | Test | 19 (58%) | 14 (42%) | 0.762 |
| Placebo | 19 (61%) | 12 (39%) | ||
| TG in higher-TG subjects (TG ≥ 100 mg/dL at baseline) | Test | 28 (76%) | 9 (24%) | 0.063 |
| Placebo | 18 (55%) | 15 (45%) | ||
| TC | Test | 32 (46%) | 38 (54%) | 0.336 |
| Placebo | 24 (38%) | 40 (63%) | ||
| LDL-C | Test | 33 (47%) | 37 (53%) | 0.975 |
| Placebo | 30 (47%) | 34 (53%) | ||
| HDL-C | Test | 41 (59%) | 29 (41%) | 0.086 |
| Placebo | 28 (44%) | 36 (56%) | ||
| FPG | Test | 28 (40%) | 42 (60%) | 0.245 |
| Placebo | 32 (50%) | 32 (50%) | ||
| HbA1c | Test | 32 (46%) | 38 (54%) | 0.021 * |
| Placebo | 42 (66%) | 22 (34%) | ||
| Insulin | Test | 40 (57%) | 30 (43%) | 0.235 |
| Placebo | 30 (47%) | 34 (53%) | ||
| BW | Test | 22 (31%) | 48 (69%) | 0.982 |
| Placebo | 20 (31%) | 44 (69%) | ||
| BFR | Test | 24 (34%) | 46 (66%) | 0.241 |
| Placebo | 16 (25%) | 48 (75%) | ||
| BMI | Test | 20 (29%) | 50 (71%) | 0.795 |
| Placebo | 17 (27%) | 47 (73%) |
| Week 0 | Week 4 | Week 8 | Week 12 | ||
|---|---|---|---|---|---|
| WBC (103/μL) | Test | 5.70 ± 1.35 | 5.78 ± 1.56 | 5.68 ± 1.42 | 5.73 ± 1.45 |
| Placebo | 5.71 ± 1.38 | 5.81 ± 1.63 | 5.75 ± 1.37 | 5.73 ± 1.58 | |
| RBC (104/μL) | Test | 462.07 ± 45.34 | 461.37 ± 39.93 | 463.09 ± 42.31 | 470.78 ± 46.36 |
| Placebo | 466.52 ± 41.84 | 462.52 ± 41.26 | 463.56 ± 40.05 | 469.14 ± 40.70 | |
| Hb (g/dL) | Test | 13.94 ± 1.69 | 13.97 ± 1.66 | 13.96 ± 1.72 | 14.22 ± 1.89 |
| Placebo | 14.20 ± 1.62 | 14.06 ± 1.59 | 14.02 ± 1.57 | 14.23 ± 1.60 | |
| Ht (%) | Test | 42.60 ± 4.40 | 42.55 ± 4.20 | 42.64 ± 4.34 | 43.62 ± 4.99 |
| Placebo | 42.98 ± 4.14 | 42.55 ± 4.07 | 42.68 ± 4.02 | 43.43 ± 4.03 | |
| Plt (104/μL) | Test | 25.19 ± 6.77 | 25.94 ± 6.33 | 25.67 ± 7.12 | 25.72 ± 7.01 |
| Placebo | 25.26 ± 5.23 | 25.43 ± 5.87 | 25.46 ± 5.51 | 25.65 ± 5.81 | |
| AST (U/L) | Test | 24.21 ± 9.33 | 23.51 ± 7.99 | 23.23 ± 7.46 | 23.09 ± 6.15 |
| Placebo | 23.36 ± 8.64 | 23.61 ± 8.27 | 24.23 ± 7.61 | 23.86 ± 7.70 | |
| ALT (U/L) | Test | 24.07 ± 15.33 | 23.97 ± 14.76 | 22.41 ± 12.97 | 21.20 ± 11.40 |
| Placebo | 22.63 ± 14.38 | 25.48 ± 17.26 | 24.52 ± 18.06 | 22.94 ± 16.08 | |
| γ-GTP (U/L) | Test | 30.99 ± 22.99 | 32.4 ± 29.89 | 28.09 ± 18.48 | 27.65 ± 17.29 |
| Placebo | 32.06 ± 31.68 | 40.02 ± 73.19 | 34.19 ± 44.79 | 30.84 ± 27.97 | |
| ALP (U/L) | Test | 215.97 ± 63.40 | 216.16 ± 70.10 | 209.94 ± 59.94 | 215.72 ± 64.00 |
| Placebo | 214.16 ± 74.31 | 219.36 ± 79.55 | 219.5 ± 93.23 | 218.77 ± 82.34 | |
| LDH (U/L) | Test | 203.47 ± 35.03 | 206.91 ± 33.63 | 207.76 ± 32.24 | 211.68 ± 34.94 |
| Placebo | 202.72 ± 25.98 | 202.97 ± 25.08 | 208.16 ± 25.15 | 208.92 ± 26.68 | |
| BUN (mg/dL) | Test | 12.73 ± 3.14 | 14.05 ± 3.53 | 13.94 ± 3.63 | 14.10 ± 3.45 |
| Placebo | 12.95 ± 3.28 | 13.70 ± 3.10 | 13.91 ± 3.30 | 13.68 ± 3.62 | |
| CRE (mg/dL) | Test | 0.73 ± 0.14 | 0.74 ± 0.14 | 0.74 ± 0.14 | 0.74 ± 0.15 |
| Placebo | 0.74 ± 0.14 | 0.74 ± 0.13 | 0.74 ± 0.13 | 0.73 ± 0.14 | |
| UA (mg/dL) | Test | 5.14 ± 1.5 | 5.20 ± 1.41 | 5.08 ± 1.36 | 5.06 ± 1.32 |
| Placebo | 5.20 ± 1.29 | 5.25 ± 1.34 | 5.18 ± 1.21 | 5.26 ± 1.24 | |
| SBP (mmHg) | Test | 118.23 ± 19.67 | 118.2 ± 18.99 | 117.67 ± 18.86 | 121.51 ± 19.17 |
| Placebo | 118.11 ± 13.97 | 116.89 ± 14.51 | 116.34 ± 15.46 | 123.3 ± 16.94 | |
| DBP (mmHg) | Test | 74.45 ± 12.38 | 73.94 ± 11.28 | 74.44 ± 10.03 | 77.33 ± 11.86 |
| Placebo | 74.23 ± 10.19 | 74.48 ± 10.17 | 74.08 ± 10.51 | 78.67 ± 9.93 | |
© 2016 by the authors; licensee MDPI, Basel, Switzerland. This article is an open access article distributed under the terms and conditions of the Creative Commons Attribution (CC-BY) license (http://creativecommons.org/licenses/by/4.0/).
Share and Cite
Nishimura, M.; Ohkawara, T.; Sato, Y.; Satoh, H.; Takahashi, Y.; Hajika, M.; Nishihira, J. Improvement of Triglyceride Levels through the Intake of Enriched-β-Conglycinin Soybean (Nanahomare) Revealed in a Randomized, Double-Blind, Placebo-Controlled Study. Nutrients 2016, 8, 491. https://doi.org/10.3390/nu8080491
Nishimura M, Ohkawara T, Sato Y, Satoh H, Takahashi Y, Hajika M, Nishihira J. Improvement of Triglyceride Levels through the Intake of Enriched-β-Conglycinin Soybean (Nanahomare) Revealed in a Randomized, Double-Blind, Placebo-Controlled Study. Nutrients. 2016; 8(8):491. https://doi.org/10.3390/nu8080491
Chicago/Turabian StyleNishimura, Mie, Tatsuya Ohkawara, Yuji Sato, Hiroki Satoh, Yoko Takahashi, Makita Hajika, and Jun Nishihira. 2016. "Improvement of Triglyceride Levels through the Intake of Enriched-β-Conglycinin Soybean (Nanahomare) Revealed in a Randomized, Double-Blind, Placebo-Controlled Study" Nutrients 8, no. 8: 491. https://doi.org/10.3390/nu8080491
APA StyleNishimura, M., Ohkawara, T., Sato, Y., Satoh, H., Takahashi, Y., Hajika, M., & Nishihira, J. (2016). Improvement of Triglyceride Levels through the Intake of Enriched-β-Conglycinin Soybean (Nanahomare) Revealed in a Randomized, Double-Blind, Placebo-Controlled Study. Nutrients, 8(8), 491. https://doi.org/10.3390/nu8080491