Abstract
A link between obesity and cerebral health is receiving growing recognition. Here, we investigate in the frontal cortex and hippocampus the potential involvement of cholinergic markers in brain alterations previously reported in rats with obesity induced by diet (DIO) after long-term exposure (17 weeks) to a high-fat diet (HFD) in comparison with animals fed with a standard diet (CHOW). The obesity developed after 5 weeks of HFD. Bodyweight, systolic blood pressure, glycemia, and insulin levels were increased in DIO rats compared to the CHOW group. Measurements of malondialdehyde (MDA) provided lipid peroxidation in HFD-fed rats. Western blot and immunohistochemical techniques were performed. Our results showed a higher expression of choline acetyltransferase (ChAT) and vesicular acetylcholine transporter (VAChT) in obese rats but not the VAChT expression in the frontal cortex after 17 weeks of HFD. Furthermore, the acetylcholinesterase (AChE) enzyme was downregulated in HFD both in the frontal cortex and hippocampus. In the brain regions analyzed, it was reported a modulation of certain cholinergic receptors expressed pre- and post-synaptically (alpha7 nicotinic receptor and muscarinic receptor subtype 1). Collectively, these findings point out precise changes of cholinergic markers that can be targeted to prevent cerebral injuries related to obesity.
1. Introduction
The prevalence of obesity has reached a global proportion. The most important cause of obesity is excessive food intake, and relative behavioral changes have recently been reported [1]. Adipose tissue accumulation and dysfunction characterize obesity. This also leads to an imbalance in adipocytokines production, which in turn triggers an uncontrolled chronic inflammation [2,3]. In addition, insulin resistance due to obesity is linked to wide metabolic abnormalities [4], which are associated with the development of severe pathologies [5].
The obese condition and long-term high-fat diet (HFD) consumption, for instance, diets rich in saturated fat, have been associated with less cognitive capacity in both humans and animals [6,7,8,9]. Population-based studies reported that the obesity-driven vascular risk factors, such as hypertension, dyslipidemia, and diabetes, are all connected with cognitive deterioration and neurodegenerative dementias, such as Alzheimer’s disease (AD), usually characterized by amyloid-aggregates forming plaques, loss of synaptic transmission and degeneration of cholinergic neurons [10,11]. Overlapping neurodegenerative mechanisms have been recognized in obese conditions: neuro-inflammation, oxidative stress, and mitochondrial dysfunction [2,11]. Then, alterations at the blood-brain barrier (BBB) integrity and peptides transport in obesity were observed [12]. Additionally, in animals, HFD influences negatively the cognitive activity, compromising the BBB integrity [13]. HFD-induced obesity is associated with insulin resistance and other chronic diet-related illnesses, including dementia [14]. Indeed, dietary composition as an environmental factor can negatively affect hippocampal activity. Many data have demonstrated in middle-aged rats that HFD negatively impacts the memory processes controlled by the hippocampus, involving learning and use of stimuli in the spatial environment [15,16].
In accordance recently, we reported in diet-induced obese (DIO) rats the presence of increased glycemia, insulin, and systolic blood pressure. In the hippocampus and frontal cortex, astrogliosis, activation of microglia, transient receptor potential (TRP) ion channels dysfunction, and endothelial inflammation have been found [17,18]. In addition, in the obese Zucker rats (OZRs), we reported BBB changes, loss of neurons, gliosis, as well as oxidative stress in the same brain regions [19,20]. Both microglia and astrocytes are critical for keeping BBB integrity, retaining neuronal metabolism in response to local tissue damage. Their activation in the hypothalamus of rats and humans follows HFD consumption [21]. These data were consistent with our recent findings, in which 20-week-old OZRs demonstrated cholinergic and synaptic alterations, highlighting that obesity and aging induced cognitive dysfunction [22]. A protective effect may be raised from the activation of the anti-inflammatory pathway involving the astroglial α7nicotinic acetylcholine receptors (α7nAChR) [23,24]. Cholinergic pathways project widely to different brain areas: basal-forebrain, cerebral cortex and hippocampus, as well as some intrinsic cholinergic hippocampal interneurons, show a decisive part in cognitive activity [25]. Among the consequences of AD, the presynaptic cholinergic hypofunction is the most relevant; thus, cholinergic replacement therapy is beneficial in alleviating the cognitive dysfunction. Even if acetylcholinesterase (AChE) inhibitors (donepezil, galantamine, or rivastigmine) stop the breakdown of synaptic acetylcholine (ACh), enhancing the cholinergic and cognitive functions, which deteriorate in normal aging and AD, they have some important limitations [26]. Furthermore, new insights into acetylcholine receptors (AChRs) molecular pharmacology are bringing other drugs directed at AChRs to the center stage [27].
Histochemical techniques show ChAT-immunoreactive fibers in layers III and IV of the cerebral cortex, with faint labeling in layer II. Many neurons positive to ChAT shown a bipolar dendritic pattern [28,29]. The hippocampus presents a finely granular distribution of neurons positive to ChAT in the pyramidal layer, with an intense immunoreactivity, especially, in the CA2 and CA3 subfields [29]. The rat hippocampus receives afferent fibers from the AChE, and they take part in cholinergic system activation [30]. A double labeling of both markers ChAT and AChE is not intense enough to be observed [29,31].
The neurobiological mechanisms, which cause brain impairment following HFD consumption, are not understood. However, it is still unknown whether HFD uniquely impairs the frontal cortex and the hippocampus, brain regions that are important for cognition. Despite the well-known global impact of overweight and obesity in the incidence of brain dysfunction, many aspects of this connection, such as the involvement of the cholinergic pathway, are still inconsistently defined [32]. Based on this evidence, in our study, we aimed at founding such a connection by assessing the effects of obesity on brain cholinergic signaling, using a rodent model of diet-induced obesity (DIO), which mimics mutual features of human obesity more precisely than other genetic models [33,34]. The study was performed in cerebral zones, where the cholinergic system is implicated: the frontal cortex, particularly the motor region, and the hippocampus, which is concerned in memory and learning skills [20]. To investigate possible mechanisms underlying these disturbances, we examined the expression of cholinergic markers also involved in neurodegenerative diseases [35], such as choline acetyltransferase (ChAT) and AChE, the enzymes used to synthesize and break down the ACh, respectively. In addition, the levels of the vesicular acetylcholine transporter (VAChT), which mediates the packaging and transport of ACh, were examined. Different AChRs subtypes 1, 3, and 5 muscarinic acetylcholine receptors (mAChR1, mAChR3, and mAChR5, respectively) were explored because of their ubiquity and richness in the cerebral cortex and the hippocampus [36,37], and they are all mainly postsynaptic and Gq coupled [38,39]. Moreover, the nicotinic alpha-7 receptor (α7nAChR), predominant and widely expressed at pre-and postsynaptic levels [40], was analyzed.
2. Materials and Methods
2.1. Animals
Wistar rats (Charles River; male; n = 36; body weight = 225–250 g) were used. All procedures concerning animals followed the Institutional Guidelines and conformed with the Italian Ministry of Health (protocol number 1610/2013) and associated guidelines from the European Communities Council Directive. Animals were arbitrarily separated into two groups: CHOW (n = 16) with standard diet ad libitum (4RF18, Mucedola, Settimo Milanese, Italy; 2.6 kcal/g, which was composed among carbohydrates, proteins, and fats as follows: 72%, 21%, and 7%, respectively) and DIO (n = 20) with HFD ad libitum (D12451, Research Diets, Inc., New Brunswick, NJ; 4.73 kcal/g, distributed in 45% fat, 35% carbohydrate, 20% protein;). After 5 weeks (12 weeks of age) of HFD, the obese phenotype was established, and DIO (n = 8) and CHOW (n = 8) rats were sacrificed. The remaining DIO rodents were fed with HFD for further 12 weeks (24 weeks of age), for a total of 17 weeks of HFD, while the remaining CHOW rats were fed with the standard diet [17,18,41,42,43]. In the groups of DIO animals, after 17 weeks of HFD, rats that were resistant to increase of body weight (n = 3) were excluded from the experiment because they did not become obese [42,44,45,46,47]. Daily, food consumption and body weight were measured. Weekly systolic blood pressure was recorded.
2.2. Blood Parameters and Brain Tissue Preaparation
At sacrifice, systolic blood pressure was recorded. In blood withdrawals, the following parameters were estimated: glucose, insulin, triglycerides, and total cholesterol. The thiobarbituric-acid-reactive substances (TBARS) quantity, measured as the malondialdehyde (MDA), was evaluated in the serum. The assay kits and all these procedures were reported previously [17,18,41,42,43]. Finally, the brains were removed and divided in two hemispheres. The right was immediately frozen for biochemical analysis, while the left was fixated in 4% paraformaldehyde solution in PBS, in order to be embedded subsequently in paraffin wax.
2.3. Histochemistry, Immunohistochemistry and Image Analysis
With a microtome, the paraffin-embedded brains were cut into sagittal sections of 10 μm and mounted on microscope slides in order to perform the morphological and immunohistochemical (IHC) analysis, as previously described [17,18]. Consecutive sagittal sections were stained with a 0.75% cresyl violet solution (Nissl’s staining) to investigate brain gross anatomy and the presence of tissue degeneration. For IHC, primary antibodies were diluted (Table 1), and sections were incubated overnight at 4 °C. Through preliminary experiments, the specificity and the concentration of the antibodies were established [22,48,49,50,51]. The sections were incubated with the specific biotinylated secondary antibodies (Bethyl Laboratories, Inc., Montgomery, TX, USA, dilution 1:200). Sections were then washed in PBS and incubated with avidin-biotin-peroxidase complex (Vectastain ABC Elite kit; Vector Laboratories, Inc., Burlingame, CA, USA). Finally, the immunoreaction was revealed using a 3,3′-diaminobenzidine tetrahydrochloride (DAB) substrate kit (Vector Laboratories, Inc., Burlingame, CA, USA) according to the manufacturer’s protocol. The intensities of immune reaction were measured with NIS Elements Nikon (Florence, Italy) image analyzer software, and representative pictures were captured by a microscope Leica DMR coupled by DS-Ri2 NIKON camera [17,18,22]. To assess the immunostaining background, some sections were not incubated with primary antibody but with a non-immune serum.

Table 1.
Primary antibodies used in immunohistochemistry (IHC) and Western blot (WB).
2.4. Western Blot and Quantification
Brain tissues approximately 0.1 ± 0.02 g, were lysed in appropriate buffer with protease inhibitors (Sigma-Aldrich, Milan, Italy). Following centrifugation, for the Western blot procedures, the protein amount in the supernatant was quantified. A total of 40 µg of proteins was loaded in sodium dodecyl sulfate (SDS) polyacrylamide gel and transferred onto nitrocellulose membranes, which were incubated with the appropriate primary antibodies at different dilutions (Table 1) as previously established [17,22]. Then, specific secondary antibodies conjugated with horseradish peroxidase (HRP) (Bethyl Laboratories, Inc., Montgomery, TX, USA, dilution 1:5000) were used. After, protein bands were visualized using chemiluminescent substrates (EuroClone, Milan, Italy) followed by densitometric analysis. To normalize, monoclonal anti-beta-actin (β-actin) or glyceraldehyde-3-phosphate dehydrogenase (GAPDH) antibodies, produced both in mice, were used as a loading control.
2.5. Statistical Analysis
Data were analyzed using GraphPad prism software. The significance of difference between means was assessed by ANOVA. All the results were expressed as the mean ± standard error of mean (S.E.M.), with p-value < 0.05 being considered as statistical significance.
3. Results
3.1. Body Weight, Food Consumption, and Blood Parameters
No significant changes were observed between the groups at the beginning of the study in terms of body weight. As expected in the HF rats, we found an increase in body weight in DIO rats in comparison to CHOW rats and the obese phenotype was established at 5 weeks of diet. At the same time, systolic blood pressure, glycemia, total cholesterol, and triglycerides levels did not change except for insulin values, which were significantly higher in DIO rats with a mean value of 0.79 µg/L with a S.E.M. of 0.12 compared to CHOW (0.31 ± 0.06 µg/L; p < 0.05 vs. DIO rats). After 17 weeks, the body weight in DIO rats was remarkably higher than in CHOW rats. As already published [17,18,41,42,43], the DIO animals showed a significant increase in the systolic blood pressure, glycemia, and insulin levels after 17 weeks of HFD, in comparison to CHOW rats. The obesity did not influence neither the triglycerides nor the total cholesterol. In addition, the TBARS assay demonstrated an increased serum concentrations of MDA in DIO rats (26.0 ± 1.5 µM) compared with the control CHOW group (18.8 ± 1.8 µM; p < 0.05 vs. DIO rats) after 5 weeks of HFD. Previously, we reported a remarkably increased MDA concentration also after 17 weeks of HFD [41].
3.2. Neuronal Nuclei and Neurofilament
As shown in Figure S1, no microanatomical changes were observed in the frontal cortex (Figure S1A) and hippocampus (Figure S1B) of DIO rats after 5 and 17 weeks of HFD in comparison with age-matched CHOW rats. Histochemical analysis confirmed the magnetic resonance imaging (MRI) results that did not show vascular and morphological alterations in the older DIO rats [52]. Moreover, to evaluate neuronal viability, sections were immunostained, using antibodies against NeuN and NF to mark neurons. After 5 weeks of HFD, neither Western blot nor immunohistochemistry revealed differences in NeuN (Figure S2A) as well as NF (Figure S2B) among the experimental groups both in the frontal cortex and in the hippocampus. Even if NeuN levels and positive neurons were not modulated after longer-lasting exposure to HFD (Figure S2C,E), NF levels diminished in the two brain areas analyzed of obese animals in comparison to controls (Figure S2D,F).
3.3. Choline Acetyltransferase and Acetylcholinesterase
Immunochemical analyses pointed out an increase in the frontal cortex (Figure 1A) and the hippocampus (Figure 1C), in the ChAT levels at 68 kDa in HFD-fed rats after 5 and 17 weeks in comparison to controls. The immunohistochemistry analysis was in line with the proteins expression. The average intensity values of ChAT were significantly increased after the exposure to HFD in the frontal cortex (Figure 1B) as well as in the hippocampus (Figure 1D). Representative pictures showed that the immunoreaction was localized in the afferent fibers in layers III and IV of the cerebral cortex (Figure 1B) and in the subfields of the hippocampus, CA2 and CA3 (Figure 1D).
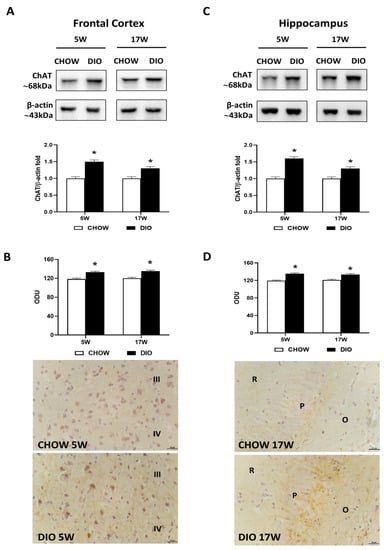
Figure 1.
Western blot and immunohistochemistry of choline acetyltransferase (ChAT). Samples of the frontal cortex (A) and hippocampus (C) from rats fed with a standard diet (CHOW rats) and high-fat diet (DIO rats) for 5 and 17 weeks were immunoblotted with anti-ChAT. Graphs reported the densitometric data with CHOW as control, and β-actin was used as a reference loading protein. ChAT immunoreaction intensity in the frontal cortex (B) and the hippocampus (D) from CHOW and DIO after 5 and 17 weeks of a high-fat diet was measured in optical density units (ODU). Data are mean ± S.E.M. * p < 0.05 vs. age-matched CHOW rats. CHOW rats 5 weeks n = 8; DIO rats 5 weeks n = 8; CHOW rats 17 weeks n = 8; DIO rats 17 weeks n = 9. Representative pictures of CHOW and DIO rats frontal cortex after 5 weeks (B) and hippocampus, CA3 subfield, after 17 weeks (D) of diet. III, IV, third and fourth layers of frontal cortex respectively; O, stratum oriens; P, pyramidal neurons; R, stratum radiatum. Scale bar: 25 µm.
Western blot analysis for the AChE carried out in the frontal cortex (Figure 2A) and in the hippocampus (Figure 2C) showed a band at 70 kDa in both these areas. A decrease of AChE level was evident in obese rats fed for 17 weeks with HFD in comparison to controls (Figure 2A,C). The AChE immunoreaction was mainly limited in the neurons of the V layer of the frontal cortex (Figure 2B). Pyramidal neurons were reactive both in the hippocampal CA1 and in CA2 (Figure 2D). The immunoreaction of AChE was found to be remarkably less intense in DIO animals fed with HFD for 17 weeks in the two brain areas analyzed (Figure 2B,D).
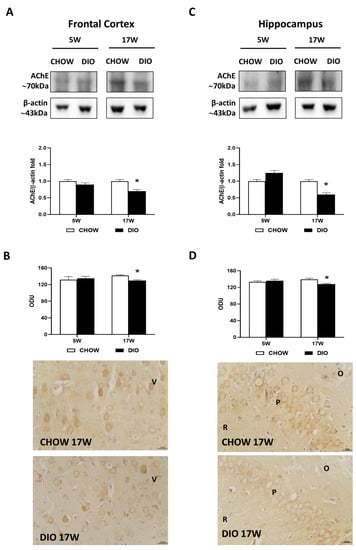
Figure 2.
Western blot and immunohistochemistry of acetylcholinesterase (AChE). Samples of the frontal cortex (A) and hippocampus (C) from rats fed with a standard diet (CHOW rats) and high-fat diet (DIO rats) for 5 and 17 weeks were immunoblotted with anti-AChE. Graphs report the densitometric data with CHOW rats as control, and β-actin was used as a reference loading protein. AChE immunoreaction intensity in the frontal cortex (B) and the hippocampus (D) from CHOW and DIO rats after 5 and 17 weeks of a high-fat diet was measured in optical density units (ODUs). Data are mean ± S.E.M. * p < 0.05 vs. age-matched CHOW rats. CHOW rats 5 weeks n = 8; DIO rats 5 weeks n = 8; CHOW rats 17 weeks n = 8; DIO rats 17 weeks n = 9. Representative pictures of CHOW and DIO frontal cortex (B) and hippocampus, CA2 subfield, (D) after 17 weeks of diet. V, fifth layer of frontal cortex; O, stratum oriens; P, pyramidal neurons; R, stratum radiatum. Scale bar: 25 µm.
3.4. Vesicular Acetylcholine Transporter
Immunochemical results for the VAChT presented a band at 80 kDa in the frontal cortex (Figure 3A) as well as in the hippocampus (Figure 3C).
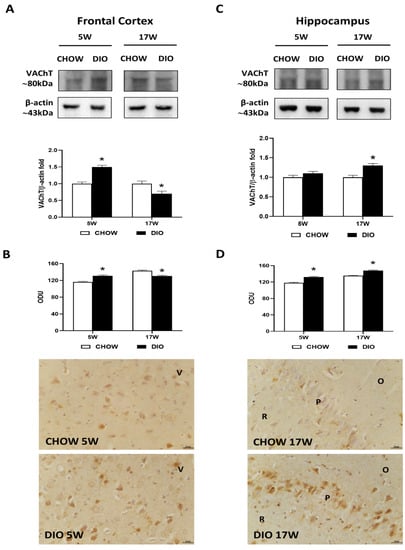
Figure 3.
Western blot and immunohistochemistry of vesicular acetylcholine transporter (VAChT). Samples of the frontal cortex (A) and hippocampus (C) from rats fed with a standard diet (CHOW rats) and high-fat diet (DIO rats) for 5 and 17 weeks were immunoblotted with anti-VAChT. Graphs report the densitometric data with CHOW rats as control. ChAT membranes were stripped and incubated with anti-VAChT antibodies. β-actin control images were reused for illustrative purposes. VAChT immunoreaction intensity in the frontal cortex (B) and the hippocampus (D) from CHOW and DIO rats after 5 and 17 weeks of a diet was measured in optical density unit (ODU). Data are mean ± S.E.M. * p < 0.05 vs. age-matched CHOW rats. CHOW rats 5 weeks n = 8; DIO rats 5 weeks n = 8; CHOW rats 17 weeks n = 8; DIO rats 17 weeks n = 9. Representative pictures of CHOW and DIO rats frontal cortex after 5 weeks (B) and hippocampus, CA1 subfield, after 17 weeks (D) of diet. V, fifth layer of frontal cortex; O, stratum oriens; P, pyramidal neurons; R, stratum radiatum. Scale bar: 25 µm.
The VAChT level was remarkably higher in the frontal cortex of DIO rats after 5 weeks of HFD. On the contrary, it was found after 17 weeks with HFD (Figure 3A). The immunohistochemistry analysis confirmed these results in the frontal cortex, where immunoreactivity was found in cell bodies of the V layer (Figure 3B). While differences in proteins levels were reported in the hippocampus only after 17 weeks of hypercaloric diet (Figure 3C), VAChT immunoreaction was significantly increased in the CA1 subfield (Figure 3D) of DIO rats both after 5 and 17 weeks of HFD exposure.
3.5. Alpha7 Nicotinic Acetylcholine Receptor
Western blot results for the α7nAChR showed a 55 kDa band in the two brain areas considered (Figure 4A,C). In the frontal cortex, protein quantification reported a less expression of α7nAChR in obese animals fed for 17 weeks with HFD compared with lean rats (Figure 4A), while in the hippocampus, a remarkable reduction was reported both after 5 and 17 weeks of hypercaloric diet (Figure 4C). The immunostaining for the nicotinic receptor α7nAChR was present in the neurons of the V layer of the frontal cortex (Figure 4B), the CA1, and the CA3 subfields (Figure 4D). The intensities of immunoreaction for α7nAChR confirmed the immunochemical results in these two brain areas analyzed (Figure 4B,D).
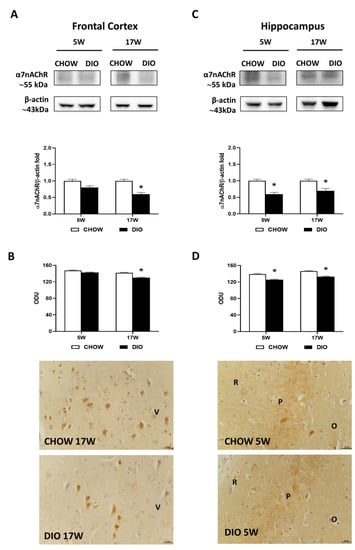
Figure 4.
Western blot and immunohistochemistry of alpha7 nicotinic acetylcholine receptor (α7nAChR). Samples of the frontal cortex (A) and hippocampus (C) from rats fed with a standard diet (CHOW rats) and high-fat diet (DIO rats) for 5 and 17 weeks were immunoblotted with anti- α7nAChR. Graphs report the densitometric data with CHOW rats as control, and β-actin was used as reference loading protein. α7nAChR immunoreactions intensity in the frontal cortex (B) and the hippocampus (D) from CHOW and DIO rats after 5 and 17 weeks of a diet was measured in optical density unit (ODU). Data are mean ± S.E.M. * p < 0.05 vs. age-matched CHOW rats. CHOW rats 5 weeks n = 8; DIO rats 5 weeks n = 8; CHOW rats 17 weeks n = 8; DIO rats 17 weeks n = 9. Representative pictures of CHOW and DIO rats frontal cortex after 17 weeks (B) and hippocampus, CA3 subfield, after 5 weeks (D) of diet. V, fifth layer of frontal cortex; O, stratum oriens; P, pyramidal cells; R, stratum radiatum. Scale bar: 25 µm.
3.6. Muscarinic Acetylcholine Receptors
Among the different muscarinic receptors considered, the mAChR1 was altered in the obese phenotype (Figure 5). Immunochemical data for the mAChR1 displayed its expression at 50 kDa, that was significantly increased in 5 weeks’ HFD-fed rats compared to that in controls in the frontal cortex (Figure 5A) but not in the hippocampus (Figure 5C). The immunohistochemistry analysis for mAChR1 (Figure 5B,D) confirmed the Western blot data. mAChR1 was highly expressed on the bodies of pyramidal neurons in the V layer of the frontal cortex (Figure 5B) as well as in the CA3 subfield of the hippocampus (Figure 5D).
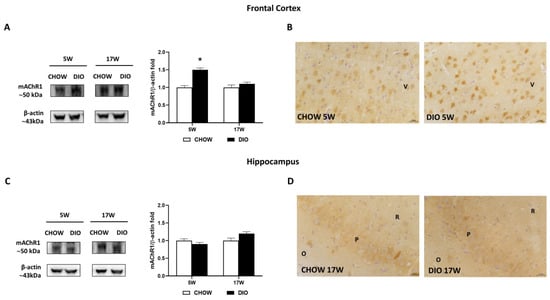
Figure 5.
Western blot and immunohistochemistry of muscarinic acetylcholine receptor subtype 1 (mAChR1). Samples of frontal cortex (A) and hippocampus (C) from rats fed with standard diet (CHOW rats) and high-fat diet (DIO rats) for 5 and 17 weeks were immunoblotted with anti- mAChR1. Graphs report the densitometric data with CHOW rats as control, and β-actin was used as a reference loading protein. Data are mean ± S.E.M. * p < 0.05 vs. age-matched CHOW rats. CHOW rats 5 weeks n = 8; DIO rats 5 weeks n = 8; CHOW rats 17 weeks n = 8; DIO rats 17 weeks n = 9. Representative pictures of CHOW and DIO rats frontal cortex after 5 weeks (B) and hippocampus, CA3 subfield, after 17 weeks (D) of diet. V, fifth layer of frontal cortex; O, stratum oriens; P, pyramidal neurons; R, stratum radiatum. Scale bar: 25 µm.
Besides, the mAChR3 receptor was expressed with an 80 kDa band in in the two brain regions considered (Figure 6A,C). Neither the mAChR3 expression (Figure 6A,C) nor its immunoreaction (Figure 6B,D) were remarkably changed between the opposite groups. As shown by representative pictures, mAChR3 was expressed on pyramidal neurons of the V layer of the frontal cortex (Figure 6B) as well as on the neurons of the CA3 subfield of the hippocampus (Figure 6D).
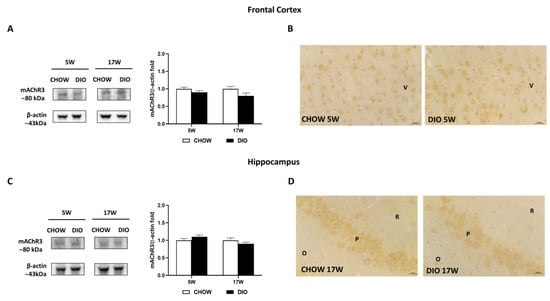
Figure 6.
Western blot and immunohistochemistry of muscarinic acetylcholine receptor subtype 3 (mAChR3). Samples of frontal cortex (A) and hippocampus (C) from rats fed with standard diet (CHOW rats) and high-fat diet (DIO rats) for 5 and 17 weeks were immunoblotted using specific anti- mAChR3. Graphs report the densitometric data with CHOW rats as control, and β-actin was used as a reference loading protein. Data are mean ± S.E.M. CHOW rats 5 weeks n = 8; DIO rats 5 weeks n = 8; CHOW rats 17 weeks n = 8; DIO rats 17 weeks n = 9. Representative pictures of CHOW and DIO rats in frontal cortex after 5 weeks (B) and hippocampus, CA3 subfield, after 17 weeks (D) of diet. V, fifth layer of frontal cortex; O, stratum oriens; P, pyramidal neurons; R, stratum radiatum. Scale bar: 25 µm.
Finally, the mAChR5 receptor was expressed at approximately 55 kDa in the frontal cortex (Figure 7A) and hippocampus (Figure 7C). The expression of the mAChR5 subtype of DIO rat after 5 weeks or 17 weeks of HFD did not differ significantly compared to CHOW in the frontal cortex (Figure 7A) as well as in the hippocampus (Figure 7C). Similar results were obtained from the IHC (Figure 7B,D). mAChR5 was expressed in the pyramidal neurons of both the V layer of the frontal cortex (Figure 7B) and in the hippocampal CA3 subfield (Figure 7D).
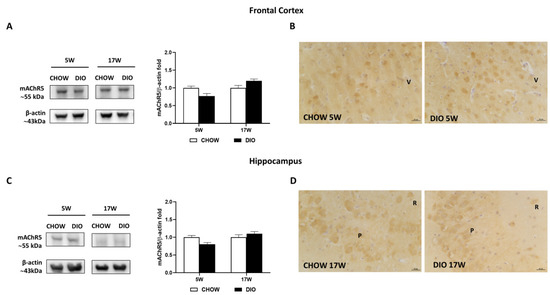
Figure 7.
Western blot and immunohistochemistry of muscarinic acetylcholine receptor subtype 5 (mAChR5). Samples of the frontal cortex (A) and hippocampus (C) from rats fed with a standard diet (CHOW rats) and high-fat diet (DIO rats) for 5 and 17 weeks were immunoblotted using specific anti- mAChR5. Graphs report the densitometric data with CHOW rats as control, and β-actin was used as a reference loading protein. Data are mean ± S.E.M. CHOW rats 5 weeks n = 8; DIO rats 5 weeks n = 8; CHOW rats 17 weeks n = 8; DIO rats 17 weeks n = 9. Representative pictures of CHOW and DIO rats frontal cortex after 5 weeks (B) and hippocampus, CA3 subfield, after 17 weeks (D) of diet. V, fifth layer of frontal cortex; P, pyramidal neurons; R, stratum radiatum. Scale bar: 25 µm.
4. Discussion
Obesity is a condition associated with numerous physiological abnormalities caused by fat tissue accumulation. The link between obesity and cognitive dysfunction has been established. Genetically, obese rats, such as the leptin-receptor-deficient OZRs, reported cognitive dysfunction related to BBB impairments, loss of neurons, inflammation, and gliosis accompanied by behavioral tests alterations [19,20]. In accordance, data showed that HFD led to compromised memory and learning in rodents [53,54,55]. As previously reported, 24-week-old DIO rats showed a condition of anxiety-like behavior and a decrease of retention latency time in the emotional learning skill if compared with CHOW rats [17]. Since ACh is expected to play a role in mediating the fluctuations in emotional behaviors induced by HFD intake [56], and the cholinergic activity has been found altered in older OZRs [22], here, we also investigated the possible modulation of the cholinergic pathway after exposure to HFD.
In obese or fatty Zucker rats, the results regarding the levels of ChAT and AChE enzymes were complex and controversial depending especially on the brain areas analyzed [57,58]. Since 14-week-old OZRs developed an enhanced both in ChAT and in AChE activities, it was postulated an intensification of the ACh turnover rate by [59], whereas in Zucker fatty rats, the lower ACh content was found in all brain regions, highlighting a dysfunction. In addition, lower ChAT activity as well as higher AChE activity was found only in the medulla oblongata and striatum of fatty rats [57]. Conversely, the reduced enzymatic activity of the AChE, particularly in the frontal cortex, hypothalamus, and midbrain area of rats fed with HFD, reflected a probable augmentation in ACh concentration in these cerebral areas [56]. These data were in agreement with [59], which reported a suppressive outcome on AChE action in the cortex and hypothalamus after long-term (6 months) HFD. Short-term (7 days) fat consumption was effective in stimulating the cholinergic system in cortical, hypothalamic, and midbrain regions [56]. As in vitro, the activity of AChE was reduced by the augmentation of free fatty acid in the HFD-consuming rats [60,61], and probably these circulating energy molecules influenced the cholinergic function [49]. Here, our results showed an earlier higher expression of ChAT and a later lower expression of AChE in obese animals both in the frontal cortex as well as in the hippocampus; perhaps it is an attempt of recovery mechanism to restore the ACh content or of increase in the ACh turnover or to positively control the NF levels, diminishing the axonal damage previously reported in DIO rats [17]. The alterations of axonal fibers could explain the downregulation of VAChT expression in the frontal cortex of 24-week-old DIO rats, similar to the VAChT modulation present both in the frontal cortex and hippocampus of older OZRs [22]. Differently, an upregulation of VAChT, as observed in spontaneously hypertensive rats, represents an attempt to compensate for cholinergic impairment in the first stages of brain dysfunction induced by hypertension [50,51].
Different anti-inflammatory pathways control the HFD-induced inflammation, including the cholinergic pathway [62], through the activation of the α7nAChR [63]. A stimulatory reaction of dietary fat has been reported on α7nAChR in the lateral and ventromedial hypothalamus [56]. Unlike other studies also in the hypothalamus, liver, spleen, and adipose tissue, we sustained that HFD reduced the expression of α7nAChR [64,65]. In accordance, our data demonstrated a reduction of this receptor both in the frontal cortex and hippocampus in rats fed with HFD, as we described recently in the same regions of older OZRs [22]. Since the stimulation of α7nAChR both in microglia as well as in astrocytes can induce neuroprotection resulting from anti-inflammatory activities [66], we could speculate that the reactive microglia, astrogliosis, and vascular inflammation, characterized by an increase of endothelial inflammatory markers (cell adhesion molecules) in DIO rats after 17 weeks of HFD [17], may be related to the low expression of α7nAChR in obese phenotype.
Among the muscarinic acetylcholine receptors (mAChRs), type 1 in the hippocampus and cerebral cortex plays a central role in cognitive processing, memory, and learning, and it is compromised in AD [67]. Recently, we reported that mAChR1 was remarkably downregulated in the hippocampus of OZRs without any differences in mAChR3 and mAChR5 levels [22]. The mAChRs were distinctly influenced by obesity in DIO rats [39,68]. Indeed, downregulation of both mAChR1 and mAChR3 in the hippocampus of DIO rats has been described without any differences in mAChR5 [68]. Interestingly, the current study showed that mAChR1 was upregulated after 5 days of HFD only in the frontal cortex. mAChR1 presence was increased in diabetic rats with a reduction in affinity [69]. The observed alterations in the receptor number and affinity were due to the changes of receptor protein and synthesis [69]. Here, no remarkable differences were detected in mAChR3 levels as well as for mAChR5. Collectively, the present data suggest a differential variation of muscarinic subtypes in obese rats compared to lean controls.
Interestingly, the lipid peroxidation in serum of obese rats perhaps may be related to the modulation of cholinergic receptors since nAChRs have shown an antioxidative effect and mAChR stimulation may generate reactive oxygen species [70]. However, the presented hypothesis requires further research and observations in both the frontal cortex and hippocampus.
5. Conclusions
Based on the functionally altered cholinergic markers in the frontal cortex and the hippocampus of DIO compared to CHOW rats, we suggest innovative perception into how obese condition can affect the cholinergic system and consequently the cognitive skills. Moreover, the modulation of certain cholinergic enzymes and/or receptors might be a useful therapeutic approach in the cerebral dysfunction related to obesity.
Supplementary Materials
The following supporting information can be downloaded at: https://www.mdpi.com/article/10.3390/nu14061243/s1. Figure S1: Sections of rat frontal cortex and hippocampus stained with cresyl violet; Figure S2: Immunoblotting and immunoreaction of neuronal nuclei (NeuN) and neurofilament 200 kDa (NF).
Author Contributions
Conceptualization, I.M., S.K.T., C.C., F.A. and D.T.; data curation, I.M., M.V.M.D.B. and D.T.; formal analysis, M.V.M.D.B. and D.T.; funding acquisition, S.K.T.; investigation, I.M., P.R., M.M. and D.T.; methodology, I.M., M.V.M.D.B., M.M. and D.T.; project administration, C.C.; resources, S.K.T., F.A. and D.T.; supervision, I.M., S.K.T., M.V.M.D.B., C.C. and D.T.; visualization, I.M., M.V.M.D.B. and C.C.; writing—original draft, I.M. and D.T.; writing—review and editing, I.M., S.K.T. and D.T. All authors have read and agreed to the published version of the manuscript.
Funding
This research was funded by the University of Camerino (FAR2019).
Institutional Review Board Statement
All procedures were conducted in accordance with the Institutional Guidelines and were complied with the Italian Ministry of Health (protocol no. 1610/2013) and associated guidelines from the European Communities Council Directive. The protocol was approved by the Ethics Committee of the University of Camerino (no. 7/2012, 6 June 2012).
Data Availability Statement
The data presented in this study are available on request from the corresponding author.
Conflicts of Interest
The authors declare no conflict of interest.
References
- Teixeira, P.J.; Marques, M.M. Health Behavior Change for Obesity Management. Obes. Facts 2017, 10, 666–673. [Google Scholar] [CrossRef] [PubMed]
- Longo, M.; Zatterale, F.; Naderi, J.; Parrillo, L.; Formisano, P.; Raciti, G.A.; Beguinot, F.; Miele, C. Adipose Tissue Dysfunction as Determinant of Obesity-Associated Metabolic Complications. Int. J. Mol. Sci. 2019, 20, 2358. [Google Scholar] [CrossRef]
- Wu, H.; Ballantyne, C.M. Metabolic Inflammation and Insulin Resistance in Obesity. Circ. Res. 2020, 126, 1549–1564. [Google Scholar] [CrossRef]
- Barazzoni, R.; Gortan-Cappellari, G.; Ragni, M.; Nisoli, E. Insulin resistance in obesity: An overview of fundamental alterations. Eat. Weight Disord. 2018, 23, 149–157. [Google Scholar] [CrossRef] [PubMed]
- Kinlen, D.; Cody, D.; O’Shea, D. Complications of obesity. QJM Int. J. Med. 2018, 111, 437–443. [Google Scholar] [CrossRef] [PubMed]
- Morris, M.C.; Evans, D.A.; Bienias, J.L.; Tangney, C.C.; Wilson, R.S. Dietary fat intake and 6-year cognitive change in an older biracial community population. Neurology 2004, 62, 1573–1579. [Google Scholar] [CrossRef] [PubMed]
- Farr, S.A.; Yamada, K.A.; Butterfield, D.A.; Abdul, H.M.; Xu, L.; Miller, N.E.; Banks, W.A.; Morley, J.E. Obesity and hypertriglyceridemia produce cognitive impairment. Endocrinology 2008, 149, 2628–2636. [Google Scholar] [CrossRef]
- Prickett, C.; Brennan, L.; Stolwyk, R. Examining the relationship between obesity and cognitive function: A systematic literature review. Obes. Res. Clin. Pract. 2015, 9, 93–113. [Google Scholar] [CrossRef] [PubMed]
- Walker, J.M.; Dixit, S.; Saulsberry, A.C.; May, J.M.; Harrison, F.E. Reversal of high fat diet-induced obesity improves glucose tolerance, inflammatory response, β-amyloid accumulation and cognitive decline in the APP/PSEN1 mouse model of Alzheimer’s disease. Neurobiol. Dis. 2017, 100, 87–98. [Google Scholar] [CrossRef] [PubMed]
- Kloppenborg, R.P.; van den Berg, E.; Kappelle, L.J.; Biessels, G.J. Diabetes and other vascular risk factors for dementia: Which factor matters most? A systematic review. Eur. J. Pharmacol. 2008, 585, 97–108. [Google Scholar] [CrossRef]
- Pugazhenthi, S.; Qin, L.; Reddy, P.H. Common neurodegenerative pathways in obesity, diabetes, and Alzheimer’s disease. Biochim. Biophys. Acta Mol. Basis Dis. 2017, 1863, 1037–1045. [Google Scholar] [CrossRef] [PubMed]
- Rhea, E.M.; Salameh, T.S.; Logsdon, A.F.; Hanson, A.J.; Erickson, M.A.; Banks, W.A. Blood-Brain Barriers in Obesity. AAPS J. 2017, 19, 921–930. [Google Scholar] [CrossRef] [PubMed]
- Persidsky, Y.; Ramirez, S.H.; Haorah, J.; Kanmogne, G.D. Blood-brain barrier: Structural components and function under physiologic and pathologic conditions. J. Neuroimmune Pharmacol. 2006, 1, 223–236. [Google Scholar] [CrossRef]
- Kothari, V.; Luo, Y.; Tornabene, T.; O’Neill, A.M.; Greene, M.W.; Geetha, T.; Babu, J.R. High fat diet induces brain insulin resistance and cognitive impairment in mice. Biochim. Acta Mol. Basis Dis. 2017, 1863, 499–508. [Google Scholar] [CrossRef] [PubMed]
- Granholm, A.C.; Bimonte-Nelson, H.A.; Moore, A.B.; Nelson, M.E.; Freeman, L.R.; Sambamurti, K. Effects of a saturated fat and high cholesterol diet on memory and hippocampal morphology in the middle-aged rat. J. Alzheimer’s Dis. 2008, 14, 133–145. [Google Scholar] [CrossRef]
- Stranahan, A.M.; Norman, E.D.; Lee, K.; Cutler, R.G.; Telljohann, R.S.; Egan, J.M.; Mattson, M.P. Diet-induced insulin resistance impairs hippocampal synaptic plasticity and cognition in middle-aged rats. Hippocampus 2008, 18, 1085–1088. [Google Scholar] [CrossRef] [PubMed]
- Micioni Di Bonaventura, M.V.; Martinelli, I.; Moruzzi, M.; Micioni Di Bonaventura, E.; Giusepponi, M.E.; Polidori, C.; Lupidi, G.; Tayebati, S.K.; Amenta, F.; Cifani, C.; et al. Brain alterations in high fat diet induced obesity: Effects of tart cherry seeds and juice. Nutrients 2020, 12, 623. [Google Scholar] [CrossRef]
- Roy, P.; Martinelli, I.; Moruzzi, M.; Maggi, F.; Amantini, C.; Micioni Di Bonaventura, M.V.; Cifani, C.; Amenta, F.; Tayebati, S.K.; Tomassoni, D. Ion channels alterations in the forebrain of high-fat diet fed rats. Eur. J. Histochem. 2021, 65, 3305. [Google Scholar] [CrossRef] [PubMed]
- Tomassoni, D.; Nwankwo, I.E.; Gabrielli, M.G.; Bhatt, S.; Muhammad, A.B.; Lokhandwala, M.F.; Tayebati, S.K.; Amenta, F. Astrogliosis in the brain of obese Zucker rat: A model of metabolic syndrome. Neurosci. Lett. 2013, 543, 136–141. [Google Scholar] [CrossRef] [PubMed]
- Tomassoni, D.; Martinelli, I.; Moruzzi, M.; Micioni Di Bonaventura, M.V.; Cifani, C.; Amenta, F.; Tayebati, S.K. Obesity and Age-Related changes in the brain of the Zucker Leprfa/fa Rats. Nutrients 2020, 12, 1356. [Google Scholar] [CrossRef] [PubMed]
- Baufeld, C.; Osterloh, A.; Prokop, S.; Miller, K.R.; Heppner, F.L. High-fat diet-induced brain region-specific phenotypic spectrum of CNS resident microglia. Acta Neuropathol. 2016, 132, 361–375. [Google Scholar] [CrossRef]
- Martinelli, I.; Tomassoni, D.; Roy, P.; Amenta, F.; Tayebati, S.K. Altered Brain Cholinergic and Synaptic Markers in Obese Zucker Rats. Cells 2021, 10, 2528. [Google Scholar] [CrossRef] [PubMed]
- Patel, H.; McIntire, J.; Ryan, S.; Dunah, A.; Loring, R. Anti-inflammatory effects of astroglial α7 nicotinic acetylcholine receptors are mediated by inhibition of the NF-κB pathway and activation of the Nrf2 pathway. J. Neuroinflamm. 2017, 14, 192. [Google Scholar] [CrossRef] [PubMed]
- Piovesana, R.; Salazar Intriago, M.S.; Dini, L.; Tata, A.M. Cholinergic Modulation of Neuroinflammation: Focus on α7 Nicotinic Receptor. Int. J. Mol. Sci. 2021, 22, 4912. [Google Scholar] [CrossRef] [PubMed]
- González, J.C.; Lignani, G.; Maroto, M.; Baldelli, P.; Hernández-Guijo, J.M. Presynaptic muscarinic receptors reduce synaptic depression and facilitate its recovery at hippocampal GABAergic synapses. Cereb. Cortex 2014, 24, 1818–1831. [Google Scholar] [CrossRef] [PubMed]
- Moss, D.E. Improving Anti-Neurodegenerative Benefits of Acetylcholinesterase Inhibitors in Alzheimer’s Disease: Are irreversible inhibitors the future? Int. J. Mol. Sci. 2020, 21, 3438. [Google Scholar] [CrossRef] [PubMed]
- Verma, S.; Kumar, A.; Tripathi, T.; Kumar, A. Muscarinic and nicotinic acetylcholine receptor agonists: Current scenario in Alzheimer’s disease therapy. J. Pharm. Pharmacol. 2018, 70, 985–993. [Google Scholar] [CrossRef] [PubMed]
- Eckenstein, F.; Thoenen, H. Cholinergic neurons in the rat cerebral cortex demonstrated by immunohistochemical localization of choline acetyltransferase. Neurosci. Lett. 1983, 36, 211–215. [Google Scholar] [CrossRef]
- Orta-Salazar, E.; Cuellar-Lemus, C.A.; Díaz-Cintra, S.; Feria-Velasco, A.I. Cholinergic markers in the cortex and hippocampus of some animal species and their correlation to Alzheimer’s disease. Neurologia 2014, 29, 497–503. [Google Scholar] [CrossRef] [PubMed]
- Shute, C.C.; Lewis, P.R. Cholinesterase-containing systems of the brain of the rat. Nature 1963, 199, 1160–1164. [Google Scholar] [CrossRef] [PubMed]
- Eckenstein, F.; Sofroniew, M.V. Identification of central cholinergic neurons containing both choline acetyltransferase and acetylcholinesterase and of central neurons containing only acetylcholinesterase. J. Neurosci. 1983, 3, 2286–2291. [Google Scholar] [CrossRef]
- Martinelli, I.; Tomassoni, D.; Moruzzi, M.; Traini, E.; Amenta, F.; Tayebati, S.K. Obesity and Metabolic Syndrome Affect the Cholinergic Transmission and Cognitive Functions. CNS Neurol. Disord. Drug Targets 2017, 16, 664–676. [Google Scholar] [CrossRef] [PubMed]
- Archer, Z.A.; Mercer, J.G. Brain responses to obesogenic diets and diet-induced obesity. Proc. Nutr. Soc. 2007, 66, 124–130. [Google Scholar] [CrossRef]
- Hariri, N.; Thibault, L. High-fat diet-induced obesity in animal models. Nutr. Res. Rev. 2010, 23, 270–299. [Google Scholar] [CrossRef]
- Ferreira-Vieira, T.H.; Guimaraes, I.M.; Silva, F.R.; Ribeiro, F.M. Alzheimer’s disease: Targeting the Cholinergic System. Curr. Neuropharmacol. 2016, 14, 101–115. [Google Scholar] [CrossRef]
- Caulfield, M.P. Muscarinic receptors–characterization, coupling and function. Pharmacol. Ther. 1993, 58, 319–379. [Google Scholar] [CrossRef]
- Tayebati, S.K.; Amenta, F.; El-Assouad, D.; Zaccheo, D. Muscarinic cholinergic receptor subtypes in the hippocampus of aged rats. Mech. Ageing Dev. 2002, 123, 521–528. [Google Scholar] [CrossRef]
- Lebois, E.P.; Thorn, C.; Edgerton, J.R.; Popiolek, M.; Xi, S. Muscarinic receptor subtype distribution in the central nervous system and relevance to aging and Alzheimer’s disease. Neuropharmacology 2018, 136, 362–373. [Google Scholar] [CrossRef] [PubMed]
- Falk, S.; Lund, C.; Clemmensen, C. Muscarinic receptors in energy homeostasis: Physiology and pharmacology. Basic Clin. Pharmacol. Toxicol. 2020, 126, 66–76. [Google Scholar] [CrossRef]
- Fabian-Fine, R.; Skehel, P.; Errington, M.L.; Davies, H.A.; Sher, E.; Stewart, M.G.; Fine, A. Ultrastructural distribution of the alpha7 nicotinic acetylcholine receptor subunit in rat hippocampus. J. Neurosci. 2001, 21, 7993–8003. [Google Scholar] [CrossRef] [PubMed]
- Martinelli, I.; Micioni Di Bonaventura, M.V.; Moruzzi, M.; Amantini, C.; Maggi, F.; Gabrielli, M.G.; Fruganti, A.; Marchegiani, A.; Dini, F.; Marini, C.; et al. Effects of Prunus cerasus L. seeds and juice on liver steatosis in an animal model of diet-induced obesity. Nutrients 2020, 12, 1308. [Google Scholar] [CrossRef] [PubMed]
- Cocci, P.; Moruzzi, M.; Martinelli, I.; Maggi, F.; Micioni Di Bonaventura, M.V.; Cifani, C.; Mosconi, G.; Tayebati, S.K.; Damiano, S.; Lupidi, G.; et al. Tart cherry (Prunus cerasus L.) dietary supplement modulates visceral adipose tissue CB1 mRNA levels along with other adipogenesis-related genes in rat models of diet-induced obesity. Eur. J. Nutr. 2021, 60, 2695–2707. [Google Scholar] [CrossRef]
- Moruzzi, M.; Klöting, N.; Blüher, M.; Martinelli, I.; Tayebati, S.K.; Gabrielli, M.G.; Roy, P.; Micioni Di Bonaventura, M.V.; Cifani, C.; Lupidi, G.; et al. Tart Cherry Juice and Seeds Affect Pro-Inflammatory Markers in Visceral Adipose Tissue of High-Fat Diet Obese Rats. Molecules 2021, 26, 1403. [Google Scholar] [CrossRef] [PubMed]
- Cifani, C.; Micioni Di Bonaventura, M.V.; Pucci, M.; Giusepponi, M.E.; Romano, A.; Di Francesco, A.; Maccarrone, M.; D’Addario, C. Regulation of hypothalamic neuropeptides gene expression in diet induced obesity resistant rats: Possible targets for obesity prediction? Front. Neurosci. 2015, 9, 187. [Google Scholar] [CrossRef] [PubMed]
- Chang, S.; Graham, B.; Yakubu, F.; Lin, D.; Peters, J.C.; Hill, J.O. Metabolic differences between obesity-prone and obesity-resistant rats. Am. J. Physiol. 1990, 259, R1103–R1110. [Google Scholar] [CrossRef]
- Levin, B.E.; Dunn-Meynell, A.A.; Balkan, B.; Keesey, R.E. Selective breeding for diet-induced obesity and resistance in Sprague Dawley rats. Am. J. Physiol. 1997, 273, R725–R730. [Google Scholar] [CrossRef]
- Levin, B.E.; Hogan, S.; Sullivan, A.C. Initiation and perpetuation of obesity and obesity resistance in rats. Am. J. Physiol. 1989, 256, R766–R771. [Google Scholar] [CrossRef]
- Tayebati, S.K.; El-Assouad, D.; Ricci, A.; Amenta, F. Immunochemical and immunocytochemical characterization of cholinergic markers in human peripheral blood lymphocytes. J. Neuroimmunol. 2002, 132, 147–155. [Google Scholar] [CrossRef]
- Tayebati, S.K.; Di Tullio, M.A.; Tomassoni, D.; Amenta, F. Localization of the m5 muscarinic cholinergic receptor in rat circle of Willis and pial arteries. Neuroscience 2003, 122, 205–211. [Google Scholar] [CrossRef]
- Tayebati, S.K.; Di Tullio, M.A.; Amenta, F. Vesicular acetylcholine transporter (VAChT) in the brain of spontaneously hypertensive rats (SHR): Effect of treatment with an acetylcholinesterase inhibitor. Clin. Exp. Hypertens. 2008, 30, 732–743. [Google Scholar] [CrossRef]
- Tomassoni, D.; Catalani, A.; Cinque, C.; Di Tullio, M.A.; Tayebati, S.K.; Cadoni, A.; Nwankwo, I.E.; Traini, E.; Amenta, F. Effects of cholinergic enhancing drugs on cholinergic transporters in the brain and peripheral blood lymphocytes of spontaneously hypertensive rats. Curr. Alzheimer Res. 2012, 9, 120–127. [Google Scholar] [CrossRef] [PubMed]
- Tomassoni, D.; Micioni Di Bonaventura, M.V.; Fruganti, A.; Dini, F.; Marchegiani, A.; Moruzzi, M.; Giusepponi, M.E.; Turchetti, L.; Marini, M.; Gabrielli, M.G.; et al. Obesity-Related nervous system injury: Preliminary evidences in diet induced obesity (DIO) rats. Ital. J. Anat. Embriol. 2016, 121, 190. [Google Scholar]
- Gurung, S.; Agbaga, M.P.; Myers, D.A. Cognitive differences between Sprague-Dawley rats selectively bred for sensitivity or resistance to diet induced obesity. Behav. Brain Res. 2016, 311, 122–130. [Google Scholar] [CrossRef] [PubMed]
- Sánchez-Sarasúa, S.; Moustafa, S.; García-Avilés, Á.; López-Climent, M.F.; Gómez-Cadenas, A.; Olucha-Bordonau, F.E.; Sánchez Pérez, A.M. The effect of abscisic acid chronic treatment on neuroinflammatory markers and memory in a rat model of high-fat diet induced neuroinflammation. Nutr. Metab. 2016, 13, 73. [Google Scholar] [CrossRef] [PubMed]
- Martins, I.V.; Rivers-Auty, J.; Allan, S.M.; Lawrence, C.B. Mitochondrial Abnormalities and Synaptic Loss Underlie Memory Deficits Seen in Mouse Models of Obesity and Alzheimer’s Disease. J. Alzheimer’s Dis. 2017, 55, 915–932. [Google Scholar] [CrossRef] [PubMed]
- Morganstern, I.; Ye, Z.; Liang, S.; Fagan, S.; Leibowitz, S.F. Involvement of cholinergic mechanisms in the behavioral effects of dietary fat consumption. Brain Res. 2012, 1470, 24–34. [Google Scholar] [CrossRef] [PubMed]
- Ohkuma, S.; Ma, F.H.; Kishi, M.; Kuriyama, K. Alteration of acetylcholine metabolism in the brain of zucker fatty rat. Neurochem. Int. 1990, 16, 99–103. [Google Scholar] [CrossRef]
- Goodman, C.B.; Soliman, K.F. Altered brain cholinergic enzymes activity in the genetically obese rat. Experientia 1991, 47, 833–835. [Google Scholar] [CrossRef]
- Kaizer, R.R.; da Silva, A.C.; Morsch, V.M.; Correa, M.C.; Schetinger, M.R. Diet-induced changes in AChE activity after long-term exposure. Neurochem. Res. 2004, 29, 2251–2255. [Google Scholar] [CrossRef] [PubMed]
- Tel, G.; Ozturk, M.; Duru, M.E.; Harmandar, M.; Topcu, G. Chemical composition of the essential oil and hexane extract of Salvia chionantha and their antioxidant and anticholinesterase activities. Food Chem. Toxicol. 2010, 48, 3189–3193. [Google Scholar] [CrossRef]
- Vajreswari, A.; Rupalatha, M.; Rao, P.S. Effect of altered dietary n-6-to-n-3 fatty acid ratio on erythrocyte lipid composition and membrane-bound enzymes. J. Nutr. Sci. Vitaminol. 2002, 48, 365–370. [Google Scholar] [CrossRef] [PubMed][Green Version]
- Luyer, M.D.; Greve, J.W.M.; Hadfoune, M.; Jacobs, J.; Dejong, C.H.; Buurman, W.A. Nutritional stimulation of cholecystokinin receptors inhibits inflammation via the vagus nerve. J. Exp. Med. 2005, 202, 1023–1029. [Google Scholar] [CrossRef] [PubMed]
- Wang, H.; Yu, M.; Ochani, M.; Amella, C.A.; Tanovic, M.; Susarla, S.; Li, J.H.; Wang, H.; Yang, H.; Ulloa, L.; et al. Nicotinic acetylcholine receptor α7 subunit is an essential regulator of inflammation. Nature 2002, 421, 384–388. [Google Scholar] [CrossRef] [PubMed]
- Souza, A.C.P.; Souza, C.M.; Amaral, C.L.; Lemes, S.F.; Santucci, L.F.; Milanski, M.; Torsoni, A.S.; Torsoni, M.A. Short-term high-fat diet consumption reduces hypothalamic expression of the nicotinic acetylcholine receptor α7 subunit (α7nachr) and affects the anti-inflammatory response in a mouse model of sepsis. Front. Immunol. 2019, 10, 565. [Google Scholar] [CrossRef] [PubMed]
- Martins, I.C.A.; Contieri, L.S.; Amaral, C.L.; Costa, S.O.; Souza, A.C.P.; Ignacio-Souza, L.M.; Milanski, M.; Torsoni, A.S.; Torsoni, M.A. Omega-3 supplementation prevents short-term high-fat diet effects on the α7 nicotinic cholinergic receptor expression and inflammatory response. Mediat. Inflamm. 2021, 2021, 5526940. [Google Scholar] [CrossRef] [PubMed]
- Xu, Z.Q.; Zhang, W.J.; Su, D.F.; Zhang, G.Q.; Miao, C.Y. Cellular responses and functions of α7 nicotinic acetylcholine receptor activation in the brain: A narrative review. Ann. Transl. Med. 2021, 9, 509. [Google Scholar] [CrossRef] [PubMed]
- Jiang, S.; Li, Y.; Zhang, C.; Zhao, Y.; Bu, G.; Xu, H.; Zhang, Y.W. M1 muscarinic acetylcholine receptor in Alzheimer’s disease. Neurosci. Bull. 2014, 30, 295–307. [Google Scholar] [CrossRef] [PubMed]
- Silva, M.F.P.; Alves, P.L.; Alponti, R.F.; Silveira, P.F.; Abdalla, F.M.F. Effects of obesity induced by high-calorie diet and its treatment with exenatide on muscarinic acetylcholine receptors in rat hippocampus. Biochem. Pharmacol. 2019, 169, 113630. [Google Scholar] [CrossRef]
- Gireesh, G.; Kumar, T.P.; Mathew, J.; Paulose, C. Enhanced muscarinic M1 receptor gene expression in the corpus striatum of streptozotocin-induced diabetic rats. J. Biomed. Sci. 2009, 16, 38. [Google Scholar] [CrossRef] [PubMed]
- Guan, Z.Z. Cross-talk between oxidative stress and modifications of cholinergic and glutaminergic receptors in the pathogenesis of Alzheimer’s disease. Acta Pharmacol. Sin. 2008, 29, 773–780. [Google Scholar] [CrossRef] [PubMed]
Publisher’s Note: MDPI stays neutral with regard to jurisdictional claims in published maps and institutional affiliations. |
© 2022 by the authors. Licensee MDPI, Basel, Switzerland. This article is an open access article distributed under the terms and conditions of the Creative Commons Attribution (CC BY) license (https://creativecommons.org/licenses/by/4.0/).