
Evidence Update on the Relationship between Diet and the Most Common Cancers from the European Prospective Investigation into Cancer and Nutrition (EPIC) Study: A Systematic Review

 , , , , ,
Abstract
1. Introduction
2. Materials and Methods
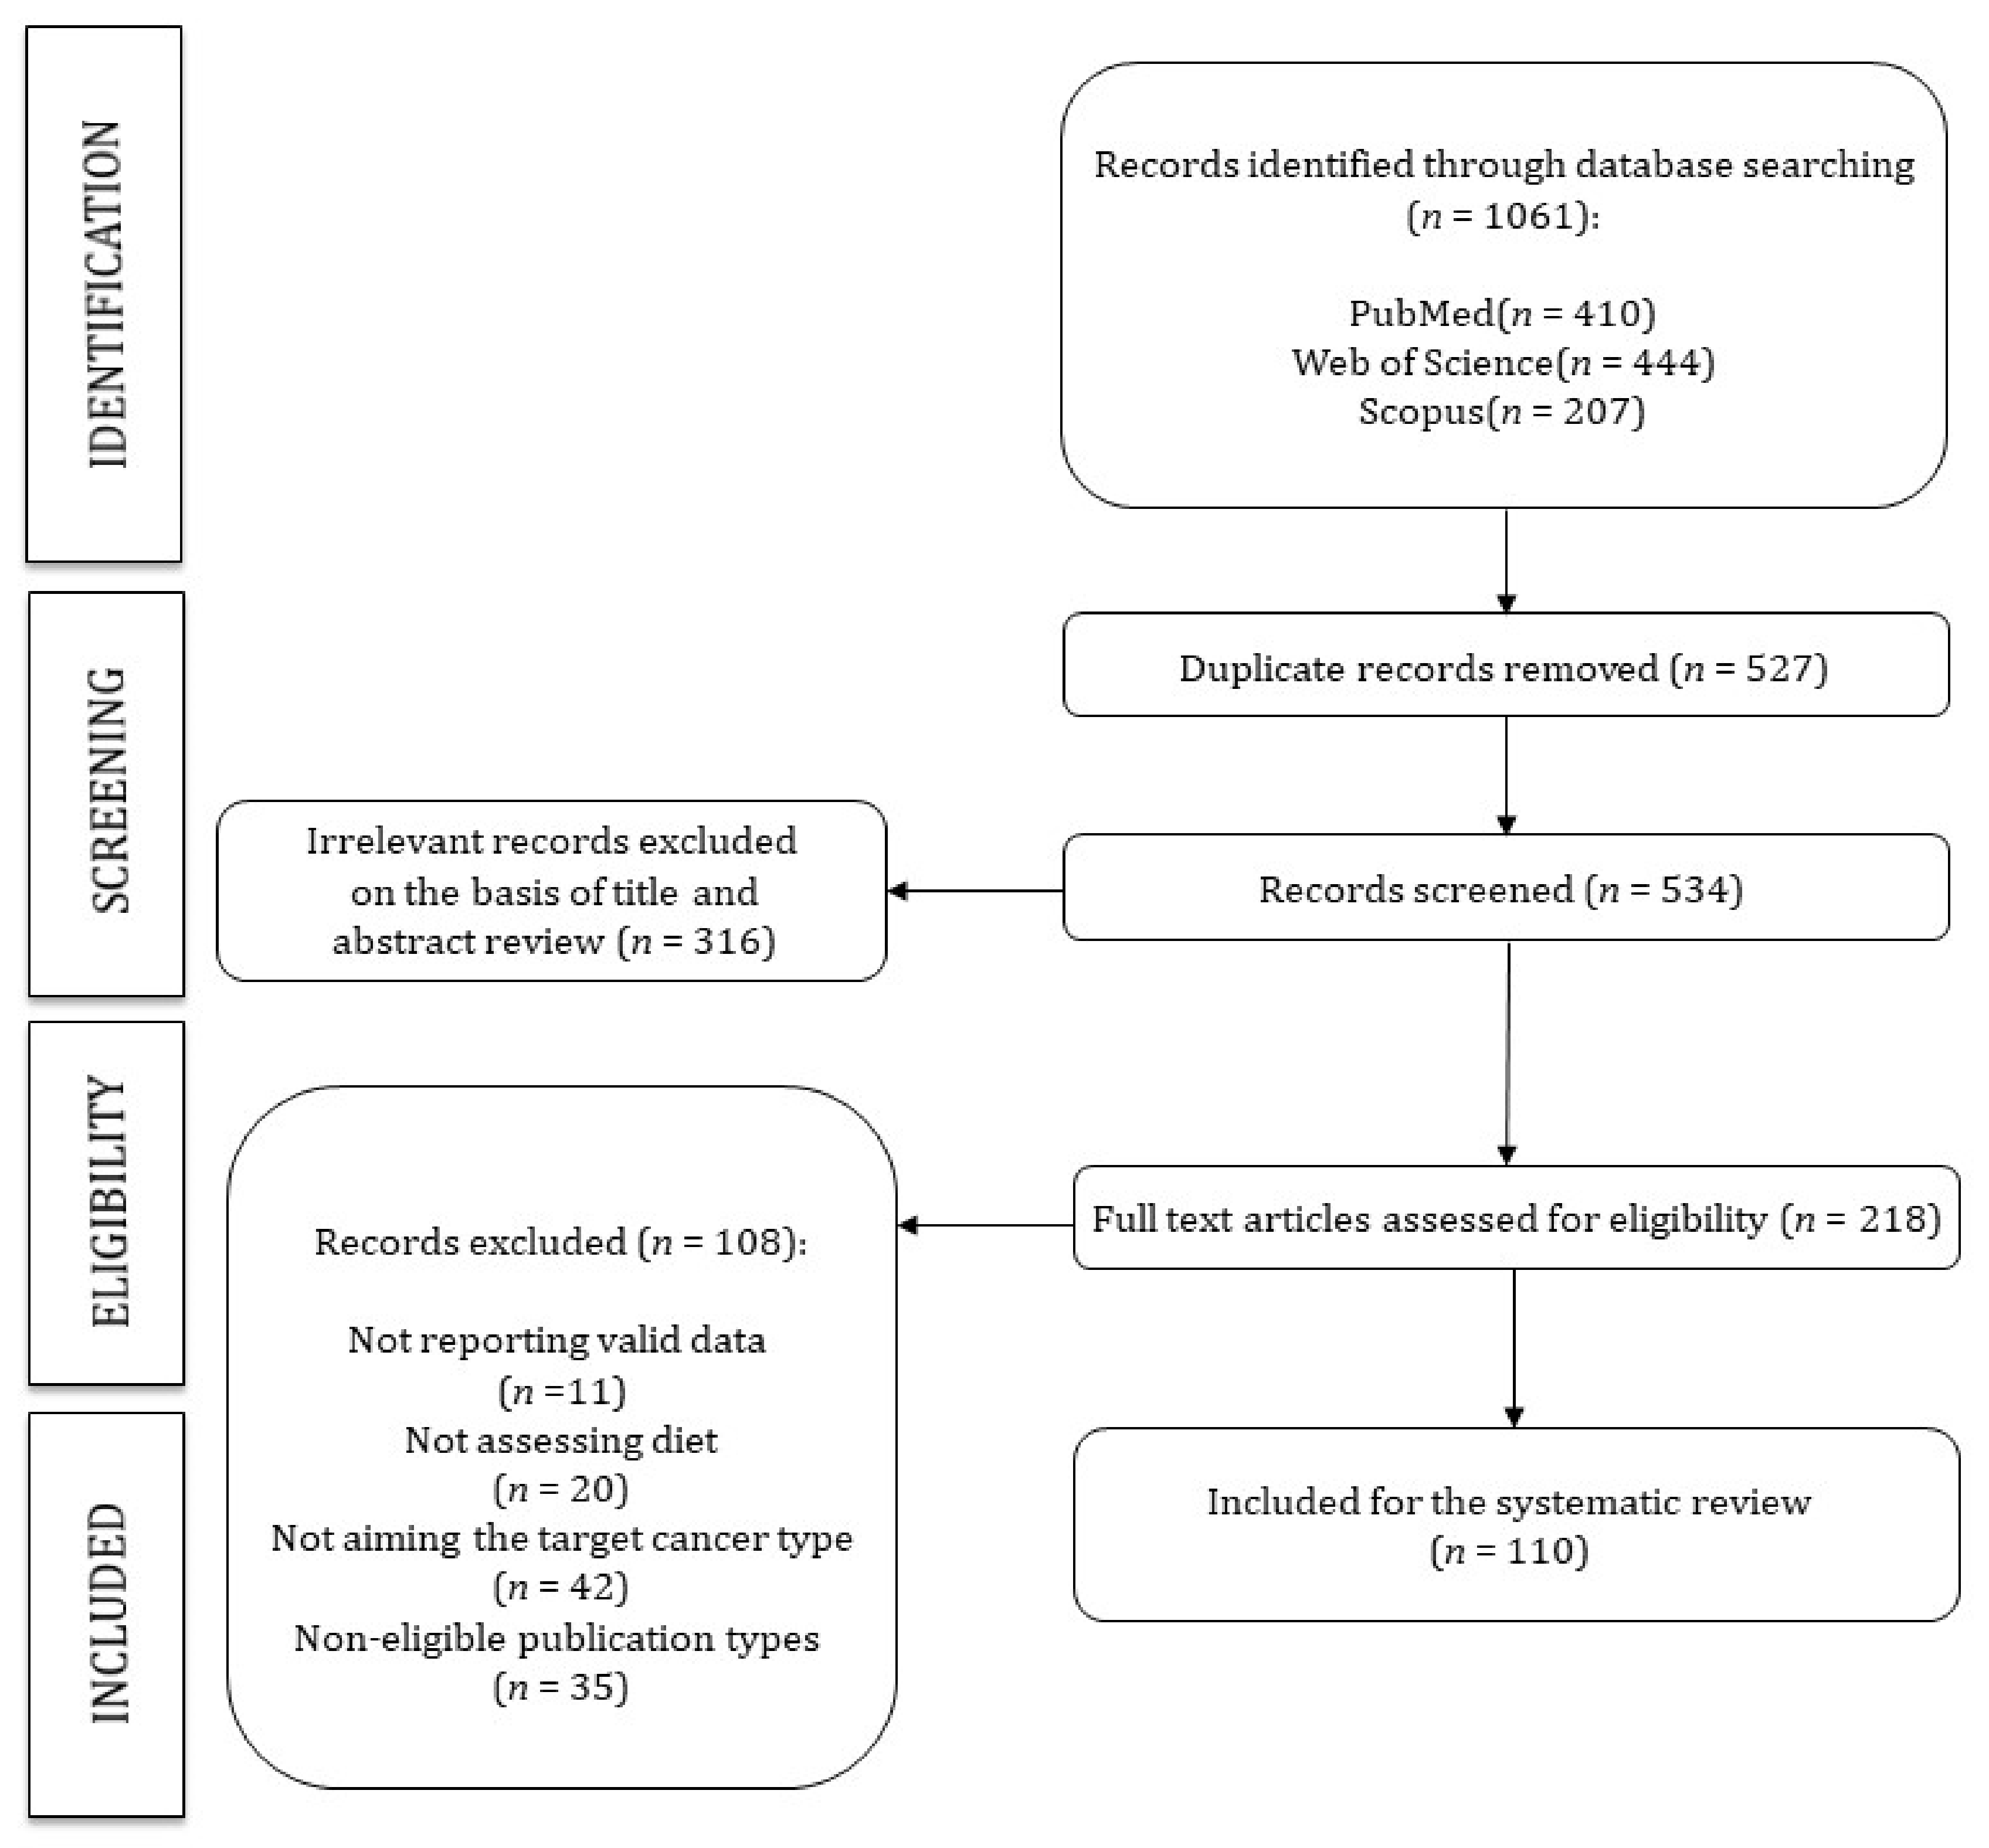
2.1. Search Strategy
2.2. Study Selection
2.3. Data Extration and Quality Assessment
2.4. Data Synthesis
3. Results
3.1. Study Quality
3.2. Colorectal Cancer

| Wholegrains, Vegetables, and Fruit | |||
|---|---|---|---|
| No. of Cases (Non-Cases) | Mean Follow-Up (Years) | Results, Relative Risk (95% Confidence Interval (CI)) | Reference |
| 1329 (476,711) | 5.1 | The data showed no association between higher intake of nuts and seeds and risk of colorectal, colon, and rectal cancers in men and women combined, but a significant inverse association was observed in subgroup analyses for colon cancer in women at the highest (>6.2 g/d) vs. the lowest: HR 0.69 (0.50–0.95) category of intake, and for the linear effect of log-transformed intake: HR 0.89 (0.80–0.98), with no associations in men. | Jenab 2004 [26] |
| 1721 (518,257) | 6.2 | The association between fiber and colorectal cancer was significant: HR 0.79 (0.63–0.99) | Bingham 2005 [24] |
| 2819 (449,936) | 8.8 | Combined consumption of fruit and vegetables was inversely associated with colorectal cancer risk (highest vs. lowest EPIC-wide quintile of consumption): HR 0.86 (0.75–1.00), P trend = 0.04. No association between fruit or vegetable consumption was observed. | van Duijnhoven 2009 [21] |
| 4517 (472,795) | 11.0 | Total dietary fibre: HR 0.87 (0.79–0.96) per 10 g/day increase in fibre. | Murphy 2012 [25] |
| 3370 (518,078) | 13.0 | A lower risk of colon cancer was observed with higher self-reported consumption of fruit and vegetables combined (highest vs. lowest quartile): HR 0.87 (0.75–1.01) P trend = 0.02, but no consistent association was observed for separate consumption of fruits and vegetables. Variety in consumption of fruits and vegetables was not associated with a lower risk of colon or rectal cancer. | Leenders 2015 [22] |
| Meat, Fish, Dairy Products, and Preservation/Processing of Foods | |||
| No. of Cases (Non-Cases) | Mean Follow-Up (YEARS) | Results, Relative Risk (95% Confidence Interval (CI)) | Reference |
| 1329 (476,711) | 4.8 | Intake of red and processed meat: HR 1.35 (0.96–1.88) highest vs. lowest intake; P trend = 0.03 Red and processed meat calibrated: HR 1.55 (1.19–2.02); P trend = 0.001 per 100-g increase. Intake of fish (>80 g/day vs. <10 g/day): HR 0.69 (0.54–0.88); P trend < 0.001. Fish calibrated: HR 0.46 (0.27–0.77) P trend = 0.003 per 100-g increase. | Norat 2005 [28] |
| 1248 (518,752) | 3.9 | Greater dietary intake of calcium was associated with a lower colorectal cancer risk: IRR 0.69 (0.50–0.96). | Jenab 2010 [30] |
| 861 (25,639) | NR | There was an interaction between red and processed meat intake and MGMT Ile143Val polymorphism on colorectal cancer risk (P interaction = 0.04): For individuals who carried the variant genotype with higher red and processed meat intake (above median) risk was increased: OR 1.43 (0.82–2.48), compared with those with the common genotype and lower red and processed meat intake (below median). Amongst the common genotype group with higher red and processed meat intake suggested an inverse association: OR 0.75 (0.55–1.01). | Loh 2010 [53] |
| 2050 (23,490) | 11.0 | Dietary calcium intake was inversely but not statistically significantly associated with colorectal cancer mortality: HR for per 100 mg increase in intake 0.95 (0.88–1.02). | Li 2011 [54] |
| 289 (44,952) | 12.0 | Yogurt intake: HR 0.65 (0.48–0.89) highest vs. lowest tertile. | Pala 2011 [32] |
| 4513 (472,609) | 11.0 | Total milk consumption: HR 0.93 (0.89–0.98) per 200 g/day Whole-fat milk: HR 0.90 (0.82–0.99) per 200 g/day Skimmed milk: HR 0.90 (0.79–1.02) per 200 g/day Dietary calcium: HR 0.95 (0.91–0.99) per 200 mg/day; no association observed for non-dairy calcium sources (HR 1.00, 0.81–1.24) per 200 mg/day. | Murphy 2013 [31] |
| 421 (46,297) | 11.0 | Consumption of yogurt (highest vs. lowest tertile): RR 0.65 (0.48–0.89) P trend = 0.002 | Sieri 2015 [33] |
| 3789 (516,189) | 4.1 | Pre-diagnostic red meat, processed meat or fibre intakes (defined as quartiles and continuous grams per day) were not associated with colorectal cancer mortality among colorectal cancer survivors; however, a marginal trend across quartiles of processed meat was detected (P = 0.053). | Ward 2016 [29] |
| 6291 (460,869) | 14.9 | Inversely associated with colorectal cancer incidence (highest vs. lowest quintile): Total fish: HR 0.88 (0.80–0.96) P trend = 0.005 Fatty fish: HR 0.90 (0.82–0.98) P trend = 0.009 Lean fish: HR 0.91 (0.83–1.00) P trend = 0.016 Total n-3 LC-PUFA: HR 0.86 (0.78–0.95) P trend = 0.010 Associated with increased risk of colorectal cancer (highest vs. lowest quintile): Dietary ratio of n-6:n-3 LC-PUFA: HR 1.31 (1.18–1.45) P trend < 0.001 | Aglago 2020 [27] |
| 1069 (469,869) | 6.4 | Subjects with higher concentrations of red blood cell stearic acid were at higher risk for colorectal cancer (per 1 mol%): OR 1.23 (1.07–1.42). Conversely, colorectal cancer incidence decreased with increasing proportions of red blood cell n-3 PUFA, particularly eicosapentaenoic acid (per 1 mol%): OR 0.75 (0.62–0.92). | Linseisen 2021 [55] |
| Dietary Patterns | |||
| No. of Cases (Non-Cases) | Mean Follow-Up (Years) | Results, Relative Risk (95% Confidence Interval (CI)) | Reference |
| 172 (99,828) | 6.3 | The meat-eaters pattern (meat, poultry, and margarine) was positively associated with colorectal cancer risk (highest vs. lowest quintile): RR 1.58 (0.98–2.53) P trend = 0.02 | Kesse 2006 [56] |
| 290 (63,260) | NR | For colorectal cancer in vegetarians compared with meat eaters: IRR 1.39 (1.01–1.91). Comparing vegetarians with nonvegetarians, the risk of colorectal cancer was significantly higher among vegetarians: IRR 1.49 (1.09–2.03). | Key 2009 [57] |
| 435 (44,840) | 11.28 | The Italian Mediterranean Index was inversely associated with colorectal cancer risk (highest vs. lowest category): HR 0.50 (0.35–0.71) P trend = 0.043. Highest Italian Mediterranean Index score was also significantly associated with reduced risks of any colon cancer: HR 0.54 (0.36–0.81), distal colon cancer: HR 0.44 (0.26–0.75), and rectal cancer: HR 0.41 (0.20–0.81), but not of proximal colon cancer. | Agnoli 2013 [34] |
| 4355 (516,975) | 11.6 | A decreased risk of colorectal cancer was estimated when comparing the highest (scores 6–9) with the lowest (scores 0–3) adherence to the Centre-Specific Modified Mediterranean diet score and the Modified Mediterranean diet score: HR 0.92 (0.84–1.00) and HR 0.89 (0.80–0.99), respectively. A 2-unit increment in either Mediterranean scale was associated with a borderline statistically significant reduction in colorectal cancer risk (for the Modified Mediterranean diet score): HR 0.96 (0.92–1.00) | Bamia 2013 [35] |
| 421 (46,297) | 11.0 | Adherence to Mediterranean diet (highest vs. lowest quartile): RR 0.50 (0.35–0.71) P trend = 0.043 | Sieri 2015 [33] |
| 5806 (421,701) | 15.3 | A higher Food Standards Agency nutrient profiling system dietary index (FSAm-NPS DI) score (lower nutritional quality diet) was associated with a higher risk of colorectal cancer (highest fifth vs. lowest quintile): HR 1.11 (1.01–1.22) P trend = 0.02 | Deschasaux 2018 [36] |
| 5991(470,169) | 14.0 | More proinflammatory diets were related to a higher colorectal cancer risk, particularly for colon cancer: Inflammatory Score of the Diet quartile (highest vs. lowest quintile): HR 1.15 (1.04–1.27) for colorectal cancer risk, HR 1.24 (1.09–1.41) for colon cancer, and HR 0.99 (0.83–1.17) for rectal cancer. Associations were more pronounced in men and not significant in women. The inflammatory profile score of the diet was associated with colorectal cancer risk, particularly colon cancer among men (highest vs. lowest quintile): HR 1.62 (1.31–2.01) for colon cancer overall, and HR 2.11 (1.50–2.97) for colon cancer in men. | Jakszyn 2020 [37] |
| Alcoholic and Non-Alcoholic Drinks | |||
| No. of Cases (Non-Cases) | Mean Follow-Up (Years) | Results, Relative Risk (95% Confidence Interval (CI)) | Reference |
| 1833 (476,899) | 6.2 | Lifetime alcohol intake was significantly positively associated to colorectal cancer risk (for 15 g/day increase): HR 1.08 (1.04–1.12). Baseline alcohol was significantly positively associated to colorectal cancer risk (for 15 g/day increase): HR 1.09 (1.05–1.13). The colorectal cancer risk for beer (HR 1.38, 1.08–1.77) was higher than wine (HR 1.21, 1.02–1.44). | Ferrari 2007 [42] |
| 407 (23,837) | 11.0 | Total alcohol consumption: HR 0.70 (0.44–1.13) for alcohol consumption of ≥21 units/week compared with non-drinkers; P trend = 0.14 (not associated with colorectal cancer). Daily consumption of ≥1 unit of wine: HR 0.61 (0.40–0.94) P trend = 0.04 | Park 2009 [43] |
| 1367 (NR) | 3.6 | Among individuals drinking <30 g alcohol/day (highest vs. lowest quintile of folate status): For males: RR 0.79 (0.52–1.23) P trend = 0.19) For females: RR 0.96 (0.67–1.37) P trend = 0.73) Among those drinking >30 g alcohol/day (highest vs. lowest quintile of folate status): For males: RR 0.91 (0.47–1.75) P trend = 0.87 For females: RR 2.59 (0.53–1.75) P trend = 0.47 | Eussen, Vollset, Igland 2010 [41] |
| 3759 (343,478) | 12.0 | Alcohol consumption: HR 0.87 (0.81–0.94) | Aleksandrova 2014 [40] |
| NR (521,330) | 16.4 | Total soft drink consumption was positively associated with colorectal cancer deaths (≥1 glass per day vs. <1 glass per month): HR 1.25 (1.07–1.47) P = 0.0047, with statistically non-significant associations found for sugar-sweetened and artificially sweetened soft drinks. | Mullee 2019 [44] |
| 6291 (515,039) | 14.9 | Greater alcohol consumption was associated with an increased risk of colorectal cancer (per 15-g/day increment): HR 1.05 (1.03–1.07). | Murphy 2019 [39] |
| 154 (45,339) | 14.0 | An increase in rectal cancer risk among subjects drinking more than 3 drinks/day of alcohol compared with drinkers of less than 1 drink/day of alcohol: HR 1.74 (1.08–2.80) | Bendinelli 2020 [38] |
| Other Dietary Exposures | |||
| No. of Cases (Non-Cases) | Mean Follow-Up (Years) | Results, Relative Risk (95% Confidence Interval (CI)) | Reference |
| 1078 (518,922) | 3.7 | Serum C-peptide concentration was positively associated with an increased colorectal cancer risk (highest vs. lowest quintile): OR 1.37 (1.00–1.88) P trend = 0.10 The cancer risk was stronger for colon: OR 1.67 (1.14–2.46) P trend < 0.01; than for rectal cancer: OR 1.42 (0.90–2.25) P trend = 0.35 | Jenab 2007 [58] |
| 1365 (NR) | 3.6 | The relative risks comparing highest to lowest quintile were: Vitamin B2: RR 0.71 (0.56–0.91) P trend = 0.02 Vitamin B6: RR 0.68 (0.53–0.87) P trend < 0.001 Vitamin B12: RR 1.02 (0.80–1.29) P trend = 0.19 | Eussen, Vollset, Hustad 2010 [47] |
| 1367 (NR) | 3.6 | Folate status (highest vs. lowest quintile): RR 0.94 (0.74–1.20) P trend = 0.44 Individuals living in Northern European countries showed an inverse association between plasma folate and rectal cancer risk (highest vs. lowest folate concentrations): RR 0.56 (0.29–1.09) P trend = 0.04 | Eussen, Vollset, Igland 2010 [41] |
| 1248 (518,752) | 3.9 | The cancer risks associated with 10% higher level of circulating 25-(OH)D were: colorectal HR 0.97 (0.95 to 0.99); colon HR 0.95 (0.93 to 0.98); rectum HR 1.00 (0.97 to 1.03). Lower levels of concentration of 25-(OH)D were associated with higher colorectal cancer risk: <25.0 nmol/L: IRR 1.32 (0.87–2.01); and 25.0–49.9 nmol/L: IRR 1.28 (1.05–1.56) Higher concentrations of 25-(OH)D were associated with lower risk: 75.0–99.9 nmol/L: IRR 0.88 (0.68–1.13); and ≥100.0 nmol/L: 0.77 (0.56–1.06) | Jenab 2010 [30] |
| 861 (25,639) | NR | Individuals who carried the variant genotype with higher vitamin E intake had a lower OR of 0.46 (0.26–0.82) whereas those with lower vitamin E intake had an OR of 1.46 (0.98–2.18) compared with those with the common genotype and lower vitamin E intake (P interaction = 0.009). Similarly, the variant genotype group with higher intake of carotene had an inverse association for colorectal cancer in contrast to the common genotype group, with lower carotene intake: OR 0.39 (0.21–0.71) P interaction = 0.005 | Loh 2010 [53] |
| 221 (886) | 9 | Phyto-oestrogen intake not associated with colorectal cancer among men. Among women: Enterolactone intake: OR 0.33 (0.14–0.74); P trend = 0.008 Total enterolignans intake: OR 0.32 (0.13–0.79); P trend = 0.013 Secoisolariciresinol intake: OR 1.60 (0.96–2.69); P trend = 0.074 | Ward 2010 [59] |
| 1202 (518,798) | 6.1 | Participants with 25(OH)D levels in the highest quintile had an HR of 0.69 (0.50–0.93) for colorectal cancer mortality. | Fedirko 2012 [46] |
| 1372 (384,375) | 12.0 | Incidence rate ratio of distal colon cancer of plasma total alkylresorcinols (highest vs. lowest quartile): IRR 0.48 (0.28–0.83). | Kyrø 2014 [49] |
| 1399 (520,049) | 4.5 | An association was observed between higher prediagnostic plasma retinol concentration and a lower risk of colon cancer (highest vs. lowest quartile): IRR 0.63 (0.46–0.87) P trend = 0.01. Dietary b-carotene showed an inverse association with colon cancer (highest vs. lowest quartile): OR 0.69 (0.52–0.94) P trend = 0.02. Dietary vitamin C was inversely associated with risk of distal colon cancer (highest vs. lowest quartile): OR 0.60 (0.39–0.93) P trend = 0.02. Dietary vitamin E showed an inverse association with risk of distal colon cancer (highest vs. lowest quartile): OR 0.65 (0.42–0.99) P trend = 0.04. | Leenders 2014 [48] |
| 1367 (NR) | 3.7 | Plasma methionine: OR 0.79 (0.63–0.99); P trend = 0.05 Plasma choline: OR 0.77 (0.60–0.99); P trend = 0.07 Plasma betaine: OR 0.85 (0.66–1.09); P trend = 0.06 | Nitter 2014 [50] |
| 966 (520,482) | 3.9 | Higher selenium concentrations were associated with a non-significant lower colorectal cancer risk (per 25 lg/L increase): IRR 0.92 (0.82–1.03) | Hughes 2015 [60] |
| 421 (46,297) | 11.0 | Glycemic index (highest vs. lowest category): RR 1.35 (1.03–1.78) P trend = 0.031 | Sieri 2015 [33] |
| 434 (44,758) | 11.28 | No significant association between dietary total antioxidant capacity and colorectal cancer: HR 0.88 (0.65–1.19) highest category vs. lowest; P trend = 0.353 Dietary total antioxidant capacity in colon cancer (highest vs. lowest tertile): HR 0.63 (0.44–0.89) P trend = 0.008 Dietary total antioxidant capacity in rectal cancer (highest vs. lowest tertile): HR 2.48 (1.32–4.66) P trend = 0.007 Intakes of vitamin C, vitamin E, and ß-carotene not significantly associated with colorectal cancer risk. | Vece 2015 [61] |
| 4517 (472,795) | 11.3 | Nutrient pattern characterised by high intakes of vitamins and minerals: HR 0.94 (0.92–0.98) per 1 SD. Pattern characterised by total protein, riboflavin, phosphorus and calcium: HR 0.96 (0.93–0.99) per 1 SD. The remaining two patterns were not significantly associated with colorectal cancer risk. | Moskal 2016 [62] |
| 966 (NR) | NR | Circulating concentration of copper (highest vs. lowest quintile): OR 1.50 (1.06–2.13) P trend = 0.02 Circulating concentration of zinc (highest vs. lowest quintile): OR 0.65 (0.43–0.97) P trend = 0.07 Ratio of copper/zinc (highest vs. lowest quintile): OR 1.70 (1.20–2.40) P trend = 0.0005 | Stepien 2017 [52] |
| 4517 (472,795) | 11 | No association between total flavonoid intake and the risk of overall colorectal cancer or any subtype. Total dietary flavonoid intake (highest vs. lowest quintile): HR 1.05 (0.93–1.18) P trend = 0.58 No association with any intake of individual flavonoid subclasses. | Zamora-Ros 2017 [63] |
| 5991 (470,169) | 13.9 | Total dietary polyphenol intake (as a continuous variable) in women: HR 1.06 (0.99–1.14) Total dietary polyphenol intake (as a continuous variable) in men: HR 0.97 (0.90–1.11) | Zamora-Ros 2018 [64] |
| 1043 (518,957) | 8.3 | Results for colorectal cancer mortality associated with deficient relative to sufficient 25(OH)D concentrations were: HR 2.24 (1.44–3.49) among cases with the vitamin D-binding protein isoform. HR 0.94 (0.68–1.22) among cases without vitamin D-binding protein. | Gibbs 2020 [45] |
| 1608 (NR) | 7.7 | Fatty acids: OR 0.51 (0.29–0.90) per unit increase Endogenous metabolites: OR 0.62 (0.50–0.78) per unit change. | Rothwell 2020 [51] |
3.3. Breast Cancer
| Wholegrains, Vegetables, and Fruit | |||
|---|---|---|---|
| No. of Cases (Non-Cases) | Mean Follow-Up (Years) | Results, Relative Risk (95% Confidence Interval (CI)) | Reference |
| 3659 (281,867) | 5.4 | No significant associations between vegetable or fruit intake and breast cancer risk (highest vs. lowest quintile): Total vegetable intake: RR 0.98 (0.84–1.14) P trend = 0.65 Total fruit intake: RR 1.09 (0.94–1.25) P trend = 0.11 Fruit and vegetable juices intake: RR 1.05 (0.92–1.20) P trend = 0.51 | van Gils 2005 [68] |
| 1355 (33,116) | 7.0 | There was a statistically higher risk of breast cancer with: Low consumption of fruit and vegetables: HR 1.76 (1.10–2.82) | Engeset 2009 [65] |
| 3747 (110,757) | 9.5 | Grapefruit intake (≥60 g/day vs. none intake): HR 0.93 (0.77–1.13) P trend = 0.5 | Spencer 2009 [87] |
| 1256 (62,699) | 9.0 | Olive oil intake (highest vs. lowest tertile of g/day/2000 kcal): HR 1.10 (0.92–1.31). There was no association between olive oil and risk of oestrogen or progesterone receptor-positive tumors, but a suggestion of a negative association with oestrogen and progesterone receptor-negative tumors. | Buckland 2012 [88] |
| 1072 (30,438) | 11.25 | Inverse association between consumption of all vegetables and breast cancer risk (highest vs. lowest quintile): Vegetables (all types): HR 0.65 (0.53–0.81) P trend = 0.003 According to subtypes of vegetables, inverse association between increasing consumption of leafy vegetables, fruiting vegetables and raw tomatoes (highest vs. lowest quintile): Leafy vegetables all types: HR 0.70 (0.57–0.86) P trend = 0.0001 Fruiting vegetables: HR 0.75 (0.60–0.94) P trend = 0.01 Raw tomatoes: HR 0.82 (0.66–1.01) P = trend 0.03 No association between fruit, overall or by subtypes, and breast cancer risk. | Masala 2012 [67] |
| 11,576 (323,273) | 11.5 | Breast cancer risk was inversely associated with intakes of total dietary fiber (highest vs. lowest quintile): HR 0.95 (0.89–1.01) P trend = 0.03, and fiber from vegetables: HR 0.90 (0.84–0.96) P trend = 0.01, but not with fiber from fruit, cereals, or legumes. For vegetable fiber, stronger associations were observed for oestrogen-receptor–negative and progesterone-receptor–negative (highest vs. lowest quintile): HR 0.74 (0.59–0.93) P trend = 0.01, than for oestrogen-receptor–positive and progesterone-receptor–positive tumors: HR 0.92 (0.81–1.03) P trend = 0.05 | Ferrari 2013 [69] |
| 879 (46,297) | 11.0 | Consumption of vegetables (highest vs. lowest quintile): RR 0.65 (0.53–0.81) P trend = 0.003 | Sieri 2015 [33] |
| 10,197 (324,857) | 11.5 | Vegetable intake was associated with a lower risk of breast cancer (highest vs. lowest quintile): HR 0.87 (0.80–0.94). Although the inverse association was most apparent for oestrogen and progesterone receptor–negative breast cancer (highest vs. lowest quintile): HR 0.74 (0.57–0.96) P trend = 0.03, and oestrogen and progesterone receptor–positive breast cancer: HR 0.91(0.79–1.05) P trend = 0.14. Fruit intake was not significantly associated with total and hormone receptor-defined breast cancer risk. | Emaus 2016 [66] |
| 10,979 (261,119) | 15.0 | Intakes of fibre (for a 1 SD increment in intake): HR 0.96 (0.94–0.98) Intakes of apple/pear (for a 1 SD increment in intake): HR 0.96 (0.94–0.99) Intakes of carbohydrates (for a 1 SD increment in intake): HR 0.96 (0.95–0.98) | Heath 2020 [76] |
| Meat, Fish, Dairy Products, and Preservation/Processing of Foods | |||
| No. of Cases (Non-Cases) | Mean Follow-Up (Years) | Results, Relative Risk (95% Confidence Interval (CI)) | Reference |
| 4776 (305,895) | 6.4 | No significant associations between intake of total fish and breast cancer risk were observed (per 10 g fish/day): HR 1.01 (0.99–1.02). When examining lean and fatty fish separately, a positive significant association only in the highest quintile for fatty fish was found (HR 1.13, 1.01–1.26), but test for trend was not significant (p = 0.10). | Engeset 2006 [70] |
| 1355 (33,116) | 7.0 | There was a statistically higher risk of breast cancer with: Low consumption of fatty fish: HR 1.80 (1.17–2.78) | Engeset 2009 [65] |
| 7119 (312,707) | 8.8 | Processed meat consumption (highest vs. lowest quintile): HR 1.10 (1.00–1.20) P trend = 0.07 | Pala 2009 [71] |
| 861 (25,639) | NR | There was no significant joint effect of red and processed meat intake and genotype polymorphism on the risks for breast cancer. | Loh 2010 [53] |
| 7760 (312,225) | 8.8 | Calcium intake (highest vs. lowest quintile): HR 0.91 (0.83–1.01). | Abbas 2013 [72] |
| Dietary Patterns | |||
| No. of Cases (Non-Cases) | Mean Follow-up (years) | Results, Relative Risk (95% Confidence Interval (CI)) | Reference |
| 585 (37,058) | 7.4 | Vegetarian population compared to nonvegetarians presented a HR of 0.91 (0.72–1.14) for breast cancer risk (P trend = 0.40) | Travis 2008 [75] |
| 240 (14,567) | 9.8 | Mediterranean diet score (for 2-point increment): HR 0.88 (0.75–1.03) P trend = 0.12 Mediterranean diet score in premenopausal women (for 2-point increment): HR 1.01 (0.80–1.28) Mediterranean diet score in postmenopausal women (for 2-point increment): HR 0.78 (0.62–0.98) | Trichopoulou 2010 [73] |
| 10,225 (324,837) | 11.0 | The adapted relative Mediterranean diet was inversely associated with the risk of breast cancer overall and in postmenopausal women (highest vs. lowest score): HR 0.94 (0.88–1.00) P trend = 0.048 and HR 0.93 (0.87–0.99) P trend = 0.037, respectively. The association was more pronounced in oestrogen and progesterone receptor negative tumors: HR 0.80 (0.65–0.99) P trend = 0.043. | Buckland 2013 [74] |
| 12,063 (421,701) | 15.3 | A higher FSAm-NPS DI score (lower nutritional quality diet) was associated with a higher risk of postmenopausal breast cancer (highest vs. lowest quintile): HR 1.08 (1.00–1.16) P trend = 0.03 | Deschasaux 2018 [36] |
| Alcoholic and Non-Alcoholic Drinks | |||
| No. of Cases (Non-Cases) | Mean Follow-Up (Years) | Results, Relative Risk (95% Confidence Interval (CI)) | Reference |
| 4285 (270,403) | 6.4 | Alcohol intake (per 10 g/d increase): IRR 1.03 (1.01–1.05) | Tjønneland 2007 [89] |
| 1355 (33,116) | 7.0 | There was a statistically higher risk of breast cancer with: High alcohol consumption: HR: 1.74 (1.14–2.68) | Engeset 2009 [65] |
| 861 (25,639) | NR | There was no evidence of a significant interaction between MGMT Ile143Valpolymorphism and alcohol on breast cancer risk. | Loh 2010 [53] |
| 10,198 (324,862) | 11.0 | Caffeinated coffee intake was associated with lower risk of postmenopausal breast cancer (high vs. low consumption): HR 0.90 (0.82–0.98) P trend = 0.029. For every 100 ml increase in caffeinated coffee intake, the risk of oestrogen and progesterone receptor–negative breast cancer was lower: HR 0.96 (0.93–1.00). Non-consumers of decaffeinated coffee had lower risk of postmenopausal breast cancer compared to low consumers: HR 0.89 (0.80–0.99) P trend = 0.128. Exclusive decaffeinated coffee consumption was not related to postmenopausal breast cancer risk, compared to any decaffeinated-low caffeinated intake: HR 0.97 (0.82–1.14), or to no intake of any coffee: HR 0.96 (0.82–1.14). Caffeinated and decaffeinated coffee were not associated with premenopausal breast cancer. Tea intake was neither associated with pre- nor post-menopausal breast cancer. | Bhoo-Pathy 2015 [79] |
| 11,576 (323,274) | 11.0 | Average daily alcohol intake at baseline (per 10 g/day): HR 1.04 (1.03–1.06) p value < 0.001 Significant increasing trends were observed between alcohol intake and tumors. | Romieu 2015 [77] |
| 672 (14,338) | 14.8 | Alcohol consumption higher than 10 g/day: HR 1.30 (1.09–1.54) P trend = 0.007 | Masala 2017 [90] |
| 11,576 (323,274) | 11.0 | For subjects with low intake of fiber (<18.5 g/day), the risk of breast cancer per 10g/day of alcohol intake: HR 1.06 (1.03–1.08). | Romieu 2017 [91] |
| NR (321,081) | 16.4 | Total, sugar-sweetened, and artificially sweetened soft drink consumption was not associated with risk of deaths from breast cancer. | Mullee 2019 [44] |
| 430 (359,570) | 14.0 | Alcohol intake was positively associated with overall breast cancer risk and specifically with oestrogen-receptor-positive tumours with respectively: TE 1.17(1.01–1.35) and TE 1.36(1.08–1.70) for a 1-SD deviation increase of intake. | Assi 2020 [78] |
| 10,979 (261,119) | 15.0 | Intake of alcohol (for a 1 SD increment in intake): HR 1.05 (1.03–1.07) Intake of beer/cider (for a 1 SD increment in intake): HR 1.05 (1.03–1.06) Intake of wine (for a 1 SD increment in intake): HR 1.04 (1.02–1.06) | Heath 2020 [76] |
| Other Dietary Exposures | |||
| No. of Cases (Non-Cases) | Mean Follow-Up (Years) | Results, Relative Risk (95% Confidence Interval (CI)) | Reference |
| 838 (65,041) | 3.4 | Fat intake (highest vs. lowest quartile): RR 1.37 (0.99–1.89) | Thiebaut 2001 [92] |
| 280 (15,275) | 5.2 | Highest intake for isoflavones and lignans (highest vs. lowest quintile): HR 0.98 (0.65–1.48) and HR 0.70 (0.46–1.09), respectively. | Keinan-Boker 2004 [93] |
| 363 (19,571) | 7.0 | The SIn-7 (the ratio between palmitic acid and palmitoleic acid) was inversely associated with breast cancer risk (highest vs. lowest quintile): OR 0.66 (0.41–1.05) P trend = 0.031 For total trans-MUFAs (highest vs. lowest quintile): OR 1.75 (1.08–2.83) P trend = 0.018. We found an increased risk of breast cancer with increasing levels of trans-palmitoleic acid and elaidic acid: OR 2.24 (1.30–3.86) P trend = 0.0016, and OR 1.45 (0.90–2.33) P trend = 0.12, respectively. We also observed a trend toward increased risk of breast cancer associated with increasing levels of trans-linoleic acid: OR 1.55 (0.91–2.63) P trend = 0.10 No significant association was found with either cis-MUFAs, palmitoleic or oleic acids, or cis -linoleic acid. | Chajès 2008 [83] |
| 7119 (312,707) | 8.8 | High saturated fat intake (highest vs. lowest quintile): HR 1.13 (1.00–1.27) P trend = 0.038 | Sieri 2008 [94] |
| 585 (37,058) | 7.4 | Moderate isoflavone intake (median intake 10.8 mg/day): HR 1.08 (0.85–1.38) P trend = 0.65 High isoflavone intake (median intake 31.6 mg/day): HR 1.17 (0.79–1.71) P trend = 0.36 | Travis 2008 [75] |
| 366 (19,652) | 7 | No significant associations between breast cancer risk and serum carotenoids, tocopherols and retinol (highest vs. lowest quintile): Serum carotenoids: OR 0.74 (0.47–1.16) P trend = 0.38 Tocopherols: OR 0.68 (0.41–1.10) P trend = 0.26 Retinol: OR 0.85 (0.53–1.35) P trend = 0.34 | Maillard 2010 [95] |
| 7502 (338,493) | 8.8 | Dietary intake of b-carotene, vitamin C and E (highest vs. lowest quintile): In premenopausal women: HR 1.04 (0.85–1.27), HR 1.12 (0.92–1.36) and HR 1.11 (0.84–1.46), respectively. In postmenopausal women: HR 0.93 (0.82–1.04), 0.98 (0.87–1.11) and 0.92 (0.77–1.11) respectively. High intake of b-carotene and vitamin C in postmenopausal women using exogenous hormones (highest vs. lowest quintile): HR 0.79 (0.66–0.96) P trend = 0.06, and HR 0.88 (0.72–1.07) P trend = 0.05, respectively. Overall, dietary intake of b-carotene, vitamin C and E not related to breast cancer risk in neither pre- nor postmenopausal women. | Nagel 2010 [96] |
| 244 (941) | 9.0 | Phytoestrogen intake not associated with breast cancer among women. | Ward 2010 [59] |
| 11,576 (323,273) | 11.5 | In postmenopausal women with oestrogen-receptor–negative breast cancer: Glycemic load (highest vs. lowest quintile): HR 1.36 (1.02–1.82) P trend = 0.010 Carbohydate intake (highest vs. lowest quintile): HR 1.41 (1.05–1.89) P trend = 0.009 Further stratification by progesterone receptor status showed slightly stronger associations with ER⁻/PR⁻ breast cancer (highest vs. lowest quintile): HR 1.48 (1.07–2.05) P trend = 0.010 for glycemic load, and HR 1.62 (1.15–2.30) P trend = 0.005 for carbohydrates. | Romieu 2012 [85] |
| 7760 (312,225) | 8.8 | Vitamin D intake (highest vs. lowest quintile): HR 1.04 (0.94–1.14) | Abbas 2013 [72] |
| 879 (25,187) | 11.0 | High dietary glycemic load (highest vs. lowest quintile): RR 1.45 (1.06–1.99) P trend = 0.029 | Sieri 2013 [86] |
| 11,576 (323,274) | 11.5 | Total flavonoids intake (highest vs. lowest quintile): HR 0.97 (0.90–1.04) P trend = 0.591 Isoflavones (highest vs. lowest quintile): HR 1.00 (0.91–1.10) P trend = 0.734 Total lignans intake (highest vs. lowest quintile): HR 1.02 (0.93–1.11) P trend = 0.469 | Zamora-Ros 2013 [97] |
| 11,575 (356,418) | 11.5 | An inverse association was observed between dietary folate and breast cancer risk (highest vs. lowest quintile): HR 0.92 (0.83–1.01) P trend = 0.037. In premenopausal women, we observed a statistically significant trend towards lower risk in oestrogen-receptor-negative breast cancer and progesterone-receptor-negative breast cancer (highest vs. lowest quintile): HR 0.66 (0.45–0.96) P trend = 0.042, and HR 0.70 (0.51–0.97) P trend = 0.021, respectively. A reduction in breast cancer risk was observed when comparing the highest with the lowest dietary folate tertiles in women having a high (>12 alcoholic drinks/week) alcohol intake: HR 0.86 (0.75–0.98). | de Batlle 2015 [98] |
| 11,782 (333,376) | 6.0 | Among postmenopausal women, an intake of lignans was related to a lower risk of dying from breast (highest vs. lowest quartile): HR 0.72 (0.53–0.98). We found no association for other polyphenol classes. | Kyrø 2015 [99] |
| 879 (46,297) | 11.0 | Glycemic load (highest vs. lowest category): RR 1.45 (1.06–1.99) P trend = 0.029 | Sieri 2015 [33] |
| 11,576 (323,274) | 11.5 | A pattern rich in nutrients found in animal foods loading on cholesterol, protein, retinol, vitamins B12, and D was not associated with BC risk. Diet rich in β-carotene, riboflavin, thiamin, vitamins C and B6, fibre, Fe, Ca, K, Mg, P and folate, was inversely associated with BC risk (highest vs. lowest quintile): HR 0.89 (0.83–0.95) P trend < 0.01 | Assi 2016 [80] |
| 1502 (519,966) | 13.0 | A-carotene and b-carotene were inversely associated with risk of oestrogen-receptor–negative breast tumors (highest vs. lowest quintile): OR 0.61 (0.39–0.98), and OR 0.41 (0.26–0.65), respectively. | Bakker 2016 [81] |
| 2982 (516,120) | 11.5 | A high level of palmitoleic acid (highest vs. lowest quartile): OR 1.37 (1.14–1.64) P trend = 0.0001 Levels of industrial trans-fatty acids were positively associated with oestrogen-receptor–negative tumors (highest vs. lowest tertile): OR 2.01(1.03–3.90) P trend = 0.047 No significant association was found between n-3 polyunsaturated fatty acids and breast cancer risk, overall or by hormonal receptor. | Chajès 2017 [84] |
| 2491 (365,412) | 11.5 | Plasma levels of folate and vitamin B12 not significantly associated with the risk of breast cancer. Vitamin B12 status and breast cancer risk in women consuming above the median value of alcohol intake (highest vs. lowest quartile): OR 1.26 (1.00–1.58) P trend = 0.05 Vitamin B12 status with breast cancer risk in women with plasma folate levels below the median value (highest vs. lowest quartile): OR 1.29 (1.02- 1.62) P trend = 0.03 | Matejcic 2017 [100] |
| 13,241 (305,366) | 8.1 | Dietary total industrial trans fatty acids intake (highest vs. lowest quintile): HR 1.14 (1.06–1.23) P trend = 0.001 Elaidic acid intake (highest vs. lowest quintile): HR 1.14 (1.06–1.23) P trend = 0.001 Dietary total ruminant trans fatty acids intake (highest vs. lowest quintile): HR 1.09 (1.01–1.17) P trend = 0.015 Conjugated linoleic acid intake (highest vs. lowest quintile): HR 1.11 (1.03–1.20) P trend = 0.001 Palmitelaidic acid intake: HR 1.08 (1.01–1.16) P trend = 0.028 | Matta 2021 [82] |
3.4. Lung Cancer
| Wholegrains, Vegetables, and Fruit | |||
|---|---|---|---|
| No. of Cases (Non-Cases) | Mean Follow-Up (Years) | Results, Relative Risk (95% Confidence Interval (CI)) | Reference |
| 860 (477,161) | NR | Fruit consumption (highest vs. lowest quintile): HR 0.60 (0.46–0.78) P trend = 0.0099 No association between vegetable consumption or vegetable subtypes and lung cancer risk. | Miller 2004 [103] |
| 1126 (477,464) | 6.4 | Fruit consumption was significantly inversely associated with lung cancer risk (highest vs. lowest quintile): HR 0.75 (0.49–0.96). Lung cancer risk significantly decreased with higher vegetable consumption (per 100 g/day increase in vegetable intake): HR 0.90 (0.81–0.99) in smokers and HR 0.92 (0.85–0.99) overall. | Linseisen 2007 [102] |
| 1830 (476,705) | 8.7 | A 100 g/day increase in fruit and vegetables consumption was associated with a reduced lung cancer risk: HR 0.94 (0.89–0.99). A 100 g/day increase in fruit consumption was associated with a reduced lung cancer risk: HR 0.94 (0.88–1.01). A 100 g/day increase in vegetables consumption was associated with a reduced lung cancer risk: HR 0.94 (0.83–1.07). | Büchner 2010 [101] |
| Meat, Fish, Dairy Products, and Preservation/Processing of Food | |||
| No. of Cases (Non-Cases) | Mean Follow-Up (Years) | Results, Relative risk (95% Confidence Interval (CI)) | Reference |
| 1822 (476,199) | 8.7 | There were no consistent associations between meat consumption and the risk of lung cancer: Red meat (per 50 g intake/day): RR 1.06 (0.89–1.27) Processed meat (per 50 g g/day): RR 1.13 (0.95–1.34) Consumption of white meat and fish were also not associated with the risk of lung cancer. | Linseisen 2011 [104] |
| Dietary Patterns | |||
| No. of Cases (Non-Cases) | Mean Follow-Up (Years) | Results, Relative Risk (95% Confidence Interval (CI)) | Reference |
| 3654 (421,701) | 15.3 | A higher FSAm-NPS DI score (lower nutritional quality diet) was associated with a higher lung cancer risk in men and women (highest vs. lowest quintile): HR 1.26 (1.06–1.51) P trend = 0.02, and HR 2.33 (1.23–4.43) P trend = 0.008, respectively. | Deschasaux 2018 [36] |
| Alcoholic and Non-Alcoholic Drinks | |||
| No. of Cases (Non-Cases) | Mean Follow-Up (Years) | Results, Relative Risk (95% Confidence Interval (CI)) | Reference |
| 1119 (477,471) | 6.4 | Neither ethanol intake at recruitment nor mean lifelong ethanol intake significantly associated with lung cancer. | Rohrmann 2006 [105] |
| Other Dietary Exposures | |||
| No. of Cases (Non-Cases) | Mean Follow-Up (Years) | Results, Relative risk (95% Confidence Interval (CI)) | Reference |
| 899 (384,848) | NR | A lower risk for lung cancer was seen for elevated serum levels of B6 and for serum methionine (fourth vs. first quartile): OR 0.44 (0.33–0.60) P trend < 0.000001, and OR 0.52 (0.39–0.69) P for trend <0.000001, respectively. Above-median levels of both were associated with a lower lung cancer risk overall: OR 0.41 (0.31–0.54), as well as separately among never, former and current smokers: OR 0.36 (0.18–0.72), OR 0.51 (0.34–0.76), and OR 0.42 (0.27–0.65), respectively. | Johansson 2010 [106] |
| 128 (22,585) | 10.2 | Dietary intake of vitamin K2 (highest vs. lowest quintile): HR 0.38 (0.20–0.71) P trend = 0.002 | Nimptsch 2010 [108] |
| 892 (1748) | 5.2 | PA/(pyridoxal þ PLP) levels: OR 1.52 (1.27–1.81) P < 0.001 | Zuo 2018 [110] |
| 3914 (15,443) | 12.0 | Plasma vitamin C concentration (highest vs. lowest quartile): HR 0.57 (0.41–0.81) | Myint 2019 [107] |
| 3731 (413,015) | 13.9 | Haem iron intake (as a continuous variable): HR 1.03 (1.00–1.07) per 0.3 mg/1000 kcal Haem iron intake (highest vs. lowest quintile): HR 1.16 (1.02–1.32) P trend = 0.035 Non-haem iron intake (as a continuous variable): HR 0.96 (0.92–1.00) per 1.2 g/1000 kcal Non-haem iron intake (highest vs. lowest quintile): HR 0.90 (0.79–1.02) P trend = 0.068 Total iron intake (as a continuous variable): HR 0.98 (0.94–1.02) per 1.3 g/1000 kcal Total iron intake (highest vs. lowest quintile): HR 0.95 (0.84–1.07) P trend = 0.20 | Ward 2019 [109] |
3.5. Prostate Cancer
| Wholegrains, Vegetables, and Fruit | |||
|---|---|---|---|
| No. of Cases (Non-Cases) | Mean Follow-Up (Years) | Results, Relative Risk (95% Confidence Interval (CI)) | Reference |
| 1104 (129,440) | 4.8 | No significant associations between fruit and vegetable consumption and prostate cancer risk were observed (highest vs. lowest quintile): Total fruits: RR 1.06 (0.84–1.34) Total vegetables: RR 1.00 (0.81–1.22) Total fruits and vegetables combined: RR 1.00 (0.79–1.26) | Key 2004 [111] |
| 2747 (139,843) | 8.7 | Overall, no association between dietary fiber intake (total, cereal, fruit or vegetable fiber) and prostate cancer risk, although calibrated intakes of total fiber and fruit fiber were associated with non-statistically significant reductions in risk (per 10 g/day): IRR 0.91 (0.81–1.02) P trend = 0.12 and IRR 0.95 (0.89–1.00) P trend = 0.06, respectively. | Suzuki 2009 [113] |
| 7036 (135,200) | 13.9 | Total fruit intake (highest vs. lowest quintile): HR 0.91 (0.83–0.99) P trend = 0.01 Citrus fruits intake (highest vs. lowest quintile): HR 0.94 (0.86–1.02) P trend = 0.01 | Perez-Cornago 2017 [112] |
| Meat, Fish, Dairy Products, and Preservation/Processing of Foods | |||
| No. of Cases (Non-Cases) | Mean Follow-Up (Years) | Results, Relative Risk (95% Confidence Interval (CI)) | Reference |
| 2727 (139,793) | 8.7 | Yoghurt intake was associated with an increased risk (highest vs. lowest quintile): HR 1.17 (1.04–1.31) P trend = 0.02, but there was no evidence of an association with intakes of milk and milk beverages or cheese. Total protein intake was not positively associated with increased risk (highest vs. lowest quintile): HR 1.17 (0.96–1.44) P trend = 0.07. Protein from dairy foods was significantly associated with an increased risk (highest vs. lowest quintile): HR 1.22 (1.07–1.41) P trend = 0.02. Total dietary calcium intake and calcium intake from dairy foods were also associated with an increased risk (highest vs. lowest quintile): HR 1.17 (1.00–1.35) P trend = 0.01 for total dietary calcium, and HR 1.18 (1.03–1.36) P trend = 0.02 for dairy calcium. Calcium intake from nondairy foods was not associated with risk. An increment of 35 g day−1 dairy protein was associated with an HR of 1.32 (1.01–1.72) P trend = 0.04, and increments of 0.3 g day−1 of total calcium and dairy calcium were associated with HR of 1.09 (1.01–1.16) P trend = 0.02, and HR 1.07 (1.00–1.14) P trend = 0.04, respectively. | Allen, Key 2008 [115] |
| 2727 (139,793) | 8.7 | There were no significant associations between prostate cancer risk and fat from red meat, dairy products, and fish. There was a significant inverse relation between fat from dairy products and risk of localized prostate cancer (each 5% increase in energy from dairy fat): HR 0.92 (0.86–0.99) and HR 0.90 (0.82–0.99), for the observed and calibrated intakes, respectively. There was no significant association between dietary fat (total, saturated, monounsaturated, and polyunsaturated fat and the ratio of polyunsaturated to saturated fat) and risk of prostate cancer: Total fat intake (highest vs. lowest quintile): HR 0.96 (0.84–1.09) P trend = 0.155. There was a significant inverse association between the observed and calibrated intakes of total, monounsaturated, and polyunsaturated fats and the risk of high-grade prostate cancer: For each 10% increase in the observed intake of total fat, the risk of high-grade prostate cancer decreased: HR 0.83 (0.72–0.95). Each 5% increase in monounsaturated and polyunsaturated fat intake was associated with a lower risk of high-grade prostate cancer: HR 0.82 (0.70–0.97) and HR 0.77 (0.62–0.97), respectively. | Crowe, Key 2008 [114] |
| 861 (25,639) | NR | There was no significant joint effect of red and processed meat intake and genotype polymorphism on the risks for prostate cancer. | Loh 2010 [53] |
| Dietary Patterns | |||
| No. of Cases (Non-Cases) | Mean Follow-Up (Years) | Results, Relative Risk (95% Confidence Interval (CI)) | Reference |
| 6745 (421,701) | 15.3 | A higher FSAm-NPS DI score (lower nutritional quality diet) score was associated with a borderline significant higher risk of prostate cancer (highest vs. lowest quintile): HR 1.07 (0.98–1.17) P trend = 0.04 | Deschasaux 2018 [36] |
| Alcoholic and Non-Alcoholic Drinks | |||
| No. of Cases (Non-Cases) | Mean Follow-Up (Years) | Results, Relative Risk (95% Confidence Interval (CI)) | Reference |
| 630 (NR) | 3.4 | Insulin-like growth factor I serum concentration (highest vs. lowest third): OR 1.39 (1.02–0.89) | Allen 2007 [122] |
| 2655 (139,952) | 8.7 | Neither alcohol consumption at baseline nor average lifetime alcohol consumption was significantly associated with risk for prostate cancer: Alcohol intake: RR 0.88 (0.72–1.08) highest intake (≥60 g per day) vs. lowest (0.1–4.9 g/d) Average lifetime alcohol intake: RR 1.09 (0.86–1.39) | Rohrmann 2008 [116] |
| 861 (25,639) | NR | A higher prostate cancer risk was seen with higher alcohol intake among the MGMTIle143Val polymorphism with the variant genotype compared to the MGMTIle143Val polymorphism with the common genotype with lower alcohol intake: OR 2.08 (1.21–3.57) P interaction = 0.0009 | Loh 2010 [53] |
| NR (521,330) | 16.4 | Total, sugar-sweetened, and artificially sweetened soft drink consumption was not associated with risk of death from prostate cancer. | Mullee 2019 [44] |
| 7036 (135,160) | 14.0 | No evidence of association for consumption of total, caffeinated or decaffeinated coffee or tea and risk of total prostate cancer or cancer by stage, grade or fatality (highest vs. lowest consumers): Coffee intake for total prostate cancer: HR 1.02 (0.94–1.09) Tea intake for total prostate cancer: HR 0.98 (0.90–1.07) Coffee intake for total fatal prostate cancer: HR 0.97 (0.79–1.21) Tea intake for total fatal prostate cancer: HR 0.89 (0.70–1.13) | Sen 2019 [117] |
| Other Dietary Exposures | |||
| No. of Cases (Non-Cases) | Mean Follow-Up (Years) | Results, Relative Risk (95% Confidence Interval (CI)) | Reference |
| 966 (136,035) | 6.0 | None of the micronutrients examined were significantly associated with prostate cancer risk. The risk of advanced disease (highest vs. lowest quintile of plasma concentrations): IRR 0.40 (0.19–0.88) for lycopene and IRR 0.35 (0.17–0.78) for the sum of carotenoids. | Key 2007 [123] |
| 959 (149,041) | 11.0 | Plasma selenium concentration was not associated with prostate cancer risk (highest vs. lowest quintile): RR 0.96 (0.70–1.31) P trend = 0.25 | Allen, Naomi 2008 [124] |
| 962 (152,495) | 4.2 | An inverse association between palmitic acid and the risk of total, localized, and low-grade prostate cancer (highest vs. lowest quintile): RR 1.47 (0.97–2.23) P trend = 0.032, RR 1.90 (1.03–3.49) P trend = 0.013, and RR 1.93 (1.02–3.64) P trend = 0.045, respectively. An inverse association between stearic acid and the risk of total and localized prostate cancer (highest vs. lowest quintile): RR 0.77 (0.56–1.06) P trend = 0.03, and RR 0.60 (0.38–0.94) P trend = 0.014, respectively. Significant positive associations between myristic, α-linolenic and eicosapentaenoic acids and risk of high-grade prostate cancer: RR 1.79 (0.80–3.98), 1.79 (0.91–3.53), and 2.00 (1.07–3.76), respectively. | Crowe, Allen 2008 [125] |
| 268 (11,660) | 8.6 | Total menaquinone intake (highest vs. lowest quartile): HR 0.65 (0.39–1.06) Total menaquinone intake for advanced prostate cancer: HR 0.37 (0.16–0.88) P trend = 0.03 Phylloquinone intake (highest vs. lowest quartile): HR 1.02 (0.70–1.48) | Nimptsch 2008 [118] |
| 250 (11,678) | 8.0 | Serum ucOC/iOC ratio in advanced-stage prostate cancer (per 0.1 increment): OR 1.38 (1.03–1.86) Serum ucOC/iOC ratio in high-grade prostate cancer (per 0.1 increment): OR 1.21 (1.00–1.46) | Nimptsch 2009 [119] |
| 652 (152,805) | 4.1 | No significant association between 25-hydroxyvitamin D and risk of prostate cancer (highest vs. lowest quintile): OR 1.28 (0.88–1.88) P trend = 0.188 | Travis, Crowe 2009 [126] |
| 950 (136,050) | 4.2 | Plasma concentrations of phyto-oestrogen genistein (highest vs. lowest quintile): RR 0.74 (0.54–1.00) P trend = 0.05 | Travis, Spencer 2009 [127] |
| 180 (22,585) | 10.2 | Dietary intake of menaquinone (highest vs. lowest quintile): HR 0.65 (0.44–0.97) P trend = 0.03 | Nimptsch 2010 [108] |
| 566 (152,834) | 4.8 | Plasma phytanic acid concentration: OR 1.27 (1.01–1.60) P trend = 0.04 | Price 2010 [121] |
| 248 (11,680) | NR | Glucosinolate intake (per 10 mg/d increment): OR 0.72 (0.53–0.96) | Steinbrecher 2010 [128] |
| 204 (812) | 9 | Total enterolignans intake: OR 1.19 (0.77–1.82) P trend = 0.44 | Ward 2010 [59] |
| 962 (152,495) | NR | A high score on a factor reflecting a long-chain n23 PUFA pattern (fatty acids) was associated with greater risk of prostate cancer (highest vs. lowest quintile): OR 1.36 (0.99–1.86) P trend = 0.041 | Dahm 2012 [129] |
| 4606 (134,399) | 10.0 | Prostate cancer risk was not associated with intake of nitrosamines (highest vs. lowest quintile): HR 0.91 (0.81- 1.03) for endogenous Nitrosocompounds, and HR 1.04 (0.95–1.18) for N-Nitrosodimethlyamine. There was also no association with heme iron (highest vs. lowest quintile): HR 1.00 (0.88–1.39). | Jakszyn 2012 [130] |
| 5916 (117,082) | 14.0 | Dry cakes/biscuits and butter intakes for low-grade prostate cancer: HR 1.07 (1.03–1.11) P = 0.01 Dry cakes/biscuits and butter intakes for aggressive prostate cancer: HR 1.08 (1.04–1.13) P = 0.02 | Papadimitriou 2020 [131] |
7036 (135,203) | 13.9 | Butyric acid intake calibrated for advanced stage prostate cancer (for 1 SD increase): HR 1.08 (1.01–1.15) P trend = 0.026 Eicosenoic acid intake calibrated for fatal prostate cancer (for 1 SD increase): HR 1.05 (1.00–1.11) P trend = 0.048 Eicosapentaenoic acid intake calibrated for fatal prostate cancer (for 1 SD increase): HR 1.07 (1.00–1.14) P trend = 0.045 | Perez-Cornago 2020 [120] |
4. Discussion
5. Conclusions
Supplementary Materials
Author Contributions
Funding
Institutional Review Board Statement
Informed Consent Statement
Data Availability Statement
Conflicts of Interest
References
- Sung, H.; Ferlay, J.; Siegel, R.L.; Laversanne, M.; Soerjomataram, I.; Jemal, A.; Bray, F. Global Cancer Statistics 2020: GLOBOCAN Estimates of Incidence and Mortality Worldwide for 36 Cancers in 185 Countries. CA Cancer J. Clin. 2021, 71, 209–249. [Google Scholar] [CrossRef] [PubMed]
- Randi, G.; Dyba, T.; Martos, C.; Giusti, F.; Dimitrova, N.; Neamtiu, L.; Flego, M.; Nicholson, N.; Carvalho, R.; Bettio, M. Estimated Cancer Incidence and Mortality in Europe for the Year 2020. Eur J. Public Health 2020, 30, 5. [Google Scholar] [CrossRef]
- International Agency for Research on Cancer—World Health Organization. World Cancer Report: Cancer Research for Cancer Prevention; World Health Organization: Lyon, France, 2020. [Google Scholar]
- Anand, P.; Kunnumakara, A.B.; Sundaram, C.; Harikumar, K.B.; Tharakan, S.T.; Lai, O.S.; Sung, B.; Aggarwal, B.B. Cancer Is a Preventable Disease That Requires Major Lifestyle Changes. Pharm. Res. 2008, 25, 2097–2116. [Google Scholar] [CrossRef]
- Bingham, S.; Riboli, E. Diet and Cancer—The European Prospective Investigation into Cancer and Nutrition. Nat. Rev. Cancer 2004, 4, 206–215. [Google Scholar] [CrossRef]
- Morze, J.; Danielewicz, A.; Przybyłowicz, K.; Zeng, H.; Hoffmann, G.; Schwingshackl, L. An Updated Systematic Review and Meta-Analysis on Adherence to Mediterranean Diet and Risk of Cancer. Eur. J. Nutr. 2020, 60, 1561–1586. [Google Scholar] [CrossRef] [PubMed]
- Stein, C.J.; Colditz, G.A. Modifiable Risk Factors for Cancer. Br. J. Cancer 2004, 90, 299–303. [Google Scholar] [CrossRef] [PubMed]
- Gonzalez, C.A.; Riboli, E.; Overvad, K.; Tjonneland, A.; Clavel-Chapelon, F.; Kaaks, R.; Boeing, H.; Trichopoulou, A.; Palli, D.; Krogh, V.; et al. Diet and Cancer Prevention: Contributions from the European Prospective Investigation into Cancer and Nutrition (EPIC) Study. Eur. J. Cancer 2010, 46, 2555–2562. [Google Scholar] [CrossRef]
- World Cancer Research Fund/American Institute for Cancer Research. Diet, Nutrition, Physical Activity and Cancer: A Global Perspective; World Cancer Research Fund/American Institute for Cancer Research: London, UK, 2018. [Google Scholar]
- Riboli, E.; Kaaks, R. The EPIC Project: Rationale and Study Design. Int. J. Epidemiol. 1997, 26, S6–S14. [Google Scholar] [CrossRef]
- Riboli, E.; Hunt, K.J.; Slimani, N.; Ferrari, P.; Norat, T.; Fahey, M.; Charrondière, U.R.; Hémon, B.; Casagrande, C.; Vignat, J.; et al. European Prospective Investigation into Cancer and Nutrition (EPIC): Study Populations and Data Collection. Public Health Nutr. 2002, 5, 1113–1124. [Google Scholar] [CrossRef]
- Margetts, B.M.; Pietinen, P. European Prospective Investigation into Cancer and Nutrition: Validity Studies on Dietary Assessment Methods. Int. J. Epidemiol. 1997, 26, S1–S5. [Google Scholar] [CrossRef]
- Hjartåker, A.; Andersen, L.F.; Lund, E. Comparison of Diet Measures from a Food-Frequency Questionnaire with Measures from Repeated 24-Hour Dietary Recalls. The Norwegian Women and Cancer Study. Public Health Nutr. 2007, 10, 1094–1103. [Google Scholar] [CrossRef]
- Slimani, N.; Kaaks, R.; Ferrari, P.; Casagrande, C.; Clavel-Chapelon, F.; Lotze, G.; Kroke, A.; Trichopoulos, D.; Trichopoulou, A.; Lauria, C.; et al. European Prospective Investigation into Cancer and Nutrition (EPIC) Calibration Study: Rationale, Design and Population Characteristics. Public Health Nutr. 2002, 5, 1125–1145. [Google Scholar] [CrossRef]
- Slimani, N.; Deharveng, G.; Unwin, I.; Southgate, D.A.T.; Vignat, J.; Skeie, G.; Salvini, S.; Parpinel, M.; Møller, A.; Ireland, J.; et al. The EPIC Nutrient Database Project (ENDB): A First Attempt to Standardize Nutrient Databases across the 10 European Countries Participating in the EPIC Study. Eur. J. Clin. Nutr. 2007, 61, 1037–1056. [Google Scholar] [CrossRef]
- Page, M.J.; McKenzie, J.E.; Bossuyt, P.M.; Boutron, I.; Hoffmann, T.C.; Mulrow, C.D.; Shamseer, L.; Tetzlaff, J.M.; Akl, E.A.; Brennan, S.E.; et al. The PRISMA 2020 Statement: An Updated Guideline for Reporting Systematic Reviews. BMJ 2021, 372, n71. [Google Scholar] [CrossRef]
- Moola, S.; Munn, Z.; Tufanaru, C.; Aromataris, E.; Sears, K.; Sfetcu, R.; Currie, M.; Lisy, K.; Qureshi, R.; Mattis, P.; et al. Chapter 7: Systematic reviews of etiology and risk. In JBI Manual for Evidence Synthesis; Aromataris, E., Munn, Z., Eds.; JBI: Adelaide, SA, Australia, 2020. [Google Scholar]
- Lin, K.Y.; Edbrooke, L.; Granger, C.L.; Denehy, L.; Frawley, H.C. The Impact of Gynaecological Cancer Treatment on Physical Activity Levels: A Systematic Review of Observational Studies. Braz. J. Phys. Ther. 2019, 23, 79–92. [Google Scholar] [CrossRef] [PubMed]
- Lukomskyj, N.; Shi, Y.; Allman-Farinelli, M.; Rangan, A. Associations between Breakfast Consumption from Childhood to Adulthood and Cardiometabolic Health: A Systematic Review. Nutr. Diet. 2021, 78, 6–23. [Google Scholar] [CrossRef]
- Larkin, D.; Lopez, V.; Aromataris, E. Non-pharmacological interventions for cancer-related fatigue in men treated for prostate cancer: A systematic review. JBI Libr. Syst. Rev. 2012, 10, 3764–3811. [Google Scholar] [CrossRef] [PubMed]
- Van Duijnhoven, F.J.; Bueno-De-Mesquita, H.B.; Ferrari, P.; Jenab, M.; Boshuizen, H.C.; Ros, M.M.; Casagrande, C.; Tjønneland, A.; Olsen, A.; Overvad, K.; et al. Fruit, Vegetables, and Colorectal Cancer Risk: The European Prospective Investigation into Cancer and Nutrition. Am. J. Clin. Nutr. 2009, 89, 1441–1452. [Google Scholar] [CrossRef] [PubMed]
- Leenders, M.; Siersema, P.D.; Overvad, K.; Tjønneland, A.; Olsen, A.; Boutron-Ruault, M.-C.; Bastide, N.; Fagherazzi, G.; Katzke, V.; Kühn, T.; et al. Subtypes of Fruit and Vegetables, Variety in Consumption and Risk of Colon and Rectal Cancer in the European Prospective Investigation into Cancer and Nutrition. Int. J. Cancer 2015, 137, 2705–2714. [Google Scholar] [CrossRef]
- Bingham, S.A.; Luben, R.; Welch, A.; Wareham, N.; Khaw, K.T.; Day, N. Are Imprecise Methods Obscuring a Relation between Fat and Breast Cancer? Lancet 2003, 362, 212–214. [Google Scholar] [CrossRef]
- Bingham, S.A.; Norat, T.; Moskal, A.; Ferrari, P.; Slimani, N.; Clavel-Chapelon, F.; Kesse, E.; Nieters, A.; Boeing, H.; Tjønneland, A.; et al. Is the Association with Fiber from Foods in Colorectal Cancer Confounded by Folate Intake? Cancer Epidemiol. Biomark. Prev. 2005, 14, 1552–1556. [Google Scholar] [CrossRef] [PubMed][Green Version]
- Murphy, N.; Norat, T.; Ferrari, P.; Jenab, M.; Bueno-de-Mesquita, B.; Skeie, G.; Dahm, C.C.; Overvad, K.; Olsen, A.; Tjønneland, A.; et al. Dietary Fibre Intake and Risks of Cancers of the Colon and Rectum in the European Prospective Investigation into Cancer and Nutrition (EPIC). PLoS ONE 2012, 7, e39361. [Google Scholar] [CrossRef] [PubMed]
- Jenab, M.; Ferrari, P.; Slimani, N.; Norat, T.; Casagrande, C.; Overad, K.; Olsen, A.; Stripp, C.; Tjønneland, A.; Boutron-Ruault, M.-C.; et al. Association of Nut and Seed Intake with Colorectal Cancer Risk in the European Prospective Investigation into Cancer and Nutrition. Cancer Epidemiol. Biomark. Prev. 2004, 13, 1595–1603. [Google Scholar]
- Aglago, E.K.; Huybrechts, I.; Murphy, N.; Casagrande, C.; Nicolas, G.; Pischon, T.; Fedirko, V.; Severi, G.; Boutron-Ruault, M.-C.; Fournier, A.; et al. Consumption of Fish and Long-Chain n-3 Polyunsaturated Fatty Acids Is Associated With Reduced Risk of Colorectal Cancer in a Large European Cohort. Clin. Gastroenterol. Hepatol. 2020, 18, 654–666.e6. [Google Scholar] [CrossRef] [PubMed]
- Norat, T.; Bingham, S.; Ferrari, P.; Slimani, N.; Jenab, M.; Mazuir, M.; Overvad, K.; Olsen, A.; Tjønneland, A.; Clavel, F.; et al. Meat, Fish, and Colorectal Cancer Risk: The European Prospective Investigation into Cancer and Nutrition. J. Natl. Cancer Inst. 2005, 97, 906–916. [Google Scholar] [CrossRef] [PubMed]
- Ward, H.A.; Norat, T.; Overvad, K.; Dahm, C.C.; Bueno-de-Mesquita, H.B.; Jenab, M.; Fedirko, V.; van Duijnhoven, F.J.B.; Skeie, G.; Romaguera-Bosch, D.; et al. Pre-Diagnostic Meat and Fibre Intakes in Relation to Colorectal Cancer Survival in the European Prospective Investigation into Cancer and Nutrition. Br. J. Nutr. 2016, 116, 316–325. [Google Scholar] [CrossRef]
- Jenab, M.; Bueno-de-Mesquita, H.B.; Ferrari, P.; van Duijnhoven, F.J.B.; Norat, T.; Pischon, T.; Jansen, E.H.J.M.; Slimani, N.; Byrnes, G.; Rinaldi, S.; et al. Association between Pre-Diagnostic Circulating Vitamin D Concentration and Risk of Colorectal Cancer in European Populations:A Nested Case-Control Study. BMJ 2010, 340, b5500. [Google Scholar] [CrossRef]
- Murphy, N.; Norat, T.; Ferrari, P.; Jenab, M.; Bueno-de-Mesquita, B.; Skeie, G.; Olsen, A.; Tjønneland, A.; Dahm, C.C.; Overvad, K.; et al. Consumption of Dairy Products and Colorectal Cancer in the European Prospective Investigation into Cancer and Nutrition (EPIC). PLoS ONE 2013, 8, e72715. [Google Scholar] [CrossRef]
- Pala, V.; Sieri, S.; Berrino, F.; Vineis, P.; Sacerdote, C.; Palli, D.; Masala, G.; Panico, S.; Mattiello, A.; Tumino, R.; et al. Yogurt Consumption and Risk of Colorectal Cancer in the Italian European Prospective Investigation into Cancer and Nutrition Cohort. Int. J. Cancer 2011, 129, 2712–2719. [Google Scholar] [CrossRef]
- Sieri, S.; Agnoli, C.; Pala, V.; Mattiello, A.; Panico, S.; Masala, G.; Assedi, M.; Tumino, R.; Frasca, G.; Sacerdote, C.; et al. Dietary habits and cancer: The experience of epicitaly. Epidemiol. Prev. 2015, 39, 333–338. [Google Scholar]
- Agnoli, C.; Grioni, S.; Sieri, S.; Palli, D.; Masala, G.; Sacerdote, C.; Vineis, P.; Tumino, R.; Giurdanella, M.C.; Pala, V.; et al. Italian Mediterranean Index and Risk of Colorectal Cancer in the Italian Section of the EPIC Cohort. Int. J. Cancer 2013, 132, 1404–1411. [Google Scholar] [CrossRef]
- Bamia, C.; Lagiou, P.; Buckland, G.; Grioni, S.; Agnoli, C.; Taylor, A.J.; Dahm, C.C.; Overvad, K.; Olsen, A.; Tjønneland, A.; et al. Mediterranean Diet and Colorectal Cancer Risk: Results from a European Cohort. Eur. J. Epidemiol. 2013, 28, 317–328. [Google Scholar] [CrossRef]
- Deschasaux, M.; Huybrechts, I.; Julia, C.; Hercberg, S.; Egnell, M.; Srour, B.; Kesse-Guyot, E.; Latino-Martel, P.; Biessy, C.; Casagrande, C.; et al. Association between Nutritional Profiles of Foods Underlying Nutri-Score Front-of-Pack Labels and Mortality: EPIC Cohort Study in 10 European Countries. BMJ 2020, 370, m3173. [Google Scholar] [CrossRef]
- Jakszyn, P.; Cayssials, V.; Buckland, G.; Perez-Cornago, A.; Weiderpass, E.; Boeing, H.; Bergmann, M.M.; Vulcan, A.; Ohlsson, B.; Masala, G.; et al. Inflammatory Potential of the Diet and Risk of Colorectal Cancer in the European Prospective Investigation into Cancer and Nutrition Study. Int. J. Cancer 2020, 147, 1027–1039. [Google Scholar] [CrossRef]
- Bendinelli, B.; Palli, D.; Assedi, M.; Facchini, L.; Grioni, S.; Agnoli, C.; Ricceri, F.; Macciotta, A.; Panico, S.; Mattiello, A.; et al. Alcohol, Smoking and Rectal Cancer Risk in a Mediterranean Cohort of Adults: The European Prospective Investigation into Cancer and Nutrition (EPIC)-Italy Cohort. Eur. J. Gastroenterol. Hepatol. 2020, 32, 475–483. [Google Scholar] [CrossRef] [PubMed]
- Murphy, N.; Ward, H.A.; Jenab, M.; Rothwell, J.A.; Boutron-Ruault, M.-C.; Carbonnel, F.; Kvaskoff, M.; Kaaks, R.; Kühn, T.; Boeing, H.; et al. Heterogeneity of Colorectal Cancer Risk Factors by Anatomical Subsite in 10 European Countries: A Multinational Cohort Study. Clin. Gastroenterol. Hepatol. 2019, 17, 1323–1331.e6. [Google Scholar] [CrossRef] [PubMed]
- Aleksandrova, K.; Pischon, T.; Jenab, M.; Bueno-de-Mesquita, H.B.; Fedirko, V.; Norat, T.; Romaguera, D.; Knüppel, S.; Boutron-Ruault, M.C.; Dossus, L.; et al. Combined Impact of Healthy Lifestyle Factors on Colorectal Cancer: A Large European Cohort Study. BMC Med. 2014, 12. [Google Scholar] [CrossRef] [PubMed]
- Eussen, S.J.P.M.; Vollset, S.E.; Igland, J.; Meyer, K.; Fredriksen, A.; Ueland, P.M.; Jenab, M.; Slimani, N.; Boffetta, P.; Overvad, K.; et al. Plasma Folate, Related Genetic Variants, and Colorectal Cancer Risk in EPIC. Cancer Epidemiol. Biomark. Prev. 2010, 19, 1328–1340. [Google Scholar] [CrossRef]
- Ferrari, P.; Jenab, M.; Norat, T.; Moskal, A.; Slimani, N.; Olsen, A.; Tjønneland, A.; Overvad, K.; Jensen, M.K.; Boutron-Ruault, M.-C.; et al. Lifetime and Baseline Alcohol Intake and Risk of Colon and Rectal Cancers in the European Prospective Investigation into Cancer and Nutrition (EPIC). Int. J. Cancer 2007, 121, 2065–2072. [Google Scholar] [CrossRef] [PubMed]
- Park, J.Y.; Mitrou, P.N.; Dahm, C.C.; Luben, R.N.; Wareham, N.J.; Khaw, K.-T.; Rodwell, S.A. Baseline Alcohol Consumption, Type of Alcoholic Beverage and Risk of Colorectal Cancer in the European Prospective Investigation into Cancer and Nutrition-Norfolk Study. Cancer Epidemiol. 2009, 33, 347–354. [Google Scholar] [CrossRef] [PubMed]
- Mullee, A.; Romaguera, D.; Pearson-Stuttard, J.; Viallon, V.; Stepien, M.; Freisling, H.; Fagherazzi, G.; Mancini, F.R.; Boutron-Ruault, M.-C.; Kühn, T.; et al. Association between Soft Drink Consumption and Mortality in 10 European Countries. JAMA Intern. Med. 2019. [Google Scholar] [CrossRef]
- Gibbs, D.C.; Bostick, R.M.; McCullough, M.L.; Um, C.Y.; Flanders, W.D.; Jenab, M.; Weiderpass, E.; Gylling, B.; Gram, I.T.; Heath, A.K.; et al. Association of Prediagnostic Vitamin D Status with Mortality among Colorectal Cancer Patients Differs by Common, Inherited Vitamin D-Binding Protein Isoforms. Int. J. Cancer 2020, 147, 2725–2734. [Google Scholar] [CrossRef]
- Fedirko, V.; Riboli, E.; Tjønneland, A.; Ferrari, P.; Olsen, A.; Bueno-de-Mesquita, H.B.; van Duijnhoven, F.J.B.F.J.B.; Norat, T.; Jansen, E.H.J.M.E.H.J.M.; Dahm, C.C.; et al. Prediagnostic 25-Hydroxyvitamin D, VDR and CASR Polymorphisms, and Survival in Patients with Colorectal Cancer in Western European Populations. Cancer Epidemiol. Biomark. Prev. 2012, 21, 582–593. [Google Scholar] [CrossRef]
- Eussen, S.J.P.M.; Vollset, S.E.; Hustad, S.; Midttun, Ø.; Meyer, K.; Fredriksen, A.; Ueland, P.M.; Jenab, M.; Slimani, N.; Boffetta, P.; et al. Plasma Vitamins B2, B6, and B12, and Related Genetic Variants as Predictors of Colorectal Cancer Risk. Cancer Epidemiol. Biomark. Prev. 2010, 19, 2549–2561. [Google Scholar] [CrossRef]
- Leenders, M.; Leufkens, A.M.; Siersema, P.D.; van Duijnhoven, F.J.B.; Vrieling, A.; Hulshof, P.J.M.; van Gils, C.H.; Overvad, K.; Roswall, N.; Kyrø, C.; et al. Plasma and Dietary Carotenoids and Vitamins A, C and E and Risk of Colon and Rectal Cancer in the European Prospective Investigation into Cancer and Nutrition. Int. J. Cancer 2014, 135, 2930–2939. [Google Scholar] [CrossRef]
- Kyrø, C.; Olsen, A.; Landberg, R.; Skeie, G.; Loft, S.; Aman, P.; Leenders, M.; Dik, V.K.; Siersema, P.D.; Pischon, T.; et al. Plasma Alkylresorcinols, Biomarkers of Whole-Grain Wheat and Rye Intake, and Incidence of Colorectal Cancer. J. Natl. Cancer Inst. 2014, 106, djt352. [Google Scholar] [CrossRef]
- Nitter, M.; Norgård, B.; de Vogel, S.; Eussen, S.J.P.M.; Meyer, K.; Ulvik, A.; Ueland, P.M.; Nygård, O.; Vollset, S.E.; Bjørge, T.; et al. Plasma Methionine, Choline, Betaine, and Dimethylglycine in Relation to Colorectal Cancer Risk in the European Prospective Investigation into Cancer and Nutrition (EPIC). Ann. Oncol. 2014, 25, 1609–1615. [Google Scholar] [CrossRef] [PubMed]
- Rothwell, J.A.; Murphy, N.; Bešević, J.; Kliemann, N.; Jenab, M.; Ferrari, P.; Achaintre, D.; Gicquiau, A.; Vozar, B.; Scalbert, A.; et al. Metabolic Signatures of Healthy Lifestyle Patterns and Colorectal Cancer Risk in a European Cohort. Clin. Gastroenterol. Hepatol. 2020. [Google Scholar] [CrossRef] [PubMed]
- Stepien, M.; Jenab, M.; Freisling, H.; Becker, N.-P.; Czuban, M.; Tjønneland, A.; Olsen, A.; Overvad, K.; Boutron-Ruault, M.-C.; Mancini, F.R.; et al. Pre-Diagnostic Copper and Zinc Biomarkers and Colorectal Cancer Risk in the European Prospective Investigation into Cancer and Nutrition Cohort. Carcinogenesis 2017, 38, 699–707. [Google Scholar] [CrossRef] [PubMed]
- Loh, Y.H.; Mitrou, P.N.; Bowman, R.; Wood, A.; Jeffery, H.; Luben, R.; Khaw, K.-T.; Rodwell, S. MGMT ILE143VAL Polymorphism, Dietary Factors, and the Risk of Breast, Colorectal, and Prostate Cancer in the European Prospective Investigation Into Cancer and Nutrition (EPIC)-Norfolk Study. DNA Repair 2010, 9, 421–428. [Google Scholar] [CrossRef]
- Li, K.; Kaaks, R.; Linseisen, J.; Rohrmann, S. Dietary Calcium and Magnesium Intake in Relation to Cancer Incidence and Mortality in a German Prospective Cohort (EPIC-Heidelberg). Cancer Causes Control 2011, 22, 1375–1382. [Google Scholar] [CrossRef]
- Linseisen, J.; Grundmann, N.; Zoller, D.; Kuehn, T.; Jansen, E.H.J.M.; Chajes, V.; Fedirko, V.; Weiderpass, E.; Dahm, C.C.; Overvad, K.; et al. Red Blood Cell Fatty Acids and Risk of Colorectal Cancer in the European Prospective Investigation into Cancer and Nutrition (EPIC). Cancer Epidemiol. Biomark. Prev. 2021. [Google Scholar] [CrossRef]
- Kesse, E.; Clavel-Chapelon, F.; Boutron-Ruault, M.C. Dietary Patterns and Risk of Colorectal Tumors: A Cohort of French Women of the National Education System (E3N). Am. J. Epidemiol. 2006, 164, 1085–1093. [Google Scholar] [CrossRef]
- Key, T.J.; Appleby, P.N.; Spencer, E.A.; Travis, R.C.; Roddam, A.W.; Allen, N.E.; TJ, K.; PN, A.; EA, S.; RC, T.; et al. Mortality in British Vegetarians: Results from the European Prospective Investigation into Cancer and Nutrition (EPIC-Oxford). Am. J. Clin. Nutr. 2009, 89, 1613S–1619S. [Google Scholar] [CrossRef] [PubMed]
- Jenab, M.; Riboli, E.; Cleveland, R.J.; Norat, T.; Rinaldi, S.; Nieters, A.; Biessy, C.; Tjønneland, A.; Olsen, A.; Overvad, K.; et al. Serum C-Peptide, IGFBP-1 and IGFBP-2 and Risk of Colon and Rectal Cancers in the European Prospective Investigation into Cancer and Nutrition. Int. J. Cancer 2007, 121, 368–376. [Google Scholar] [CrossRef] [PubMed]
- Ward, H.A.; Kuhnle, G.G.C.; Mulligan, A.A.; Lentjes, M.A.H.; Luben, R.N.; Khaw, K.-T.; HA, W.; GG, K.; AA, M.; MA, L.; et al. Breast, Colorectal, and Prostate Cancer Risk in the European Prospective Investigation into Cancer and Nutrition-Norfolk in Relation to Phytoestrogen Intake Derived from an Improved Database. Am. J. Clin. Nutr. 2010, 91, 440–448. [Google Scholar] [CrossRef] [PubMed]
- Hughes, D.J.; Fedirko, V.; Jenab, M.; Schomburg, L.; Méplan, C.; Freisling, H.; Bueno-de-Mesquita, H.B.; Hybsier, S.; Becker, N.-P.; Czuban, M.; et al. Selenium Status Is Associated with Colorectal Cancer Risk in the European Prospective Investigation of Cancer and Nutrition Cohort. Int. J. Cancer 2015, 136, 1149–1161. [Google Scholar] [CrossRef]
- Vece, M.M.; Agnoli, C.; Grioni, S.; Sieri, S.; Pala, V.; Pellegrini, N.; Frasca, G.; Tumino, R.; Mattiello, A.; Panico, S.; et al. Dietary Total Antioxidant Capacity and Colorectal Cancer in the Italian EPIC Cohort. PLoS ONE 2015, 10, e0142995. [Google Scholar] [CrossRef]
- Moskal, A.; Freisling, H.; Byrnes, G.; Assi, N.; Fahey, M.T.; Jenab, M.; Ferrari, P.; Tjønneland, A.; Petersen, K.E.; Dahm, C.C.; et al. Main Nutrient Patterns and Colorectal Cancer Risk in the European Prospective Investigation into Cancer and Nutrition Study. Br. J. Cancer 2016, 115, 1430–1440. [Google Scholar] [CrossRef]
- Zamora-Ros, R.; Barupal, D.K.; Rothwell, J.A.; Jenab, M.; Fedirko, V.; Romieu, I.; Aleksandrova, K.; Overvad, K.; Kyrø, C.; Tjønneland, A.; et al. Dietary Flavonoid Intake and Colorectal Cancer Risk in the European Prospective Investigation into Cancer and Nutrition (EPIC) Cohort. Int. J. Cancer 2017, 140, 1836–1844. [Google Scholar] [CrossRef]
- Zamora-Ros, R.; Cayssials, V.; Jenab, M.; Rothwell, J.A.; Fedirko, V.; Aleksandrova, K.; Tjønneland, A.; Kyrø, C.; Overvad, K.; Boutron-Ruault, M.-C.; et al. Dietary Intake of Total Polyphenol and Polyphenol Classes and the Risk of Colorectal Cancer in the European Prospective Investigation into Cancer and Nutrition (EPIC) Cohort. Eur. J. Epidemiol. 2018, 33, 1063–1075. [Google Scholar] [CrossRef]
- Engeset, D.; Dyachenko, A.; Ciampi, A.; Lund, E. Dietary Patterns and Risk of Cancer of Various Sites in the Norwegian European Prospective Investigation into Cancer and Nutrition Cohort: The Norwegian Women and Cancer Study. Eur. J. Cancer Prev. 2009, 18, 69–75. [Google Scholar] [CrossRef]
- Emaus, M.J.; Peeters, P.H.M.; Bakker, M.F.; Overvad, K.; Tjønneland, A.; Olsen, A.; Romieu, I.; Ferrari, P.; Dossus, L.; Boutron-Ruault, M.C.; et al. Vegetable and Fruit Consumption and the Risk of Hormone Receptor-Defined Breast Cancer in the EPIC Cohort. Am. J. Clin. Nutr. 2016, 103, 168–177. [Google Scholar] [CrossRef] [PubMed]
- Masala, G.; Assedi, M.; Bendinelli, B.; Ermini, I.; Sieri, S.; Grioni, S.; Sacerdote, C.; Ricceri, F.; Panico, S.; Mattiello, A.; et al. Fruit and Vegetables Consumption and Breast Cancer Risk: The EPIC Italy Study. Breast Cancer Res. Treat. 2012, 132, 1127–1136. [Google Scholar] [CrossRef]
- van Gils, C.H.; Peeters, P.H.M.; Bueno-de-Mesquita, H.B.; Boshuizen, H.C.; Lahmann, P.H.; Clavel-Chapelon, F.; Thiébaut, A.; Kesse, E.; Sieri, S.; Palli, D.; et al. Consumption of Vegetables and Fruits and Risk of Breast Cancer. JAMA 2005, 293, 183–193. [Google Scholar] [CrossRef]
- Ferrari, P.; Rinaldi, S.; Jenab, M.; Lukanova, A.; Olsen, A.; Tjønneland, A.; Overvad, K.; Clavel-Chapelon, F.; Fagherazzi, G.; Touillaud, M.; et al. Dietary Fiber Intake and Risk of Hormonal Receptor-Defined Breast Cancer in the European Prospective Investigation into Cancer and Nutrition Study. Am. J. Clin. Nutr. 2013, 97, 344–353. [Google Scholar] [CrossRef] [PubMed]
- Engeset, D.; Alsaker, E.; Lund, E.; Welch, A.; Khaw, K.-T.; Clavel-Chapelon, F.; Thiébaut, A.; Chajès, V.; Key, T.J.; Allen, N.E.; et al. Fish Consumption and Breast Cancer Risk. The European Prospective Investigation into Cancer and Nutrition (EPIC). Int. J. Cancer 2006, 119, 175–182. [Google Scholar] [CrossRef]
- Pala, V.; Krogh, V.; Berrino, F.; Sieri, S.; Grioni, S.; Tjønneland, A.; Olsen, A.; Jakobsen, M.U.; Overvad, K.; Clavel-Chapelon, F.; et al. Meat, Eggs, Dairy Products, and Risk of Breast Cancer in the European Prospective Investigation into Cancer and Nutrition (EPIC) Cohort. Am. J. Clin. Nutr. 2009, 90, 602–612. [Google Scholar] [CrossRef]
- Abbas, S.; Linseisen, J.; Rohrmann, S.; Chang-Claude, J.; Peeters, P.H.; Engel, P.; Brustad, M.; Lund, E.; Skeie, G.; Olsen, A.; et al. Dietary Intake of Vitamin D and Calcium and Breast Cancer Risk in the European Prospective Investigation into Cancer and Nutrition. Nutr. Cancer 2013, 65, 178–187. [Google Scholar] [CrossRef]
- Trichopoulou, A.; Bamia, C.; Lagiou, P.; Trichopoulos, D. Conformity to Traditional Mediterranean Diet and Breast Cancer Risk in the Greek EPIC (European Prospective Investigation into Cancer and Nutrition) Cohort. Am. J. Clin. Nutr. 2010, 92, 620–625. [Google Scholar] [CrossRef] [PubMed]
- Buckland, G.; Travier, N.; Cottet, V.; González, C.A.; Luján-Barroso, L.; Agudo, A.; Trichopoulou, A.; Lagiou, P.; Trichopoulos, D.; Peeters, P.H.; et al. Adherence to the Mediterranean Diet and Risk of Breast Cancer in the European Prospective Investigation into Cancer and Nutrition Cohort Study. Int. J. Cancer 2013, 132, 2918–2927. [Google Scholar] [CrossRef]
- Travis, R.C.; Allen, N.E.; Appleby, P.N.; Spencer, E.A.; Roddam, A.W.; Key, T.J. A Prospective Study of Vegetarianism and Isoflavone Intake in Relation to Breast Cancer Risk in British Women. Int. J. Cancer 2008, 122, 705–710. [Google Scholar] [CrossRef]
- Heath, A.K.; Muller, D.C.; van den Brandt, P.A.; Papadimitriou, N.; Critselis, E.; Gunter, M.; Vineis, P.; Weiderpass, E.; Fagherazzi, G.; Boeing, H.; et al. Nutrient-Wide Association Study of 92 Foods and Nutrients and Breast Cancer Risk. Breast Cancer Res. 2020, 22, 5. [Google Scholar] [CrossRef]
- Romieu, I.; Scoccianti, C.; Chajès, V.; de Batlle, J.; Biessy, C.; Dossus, L.; Baglietto, L.; Clavel-Chapelon, F.; Overvad, K.; Olsen, A.; et al. Alcohol Intake and Breast Cancer in the European Prospective Investigation into Cancer and Nutrition. Int. J. Cancer 2015, 137, 1921–1930. [Google Scholar] [CrossRef] [PubMed]
- Assi, N.; Rinaldi, S.; Viallon, V.; Dashti, S.G.; Dossus, L.; Fournier, A.; Cervenka, I.; Kvaskoff, M.; Turzanski-Fortner, R.; Bergmann, M.; et al. Mediation Analysis of the Alcohol-Postmenopausal Breast Cancer Relationship by Sex Hormones in the EPIC Cohort. Int. J. Cancer 2020, 146, 759–768. [Google Scholar] [CrossRef] [PubMed]
- Bhoo-Pathy, N.; Peeters, P.H.M.; Uiterwaal, C.S.P.M.; Bueno-de-Mesquita, H.B.; Bulgiba, A.M.; Bech, B.H.; Overvad, K.; Tjønneland, A.; Olsen, A.; Clavel-Chapelon, F.; et al. Coffee and Tea Consumption and Risk of Pre- and Postmenopausal Breast Cancer in the European Prospective Investigation into Cancer and Nutrition (EPIC) Cohort Study. Breast Cancer Res. 2015, 17, 15. [Google Scholar] [CrossRef] [PubMed]
- Assi, N.; Moskal, A.; Slimani, N.; Viallon, V.; Chajes, V.; Freisling, H.; Monni, S.; Knueppel, S.; Förster, J.; Weiderpass, E.; et al. A Treelet Transform Analysis to Relate Nutrient Patterns to the Risk of Hormonal Receptor-Defined Breast Cancer in the European Prospective Investigation into Cancer and Nutrition (EPIC). Public Health Nutr. 2016, 19, 242–254. [Google Scholar] [CrossRef] [PubMed]
- Bakker, M.F.; Peeters, P.H.; Klaasen, V.M.; Bueno-de-Mesquita, H.B.; Jansen, E.H.; Ros, M.M.; Travier, N.; Olsen, A.; Tjønneland, A.; Overvad, K.; et al. Plasma Carotenoids, Vitamin C, Tocopherols, and Retinol and the Risk of Breast Cancer in the European Prospective Investigation into Cancer and Nutrition Cohort. Am. J. Clin. Nutr. 2016, 103, 454–464. [Google Scholar] [CrossRef] [PubMed]
- Matta, M.; Huybrechts, I.; Biessy, C.; Casagrande, C.; Yammine, S.; Fournier, A.; Olsen, K.S.; Lukic, M.; Gram, I.T.; Ardanaz, E.; et al. Dietary Intake of Trans Fatty Acids and Breast Cancer Risk in 9 European Countries. BMC Med. 2021, 19, 81. [Google Scholar] [CrossRef]
- Chajès, V.; Thiébaut, A.C.M.; Rotival, M.; Gauthier, E.; Maillard, V.; Boutron-Ruault, M.-C.; Joulin, V.; Lenoir, G.M.; Clavel-Chapelon, F.F.; Chajes, V.; et al. Association between Serum Trans-Monounsaturated Fatty Acids and Breast Cancer Risk in the E3N-EPIC Study. Am. J. Epidemiol. 2008, 167, 1312–1320. [Google Scholar] [CrossRef] [PubMed]
- Chajès, V.; Assi, N.; Biessy, C.; Ferrari, P.; Rinaldi, S.; Slimani, N.; Lenoir, G.M.; Baglietto, L.; His, M.; Boutron-Ruault, M.C.; et al. A Prospective Evaluation of Plasma Phospholipid Fatty Acids and Breast Cancer Risk in the EPIC Study. Ann. Oncol. 2017, 28, 2836–2842. [Google Scholar] [CrossRef]
- Romieu, I.; Ferrari, P.; Rinaldi, S.; Slimani, N.; Jenab, M.; Olsen, A.; Tjonneland, A.; Overvad, K.; Boutron-Ruault, M.-C.; Lajous, M.; et al. Dietary Glycemic Index and Glycemic Load and Breast Cancer Risk in the European Prospective Investigation into Cancer and Nutrition (EPIC). Am. J. Clin. Nutr. 2012, 96, 345–355. [Google Scholar] [CrossRef] [PubMed]
- Sieri, S.; Pala, V.; Brighenti, F.; Agnoli, C.; Grioni, S.; Berrino, F.; Scazzina, F.; Palli, D.; Masala, G.; Vineis, P.; et al. High Glycemic Diet and Breast Cancer Occurrence in the Italian EPIC Cohort. Nutr. Metab. Cardiovasc. Dis. 2013, 23, 628–634. [Google Scholar] [CrossRef] [PubMed]
- Spencer, E.A.; Key, T.J.; Appleby, P.N.; van Gils, C.H.; Olsen, A.; Tjønneland, A.; Clavel-Chapelon, F.; Boutron-Ruault, M.-C.; Touillaud, M.; Sánchez, M.-J.; et al. Prospective Study of the Association between Grapefruit Intake and Risk of Breast Cancer in the European Prospective Investigation into Cancer and Nutrition (EPIC). Cancer Causes Control 2009, 20, 803–809. [Google Scholar] [CrossRef]
- Buckland, G.; Travier, N.; Agudo, A.; Fonseca-Nunes, A.; Navarro, C.; Lagiou, P.; Demetriou, C.; Amiano, P.; Dorronsoro, M.; Chirlaque, M.-D.; et al. Olive Oil Intake and Breast Cancer Risk in the Mediterranean Countries of the European Prospective Investigation into Cancer and Nutrition Study. Int. J. Cancer 2012, 131, 2465–2469. [Google Scholar] [CrossRef] [PubMed]
- Tjønneland, A.; Christensen, J.; Olsen, A.; Stripp, C.; Thomsen, B.L.; Overvad, K.; Peeters, P.H.M.; van Gils, C.H.; Bueno-de-Mesquita, H.B.; Ocké, M.C.; et al. Alcohol Intake and Breast Cancer Risk: The European Prospective Investigation into Cancer and Nutrition (EPIC). Cancer Causes Control 2007, 18, 361–373. [Google Scholar] [CrossRef]
- Masala, G.; Bendinelli, B.; Assedi, M.; Occhini, D.; Zanna, I.; Sieri, S.; Agnoli, C.; Sacerdote, C.; Ricceri, F.; Mattiello, A.; et al. Up to One-Third of Breast Cancer Cases in Post-Menopausal Mediterranean Women Might Be Avoided by Modifying Lifestyle Habits: The EPIC Italy Study. Breast Cancer Res. Treat. 2017, 161, 311–320. [Google Scholar] [CrossRef]
- Romieu, I.; Ferrari, P.; Chajès, V.; de Batlle, J.; Biessy, C.; Scoccianti, C.; Dossus, L.; Christine Boutron, M.; Bastide, N.; Overvad, K.; et al. Fiber Intake Modulates the Association of Alcohol Intake with Breast Cancer. Int. J. Cancer 2017, 140, 316–321. [Google Scholar] [CrossRef][Green Version]
- Thiebaut, A.C.M.; Clavel-Chapelon, F. Fat Consumption and Breast Cancer: Preliminary Results from the E3N-Epic Cohort. Bull. Cancer 2001, 88, 954–958. [Google Scholar]
- Keinan-Boker, L.; van Der Schouw, Y.T.; Grobbee, D.E.; Peeters, P.H.M. Dietary Phytoestrogens and Breast Cancer Risk. Am. J. Clin. Nutr. 2004, 79, 282–288. [Google Scholar] [CrossRef]
- Sieri, S.; Krogh, V.; Ferrari, P.; Berrino, F.; Pala, V.; Thiébaut, A.C.M.; Tjønneland, A.; Olsen, A.; Overvad, K.; Jakobsen, M.U.; et al. Dietary Fat and Breast Cancer Risk in the European Prospective Investigation into Cancer and Nutrition. Am. J. Clin. Nutr. 2008, 88, 1304–1312. [Google Scholar] [CrossRef]
- Maillard, V.; Kuriki, K.; Lefebvre, B.; Boutron-Ruault, M.-C.; Lenoir, G.M.; Joulin, V.; Clavel-Chapelon, F.; Chajès, V. Serum Carotenoid, Tocopherol and Retinol Concentrations and Breast Cancer Risk in the E3N-EPIC Study. Int. J. Cancer 2010, 127, 1188–1196. [Google Scholar] [CrossRef] [PubMed]
- Nagel, G.; Linseisen, J.; van Gils, C.H.; Peeters, P.H.; Boutron-Ruault, M.C.; Clavel-Chapelon, F.; Romieu, I.; Tjønneland, A.; Olsen, A.; Roswall, N.; et al. Dietary Beta-Carotene, Vitamin C and E Intake and Breast Cancer Risk in the European Prospective Investigation into Cancer and Nutrition (EPIC). Breast Cancer Res. Treat. 2010, 119, 753–765. [Google Scholar] [CrossRef]
- Zamora-Ros, R.; Ferrari, P.; González, C.A.; Tjønneland, A.; Olsen, A.; Bredsdorff, L.; Overvad, K.; Touillaud, M.; Perquier, F.; Fagherazzi, G.; et al. Dietary Flavonoid and Lignan Intake and Breast Cancer Risk According to Menopause and Hormone Receptor Status in the European Prospective Investigation into Cancer and Nutrition (EPIC) Study. Breast Cancer Res. Treat. 2013, 139, 163–176. [Google Scholar] [CrossRef]
- De Batlle, J.; Ferrari, P.; Chajes, V.; Park, J.Y.; Slimani, N.; McKenzie, F.; Overvad, K.; Roswall, N.; Tjønneland, A.; Boutron-Ruault, M.C.; et al. Dietary Folate Intake and Breast Cancer Risk: European Prospective Investigation into Cancer and Nutrition. J. Natl. Cancer Inst. 2015, 107, 367. [Google Scholar] [CrossRef] [PubMed]
- Kyrø, C.; Zamora-Ros, R.; Scalbert, A.; Tjønneland, A.; Dossus, L.; Johansen, C.; Bidstrup, P.E.; Weiderpass, E.; Christensen, J.; Ward, H.; et al. Pre-Diagnostic Polyphenol Intake and Breast Cancer Survival: The European Prospective Investigation into Cancer and Nutrition (EPIC) Cohort. Breast Cancer Res. Treat. 2015, 154, 389–401. [Google Scholar] [CrossRef] [PubMed]
- Matejcic, M.; de Batlle, J.; Ricci, C.; Biessy, C.; Perrier, F.; Huybrechts, I.; Weiderpass, E.; Boutron-Ruault, M.C.; Cadeau, C.; His, M.; et al. Biomarkers of Folate and Vitamin B12 and Breast Cancer Risk: Report from the EPIC Cohort. Int. J. Cancer 2017, 140, 1246–1259. [Google Scholar] [CrossRef] [PubMed]
- Büchner, F.L.; Bueno-de-Mesquita, H.B.; Linseisen, J.; Boshuizen, H.C.; Kiemeney, L.A.L.M.; Ros, M.M.; Overvad, K.; Hansen, L.; Tjonneland, A.; Raaschou-Nielsen, O.; et al. Fruits and Vegetables Consumption and the Risk of Histological Subtypes of Lung Cancer in the European Prospective Investigation into Cancer and Nutrition (EPIC). Cancer Causes Control 2010, 21, 357–371. [Google Scholar] [CrossRef]
- Linseisen, J.; Rohrmann, S.; Miller, A.B.; Bueno-de-Mesquita, H.B.; Büchner, F.L.; Vineis, P.; Agudo, A.; Gram, I.T.; Janson, L.; Krogh, V.; et al. Fruit and Vegetable Consumption and Lung Cancer Risk: Updated Information from the European Prospective Investigation into Cancer and Nutrition (EPIC). Int. J. Cancer 2007, 121, 1103–1114. [Google Scholar] [CrossRef]
- Miller, A.B.; Altenburg, H.-P.; Bueno-de-Mesquita, B.; Boshuizen, H.C.; Agudo, A.; Berrino, F.; Gram, I.T.; Janson, L.; Linseisen, J.; Overvad, K.; et al. Fruits and Vegetables and Lung Cancer: Findings from the European Prospective Investigation into Cancer and Nutrition. Int. J. Cancer 2004, 108, 269–276. [Google Scholar] [CrossRef]
- Linseisen, J.; Rohrmann, S.; Bueno-de-Mesquita, B.; Büchner, F.L.; Boshuizen, H.C.; Agudo, A.; Gram, I.T.; Dahm, C.C.; Overvad, K.; Egeberg, R.; et al. Consumption of Meat and Fish and Risk of Lung Cancer: Results from the European Prospective Investigation into Cancer and Nutrition. Cancer Causes Control 2011, 22, 909–918. [Google Scholar] [CrossRef]
- Rohrmann, S.; Linseisen, J.; Boshuizen, H.C.; Whittaker, J.; Agudo, A.; Vineis, P.; Boffetta, P.; Jensen, M.K.; Olsen, A.; Overvad, K.; et al. Ethanol Intake and Risk of Lung Cancer in the European Prospective Investigation into Cancer and Nutrition (EPIC). Am. J. Epidemiol. 2006, 164, 1103–1114. [Google Scholar] [CrossRef] [PubMed]
- Johansson, M.; Relton, C.; Ueland, P.M.; Vollset, S.E.; Midttun, Ø.; Nygård, O.; Slimani, N.; Boffetta, P.; Jenab, M.; Clavel-Chapelon, F.; et al. Serum B Vitamin Levels and Risk of Lung Cancer. JAMA 2010, 303, 2377–2385. [Google Scholar] [CrossRef] [PubMed]
- Myint, P.K.; Wilson, A.M.; Clark, A.B.; Luben, R.N.; Wareham, N.J.; Khaw, K.-T. Plasma Vitamin C Concentrations and Risk of Incident Respiratory Diseases and Mortality in the European Prospective Investigation into Cancer-Norfolk Population-Based Cohort Study. Eur. J. Clin. Nutr. 2019, 73, 1492–1500. [Google Scholar] [CrossRef] [PubMed]
- Nimptsch, K.; Rohrmann, S.; Kaaks, R.; Linseisen, J. Dietary Vitamin K Intake in Relation to Cancer Incidence and Mortality: Results from the Heidelberg Cohort of the European Prospective Investigation into Cancer and Nutrition (EPIC-Heidelberg). Am. J. Clin. Nutr. 2010, 91, 1348–1358. [Google Scholar] [CrossRef]
- Ward, H.A.; Whitman, J.; Muller, D.C.; Johansson, M.; Jakszyn, P.; Weiderpass, E.; Palli, D.; Fanidi, A.; Vermeulen, R.; Tjønneland, A.; et al. Haem Iron Intake and Risk of Lung Cancer in the European Prospective Investigation into Cancer and Nutrition (EPIC) Cohort. Eur. J. Clin. Nutr. 2019, 73, 1122–1132. [Google Scholar] [CrossRef] [PubMed]
- Zuo, H.; Ueland, P.M.; Midttun, Ø.; Vollset, S.E.; Tell, G.S.; Theofylaktopoulou, D.; Travis, R.C.; Boutron-Ruault, M.-C.; Fournier, A.; Severi, G.; et al. Results from the European Prospective Investigation into Cancer and Nutrition Link Vitamin B6 Catabolism and Lung Cancer Risk. Cancer Res. 2018, 78, 302–308. [Google Scholar] [CrossRef]
- Key, T.J.; Allen, N.; Appleby, P.; Overvad, K.; Tjønneland, A.; Miller, A.; Boeing, H.; Karalis, D.; Psaltopoulou, T.; Berrino, F.; et al. Fruits and Vegetables and Prostate Cancer: No Association among 1104 Cases in a Prospective Study of 130544 Men in the European Prospective Investigation into Cancer and Nutrition (EPIC). Int. J. Cancer 2004, 109, 119–124. [Google Scholar] [CrossRef]
- Perez-Cornago, A.; Travis, R.C.; Appleby, P.N.; Tsilidis, K.K.; Tjønneland, A.; Olsen, A.; Overvad, K.; Katzke, V.; Kühn, T.; Trichopoulou, A.; et al. Fruit and Vegetable Intake and Prostate Cancer Risk in the European Prospective Investigation into Cancer and Nutrition (EPIC). Int. J. Cancer 2017, 141, 287–297. [Google Scholar] [CrossRef]
- Suzuki, R.; Allen, N.E.; Key, T.J.; Appleby, P.N.; Tjønneland, A.; Johnsen, N.F.; Jensen, M.K.; Overvad, K.; Boeing, H.; Pischon, T.; et al. A Prospective Analysis of the Association between Dietary Fiber Intake and Prostate Cancer Risk in EPIC. Int. J. Cancer 2009, 124, 245–249. [Google Scholar] [CrossRef]
- Crowe, F.L.; Key, T.J.; Appleby, P.N.; Travis, R.C.; Overvad, K.; Jakobsen, M.U.; Johnsen, N.F.; Tjønneland, A.; Linseisen, J.; Rohrmann, S.; et al. Dietary Fat Intake and Risk of Prostate Cancer in the European Prospective Investigation into Cancer and Nutrition. Am. J. Clin. Nutr. 2008, 87, 1405–1413. [Google Scholar] [CrossRef] [PubMed]
- Allen, N.E.; Key, T.J.; Appleby, P.N.; Travis, R.C.; Roddam, A.W.; Tjønneland, A.; Johnsen, N.F.; Overvad, K.; Linseisen, J.; Rohrmann, S.; et al. Animal Foods, Protein, Calcium and Prostate Cancer Risk: The European Prospective Investigation into Cancer and Nutrition. Br. J. Cancer 2008, 98, 1574–1581. [Google Scholar] [CrossRef] [PubMed]
- Rohrmann, S.; Linseisen, J.; Key, T.J.; Jensen, M.K.; Overvad, K.; Johnsen, N.F.; Tjønneland, A.; Kaaks, R.; Bergmann, M.M.; Weikert, C.; et al. Alcohol Consumption and the Risk for Prostate Cancer in the European Prospective Investigation into Cancer and Nutrition. Cancer Epidemiol. Biomark. Prev. 2008, 17, 1282–1287. [Google Scholar] [CrossRef] [PubMed]
- Sen, A.; Papadimitriou, N.; Lagiou, P.; Perez-Cornago, A.; Travis, R.C.; Key, T.J.; Murphy, N.; Gunter, M.; Freisling, H.; Tzoulaki, I.; et al. Coffee and Tea Consumption and Risk of Prostate Cancer in the European Prospective Investigation into Cancer and Nutrition. Int. J. Cancer 2019, 144, 240–250. [Google Scholar] [CrossRef] [PubMed]
- Nimptsch, K.; Rohrmann, S.; Linseisen, J. Dietary Intake of Vitamin K and Risk of Prostate Cancer in the Heidelberg Cohort of the European Prospective Investigation into Cancer and Nutrition (EPIC-Heidelberg). Am. J. Clin. Nutr. 2008, 87, 985–992. [Google Scholar] [CrossRef]
- Nimptsch, K.; Rohrmann, S.; Nieters, A.; Linseisen, J. Serum Undercarboxylated Osteocalcin as Biomarker of Vitamin K Intake and Risk of Prostate Cancer: A Nested Case-Control Study in the Heidelberg Cohort of the European Prospective Investigation into Cancer and Nutrition. Cancer Epidemiol. Biomark. Prev. 2009, 18, 49–56. [Google Scholar] [CrossRef]
- Perez-Cornago, A.; Huybrechts, I.; Appleby, P.N.; Schmidt, J.A.; Crowe, F.L.; Overvad, K.; Tjønneland, A.; Kühn, T.; Katzke, V.; Trichopoulou, A.; et al. Intake of Individual Fatty Acids and Risk of Prostate Cancer in the European Prospective Investigation into Cancer and Nutrition. Int. J. Cancer 2020, 146, 44–57. [Google Scholar] [CrossRef]
- Price, A.J.; Allen, N.E.; Appleby, P.N.; Crowe, F.L.; Jenab, M.; Rinaldi, S.; Slimani, N.; Kaaks, R.; Rohrmann, S.; Boeing, H.; et al. Plasma Phytanic Acid Concentration and Risk of Prostate Cancer: Results from the European Prospective Investigation into Cancer and Nutrition. Am. J. Clin. Nutr. 2010, 91, 1769–1776. [Google Scholar] [CrossRef]
- Allen, N.E.; Key, T.J.; Appleby, P.N.; Travis, R.C.; Roddam, A.W.; Rinaldi, S.; Egevad, L.; Rohrmann, S.; Linseisen, J.; Pischon, T.; et al. Serum Insulin-like Growth Factor (IGF)-I and IGF-Binding Protein-3 Concentrations and Prostate Cancer Risk: Results from the European Prospective Investigation into Cancer and Nutrition. Cancer Epidemiol. Biomark. Prev. 2007, 16, 1121–1127. [Google Scholar] [CrossRef]
- Key, T.J.; Appleby, P.N.; Allen, N.E.; Travis, R.C.; Roddam, A.W.; Jenab, M.; Egevad, L.; Tjønneland, A.; Johnsen, N.F.; Overvad, K.; et al. Plasma Carotenoids, Retinol, and Tocopherols and the Risk of Prostate Cancer in the European Prospective Investigation into Cancer and Nutrition Study. Am. J. Clin. Nutr. 2007, 86, 672–681. [Google Scholar] [CrossRef]
- Allen, N.E.; Appleby, P.N.; Roddam, A.W.; Tjønneland, A.; Johnsen, N.F.; Overvad, K.; Boeing, H.; Weikert, S.; Kaaks, R.; Linseisen, J.; et al. Plasma Selenium Concentration and Prostate Cancer Risk: Results from the European Prospective Investigation into Cancer and Nutrition (EPIC). Am. J. Clin. Nutr. 2008, 88, 1567–1575. [Google Scholar] [CrossRef]
- Crowe, F.L.; Allen, N.E.; Appleby, P.N.; Overvad, K.; Aardestrup, I.V.; Johnsen, N.F.; Tjønneland, A.; Linseisen, J.; Kaaks, R.; Boeing, H.; et al. Fatty Acid Composition of Plasma Phospholipids and Risk of Prostate Cancer in a Case-Control Analysis Nested within the European Prospective Investigation into Cancer and Nutrition. Am. J. Clin. Nutr. 2008, 88, 1353–1363. [Google Scholar] [CrossRef]
- Travis, R.; Crowe, F.; Allen, N.; Appleby, P.; Roddam, A.; Tjønneland, A.; Olsen, A.; Linseisen, J.; Kaaks, R.; Boeing, H.; et al. Serum Vitamin D and Risk of Prostate Cancer in a Case-Control Analysis Nested within the European Prospective Investigation into Cancer and Nutrition (EPIC). Am. J. Epidemiol. 2009, 169, 1223–1232. [Google Scholar] [CrossRef]
- Travis, R.C.; Spencer, E.A.; Allen, N.E.; Appleby, P.N.; Roddam, A.W.; Overvad, K.; Johnsen, N.F.; Olsen, A.; Kaaks, R.; Linseisen, J.; et al. Plasma Phyto-Oestrogens and Prostate Cancer in the European Prospective Investigation into Cancer and Nutrition. Br. J. Cancer 2009, 100, 1817–1823. [Google Scholar] [CrossRef]
- Steinbrecher, A.; Rohrmann, S.; Timofeeva, M.; Risch, A.; Jansen, E.; Linseisen, J. Dietary Glucosinolate Intake, Polymorphisms in Selected Biotransformation Enzymes, and Risk of Prostate Cancer. Cancer Epidemiol. Biomark. Prev. 2010, 19, 135–143. [Google Scholar] [CrossRef]
- Dahm, C.C.; Gorst-Rasmussen, A.; Crowe, F.L.; Roswall, N.; Tjønneland, A.; Drogan, D.; Boeing, H.; Teucher, B.; Kaaks, R.; Adarakis, G.; et al. Fatty Acid Patterns and Risk of Prostate Cancer in a Case-Control Study Nested within the European Prospective Investigation into Cancer and Nutrition. Am. J. Clin. Nutr. 2012, 96, 1354–1361. [Google Scholar] [CrossRef]
- Jakszyn, P.G.; Allen, N.E.; Lujan-Barroso, L.; Gonzalez, C.A.; Key, T.J.; Fonseca-Nunes, A.; Tjønneland, A.; Føns-Johnsen, N.; Overvad, K.; Teucher, B.; et al. Nitrosamines and Heme Iron and Risk of Prostate Cancer in the European Prospective Investigation into Cancer and Nutrition. Cancer Epidemiol. Biomark. Prev. 2012, 21, 547–551. [Google Scholar] [CrossRef] [PubMed]
- Papadimitriou, N.; Muller, D.; van den Brandt, P.A.; Geybels, M.; Patel, C.J.; Gunter, M.J.; Lopez, D.S.; Key, T.J.; Perez-Cornago, A.; Ferrari, P.; et al. A Nutrient-Wide Association Study for Risk of Prostate Cancer in the European Prospective Investigation into Cancer and Nutrition and the Netherlands Cohort Study. Eur. J. Nutr. 2020, 59, 2929–2937. [Google Scholar] [CrossRef] [PubMed]
- Barzi, A.; Lenz, A.; Labonte, M.; Lenz, H. Molecular Pathways: Estrogen Pathway in Colorectal Cancer. Clin. Cancer Res. 2013, 19, 5842–5848. [Google Scholar] [CrossRef] [PubMed]
- Potter, J.; Slattery, M.; Bostick, R.; Gapstur, S. Colon Cancer: A Review of the Epidemiology. Epidemiol. Rev. 1993, 15, 499–545. [Google Scholar] [CrossRef] [PubMed]
- Dimitrakopoulou, V.I.; Tsilidis, K.K.; Haycock, P.C.; Dimou, N.L.; Al-Dabhani, K.; Martin, R.M.; Lewis, S.J.; Gunter, M.J.; Mondul, A.; Shui, I.M.; et al. Circulating Vitamin D Concentration and Risk of Seven Cancers: Mendelian Randomisation Study. BMJ 2017, 359, j4761. [Google Scholar] [CrossRef] [PubMed]
- Bouvard, V.; Loomis, D.; Guyton, K.Z.; Grosse, Y.; Ghissassi, F.E.; Benbrahim-Tallaa, L.; Guha, N.; Mattock, H.; Straif, K. Carcinogenicity of Consumption of Red and Processed Meat. Lancet Oncol. 2015, 16, 1599–1600. [Google Scholar] [CrossRef]
- Veettil, S.K.; Wong, T.Y.; Loo, Y.S.; Playdon, M.C.; Lai, N.M.; Giovannucci, E.L.; Chaiyakunapruk, N. Role of Diet in Colorectal Cancer Incidence: Umbrella Review of Meta-Analyses of Prospective Observational Studies. JAMA Netw. Open 2021, 4, e2037341. [Google Scholar] [CrossRef] [PubMed]
- McDonald, J.A.; Goyal, A.; Terry, M.B. Alcohol Intake and Breast Cancer Risk: Weighing the Overall Evidence. Curr. Breast Cancer Rep. 2013, 5, 208–221. [Google Scholar] [CrossRef]
- Holmes, M.D.; Willett, W.C. Does Diet Affect Breast Cancer Risk? Breast Cancer Res. 2004, 6, 170–178. [Google Scholar] [CrossRef] [PubMed]
- Zeinomar, N.; Knight, J.A.; Genkinger, J.M.; Phillips, K.A.; Daly, M.B.; Milne, R.L.; Dite, G.S.; Kehm, R.D.; Liao, Y.; Southey, M.C.; et al. Alcohol Consumption, Cigarette Smoking, and Familial Breast Cancer Risk: Findings from the Prospective Family Study Cohort (ProF-SC). Breast Cancer Res. 2019, 21, 16. [Google Scholar] [CrossRef] [PubMed]
- Hamajima, N.; Hirose, K.; Tajima, K.; Rohan, T.; Calle, E.E.; Heath, C.W.; Coates, R.J.; Liff, J.M.; Talamini, R.; Chantarakul, N.; et al. Alcohol, Tobacco and Breast Cancer—Collaborative Reanalysis of Individual Data from 53 Epidemiological Studies, Including 58 515 Women with Breast Cancer and 95 067 Women without the Disease. Br. J. Cancer 2002, 87, 1234–1245. [Google Scholar] [CrossRef] [PubMed]
- Dandamudi, A.; Tommie, J.; Nommsen-Rivers, L.; Couch, S. Dietary Patterns and Breast Cancer Risk: A Systematic Review. Anticancer. Res. 2018, 38, 3209–3222. [Google Scholar] [CrossRef] [PubMed]
- Boyd, N.F.; Stone, J.; Vogt, K.N.; Connelly, B.S.; Martin, L.J.; Minkin, S. Dietary Fat and Breast Cancer Risk Revisited: A Meta-Analysis of the Published Literature. Br. J. Cancer 2003, 89, 1672–1685. [Google Scholar] [CrossRef]
- Xia, H.; Ma, S.; Wang, S.; Sun, G. Meta-Analysis of Saturated Fatty Acid Intake and Breast Cancer Risk. Medicine 2015, 94. [Google Scholar] [CrossRef]
- Cao, Y.; Hou, L.; Wang, W. Dietary Total Fat and Fatty Acids Intake, Serum Fatty Acids and Risk of Breast Cancer: A Meta-Analysis of Prospective Cohort Studies. Int. J. Cancer 2016, 138, 1894–1904. [Google Scholar] [CrossRef] [PubMed]
- Boeke, C.E.; Eliassen, A.H.; Chen, W.Y.; Cho, E.; Holmes, M.D.; Rosner, B.; Willett, W.C.; Tamimi, R.M. Dietary Fat Intake in Relation to Lethal Breast Cancer in Two Large Prospective Cohort Studies. Breast Cancer Res. Treat. 2014, 146, 383–392. [Google Scholar] [CrossRef] [PubMed]
- Luo, J.; Shen, L.; Zheng, D. Association between Vitamin C Intake and Lung Cancer: A Dose-Response Meta-Analysis. Sci. Rep. 2014, 4, 1–7. [Google Scholar] [CrossRef] [PubMed]
- Wang, M.; Qin, S.; Zhang, T.; Song, X.; Zhang, S. The Effect of Fruit and Vegetable Intake on the Development of Lung Cancer: A Meta-Analysis of 32 Publications and 20 414 Cases. Eur. J. Clin. Nutr. 2015, 69, 1184–1192. [Google Scholar] [CrossRef] [PubMed]
- Vieira, A.R.; Abar, L.; Vingeliene, S.; Chan, D.S.M.; Aune, D.; Navarro-Rosenblatt, D.; Stevens, C.; Greenwood, D.; Norat, T. Fruits, Vegetables and Lung Cancer Risk: A Systematic Review and Meta-Analysis. Ann. Oncol. 2016, 27, 81–96. [Google Scholar] [CrossRef]
- Zuccolo, L.; Lewis, S.; Hamdy, F.; Neal, D.; Donovan, J.; Smith, G.D. O6-2.5 Alcohol and Prostate Cancer Risk: A Mendelian Randomisation Approach. J. Epidemiol. Commun. Health 2011, 65 (Suppl. 1), A60. [Google Scholar] [CrossRef][Green Version]
- Brunner, C.; Davies, N.M.; Martin, R.M.; Eeles, R.; Easton, D.; Kote-Jarai, Z.; Al Olama, A.A.; Benlloch, S.; Muir, K.; Giles, G.; et al. Alcohol Consumption and Prostate Cancer Incidence and Progression: A Mendelian Randomisation Study. Int. J. Cancer 2017, 140, 75–85. [Google Scholar] [CrossRef]
- Oczkowski, M.; Dziendzikowska, K.; Pasternak-Winiarska, A.; Włodarek, D.; Gromadzka-Ostrowska, J. Dietary Factors and Prostate Cancer Development, Progression, and Reduction. Nutrients 2021, 13, 496. [Google Scholar] [CrossRef]
- Wolk, A. Diet, Lifestyle and Risk of Prostate Cancer. Acta Oncol. 2005, 44, 277–281. [Google Scholar] [CrossRef]
- Lippmann, D.; Lehmann, C.; Florian, S.; Barknowitz, G.; Haack, M.; Mewis, I.; Wiesner, M.; Schreiner, M.; Glatt, H.; Brigelius-Flohé, R.; et al. Glucosinolates from Pak Choi and Broccoli Induce Enzymes and Inhibit Inflammation and Colon Cancer Differently. Food Funct. 2014, 5, 1073–1081. [Google Scholar] [CrossRef]
- Gilsing, A.; Fransen, F.; de Kok, T.; Goldbohm, A.; Schouten, L.; de Bruïne, A.; van Engeland, M.; van den Brandt, P.; de Goeij, A.; Weijenberg, M. Dietary Heme Iron and the Risk of Colorectal Cancer with Specific Mutations in KRAS and APC. Carcinogenesis 2013, 34, 2757–2766. [Google Scholar] [CrossRef] [PubMed]
- Seitz, H.K.; Stickel, F. Molecular Mechanisms of Alcohol-Mediated Carcinogenesis. Nat. Rev. Cancer 2007, 7, 599–612. [Google Scholar] [CrossRef] [PubMed]
- Albano, E. Alcohol, Oxidative Stress and Free Radical Damage. Proc. Nutr. Soc. 2006, 65, 278–290. [Google Scholar] [CrossRef] [PubMed]
- Boffetta, P.; Hashibe, M. Alcohol and Cancer. Lancet Oncol. 2006, 7, 149–156. [Google Scholar] [CrossRef]
- Hankinson, S.; Willett, W.; Manson, J.; Hunter, D.; Colditz, G.; Stampfer, M.; Longcope, C.; Speizer, F. Alcohol, Height, and Adiposity in Relation to Estrogen and Prolactin Levels in Postmenopausal Women. J. Natl. Cancer Inst. 1995, 87, 1297–1302. [Google Scholar] [CrossRef] [PubMed]

Publisher’s Note: MDPI stays neutral with regard to jurisdictional claims in published maps and institutional affiliations. |
© 2021 by the authors. Licensee MDPI, Basel, Switzerland. This article is an open access article distributed under the terms and conditions of the Creative Commons Attribution (CC BY) license (https://creativecommons.org/licenses/by/4.0/).
Share and Cite
Ubago-Guisado, E.; Rodríguez-Barranco, M.; Ching-López, A.; Petrova, D.; Molina-Montes, E.; Amiano, P.; Barricarte-Gurrea, A.; Chirlaque, M.-D.; Agudo, A.; Sánchez, M.-J. Evidence Update on the Relationship between Diet and the Most Common Cancers from the European Prospective Investigation into Cancer and Nutrition (EPIC) Study: A Systematic Review. Nutrients 2021, 13, 3582. https://doi.org/10.3390/nu13103582
Ubago-Guisado E, Rodríguez-Barranco M, Ching-López A, Petrova D, Molina-Montes E, Amiano P, Barricarte-Gurrea A, Chirlaque M-D, Agudo A, Sánchez M-J. Evidence Update on the Relationship between Diet and the Most Common Cancers from the European Prospective Investigation into Cancer and Nutrition (EPIC) Study: A Systematic Review. Nutrients. 2021; 13(10):3582. https://doi.org/10.3390/nu13103582
Chicago/Turabian StyleUbago-Guisado, Esther, Miguel Rodríguez-Barranco, Ana Ching-López, Dafina Petrova, Esther Molina-Montes, Pilar Amiano, Aurelio Barricarte-Gurrea, María-Dolores Chirlaque, Antonio Agudo, and María-José Sánchez. 2021. "Evidence Update on the Relationship between Diet and the Most Common Cancers from the European Prospective Investigation into Cancer and Nutrition (EPIC) Study: A Systematic Review" Nutrients 13, no. 10: 3582. https://doi.org/10.3390/nu13103582
APA StyleUbago-Guisado, E., Rodríguez-Barranco, M., Ching-López, A., Petrova, D., Molina-Montes, E., Amiano, P., Barricarte-Gurrea, A., Chirlaque, M.-D., Agudo, A., & Sánchez, M.-J. (2021). Evidence Update on the Relationship between Diet and the Most Common Cancers from the European Prospective Investigation into Cancer and Nutrition (EPIC) Study: A Systematic Review. Nutrients, 13(10), 3582. https://doi.org/10.3390/nu13103582