Procyanidin—Cell Wall Interactions within Apple Matrices Decrease the Metabolization of Procyanidins by the Human Gut Microbiota and the Anti-Inflammatory Effect of the Resulting Microbial Metabolome In Vitro

 , , ,
, , ,
Abstract
:1. Introduction
2. Material and Methods
2.1. Standards and Chemicals
2.2. Preparation of Apple Matrices with Different Polyphenol-Cell Wall Linkages
2.2.1. Plant Material
2.2.2. Industrial Processing of Apple Purée
2.2.3. Extensive Rinsing of Apple Purées
2.2.4. Extraction and Purification of the Phenolic Fraction
2.2.5. Preparation of Cell Wall Material
2.2.6. Assembly of the Mno Matrix
2.3. In Vitro Batch Fermentation and Sample Collection
2.4. Biochemical Analyses
2.4.1. Cell Wall Analysis in Apple Matrix
2.4.2. Polyphenol Analysis in Apple Matrices
2.4.3. Polyphenol Analysis in Fecal Slurries
2.4.4. Analysis of Microbial Metabolites
2.5. Microbiota Analyses
2.5.1. DNA Extraction
2.5.2. Sequencing Strategy and Data Analysis
2.5.3. Quantitative Real-Time PCR (qPCR)
2.6. Inflammation Assays
2.7. Statistical Analyses
3. Results
3.1. Characterization of the Apple Matrices
3.1.1. Phenolic Composition
3.1.2. Cell Wall Composition
3.2. Metabolism of the Apple Matrices during In Vitro Fermentation with Fecal Microbiota
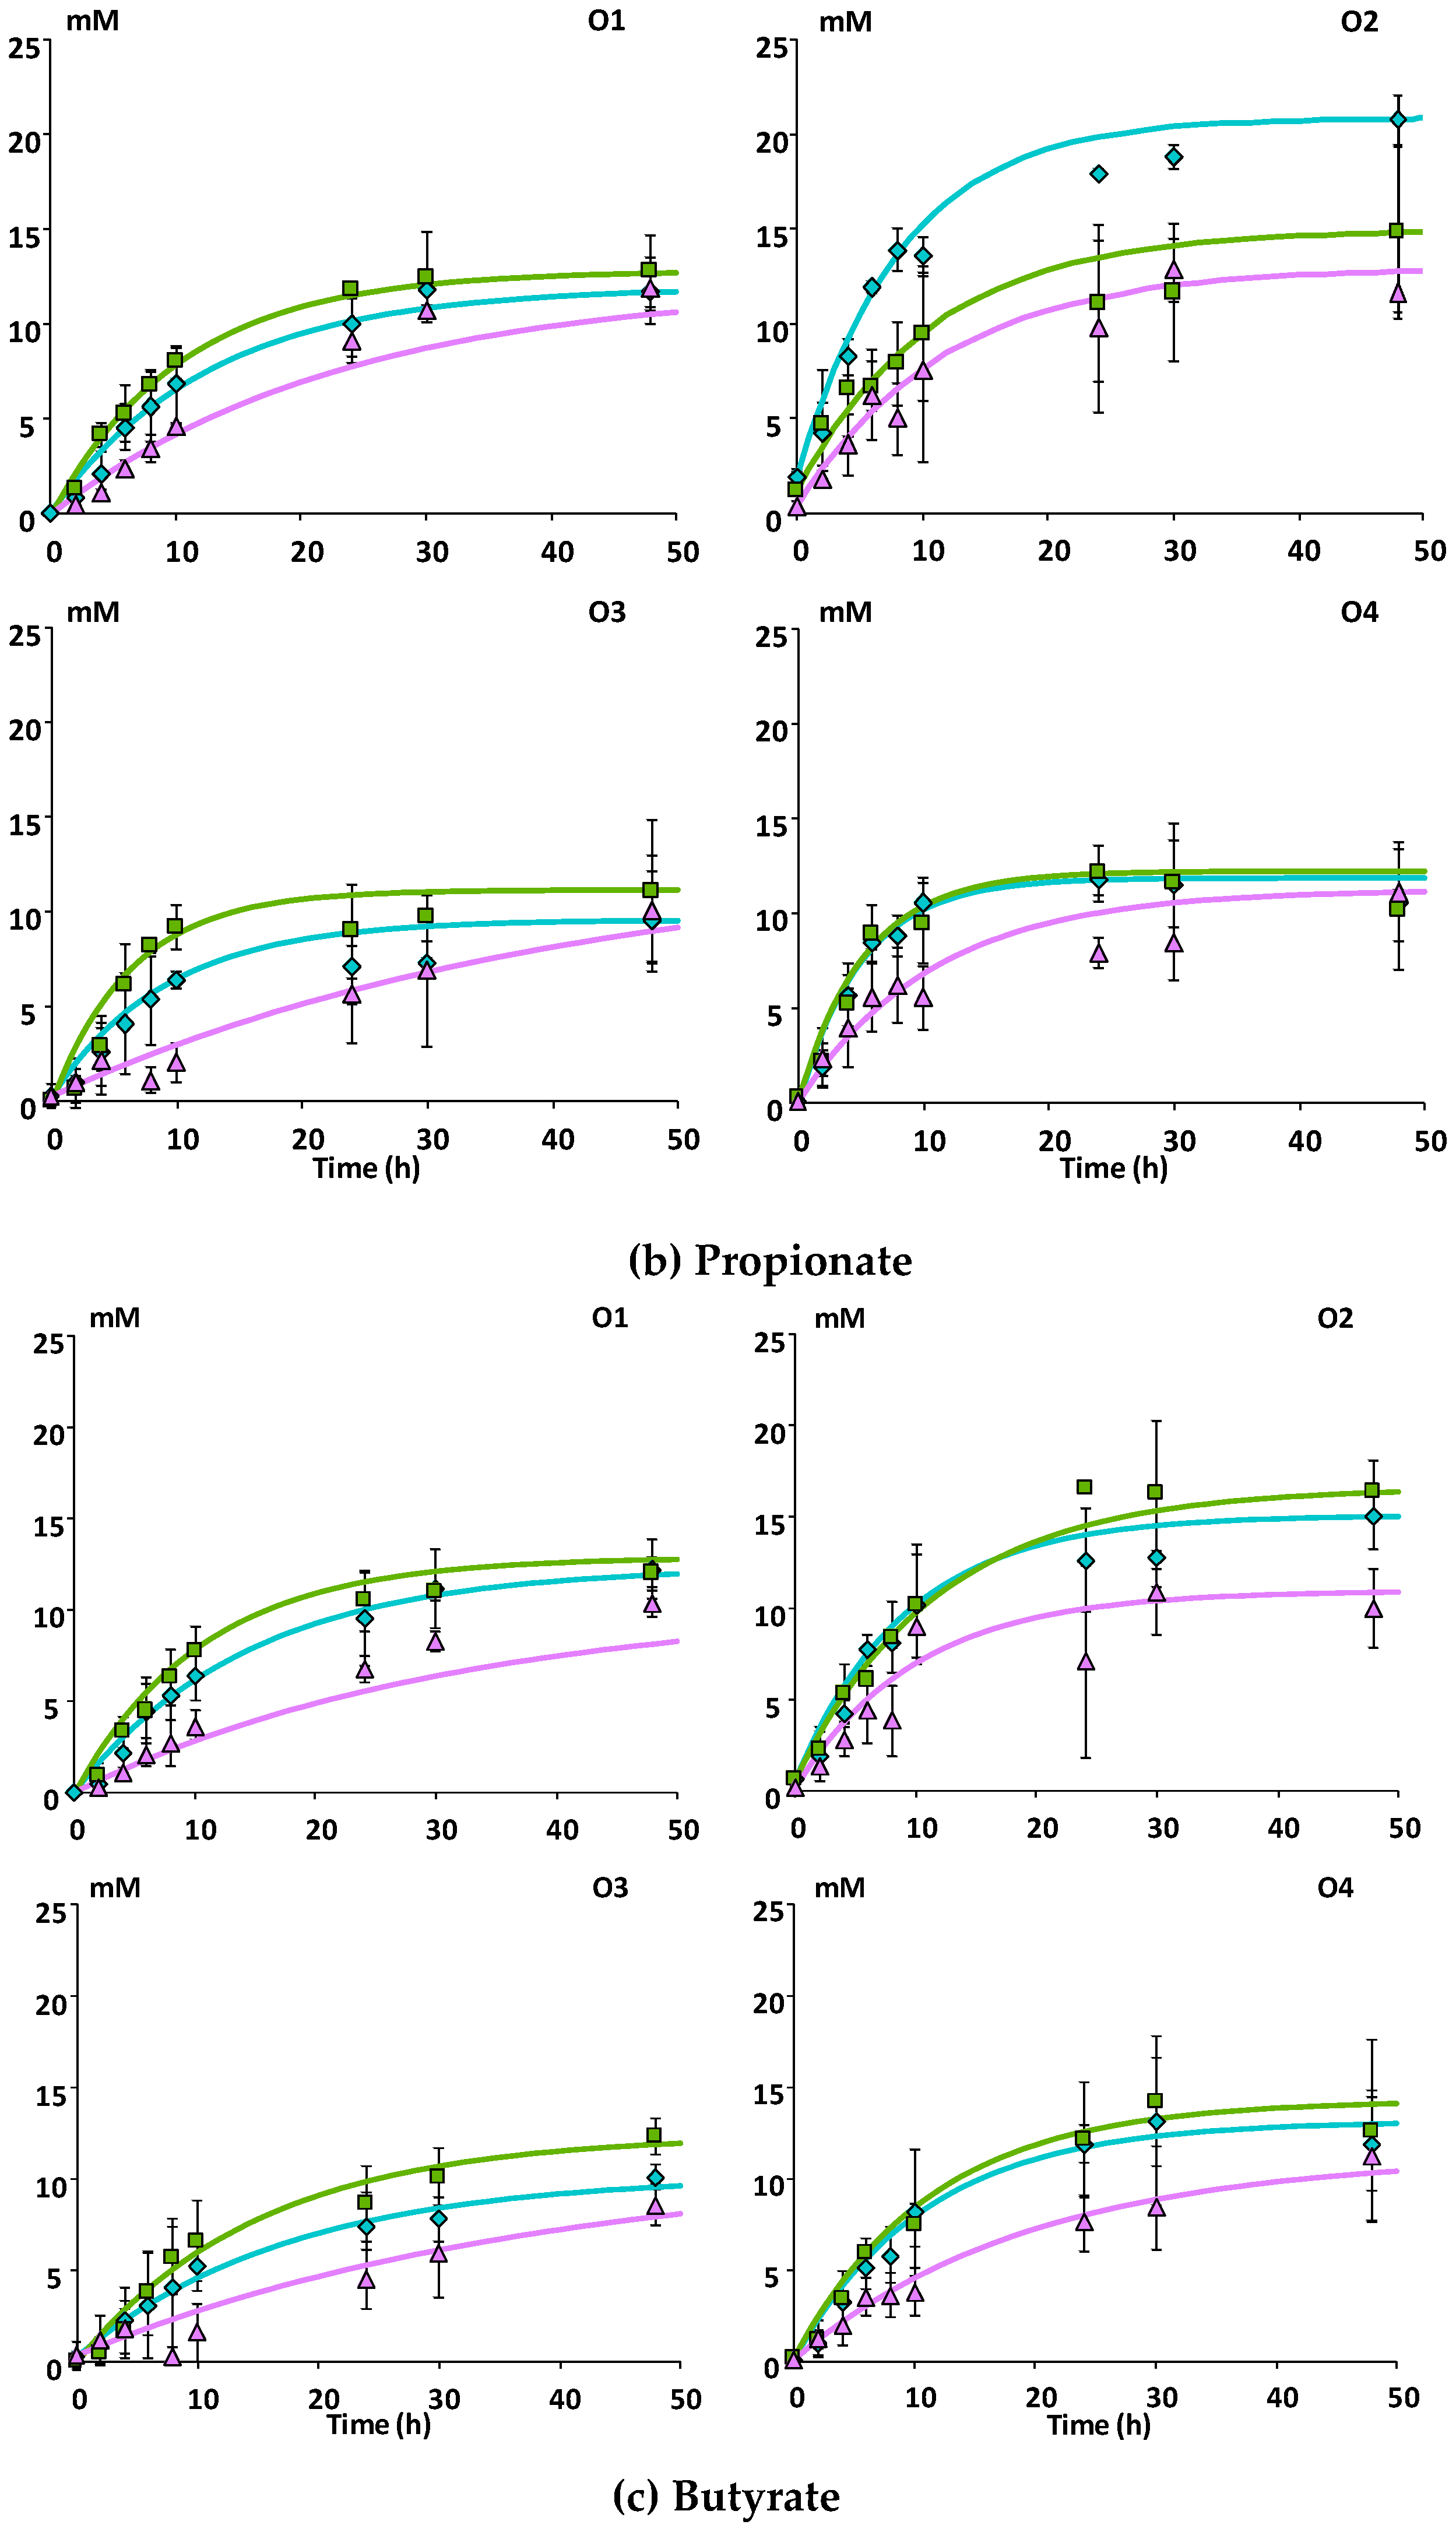
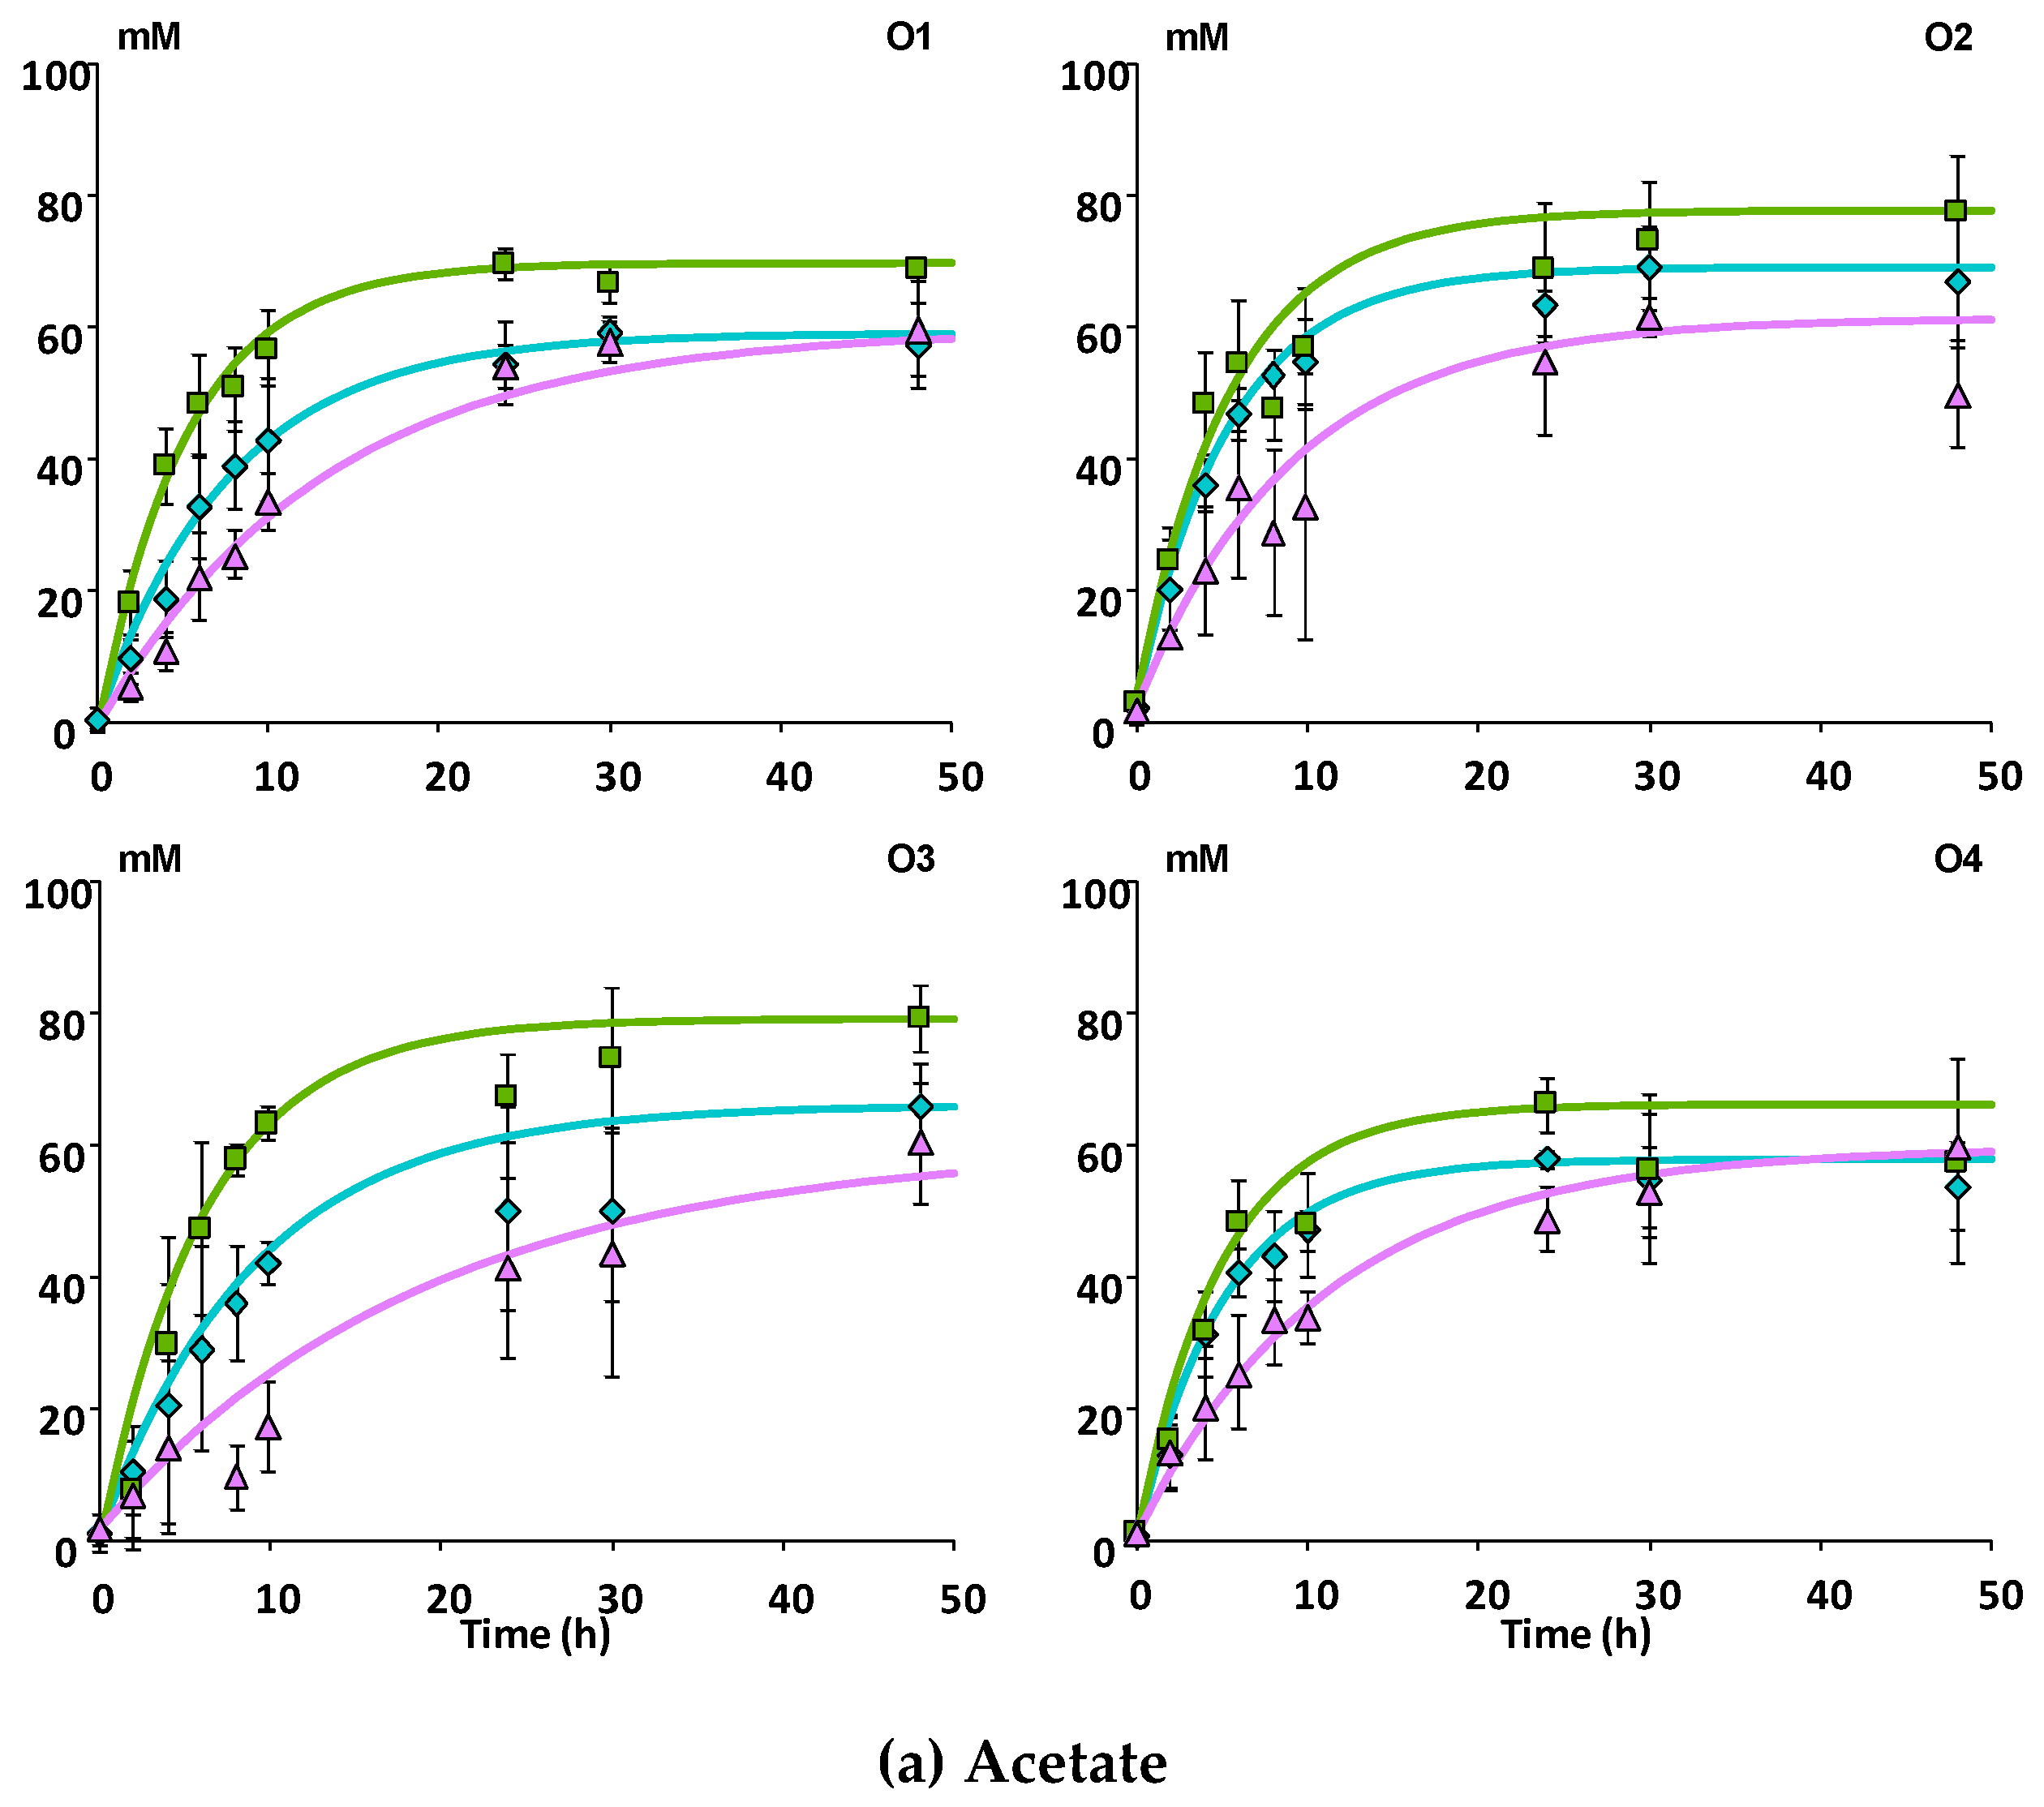
3.2.1. SCFA Production
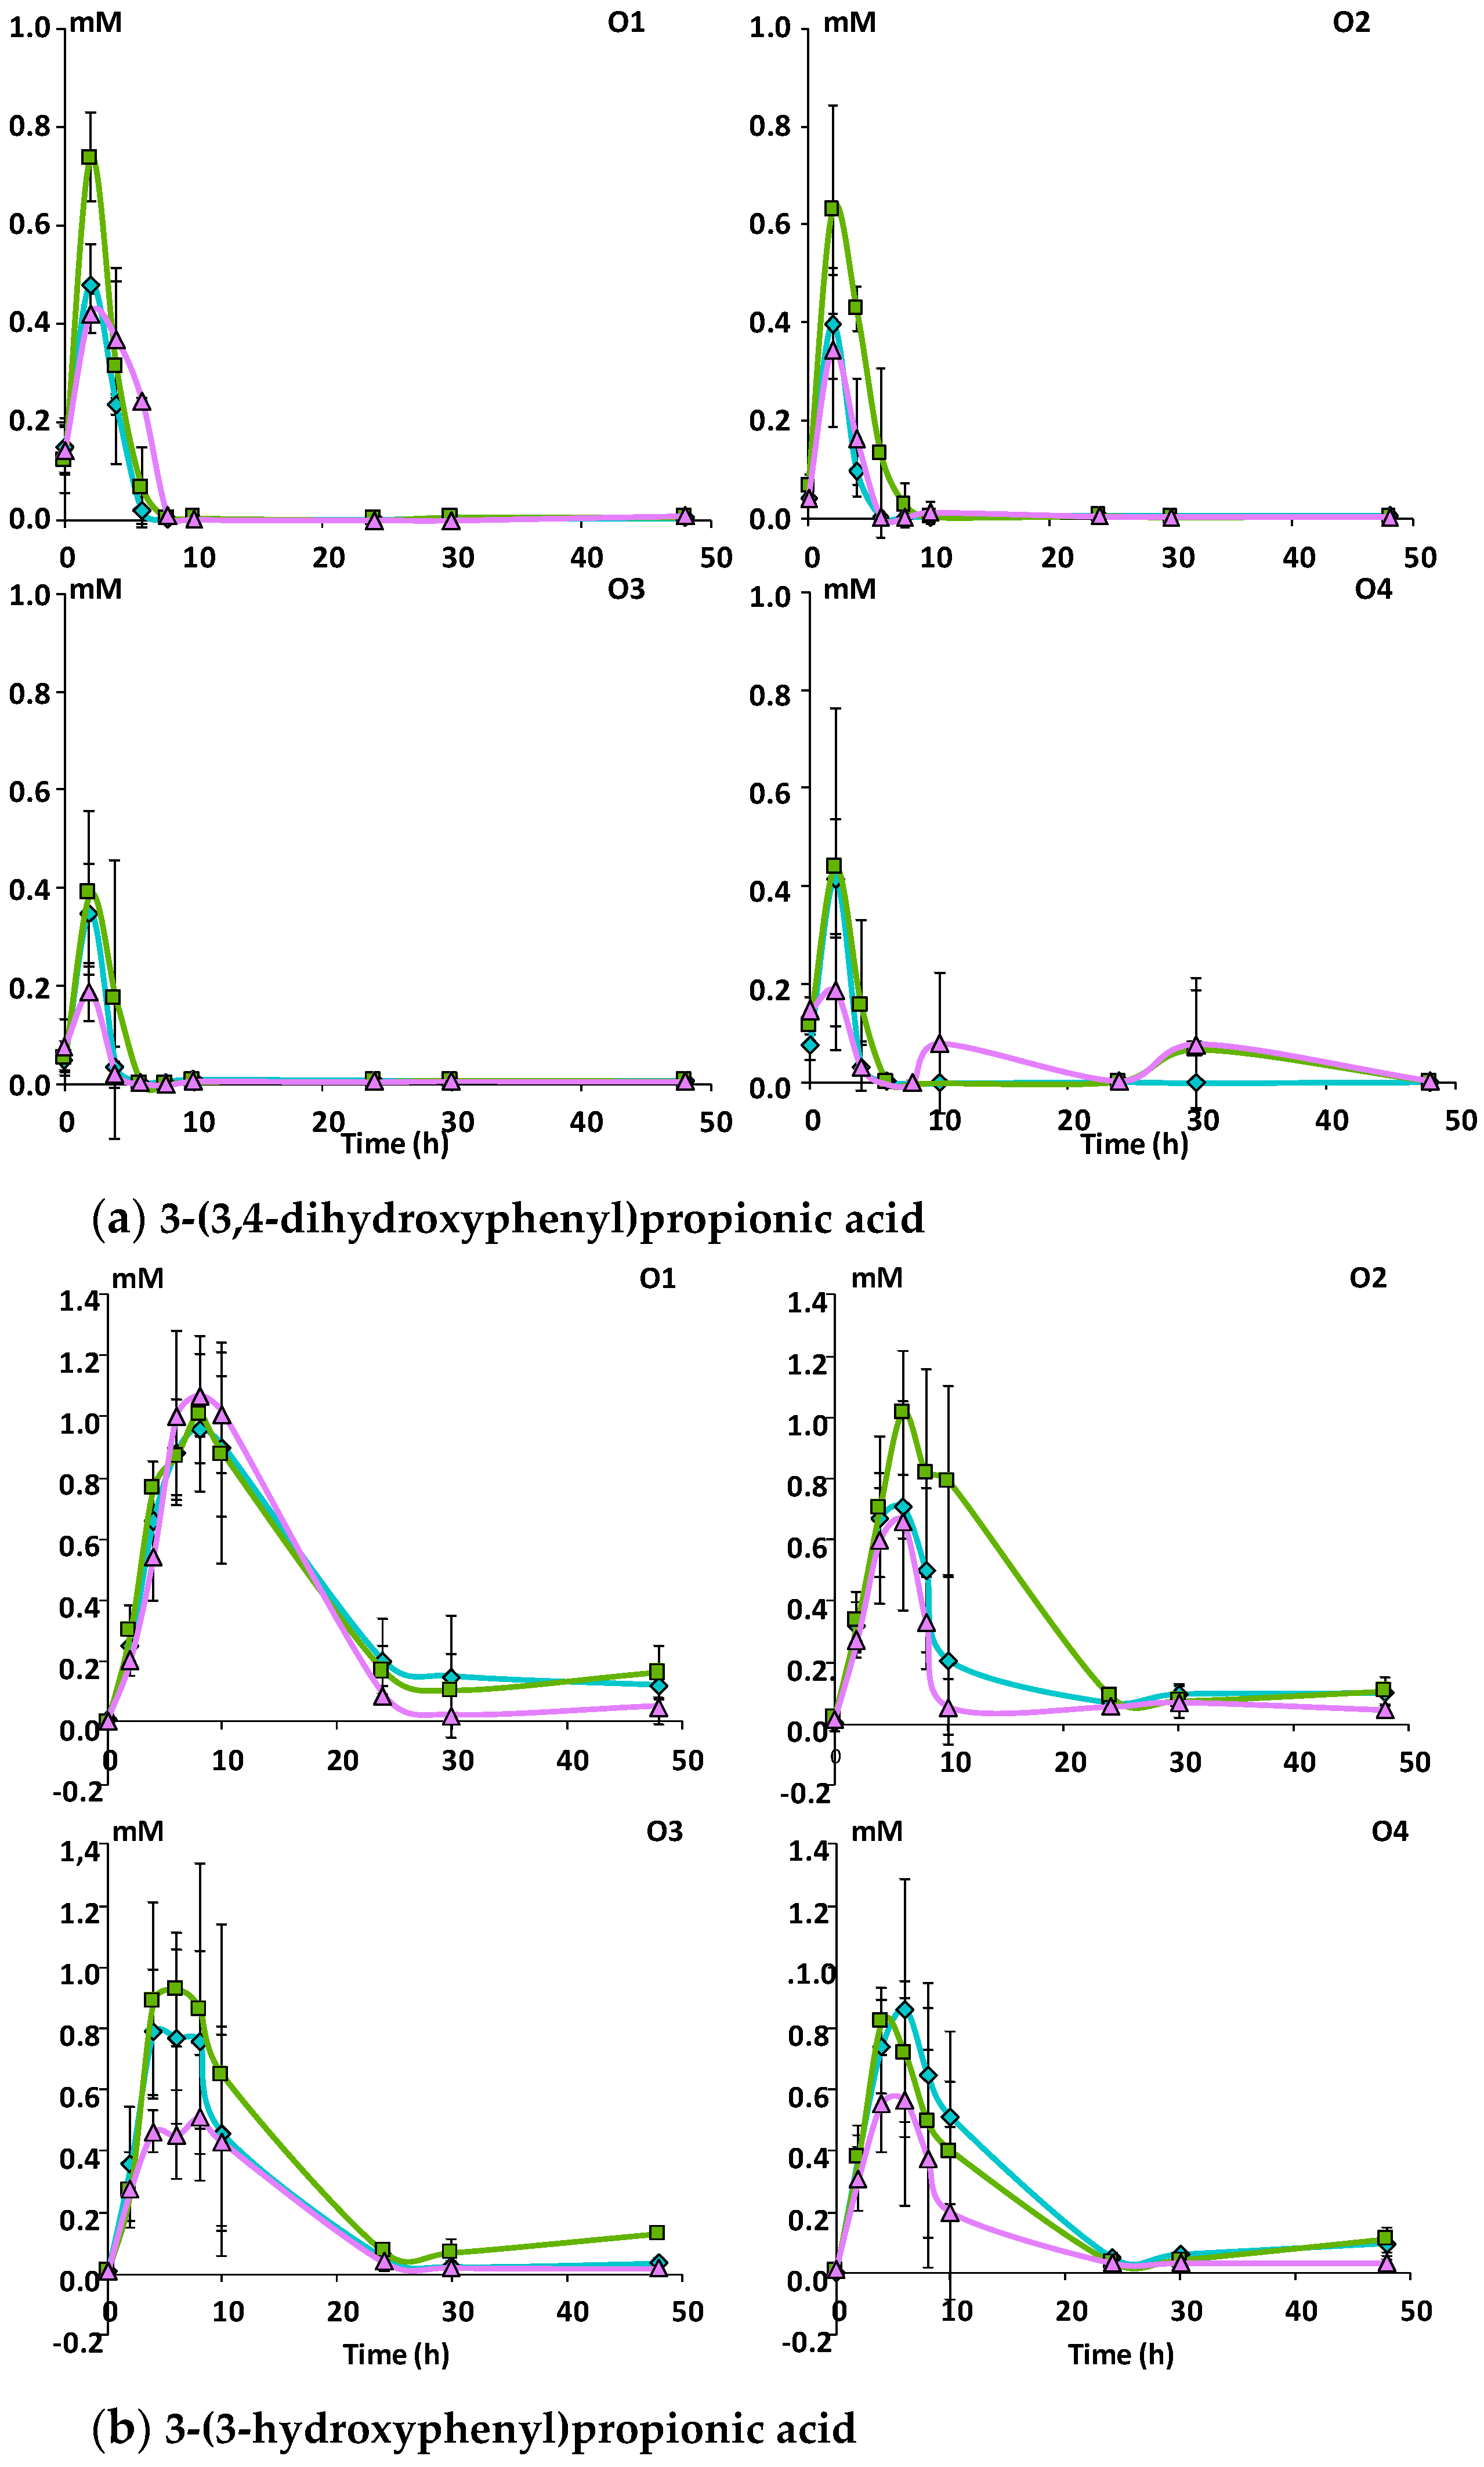
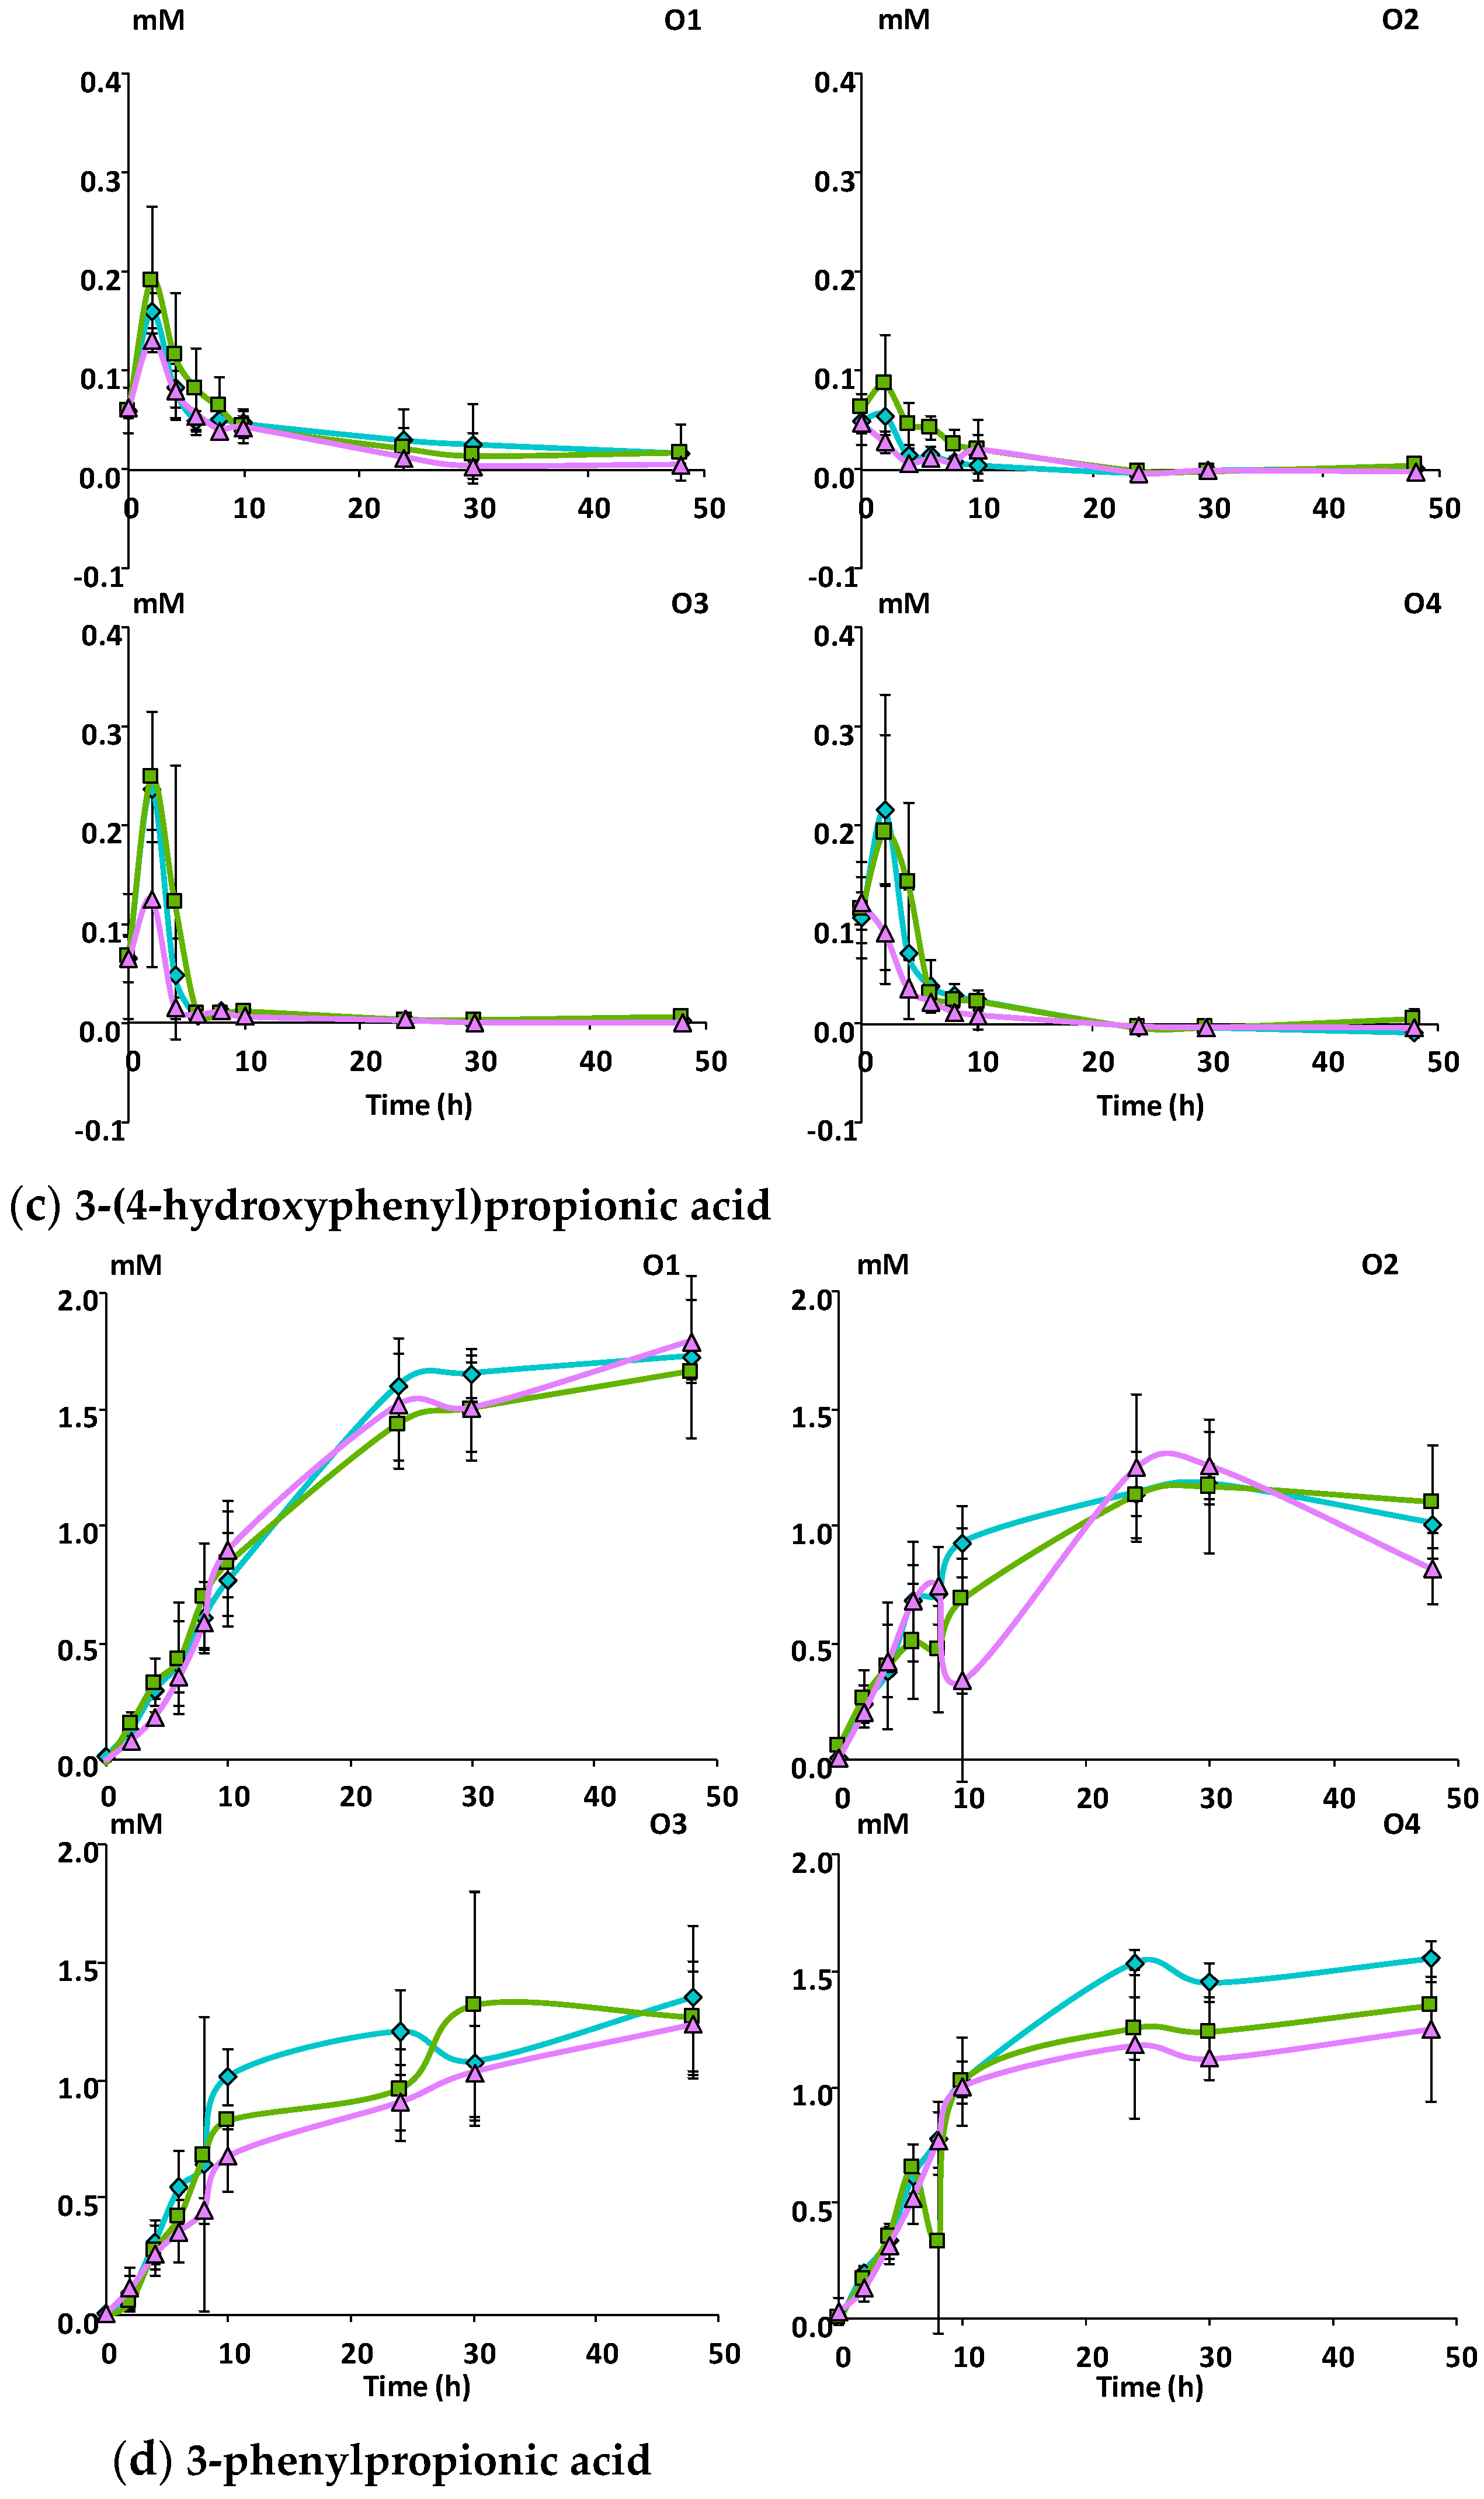
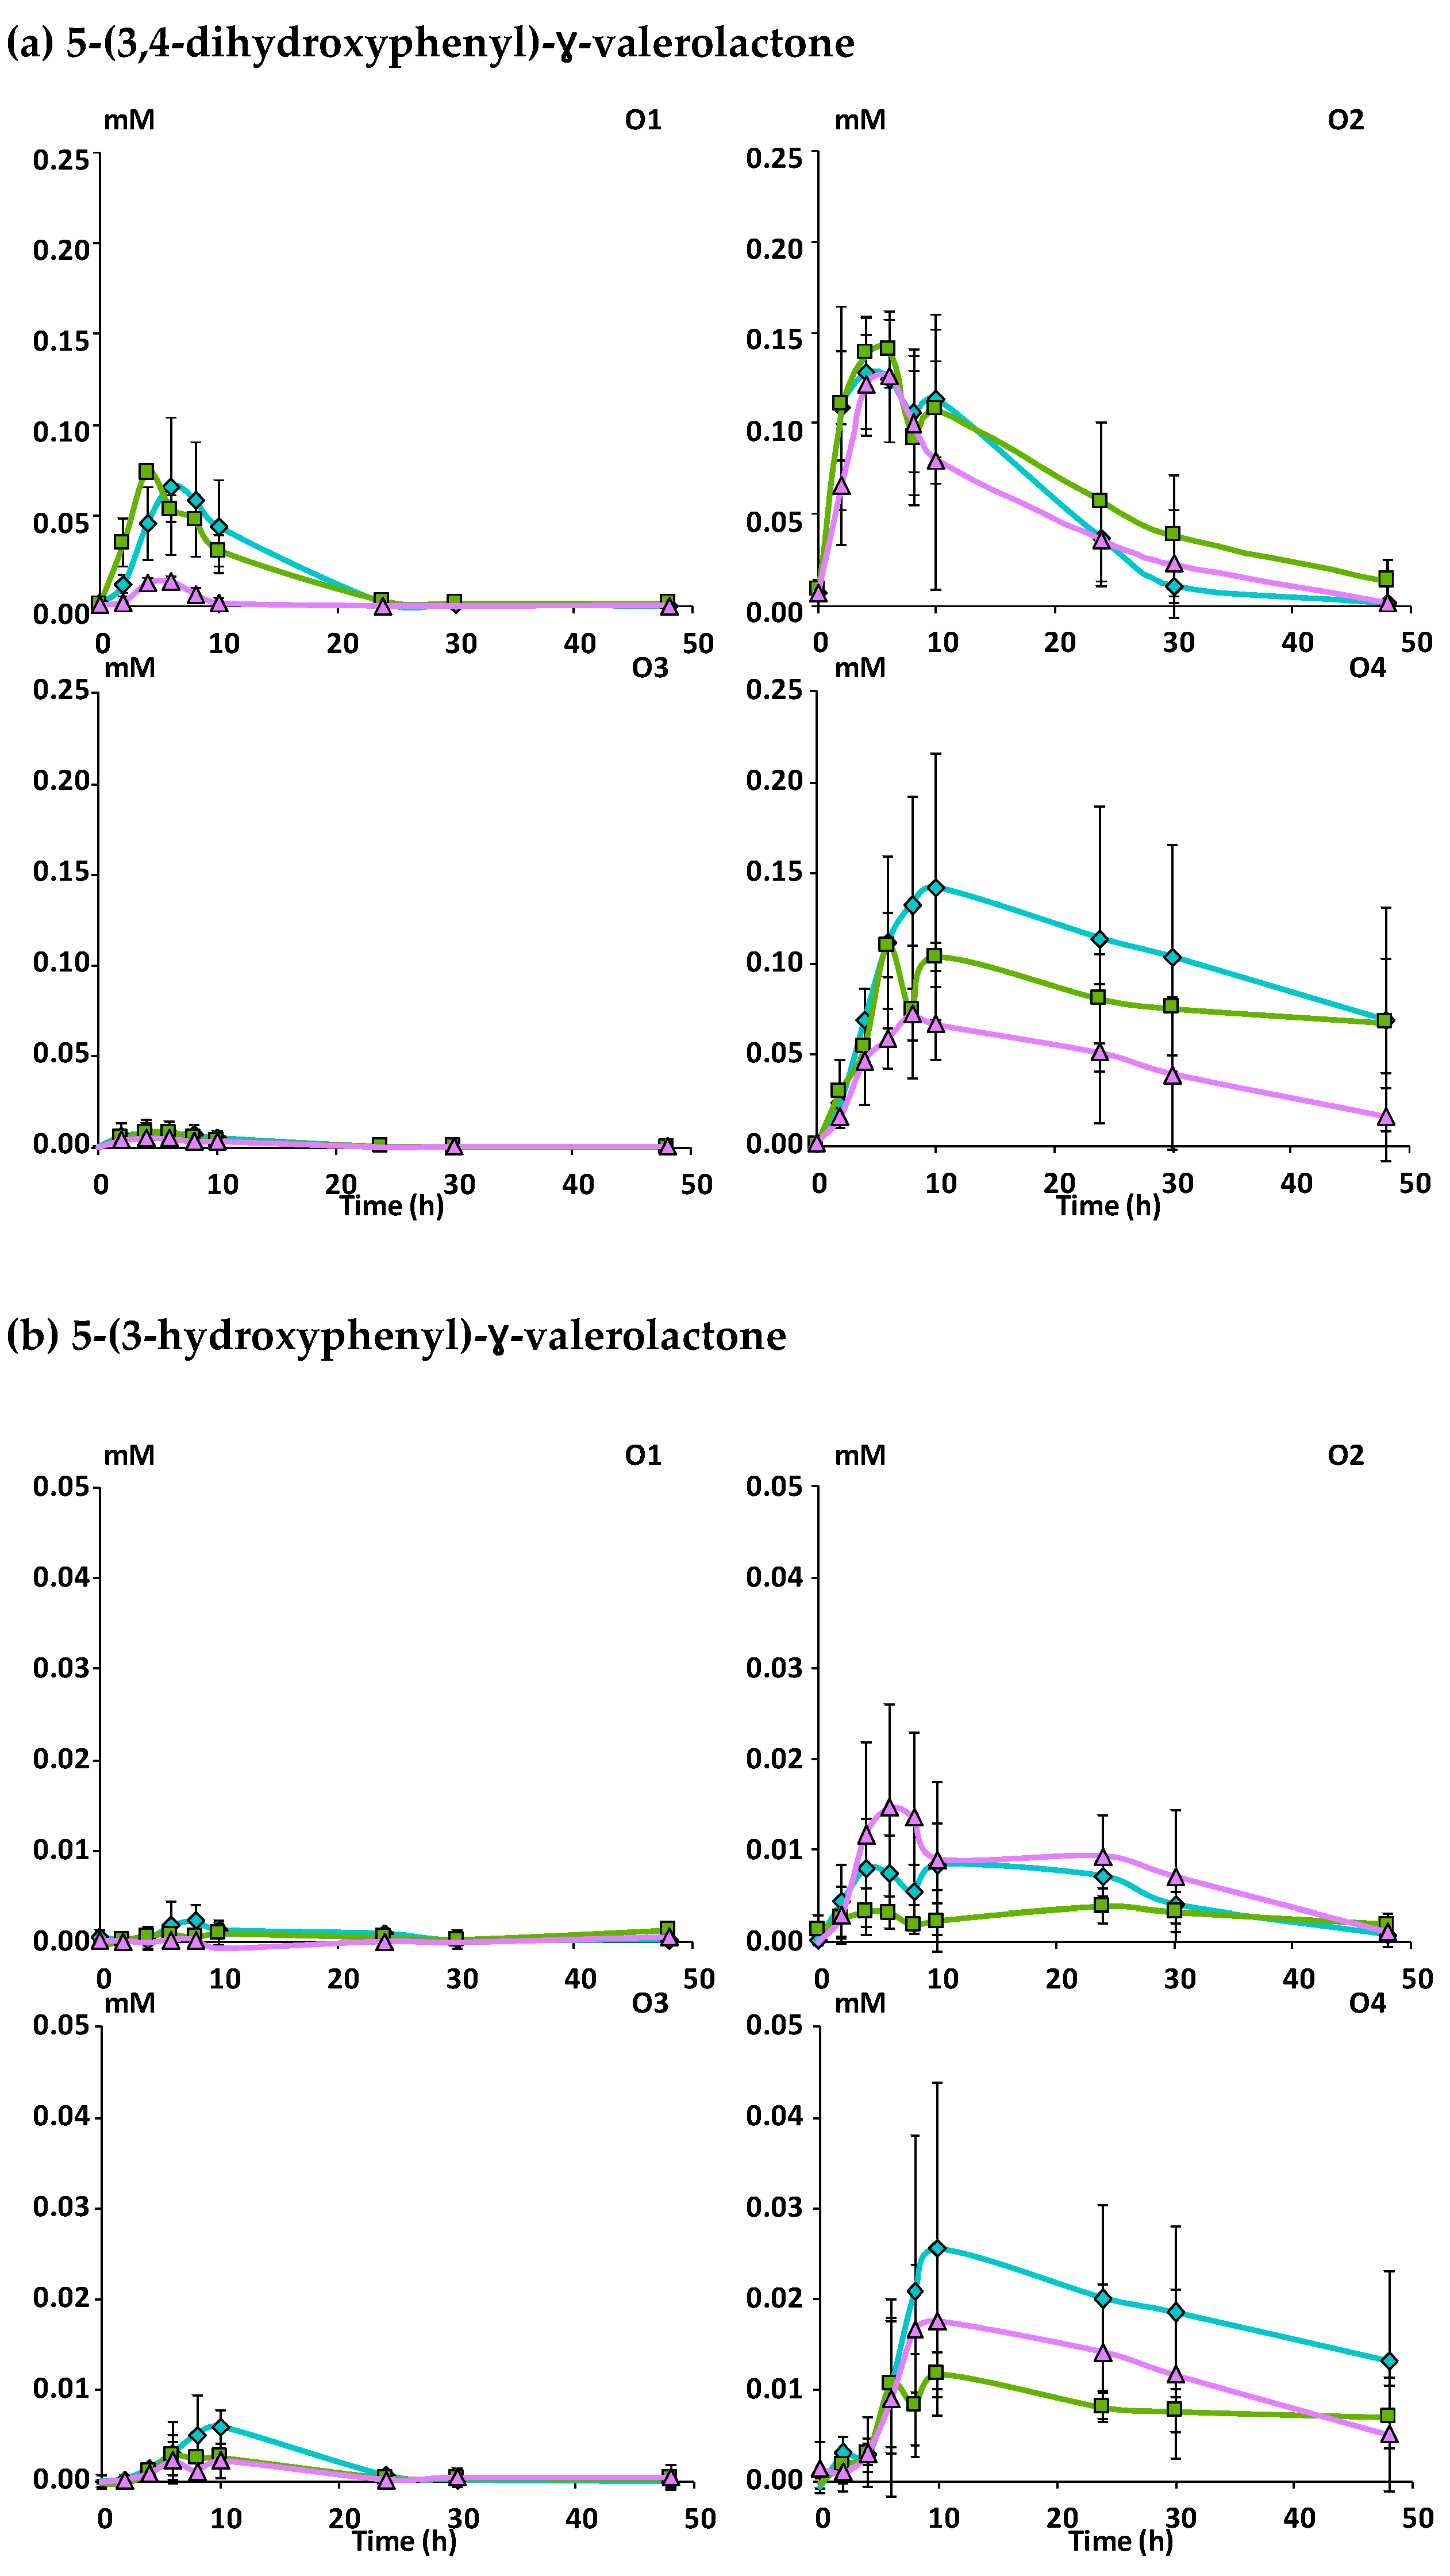
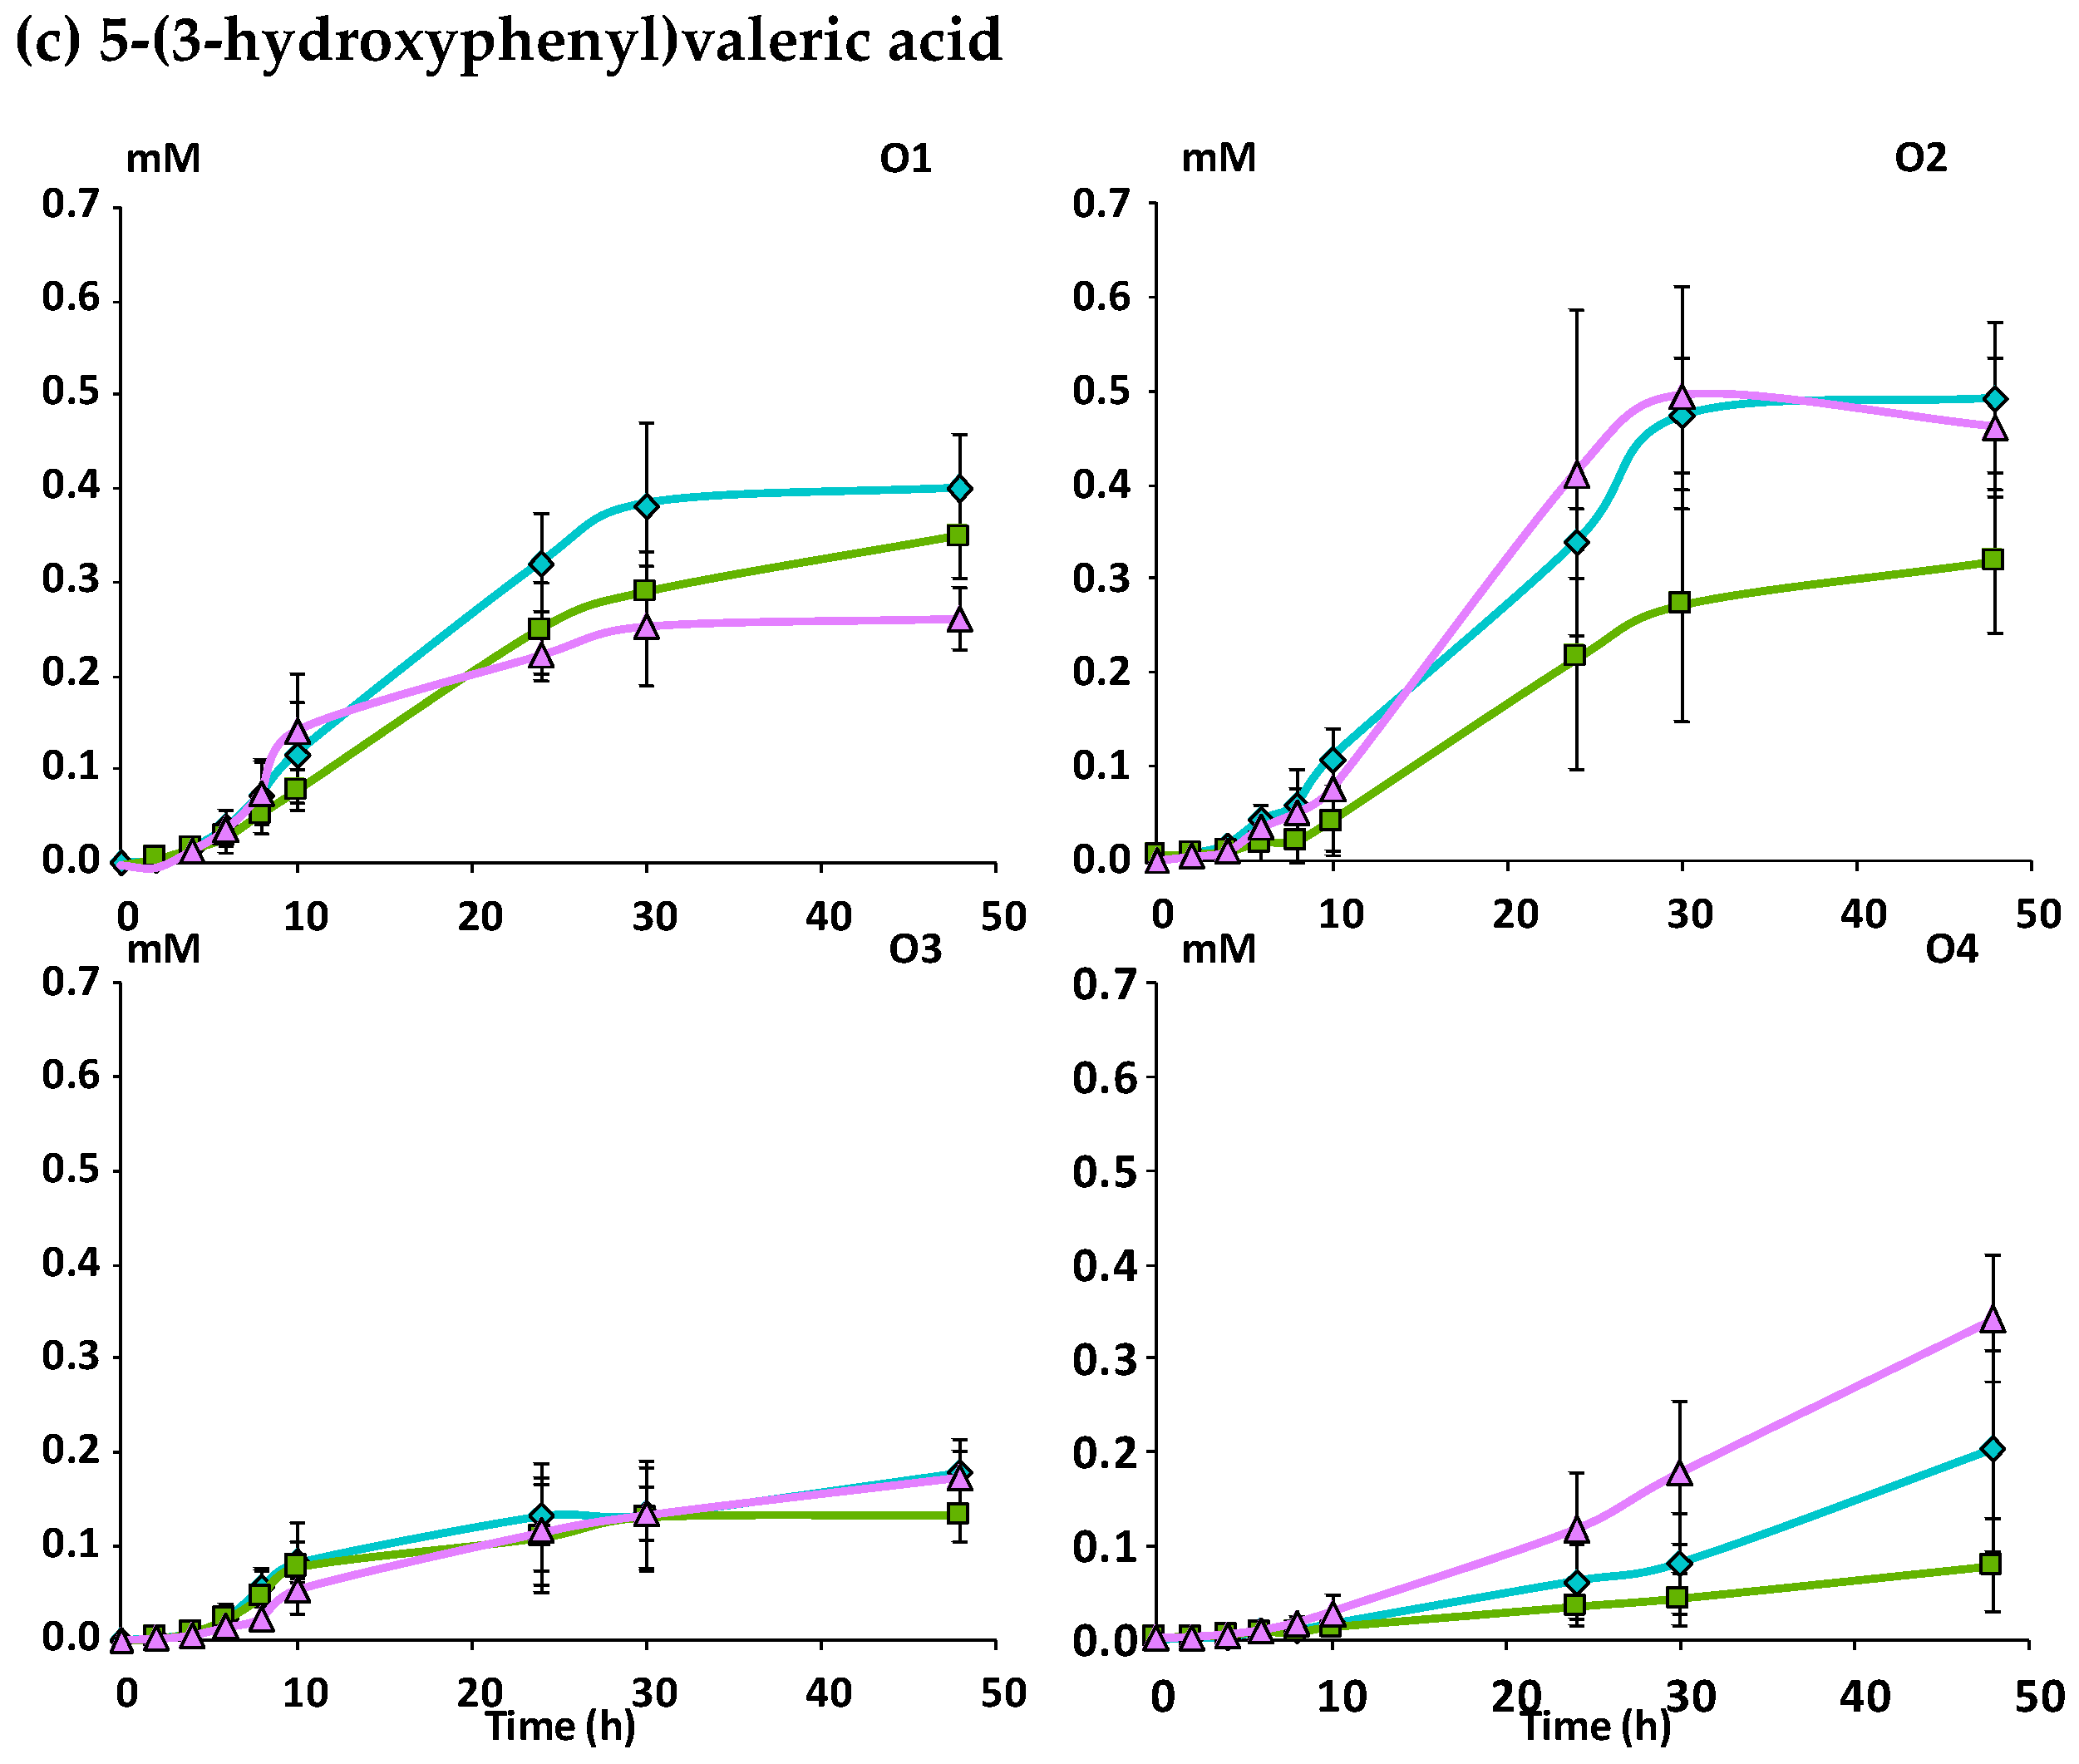
3.2.2. Catabolism of Native Phenolic Compounds and Production of Microbial Phenolic Metabolites
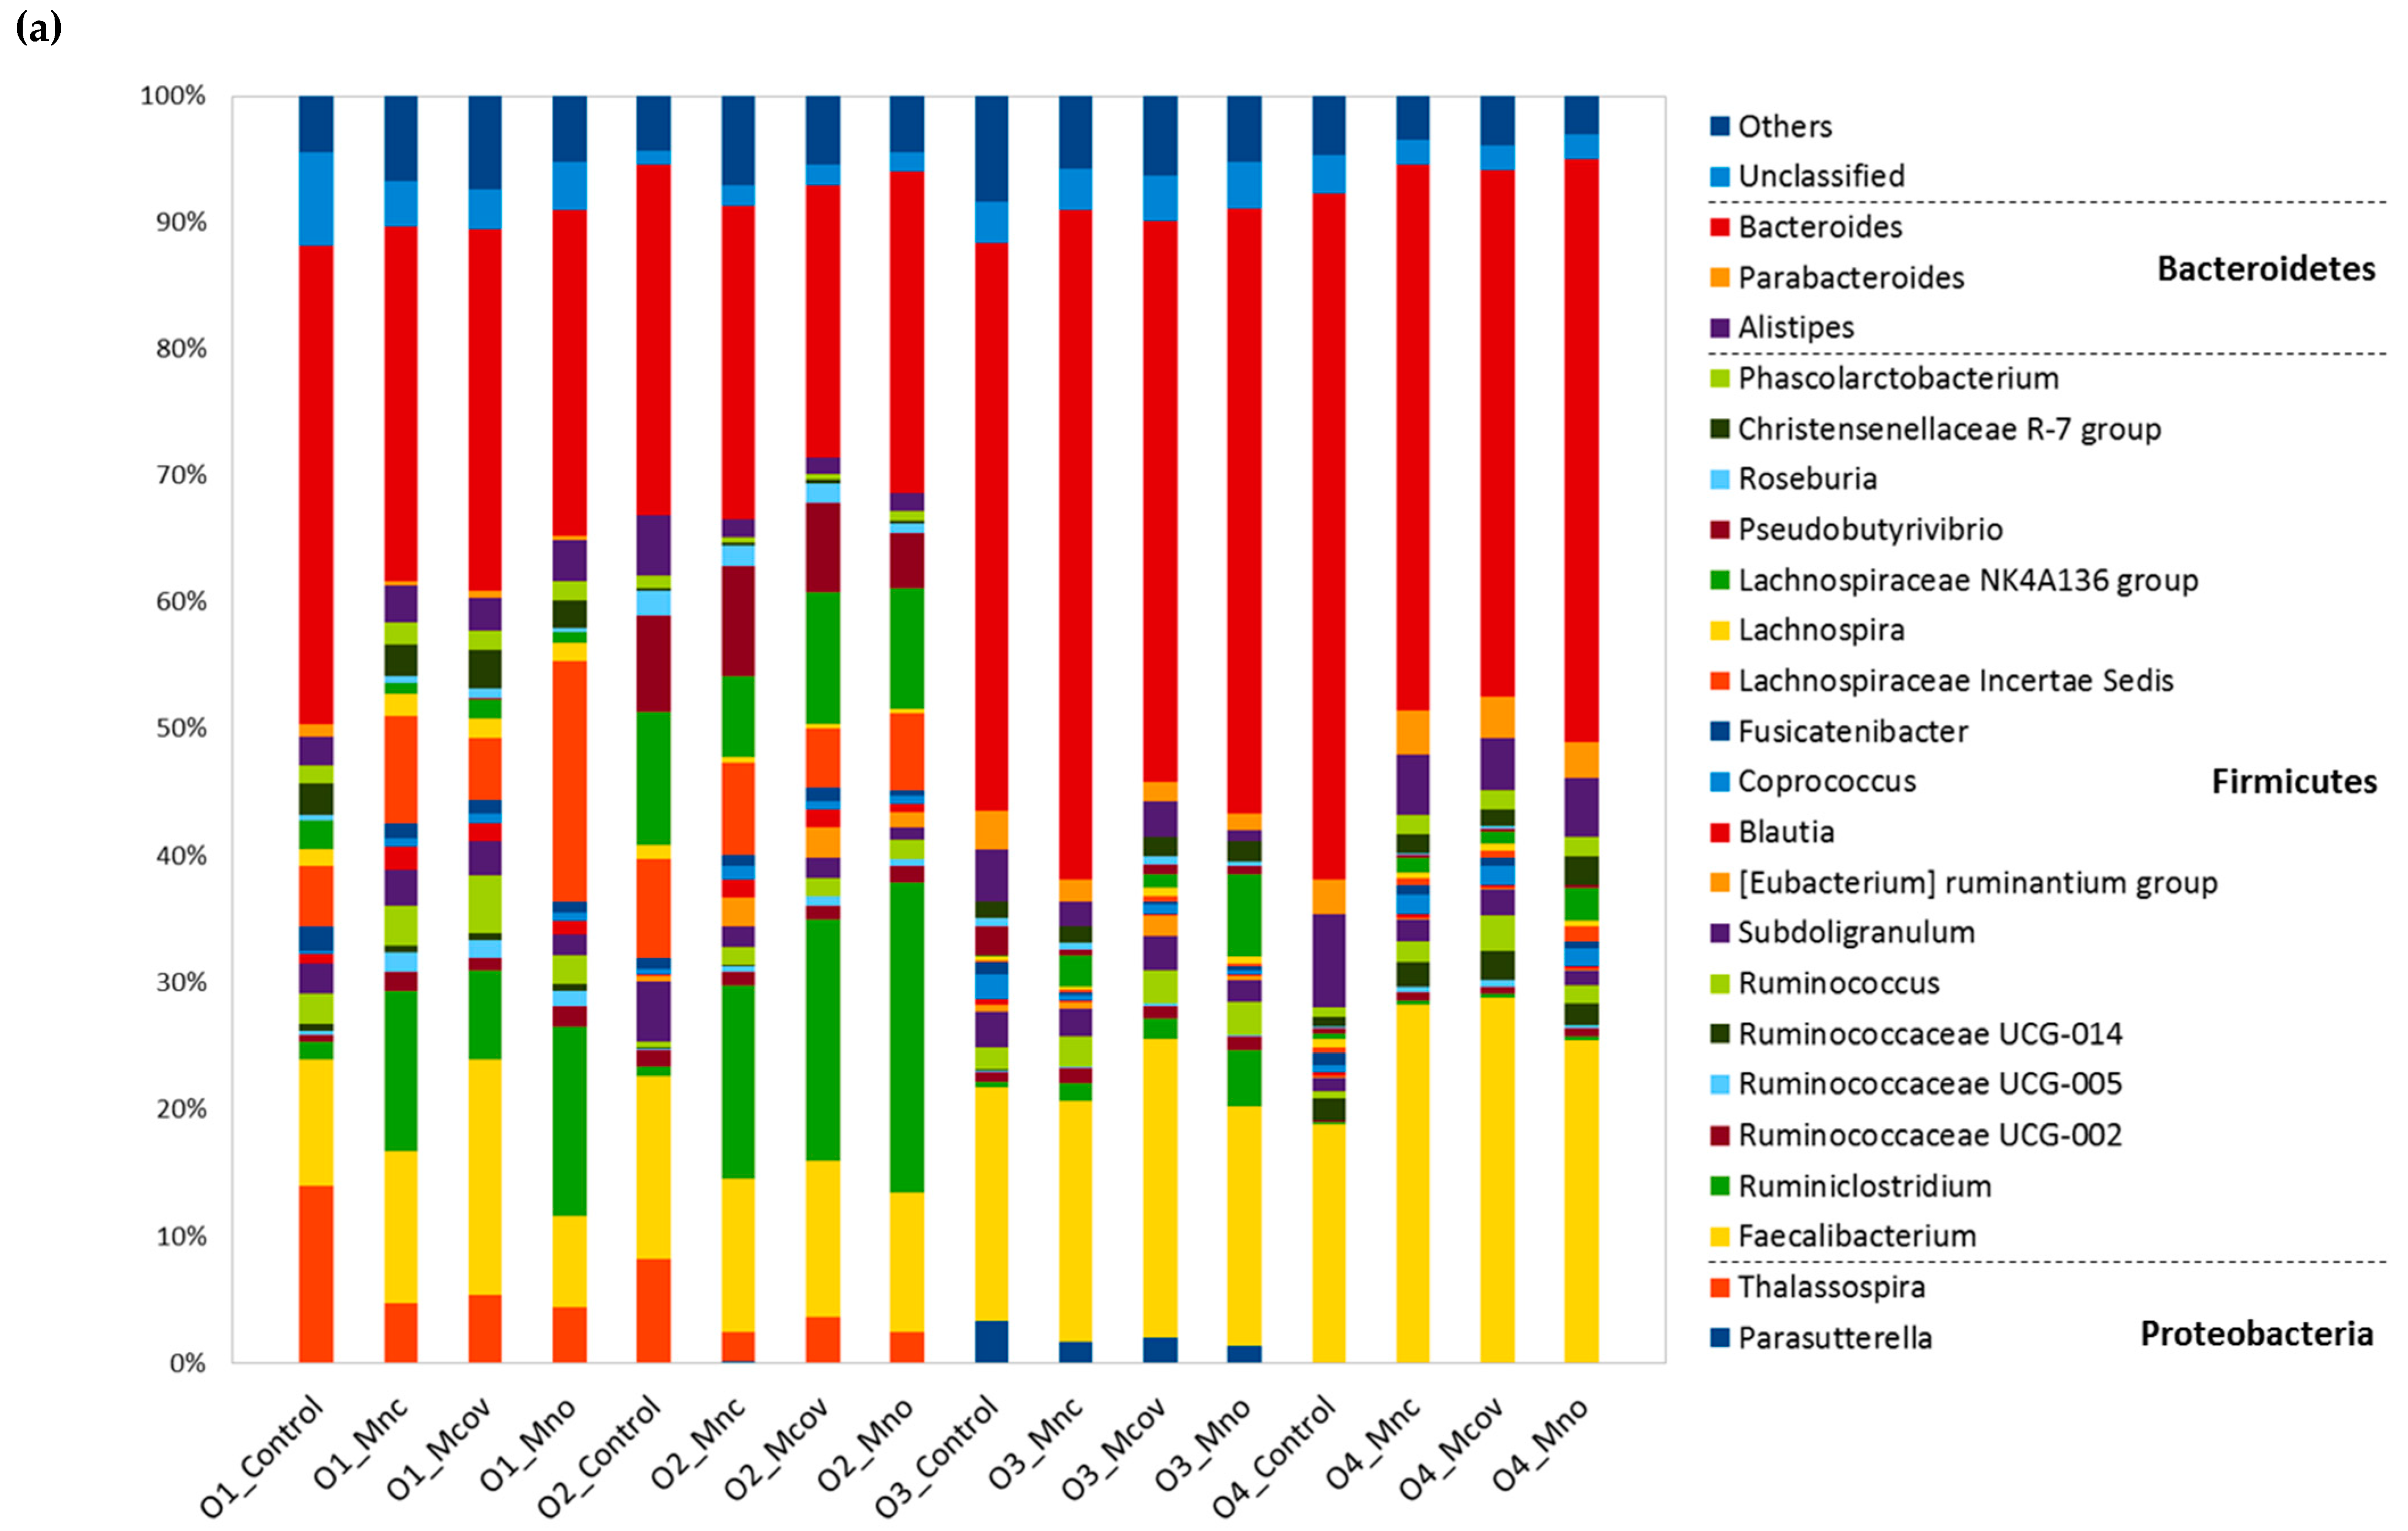
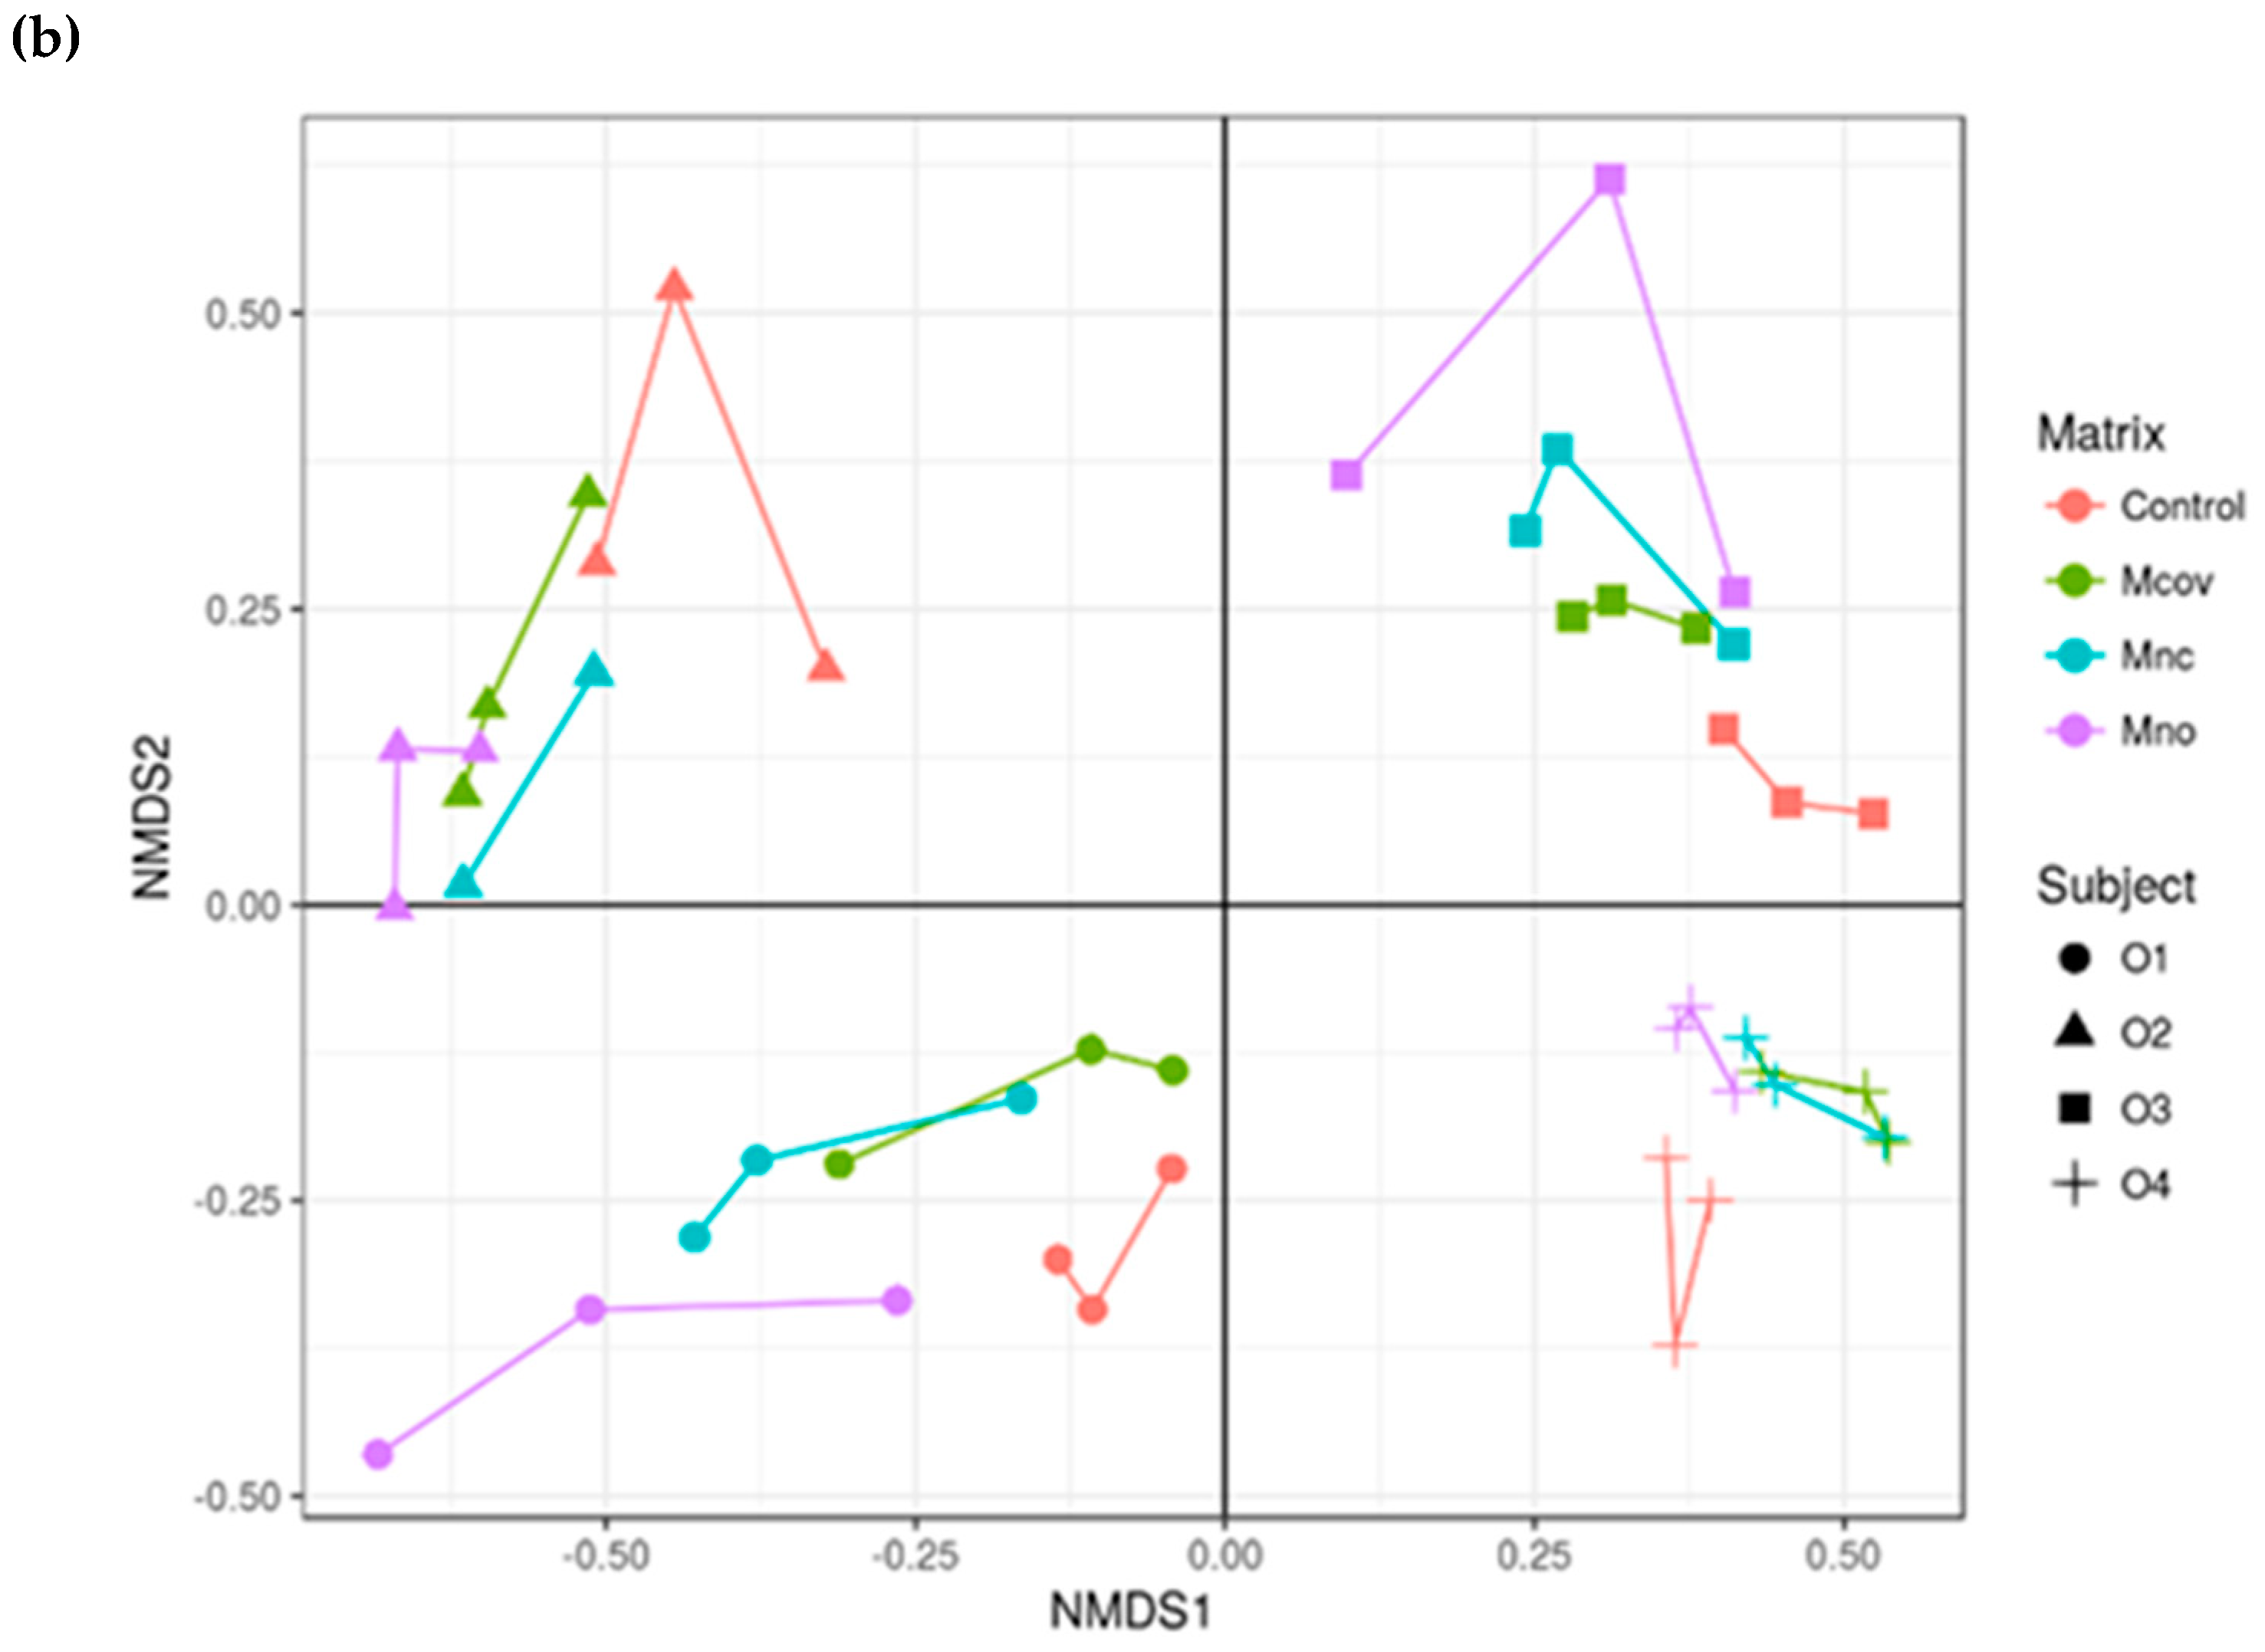
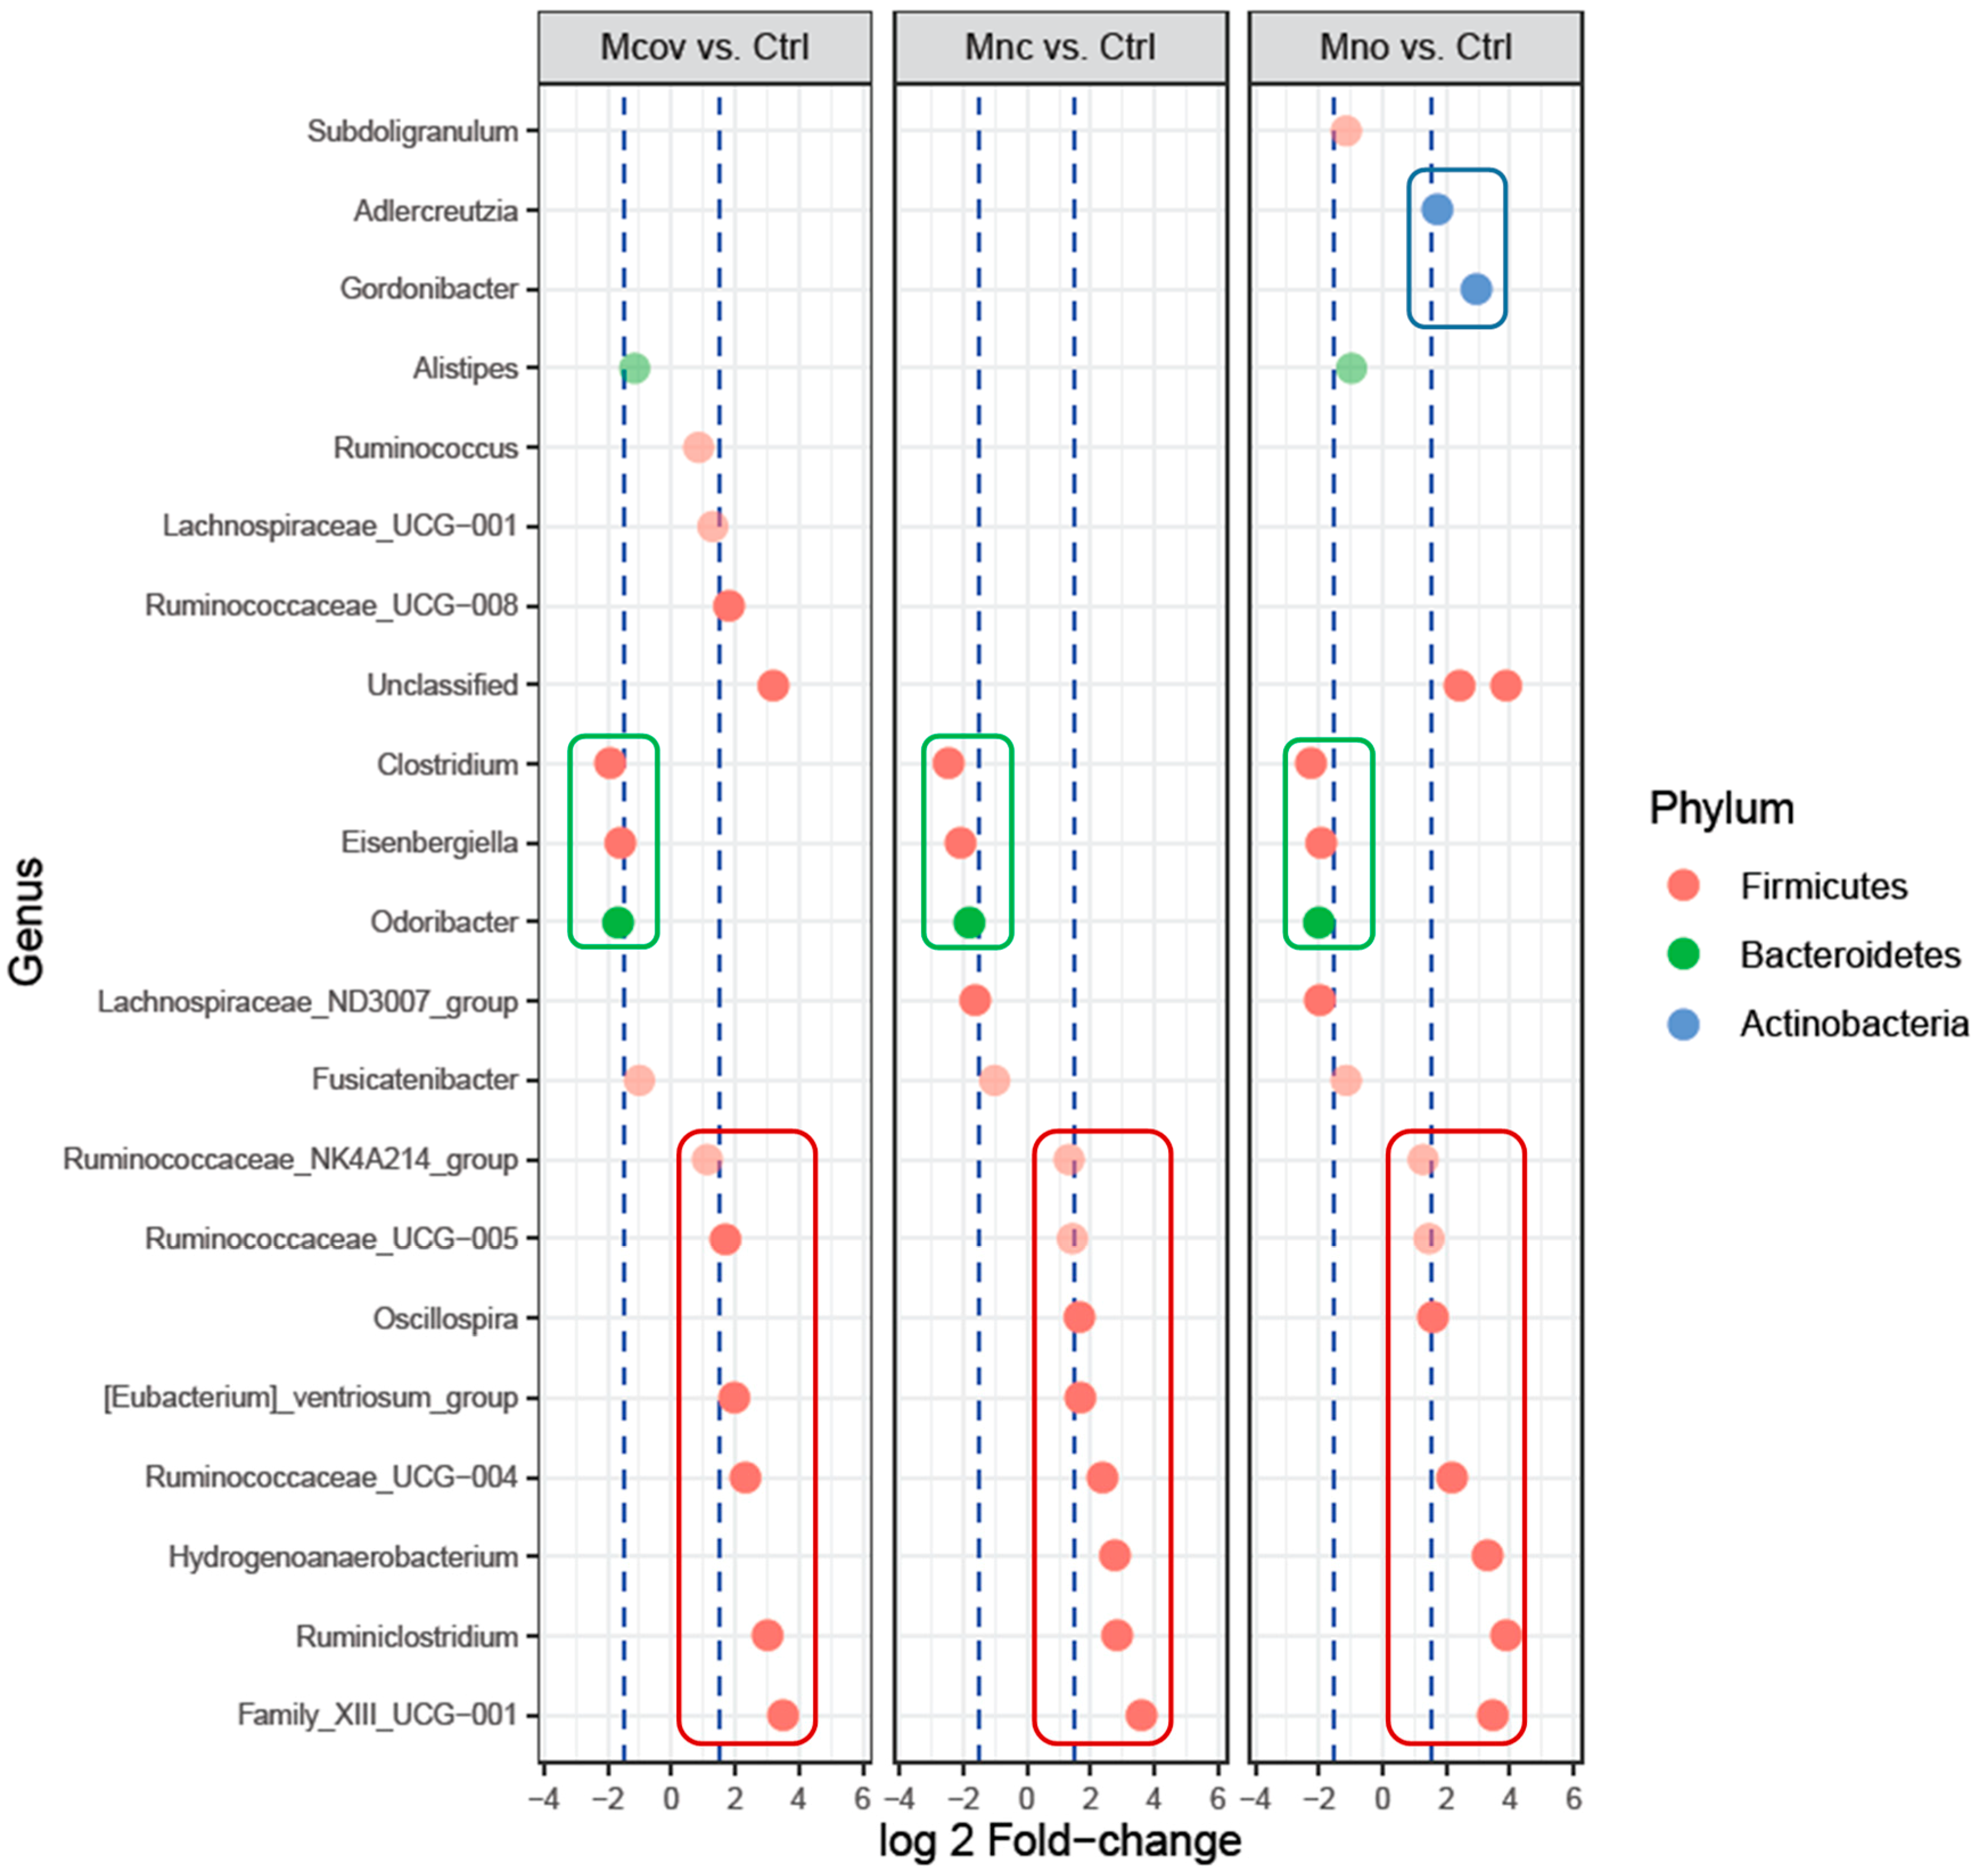
3.3. Bacterial Community Composition upon Growth on the Apple Matrices
3.4. Inflammatory Response
4. Discussion
5. Conclusions
Supplementary Materials
Author Contributions
Funding
Acknowledgments
Conflicts of Interest
References
- Guyot, S.; Marnet, N.; Laraba, D.; Sanoner, P.; Drilleau, J.F. Reversed-phase HPLC following thiolysis for quantitative estimation and characterization of the four main classes of phenolic compounds in different tissue zones of a French cider apple variety (Malus domestica var. Kermerrien). J. Agric. Food Chem. 1998, 46, 1698–1705. [Google Scholar] [CrossRef]
- Guyot, S.; Le Bourvellec, C.; Marnet, N.; Drilleau, J.F. Procyanidins are the most abundant polyphenols in dessert apples at maturity. Lebensm-Wiss Technol 2002, 35, 289–291. [Google Scholar] [CrossRef]
- Joseph, S.V.; Edirisinghe, I.; Burton-Freeman, B.M. Fruit polyphenols: A review of anti-inflammatory effects in humans. Crit. Rev. Food Sci. Nutr. 2016, 56, 419–444. [Google Scholar] [CrossRef] [PubMed]
- Gonzalez-Sarrias, A.; Espin, J.C.; Tomas-Barberan, F.A. Non-extractable polyphenols produce gut microbiota metabolites that persist in circulation and show anti-inflammatory and free radical-scavenging effects. Trends Food Sci. Technol. 2017, 69, 281–288. [Google Scholar] [CrossRef]
- Bondonno, N.P.; Bondonno, C.P.; Ward, N.C.; Hodgson, J.M.; Croft, K.D. The cardiovascular health benefits of apples: Whole fruit vs. isolated compounds. Trends Food Sci. Technol. 2017, 69, 243–256. [Google Scholar] [CrossRef]
- Mcmanus, J.P.; Davis, K.G.; Beart, J.E.; Gaffney, S.H.; Lilley, T.H.; Haslam, E. Polyphenol interactions. 1. Introduction - Some observations on the reversible complexation of polyphenols with proteins and polysaccharides. J. Chem. Soc. Perk. T2. 1985, 9, 1429–1438. [Google Scholar] [CrossRef]
- Le Bourvellec, C.; Watrelot, A.A.; Ginies, C.; Imberty, A.; Renard, C.M. Impact of processing on the noncovalent interactions between procyanidin and apple cell wall. J. Agric. Food Chem. 2012, 60, 9484–9494. [Google Scholar] [CrossRef]
- Le Bourvellec, C.; Gouble, B.; Bureau, S.; Loonis, M.; Ple, Y.; Renard, C.M.G.C. Pink discoloration of canned pears: Role of procyanidin chemical depolymerization and procyanidin/cell wall interactions. J. Agric. Food Chem. 2013, 61, 6679–6692. [Google Scholar] [CrossRef]
- Donovan, J.L.; Manach, C.; Rios, L.; Morand, C.; Scalbert, A.; Remesy, C. Procyanidins are not bioavailable in rats fed a single meal containing a grapeseed extract or the procyanidin dimer B3. Br. J. Nutr. 2002, 87, 299–306. [Google Scholar] [CrossRef] [Green Version]
- Deprez, S.; Brezillon, C.; Rabot, S.; Philippe, C.; Mila, I.; Lapierre, C.; Scalbert, A. Polymeric proanthocyanidins are catabolized by human colonic microflora into low-molecular-weight phenolic acids. J. Nutr. 2000, 130, 2733–2738. [Google Scholar] [CrossRef]
- Bazzocco, S.; Mattila, I.; Guyot, S.; Renard, C.; Aura, A.M. Factors affecting the conversion of apple polyphenols to phenolic acids and fruit matrix to short-chain fatty acids by human faecal microbiota in vitro. Eur. J. Nutr. 2008, 47, 442–452. [Google Scholar] [CrossRef] [PubMed]
- Aura, A.-M. Microbial metabolism of dietary phenolic compounds in the colon. Phytochem. Rev. 2008, 7, 407–429. [Google Scholar] [CrossRef]
- Aura, A.M.; Mattila, I.; Hyotylainen, T.; Gopalacharyulu, P.; Cheynier, V.; Souquet, J.M.; Bes, M.; Le Bourvellec, C.; Guyot, S.; Oresic, M. Characterization of microbial metabolism of Syrah grape products in an in vitro colon model using targeted and non-targeted analytical approaches. Eur. J. Nutr. 2013, 52, 833–846. [Google Scholar] [CrossRef] [PubMed]
- Aprikian, O.; Duclos, V.; Guyot, S.; Besson, C.; Manach, C.; Bernalier, A.; Morand, C.; Remesy, C.; Demigne, C. Apple pectin and a polyphenol-rich apple concentrate are more effective together than separately on cecal fermentations and plasma lipids in rats. J. Nutr. 2003, 133, 1860–1865. [Google Scholar] [CrossRef] [PubMed]
- Saura-Calixto, F.; Perez-Jimenez, J.; Tourino, S.; Serrano, J.; Fuguet, E.; Torres, J.L.; Goni, I. Proanthocyanidin metabolites associated with dietary fibre from in vitro colonic fermentation and proanthocyanidin metabolites in human plasma. Mol. Nutr. Food Res. 2010, 54, 939–946. [Google Scholar] [CrossRef] [PubMed]
- Dubois, M.; Gilles, K.A.; Hamilton, J.K.; Rebers, P.A.; Smith, F. Colorimetric method for determination of sugars and related substances. Anal. Chem. 1956, 28, 350–356. [Google Scholar] [CrossRef]
- Bryant, M.P.; Burkey, L.A. Cultural methods and some characteristics of some of the more numerous groups of bacteria in the bovine rumen. J. Dairy Sci. 1953, 36, 205–217. [Google Scholar] [CrossRef]
- Renard, C.M.G.C.; Ginies, C. Comparison of the cell wall composition for flesh and skin from five different plums. Food Chem. 2009, 114, 1042–1049. [Google Scholar] [CrossRef]
- Guyot, S.; Marnet, N.; Sanoner, P.; Drilleau, J.F. Direct thiolysis on crude apple materials for high-performance liquid chromatography characterization and quantification of polyphenols in cider apple tissues and juices. Method Enzymol. 2001, 335, 57–70. [Google Scholar]
- Le Bourvellec, C.; Bouzerzour, K.; Ginies, C.; Regis, S.; Ple, Y.; Renard, C.M.G.C. Phenolic and polysaccharidic composition of applesauce is close to that of apple flesh. J. Food Compos. Anal. 2011, 24, 537–547. [Google Scholar] [CrossRef]
- Stalmach, A.; Edwards, C.A.; Wightman, J.D.; Crozier, A. Colonic catabolism of dietary phenolic and polyphenolic compounds from Concord grape juice. Food Funct. 2013, 4, 52–62. [Google Scholar] [CrossRef]
- Erwin, E.S.; Marco, G.J.; Emery, E.M. Volatile fatty acid analyses of blood and rumen fluid by gas chromatography. J. Dairy Sci. 1961, 44, 1768–1771. [Google Scholar] [CrossRef]
- Jeraldo, P.; Kalari, K.; Chen, X.; Bhavsar, J.; Mangalam, A.; White, B.; Nelson, H.; Kocher, J.P.; Chia, N. IM-TORNADO: A tool for comparison of 16S reads from paired-end libraries. PLoS ONE 2014, 9, e114804. [Google Scholar] [CrossRef]
- Quast, C.; Pruesse, E.; Yilmaz, P.; Gerken, J.; Schweer, T.; Yarza, P.; Peplies, J.; Glockner, F.O. The SILVA ribosomal RNA gene database project: Improved data processing and web-based tools. Nucleic Acids Res. 2013, 41, D590–D596. [Google Scholar] [CrossRef]
- Ramirez-Farias, C.; Slezak, K.; Fuller, Z.; Duncan, A.; Holtrop, G.; Louis, P. Effect of inulin on the human gut microbiota: Stimulation of Bifidobacterium adolescentis and Faecalibacterium prausnitzii. Br. J. Nutr. 2009, 101, 541–550. [Google Scholar] [CrossRef]
- Walker, A.W.; Ince, J.; Duncan, S.H.; Webster, L.M.; Holtrop, G.; Ze, X.L.; Brown, D.; Stares, M.D.; Scott, P.; Bergerat, A.; et al. Dominant and diet-responsive groups of bacteria within the human colonic microbiota. ISME J. 2011, 5, 220–230. [Google Scholar] [CrossRef]
- Mosoni, P.; Chaucheyras-Durand, F.; Bera-Maillet, C.; Forano, E. Quantification by real-time PCR of cellulolytic bacteria in the rumen of sheep after supplementation of a forage diet with readily fermentable carbohydrates: Effect of a yeast additive. J. Appl. Microbiol. 2007, 103, 2676–2685. [Google Scholar] [CrossRef]
- Box, G.E.; Hunter, W.G.; Hunter, J.S. Statistics for Experimenters: An Introduction to Design, Data Analysis and Model Building; Wiley and Sons: New York, NY, USA, 1978; p. 352. [Google Scholar]
- McMurdie, P.J.; Holmes, S. Phyloseq: An R package for reproducible interactive analysis and graphics of microbiome census data. PLoS ONE 2013, 8. [Google Scholar] [CrossRef]
- Anderson, M.J. A new method for non-parametric multivariate analysis of variance. Austral Ecol. 2001, 26, 32–46. [Google Scholar] [CrossRef]
- Vegan: Community Ecology Package. R Package Version 2.5-3. Available online: https://CRAN.R-project.org/package=vegan (accessed on 18 March 2019).
- Anderson, M.J. Distance-based tests for homogeneity of multivariate dispersions. Biometrics 2006, 62, 245–253. [Google Scholar] [CrossRef]
- Beals, E.W. Bray-Curtis Ordination—An Effective Strategy for Analysis of Multivariate Ecological Data. Adv. Ecol. Res. 1984, 14, 1–55. [Google Scholar] [CrossRef]
- Love, M.I.; Huber, W.; Anders, S. Moderated estimation of fold change and dispersion for RNA-seq data with DESeq2. Genome Biol. 2014, 15. [Google Scholar] [CrossRef]
- Bourgon, R.; Gentleman, R.; Huber, W. Independent filtering increases detection power for high-throughput experiments. Proc. Natl. Acad. Sci. USA 2010, 107, 9546–9551. [Google Scholar] [CrossRef] [Green Version]
- Bates, D.; Machler, M.; Bolker, B.M.; Walker, S.C. Fitting Linear Mixed-Effects Models Using lme4. J. Stat. Softw. 2015, 67, 1–48. [Google Scholar] [CrossRef]
- Le Bourvellec, C.; Renard, C.M. Interactions between polyphenols and macromolecules: Quantification methods and mechanisms. Crit. Rev. Food Sci. Nutr. 2012, 52, 213–248. [Google Scholar] [CrossRef]
- Khanizadeh, S.; Tsao, R.; Rekika, D.; Yang, R.; Charles, M.T.; Rupasinghe, H.P.V. Polyphenol composition and total antioxidant capacity of selected apple genotypes for processing. J. Food Compost. Anal. 2008, 21, 396–401. [Google Scholar] [CrossRef]
- Sanoner, P.; Guyot, S.; Marnet, N.; Molle, D.; Drilleau, J.P. Polyphenol profiles of French cider apple varieties (Malus domestica sp.). J. Agric. Food Chem. 1999, 47, 4847–4853. [Google Scholar] [CrossRef]
- Renard, C.M.G.C. Variability in cell wall preparations: Quantification and comparison of common methods. Carbohydr. Polym. 2005, 60, 515–522. [Google Scholar] [CrossRef]
- Renard, C.M.G.C.; Voragen, A.G.J.; Thibault, J.F.; Pilnik, W. Studies on apple protopectin. 1. Extraction of insoluble pectin by chemical means. Carbohydr. Polym. 1990, 12, 9–25. [Google Scholar] [CrossRef]
- Renard, C.M.G.C.; Thibault, J.F. Composition and physicochemical properties of apple fibers from fresh fruits and industrial-products. Food Sci. Technol.-Leb. 1991, 24, 523–527. [Google Scholar]
- De Vries, J.A.; Rombouts, F.M.; Voragen, A.G.J.; Pilnik, W. Enzymic degradation of apple pectins. Carbohydr. Polym. 1982, 2, 25–33. [Google Scholar] [CrossRef]
- Scalbert, A. Antimicrobial properties of tannins. Phytochemistry 1991, 30, 3875–3883. [Google Scholar] [CrossRef]
- Choy, Y.Y.; Jaggers, G.K.; Oteiza, P.I.; Waterhouse, A.L. Bioavailability of intact proanthocyanidins in the rat colon after ingestion of grape seed extract. J. Agric. Food Chem. 2013, 61, 121–127. [Google Scholar] [CrossRef]
- Ou, K.Q.; Sarnoski, P.; Schneider, K.R.; Song, K.J.; Khoo, C.; Gu, L.W. Microbial catabolism of procyanidins by human gut microbiota. Mol. Nutr. Food Res. 2014, 58, 2196–2205. [Google Scholar] [CrossRef]
- Despres, J.; Forano, E.; Lepercq, P.; Comtet-Marre, S.; Jubelin, G.; Yeoman, C.J.; Miller, M.E.; Fields, C.J.; Terrapon, N.; Le Bourvellec, C.; et al. Unraveling the pectinolytic function of Bacteroides xylanisolvens using a RNA-seq approach and mutagenesis. BMC Genom. 2016, 17, 147. [Google Scholar] [CrossRef]
- Appeldoorn, M.M.; Vincken, J.P.; Aura, A.M.; Hollman, P.C.; Gruppen, H. Procyanidin dimers are metabolized by human microbiota with 2-(3,4-dihydroxyphenyl)acetic acid and 5-(3,4-dihydroxyphenyl)-gamma-valerolactone as the major metabolites. J. Agric. Food Chem. 2009, 57, 1084–1092. [Google Scholar] [CrossRef]
- Stoupi, S.; Williamson, G.; Drynan, J.W.; Barron, D.; Clifford, M.N. A comparison of the in vitro biotransformation of (−)-epicatechin and procyanidin B2 by human faecal microbiota. Mol. Nutr. Food Res. 2010, 54, 747–759. [Google Scholar] [CrossRef]
- van’t Slot, G.; Mattern, W.; Rzeppa, S.; Grewe, D.; Humpf, H.U. Complex flavonoids in cocoa: Synthesis and degradation by intestinal microbiota. J. Agric. Food Chem. 2010, 58, 8879–8886. [Google Scholar] [CrossRef]
- Groenewoud, G.; Hundt, H.K. The microbial metabolism of condensed (+)-catechins by rat-caecal microflora. Xenobiotica 1986, 16, 99–107. [Google Scholar] [CrossRef]
- Monagas, M.; Urpi-Sarda, M.; Sanchez-Patan, F.; Llorach, R.; Garrido, I.; Gomez-Cordoves, C.; Andres-Lacueva, C.; Bartolome, B. Insights into the metabolism and microbial biotransformation of dietary flavan-3-ols and the bioactivity of their metabolites. Food Funct. 2010, 1, 233–253. [Google Scholar] [CrossRef]
- Duenas, M.; Cueva, C.; Munoz-Gonzalez, I.; Jimenez-Giron, A.; Sanchez-Patan, F.; Santos-Buelga, C.; Moreno-Arribas, M.V.; Bartolome, B. Studies on modulation of gut microbiota by wine polyphenols: From isolated cultures to omic approaches. Antioxidants 2015, 4, 1–21. [Google Scholar] [CrossRef]
- Del Rio, D.; Rodriguez-Mateos, A.; Spencer, J.P.E.; Tognolini, M.; Borges, G.; Crozier, A. Dietary (poly)phenolics in human health: Structures, bioavailability, and evidence of protective effects against chronic diseases. Antioxid. Redox Signal. 2013, 18, 1818–1892. [Google Scholar] [CrossRef]
- Koutsos, A.; Lima, M.; Conterno, L.; Gasperotti, M.; Bianchi, M.; Fava, F.; Vrhovsek, U.; Lovegrove, J.A.; Tuohy, K.M. Effects of commercial apple varieties on human gut microbiota composition and metabolic output using an in vitro colonic model. Nutrients 2017, 9, 533. [Google Scholar] [CrossRef]
- Mena, P.; Bresciani, L.; Brindani, N.; Ludwig, I.A.; Pereira-Caro, G.; Angelino, D.; Llorach, R.; Calani, L.; Brighenti, F.; Clifford, M.N.; et al. Phenyl-g-valerolactones and phenylvaleric acids, the main colonic metabolites of flavan-3-ols: Synthesis, analysis, bioavailability, and bioactivity. Nat. Prod. Rep. 2019. [Google Scholar] [CrossRef]
- Mena, P.; Ludwig, I.A.; Tomatis, V.B.; Acharjee, A.; Calani, L.; Rosi, A.; Brighenti, F.; Ray, S.; Griffin, J.L.; Bluck, L.J.; et al. Inter-individual variability in the production of flavan-3-ol colonic metabolites: Preliminary elucidation of urinary metabotypes. Eur. J. Nutr. 2018. [Google Scholar] [CrossRef]
- Huttenhower, C.; Gevers, D.; Knight, R.; Abubucker, S.; Badger, J.H.; Chinwalla, A.T.; Creasy, H.H.; Earl, A.M.; FitzGerald, M.G.; Fulton, R.S.; et al. Structure, function and diversity of the healthy human microbiome. Nature 2012, 486, 207–214. [Google Scholar] [CrossRef] [Green Version]
- Ravachol, J.; de Philip, P.; Borne, R.; Mansuelle, P.; Mate, M.J.; Perret, S.; Fierobe, H.P. Mechanisms involved in xyloglucan catabolism by the cellulosome-producing bacterium Ruminiclostridium cellulolyticum. Sci. Rep. UK 2016, 6, 22770. [Google Scholar] [CrossRef] [Green Version]
- Yoav, S.; Barak, Y.; Shamshoum, M.; Borovok, I.; Lamed, R.; Dassa, B.; Hadar, Y.; Morag, E.; Bayer, E.A. How does cellulosome composition influence deconstruction of lignocellulosic substrates in Clostridium (Ruminiclostridium) thermocellum DSM 1313? Biotechnol. Biofuels 2017, 10, 222. [Google Scholar] [CrossRef]
- Maruo, T.; Sakamoto, M.; Ito, C.; Toda, T.; Benno, Y. Adlercreutzia equolifaciens gen. nov., sp. nov., an equol-producing bacterium isolated from human faeces, and emended description of the genus Eggerthella. Int. J. Syst. Evol. Microbiol. 2008, 58, 1221–1227. [Google Scholar] [CrossRef]
- Takagaki, A.; Nanjo, F. Bioconversion of (−)-epicatechin, (+)-epicatechin, (−)-catechin, and (+)-catechin by (−)-epigallocatechin-metabolizing bacteria. Biol. Pharm. Bull. 2015, 38, 789–794. [Google Scholar] [CrossRef]
- Tomas-Barberan, F.A.; Selma, M.V.; Espin, J.C. Interactions of gut microbiota with dietary polyphenols and consequences to human health. Curr. Opin. Clin. Nutr. Metab. Care 2016, 19, 471–476. [Google Scholar] [CrossRef] [PubMed]
- Jin, J.S.; Lee, K.C.; Park, I.S.; Kim, K.K.; Ahn, J.S.; Benno, Y.; Hattori, M.; Lee, J.S. Gordonibacter faecihominis sp. nov., isolated from human faeces. Antonie Van Leeuwenhoek 2014, 106, 439–447. [Google Scholar] [CrossRef] [PubMed]
- Karlsson, P.C.; Huss, U.; Jenner, A.; Halliwell, B.; Bohlin, L.; Rafter, J.J. Human fecal water inhibits COX-2 in colonic HT-29 cells: Role of phenolic compounds. J. Nutr. 2005, 135, 2343–2349. [Google Scholar] [CrossRef] [PubMed]
- Liu, H.; Wang, J.; He, T.; Becker, S.; Zhang, G.L.; Li, D.F.; Ma, X. Butyrate: A double-edged sword for health? Adv. Nutr. 2018, 9, 21–29. [Google Scholar] [CrossRef] [PubMed]
 Mcov matrix,
  Mnc matrix,
  Mno matrix.
Mcov matrix, Mnc matrix, Mno matrix.
Mno matrix.
Mcov matrix, Mnc matrix, Mno matrix.
 Mcov matrix, Mnc matrix, Mno matrix.
Mcov matrix, Mnc matrix, Mno matrix.
Mcov matrix, Mnc matrix, Mno matrix.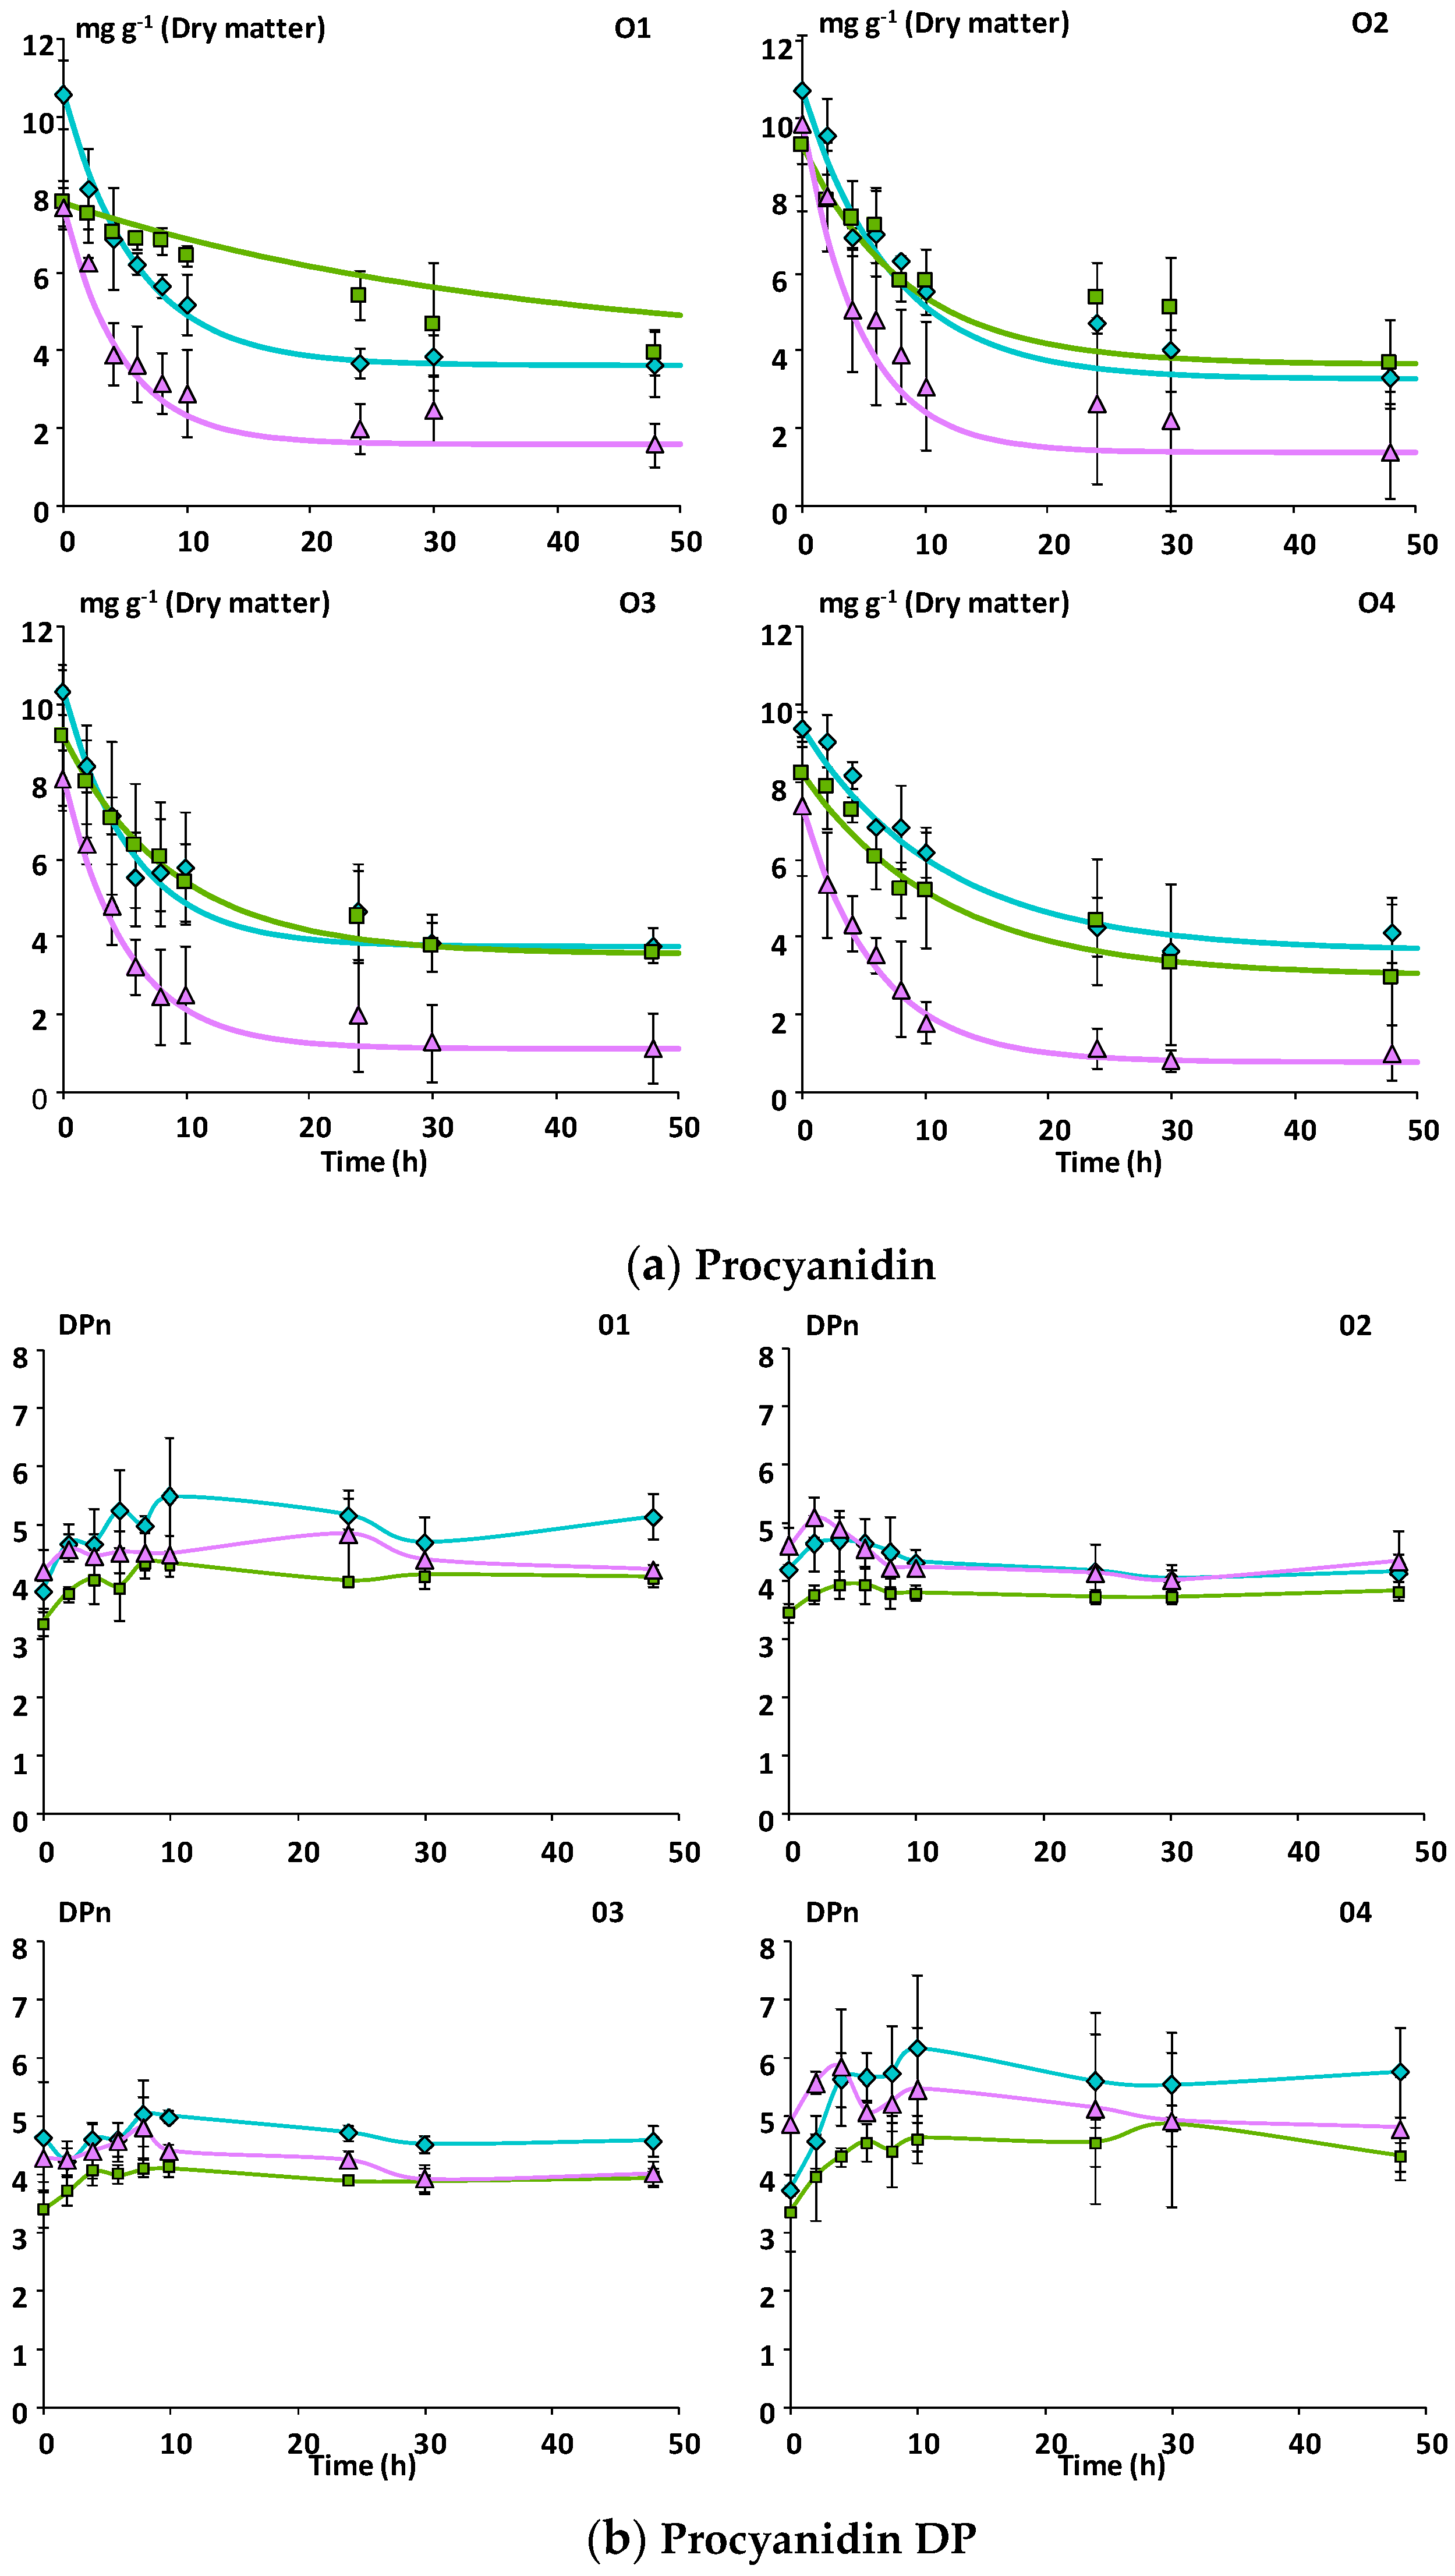 Mcov matrix, Mnc matrix, Mno matrix.
Mcov matrix, Mnc matrix, Mno matrix.
Mcov matrix, Mnc matrix, Mno matrix.
 Mcov matrix, Mnc matrix, Mno matrix.
Mcov matrix, Mnc matrix, Mno matrix.
Mcov matrix, Mnc matrix, Mno matrix.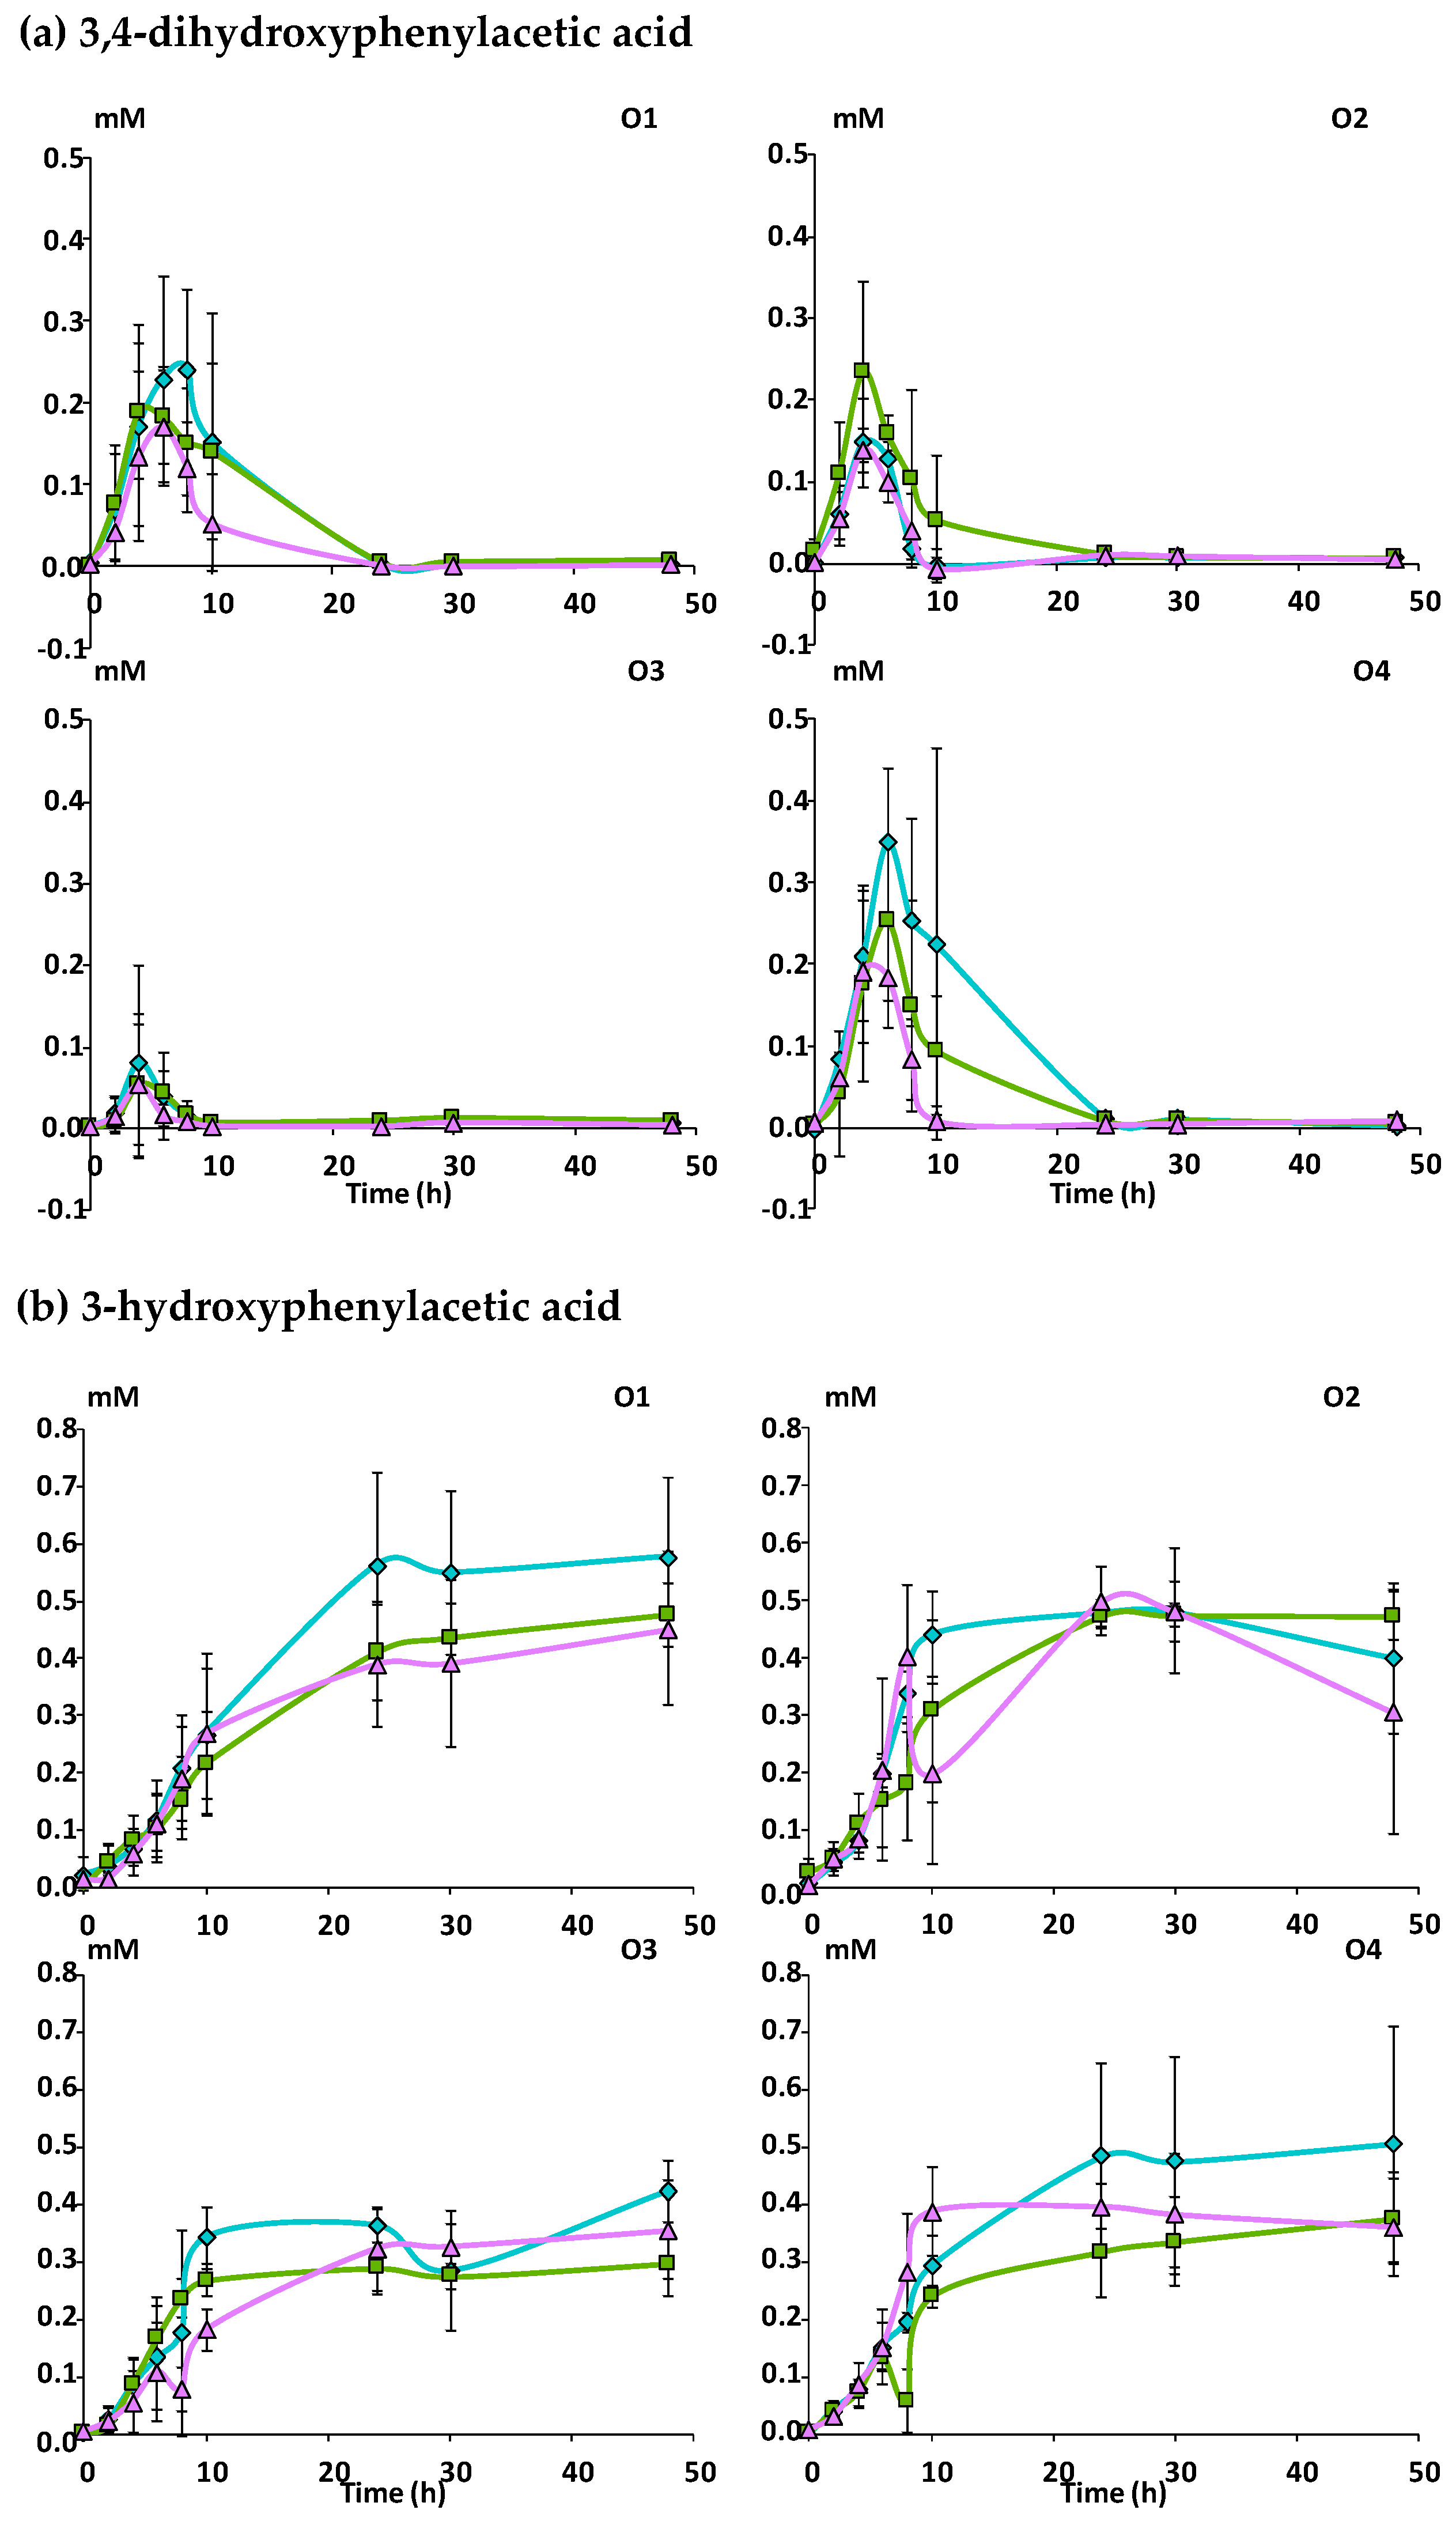 Mcov matrix, Mnc matrix, Mno matrix.
Mcov matrix, Mnc matrix, Mno matrix.
Mcov matrix, Mnc matrix, Mno matrix.


 Mcov,
Mcov,  Mnc,
Mnc,  Mno). Interleukin 8 (IL8) was used as a marker of inflammation. The red line corresponds to IL8 production by TNFα-treated intestinal cells. The box plots represent IL8 production (pg/mL) by TNFα treated cells on which the supernatant of the fermenters after 48h fermentation of the apple matrices has been applied. Centre lines show the medians; box limits indicate the 25th and 75th percentiles. When IL8 levels > red line: pro-inflammatory effect of the supernatants. When IL8 levels < red line: anti-inflammatory effect of the supernatants.
Mcov, Mnc, Mno). Interleukin 8 (IL8) was used as a marker of inflammation. The red line corresponds to IL8 production by TNFα-treated intestinal cells. The box plots represent IL8 production (pg/mL) by TNFα treated cells on which the supernatant of the fermenters after 48h fermentation of the apple matrices has been applied. Centre lines show the medians; box limits indicate the 25th and 75th percentiles. When IL8 levels > red line: pro-inflammatory effect of the supernatants. When IL8 levels < red line: anti-inflammatory effect of the supernatants.
Mno). Interleukin 8 (IL8) was used as a marker of inflammation. The red line corresponds to IL8 production by TNFα-treated intestinal cells. The box plots represent IL8 production (pg/mL) by TNFα treated cells on which the supernatant of the fermenters after 48h fermentation of the apple matrices has been applied. Centre lines show the medians; box limits indicate the 25th and 75th percentiles. When IL8 levels > red line: pro-inflammatory effect of the supernatants. When IL8 levels < red line: anti-inflammatory effect of the supernatants.
Mcov, Mnc, Mno). Interleukin 8 (IL8) was used as a marker of inflammation. The red line corresponds to IL8 production by TNFα-treated intestinal cells. The box plots represent IL8 production (pg/mL) by TNFα treated cells on which the supernatant of the fermenters after 48h fermentation of the apple matrices has been applied. Centre lines show the medians; box limits indicate the 25th and 75th percentiles. When IL8 levels > red line: pro-inflammatory effect of the supernatants. When IL8 levels < red line: anti-inflammatory effect of the supernatants.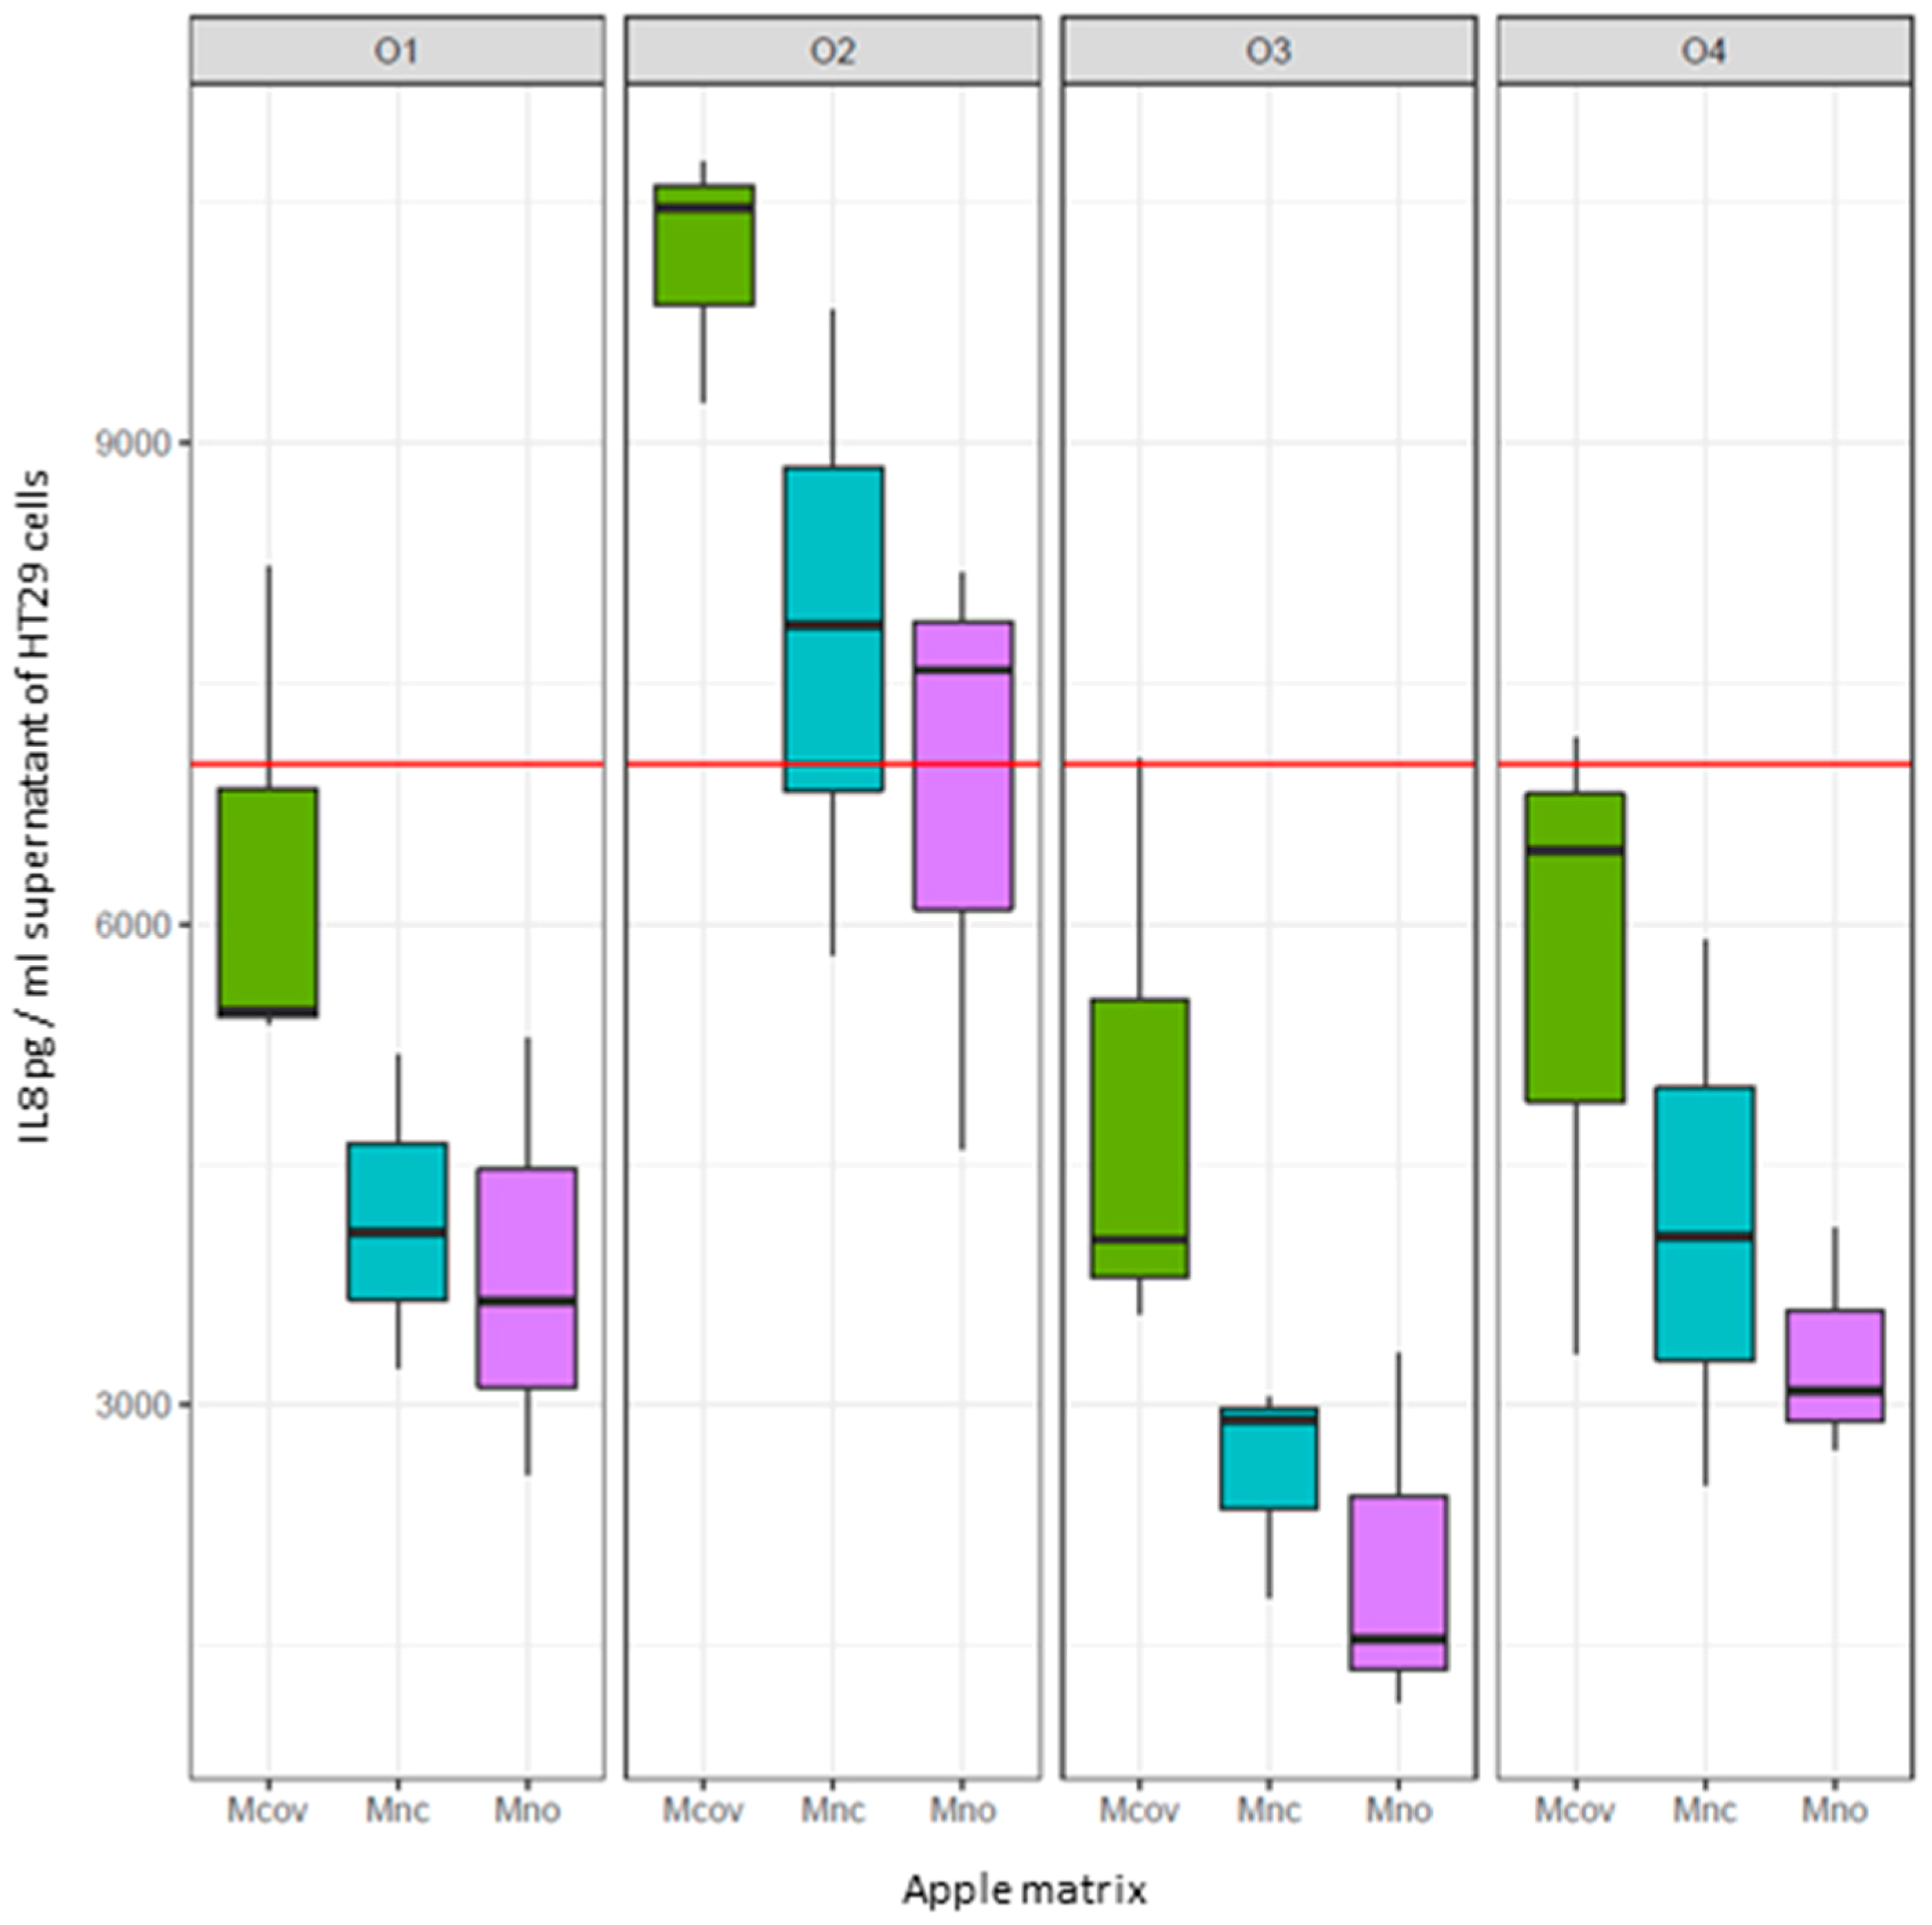


| Apple Matrix Composition | Apple Matrices | |||
|---|---|---|---|---|
| Mnc | Mcov | Mno | Pooled SD 3 | |
| Phenolic compounds 1 | ||||
| Flavan-3-ols | ||||
| CAT | 4.39 | 5.83 | 4.16 | 0.66 |
| EPI | 10.8 | 11.3 | 8.9 | 1.2 |
| PCA | 59.0 | 50.9 | 63.9 | 2.1 |
| DPn | 5.6 | 5.6 | 6.3 | 0.32 |
| Dihydrochalcones | ||||
| PLX | 0.87 | 0.94 | 0.68 | 0.02 |
| PLZ | 4.56 | 5.35 | 3.17 | 0.06 |
| Hydroxycinnamic acids | ||||
| 5CQA | 17.42 | 22.26 | 17.39 | 0.23 |
| pCQA | 1.27 | 1.50 | 1.10 | 0.04 |
| Flavonols | ||||
| TotalFl | 1.74 | 1.82 | 0.67 | 0.22 |
| Anthocyanins | ||||
| EC | nd | 0.02 | nd | 0.00 |
| CYA | nd | 0.08 | nd | 0.00 |
| AIS 2 | ||||
| Rha | 9 | 7 | 11 | 0.2 |
| Fuc | 5 | 4 | 1 | 0.2 |
| Ara | 76 | 71 | 81 | 5.7 |
| Xyl | 37 | 37 | 47 | 3.7 |
| Man | 15 | 12 | 9 | 3.3 |
| Gal | 49 | 45 | 45 | 4.0 |
| Glc | 214 | 174 | 254 | 11.9 |
| GalA | 148 | 144 | 170 | 4.4 |
| MeOH (DM) | 22 (80) | 20 (78) | 25 (81) | 0.9 (4.6) |
| Donor | Apple Matrices | Rate (h−1) 1 | |||
|---|---|---|---|---|---|
| Acetate | Propionate | Butyrate | Procyanidins | ||
| O1 | Mnc | 0.131 | 0.081 | 0.066 | 0.171 |
| Mcov | 0.207 | 0.105 | 0.105 | 0.043 | |
| Mno | 0.074 | 0.044 | 0.032 | 0.211 | |
| O2 | Mnc | 0.184 | 0.119 | 0.109 | 0.137 |
| Mcov | 0.185 | 0.100 | 0.081 | 0.116 | |
| Mno | 0.115 | 0.075 | 0.065 | 0.191 | |
| O3 | Mnc | 0.116 | 0.126 | 0.070 | 0.188 |
| Mcov | 0.158 | 0.168 | 0.063 | 0.126 | |
| Mno | 0.031 | 0.026 | 0.019 | 0.187 | |
| O4 | Mnc | 0.206 | 0.203 | 0.092 | 0.091 |
| Mcov | 0.197 | 0.186 | 0.093 | 0.067 | |
| Mno | 0.100 | 0.115 | 0.048 | 0.125 | |
| Pooled SD 2 | 0.027 | 0.032 | 0.019 | 0.027 | |
| F-value and significance | |||||
| Donor | 3.560 | 4.598 | 1.820 | 2.452 | |
| * | * | ns | ns | ||
| Matrix | 16.306 | 7.281 | 7.158 | 13.705 | |
| *** | ** | ** | *** | ||
| Statistics | Acetate | Propionate | Butyrate | PCA | 3,4-diOHPPA | 3-OHPPA | 4-OHPPA | 3-PPA | 3,4-diOHPAA | 3-OHPAA | 3,4-diOHPval | 3-OHPval | 3-OHPVA |
|---|---|---|---|---|---|---|---|---|---|---|---|---|---|
| F-value and significance | |||||||||||||
| Matrix | 8.779 | 1.852 | 6.281 | 23.364 | 12.113 | 5.831 | 8.520 | 1.134 | 4.543 | 2.501 | 6.089 | 2.646 | 9.311 |
| ** | ns | ** | *** | ** | ** | ** | ns | * | ns | ** | ns | ** | |
| Donor | 3.138 | 9.067 | 3.329 | 0.404 | 4.224 | 3.579 | 15.977 | 18.129 | 13.607 | 2.259 | 41.739 | 11.098 | 34.339 |
| * | * | * | ns | * | * | *** | *** | *** | ns | *** | *** | *** |
© 2019 by the authors. Licensee MDPI, Basel, Switzerland. This article is an open access article distributed under the terms and conditions of the Creative Commons Attribution (CC BY) license (http://creativecommons.org/licenses/by/4.0/).
Share and Cite
Le Bourvellec, C.; Bagano Vilas Boas, P.; Lepercq, P.; Comtet-Marre, S.; Auffret, P.; Ruiz, P.; Bott, R.; Renard, C.M.G.C.; Dufour, C.; Chatel, J.-M.; et al. Procyanidin—Cell Wall Interactions within Apple Matrices Decrease the Metabolization of Procyanidins by the Human Gut Microbiota and the Anti-Inflammatory Effect of the Resulting Microbial Metabolome In Vitro. Nutrients 2019, 11, 664. https://doi.org/10.3390/nu11030664
Le Bourvellec C, Bagano Vilas Boas P, Lepercq P, Comtet-Marre S, Auffret P, Ruiz P, Bott R, Renard CMGC, Dufour C, Chatel J-M, et al. Procyanidin—Cell Wall Interactions within Apple Matrices Decrease the Metabolization of Procyanidins by the Human Gut Microbiota and the Anti-Inflammatory Effect of the Resulting Microbial Metabolome In Vitro. Nutrients. 2019; 11(3):664. https://doi.org/10.3390/nu11030664
Chicago/Turabian StyleLe Bourvellec, Carine, Priscilla Bagano Vilas Boas, Pascale Lepercq, Sophie Comtet-Marre, Pauline Auffret, Philippe Ruiz, Romain Bott, Catherine M. G. C. Renard, Claire Dufour, Jean-Marc Chatel, and et al. 2019. "Procyanidin—Cell Wall Interactions within Apple Matrices Decrease the Metabolization of Procyanidins by the Human Gut Microbiota and the Anti-Inflammatory Effect of the Resulting Microbial Metabolome In Vitro" Nutrients 11, no. 3: 664. https://doi.org/10.3390/nu11030664
APA StyleLe Bourvellec, C., Bagano Vilas Boas, P., Lepercq, P., Comtet-Marre, S., Auffret, P., Ruiz, P., Bott, R., Renard, C. M. G. C., Dufour, C., Chatel, J.-M., & Mosoni, P. (2019). Procyanidin—Cell Wall Interactions within Apple Matrices Decrease the Metabolization of Procyanidins by the Human Gut Microbiota and the Anti-Inflammatory Effect of the Resulting Microbial Metabolome In Vitro. Nutrients, 11(3), 664. https://doi.org/10.3390/nu11030664