Comparison of Dietary Micronutrient Intakes by Body Weight Status among Mexican-American and Non-Hispanic Black Women Aged 19–39 Years: An Analysis of NHANES 2003–2014


Abstract
1. Introduction
2. Materials and Methods
2.1. Study Population and Anthropometry Data
2.2. Assessments of Micronutrient Intakes from Foods
2.3. Statistical Analysis
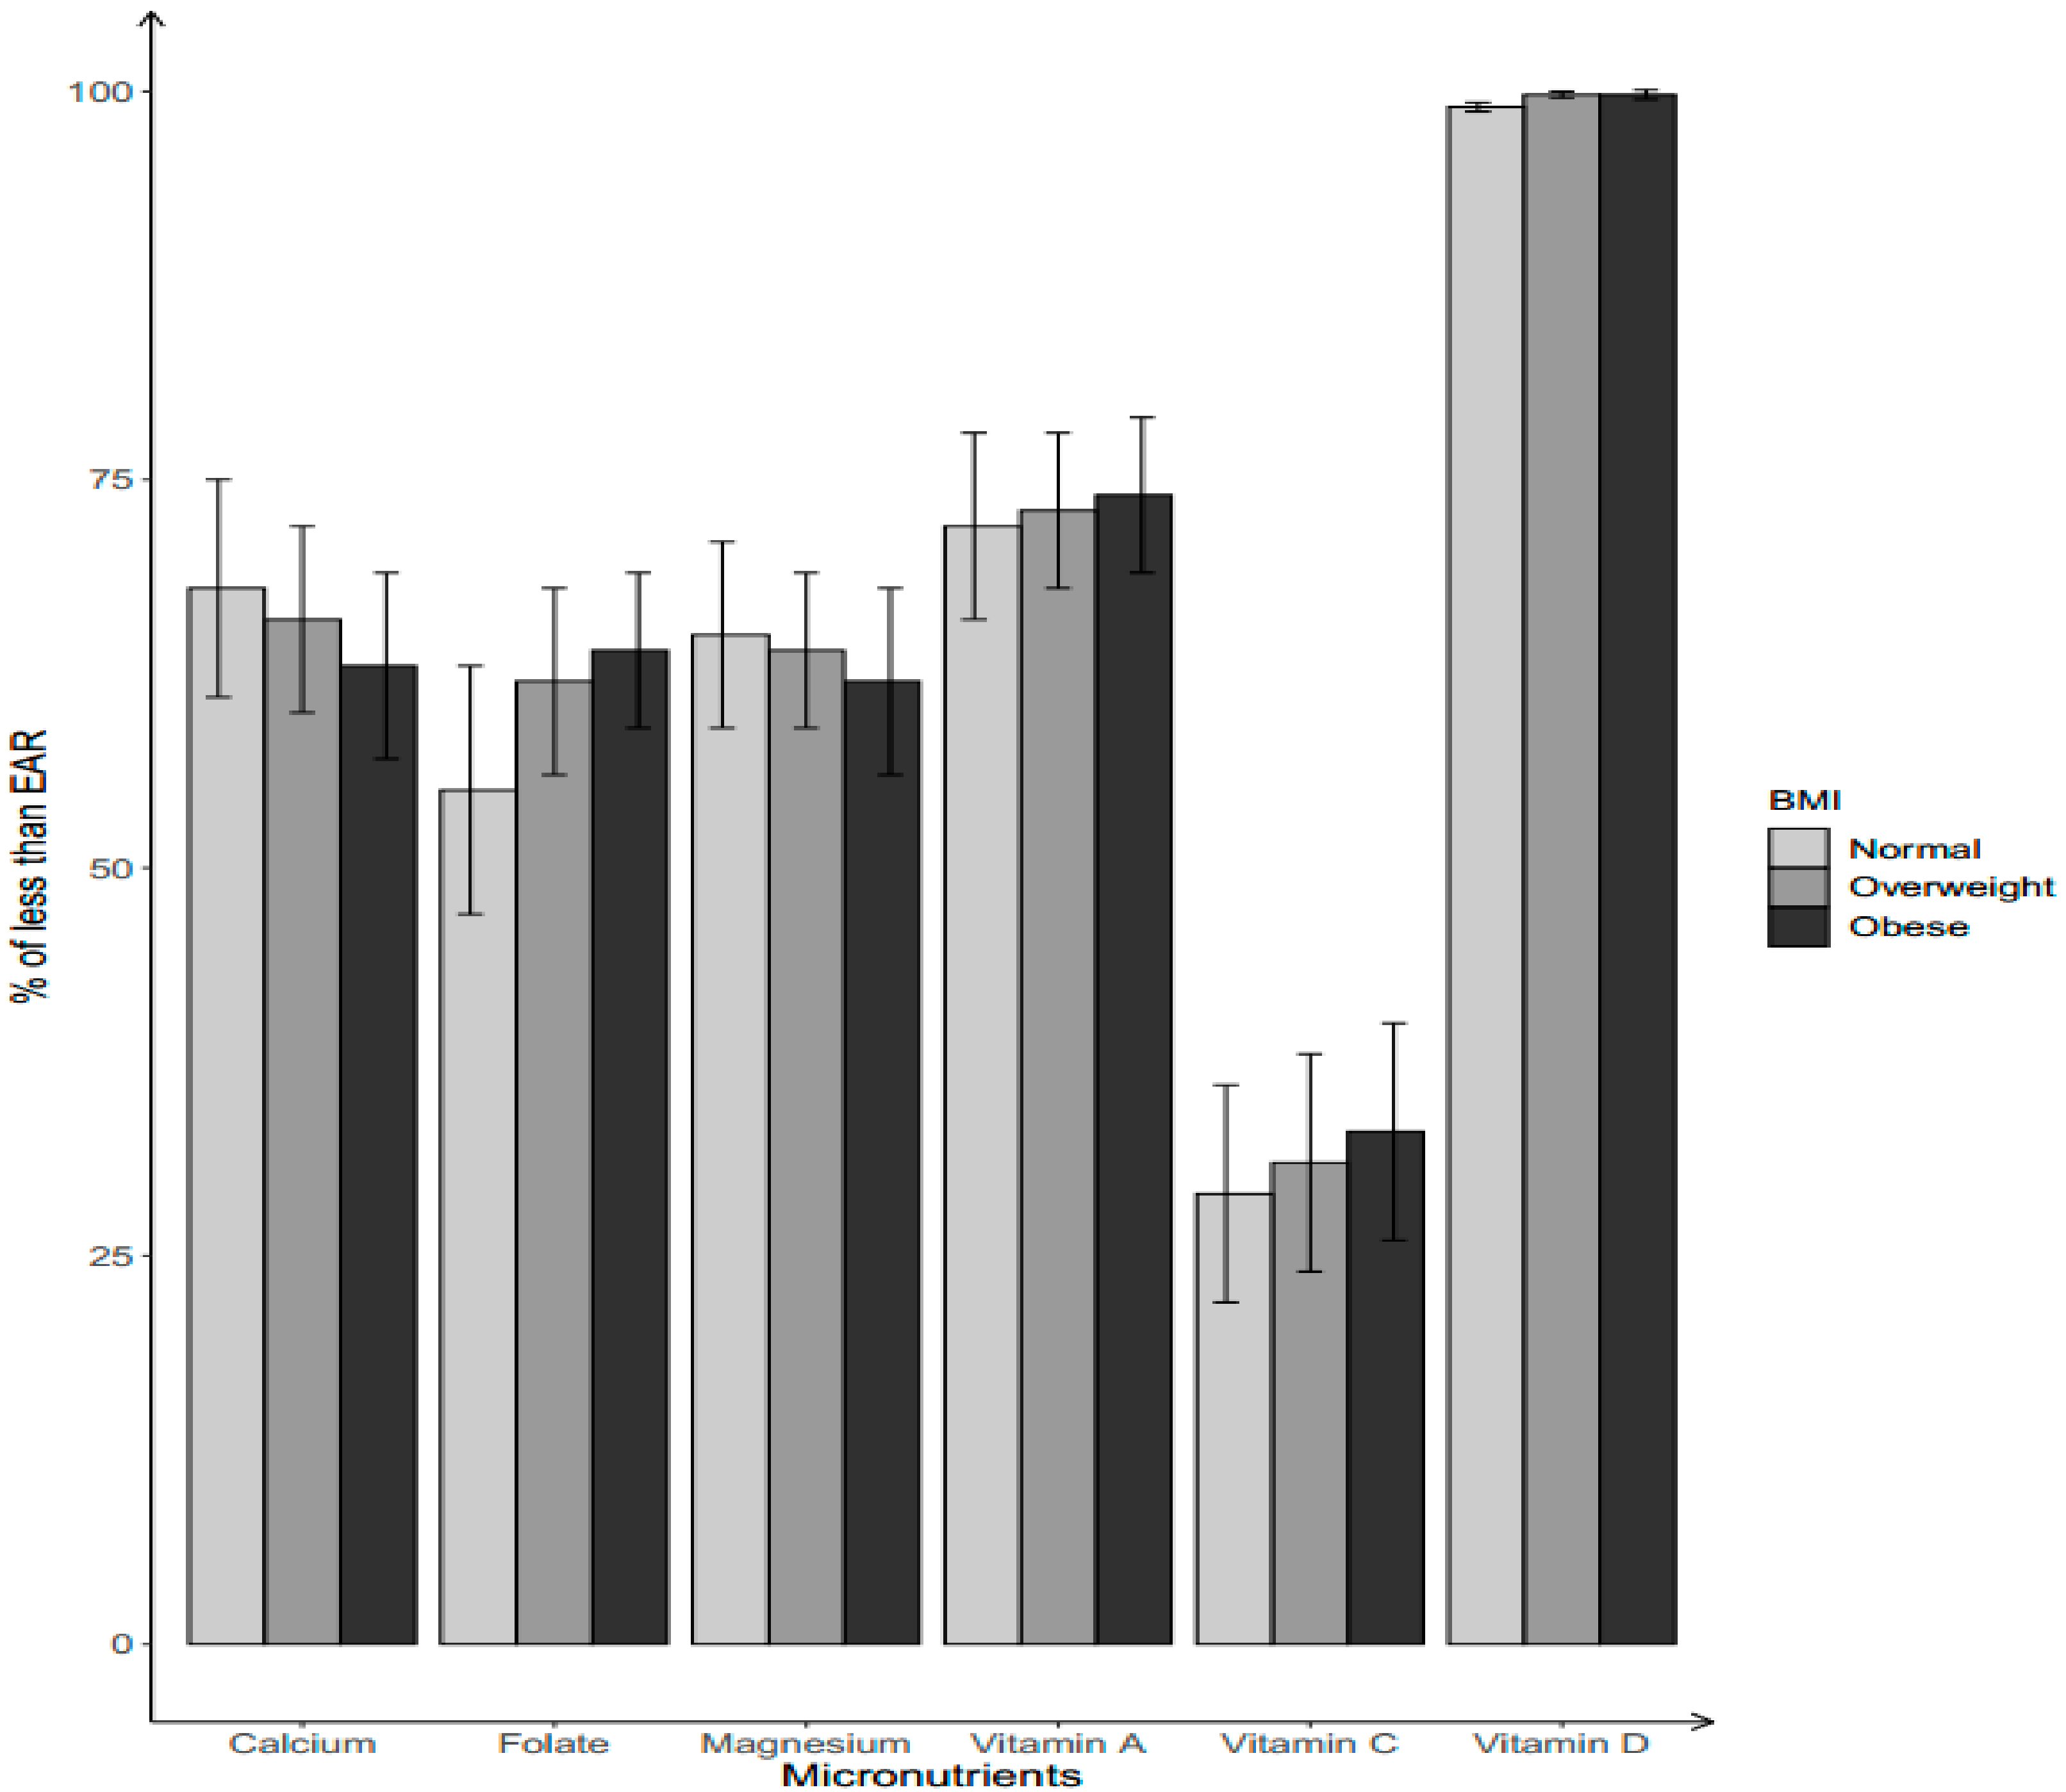
3. Results
4. Discussion
5. Conclusions
Supplementary Materials
Author Contributions
Acknowledgments
Conflicts of Interest
References
- Christian, P.; Stewart, C.P. Maternal micronutrient deficiency, fetal development, and the risk of chronic disease. J. Nutr. 2010, 140, 437–445. [Google Scholar] [CrossRef] [PubMed]
- Cetin, I.; Berti, C.; Calabrese, S. Role of micronutrients in the periconceptional period. Hum. Reprod. Update 2010, 16, 80–95. [Google Scholar] [CrossRef] [PubMed]
- Kontic-Vucinic, O.; Sulovic, N.; Radunovic, N. Micronutrients in women’s reproductive health: Ii. Minerals and trace elements. Int. J. Fertil Womens Med. 2006, 51, 116–124. [Google Scholar] [PubMed]
- Zeisel, S.H. Is maternal diet supplementation beneficial? Optimal development of infant depends on mother’s diet. Am. J. Clin. Nutr. 2009, 89, 685S–687S. [Google Scholar] [CrossRef]
- Bartley, K.A.; Underwood, B.A.; Deckelbaum, R.J. A life cycle micronutrient perspective for women’s health. Am. J. Clin. Nutr. 2005, 81, 1188S–1193S. [Google Scholar] [CrossRef]
- Torheim, L.E.; Ferguson, E.L.; Penrose, K.; Arimond, M. Women in resource-poor settings are at risk of inadequate intakes of multiple micronutrients. J. Nutr. 2010, 140, 2051S–2058S. [Google Scholar] [CrossRef]
- Bastos Maia, S.; Rolland Souza, A.S.; Costa Caminha, M.F.; Lins da Silva, S.; Callou Cruz, R.S.B.L.; Carvalho Dos Santos, C.; Batista Filho, M. Vitamin a and pregnancy: A narrative review. Nutrients 2019, 11, e681. [Google Scholar] [CrossRef]
- Jang, W.; Kim, H.; Lee, B.E.; Chang, N. Maternal fruit and vegetable or vitamin c consumption during pregnancy is associated with fetal growth and infant growth up to 6 months: Results from the korean mothers and children’s environmental health (moceh) cohort study. Nutr. J. 2018, 17, 105. [Google Scholar] [CrossRef]
- Liu, C.; Zhong, C.; Chen, R.; Zhou, X.; Wu, J.; Han, J.; Li, X.; Zhang, Y.; Gao, Q.; Xiao, M.; et al. Higher dietary vitamin c intake is associated with a lower risk of gestational diabetes mellitus: A longitudinal cohort study. Clin. Nutr. 2019. [Google Scholar] [CrossRef]
- Yin, J.; Dwyer, T.; Riley, M.; Cochrane, J.; Jones, G. The association between maternal diet during pregnancy and bone mass of the children at age 16. Eur. J. Clin. Nutr. 2010, 64, 131–137. [Google Scholar] [CrossRef]
- Kumanyika, S.K.; Obarzanek, E.; Stettler, N.; Bell, R.; Field, A.E.; Fortmann, S.P.; Franklin, B.A.; Gillman, M.W.; Lewis, C.E.; Poston, W.C., 2nd; et al. Population-based prevention of obesity: The need for comprehensive promotion of healthful eating, physical activity, and energy balance: A scientific statement from american heart association council on epidemiology and prevention, interdisciplinary committee for prevention (formerly the expert panel on population and prevention science). Circulation 2008, 118, 428–464. [Google Scholar] [PubMed]
- Pannu, P.K.; Calton, E.K.; Soares, M.J. Calcium and vitamin d in obesity and related chronic disease. Adv. Food Nutr. Res. 2016, 77, 57–100. [Google Scholar] [PubMed]
- Hosseini, B.; Saedisomeolia, A.; Allman-Farinelli, M. Association between antioxidant intake/status and obesity: A systematic review of observational studies. Biol. Trac. Elem. Res. 2017, 175, 287–297. [Google Scholar] [CrossRef] [PubMed]
- Bento, C.; Mato, A.C.; Cordeiro, A.; Ramalho, A. Vitamin a deficiency is associated with body mass index and body adiposity in women with recommended intake of vitamin a. Nutr. Hosp. 2018, 35, 1072–1078. [Google Scholar] [PubMed]
- Hales, C.M.; Carroll, M.D.; Fryar, C.D.; Ogden, C.L. Prevalence of obesity among adults and youth: United states, 2015–2016. NCHS Data Brief 2017, 288, 1–8. [Google Scholar]
- Ogden, C.L.; Carroll, M.D.; Fryar, C.D.; Flegal, K.M. Prevalence of obesity among adults and youth: United states, 2011–2014. NCHS Data Brief 2015, 219, 1–8. [Google Scholar]
- Rai, D.; Bird, J.K.; McBurney, M.I.; Chapman-Novakofski, K.M. Nutritional status as assessed by nutrient intakes and biomarkers among women of childbearing age--is the burden of nutrient inadequacies growing in america? Public Health Nutr. 2015, 18, 1658–1669. [Google Scholar] [CrossRef]
- Storey, M.L.; Anderson, P.A. Vegetable consumption and selected nutrient intakes of women of childbearing age. J. Nutr. Educ. Behav. 2016, 48, 691–696. [Google Scholar] [CrossRef]
- Yang, Q.H.; Carter, H.K.; Mulinare, J.; Berry, R.J.; Friedman, J.M.; Erickson, J.D. Race-ethnicity differences in folic acid intake in women of childbearing age in the united states after folic acid fortification: Findings from the national health and nutrition examination survey, 2001–2002. Am. J. Clin. Nutr. 2007, 85, 1409–1416. [Google Scholar] [CrossRef]
- Groth, S.W.; Stewart, P.A.; Ossip, D.J.; Block, R.C.; Wixom, N.; Fernandez, I.D. Micronutrient intake is inadequate for a sample of pregnant african-american women. J. Acad. Nutr. Diet 2017, 117, 589–598. [Google Scholar] [CrossRef]
- U.S. Department of Health Human Services; U.S. Department of Agriculture. 2015–2020 Dietary Guidelines for American, 8th ed.; U.S. Department of Health Human Services: Washington, DC, USA; U.S. Department of Agriculture: Washington, DC, USA, 2015. Available online: https://health.gov/dietaryguidelines/2015/guidelines/ (accessed on 3 June 2019).
- Johnson, C.L.; Dohrmann, S.M.; Burt, V.; Mohadjer, L.K. National health and nutrition examination survey: Sample design, 2011–2014. Vital Health Stat 2 2014, 1–33. [Google Scholar]
- Centers for Disease Control Prevention. National Health and Nutrition Examination Survey (nhanes): Anthropometry Procedures Manual; CreateSpace Independent Publishing Platform: Scotts Valley, CA, USA, 2014.
- James, P.T.; Leach, R.; Kalamara, E.; Shayeghi, M. The worldwide obesity epidemic. Obes. Res. 2001, 9, 228S–233S. [Google Scholar] [CrossRef] [PubMed]
- Ahluwalia, N.; Dwyer, J.; Terry, A.; Moshfegh, A.; Johnson, C. Update on nhanes dietary data: Focus on collection, release, analytical considerations, and uses to inform public policy. Adv. Nutr. 2016, 7, 121–134. [Google Scholar] [CrossRef] [PubMed]
- U.S. Department of Agriculture, Agricultural Research Service. Usda National Nutrient Database for Standard Reference. Available online: https://www.ars.usda.gov/northeast-area/beltsville-md-bhnrc/beltsville-human-nutrition-research-center/nutrient-data-laboratory/docs/usda-national-nutrient-database-for-standard-reference/ (accessed on 3 June 2019).
- Institute of Medicine. Dietary Reference Intakes: The Essential Guide to Nutrient Requirements; National Academies Press: Washington, DC, USA, 2006. [Google Scholar]
- Tooze, J.A.; Midthune, D.; Dodd, K.W.; Freedman, L.S.; Krebs-Smith, S.M.; Subar, A.F.; Guenther, P.M.; Carroll, R.J.; Kipnis, V. A new statistical method for estimating the usual intake of episodically consumed foods with application to their distribution. J. Am. Diet. Assoc. 2006, 106, 1575–1587. [Google Scholar] [CrossRef] [PubMed]
- Tooze, J.A.; Kipnis, V.; Buchman, D.W.; Carroll, R.J.; Freedman, L.S.; Guenther, P.M.; Krebs-Smith, S.M.; Subar, A.F.; Dodd, K.W. A mixed-effects model approach for estimating the distribution of usual intake of nutrients: The NCI method. Stat. Med. 2010, 29, 2857–2868. [Google Scholar] [CrossRef] [PubMed]
- Herrick, K.A.; Rossen, L.M.; Parsons, R.; Dodd, K.W. Estimating usual dietary intake from national health and nutrition examination survey data using the national cancer institute method. Vital Health Stat. 2018, 178, 1–63. [Google Scholar]
- Subcommittee on Criteria for Dietary Evaluation, Coordinating Committee on Evaluation of Food Consumption Surveys, Food and Nutrition Board, Commission on Life Science, National Research Council. Nutrient Adequacy: Assessment Using Food Comsumption Surveys; National Academies Press (US): Washington, DC, USA, 1986.
- SAS Institute Inc. Base SAS 9.4 Procedures Guide, 5th ed.; Sas institute Inc.: Cary, NC, USA, 2015; Available online: http://www.support.sas.com (accessed on 3 June 2019).
- U.S. Census Bureau. Ratio of Income to Poverty Level. Available online: http://www.census.gov/hhes/income/defs/ratio.html (accessed on 5 November 2019).
- Tidwell, D.K.; Valliant, M.W. Higher amounts of body fat are associated with inadequate intakes of calcium and vitamin d in african american women. Nutr. Res. 2011, 31, 527–536. [Google Scholar] [CrossRef]
- Zemel, M.B.; Richards, J.; Milstead, A.; Campbell, P. Effects of calcium and dairy on body composition and weight loss in african-american adults. Obes. Res. 2005, 13, 1218–1225. [Google Scholar] [CrossRef]
- García, O.P.; Ronquillo, D.; Caamaño Mdel, C.; Camacho, M.; Long, K.Z.; Rosado, J.L. Zinc, vitamin a, and vitamin c status are associated with leptin concentrations and obesity in mexican women: Results from a cross-sectional study. Nutr. Metab. 2012, 9, 59. [Google Scholar] [CrossRef]
- Chambers, E.C.; Heshka, S.; Gallagher, D.; Wang, J.; Pi-Sunyer, F.X.; Pierson, R.N., Jr. Serum iron and body fat distribution in a multiethnic cohort of adults living in new york city. J. Am. Diet. Assoc. 2006, 106, 680–684. [Google Scholar] [CrossRef]
- Institute of Medicine (US) Panel on Micronutrients. Dietary Reference Intakes for Vitamin A, Vitamin K, Arsenic, Boron, Chromium, Copper, Iodine, Iron, Manganese, Molybdenum, Nickel, Silicon, Vanadium, and Zinc; National Academies Press (US): Washington, DC, USA, 2001.
- Ross, A.C.; Caballero, B.; Cousins, R.J.; Tucker, K.L.; Ziegler, T.R. Modern Nutrition in Health and Disease; Lippincott Williams & Wilkins: Philadelphia, PA, USA, 2014. [Google Scholar]
- Pang, X.Y.; Wang, S.; Jurczak, M.J.; Shulman, G.I.; Moise, A.R. Retinol saturase modulates lipid metabolism and the production of reactive oxygen species. Arch Biochem. Biophys. 2017, 633, 93–102. [Google Scholar] [CrossRef] [PubMed]
- Arab, L.; Carriquiry, A.; Steck-Scott, S.; Gaudet, M.M. Ethnic differences in the nutrient intake adequacy of premenopausal us women: Results from the third national health examination survey. J. Am. Diet. Assoc. 2003, 103, 1008–1014. [Google Scholar] [CrossRef]
- Cha, S.; Kang, J.H.; Lee, J.H.; Kim, J.; Kim, H.; Yang, Y.J.; Park, W.Y.; Kim, J. Impact of genetic variants on the individual potential for body fat loss. Nutrients 2018, 10, E266. [Google Scholar] [CrossRef] [PubMed]
- Oh, R.; Brown, D.L. Vitamin b12 deficiency. Am. Fam. Physician 2003, 67, 979–986. [Google Scholar]
- Crider, K.S.; Bailey, L.B.; Berry, R.J. Folic acid food fortification-its history, effect, concerns, and future directions. Nutrients 2011, 3, 370–384. [Google Scholar] [CrossRef]
- Dietrich, M.; Brown, C.J.; Block, G. The effect of folate fortification of cereal-grain products on blood folate status, dietary folate intake, and dietary folate sources among adult non-supplement users in the united states. J. Am. Coll. Nutr. 2005, 24, 266–274. [Google Scholar] [CrossRef]
- Tinker, S.C.; Cogswell, M.E.; Devine, O.; Berry, R.J. Folic acid intake among U.S. Women aged 15–44 years, national health and nutrition examination survey, 2003–2006. Am. J. Prev. Med. 2010, 38, 534–542. [Google Scholar] [CrossRef]
- Murakami, K.; Livingstone, M.B. Prevalence and characteristics of misreporting of energy intake in us adults: Nhanes 2003–2012. Br. J. Nutr. 2015, 114, 1294–1303. [Google Scholar] [CrossRef]
- Roark, R.A.; Niederhauser, V.P. Fruit and vegetable intake: Issues with definition and measurement. Public Health Nutr. 2013, 16, 2–7. [Google Scholar] [CrossRef]


| Non-Hispanic White (n = 1916) | Mexican-American (n = 916) | Non-Hispanic Black (n = 1099) | p-Value | |
|---|---|---|---|---|
| Age (years) | 29.3 ± 0.2 | 29.1 ± 0.2 | 28.7 ± 0.3 | 0.1658 |
| BMI group (%) | <0.0001 | |||
| Normal/underweight | 48.6 | 30.0 | 25.6 | |
| Overweight | 23.3 | 30.5 | 23.1 | |
| Obesity | 28.1 | 39.5 | 51.2 | |
| Marital status (%) | <0.0001 | |||
| Married | 46.3 | 47.1 | 20.4 | |
| Not married | 53.7 | 52.9 | 79.6 | |
| PIR a (%) | <0.0001 | |||
| <1.0 | 16.6 | 38.4 | 35.9 | |
| 1.0–1.84 | 16.9 | 28.3 | 24.6 | |
| ≥1.85 | 66.5 | 33.3 | 39.5 | |
| Education (%) | <0.0001 | |||
| Less than high school | 8.8 | 41.9 | 17.2 | |
| High school/ GED b | 18.6 | 20.4 | 24.9 | |
| Some college or above | 72.5 | 37.7 | 57.9 |
| Micronutrients | Mean ± SE a | p-Value * | ||
|---|---|---|---|---|
| Non-Hispanic White (n = 1916) | Mexican-American (n = 916) | Non-Hispanic Black (n = 1099) | ||
| Vitamin A, μg | 557.8 ± 21.0 | 454.6 ± 16.7 | 504.1 ± 16.9 | <0.0001 |
| Vitamin B2, mg | 2.0 ± 0.0 | 1.7 ± 0.0 | 1.8 ± 0.0 | <0.0001 |
| Vitamin B6, mg | 1.7 ± 0.1 | 1.7 ± 0.1 | 1.7 ± 0.1 | 0.03 |
| Vitamin B12, μg | 4.4 ± 0.2 | 4.1 ± 0.2 | 4.3 ± 0.2 | <0.0001 |
| Vitamin C, mg | 67.9 ± 3.2 | 89.4 ± 4.3 | 78.1 ± 3.4 | <0.0001 |
| Vitamin D, μg | 3.9 ± 0.2 | 3.7 ± 0.2 | 3.8 ± 0.2 | 0.04 |
| Folate, μg | 367.7 ± 8.5 | 346.2 ± 9.8 | 356.6 ± 7.9 | <0.0001 |
| Calcium, mg | 930.9 ± 23.0 | 849.2 ± 22.1 | 889.2 ± 20.5 | <0.0001 |
| Magnesium, mg | 269.3 ± 5.6 | 262.8 ± 5.6 | 265.8 ± 4.8 | 0.02 |
| Phosphorus, mg | 1245.4 ± 24.0 | 1234.4 ± 27.6 | 1239.3 ± 23.4 | 0.26 |
| Copper, μg | 749.7 ± 32.7 | 720.4 ± 29.3 | 734.7 ± 30.0 | 0.12 |
| Iron, mg | 13.6 ± 0.3 | 13.8 ± 0.3 | 13.7 ± 0.2 | 0.34 |
| Zinc, mg | 10.3 ± 0.3 | 10.3 ± 0.3 | 10.3 ± 0.2 | 0.75 |
| Energy, kcal | 2053.0 ± 29.2 | 2099.4 ± 39.9 | 2075.9 ± 29.4 | 0.04 |
| Micronutrients | Mean ± SE a | p-Value * | ||
|---|---|---|---|---|
| Normal/Under-Weight (n = 291) | Overweight (n = 283) | Obese (n = 342) | ||
| Vitamin A, μg | 494.7 ± 40.7 | 467.9 ± 34.0 | 442.1 ± 31.7 | 0.0004 |
| Vitamin B2, mg | 1.8 ± 0.1 | 1.8 ± 0.1 | 1.7 ± 0.1 | 0.04 |
| Vitamin B6, mg | 1.7 ± 0.1 | 1.7 ± 0.1 | 1.7 ± 0.2 | 0.20 |
| Vitamin B12, μg | 3.9 ± 0.3 | 3.8 ± 0.3 | 3.7 ± 0.3 | 0.24 |
| Vitamin C, mg | 87.3 ± 8.6 | 79.3 ± 7.5 | 72.0 ± 8.2 | 0.0002 |
| Vitamin D, μg | 3.4 ± 0.3 | 3.2 ± 0.2 | 3.0 ± 0.3 | 0.03 |
| Folate, μg | 377.5 ± 19.5 | 372.3 ± 19.5 | 367.9 ± 22.7 | 0.24 |
| Calcium, mg | 907.6 ± 47.7 | 902.9 ± 45.9 | 895.9 ± 50.7 | 0.50 |
| Magnesium, mg | 264.1 ± 22.8 | 264.6 ± 9.4 | 264.9 ± 9.2 | 0.90 |
| Phosphorus, mg | 1228.5 ± 52.4 | 1248.6 ± 48.1 | 1269.3 ± 50.3 | 0.04 |
| Copper, μg | 1130.7 ± 124.7 | 1133.8 ± 112.8 | 1133.4 ± 115.1 | 0.06 |
| Iron, mg | 14.1 ± 0.7 | 14.0 ± 0.6 | 13.9 ± 0.7 | 0.58 |
| Zinc, mg | 9.9 ± 0.5 | 10.2 ± 0.5 | 10.4 ± 0.5 | 0.05 |
| Energy, kcal | 1947.3 ± 79.4 | 1979.1 ± 69.7 | 2007.5 ± 72.9 | 0.13 |
| Micronutrients | Mean ± SE a | p-Value * | ||
|---|---|---|---|---|
| Normal/Under-Weight (n = 309) | Overweight (n = 250) | Obese (n = 540) | ||
| Vitamin A, μg | 419.7 ± 33.7 | 413.5 ± 27.4 | 408.3 ± 29.3 | 0.46 |
| Vitamin B2, mg | 1.5 ± 0.1 | 1.5 ± 0.1 | 1.5 ± 0.1 | 0.75 |
| Vitamin B6, mg | 1.6 ± 0.1 | 1.6 ± 0.1 | 1.6 ± 0.1 | 0.63 |
| Vitamin B12, μg | 3.9 ± 0.3 | 3.8 ± 0.2 | 3.7 ± 0.1 | 0.13 |
| Vitamin C, mg | 90.3 ± 9.4 | 88.3 ± 8.3 | 86.5 ± 8.5 | 0.34 |
| Vitamin D, μg | 3.1 ± 0.3 | 3.1 ± 0.2 | 3.0 ± 0.3 | 0.73 |
| Folate, μg | 318.1 ± 17.3 | 313.4 ± 13.3 | 307.8 ± 12.0 | 0.13 |
| Calcium, mg | 715.4 ± 41.1 | 731.0 ± 34.9 | 745.6 ± 36.5 | 0.14 |
| Magnesium, mg | 237.3 ± 9.9 | 239.6 ± 9.0 | 241.4 ± 10.0 | 0.42 |
| Phosphorus, mg | 1120.6 ± 44.5 | 1132.9 ± 36.6 | 1145.1 ± 42.1 | 0.37 |
| Copper, μg | 1060.5 ± 113.6 | 1079.8 ± 102.6 | 1094.8 ± 117.2 | 0.67 |
| Iron, mg | 13.4 ± 0.6 | 13.1 ± 0.4 | 12.8 ± 0.4 | 0.02 |
| Zinc, mg | 10.4 ± 0.5 | 10.1 ± 0.4 | 9.8 ± 0.4 | 0.01 |
| Energy, kcal | 2190.2 ± 87.6 | 2176.7 ± 71.0 | 2160.9 ± 70.3 | 0.43 |
© 2019 by the authors. Licensee MDPI, Basel, Switzerland. This article is an open access article distributed under the terms and conditions of the Creative Commons Attribution (CC BY) license (http://creativecommons.org/licenses/by/4.0/).
Share and Cite
Liu, J.; Zhu, X.; Fulda, K.G.; Chen, S.; Tao, M.-H. Comparison of Dietary Micronutrient Intakes by Body Weight Status among Mexican-American and Non-Hispanic Black Women Aged 19–39 Years: An Analysis of NHANES 2003–2014. Nutrients 2019, 11, 2846. https://doi.org/10.3390/nu11122846
Liu J, Zhu X, Fulda KG, Chen S, Tao M-H. Comparison of Dietary Micronutrient Intakes by Body Weight Status among Mexican-American and Non-Hispanic Black Women Aged 19–39 Years: An Analysis of NHANES 2003–2014. Nutrients. 2019; 11(12):2846. https://doi.org/10.3390/nu11122846
Chicago/Turabian StyleLiu, Jialiang, Xiangzhu Zhu, Kimberly G. Fulda, Shande Chen, and Meng-Hua Tao. 2019. "Comparison of Dietary Micronutrient Intakes by Body Weight Status among Mexican-American and Non-Hispanic Black Women Aged 19–39 Years: An Analysis of NHANES 2003–2014" Nutrients 11, no. 12: 2846. https://doi.org/10.3390/nu11122846
APA StyleLiu, J., Zhu, X., Fulda, K. G., Chen, S., & Tao, M.-H. (2019). Comparison of Dietary Micronutrient Intakes by Body Weight Status among Mexican-American and Non-Hispanic Black Women Aged 19–39 Years: An Analysis of NHANES 2003–2014. Nutrients, 11(12), 2846. https://doi.org/10.3390/nu11122846