Utilizing Multi-Source Remote Sensing Data and the CGAN to Identify Key Drought Factors Influencing Maize Across Distinct Phenological Stages


Highlights
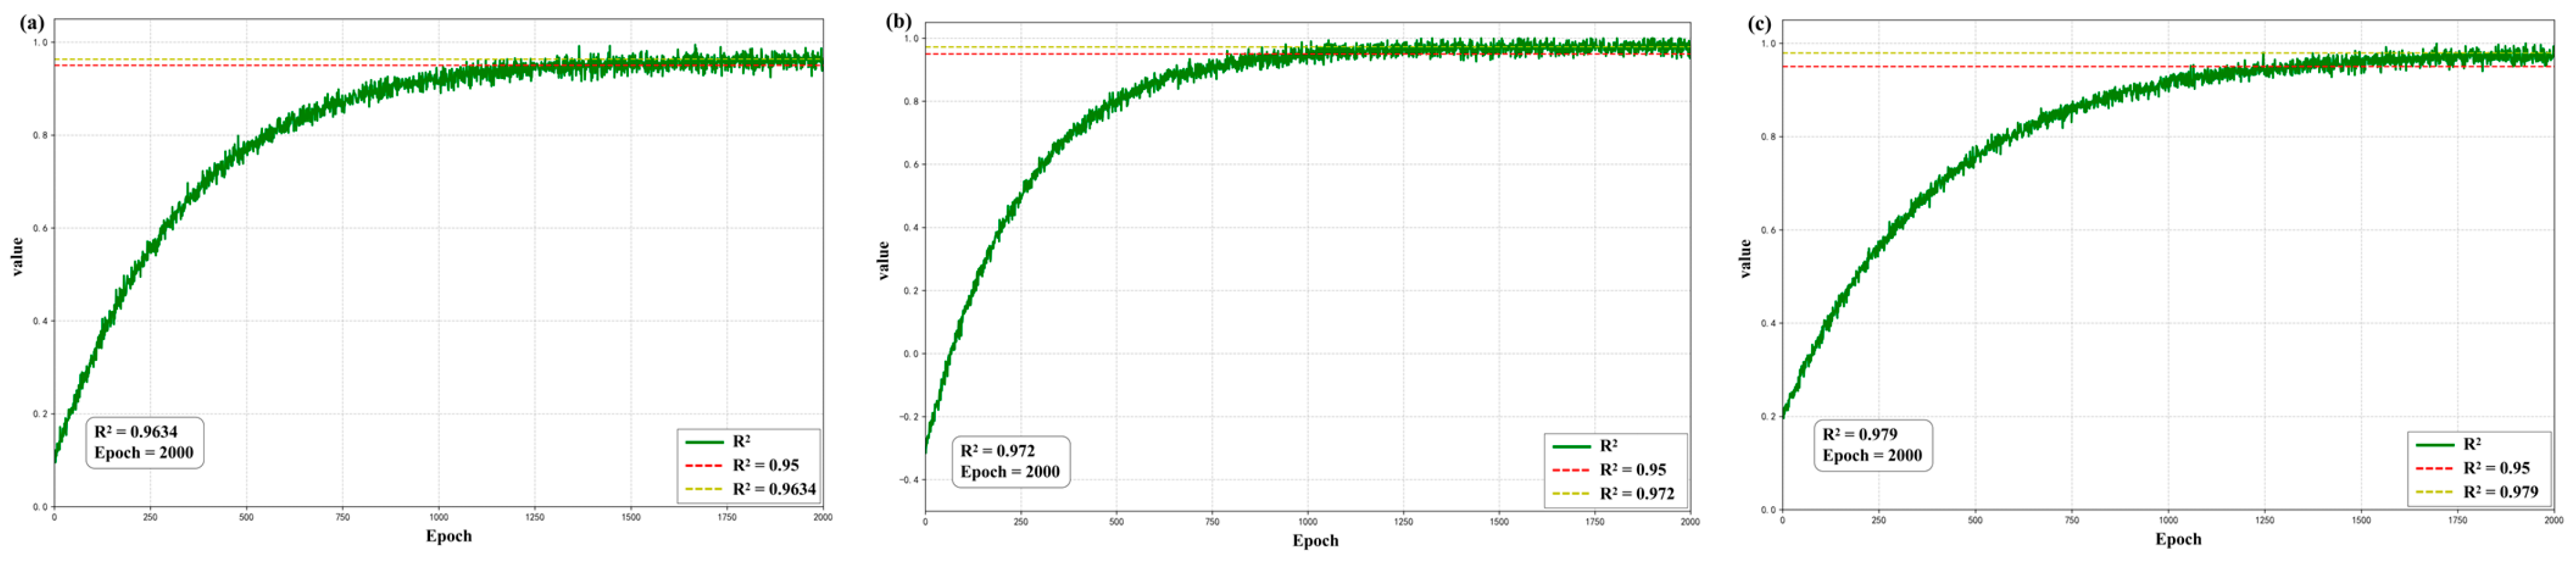
- The improved CGAN model achieved high-precision fitting of maize drought severity (R2 > 0.96) under limited sample conditions in Northwest China’s rain-fed agricultural region, demonstrating superior capability in capturing complex nonlinear relationships among multi-source remote sensing factors.
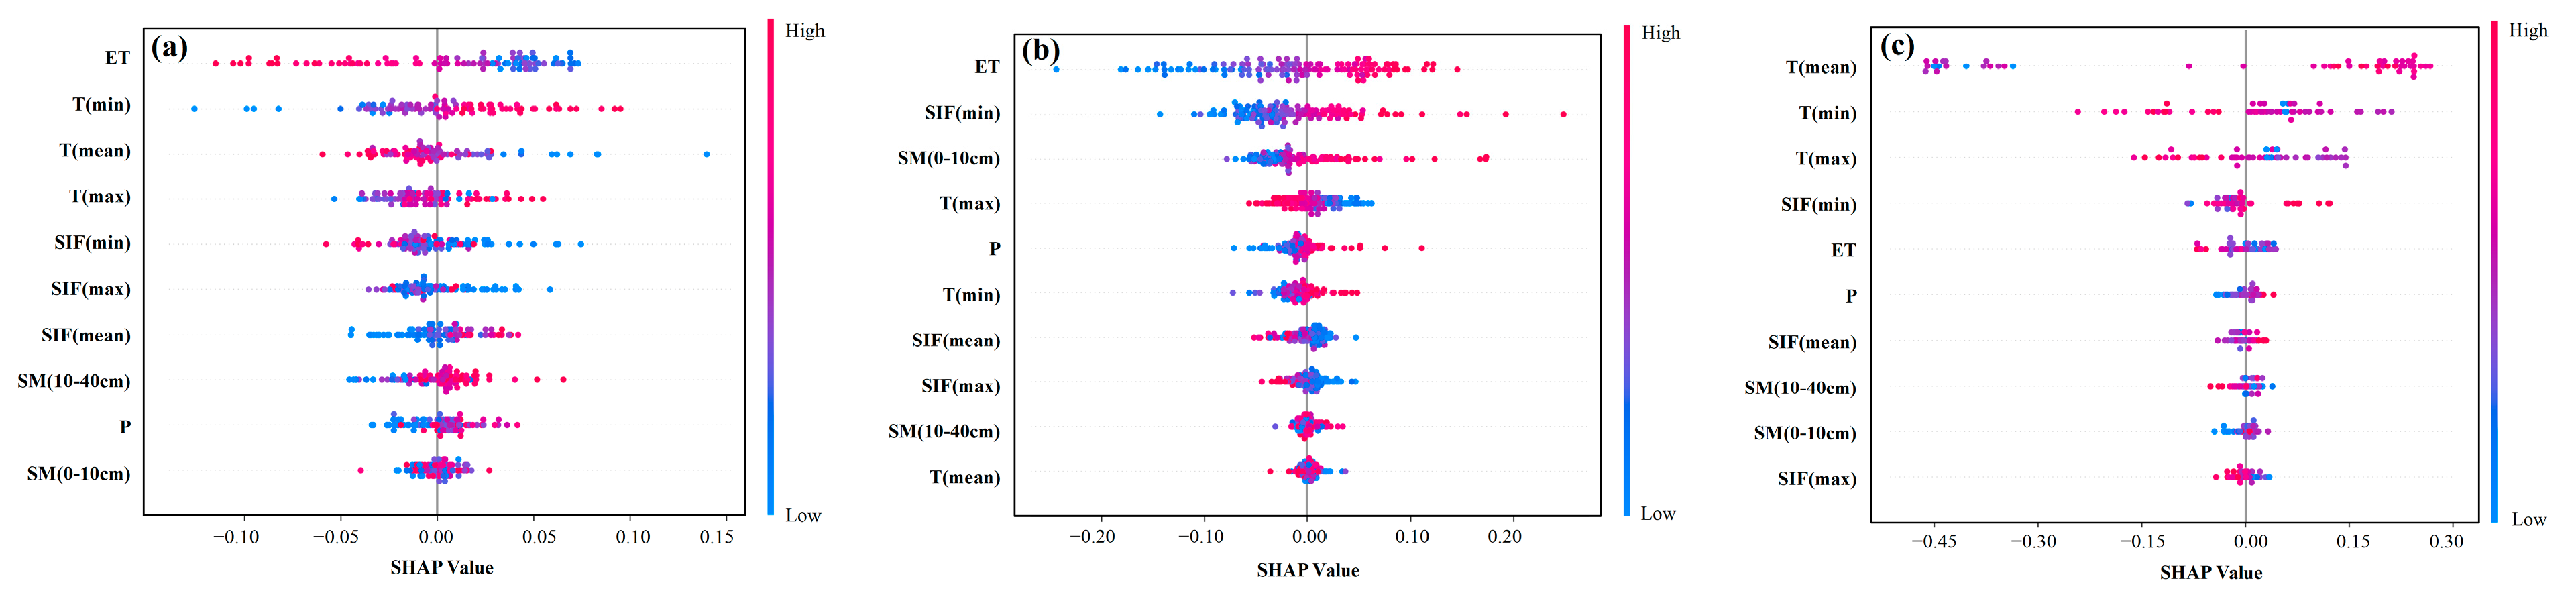
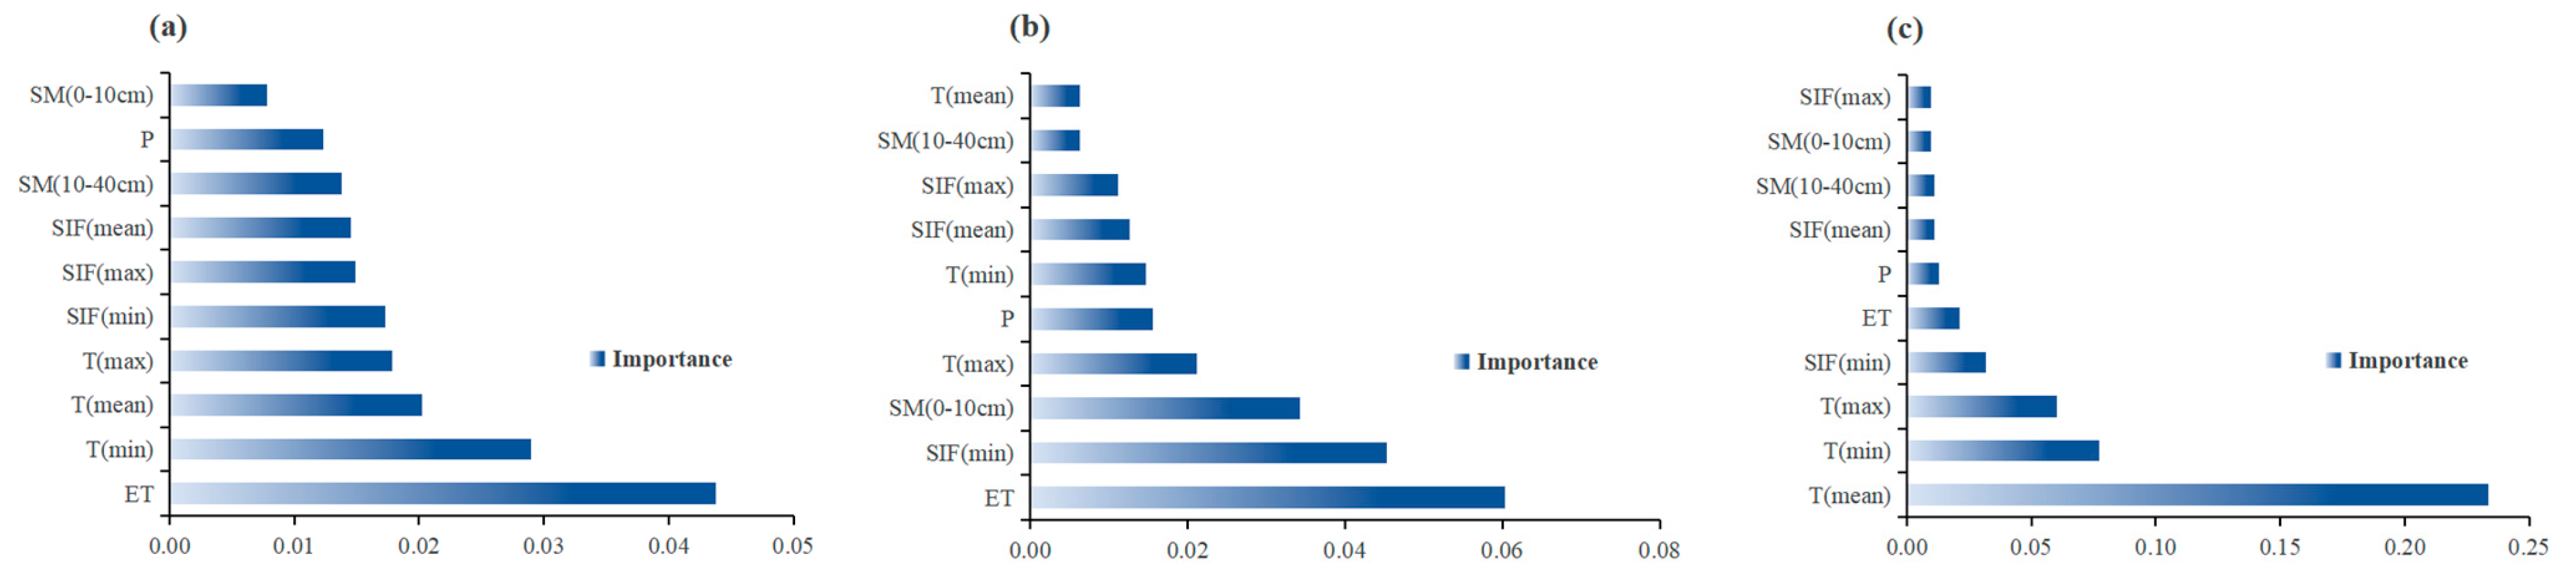
- The dominant drivers of maize drought exhibit a clear dynamic evolution across phenological stages: ET dominates at the seedling stage, ET and SIFmin co-dominate at the jointing–tasseling stage, and temperature (Tmean) becomes absolutely dominant at the maturity stage.
- The integrated application of CGAN and SHAP provides a feasible framework for deep learning modeling and interpretable attribution using small-sample remote sensing data, expanding the methodological options for quantitative agricultural drought research.
- Solar-induced chlorophyll fluorescence (SIF), particularly its minimum value, emerges as a superior indicator of crop physiological drought stress during the mid-to-late growth stages. This provides empirical evidence for integrating crop physiological signals into drought monitoring frameworks and has direct implications for formulating stage-specific drought management strategies.
Abstract
1. Introduction
2. Materials and Methods
2.1. Study Area Overview
2.2. Research Data
2.3. Research Methods
2.3.1. Data Normalization
2.3.2. Model Selection
- (1)
- Generator
- (2)
- Discriminator
2.3.3. Loss Function
- (1)
- Adversarial Loss
- (2)
- Regression Loss
- (3)
- L1 Loss
- (4)
- Combined Loss and Weight Settings
2.3.4. Evaluation Metrics
2.3.5. Dominant Factor Analysis
3. Results and Analysis
3.1. Model Training Process and Convergence Analysis
3.2. Model Performance Evaluation
3.3. Interpretability Analysis
3.4. Factor Importance and Dynamic Evolution Analysis
4. Discussion
4.1. Discussion of Research Findings
4.2. Discussion of Data Limitations
4.3. Future Research Perspectives
5. Conclusions
- (1)
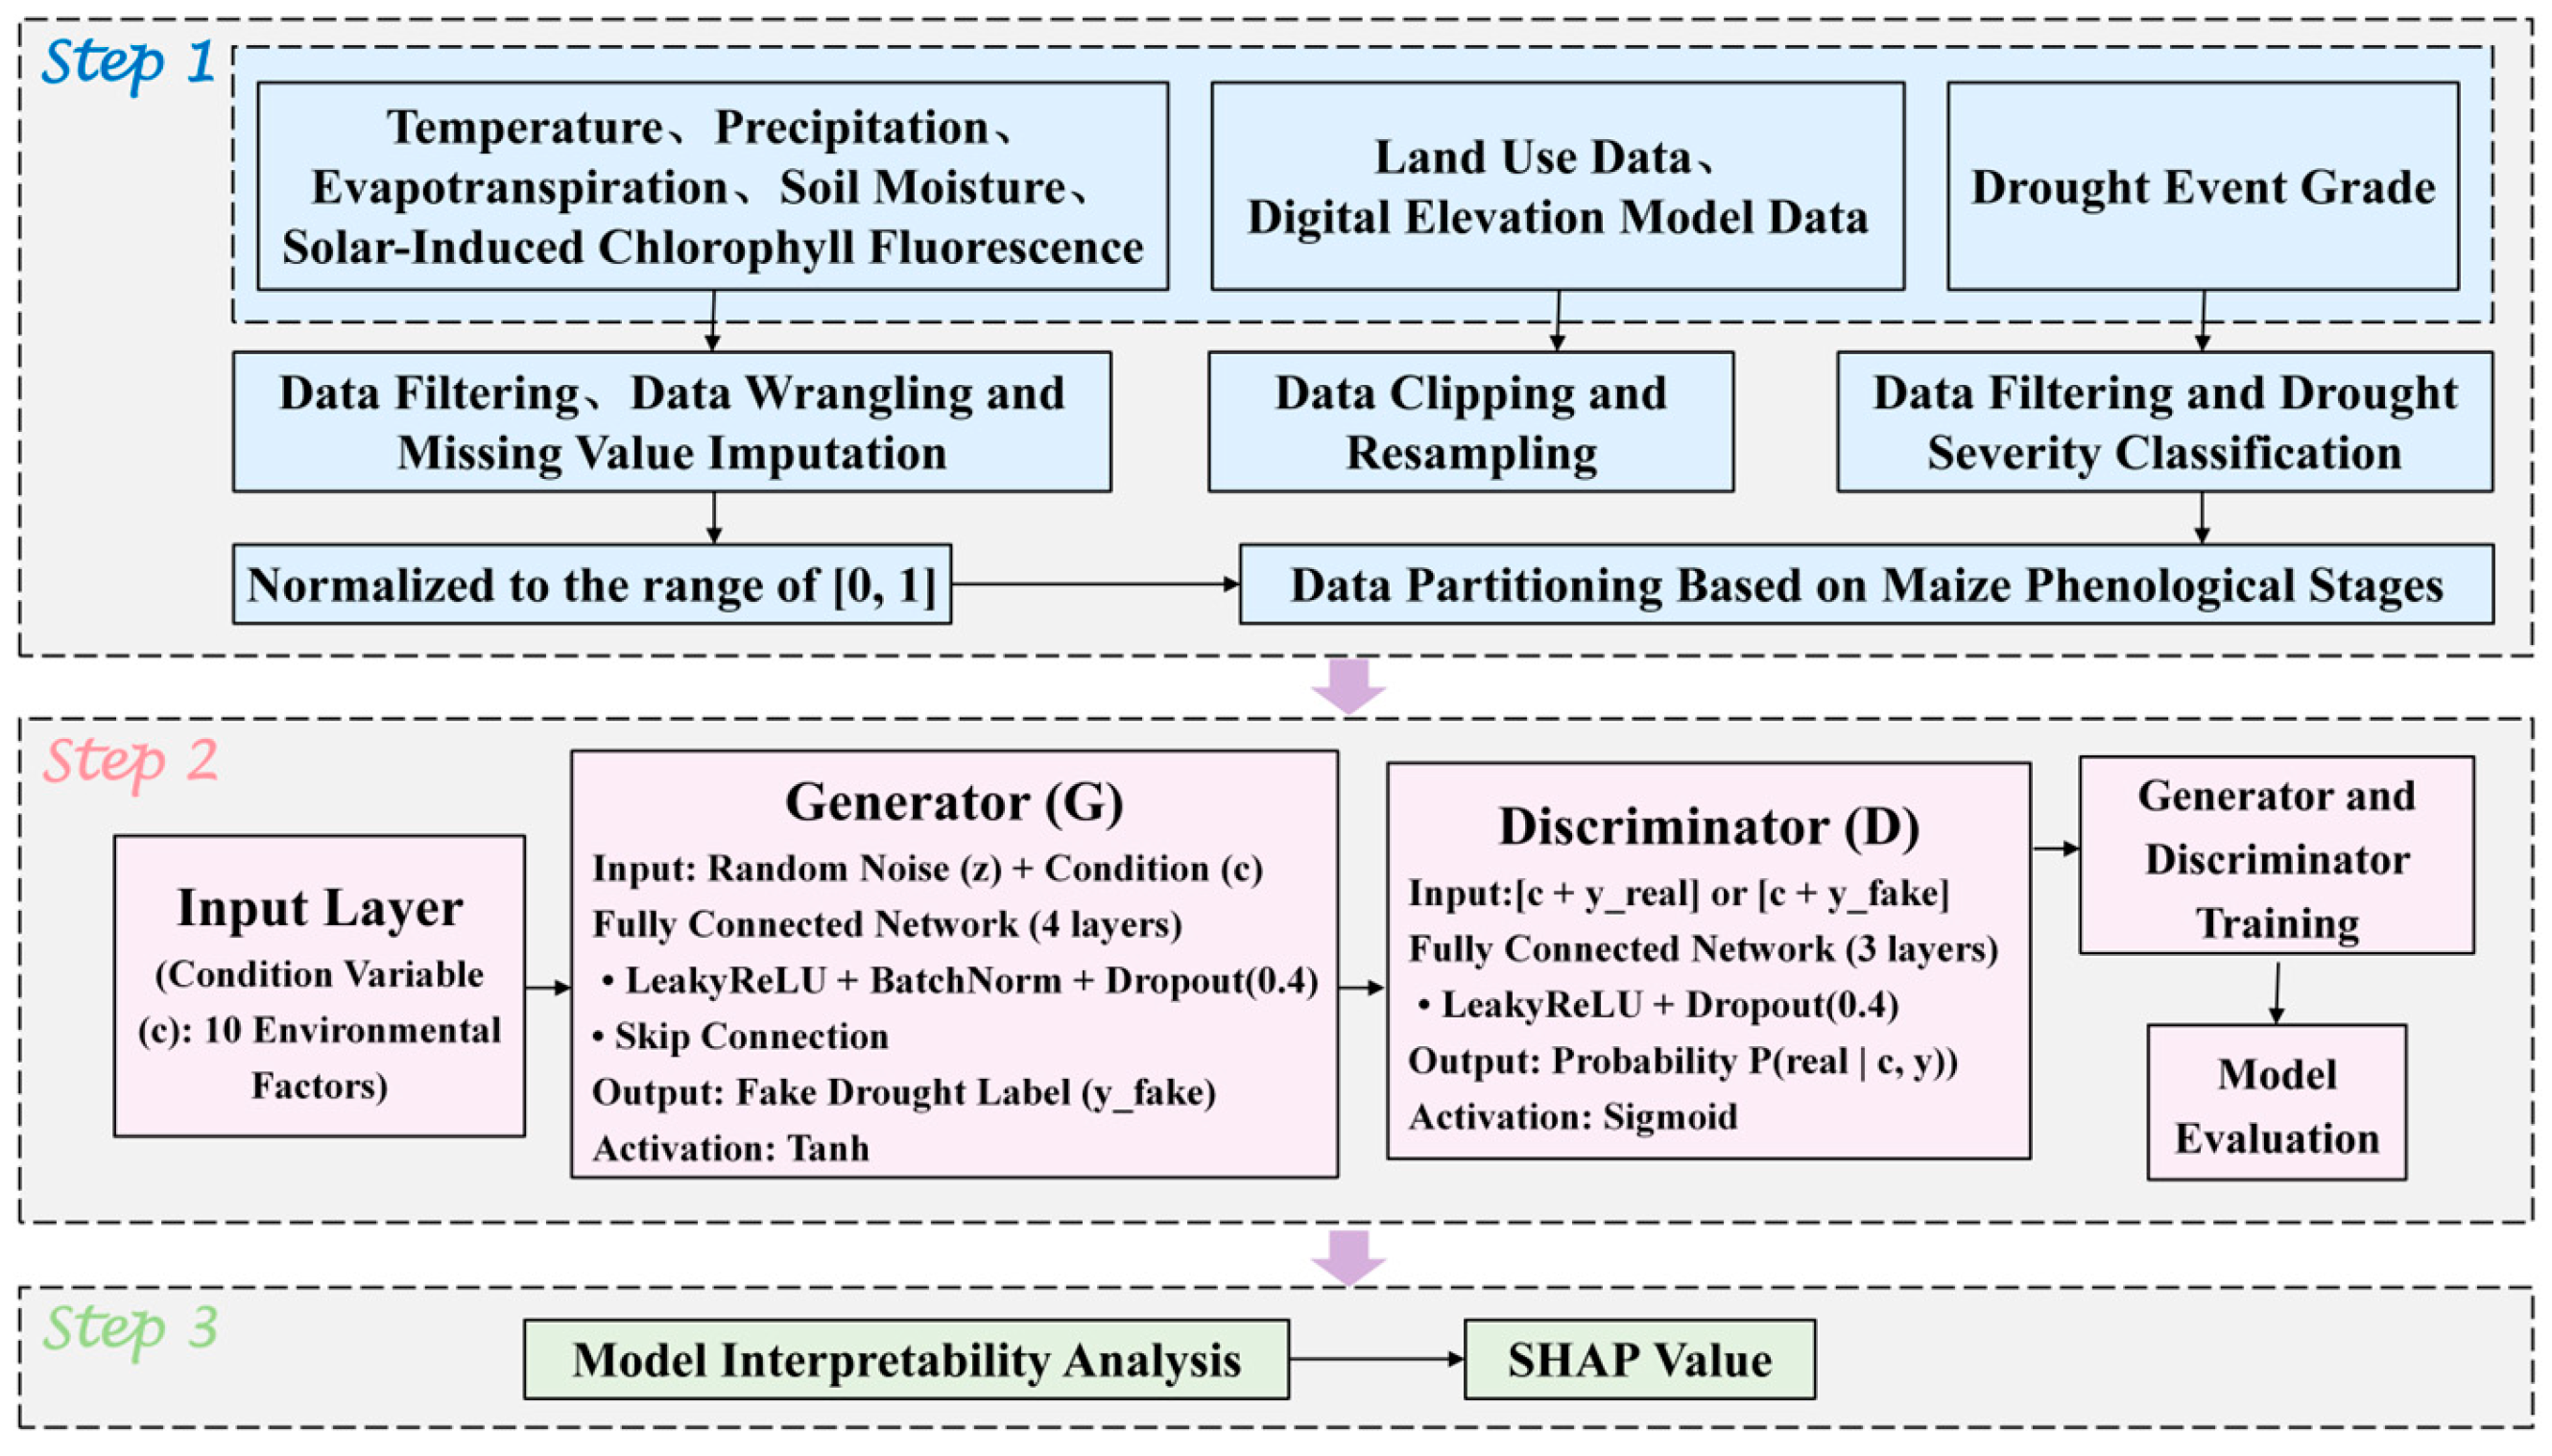
- Methodological contribution to small-sample deep learning modeling. This study demonstrates that the adversarial training mechanism of CGAN can effectively learn complex nonlinear relationships between environmental factors and drought levels from limited samples, providing a novel technical pathway for agricultural remote sensing modeling in data-scarce regions. Combined with SHAP interpretability analysis, the framework addresses the “black box” problem of deep learning, enabling a closed-loop process from prediction to attribution and offering a reproducible methodological framework for quantitative agricultural drought attribution research.
- (2)
- Phenology-dependent dynamic evolution of maize drought formation mechanisms. The study reveals a stage-dependent transition in maize drought formation mechanisms: the seedling stage is dominated by surface water–heat balance (ET), which characterizes meteorological drought; the jointing–tasseling stage transitions to a coupled water-physiology dominance (ET, SM(0–10 cm), SIFmin); and the maturity stage shifts to heat stress (Tmean) as the dominant factor. These findings, derived from a data-driven perspective, underscore the complexity of maize drought formation mechanisms and provide a theoretical basis for developing stage-specific drought management strategies.
- (3)
- Potential of SIF for monitoring crop physiological responses. The study found that the importance of minimum SIF surpassed that of most traditional environmental factors during the mid-to-late growth stages of maize. This result indicates that SIF can capture crop physiological response information not fully reflected by traditional environmental indicators, demonstrating unique advantages for identifying crop stress conditions. It provides a preliminary foundation and empirical evidence for the future development of drought monitoring indicator systems that integrate environmental factors with crop physiological response signals. Subsequent research should further validate the independent value of SIF in crop physiological drought monitoring by incorporating physiological indicators such as crop water deficit indices and direct photosynthesis observations.
Author Contributions
Funding
Data Availability Statement
Acknowledgments
Conflicts of Interest
References
- Hou, X.-X.; Liu, Y.; Zhang, X.; Ma, Q.; Shang, G. Spatiotemporal Dynamics and Drivers of Agricultural Drought in the Huang-Huai-Hai Plain Based on Crop Water Stress Index and Spatial Machine Learning. Remote Sens. 2025, 17, 3678. [Google Scholar] [CrossRef]
- Zhou, Y.; Li, J.; Jia, W.; Zhang, F.; Zhang, H.; Wang, S. The Evolution of Drought and Propagation Patterns from Meteorological Drought to Agricultural Drought in the Pearl River Basin. Water 2025, 17, 1116. [Google Scholar] [CrossRef]
- Peng, Y.; Peng, T.; Li, Y. Spatiotemporal Characteristics of Drought in Northwest China Based on SPEI Analysis. Atmosphere 2023, 14, 1188. [Google Scholar] [CrossRef]
- Zhou, G.; Yao, J.; Chen, J.; Chen, Y.; Wang, C.; Mo, Y.; Ma, C.; Yang, Y.; Li, M.; Zheng, P. Characteristics of Drought Events and Their Impact on Vegetation Dynamics in the Arid Region of Northwest China. Forests 2024, 15, 2187. [Google Scholar] [CrossRef]
- Cheng, M.; Wang, H.; Fan, J.; Zhang, F.; Wang, X. Effects of Soil Water Deficit at Different Growth Stages on Maize Growth, Yield, and Water Use Efficiency under Alternate Partial Root-Zone Irrigation. Water 2021, 13, 148. [Google Scholar] [CrossRef]
- Cakir, R. Effect of water stress at different development stages on vegetative and reproductive growth of corn. Field Crops Res. 2004, 89, 1–16. [Google Scholar] [CrossRef]
- Pongtip, A.; Thobunluepop, P.; Nakasathien, S.; Kongsil, P.; Sarobol, E.; Chitbanchong, W.; Pawelzik, E. Growth and Physiological Responses of Maize (Zea mays L.) under Drought Stress at Different Development Stages. J. Curr. Sci. Technol. 2023, 14, 15. [Google Scholar] [CrossRef]
- Singh, A.; Pandey, H.; Pandey, S.; Lal, D.; Chauhan, D.; Aparna; Antre, S.H.; Santhosh, B.; Kumar, A. Drought stress in maize: Stress perception to molecular response and strategies for its improvement. Funct. Integr. Genom. 2023, 23, 296. [Google Scholar] [CrossRef]
- Wang, X.; Li, X.; Gu, J.; Shi, W.; Zhao, H.; Sun, C.; You, S. Drought and Waterlogging Status and Dominant Meteorological Factors Affecting Maize (Zea mays L.) in Different Growth and Development Stages in Northeast China. Agronomy 2023, 13, 374. [Google Scholar] [CrossRef]
- Keya, S.S.; Islam, M.R.; Pham, H.; Rahman, M.A.; Bulle, M.; Patwary, A.; Kanika, M.M.-A.-R.; Hemel, F.H.; Ghosh, T.K.; Huda, N.; et al. Thirsty, soaked, and thriving: Maize morpho-physiological and biochemical responses to sequential drought, waterlogging, and re-drying. Plant Stress 2025, 15, 100722. [Google Scholar] [CrossRef]
- Huang, S.; Zhang, Q.; Dai, S. Identification of regional agricultural drought in the North China Plain and its attribution factors. Eur. J. Agron. 2026, 174, 127930. [Google Scholar] [CrossRef]
- Yang, M.; Li, X.; Xu, J.; Jing, H.; Zhang, X.; Sang, L. Evaluating Agricultural Drought in the Haihe River Basin Using an Improved Crop Moisture Index. Water 2025, 17, 3372. [Google Scholar] [CrossRef]
- Crane-Droesch, A. Machine learning methods for crop yield prediction and climate change impact assessment in agriculture. Environ. Res. Lett. 2018, 13, 114003. [Google Scholar] [CrossRef]
- van Klompenburg, T.; Kassahun, A.; Cata, C. Crop yield prediction using machine learning: A systematic literature review. Comput. Electron. Agric. 2020, 177, 105709. [Google Scholar] [CrossRef]
- Yuan, J.; Zhang, Y.; Zheng, Z.; Yao, W.; Wang, W.; Guo, L. Grain Crop Yield Prediction Using Machine Learning Based on UAV Remote Sensing: A Systematic Literature Review. Drones 2024, 8, 559. [Google Scholar] [CrossRef]
- Xu, Z.; Sun, H.; Zhang, T.; Xu, H.; Wu, D.; Gao, J. The high spatial resolution Drought Response Index (HiDRI): An integrated framework for monitoring vegetation drought with remote sensing, deep learning, and spatiotemporal fusion. Remote Sens. Environ. 2024, 312, 114324. [Google Scholar] [CrossRef]
- Wei, M.C.F.; Molin, J.P.; Longchamps, L. Predictive Power vs. Interpretability: Machine Learning Approaches to Unravel Sugarcane Yield Drivers. Comput. Electron. Agric. 2026, 243, 111353. [Google Scholar] [CrossRef]
- Mahdizadeh Gharakhanlou, N.; Perez, L. From Data to Harvest: Leveraging Ensemble Machine Learning for Enhanced Crop Yield Predictions across Canada amidst Climate Change. Sci. Total Environ. 2024, 951, 175764. [Google Scholar] [CrossRef]
- Huang, L.; Liu, Y.; Huang, W.; Dong, Y.; Ma, H.; Wu, K.; Guo, A. Combining Random Forest and XGBoost Methods in Detecting Early and Mid-Term Winter Wheat Stripe Rust Using Canopy Level Hyperspectral Measurements. Agriculture 2022, 12, 74. [Google Scholar] [CrossRef]
- Li, X.; Li, Y.; Yan, B.; Gao, Y.; Su, S.; Zhou, H.; Kang, L.; Liu, H.; Li, Y. Oilseed Flax Yield Prediction in Arid Gansu, China Using a CNN–Informer Model and Multi-Source Spatio-Temporal Data. Remote Sens. 2026, 18, 181. [Google Scholar] [CrossRef]
- Kuang, X.; Wang, D.; Mao, B.; Li, Y.; Chen, D.; Fu, W.; Cheng, Q.; Duan, F.; Li, H.; Hou, X.; et al. A CNN-LSTM-XGBoost Hybrid Framework for Interpretable Nitrogen Stress Classification Using Multimodal UAV Imagery. Remote Sens. 2026, 18, 538. [Google Scholar] [CrossRef]
- Fu, X.; Wu, D.; Xu, S. RSSRGAN: A Residual Separable Generative Adversarial Network for Remote Sensing Image Super-Resolution Reconstruction. Remote Sens. 2026, 18, 44. [Google Scholar] [CrossRef]
- Lu, Y.; Li, Z.; Qi, D.; Zhou, L. Research on turbulence-removal optical imaging based on multi-scale GAN and sequential images. Sci. Rep. 2025, 15, 43748. [Google Scholar] [CrossRef] [PubMed]
- Ji, H.K.; Mirzaei, M.; Lai, S.H.; Dehghani, A.; Dehghani, A. Implementing generative adversarial network (GAN) as a data-driven multi-site stochastic weather generator for flood frequency estimation. Environ. Model. Softw. 2024, 172, 105896. [Google Scholar] [CrossRef]
- Rehman, H.U.; Zhou, G.; Antezana Lopez, F.P.; Jiang, H. Harmonization of Gaofen-1/WFV Imagery with the HLS Dataset Using Conditional Generative Adversarial Networks. Remote Sens. 2025, 17, 2995. [Google Scholar] [CrossRef]
- Wang, F.; Liu, Y.; Zhou, Y.; Sun, R.; Duan, J.; Li, Y.; Ding, Q.; Wang, H. Retrieving Vertical Cloud Radar Reflectivity from MODIS Cloud Products with CGAN: An Evaluation for Different Cloud Types and Latitudes. Remote Sens. 2023, 15, 816. [Google Scholar] [CrossRef]
- Kim, K.; Kim, J.-H.; Moon, Y.-J.; Park, E.; Shin, G.; Kim, T.; Kim, Y.; Hong, S. Nighttime Reflectance Generation in the Visible Band of Satellites. Remote Sens. 2019, 11, 2087. [Google Scholar] [CrossRef]
- Samek, W.; Montavon, G.; Lapuschkin, S.; Anders, C.J.; Müller, K.R. Explaining deep neural networks and beyond: A review of methods and applications. Proc. IEEE 2021, 109, 247–278. [Google Scholar] [CrossRef]
- Ansari, A.; Quaff, A.R. Comparative benchmarking of eleven machine learning regressors for daily air quality index (AQI) forecasting: Sensitivity analysis and SHapley Additive exPlanations (SHAP)-Based interpretability framework. Theor. Appl. Clim. 2025, 156, 620. [Google Scholar] [CrossRef]
- Birinci, E.; Ekmekcioğlu, Ö.; Ozdemir, H.; Deniz, A. Interpretable machine learning framework for air quality prediction in Istanbul using Shapley additive explanations (SHAP). Stoch. Environ. Res. Risk Assess. 2026, 40, 37. [Google Scholar] [CrossRef]
- Zhou, B.; Chen, G.; Yu, H.; Zhao, J.; Yin, Y. Revealing the Nonlinear Impact of Human Activities and Climate Change on Ecosystem Services in the Karst Region of Southeastern Yunnan Using the XGBoost–SHAP Model. Forests 2024, 15, 1420. [Google Scholar] [CrossRef]
- Ma, C.; Zhang, C.; Chen, H.; Ma, M.; Wang, S. Spatiotemporal dynamics and drivers of ecological quality in Shaanxi (Yellow River Basin, China) based on optimized RSEI and SHAP. Front. Environ. Sci. 2026, 14, 1721306. [Google Scholar] [CrossRef]
- Eshaghi, A.; Kamkar, B. A remote sensing-based framework for agricultural drought risk monitoring and assessment: Introducing SADFI for disaster risk assessment in Northeastern Iran. Theor. Appl. Clim. 2025, 156, 684. [Google Scholar] [CrossRef]
- Karimi, M.; Shahedi, K.; Raziei, T.; Miryaghoubzadeh, M. Meteorological and agricultural drought monitoring in Southwest of Iran using a remote sensing-based combined drought index. Stoch. Environ. Res. Risk Assess. 2022, 36, 3707–3724. [Google Scholar] [CrossRef]
- Hinge, G.; Piplodiya, J.; Sharma, A.; Hamouda, M.A.; Mohamed, M.M. Evaluation of Hybrid Wavelet Models for Regional Drought Forecasting. Remote Sens. 2022, 14, 6381. [Google Scholar] [CrossRef]
- Yao, T.; Liu, S.; Hu, S.; Mo, X. Response of vegetation ecosystems to flash drought with solar-induced chlorophyll fluorescence over the Hai River Basin, China during 2001–2019. J. Environ. Manag. 2022, 313, 114947. [Google Scholar] [CrossRef]
- Zhou, L.; Lin, J.; Du, R.; Yang, R.; Bao, J.; Yuan, H.; Gao, S.; Chen, P.; Feng, X.; Mao, T.; et al. Evaluating the predictability of SIF at multiple temporal scales for winter wheat yield in Huang-Huai-Hai plain. Ecol. Indic. 2025, 181, 114460. [Google Scholar] [CrossRef]
- Yu, W.; Ji, R.; Cai, F.; Feng, R.; Wu, J.; Zhao, X. Drought Sensitivity of Solar-Induced Chlorophyll Fluorescence in Maize (Zea mays L.). J. Appl. Meteorol. Clim. 2025, 64, 1785–1802. [Google Scholar] [CrossRef]
- Wang, J.; Liu, Z.; Jiang, H.; Yang, P.; Xu, S.; Guo, T.; Zhang, R.; Han, D.; Zhao, H. Integrating Diurnal Physiological and Structural Variations in SIF for Enhanced Daily Drought Detection in Maize. Remote Sens. 2025, 17, 565. [Google Scholar] [CrossRef]
- Xu, S.; Liu, Z.; Han, S.; Chen, Z.; He, X.; Zhao, H.; Ren, S. Exploring the Sensitivity of Solar-Induced Chlorophyll Fluorescence at Different Wavelengths in Response to Drought. Remote Sens. 2023, 15, 1077. [Google Scholar] [CrossRef]
- Li, J.; Gu, L.; Chen, J.; Zhang, Y. The relationship between spectral and integrated sun-induced chlorophyll fluorescence and its implication for photosynthesis estimation using fluorescence observations. Remote Sens. Environ. 2026, 333, 115113. [Google Scholar] [CrossRef]
- Wu, R.; Shen, X.; Shang, B.; Zhao, J.; Agathokleous, E.; Feng, Z. Complexity and interactions of climatic variables affecting winter wheat photosynthesis in the North China Plain. Eur. J. Agron. 2025, 166, 127568. [Google Scholar] [CrossRef]
- Peng, S.; Ding, Y.; Wen, Z.; Chen, Y.; Cao, Y.; Ren, J. Spatiotemporal change and trend analysis of potential evapotranspiration over the Loess Plateau of China during 2011–2100. Agric. For. Meteorol. 2017, 233, 183–194. [Google Scholar] [CrossRef]
- Ding, Y.; Peng, S. Spatiotemporal trends and attribution of drought across China from 1901–2100. Sustainability 2020, 12, 477. [Google Scholar] [CrossRef]
- Peng, S.; Ding, Y.; Liu, W.; Li, Z. 1 km monthly temperature and precipitation dataset for China from 1901 to 2017. Earth Syst. Sci. Data 2019, 11, 1931–1946. [Google Scholar] [CrossRef]
- Peng, S.; Gang, C.; Cao, Y.; Chen, Y. Assessment of climate change trends over the loess plateau in China from 1901 to 2100. Int. J. Clim. 2018, 38, 2250–2264. [Google Scholar] [CrossRef]
- Li, X.; Xiao, J. A Global, 0.05-Degree Product of Solar-Induced Chlorophyll Fluorescence Derived from OCO-2, MODIS, and Reanalysis Data. Remote Sens. 2019, 11, 517. [Google Scholar] [CrossRef]
- GB/T 20481-2017; Meteorological Drought Grade. General Administration of Quality Supervision, Inspection and Quarantine of the People’s Republic of China and Standardization Administration of China: Beijing, China, 2017.
- Rodríguez-Suárez, B.; Quesada-Barriuso, P.; Argüello, F. Design of CGAN Models for Multispectral Reconstruction in Remote Sensing. Remote Sens. 2022, 14, 816. [Google Scholar] [CrossRef]
- Su, X.; Zheng, C.; Qiang, W.; Wu, F.; Zhao, J.; Sun, F.; Xiong, H. Manifold constraint regularization for remote sensing image generation. IEEE Trans. Geosci. Remote Sens. 2024, 62, 1–20. [Google Scholar] [CrossRef]
- Manco, I.; Riviera, W.; Zanetti, A.; Briscolini, M.; Mercogliano, P.; Navarra, A. A new conditional generative adversarial neural network approach for statistical downscaling of the ERA5 reanalysis over the Italian Peninsula. Environ. Model. Softw. 2025, 188, 106427. [Google Scholar] [CrossRef]
- Howe, J.; Pula, K.; Reite, A.A. Conditional Generative Adversarial Networks for Data Augmentation and Adaptation in Remotely Sensed Imagery. In Proceedings of SPIE 11139, Applications of Machine Learning; SPIE: Bellingham, WA, USA, 2019; Volume 111390. [Google Scholar]
- Sui, B.; Jiang, T.; Zhang, Z.; Pan, X. ECGAN: An Improved Conditional Generative Adversarial Network with Edge Detection to Augment Limited Training Data for the Classification of Remote Sensing Images with High Spatial Resolution. IEEE J. Sel. Top. Appl. Earth Obs. Remote Sens. 2021, 14, 1311–1325. [Google Scholar] [CrossRef]
- Yuan, X.; Tian, J.; Reinartz, P. Learning-Based Near-Infrared Band Simulation with Applications on Large-Scale Landcover Classification. Sensors 2023, 23, 4179. [Google Scholar] [CrossRef] [PubMed]
- Xiao, B.; Ni, H.; Yang, W. MCGAN: Enhancing GAN Training with Regression-Based Generator Loss. Proc. AAAI Conf. Artif. Intell. 2025, 39, 21644–21652. [Google Scholar] [CrossRef]
- Abu-Srhan, A.; Abushariah, M.A.M.; Al-Kadi, O.S. The Effect of Loss Function on Conditional Generative Adversarial Networks. J. King Saud Univ.-Comput. Inf. Sci. 2022, 34, 6977–6988. [Google Scholar] [CrossRef]
- Fong, T.; Huang, Y.; Chin, R.; Koo, C. Integrating remote sensing and meteorological data for AI-based land surface temperature prediction with feature selection approaches. Environ. Sci. Eur. 2025, 37, 214. [Google Scholar] [CrossRef]
- Elbeltagi, A.; Srivastava, A.; Cao, X.; Gautam, V.; Zerouali, B.; Aslam, M.; Salem, A.; Emami, H.; Elsadek, E. Bayesian-optimized machine learning boosts actual evapotranspiration prediction in water-stressed agricultural regions of China. Sci. Rep. 2025, 15, 37548. [Google Scholar] [CrossRef]
- Zhou, Y.; Yan, H.; Zhang, J.; Wang, G.; Zhang, C.; Zheng, H.; Wu, J.; Tian, D.; Yu, Z.; Wang, B.; et al. Energy partitioning mechanism and evapotranspiration modeling of maize fields in three different climate regions in China. J. Hydrol. 2025, 662, 133888. [Google Scholar] [CrossRef]
- Leggesse, E.S.; Zimale, F.A.; Sultan, D.; Enku, T.; Srinivasan, R.; Tilahun, S.A. Predicting Optical Water Quality Indicators from Remote Sensing Using Machine Learning Algorithms in Tropical Highlands of Ethiopia. Hydrology 2023, 10, 110. [Google Scholar] [CrossRef]
- Xiao, W.; Fan, W.; Wei, Y.; Kelleher, L.; Yuan, W.; Zheng, S.; Shi, Z. Dynamics of ecosystem health in the Guanzhong-Tianshui Economic Zone: A Catboost and SHAP-based analysis from 1990 to 2020. Ecol. Indic. 2025, 181, 114431. [Google Scholar] [CrossRef]
- Tahooni, A.; Kakroodi, A.; Kiavarz, M.; Mansourian, H. High-resolution urban LST downscaling via machine learning and SHAP: A case study in a rapidly urbanizing semi-arid region. Sustain. Cities Soc. 2025, 134, 106897. [Google Scholar] [CrossRef]





| Grade | Drought Status | Standardized Precipitation Index (SPI) |
|---|---|---|
| I | No Drought | −0.5 < SPI |
| II | Mild Drought | −1.0 < SPI ≤ −0.5 |
| III | Moderate Drought | −1.5 < SPI ≤ −1.0 |
| IV | Severe Drought | −2.0 < SPI ≤ −1.5 |
| V | Extreme Drought | SPI ≤ −2.0 |
| Phenological Stage | R2 | RMSE | Bias |
|---|---|---|---|
| Seedling Stage | 0.9634 | 0.0585 | −0.018 |
| Jointing–Tasseling Stage | 0.972 | 0.0522 | 0.0195 |
| Maturity Stage | 0.979 | 0.051 | −0.0042 |
| Phenological Stage | R2 (Mean ± SD) | RMSE (Mean ± SD) | Bias (Mean ± SD) |
|---|---|---|---|
| Seedling Stage | 0.9714 ± 0.0026 | 0.0752 ± 0.0022 | 0.0002 ± 0.0019 |
| Jointing–Tasseling Stage | 0.9722 ± 0.0017 | 0.0740 ± 0.0016 | 0.0002 ± 0.0013 |
| Maturity Stage | 0.9790 ± 0.0014 | 0.0670 ± 0.0016 | 0.0000 ± 0.0008 |
| Rank | Seedling Stage | Jointing–Tasseling Stage | Maturity Stage |
|---|---|---|---|
| 1 | ET | ET | T(mean) |
| 2 | T(min) | SIF(min) | T(min) |
| 3 | T(mean) | SM(0–10cm) | T(max) |
| 4 | T(max) | T(max) | SIF(min) |
| 5 | SIF(min) | P | ET |
| 6 | SIF(max) | T(min) | P |
| 7 | SIF(mean) | SIF(mean) | SIF(mean) |
| 8 | SM(10–40cm) | SIF(max) | SM(10–40cm) |
| 9 | P | SM(10–40cm) | SM(0–10cm) |
| 10 | SM(0–10cm) | T(mean) | SIF(max) |
Disclaimer/Publisher’s Note: The statements, opinions and data contained in all publications are solely those of the individual author(s) and contributor(s) and not of MDPI and/or the editor(s). MDPI and/or the editor(s) disclaim responsibility for any injury to people or property resulting from any ideas, methods, instructions or products referred to in the content. |
© 2026 by the authors. Licensee MDPI, Basel, Switzerland. This article is an open access article distributed under the terms and conditions of the Creative Commons Attribution (CC BY) license.
Share and Cite
Zhao, H.; Guo, J.; Jiang, J.; Zhao, F.; Yang, X. Utilizing Multi-Source Remote Sensing Data and the CGAN to Identify Key Drought Factors Influencing Maize Across Distinct Phenological Stages. Remote Sens. 2026, 18, 1085. https://doi.org/10.3390/rs18071085
Zhao H, Guo J, Jiang J, Zhao F, Yang X. Utilizing Multi-Source Remote Sensing Data and the CGAN to Identify Key Drought Factors Influencing Maize Across Distinct Phenological Stages. Remote Sensing. 2026; 18(7):1085. https://doi.org/10.3390/rs18071085
Chicago/Turabian StyleZhao, Hui, Jifu Guo, Jing Jiang, Funian Zhao, and Xiaoyang Yang. 2026. "Utilizing Multi-Source Remote Sensing Data and the CGAN to Identify Key Drought Factors Influencing Maize Across Distinct Phenological Stages" Remote Sensing 18, no. 7: 1085. https://doi.org/10.3390/rs18071085
APA StyleZhao, H., Guo, J., Jiang, J., Zhao, F., & Yang, X. (2026). Utilizing Multi-Source Remote Sensing Data and the CGAN to Identify Key Drought Factors Influencing Maize Across Distinct Phenological Stages. Remote Sensing, 18(7), 1085. https://doi.org/10.3390/rs18071085