1. Introduction
Land cover (LC) dynamics represent one of the most critical indicators of global environmental change because they directly influence biodiversity patterns, ecosystem structure, climate regulation, and the capacity of landscapes to deliver essential ecosystem services such as carbon storage, hydrological regulation, and soil conservation [
1,
2,
3,
4]. These dynamics arise from complex interactions between anthropogenic drivers, including agricultural expansion, fuelwood harvesting, overgrazing, and settlement growth, and natural processes such as climate variability and soil degradation [
5,
6,
7,
8]. Alterations in land cover can significantly modify microclimates, disrupt hydrological cycles, reduce soil fertility, and weaken ecosystem resilience, thereby triggering cascading impacts on ecological integrity and human livelihoods [
2,
9,
10,
11,
12]. Consequently, understanding land cover trajectories is fundamental for sustainable land management, environmental policy development, and ecosystem conservation, particularly in environmentally vulnerable regions [
13,
14,
15].
Across sub-Saharan Africa, especially in semi-arid and dryland ecosystems, land cover change is occurring at an accelerated rate due to recurrent droughts, nutrient-poor soils, rapid population growth, and persistent socio-economic pressures [
6,
7,
16,
17]. These drivers intensify woodland degradation, promote cropland expansion, increase fuelwood extraction, and lead to widespread conversion of natural vegetation. Such processes frequently result in vegetation loss, landscape fragmentation, and declining ecosystem service provision [
4,
5,
16,
18]. The resulting transformations undermine food security, reduce soil productivity, and weaken climate resilience, thereby increasing the vulnerability of rural communities that depend heavily on natural resources [
3,
7,
8,
10]. Despite their importance, systematic and long-term monitoring of land cover dynamics remains limited in many African drylands due to data scarcity, technical constraints, and limited institutional capacity [
14,
19,
20,
21].
In Sudan, savanna woodlands and protected areas constitute critical socio-ecological systems that support local livelihoods through the provision of fuelwood, fodder, and non-timber forest products, while also delivering key regulating services such as soil stabilization and water retention [
1,
8,
22,
23,
24,
25,
26]. However, these woodland ecosystems have experienced substantial degradation over recent decades due to increasing anthropogenic pressure, including mechanized agriculture, overgrazing, unregulated wood extraction, and expanding settlements [
16,
27,
28,
29,
30,
31]. These pressures have led to a progressive decline in dense woodland cover and an expansion of degraded woodland, shrub-dominated areas, and bare land. Such changes threaten biodiversity, reduce carbon stocks, accelerate soil degradation, and increase vulnerability to climate extremes [
4,
18,
25,
32,
33,
34]. Despite these growing concerns, spatially explicit and long-term assessments of land cover dynamics remain scarce in Sudan’s semi-arid savanna woodlands, particularly studies that integrate both retrospective analysis and future predictive modeling [
8,
14,
19,
20].
Recent advances in satellite-based Earth observation and machine learning techniques provide new opportunities to overcome long-standing monitoring limitations in data-scarce regions [
14,
35,
36,
37,
38,
39]. Cloud-based geospatial platforms facilitate the efficient processing of large multi-temporal datasets and enable reproducible analyses of long-term land cover dynamics [
14,
35,
40,
41]. Among machine learning approaches, the Random Forest (RF) classifier has demonstrated strong performance due to its robustness to noisy data, ability to capture complex non-linear relationships, and high classification accuracy with relatively low parameterization requirements [
42,
43,
44,
45]. Previous studies have shown that RF consistently produces reliable land cover classifications across heterogeneous dryland environments [
14,
43,
45,
46,
47].
Beyond historical mapping, modeling future land cover trajectories is essential for anticipating ecological risks and supporting sustainable land-use planning [
48,
49,
50]. The Cellular Automata–Artificial Neural Network (CA–ANN) framework is particularly effective for simulating spatial dynamics of land cover change, as it integrates historical transition patterns with neural network–derived transition rules to capture both spatial dependence and non-linear processes [
51,
52,
53,
54,
55,
56,
57,
58,
59]. When applied to accurately classified land cover datasets, CA–ANN enables the generation of spatially explicit projections that can reveal potential pathways of woodland degradation, persistence, or recovery under evolving environmental and socio-economic conditions [
14,
38,
39,
47,
60].
Previous land cover studies in Sudan have largely relied on conventional classification approaches, such as maximum likelihood applied to Landsat or ASTER imagery, to document historical changes [
5,
16,
18,
27,
61,
62,
63,
64,
65,
66]. While these studies provide valuable insights into vegetation decline and land degradation, they are often limited to retrospective analyses and do not incorporate predictive modeling or advanced machine learning techniques. Furthermore, integrated frameworks that combine multi-temporal classification with spatially explicit simulation remain scarce, particularly in savanna woodland ecosystems where ecological pressures are intensifying [
8,
14,
19,
20].
The Elnour Natural Forest Reserve (ENFR) in Blue Nile State represents a critical example of a semi-arid savanna woodland system undergoing rapid transformation due to illegal logging, intensive grazing, and localized agricultural expansion [
8,
16,
18,
65,
66]. Understanding the spatio-temporal dynamics of land cover change in this region, as well as its potential future trajectories, is essential for informing sustainable management and conservation strategies.
Therefore, this study aims to (i) quantify multi-temporal land cover dynamics in the ENFR savanna woodlands using a Random Forest classifier, and (ii) simulate future land cover changes using a CA–ANN modeling framework. By integrating long-term satellite observations with spatially explicit predictive modeling, this research provides a comprehensive assessment of landscape transformation in a data-limited dryland environment. The study contributes to advancing understanding of woodland degradation processes, improving predictive capacity for land cover change, and supporting evidence-based decision making for sustainable woodland management and restoration planning in Sudan and similar semi-arid regions.
2. Materials and Methods
2.1. Study Area
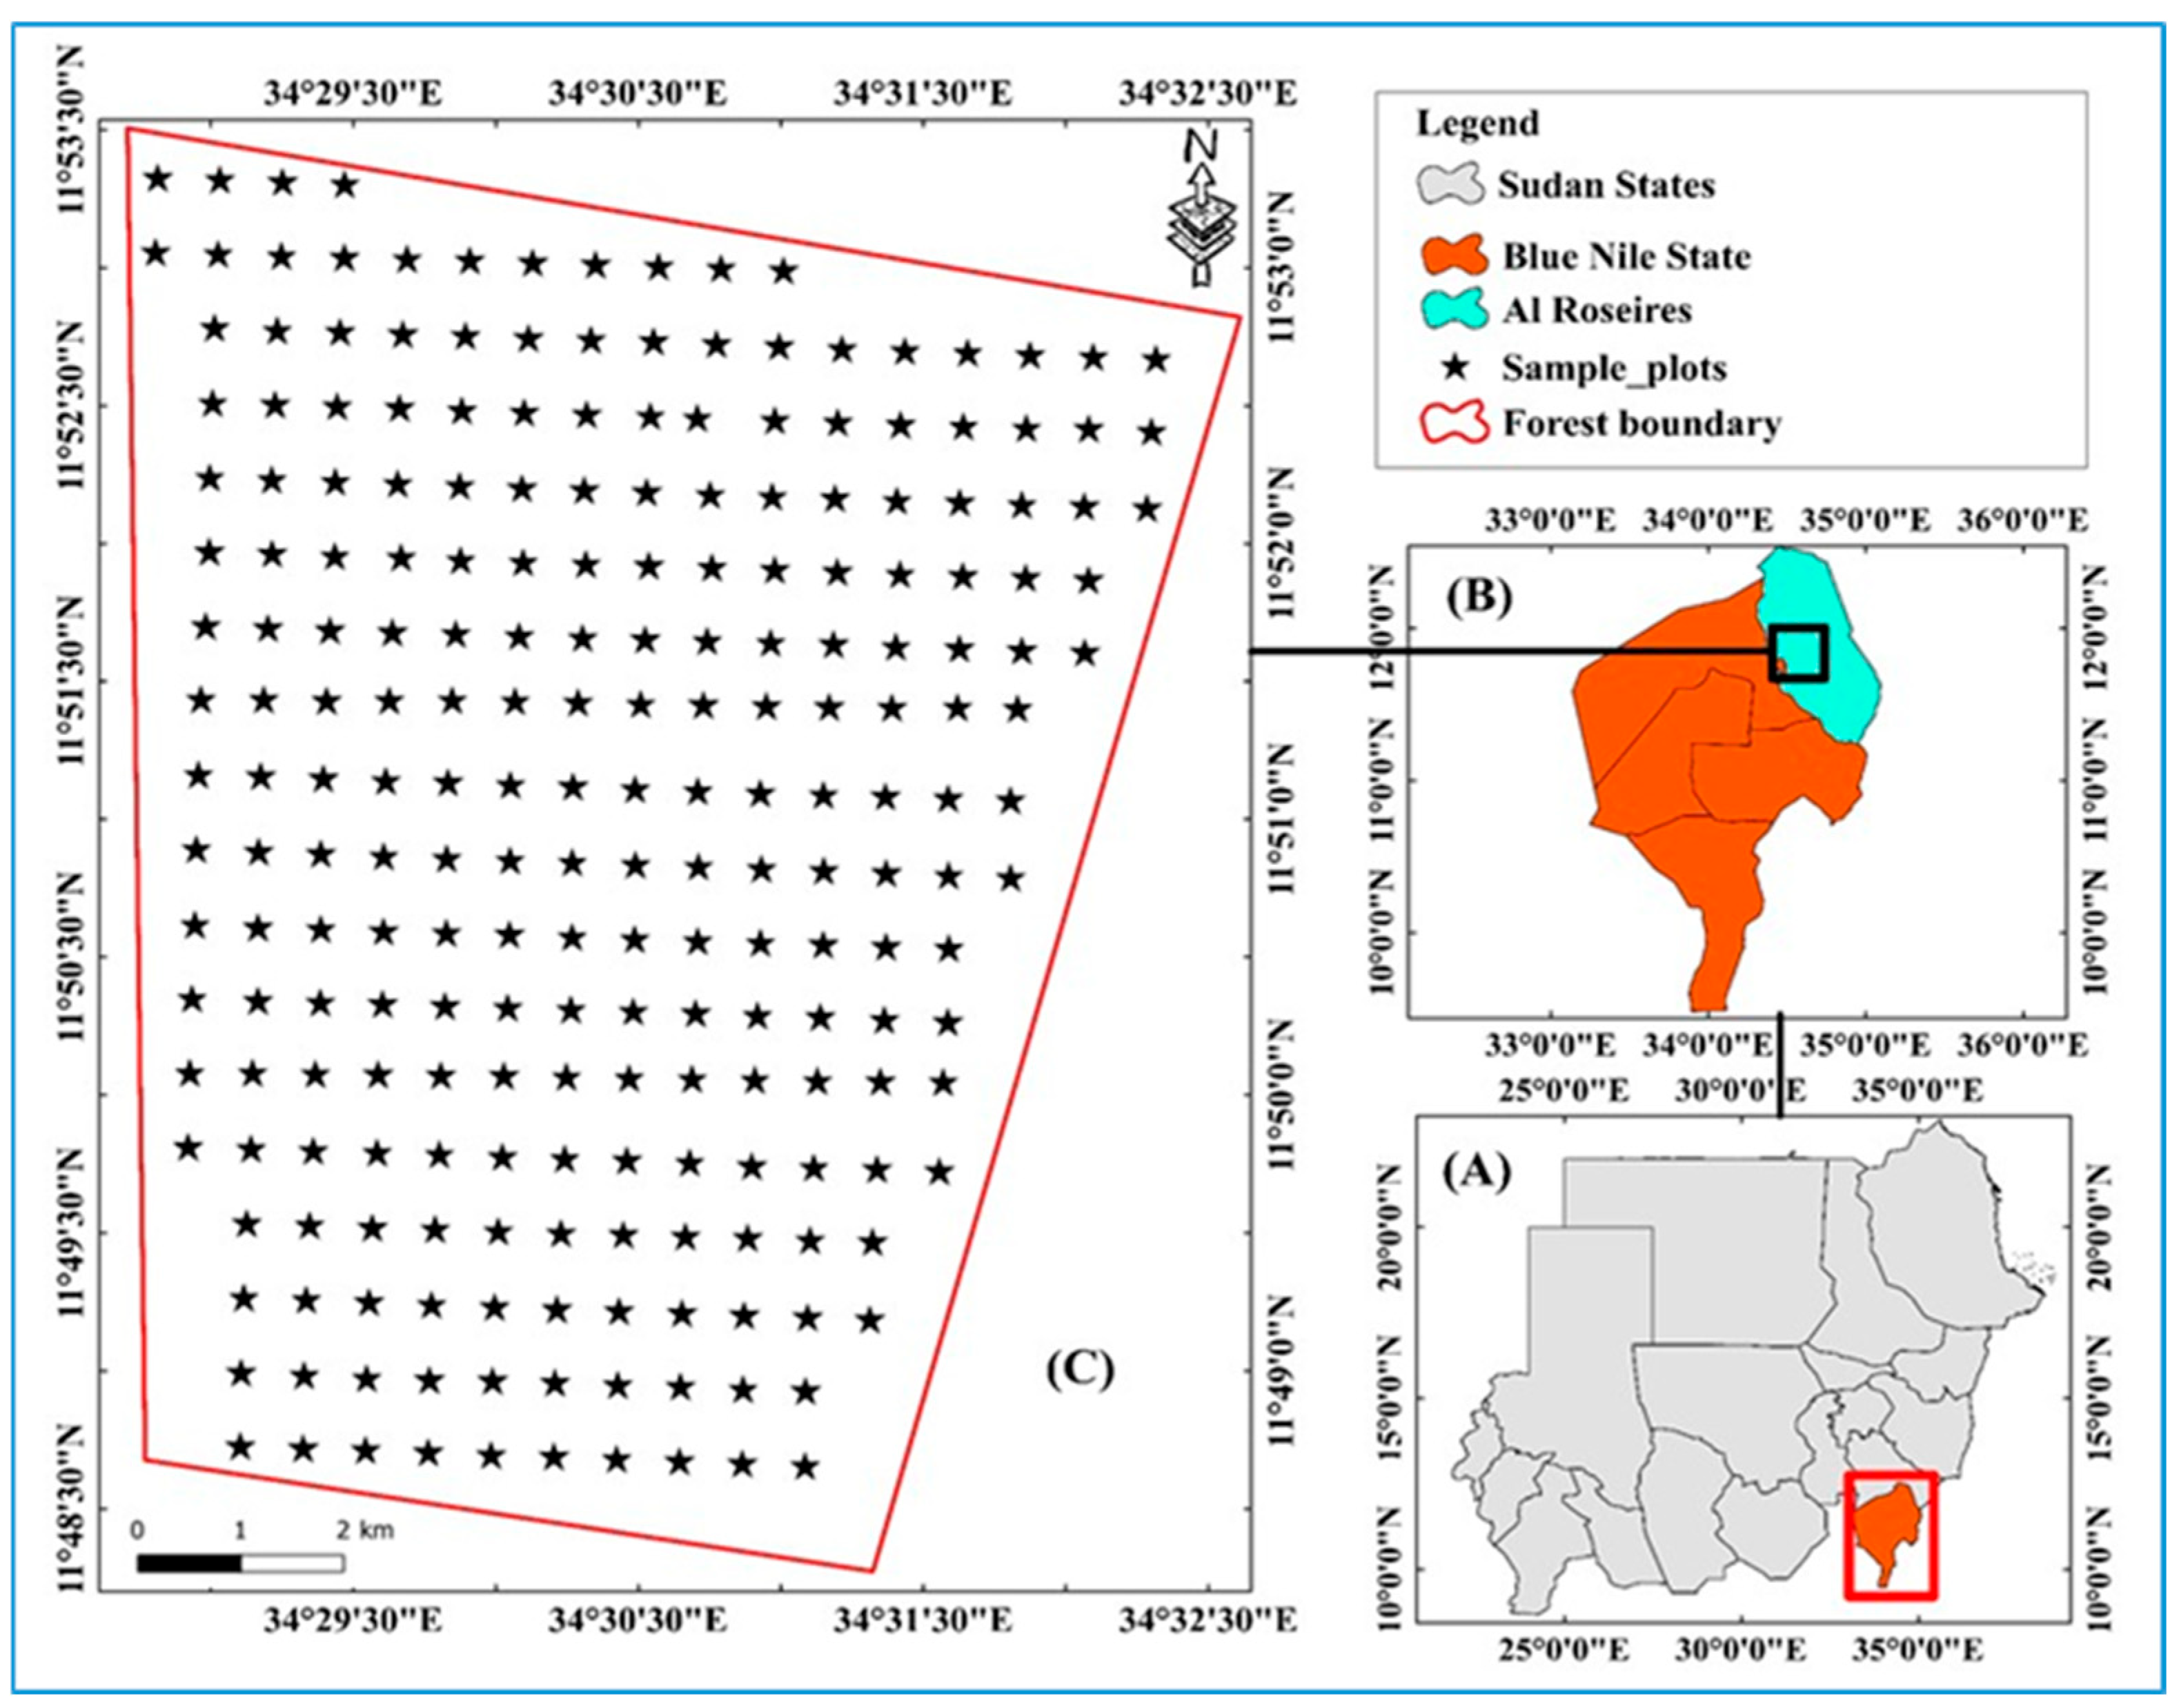
This study was conducted in Blue Nile region at Elnour Natural Reserve Forest (ENFR), located between longitudes 11°48′19″N and 11°53′30″N and latitudes 34°28′47″E and 34°32′35″E, 6 km southeast of El Damazin Town and about 3 km east of El Rosaries town. The forest was declared as a reserved forest on 15 June 1959, covering a total area of 4667.17 ha to offer high degree of protection from poaching, and hunting for biodiversity conservation (
Figure 1). The region’s climate is tropical and subcontinental characterized by humid rainy summers and dry winters. The temperature during winter months (December–January) ranges from 16.41 °C to 15.62 °C, while in summer (April and May) can reach 41.48 °C to 39.91 °C. A significant change in mean daily temperature occurs during the rainy period from June to October due to high humidity. Additionally, rainfall is influenced by South Atlantic and Congo air masses, with minimal impact from the Indian Ocean as well as precipitation varies between 300–700 mm from April to November, peaking from July to September. Harison and Jackson [
67] classified Sudan’s vegetation into various categories, with ENFR classified as low rainfall woodland savannah, featuring 55 woody plant species from 36 genera and 18 families [
68]. Dominant species in the reserve include
Sterculia setigera Delile,
Combretum hartmannianum Schweinf.,
Acacia seyal (Delile),
Terminalia brownii Fresen.,
Terminalia laxiflora Engl.,
Anogeissus leiocarpus (DC.) Guill. & Perr.,
Balanites aegyptiaca (L.) Delile,
Combretum micranthum G.Don, and
Lannea fruticosa (Hochst. ex A.Rich.) Engl. [
69]. The reserve also contains ecologically important and threatened species such as
Adansonia digitata L.,
Boswellia papyrifera (Delile) Hochst.,
Dalbergia melanoxylon Guill. & Perr.,
Grewia spp.,
Lonchocarpus laxiflorus Guill. & Perr.,
Piliostigma reticulatum (DC.) Hochst., and
Xeromphis nilotica (Stapf) Keay [
70]. The topography of ENFR is slightly flattened, with some depressions in the central and northern clay areas [
71]. The reserve forest soil is classified into two types: dark cracking clay soil, constituting about 64.2% of the forest area (2994.31 ha), and sandy loam to gravelly soil covering 35.8% (1672.86 ha). El Azaza is the nearest village to the reserve forest, part of Hamag civil administration under Mayer Obied Abou Shotal, that inhabits main tribes including Kenana (Arab), Rufaa (Arab), Bargo, Masalit, Fallata, Dinka, El Broon, and Tama. The village inhabitants periodically collect dry branches and twigs for firewood, as well as fruits, leaves, barks, and roots for medicine and building materials for life sustenance. The forest serves as a grazing area during the dry season from March to May, except where new regeneration is established.
2.2. Data Collection and Preprocessing
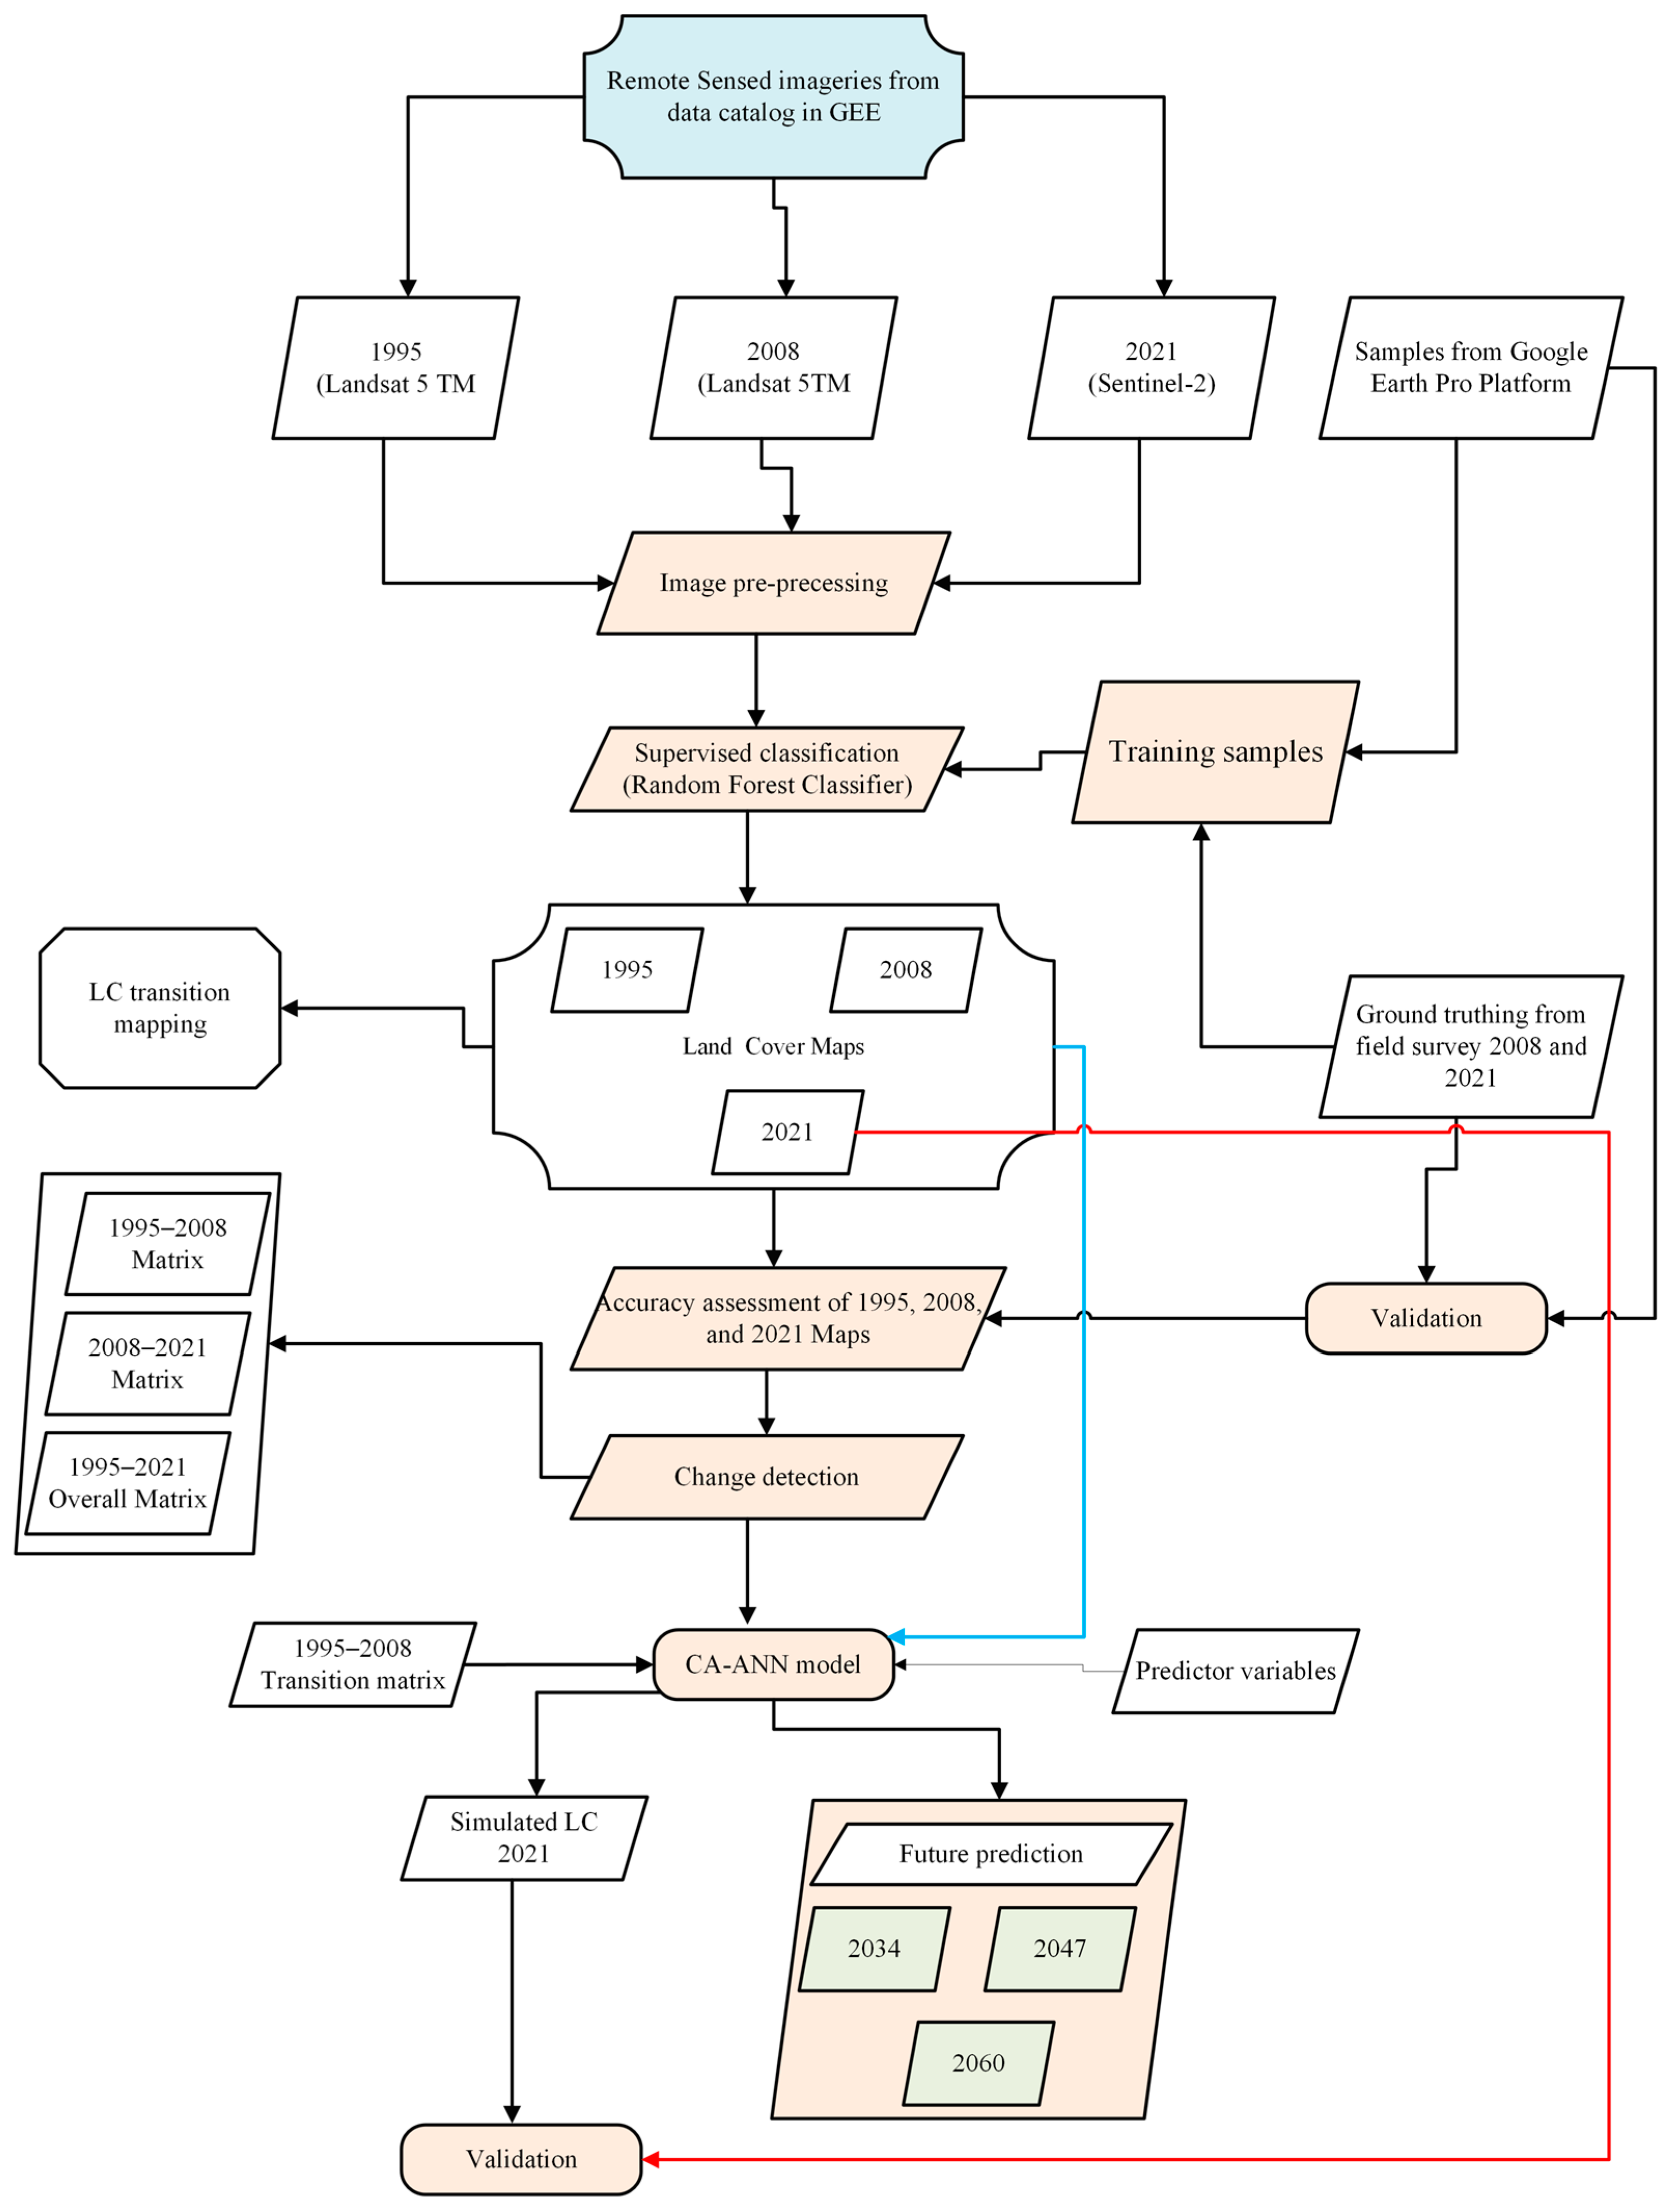
Figure 2 illustrates the methodological workflow adopted in this study. Landsat multispectral imagery remains a cornerstone for long-term land cover (LC) time series analysis due to its extensive historical archive and consistent spectral properties [
72]. In this study, multi-temporal datasets from Landsat 5 Thematic Mapper (TM) (30 m) and Sentinel-2 (10 m) were obtained from the Google Earth Engine (GEE) open-access catalog within the WGS84 reference system [
35].
The integration of Landsat and Sentinel-2 data was motivated by the need to ensure temporal continuity while benefiting from improved spatial resolution in recent years. To minimize inconsistencies arising from sensor differences, all datasets were harmonized through radiometric calibration, atmospheric correction, and spatial resampling to a common resolution prior to analysis.
Comprehensive preprocessing included cloud masking, atmospheric and topographic corrections, geometric alignment, and layer stacking. For each target year (1995, 2008, and 2021), annual median composites were generated using imagery acquired between 1 January and 31 December, following established approaches to reduce noise and seasonal variability in multi-temporal analyses [
40,
41].
2.3. Training and Testing Data for the Classification Algorithm
Accurate land cover mapping requires assigning each pixel to a predefined class, a process influenced by classifier selection, training data quality, and reference data reliability [
30,
35,
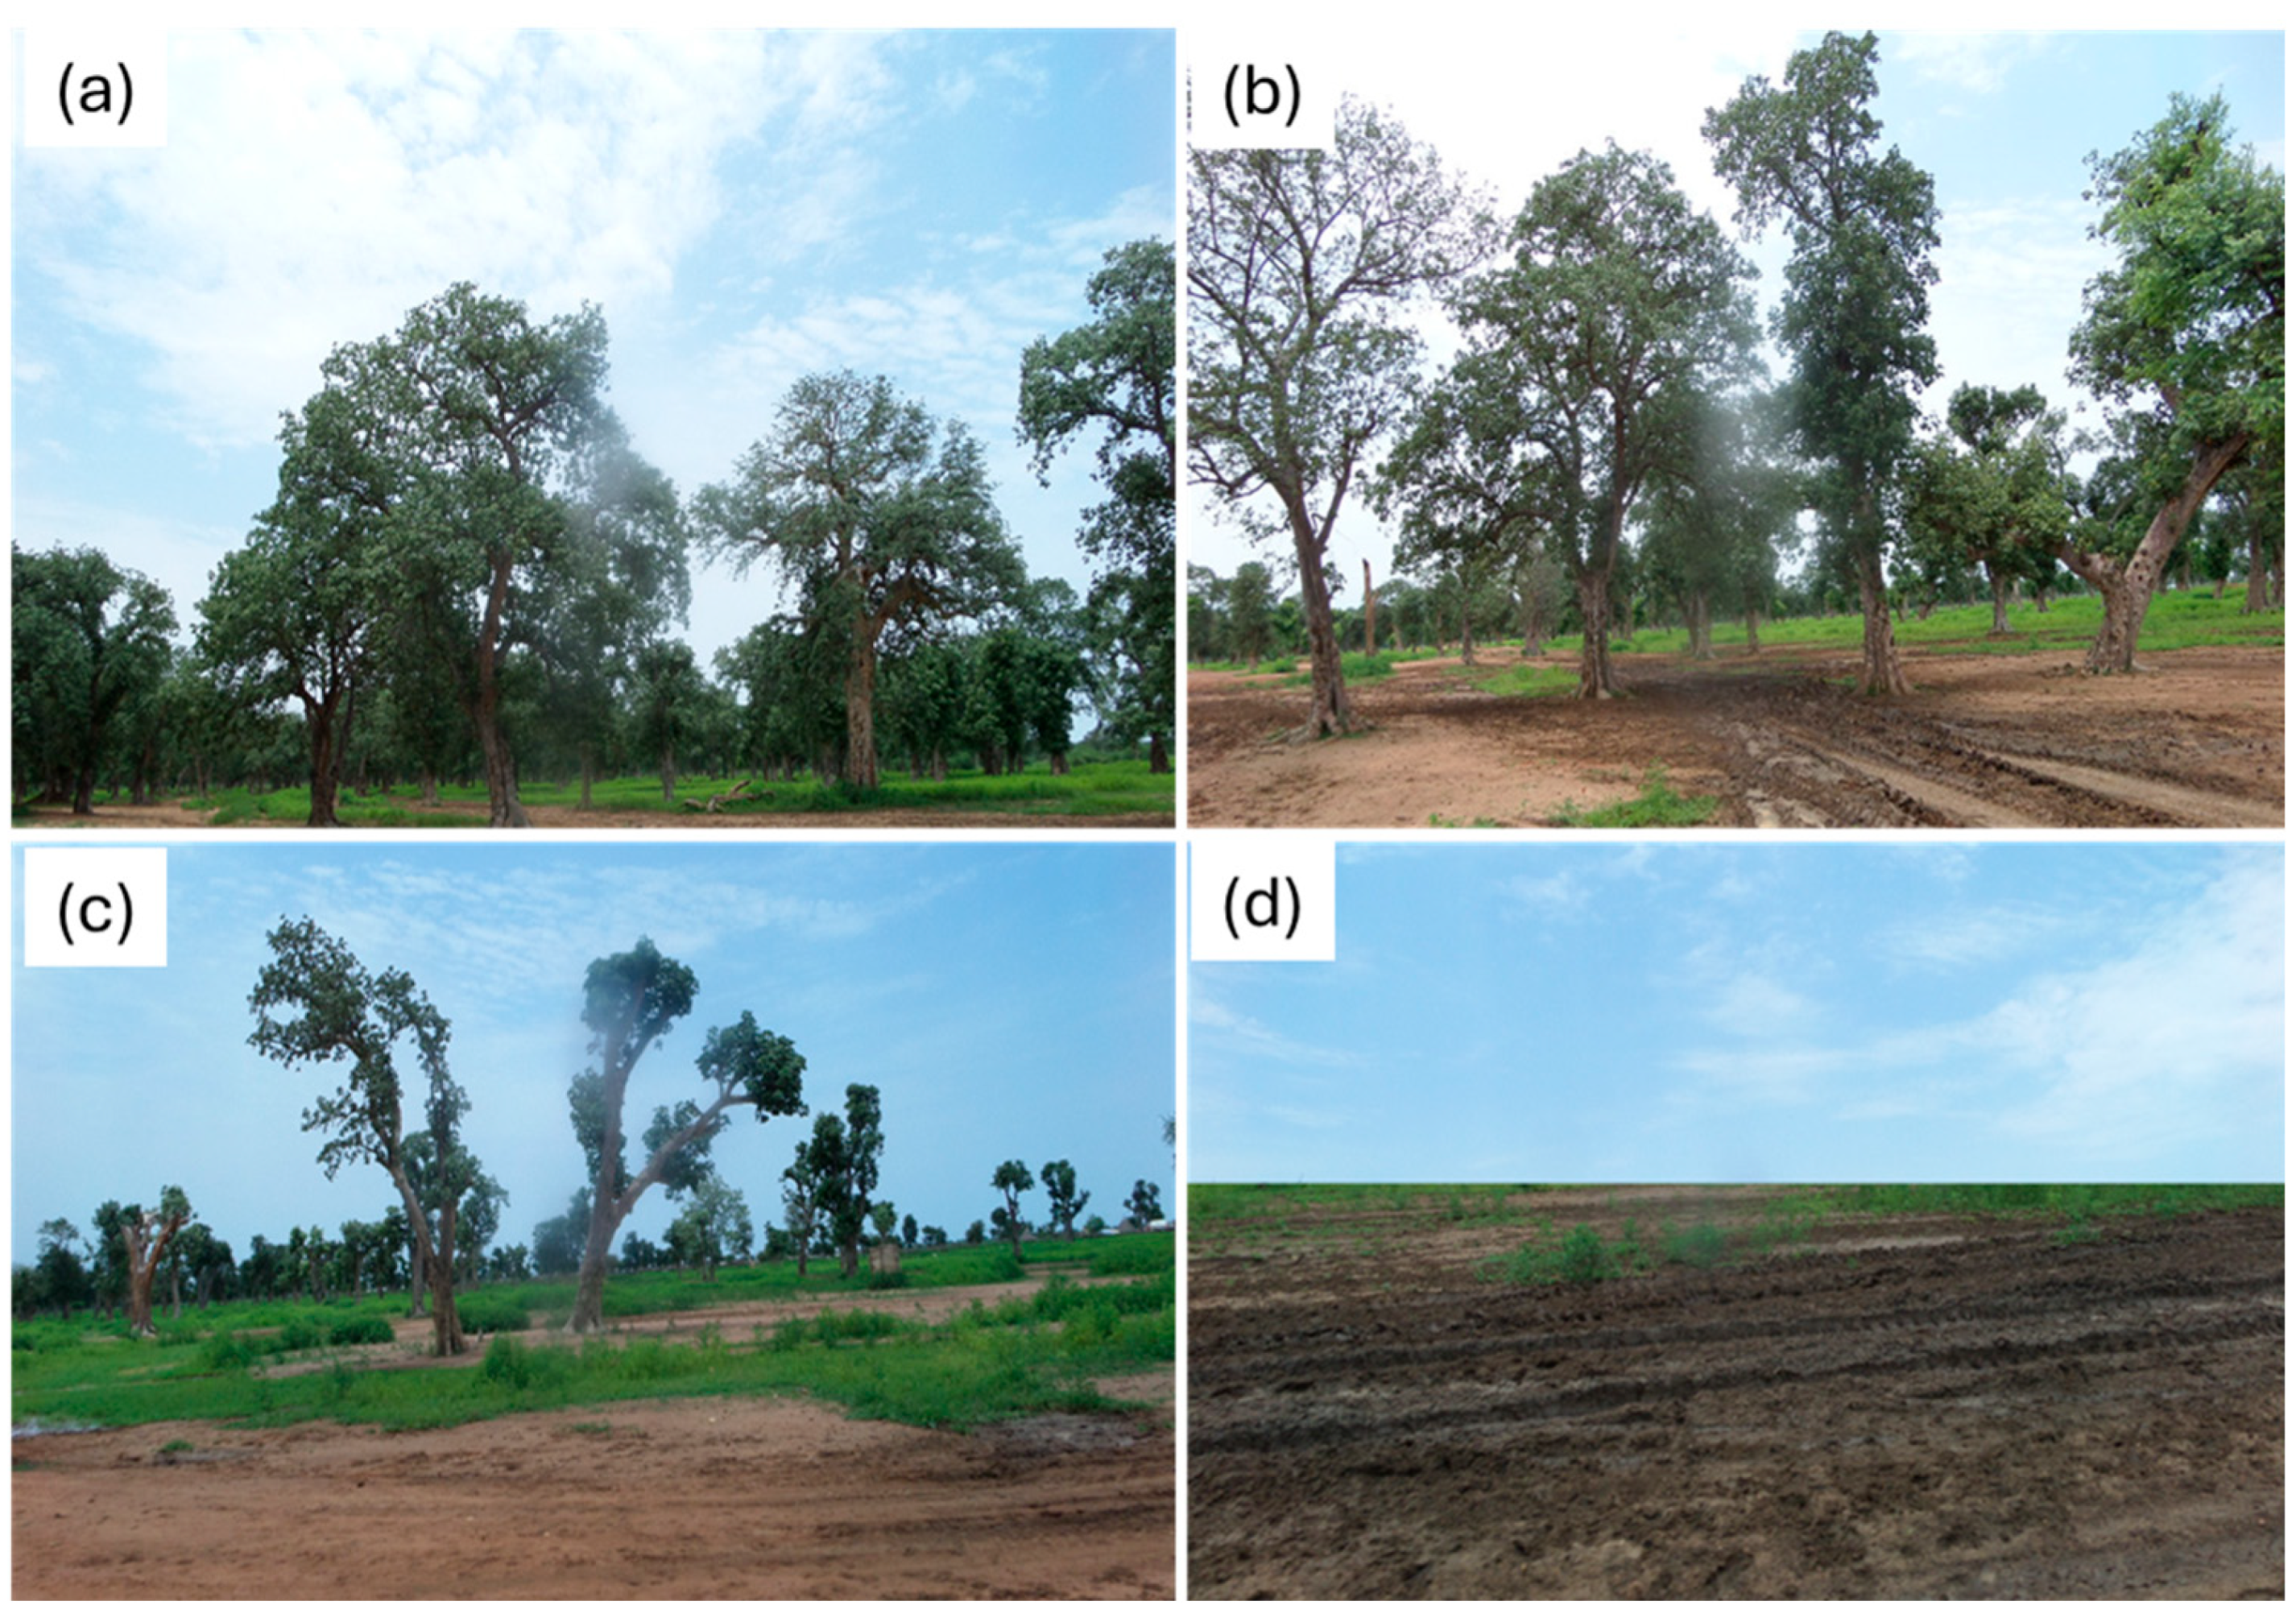
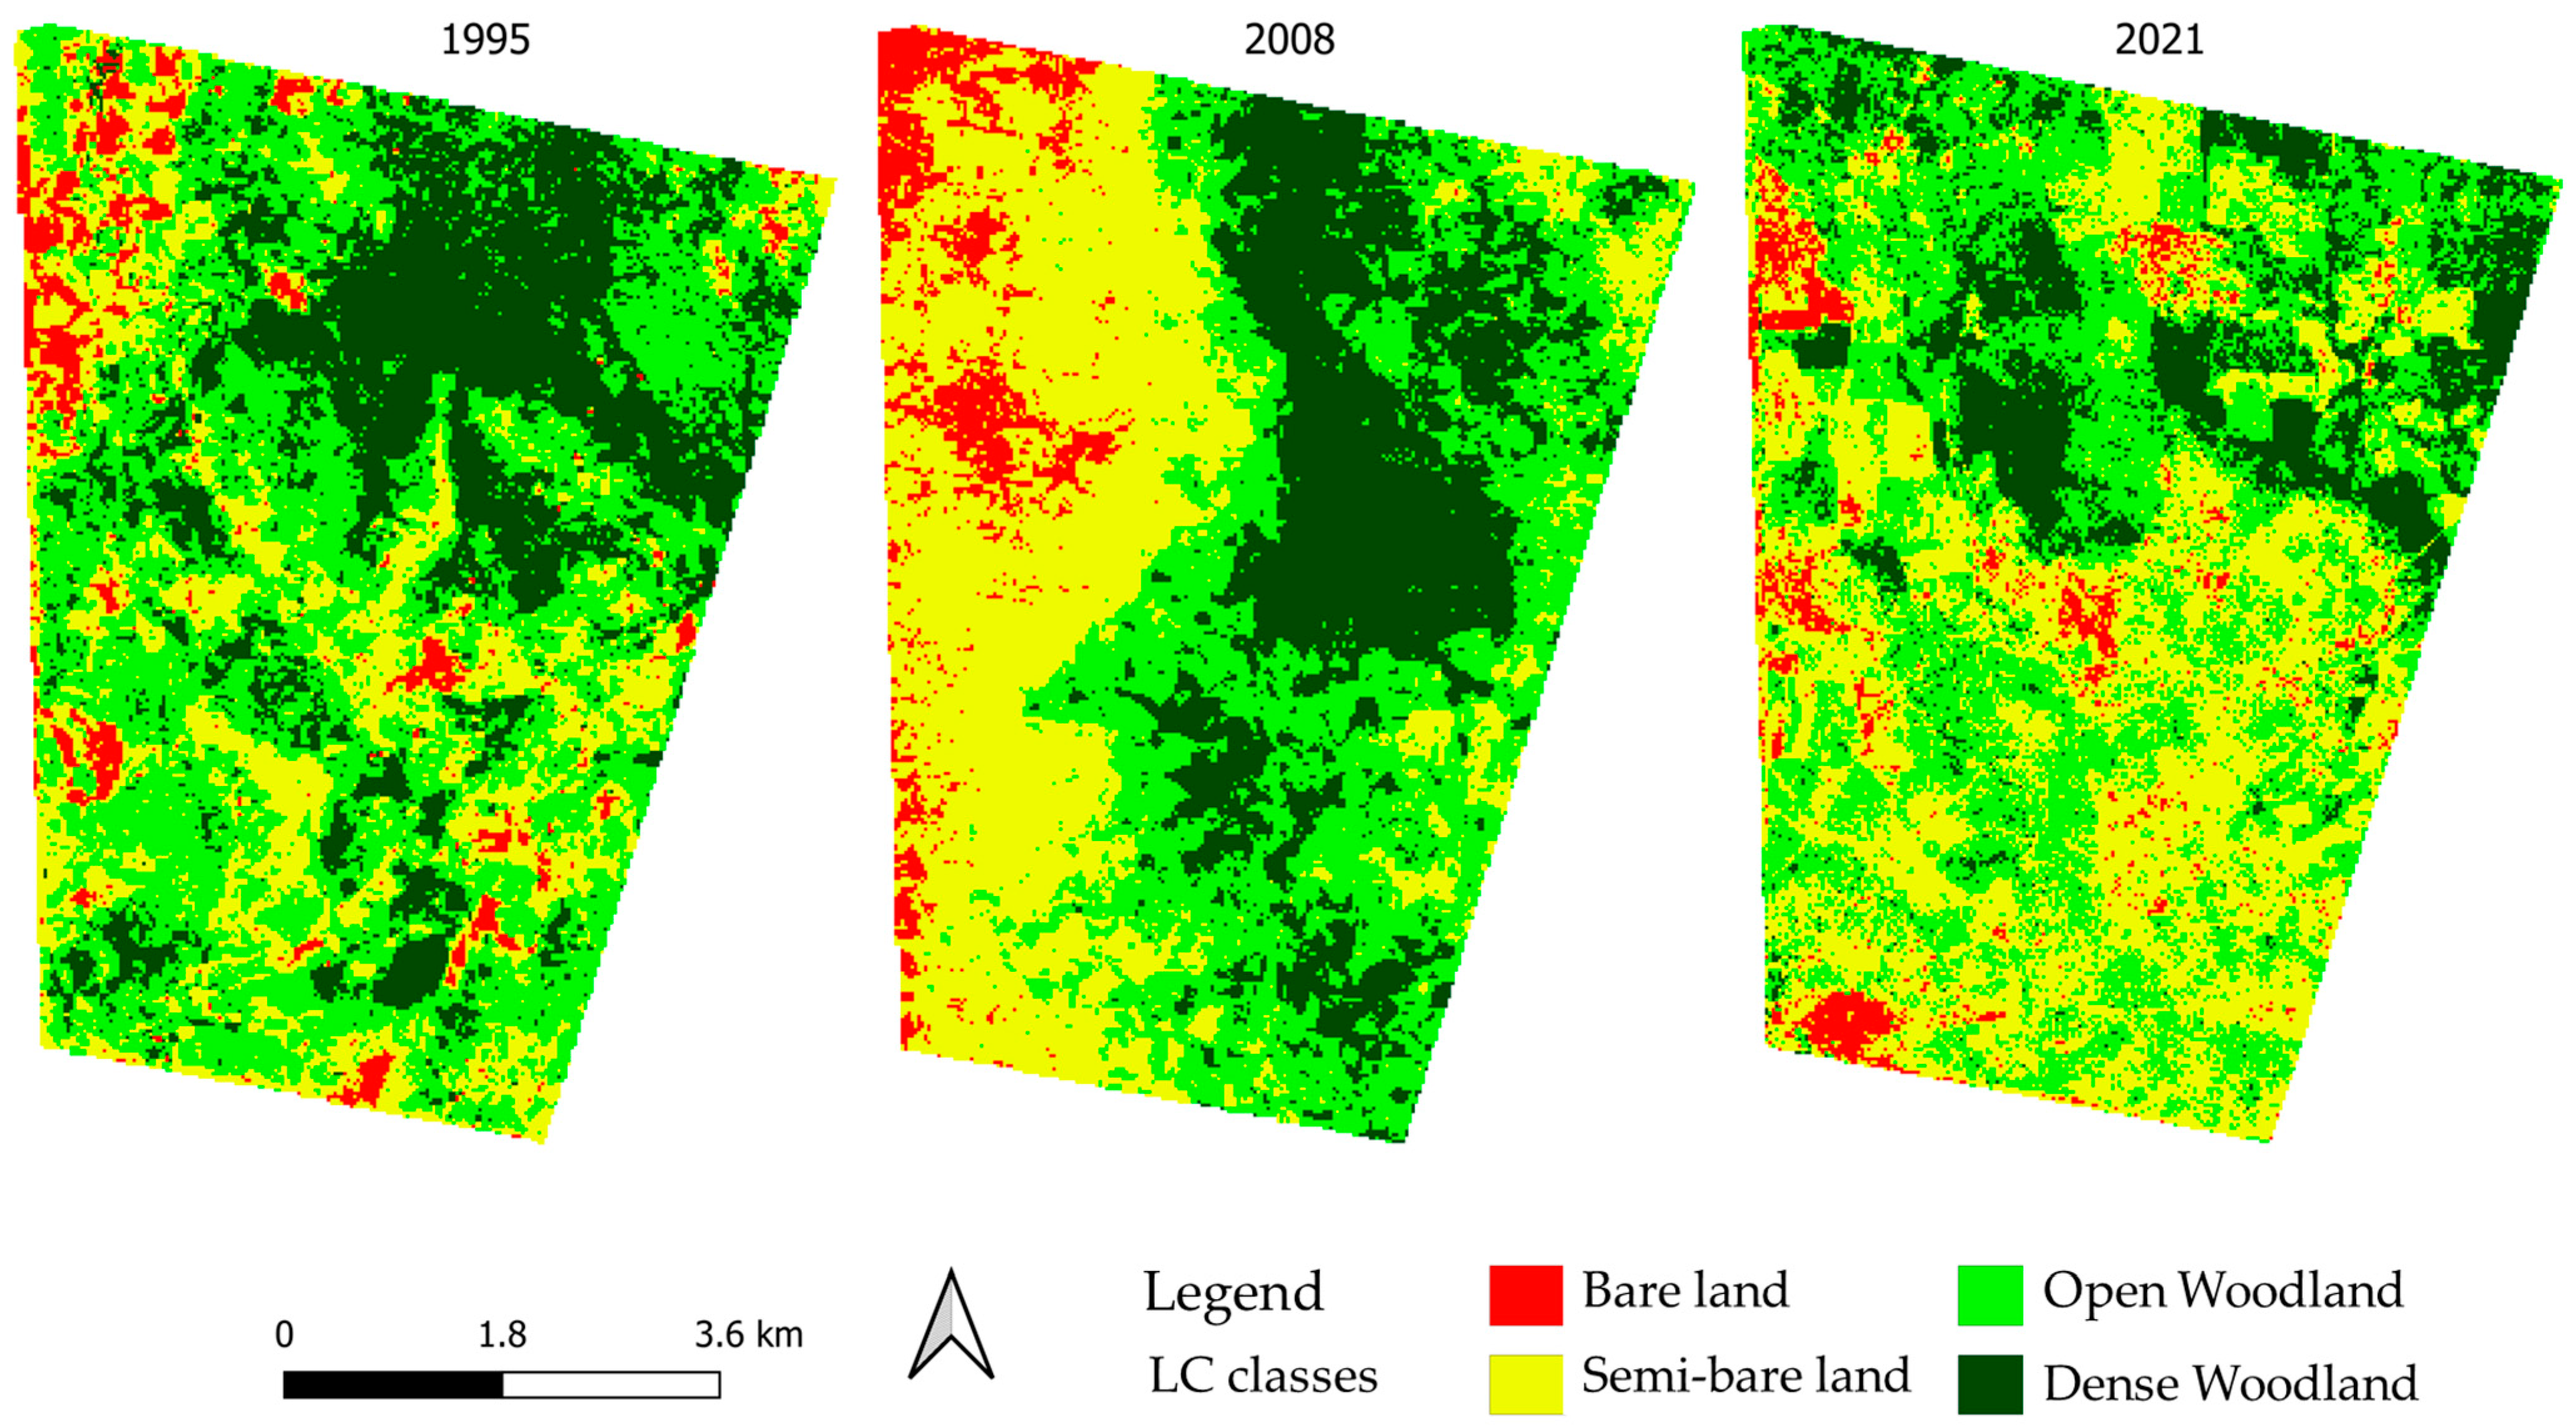
40]. In this study, four land cover classes: bare land, semi-bare land, open woodland (formerly light forest), and dense woodland, were mapped for 1995, 2008, and 2021 (
Table 1). These classes were defined based on canopy cover thresholds and ecological characteristics derived from previous studies [
36], field observations, and expert knowledge. Representative field photographs illustrating the structural characteristics of each land cover class are provided in
Figure 3, supporting the interpretation of classification categories based on canopy cover thresholds.
Reference samples were collected from two field campaigns (2008 and 2021; 229 samples each) and supplemented by onscreen digitization of high-resolution imagery in Google Earth Pro. This approach is widely recognized for generating reliable training data in remote sensing studies [
39,
45,
73].
A total of 916 samples per reference year were compiled (687 from onscreen interpretation and 229 from field data) and proportionally distributed across classes. Of these, 70% (641 samples) were used for training the Random Forest classifier. Training polygons were designed to be spatially homogeneous and limited in size to reduce spatial autocorrelation and capture intra-class spectral variability.
The remaining 30% (275 samples) were reserved for independent validation. Test samples were randomly distributed and maintained at a minimum distance of 100 m from training samples to avoid spatial dependence and ensure unbiased accuracy assessment [
73] (
Appendix A Table A1).
2.4. Landsat and Sentinel-2 Images Classification
Supervised classification of land cover was performed using the Random Forest (RF) algorithm, a non-parametric ensemble learning method widely applied in remote sensing for handling high-dimensional and heterogeneous datasets [
74]. The RF classifier was applied to multi-temporal Landsat and Sentinel-2 imagery to map four land cover classes in the ENFR, Blue Nile State, Sudan.
The selection of RF was based on its demonstrated capability to model complex, non-linear relationships between spectral variables and land cover classes, as well as its robustness to noise and overfitting [
43,
47,
75]. RF constructs multiple decision trees using bootstrap samples of the training dataset and aggregates their outputs through majority voting to assign the final class label [
9,
42]. This ensemble approach improves classification stability and generalization, particularly in environments characterized by spectral variability.
The model was parameterized following established practices [
9,
46], using 100 decision trees (ntree = 100), while the number of variables randomly selected at each split (mtry) was set to the square root of the total number of predictor variables. These parameter settings provide a balance between computational efficiency and predictive performance.
The suitability of RF for this study is further supported by its ability to handle large datasets, reduce sensitivity to outliers, and maintain stable performance across different land cover types, making it appropriate for multi-temporal classification of savanna woodland environments [
39,
45,
76].
2.5. Classification Accuracy Assessment
The reliability of any thematic LULC map depends on both its overall accuracy and the class-specific accuracy of individual land-cover categories [
77]. Accuracy assessment typically employs several well-established metrics, including overall accuracy (OA), producer’s accuracy (PA), and user’s accuracy (UA) (
Appendix A Table A2). In this study, we computed OA, PA, and UA for each reference year, excluding kappa coefficient due to its widely documented limitations in reflecting true map reliability [
78].
To provide a more robust, class-specific measure of accuracy, we also calculated the F1-score, which synthesizes
PA and
UA into a single metric ranging from 0 to 100% [
79]. The
F1-
score for class
i was computed as:
Given ongoing concerns regarding the interpretability and statistical weaknesses of the kappa coefficient in thematic accuracy evaluation [
78], we further incorporated two complementary disagreement metrics: quantity disagreement (QD) and allocation disagreement (AD), as proposed by Pontius and Millones [
80]. QD quantifies discrepancies between the observed and predicted class proportions, whereas AD captures differences in the spatial allocation of predicted versus observed samples. Together, these metrics offer a more nuanced and reliable characterization of classification performance.
2.6. LC Change Detection
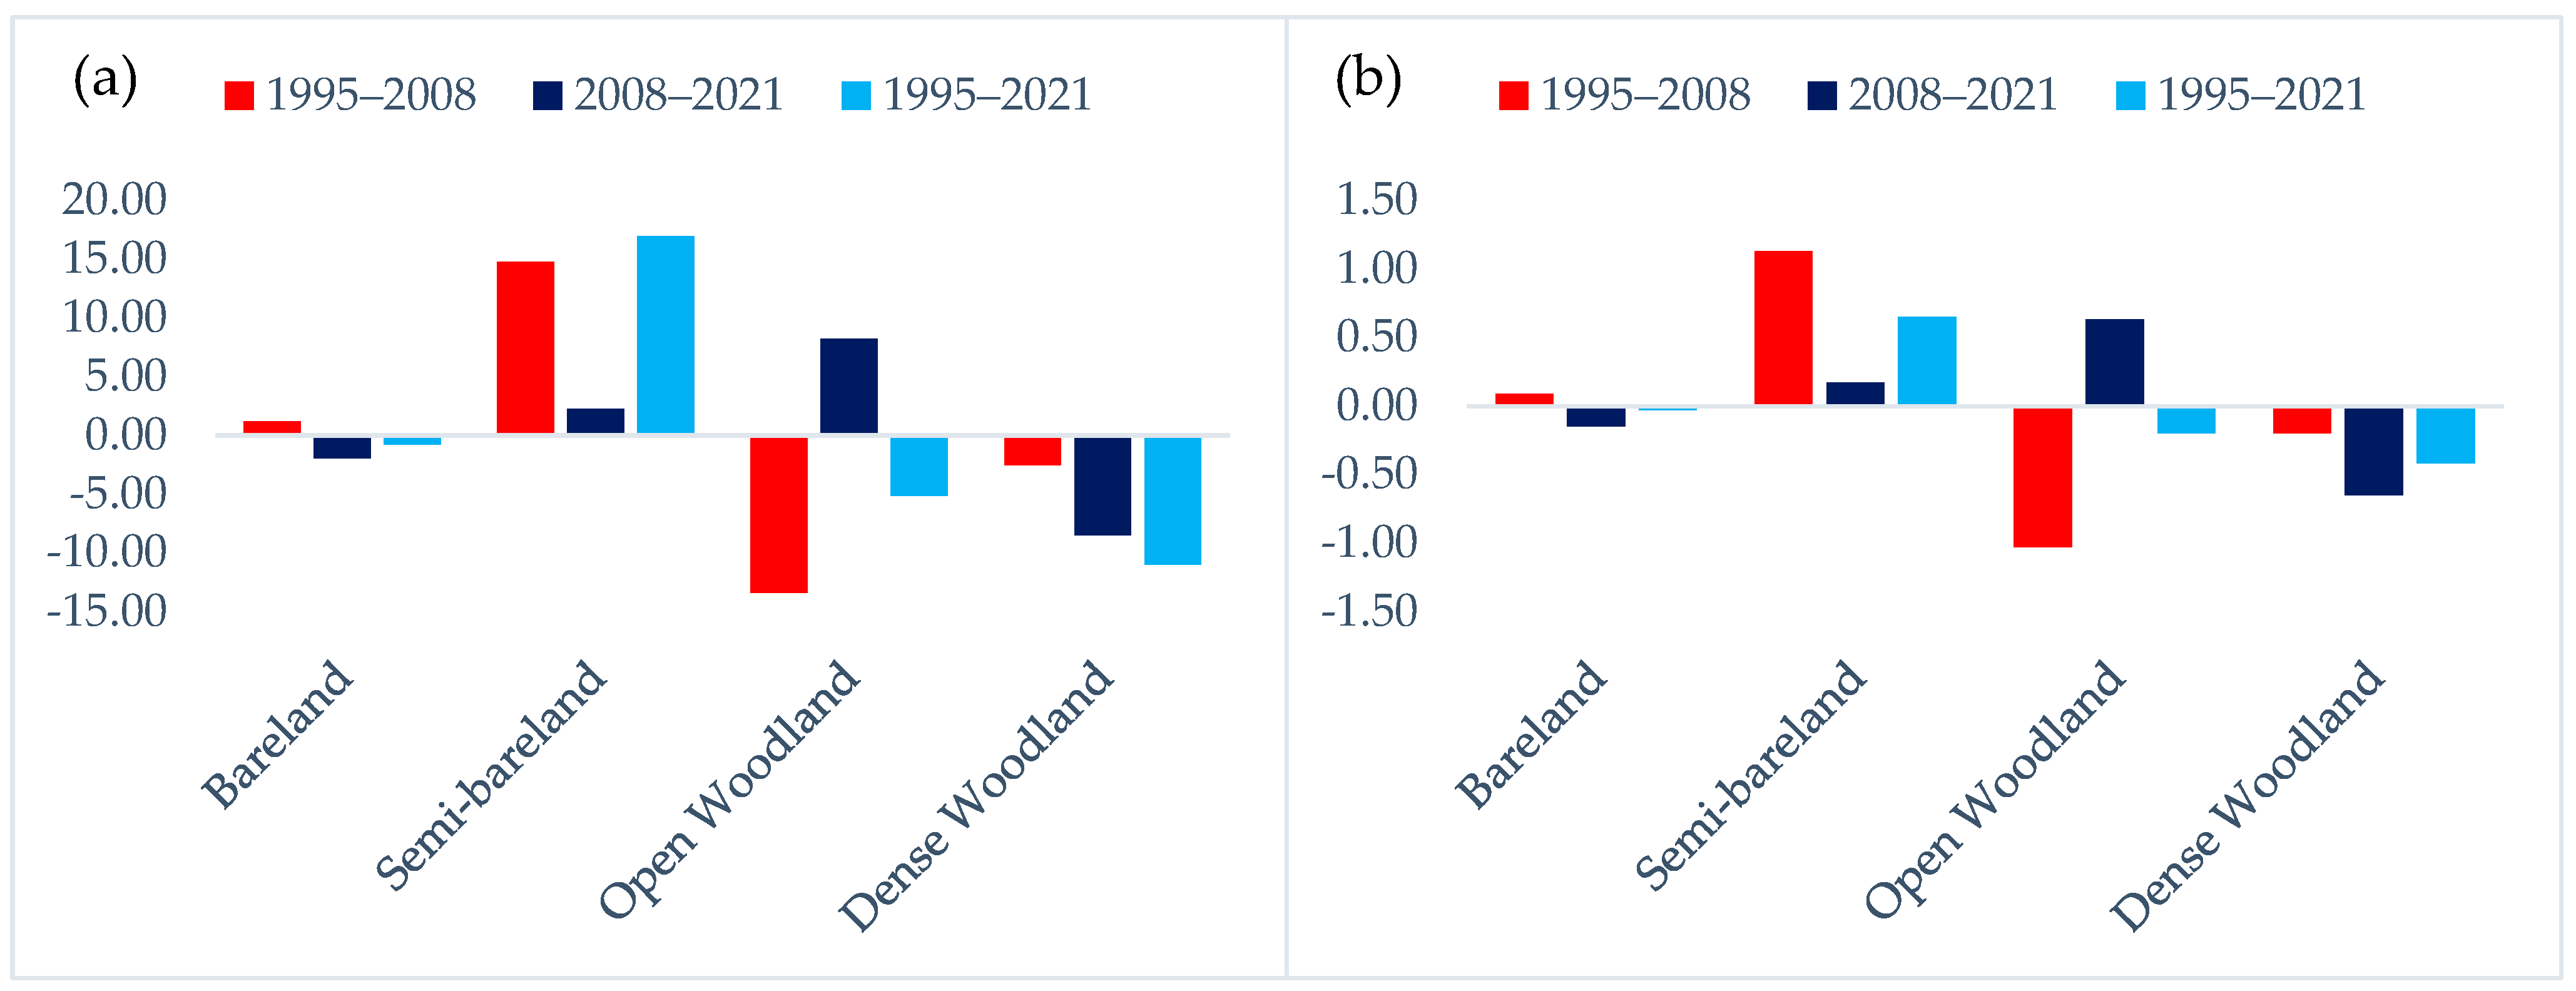
LC dynamics across the study area were quantified by analyzing classified maps from multiple time slices. The proportional change in each LULC category was computed following the approach in [
81] using:
where
C1 and
C2 denote the area of each LULC class in the baseline year (1995) and the terminal year (2021), respectively.
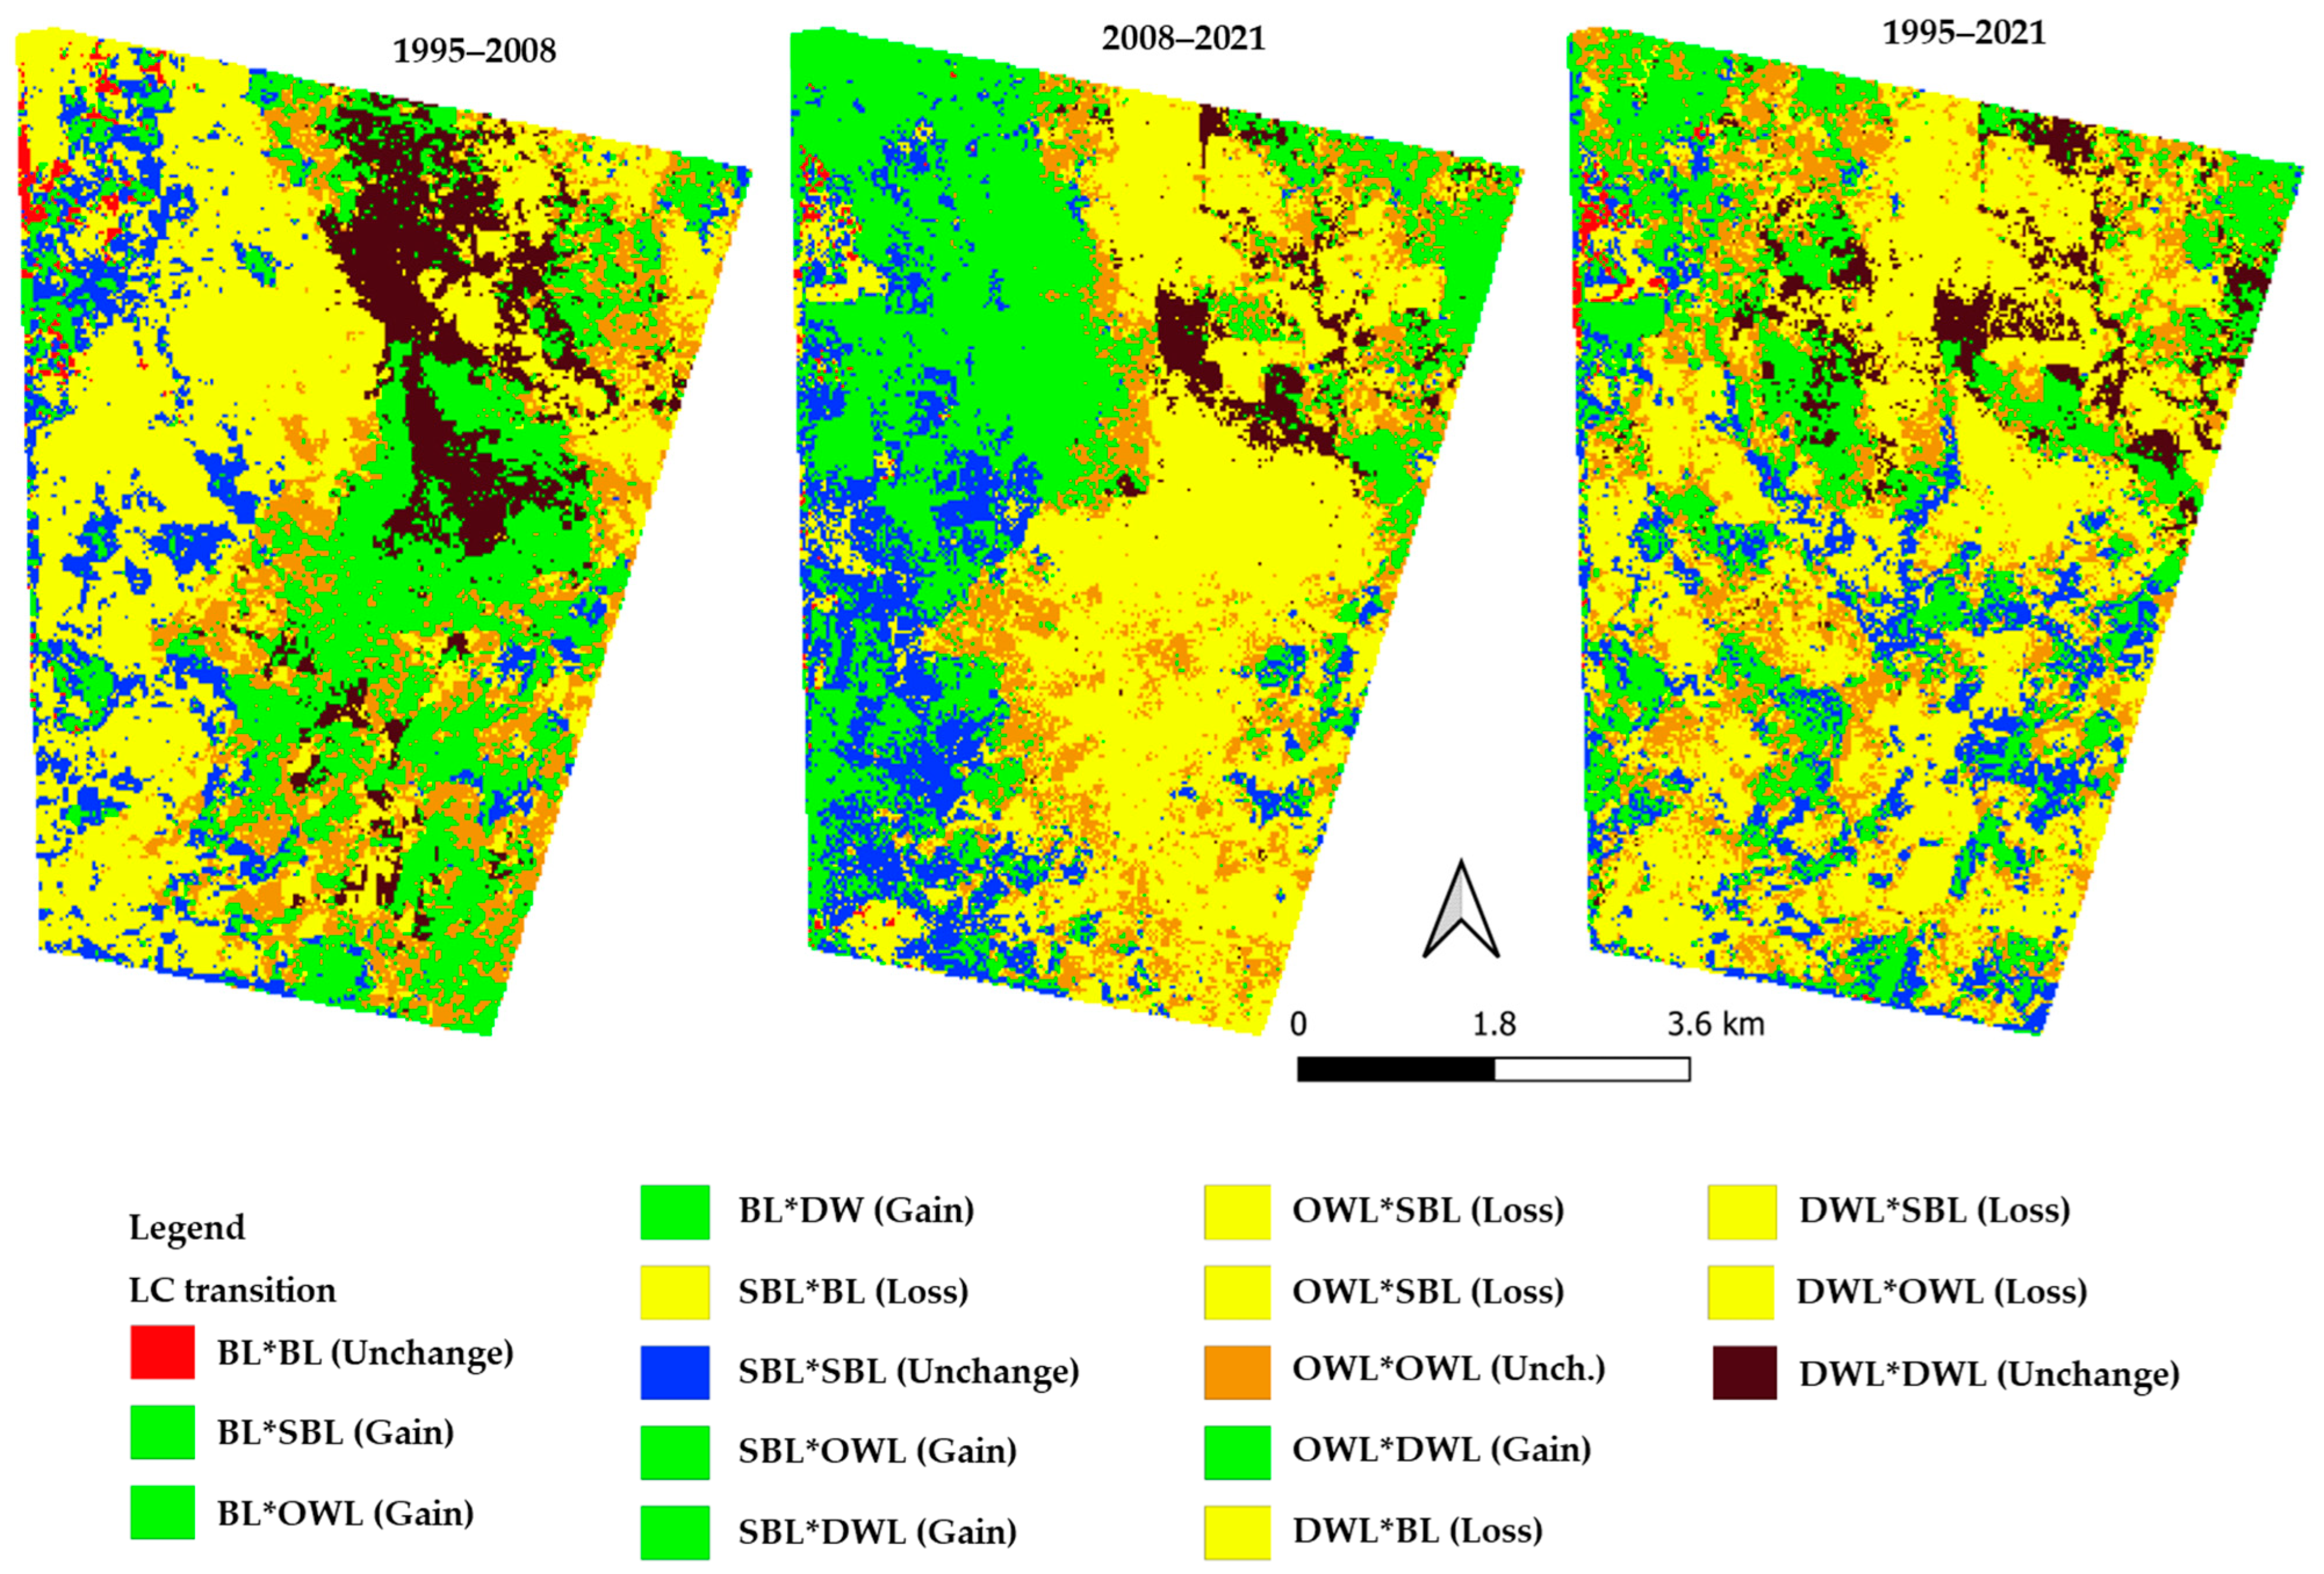
To further elucidate landscape trajectories, a transition matrix was generated to characterize LULC stocks, their composition, and net gains or losses. Additionally, LULC transitions among classes were evaluated at 13-year intervals, 1995–2008, 2008–2021, and overall change 1995–2021, to capture the direction, magnitude, and persistence of class-to-class transformations throughout the study period.
2.7. LC Transition Mapping
To visualize and quantify the spatiotemporal dynamics of land use/land cover (LULC) transitions in ENFR, we generated transition maps and matrices using ArcGIS Pro 3.6, following established LULC transformation assessment approaches [
10,
82]. Classified LULC maps from 1995, 2008, and 2021 served as reference layers for detecting class-to-class conversions across the study period. These datasets enabled the derivation of transition pathways over 13-year and 26-year intervals, thereby capturing both short-term and long-term landscape transformations and providing a comprehensive overview of LULC change trajectories.
2.8. Future Prediction of LC
Future land cover (LC) projections were performed using a hybrid Cellular Automata–Artificial Neural Network (CA–ANN) modeling framework. Multi-temporal LC maps derived from Landsat imagery for 1995, 2008, and 2021 (13-year intervals) were used to characterize historical transitions and support future simulations. The CA–ANN model was implemented using the MOLUSCE plugin in QGIS (version 3.44.3), which is widely applied for spatio-temporal land cover analysis and scenario-based prediction of landscape dynamics [
54,
58,
59,
83,
84].
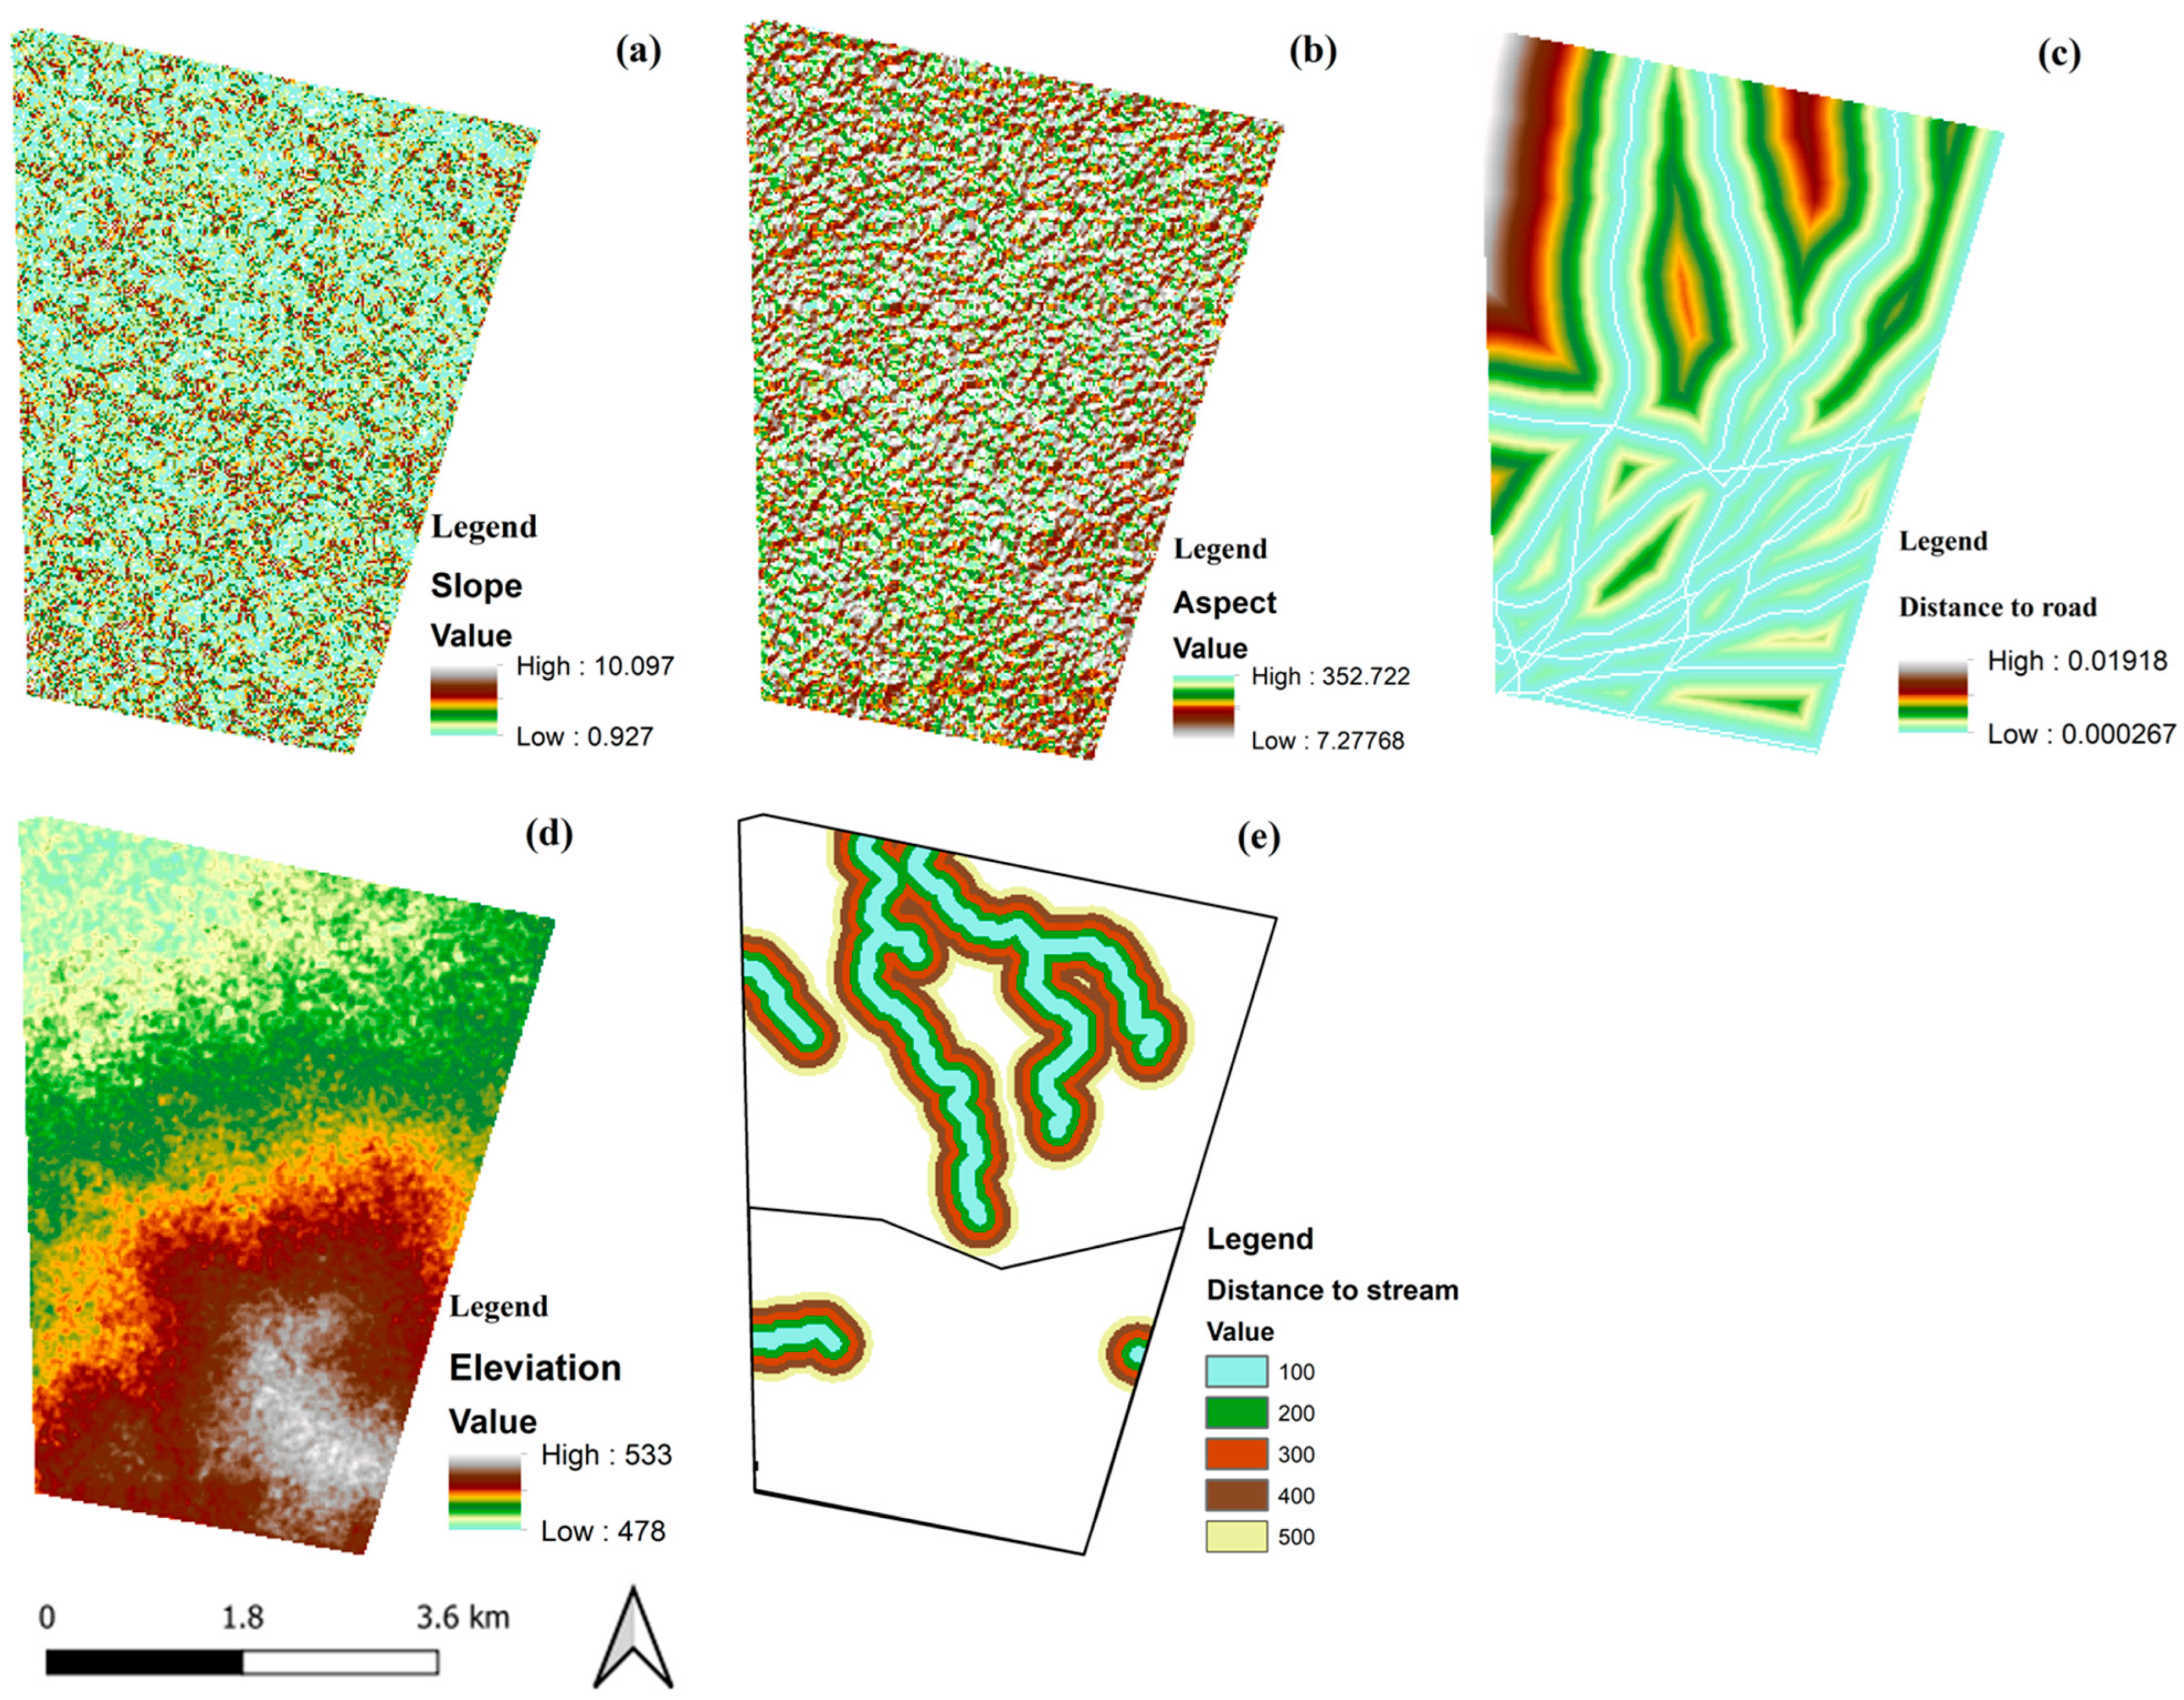
The modeling framework was driven by a set of biophysical and accessibility-related predictors selected based on their relevance to land cover change processes and data availability [
50,
57,
85]. These predictors included elevation, slope, aspect, distance to roads, and distance to streams (
Appendix A Figure A1). Such variables are commonly used in land cover modeling as they provide spatially explicit representations of environmental constraints and human accessibility that influence landscape transitions [
58]. All predictor layers were standardized and resampled to a common spatial resolution of 10 × 10 m in the WGS_1984_UTM_Zone_36N coordinate reference system prior to model implementation.
The CA–ANN framework integrates two complementary components:
- (i)
An Artificial Neural Network (ANN), which estimates transition suitability by modeling non-linear relationships between observed land cover changes and the selected driving factors.
- (ii)
A Cellular Automata (CA) module, which incorporates neighborhood configuration and spatial contiguity during the allocation of future land cover states.
Transition probability matrices were derived from observed changes between 1995 and 2008 and between 2008 and 2021. These matrices were used to parameterize the temporal dynamics of land cover transitions, while the ANN-generated suitability surfaces guided their spatial distribution.
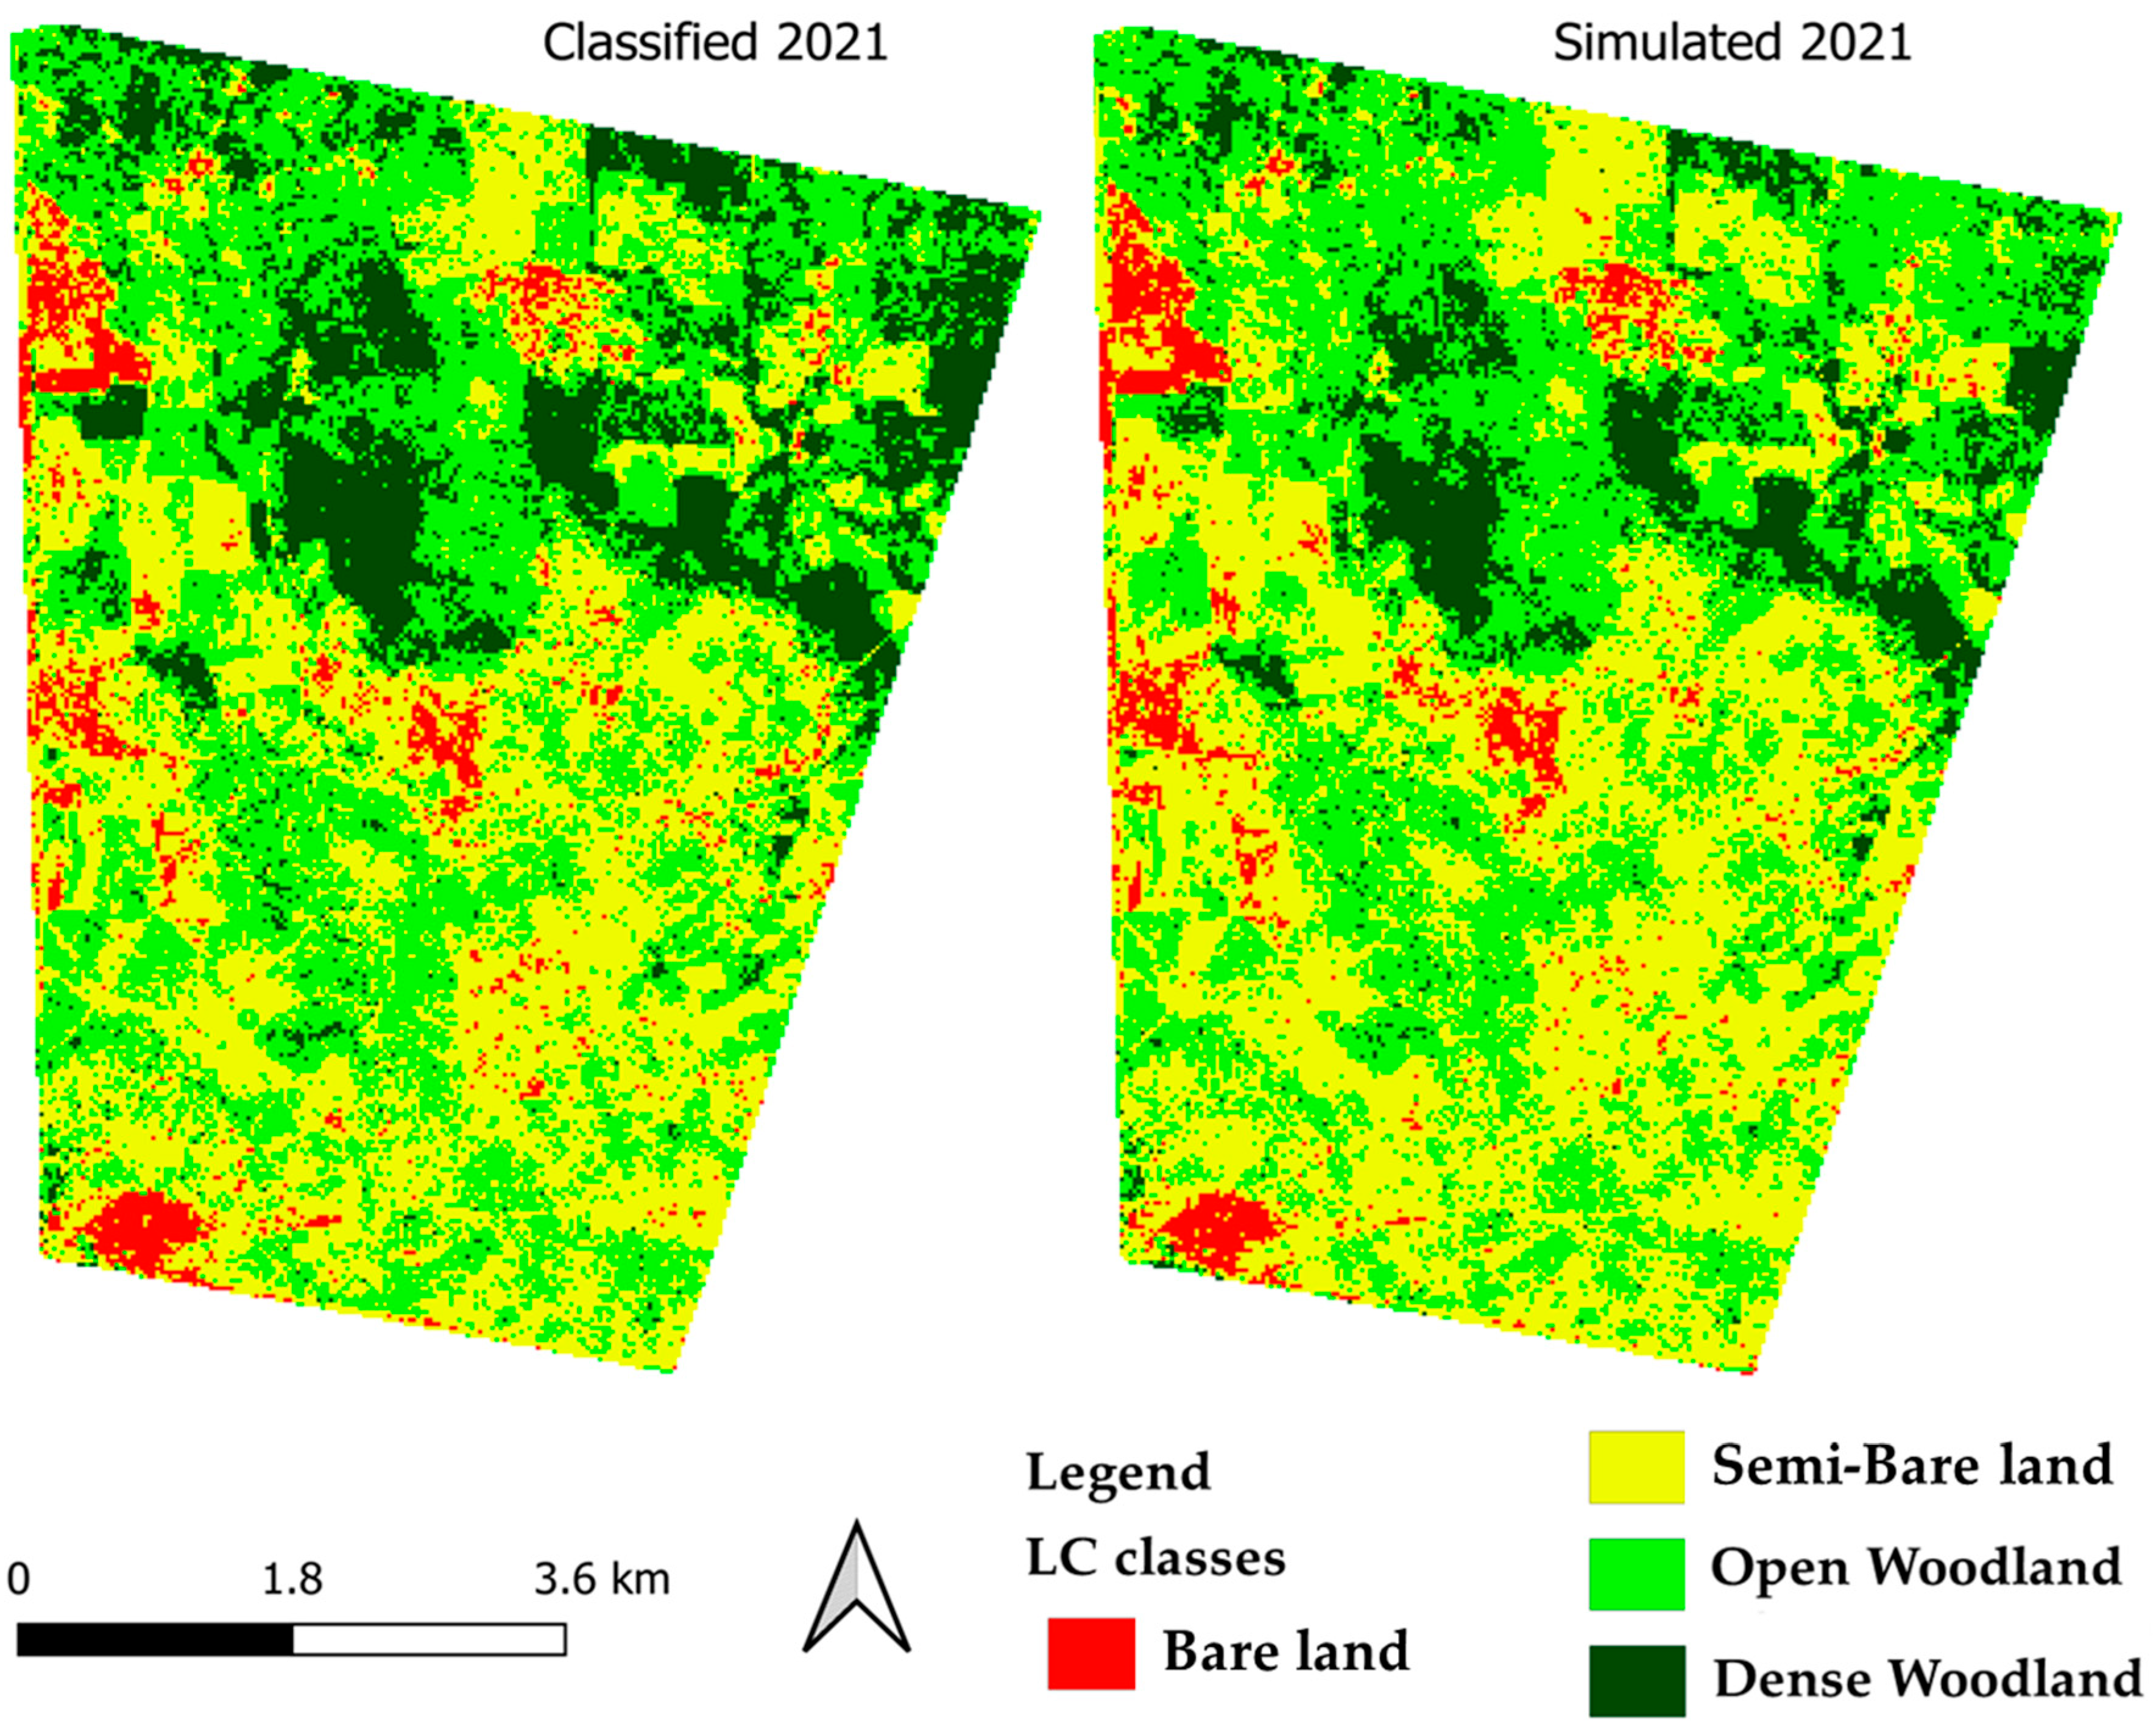
Model validation was conducted by simulating the 2021 land cover map using transition probabilities derived from the 1995–2008 period and comparing the simulated output with the observed 2021 classification. Model performance was evaluated using the accuracy metrics provided by the MOLUSCE plugin, including overall accuracy (percent correctness), Kappa for location, and Kappa for histograms, enabling assessment of both spatial agreement and class distribution consistency.
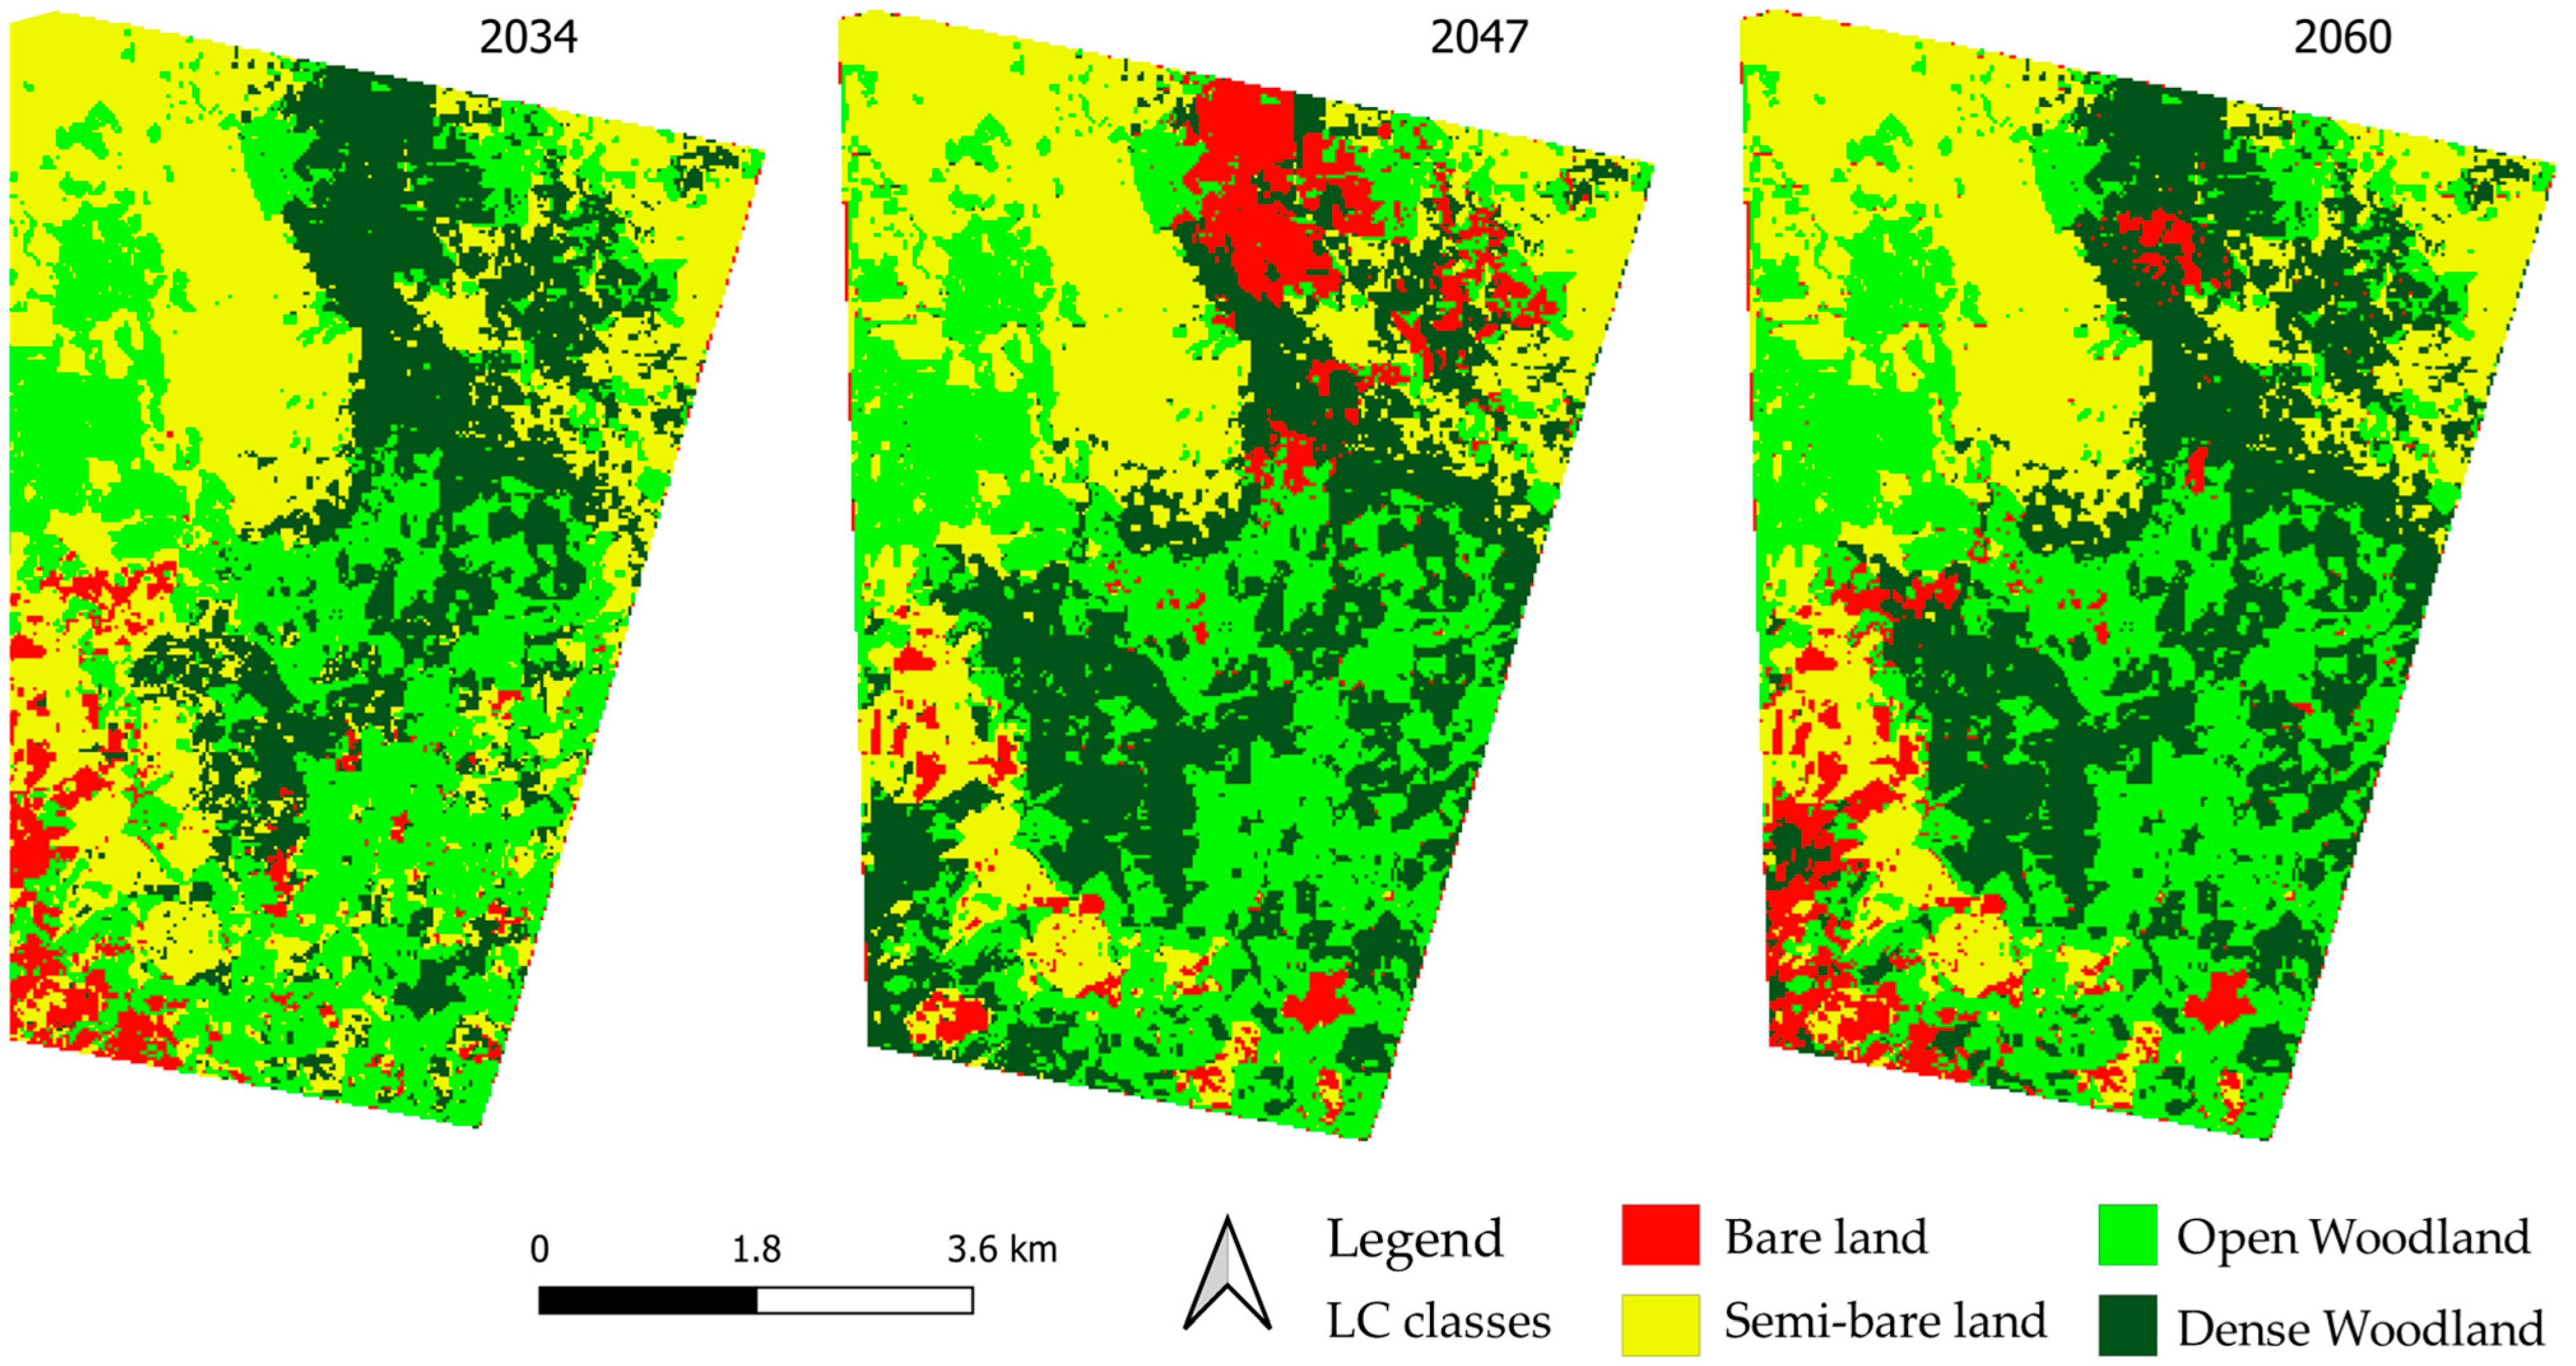
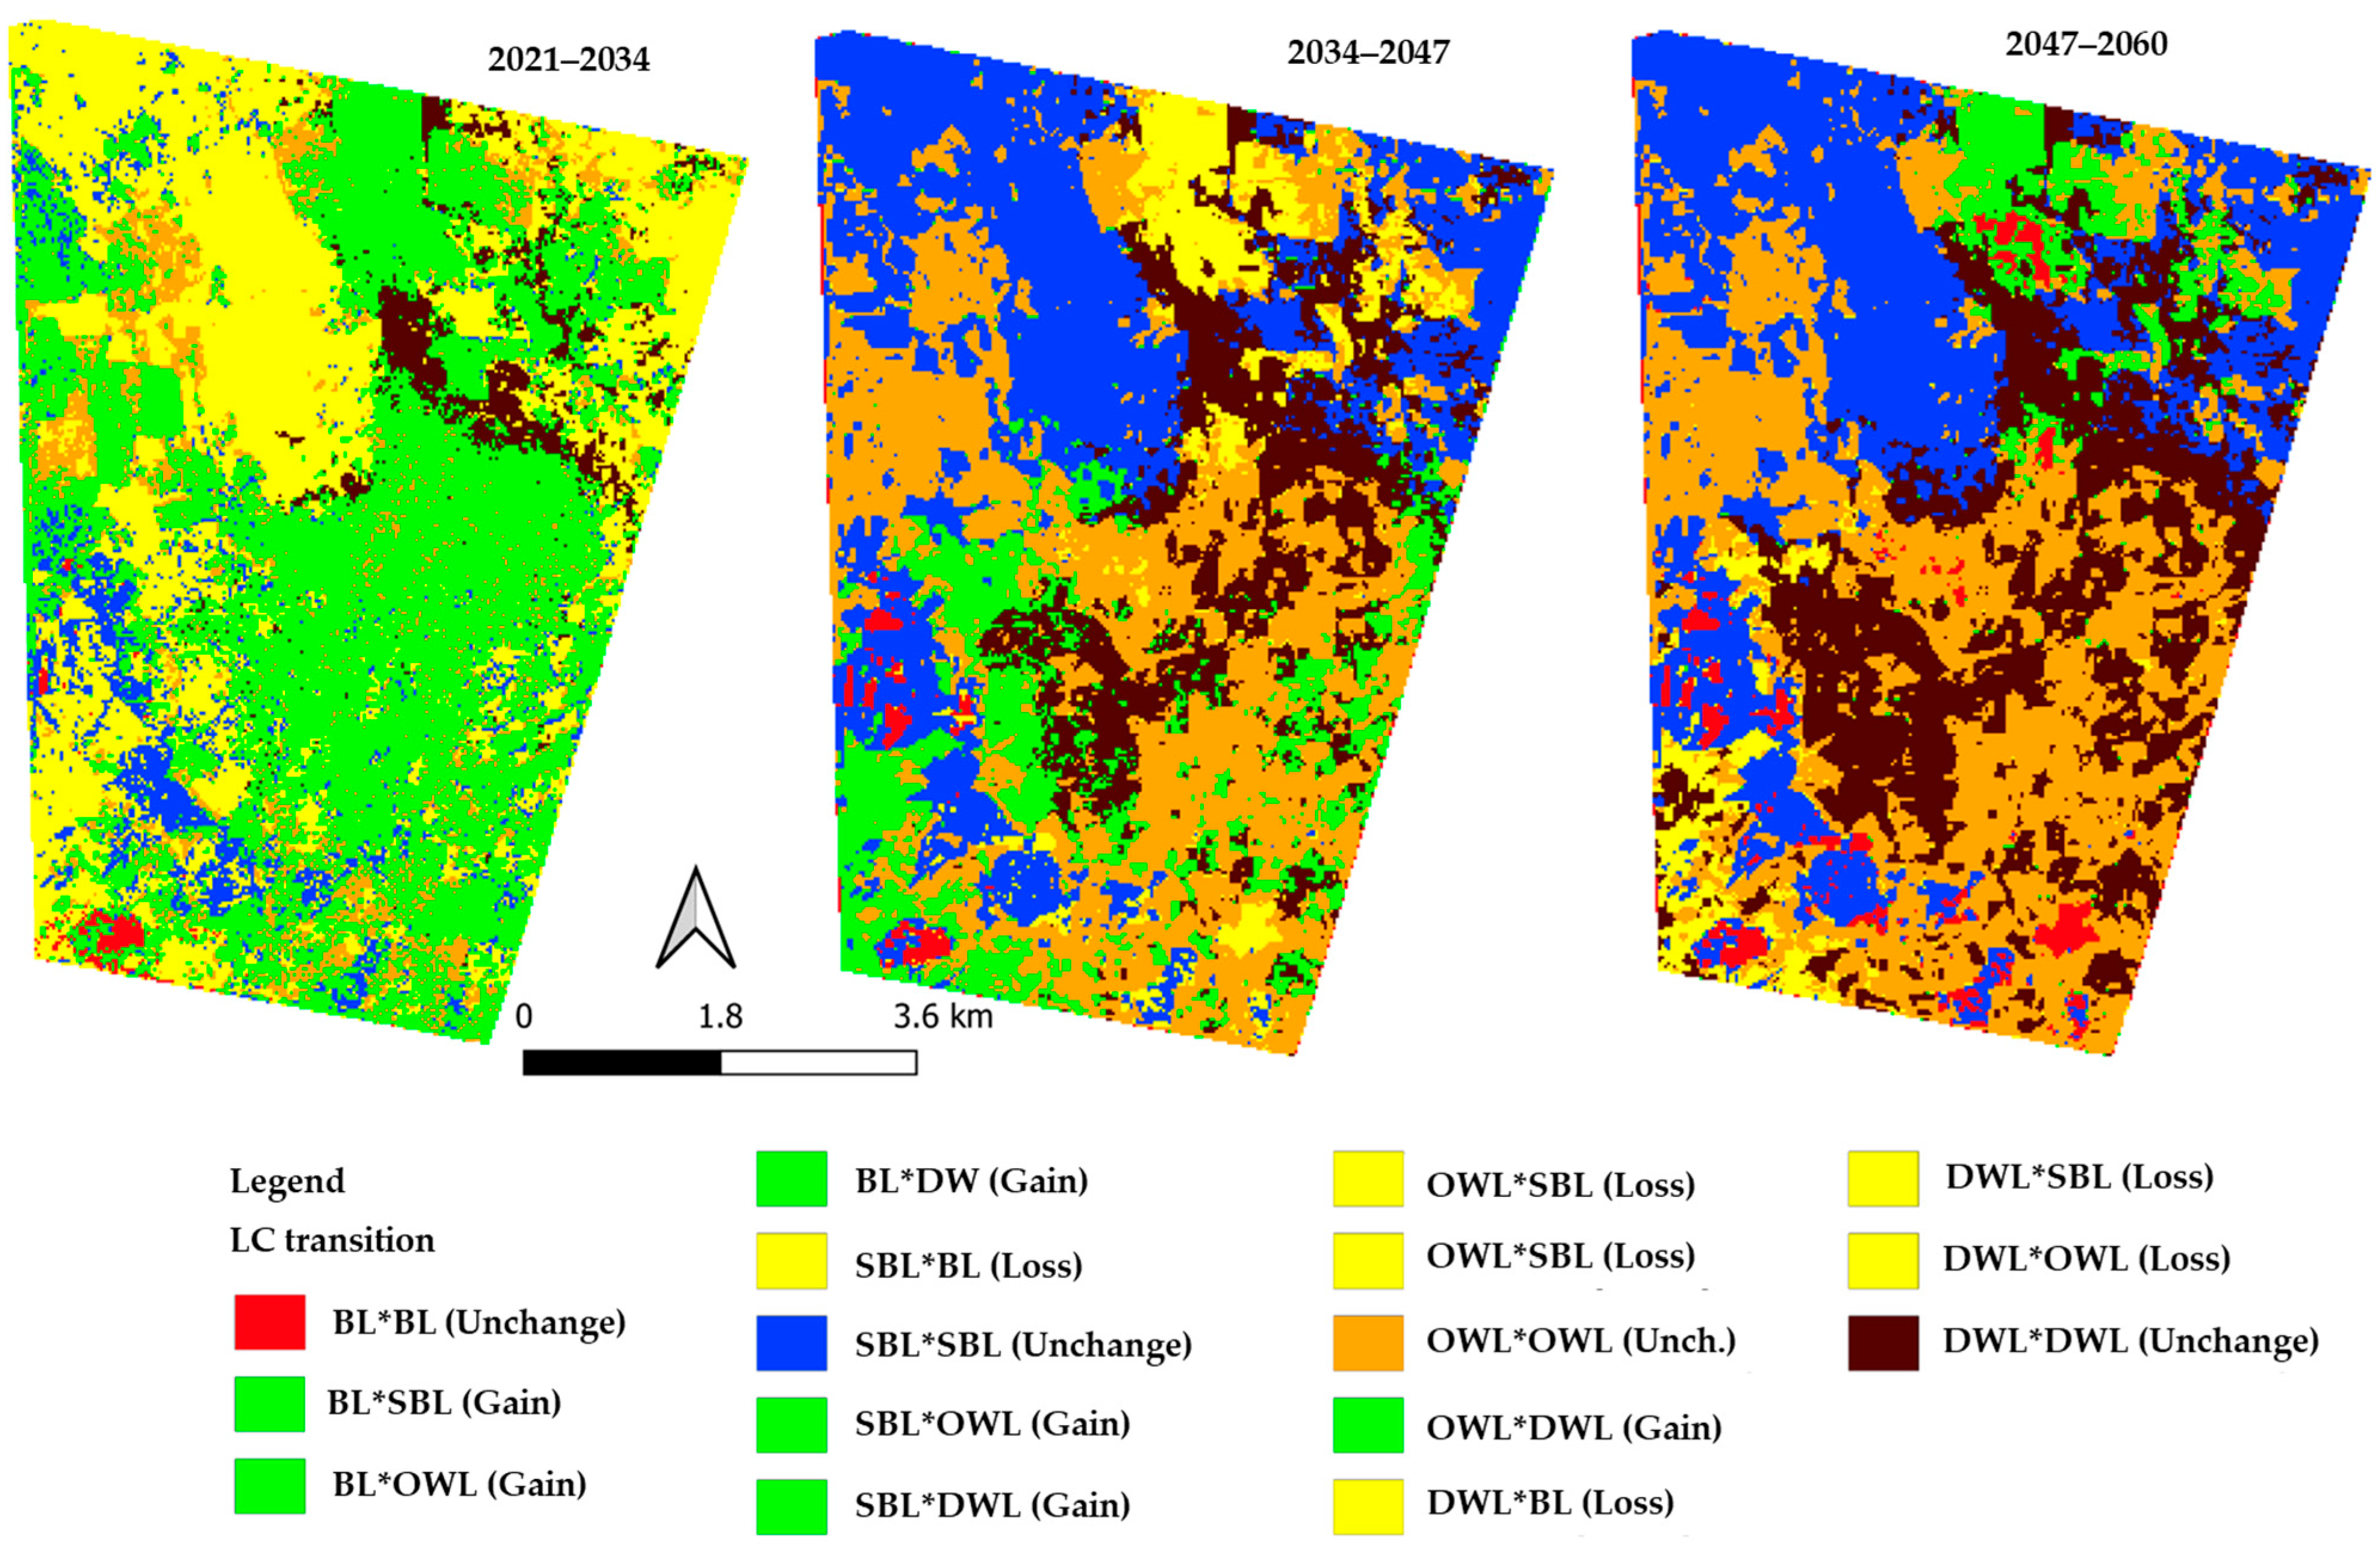
Following validation, the calibrated CA–ANN model was applied to simulate future land cover scenarios for 2034, 2047, and 2060. Transition probability matrices (
Pij) were computed based on observed transitions and combined with ANN-derived suitability maps and CA neighborhood rules. Future land cover states were estimated using the Markov transition framework [
86]:
where
and
represent the LULC states at time
and
, respectively, and
denotes the probability of transition from class
to class
, subject to the constraint [
87]:
The transition matrices, combined with ANN-generated suitability maps and CA spatial allocation rules, were used to generate the final LULC projections for 2034, 2047, and 2060.
4. Discussion
4.1. Forest Decline, Recovery Cycles, and Landscape Transformation
The long-term land cover dynamics in ENFR reveal a landscape undergoing progressive structural transformation driven by the interaction of anthropogenic pressures and environmental variability [
88,
89,
90,
91,
92]. The continuous decline of dense woodland between 1995 and 2021, coupled with the expansion of semi-bare land, indicates a persistent trajectory toward ecosystem degradation typical of semi-arid savanna systems. This pattern reflects a shift from structurally complex vegetation to simplified and fragmented landscapes, consistent with degradation pathways reported in comparable dryland ecosystems [
14,
16,
35,
65,
66,
93].
Although partial recovery of open woodland was observed after 2008, alongside a reduction in bare land between 2008 and 2021, these improvements were spatially limited and insufficient to offset the overall decline in dense woodland. Such localized recovery is characteristic of semi-arid environments, where regeneration occurs opportunistically under reduced disturbance or favorable micro-site conditions, as documented in previous remote sensing–based studies [
43,
45,
47]. However, the dominance of transitions from dense and open woodland to semi-bare land indicates that degradation processes remain more persistent than recovery dynamics.
The extremely low persistence of dense woodland in certain areas (<1% of its original extent) highlights severe canopy loss and fragmentation. This reflects a breakdown in structural integrity and suggests that ecological thresholds may be approaching, beyond which natural recovery becomes increasingly constrained. Similar transitions have been described as early-stage collapse dynamics in dryland woodlands exposed to sustained disturbance and climatic stress [
11,
22,
26,
51,
94,
95]. Overall, these findings indicate that ENFR is undergoing progressive fragmentation and structural simplification, with increasing vulnerability to further degradation.
4.2. Anthropogenic and Environmental Drivers of Degradation
The findings of this study demonstrate that woodland degradation in the Elnour Natural Forest Reserve (ENFR) is primarily driven by anthropogenic pressures, with environmental factors acting as secondary but reinforcing stressors. The dominance of human-induced drivers identified in this study is consistent with broader patterns reported across semi-arid ecosystems in Sudan and sub-Saharan Africa [
16,
35,
65,
66].
Illegal tree cutting and charcoal production emerged as the most influential drivers of woodland degradation. These activities are closely linked to increasing urban energy demand and limited alternative livelihood options, leading to intensified extraction beyond subsistence levels. Similar findings have been widely reported in dryland regions, where charcoal production is a major contributor to canopy loss and structural degradation of woodland ecosystems [
16,
35,
65,
66]. The removal of mature trees not only reduces biomass but also disrupts regeneration processes, resulting in long-term declines in woodland resilience.
Overgrazing was identified as another critical driver influencing woodland dynamics. Continuous livestock movement within and around ENFR limits seedling establishment and alters species composition, favoring disturbance-tolerant species. This pattern aligns with previous studies demonstrating that grazing pressure in semi-arid environments creates persistent regeneration bottlenecks and inhibits woodland recovery [
13,
18,
54,
94,
96]. The combined effect of tree removal and grazing pressure accelerates the transition from dense woodland to more open and degraded land cover types.
Governance-related constraints further intensify these processes. Weak institutional enforcement, unclear land tenure systems, and limited management capacity reduce the effectiveness of conservation measures and enable unsustainable resource use. This finding is consistent with regional studies highlighting governance limitations as a key underlying driver of land degradation in dryland systems [
17].
Socioeconomic dependence on woodland resources also plays a significant role. Local communities rely heavily on fuelwood, charcoal production, and grazing for their livelihoods, particularly in contexts of economic instability and low agricultural productivity. This dependence reinforces extraction pressures and limits the adoption of sustainable resource management practices, as reported in similar socio-ecological systems [
14].
Although environmental factors such as prolonged dry seasons and rainfall variability were found to have a comparatively lower direct influence, they play an important role in shaping ecosystem response. Climatic stress reduces seedling survival, limits vegetation recovery, and increases the vulnerability of already degraded woodland areas. These interactions highlight the role of climate as a stress multiplier that amplifies the impacts of human activities rather than acting as an independent primary driver.
Overall, the interaction between anthropogenic pressures and environmental variability creates a reinforcing cycle of degradation in ENFR. This coupled human–environment system leads to progressive woodland fragmentation, shifts in species composition, and the expansion of degraded land cover types. Such dynamics are consistent with patterns observed in other semi-arid woodland ecosystems, where the combined effects of resource extraction, grazing pressure, and climatic stress drive long-term landscape transformation [
16,
65,
66,
97].
4.3. Ecological Implications of Historical and Future LC Change
The observed historical and projected land cover dynamics have important ecological implications for ENFR. The decline of dense woodland reduces habitat availability, disrupts ecological connectivity, and limits the persistence of key functional species that sustain ecosystem processes in dryland environments. These changes weaken ecosystem stability and reduce resilience to external disturbances.
The expansion of semi-bare land reflects a transition toward degraded states characterized by increased soil exposure, reduced vegetation cover, and higher susceptibility to erosion. This pattern is consistent with ecological degradation trajectories reported in semi-arid landscapes, where repeated disturbance leads to reduced regenerative capacity and shifts toward low-productivity vegetation mosaics [
13,
18,
54,
96,
97]. The persistence of semi-bare land suggests that portions of the landscape may be approaching a stable degraded equilibrium, where natural recovery is limited without external intervention.
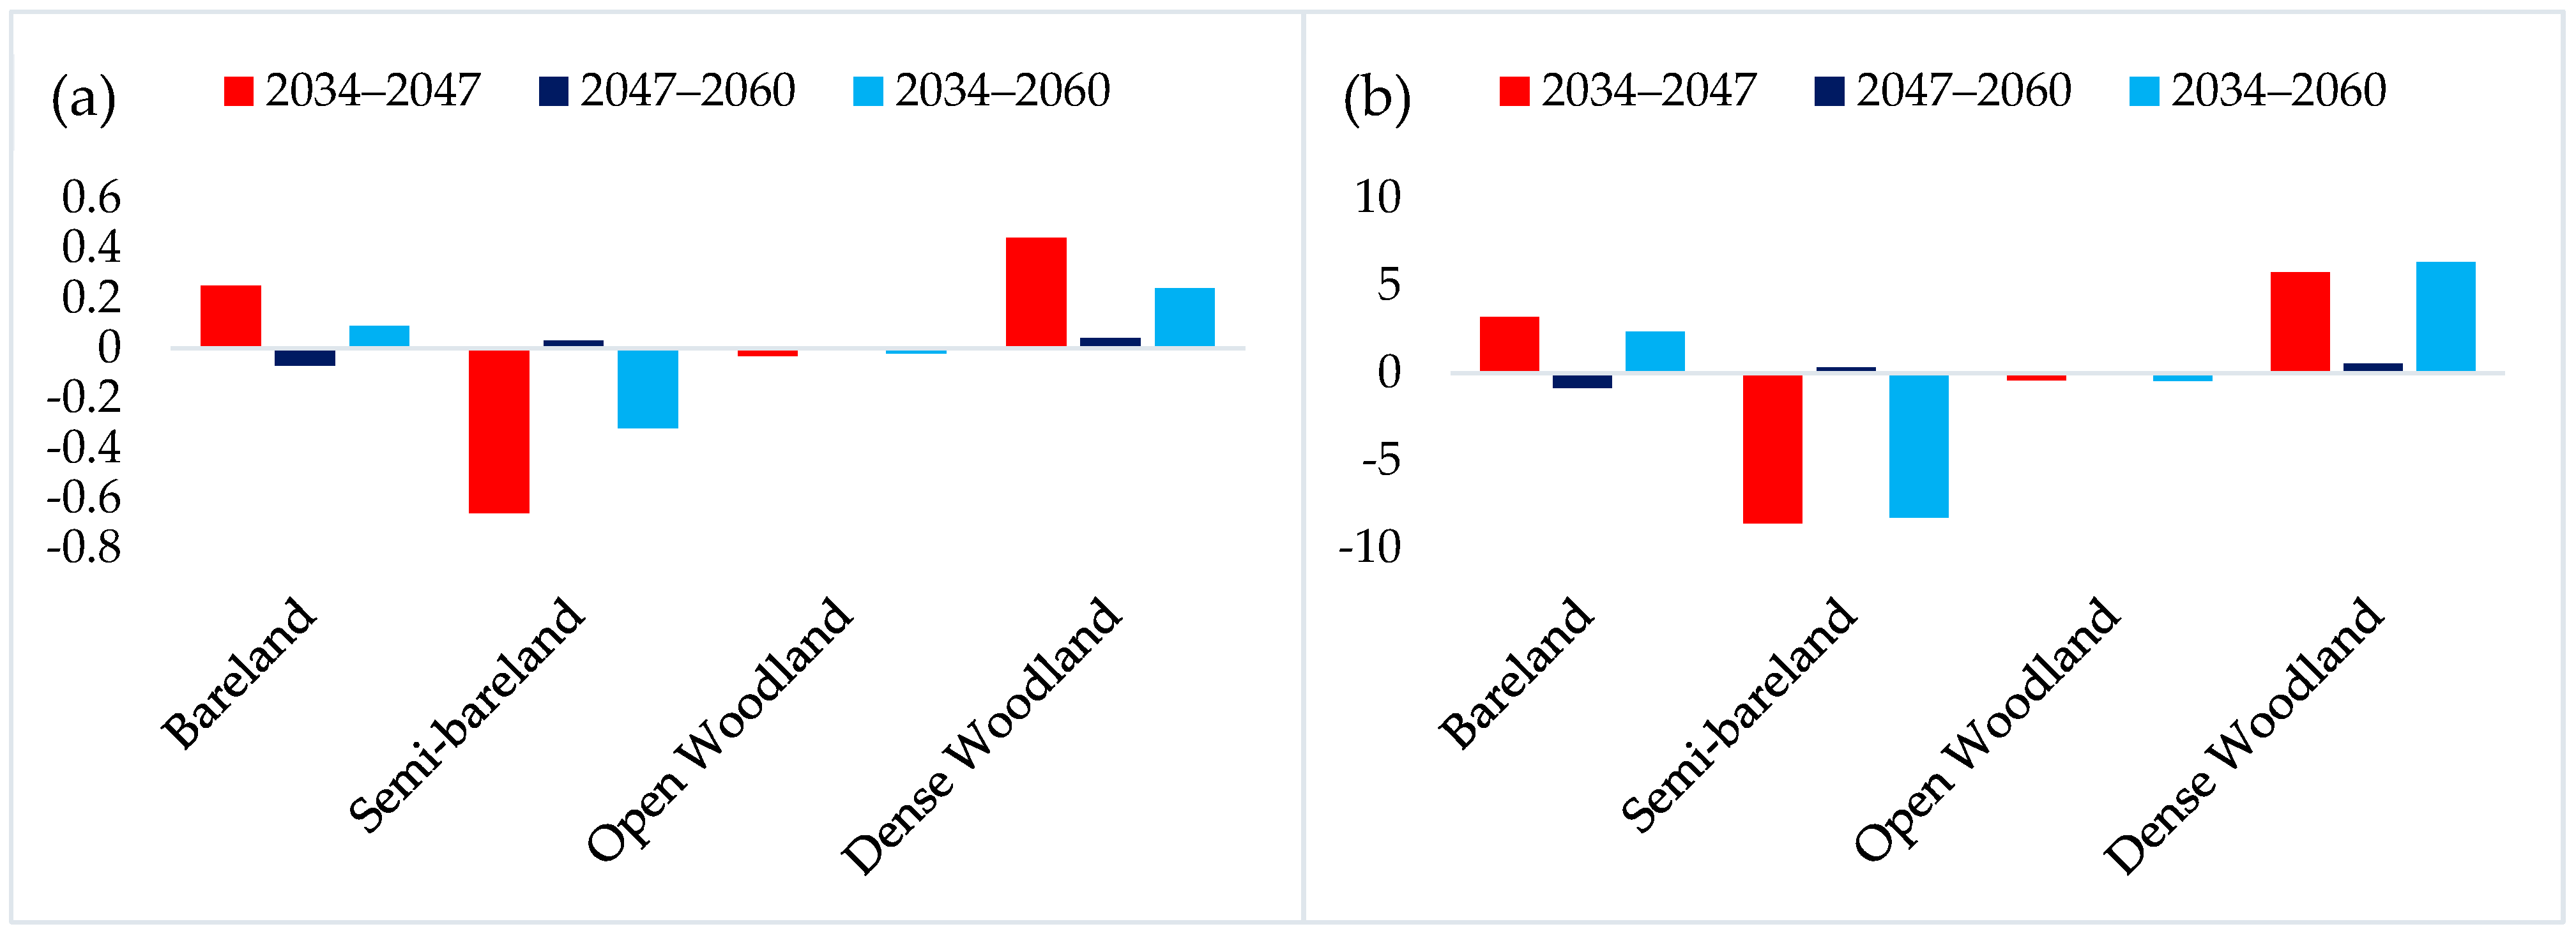
Future projections indicate a moderate increase in dense woodland; however, this recovery remains spatially constrained and does not fully compensate for historical losses. The relative stability of open woodland suggests that this class functions as a transitional state, mediating shifts between dense vegetation and degraded land cover. Similar transitional dynamics have been reported in other dryland systems, where intermediate canopy cover plays a critical role in regulating ecosystem responses to disturbance [
43,
45,
66,
94].
Despite indications of partial recovery, the continued dominance of semi-bare land and fluctuating bare land highlights the persistence of degradation processes. These findings suggest that ENFR is transitioning toward a more fragmented and less resilient ecosystem, consistent with landscape patterns observed in other semi-arid woodland environments [
47,
83].
4.4. Interpretation of Future Landscape Stability and Vulnerability
The CA–ANN-based projections provide insights into the balance between recovery potential and ongoing vulnerability in ENFR. The persistence of semi-bare land across future scenarios indicates that degraded states may become increasingly stable over time, particularly in the absence of active management interventions. This aligns with regional studies showing that semi-bare land often represents a critical ecological bottleneck limiting woodland recovery in semi-arid environments [
54,
83,
93,
96,
97].
The projected increase in dense woodland suggests that certain areas retain the capacity for regeneration, likely due to localized reductions in disturbance or favorable environmental conditions. However, this recovery is uneven and does not represent a system-wide reversal of degradation trends. Similar patterns have been reported in dryland forests, where recovery occurs in patches rather than across the entire landscape [
11,
16,
55,
95].
The gradual transition of bare land into vegetated classes in future scenarios indicates potential for passive restoration [
53,
83,
98]. However, the long-term stability of open woodland further emphasizes its role as an intermediate state controlling transitions between degraded and dense vegetation. These dynamics highlight the importance of spatial heterogeneity in shaping landscape trajectories [
14,
35,
66].
Overall, the projections indicate that ENFR remains vulnerable to continued degradation under current conditions. The coexistence of localized recovery and widespread degradation reflects a system operating near critical thresholds, where small changes in disturbance regimes or climate conditions may lead to disproportionate landscape responses. This reinforces the need for targeted interventions to shift the system toward more stable and resilient states.
4.5. Management and Policy Recommendations for ENFR
The observed land cover dynamics highlight the need for targeted and integrated management strategies to enhance ecosystem resilience in ENFR. Given the dominant role of anthropogenic drivers, strengthening forest governance is essential. Improved enforcement mechanisms, participatory management approaches, and clear land tenure systems can reduce uncontrolled resource extraction, as demonstrated in similar dryland contexts [
16,
18,
66,
88,
94].
Reducing pressure on woodland resources requires diversification of livelihoods and the promotion of alternative energy sources to decrease dependence on charcoal production. Restoration efforts should prioritize semi-bare land areas, which represent the most persistent degraded class, through interventions such as assisted natural regeneration, enrichment planting, and controlled grazing management [
18,
54,
65,
66,
96].
The relative stability of open woodland suggests that it represents a strategic target for restoration, where interventions can enhance recovery trajectories. In addition, improving agricultural productivity outside of forest areas may reduce expansion pressure on woodland margins.
Continuous monitoring of land cover dynamics is essential for adaptive management. Remote sensing–based approaches provide valuable tools for tracking changes and identifying emerging degradation hotspots, supporting evidence-based decision making in data-limited environments [
14,
35,
45,
75].
4.6. Limitations and Uncertainty of the CA–ANN Modeling Approach
While the CA–ANN framework provides a robust basis for simulating future land cover dynamics in ENFR, several sources of uncertainty influence the reliability of long-term projections.
First, uncertainty arises from input data quality, including the spatial resolution, temporal consistency, and representativeness of historical land cover maps and driving variables. Errors or inconsistencies in these inputs may propagate through the modeling process and affect the stability of simulated outcomes [
51,
52,
99].
Second, the CA–ANN model assumes temporal stationarity, whereby historical transition patterns and relationships between land cover change and driving factors remain constant over time. However, rapid socio-economic or governance changes, such as fluctuations in charcoal demand, shifts in grazing intensity, or expansion of agricultural activities, may alter these relationships, thereby reducing the predictive reliability of long-term simulations [
83,
97,
100].
Third, model outputs are sensitive to parameterization, including neighborhood configuration, transition thresholds, and the relative influence of driving variables. Variations in these parameters can affect both the magnitude and spatial allocation of simulated land cover transitions, particularly in ecotonal zones such as woodland, semi-bare land interfaces [
51,
101].
Fourth, certain drivers of land cover change are difficult to quantify or were not explicitly included in the modeling framework. Factors such as informal resource extraction, variability in policy enforcement, extreme climatic events (e.g., drought), and conflict-induced population displacement may lead to abrupt or non-linear changes that are not fully captured by the model.
Finally, uncertainty increases with the projection horizon. While the CA–ANN model demonstrates reliable performance for short- to medium-term simulations, projections extending beyond two decades inherently accumulate uncertainty. Therefore, the projected land cover patterns for 2047 and 2060 should be interpreted as plausible scenario-based outcomes rather than precise predictions, particularly in semi-arid ecosystems characterized by high environmental variability and socio-economic sensitivity [
52,
97,
99,
101,
102].
In addition to the qualitative assessment of uncertainty, model reliability was evaluated through comparison between the simulated and observed 2021 land cover maps (
Figure 10). The results demonstrate a strong level of spatial agreement for dominant classes such as Semi-bare land and Open Woodland, indicating that the model effectively captures the overall landscape structure. However, discrepancies observed in transition zones, particularly between Open Woodland and Semi-bare land, highlight areas of higher uncertainty associated with localized land cover dynamics and classification sensitivity. These findings reinforce that the CA–ANN projections should be interpreted as scenario-based outcomes rather than exact predictions.
5. Conclusions
This study demonstrates a clear long-term transition in the ENFR from dense woodland to predominantly lower-density and degraded land cover classes over the period 1995–2021. The results indicate a continuous decline in dense woodland, a substantial expansion of semi-bare land, and limited persistence of intact vegetation, reflecting significant structural transformation of the landscape. Future projections based on the CA–ANN framework suggest partial recovery of dense woodland; however, semi-bare land is expected to remain the dominant class through 2060, indicating continued ecosystem vulnerability.
By integrating multi-temporal classification using the Random Forest algorithm with spatially explicit CA–ANN modeling, this study provides a comprehensive assessment of both historical land cover dynamics and potential future trajectories in a semi-arid woodland environment. The findings highlight the persistence of degradation patterns alongside localized recovery processes, emphasizing the complexity of landscape dynamics in dryland ecosystems.
The study contributes to land cover research by demonstrating the applicability of combining machine learning classification and spatial simulation approaches for analyzing long-term changes and projecting future scenarios in data-limited regions. This integrated framework improves understanding of land cover transitions and provides a basis for evaluating potential future landscape conditions.
Future research should incorporate additional socio-ecological variables, such as spatially explicit grazing intensity, resource extraction patterns, and local land-use practices, to improve model representation of driving processes. The application of multi-model approaches and higher-resolution datasets may further enhance the robustness of projections and reduce uncertainty. In addition, field-based observations of vegetation structure, regeneration dynamics, and soil conditions are needed to support model calibration and validation.
Overall, advancing integrated approaches that combine remote sensing, spatial modeling, and socio-ecological analysis will be essential for improving the assessment and monitoring of land cover dynamics in semi-arid woodland ecosystems.