Article

Decadal and Heterogeneous Deformation of Breakwater Dams and Reclaimed Lands in Xuwei Port Revealed by Radar Interferometry Measurements

1
School of Geosciences and Info-Physics, Central South University, Changsha 410083, China
2
Hunan Research Institute of Water Resources and Hydropower, Changsha 410007, China
3
Hunan Engineering Research Center for Dam Safety and Disease Prevention & Control, Changsha 410007, China
4
Department of Land Surveying and Geo-Informatics, The Hong Kong Polytechnic University, Hong Kong, China
5
Geomatics Engineering Lab., Public Works Department, Faculty of Engineering, Cairo University, Al Giza 12613, Egypt
*
Author to whom correspondence should be addressed.
Remote Sens. 2025, 17(16), 2778; https://doi.org/10.3390/rs17162778
Submission received: 17 July 2025 / Revised: 8 August 2025 / Accepted: 8 August 2025 / Published: 11 August 2025
(This article belongs to the Special Issue Advances in Surface Deformation Monitoring Using SAR Interferometry)

Abstract

Breakwater dams are critical infrastructures that protect the safety of ports. However, these coastal structures are facing the compounding threats of sea level rise, storm surge, and dam subsidence. Heterogeneous deformations in these infrastructures arise from differential construction sequencing, sediment consolidation, and filling materials, yet traditional in situ monitoring remains spatially limited or even unavailable to trace back and continuously monitor deformation evolutions. In contrast, Interferometric Synthetic Aperture Radar (InSAR) offers valuable insights in providing the spatially and temporally covered dam deformation. In this study, we used two Sentinel-1 tracks from 2016 to 2025, and the persistent and distributed scatterers InSAR methods to map the long-term deformation of Xuwei Port, Lianyungang, China. We utilized six sites of leveling measurements to validate the InSAR-derived vertical deformation and indicate Root Mean Square Errors (RMSEs) ranging from −0.9–1.2 cm. We find, for the rock-sand filled section, the deformations show consolidating subsidence ranging from −63.8 cm to −40.6 cm. In contrast, the concrete tubular structure remains stable, with cumulative deformation ranging from −10.6 cm to −5.2 cm. The enclosing reclaimed land undergoes a period of accelerated settlement with subsidence rates of −64.9–−39.3 cm/yr, which are higher than original subsidence rates of −10.1–−9.7 cm/yr. Additionally, we integrated the consolidation model and tide gauge to quantify that the freeboard will decrease to 0.08–0.31 m in the following 100 years with the continuous sea level rise and dam subsidence. This study benefits our understandings of coastal dam and reclaimed land. It highlights InSAR as a valuable tool to evaluate the critical risk between sea level rise and coastal infrastructure subsidence.

1. Introduction

The subsidence of port facilities decreases the elevation between sea level and the foundations of structures, inherently increasing the flooding and storm surge risks [1]. Global climate change, particularly sea level rise and frequent extreme weather, further intensifies these risks for low-lying infrastructures worldwide [2]. As the harbor facilities support global supply chains and international trades, and sustain the coastal industries and populations, controlling and adapting to land subsidence in harbors is urgently needed [1,3]. The driving factors for harbor subsidence are diverse, including sediment compaction, building construction, and groundwater extraction [4,5,6,7]. Moreover, land reclamation activities expand seaward development and elevate subsidence risks in areas where most docks are located [8]. Therefore, considering the external deformation as an important indicator regarding structural health [9], accurate and continuous deformation monitoring of port infrastructures is critical for risk control and early hazard warning.
Different from conventional in situ deformation monitoring techniques, Interferometric Synthetic Aperture Radar (InSAR) provides a broader spatial coverage for surface deformation [10,11]. This technique features weather independence, labor-free, and high-spatial resolution. It is widely applicable to monitor flood-resilient infrastructures [12,13,14,15]. For instance, Hassen and van Leijen (2008) pioneered the monitoring of linear water defense levee deformation using the European Remote Sensing satellite (ERS) data from 1990s [16]. By assuming that adjacent points along the neighboring one-dimension arc experience limited differences in atmospheric delay, phase ambiguity, and elevation error, computational complexity was reduced and full-stack analysis was conducted. Their results indicated a 5 mm/yr line-of-sight (LOS) deformation in the local site of the Hondsbossche dike, Netherlands. Pros et al. (2014) applied a persistent scatterers (PS) analysis to monitor the breakwater dams in Port of Barcelona, Spain, using the TerraSAR-X (TSX) and Radarsat-2 data [17]. The kriging interpolation of the PS points revealed a clear subsidence with velocities of 8–16 cm/yr at the northeastern end of the southern breakwater, and 8–18 cm/year at the southern end of the eastern breakwater. This significant subsidence decelerated between 2009 and 2010, indicating consolidation via pore-water dissipation and soil compaction. Similarly, COSMO-SkyMed (CSK) data from 2011–2016 recorded a maximum LOS displacement rate of 2.7 cm/yr at the arc-shaped offshore dike in Gela port, Italy [18]. Recently, multi-track Sentinel-1 (2016.10–2021.12) and TSX (2016.4–2017.4) observations during overlapping periods revealed high correlation (>0.8) in a 9.6 km-length embankment in Shandong, China [19]. Compared with the medium resolution Sentinel-1 data (~5 × 20 m), these high resolution TSX data (~3 × 3 m) provide the denser and completed spatial coverage to reveal fine dam structure, such as outlet, spillway, and abutment [9]. At the riverbed section of the Upper Atbara dam, Sudan, InSAR-derived deformation matched well with leveling data with a 2 mm/yr discrepancy in the vertical direction. The pattern of deformation was linked to the impoundment of the reservoir and the embankment filling heights [20]. InSAR-based measurement has further predicted coastal embankment subsidence exceeding 100 cm due to the compaction of the foundation and dam itself [21]. The InSAR derived deformation in the long-linear dike can also be employed for the hazard warning and causality analysis. For example, the uneven settlement with more than 5 cm in a 200 m breach section was detected by Sentinel-1 at a 28-km U-shaped dam, Uzbekistan, before the final dam failure in May 2020 [22,23]. Additionally, InSAR-measured coastal levee subsidence enables long-term inundation risk assessment, exemplified by Gudong Dam, China, which could submerge by the 2100s at current subsidence and sea level rise [24].
Although the existing studies demonstrate InSAR’s capability in monitoring water defense infrastructures, research gaps remain in applying and evaluating InSAR measurements to coastal dams over decadal timescales, and across diverse dam structures (e.g., rockfill and concrete). Such long-term, multi-structure analysis is essential to reveal deformation dynamics throughout port construction and operational phases. In addition, considering the 10–20 m width of coastal dams, the monitoring capability and applicability of medium resolution SAR data (~10–20 m) deserves to be evaluated. We therefore focus on Xuwei Port, China, which was constructed between 2012 and 2018. This port features two major breakwaters (east and west) totaling 21.8 km in length. Prior studies reported preliminary subsidence rates of 10–20 cm/yr during 2016–2017 (Sentinel-1) [25], and 2017–2018 (Radarsat-2) [26]. Yet, spatial coverage was limited to breakwater segments with only 2 years of observation.
The remainder of this paper is organized as follows: Section 2 provides detailed information regarding Xuwei Port, including its construction timeline and dam structures, followed by the InSAR data processing and post time-series deformation analysis. Section 3 reports the result of InSAR-derived deformation, accuracy assessment, and spatiotemporal evolution patterns. In Section 4, we discuss deformation mechanisms across dam structures and implications for sea level rise scenarios. Section 5 summarizes key findings and conclusions.

2. Materials and Methods

2.1. Study Area

Xuwei Port (34.6°N, 119.6°E) is situated in Lianyungang City, Jiangsu Province, China. It borders the Yellow Sea and occupies 22 km of the coastline (Figure 1a). According to tidal gauge records from the last two decades, the mean sea level is 2.96 m with a tidal difference of 3.65 m [27]. Sediments primarily originate from wave-induced coastal erosion, forming marine soft soil strata dominated by silt, clay, and mud. These deposits average 13–15 m in thickness, locally reaching up to 20 m [28]. The port comprises 25 berths supporting 300,000-ton oil industry transportation. Construction commenced in November 2012 and concluded in July 2018. Two breakwaters, western (9.6 km) and eastern (12.2 km), protect the harbor against maximum wave heights of 7 m [29]. Both breakwaters incorporate two structural types: rock-sand fill dams and precast tubular concrete dams (Figure 1c, d).
Rock-sand fill dams span 6.8 km along the western breakwater and 8.0 km along the eastern breakwater (Figure 1a) [29]. These structures consist of rock-sand composite embankments with a standard profile height of 8 m and cross-section length of 75 m (Figure 1c). The width of the dam crest is 10 m, with both the harbor-side and seaward slope ratio at 1:1.5. Foundations extend through 20 m thick clay-silt-sand strata, while operational water levels range from 0.5 to 5.4 m above a basal clay layer at −4.2 m. Tubular concrete dams employ prefabricated installation with 2.8 km and 4.2 km in western and eastern sides, respectively (Figure 1a). Each unit comprises a lower tier of rectangular concrete tubes (30 × 20 × 10 m) surmounted by parallel upper tubes (13 m in height) (Figure 1d) [30]. This design enables rapid assembly independent of wind conditions. It also reduces sand material consumption and accommodates deep-water deployment with larger than 4.5 m in depth.
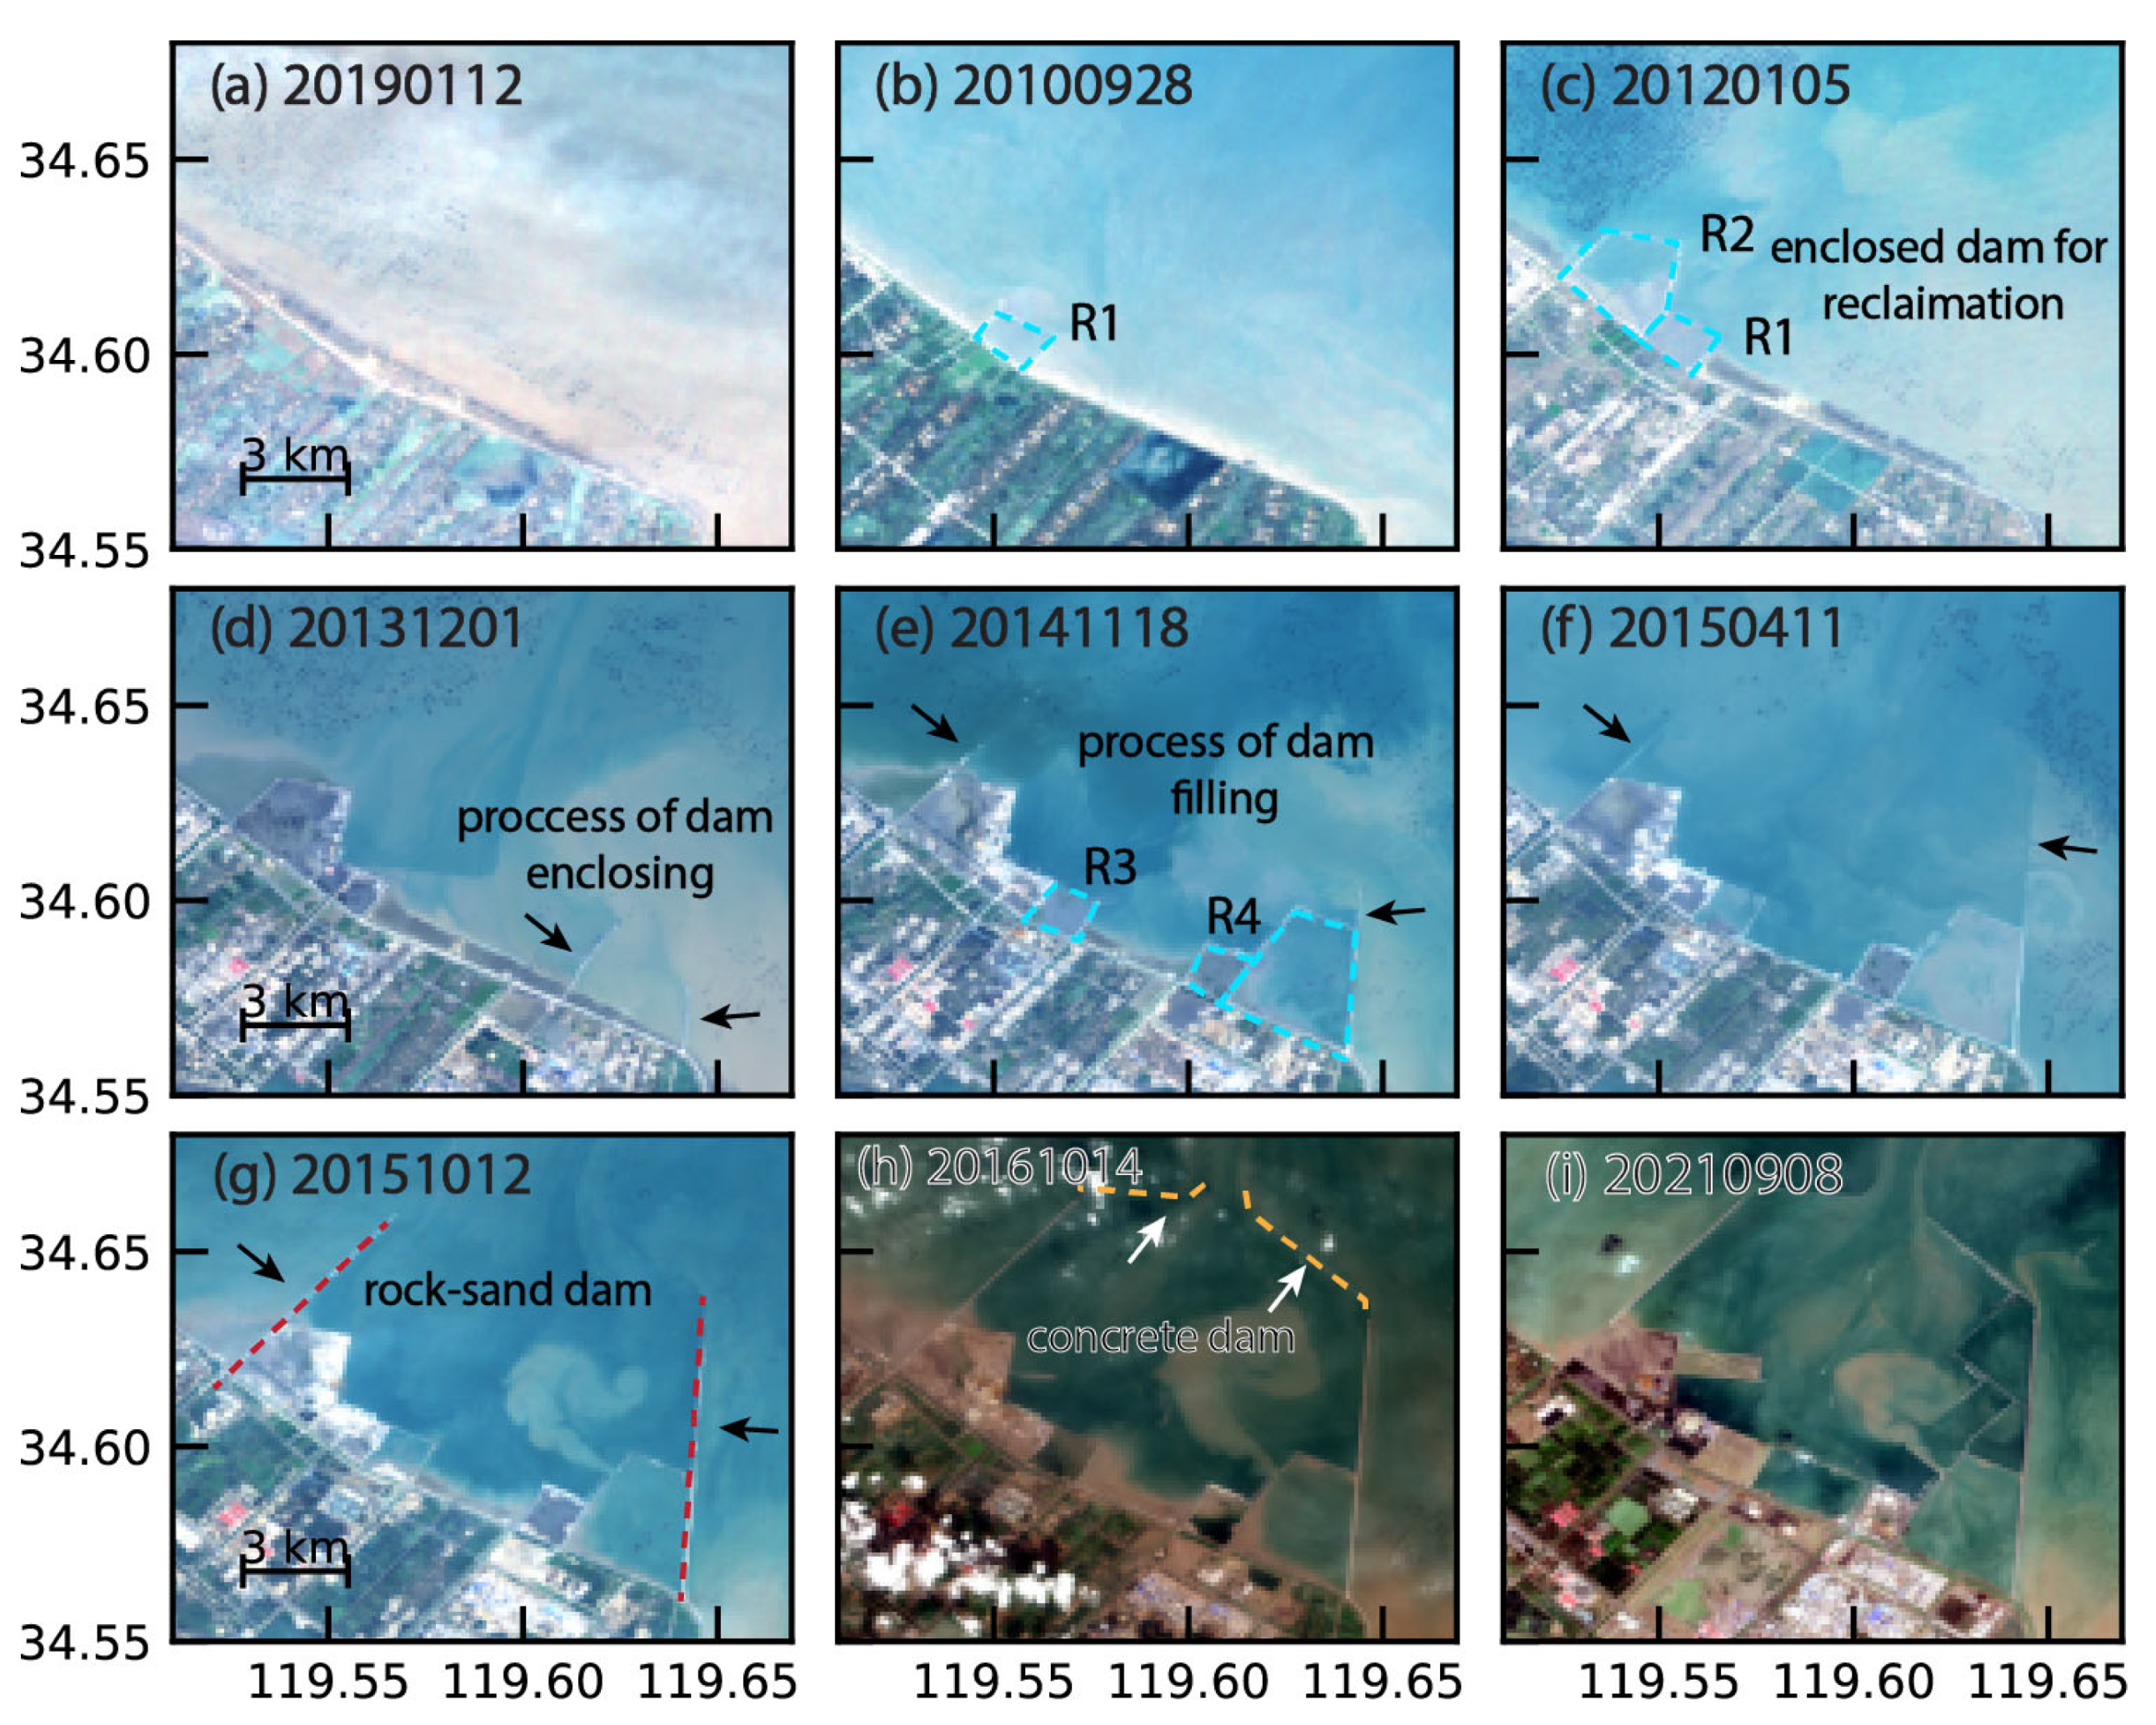
We used Landsat-7/8 and Sentinel-2 optical imagery (2009–2021) to track the construction process of the dam and reclamation through three sequential phases (Figure 2). Before 2009, satellite observations show the original coastline and confirm construction activity has not started (Figure 2a). Construction phase 1 commenced in September 2010 with land reclamation closure levee construction at Zones R1 and R2, completed by January 2012 (Figure 2b,c). The subsequent phase 2 was initiated in December 2013, executing on eastern section levees through November 2014 (Figure 2d,e). Concurrently, during November 2014 and October 2015, rock-sand dam segments were progressively filled along both breakwater flanks (Figure 2e–g). The final construction stage involved installations of prefabricated concrete tube dam, commencing at the end of 2015 and concluding in September 2016 (Figure 2h,i).

2.2. InSAR Data Processing

According to the timeline of construction procedure, Sentinel-1 data from September 2016 onward (post-construction completion) were selected for analysis (Table 1). We processed TOPS-mode imagery from both ascending (Track 69) and descending (Track 76) orbits. Given the port’s spatial extent (20 km × 20 km) relative to the full Sentinel-1 frame (250 km × 250 km), analysis focused exclusively on a single IW-mode burst (80 km × 25 km). Due to the decommission of descending track 76 in 2022, only pre-2022 data were utilized. In general, the dataset comprises 307 ascending and 140 descending images, spanning September 2016 to March 2025 and October 2016 to December 2021, respectively.
We processed SAR Single-Look Complex (SLC) data using the InSAR Scientific Computing Environment (ISCE2) [31], with primary images designated as 5 April 2020 (ascending) and 23 May 2020 (descending). Since a single burst can fully cover the study area, range-direction co-registration was conducted by geometry-based method using precise orbits and a 30 m resolution SRTM-DEM. No azimuth direction offsets are estimated. Following co-registration, PS were identified using an amplitude dispersion threshold D A of <0.30:
D A = σ A μ A
in which σ A and μ A are the standard deviation and average of the amplitude over time. The distributed scatterers (DS), as statistically homogeneous pixels (SHPs), were determined via the conventional Kolmogorov–Smirnov test with a 95% confidence level. The covariance matrix C ^ of the identified DS can be estimated by the following Equation (2) [32]:
C ^ i j = E x x H = 1 M x Ω   x x H
where x denotes the set of centered pixels, E · is the expectation operator, H represents the Hermitian conjugate (i.e., conjugate transpose), M is the number of homogeneous points, and Ω defines the set of SHPs. The wrapped phase history of the identified distributed scatterers is reconstructed via eigenvalue decomposition-based maximum likelihood estimation following the method of [33]. This identifies the dominant scatterer through the principal eigenvector of the coherence matrix, as follows:
Γ ^ i j 1 C ζ ^ = λ m i n ζ ^
in which Γ ^ is normalization of covariance matrix C ^ , as
Γ i j = C i j x M   A x i 2 x M   A x j 2
where A x i is the amplitude of pixel x at time epoch i . Here, C is sample covariance matrix, λ m i n corresponds to the minimum eigenvalue whose eigenvector ζ ^ yields the optimal phase solution, and denotes the Hadamard product.
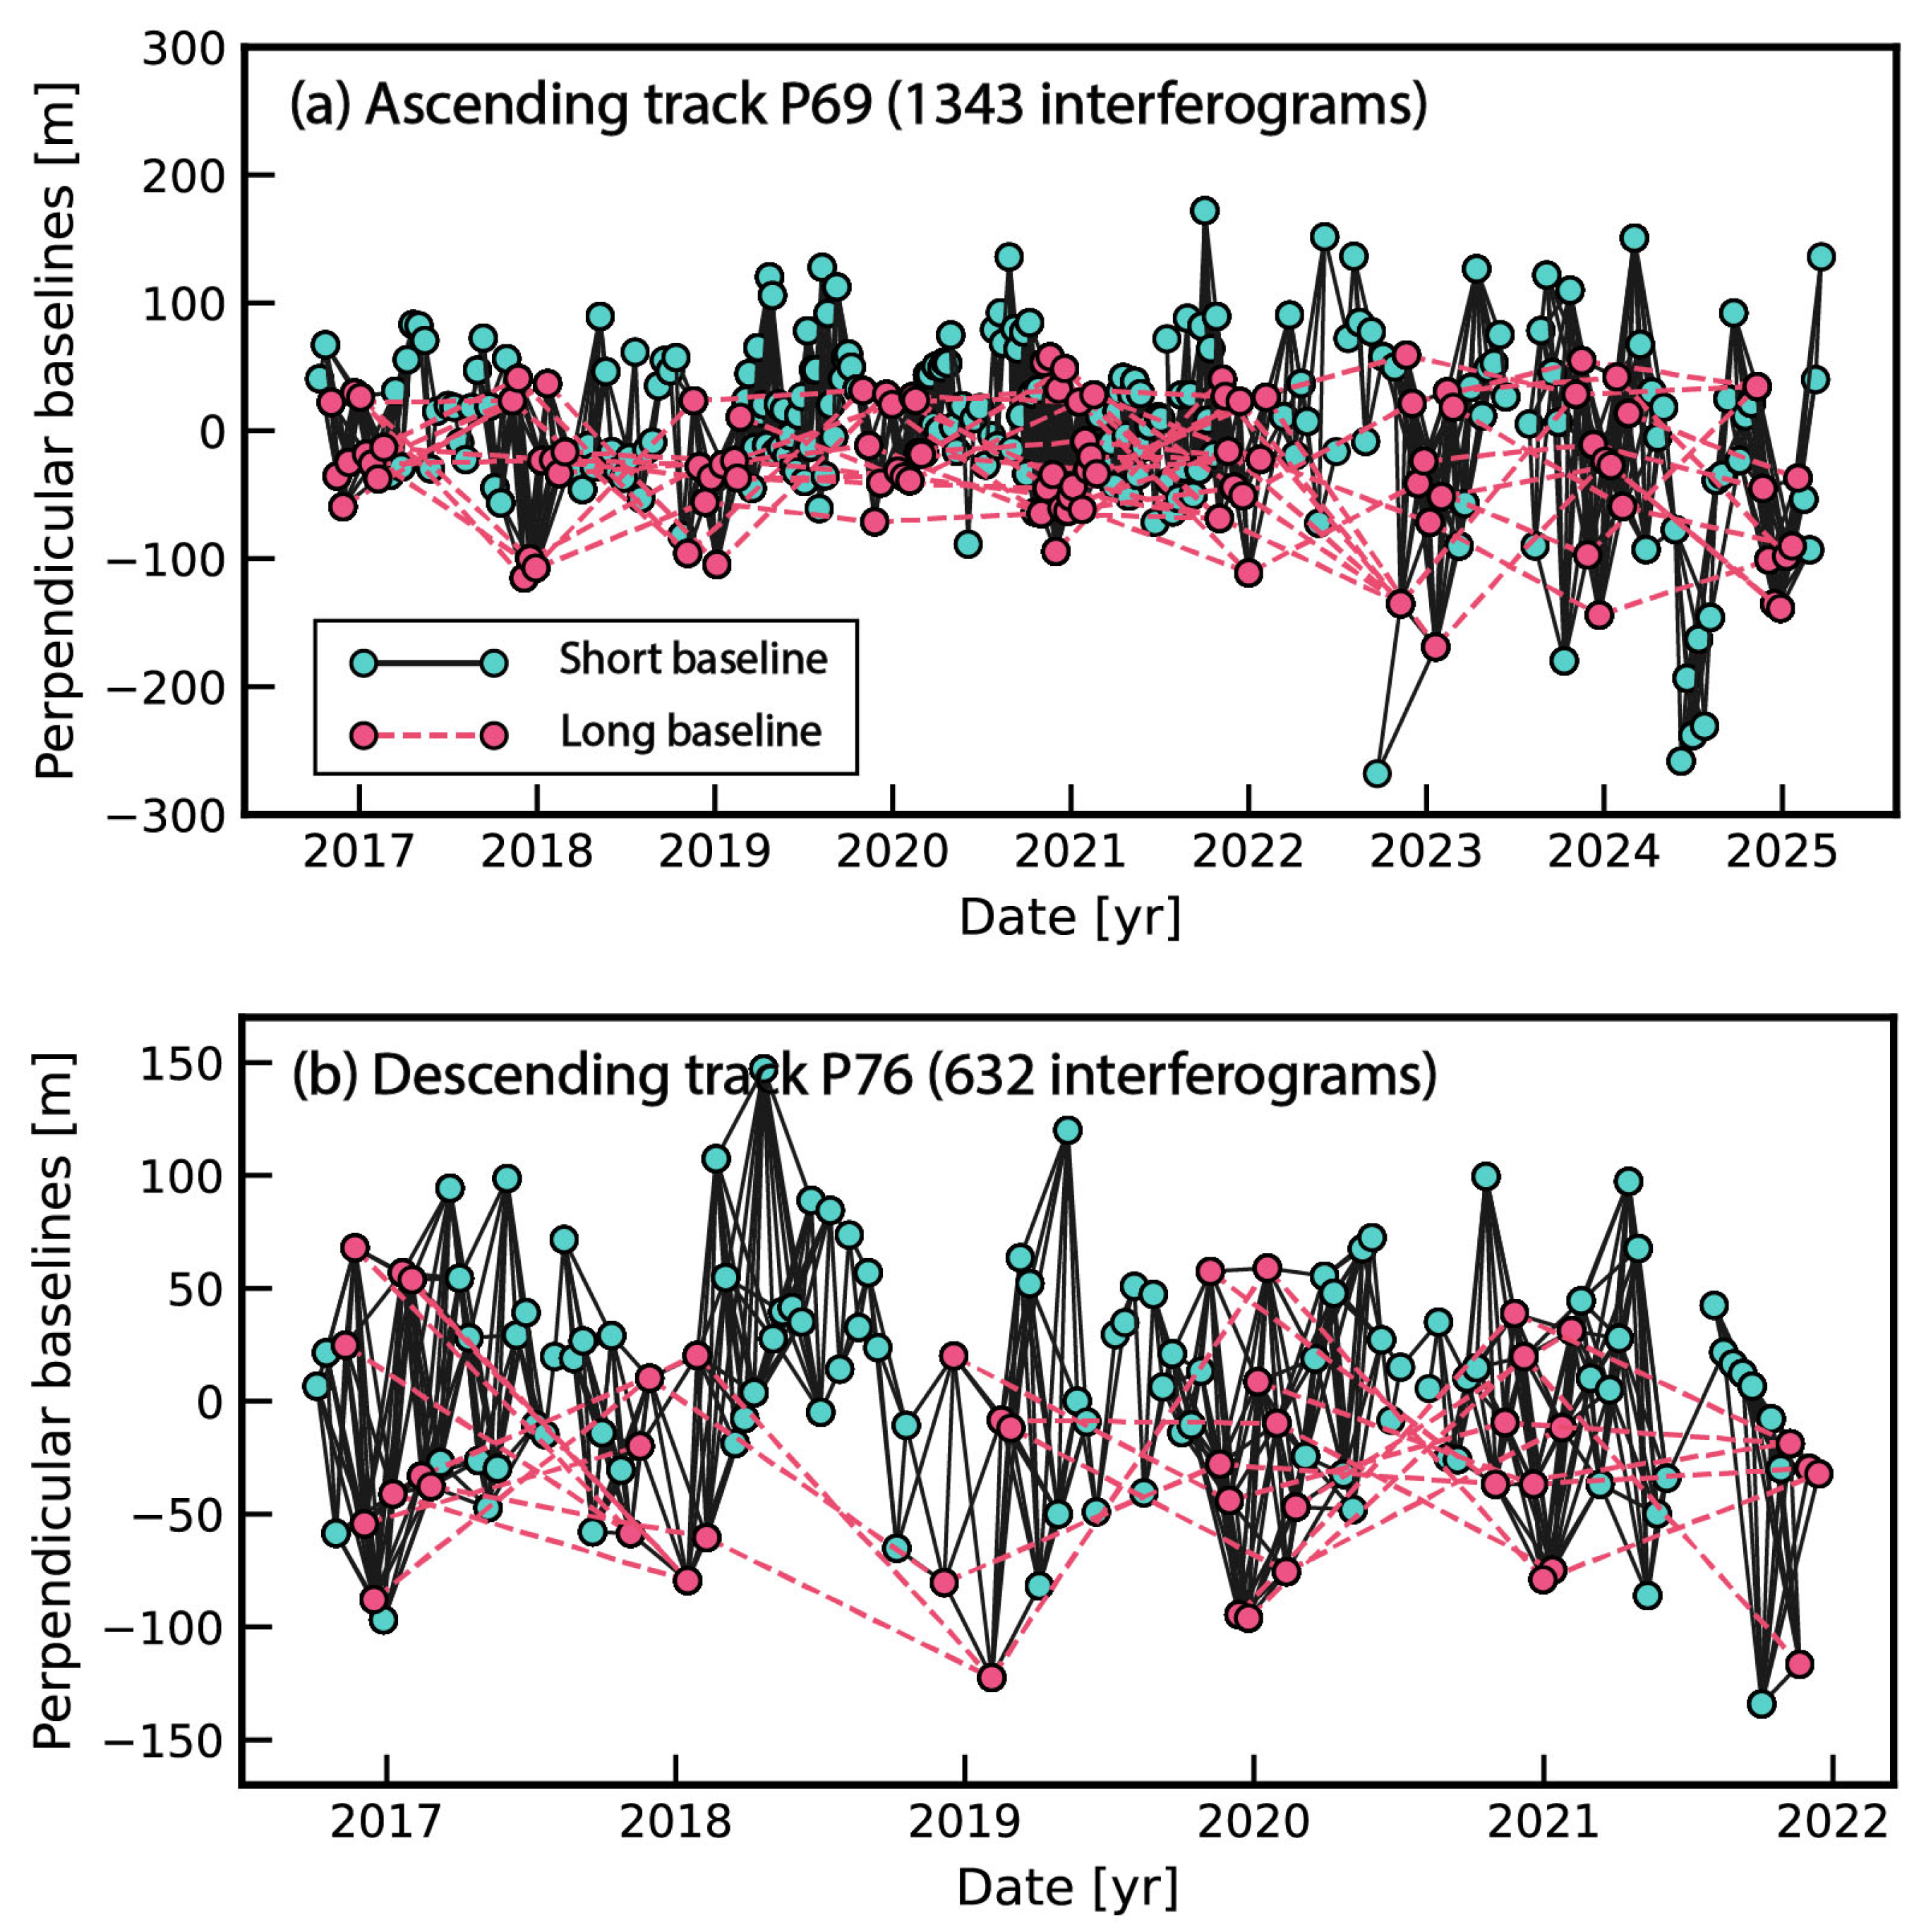
Following the scatterer identification and phase optimization, we established a short-baseline network with temporal and spatial thresholds of 75 days and 200 m, generating 1253 ascending and 599 descending interferograms (Figure 3). To capture long-term deformation at breakwater dams and adjacent infrastructure, we incorporated annual winter baselines (November to February). This approach mitigates systematic biases from soil moisture variations that affect velocity estimates derived from short baselines [34]. By integrating these long temporal baselines, the final stacks contain 1343 and 632 interferograms, respectively. Then, we used the SNAPHU method to unwrap the interferograms [34], and corrected the unwrap errors by phase closure triplets. Time-series deformation was estimated by the interferogram stacks combining both short and long baselines through weighted least squares inversion using covariance matrix. The ERA-5 reanalysis product with a spatial resolution of 0.25° was interpolated to the radar coordinate for mitigating the tropospheric delay [35]. The dem residual errors were subsequently estimated with perpendicular baselines [36]. As the primary deformation of the dam is in the vertical direction, LOS deformations from both tracks were geocoded to a common reference frame and decomposed pixel-wise using Equation (5):
s i n θ a s c c o s ϕ a s c c o s θ a s c s i n θ d e s c c o s ϕ d e s c c o s θ d s c d E W d U = d L O S a s c d L O S d e s c
in which θ and ϕ are the incidence angle and azimuth angle, respectively. For the data after 2021, only one ascending track of data is available, and we projected the LOS deformation by the pixel-wise incident angle only.
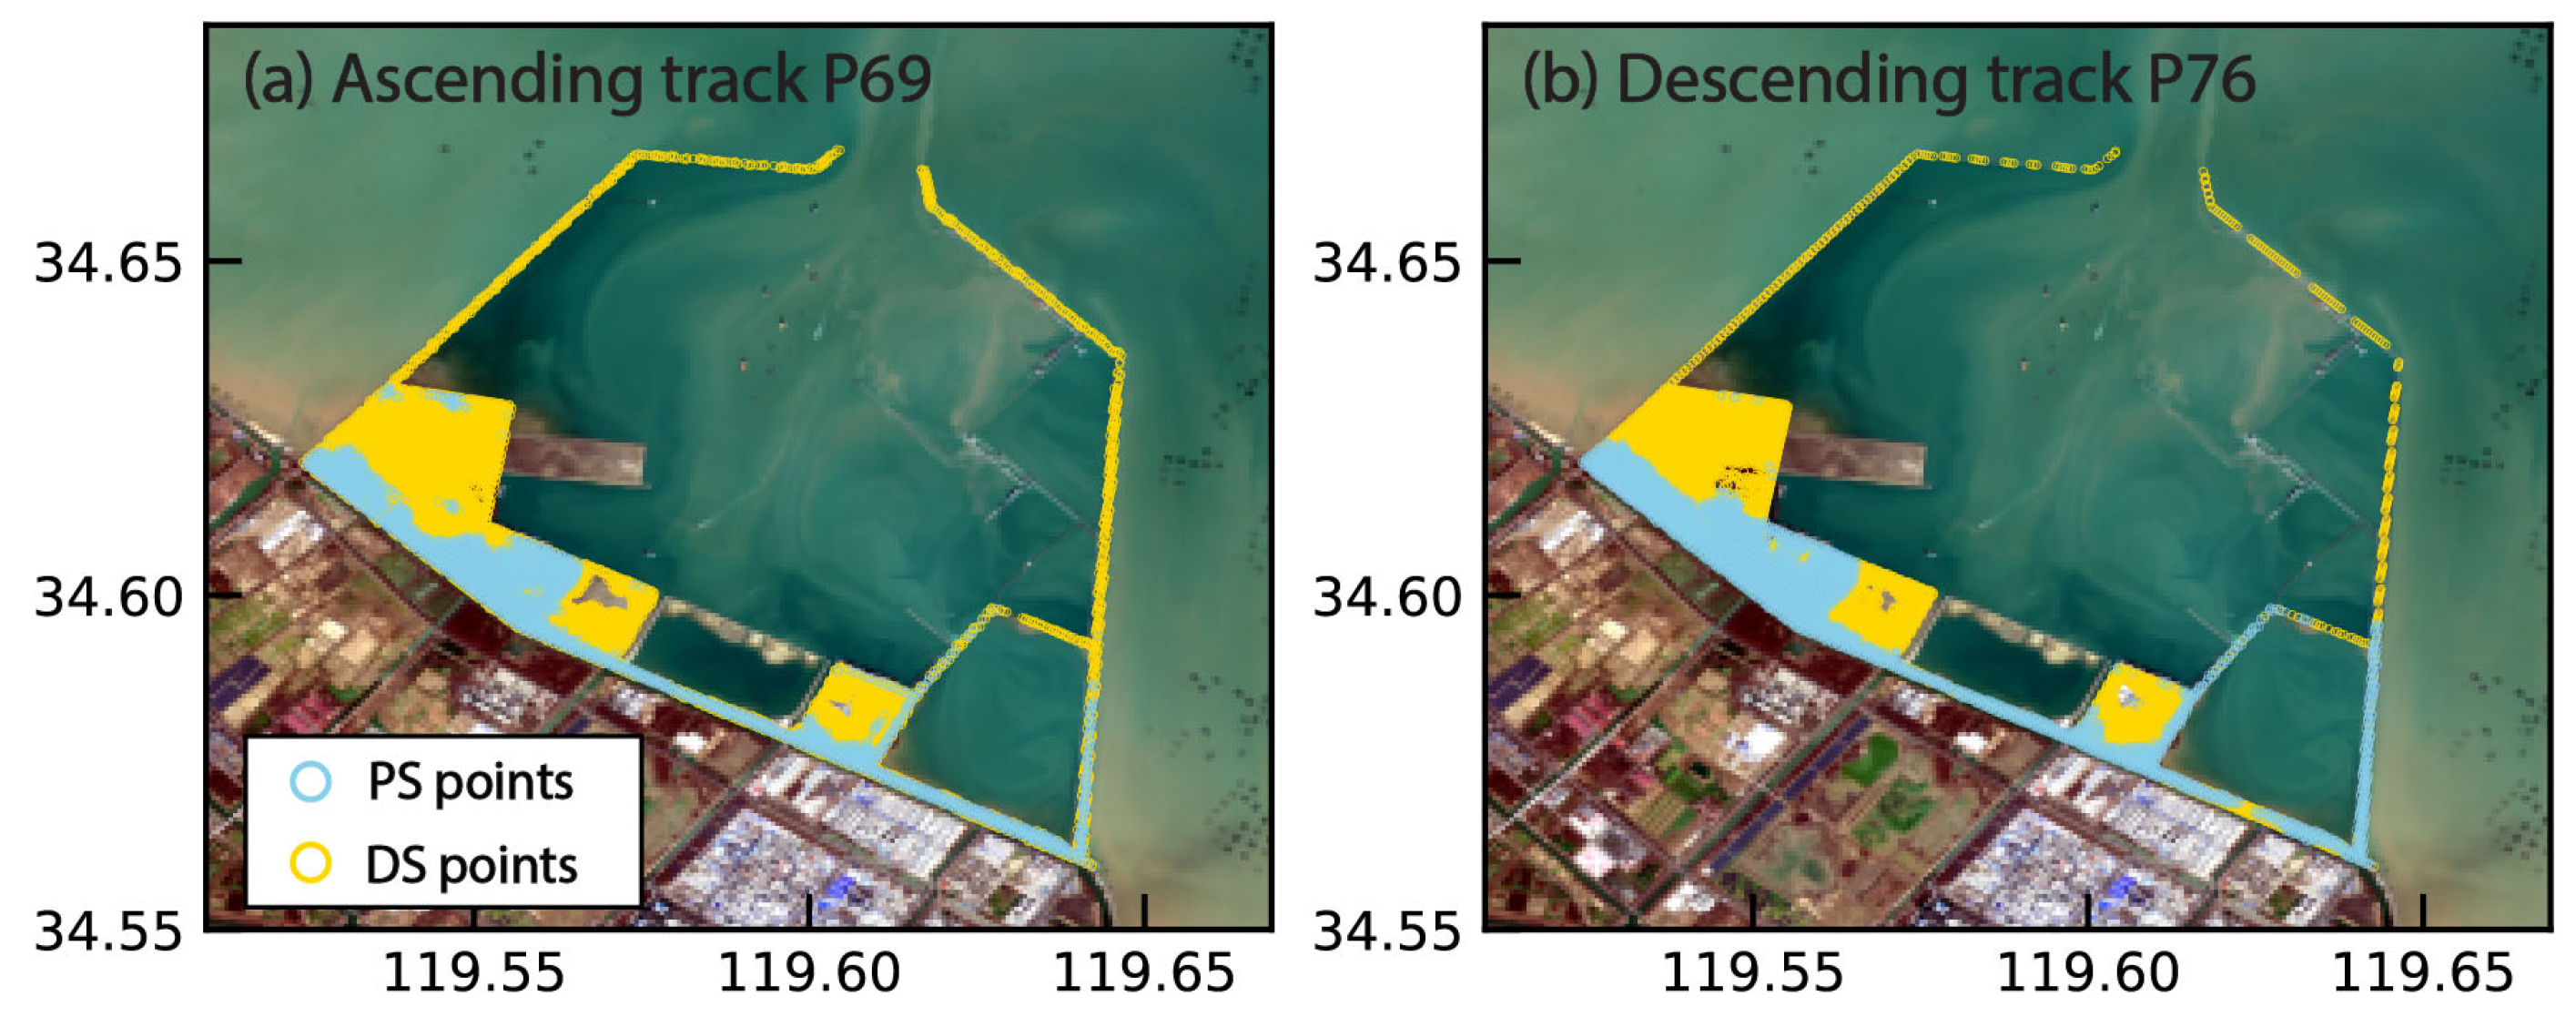
In the ascending track, there are 3514 PS points, predominantly clustered along roads near the shoreline and buildings on reclaimed lands (Figure 4a). PS coverage on the eastern breakwater dam spanned only ~3.2 km. Similarly, the descending track identified 4397 PS points, with detectable scatterers on the south section of the eastern breakwater dam (Figure 4b). In contrast, DS provided significantly broader coverage: 6224 points (ascending) and 4761 points (descending). Crucially, DS points achieved spatial continuous monitoring coverages, exhibiting linear densities of 3.7 and 3.4 points per 100 m along the western and eastern dam axes, respectively.

3. Results

3.1. InSAR Deformation and Validation

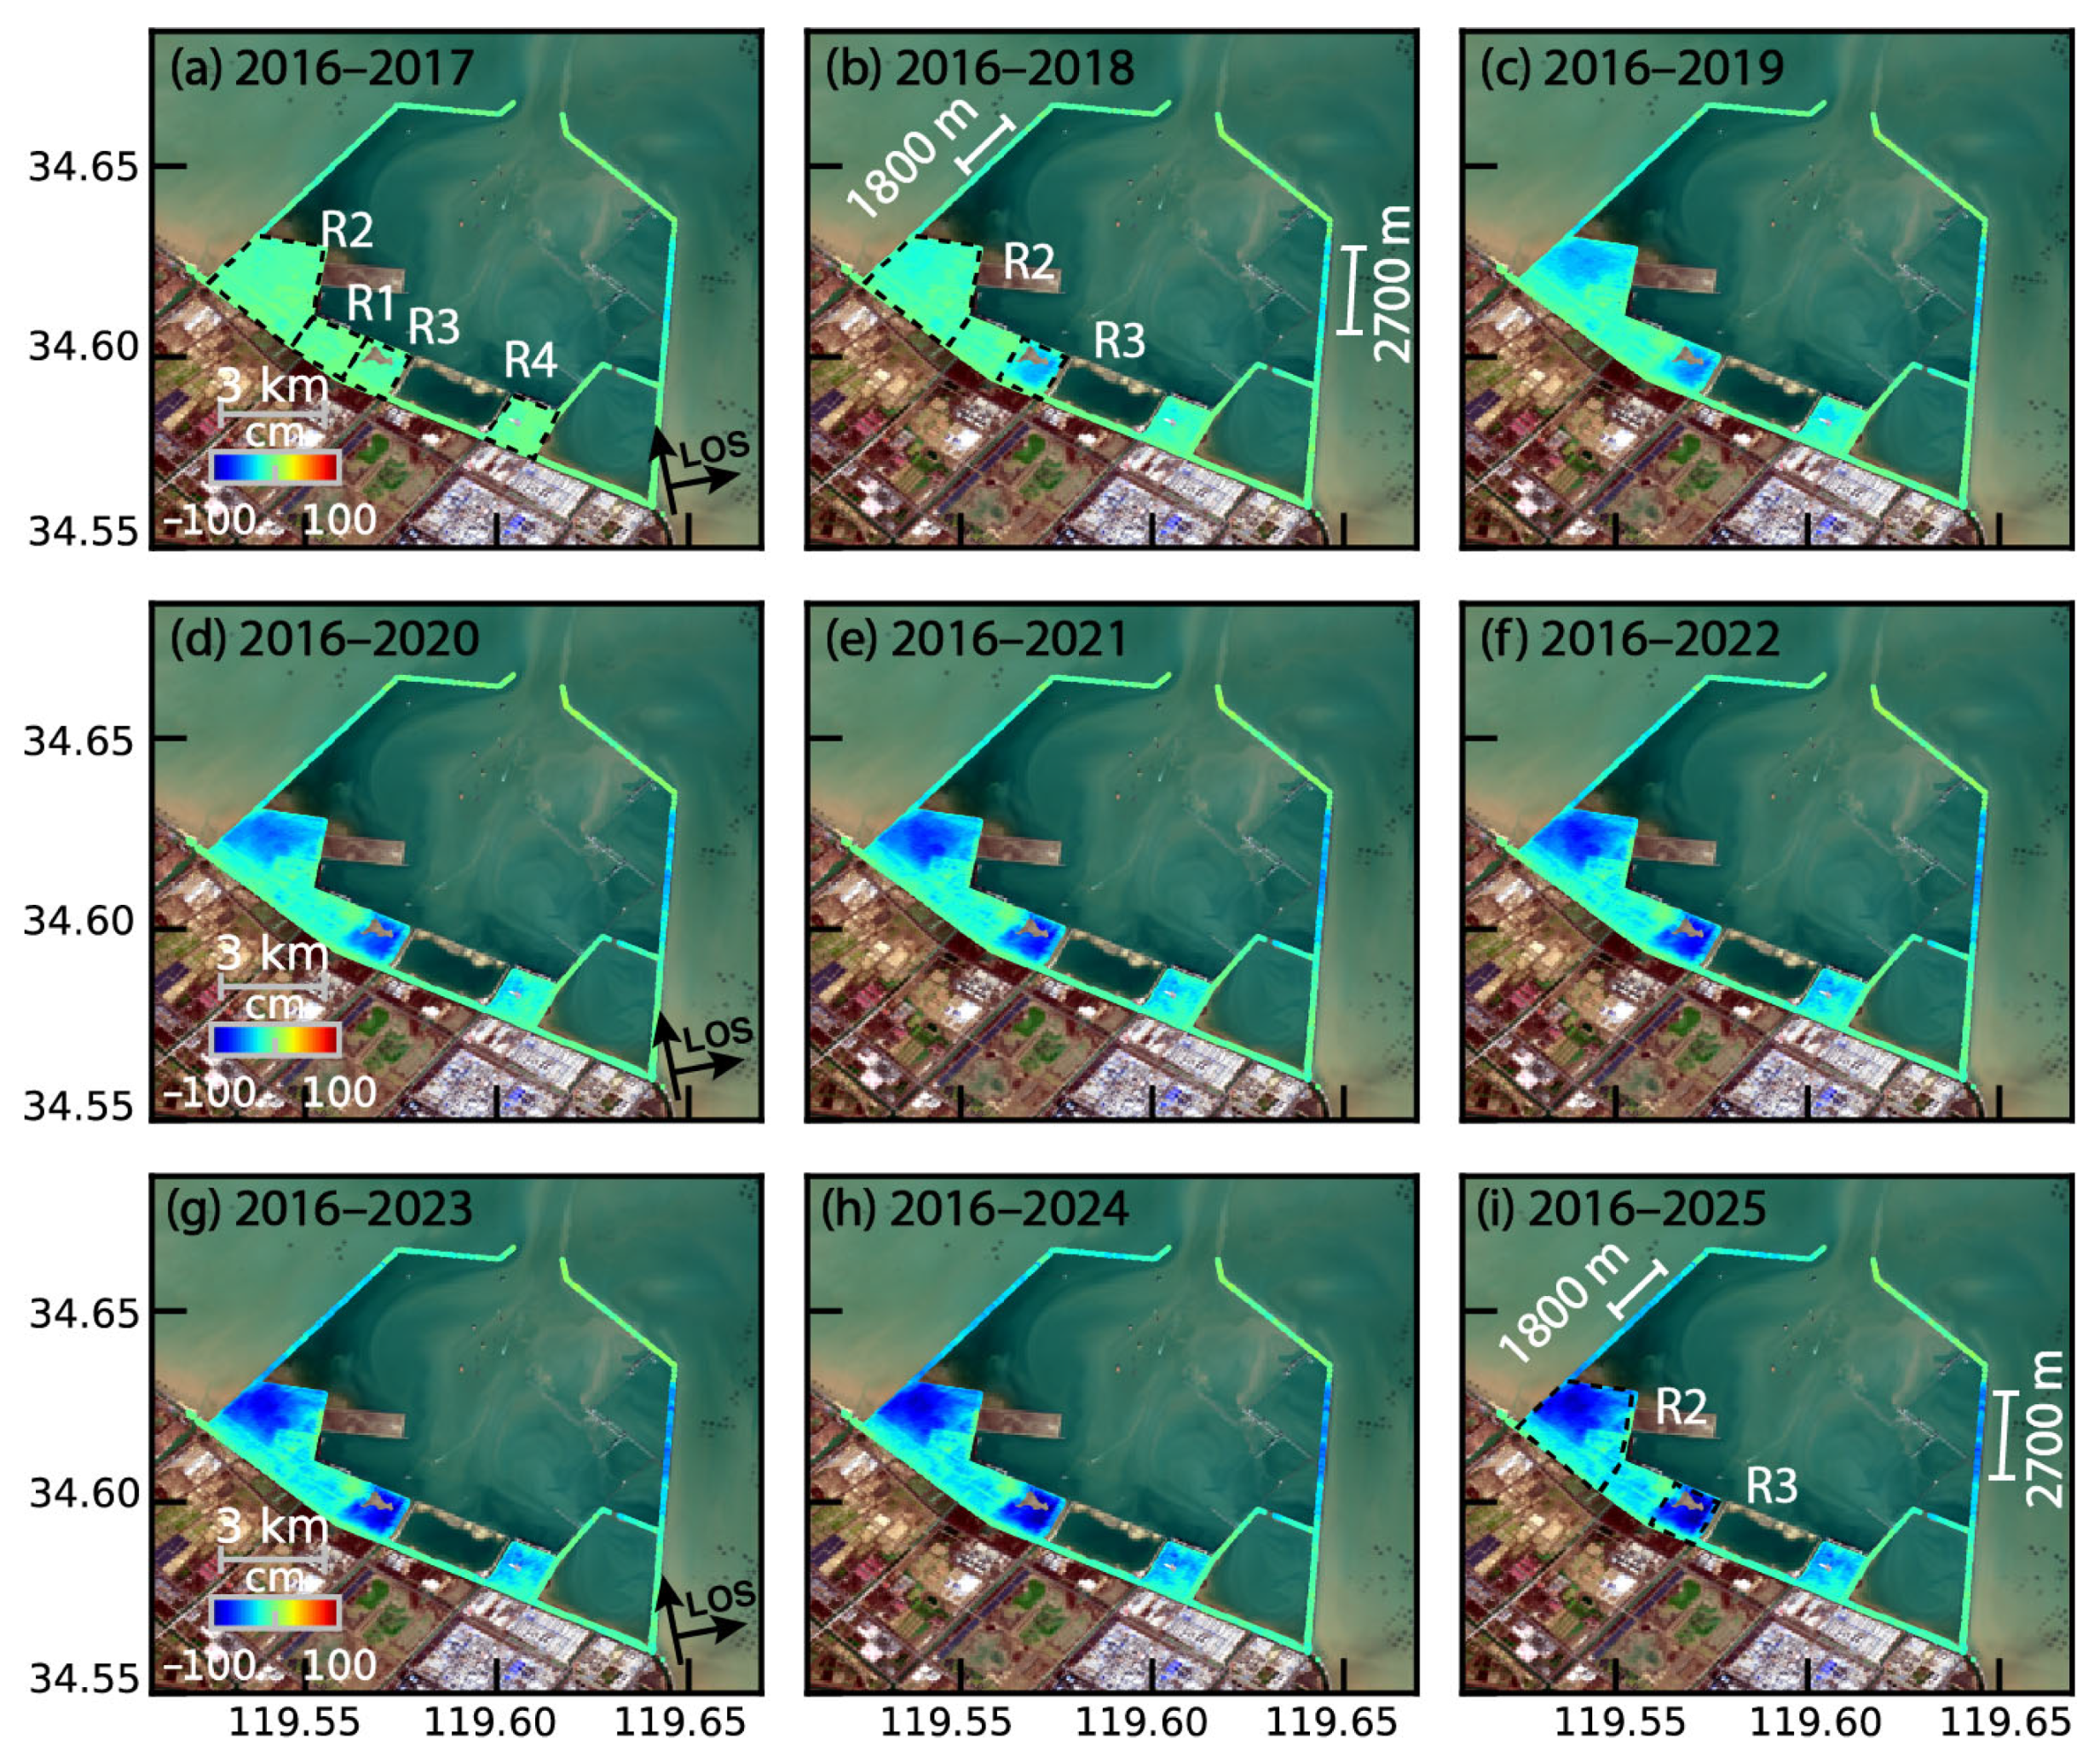
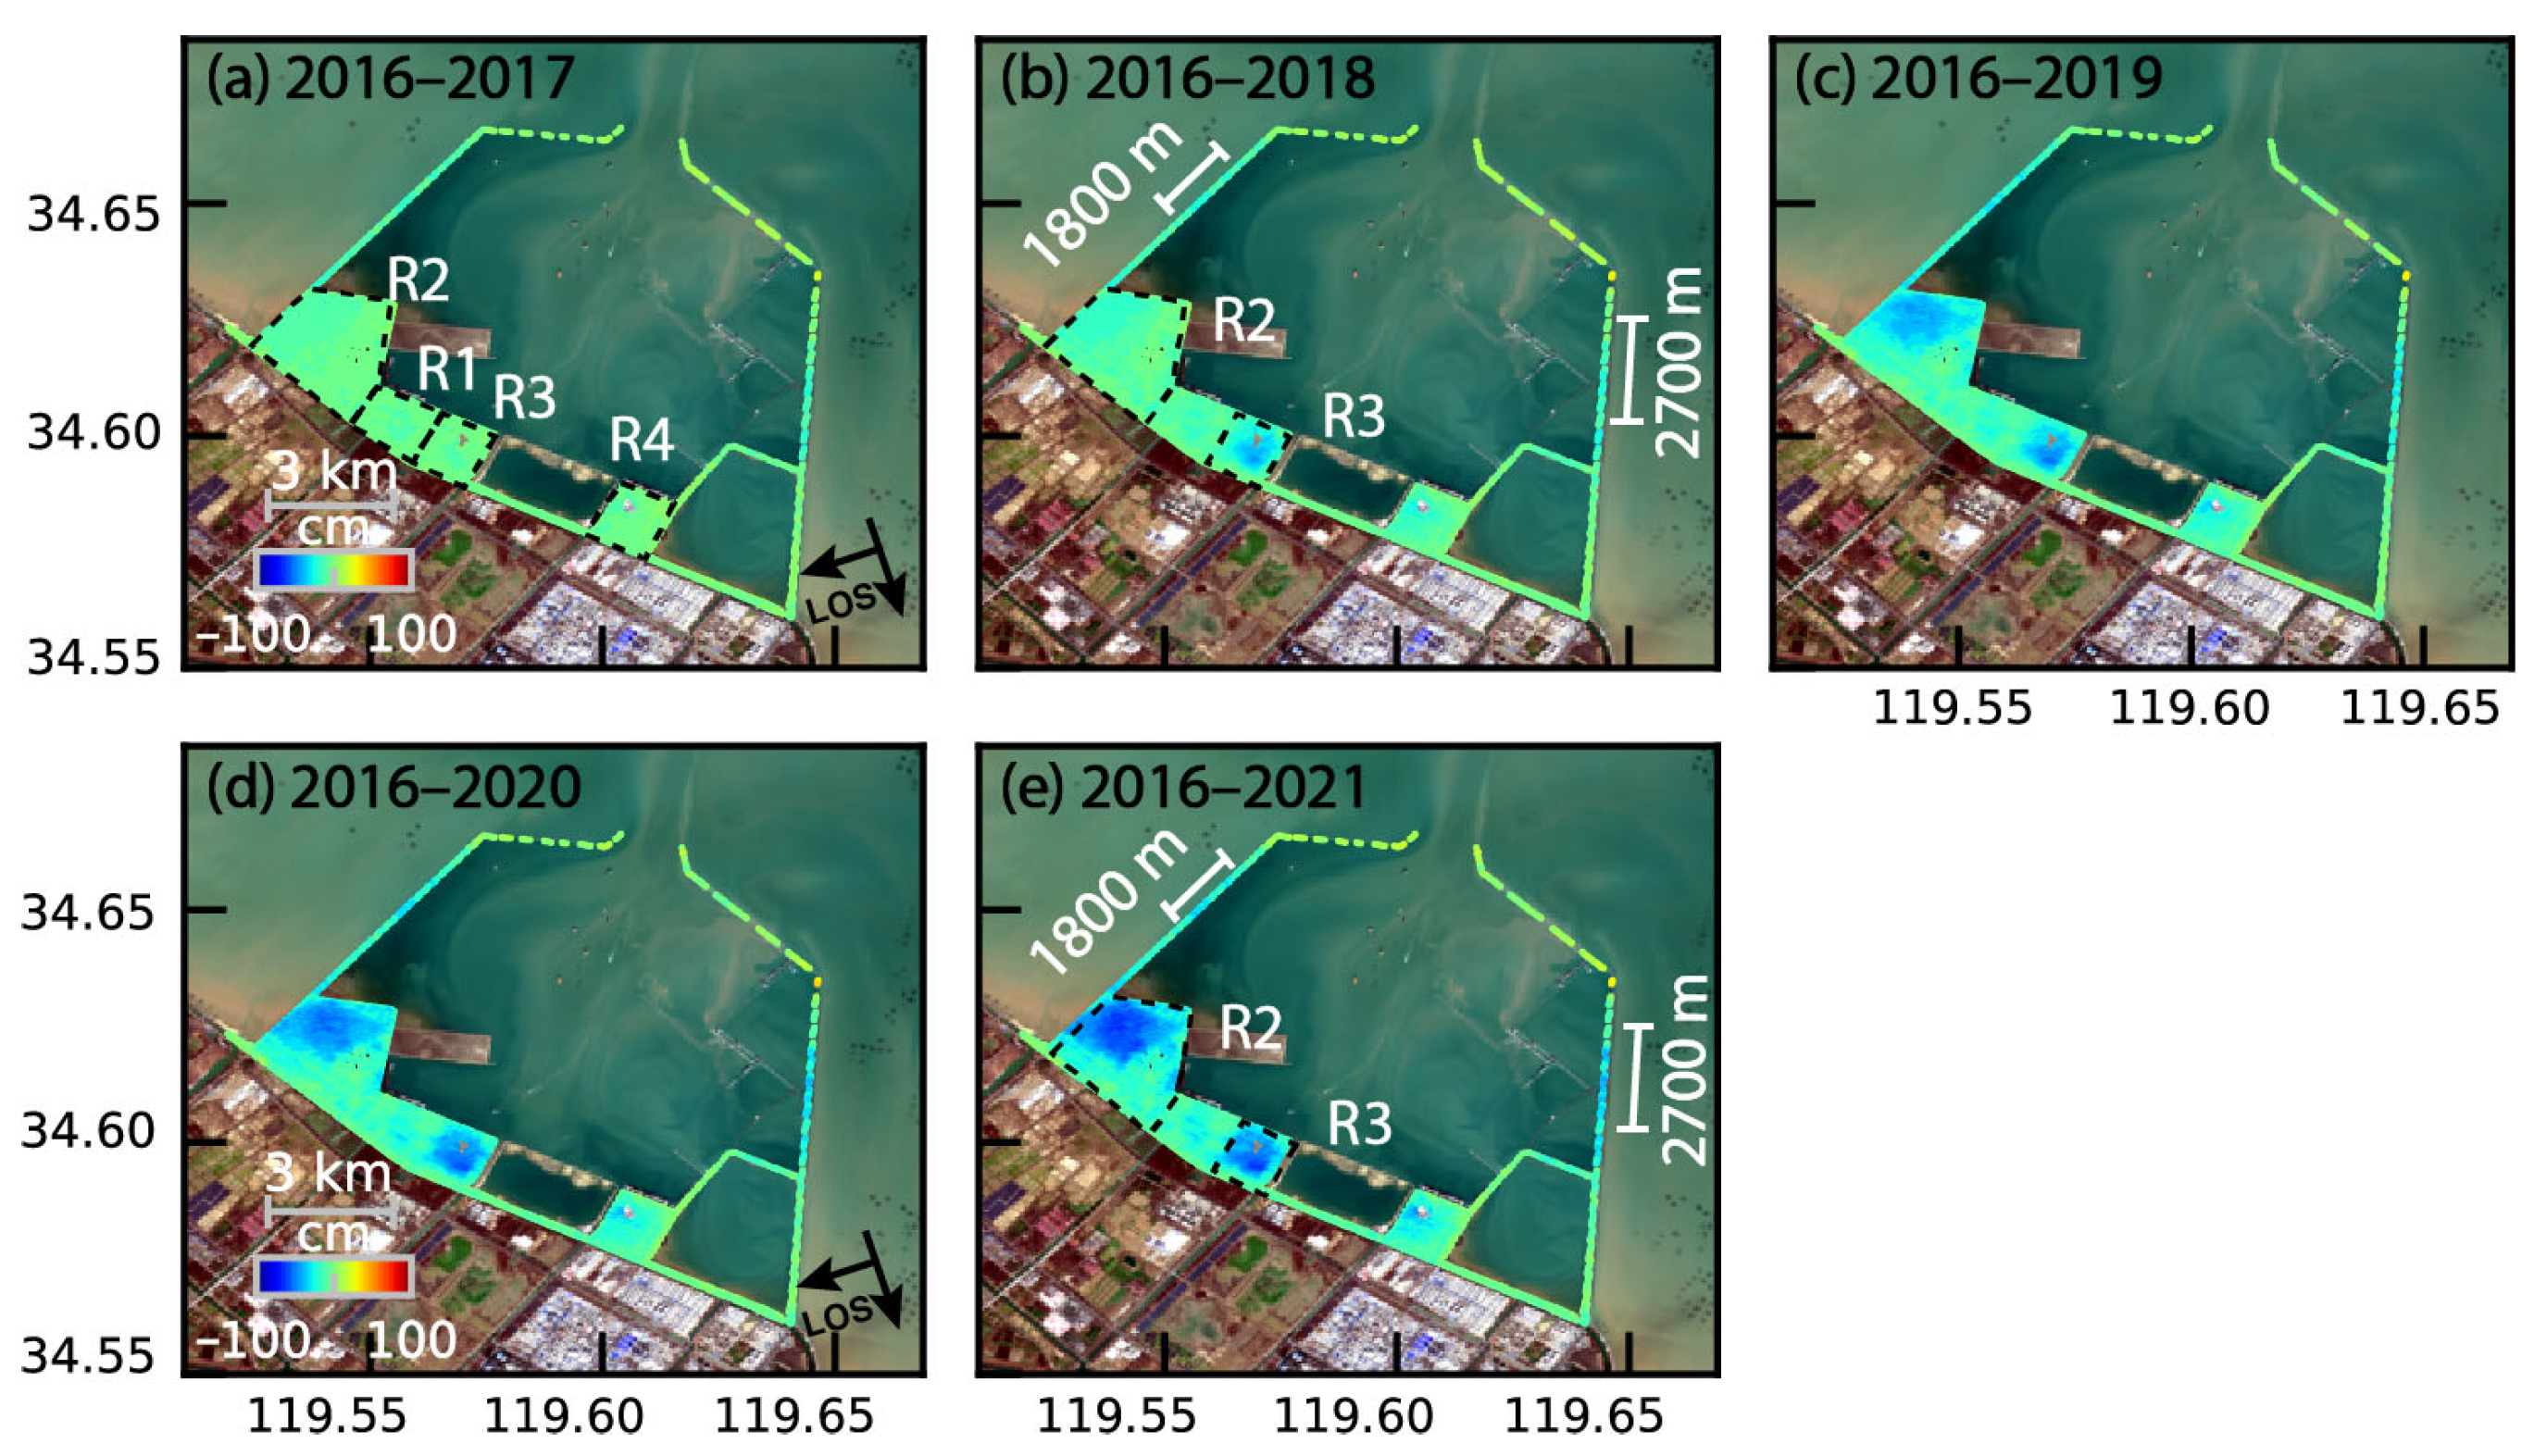
The deformation obtained from both InSAR tracks shows the significant away-motion deformation across breakwater dams and reclaimed lands (Figure 5 and Figure 6). Along the western breakwater, ascending track data (2016–2025) show a 1.8-km section with cumulative LOS deformation reaching −35.4 cm. Comparatively, the descending track recorded −24.9 cm LOS deformation during 2016–2021. The eastern breakwater exhibited more extensive deformation, with a 2.7-km section showing cumulative LOS displacements of −49.0 cm (ascending) and −32.2 cm (descending) (Figure 6). Beyond the dam itself, reclaimed zones R2 and R3 experienced pronounced deformation, particularly R2 with cumulative LOS deformation of −85.2 cm (ascending) and −59.4 cm (descending).
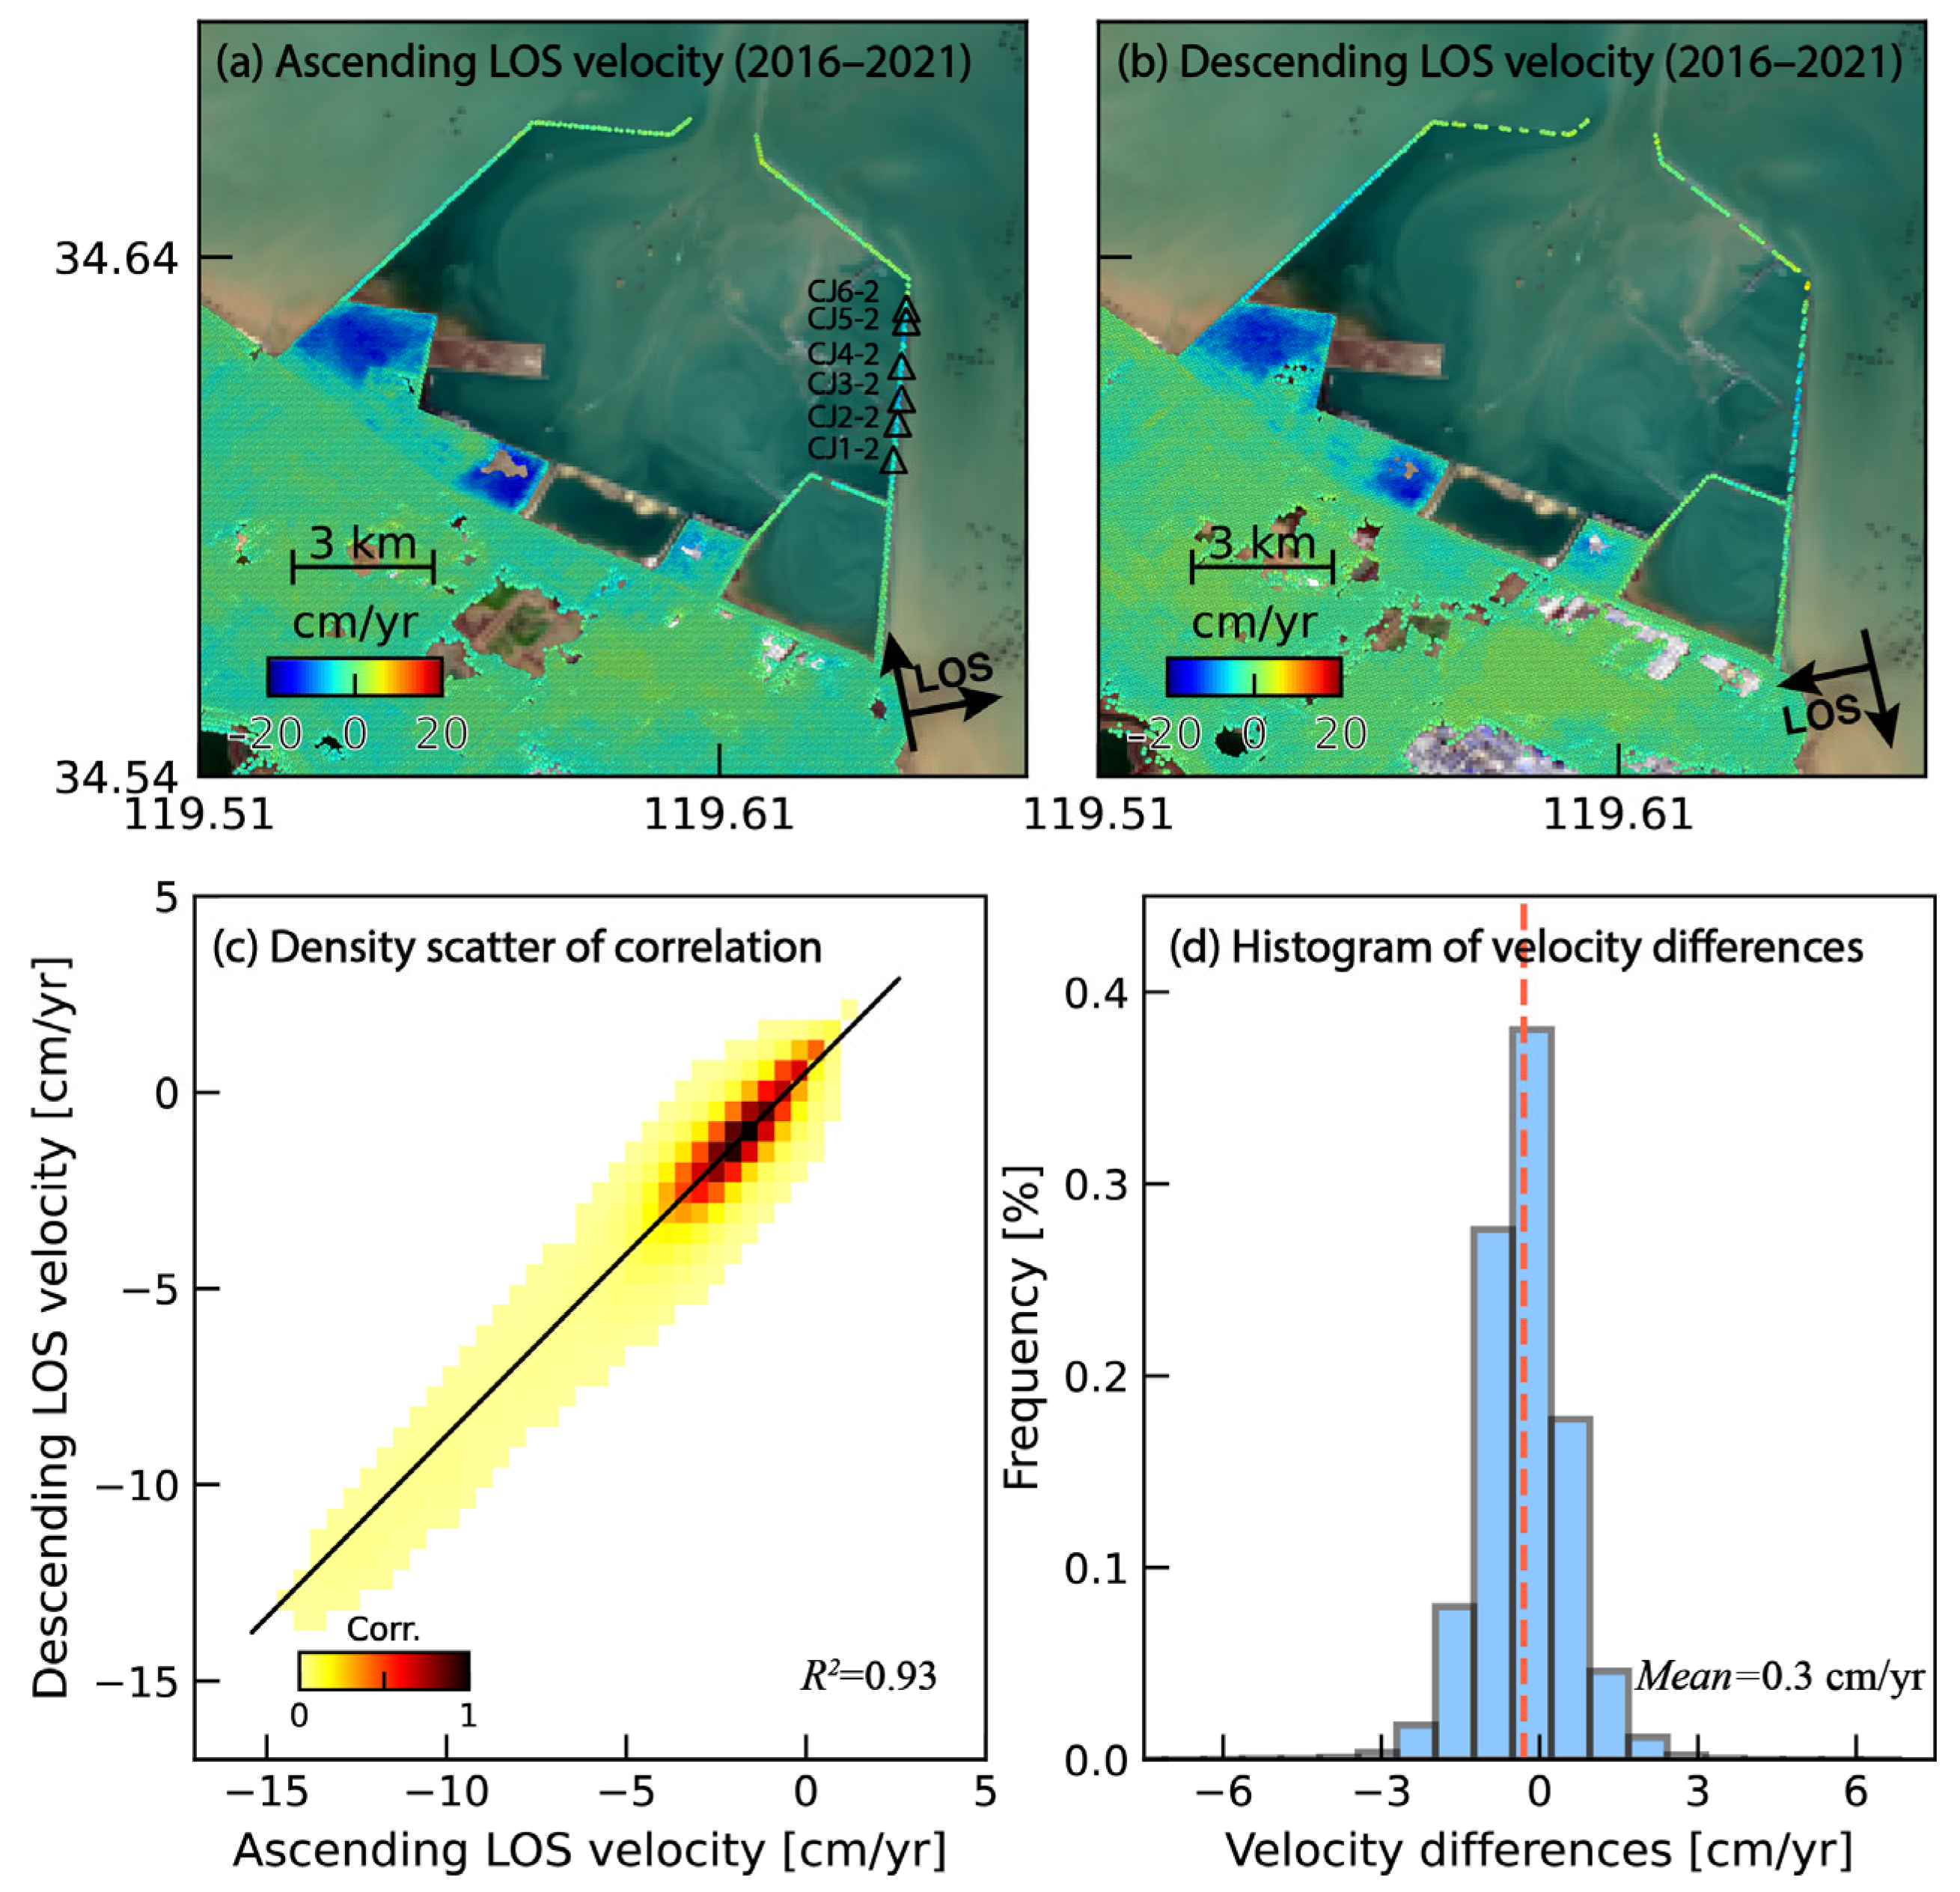
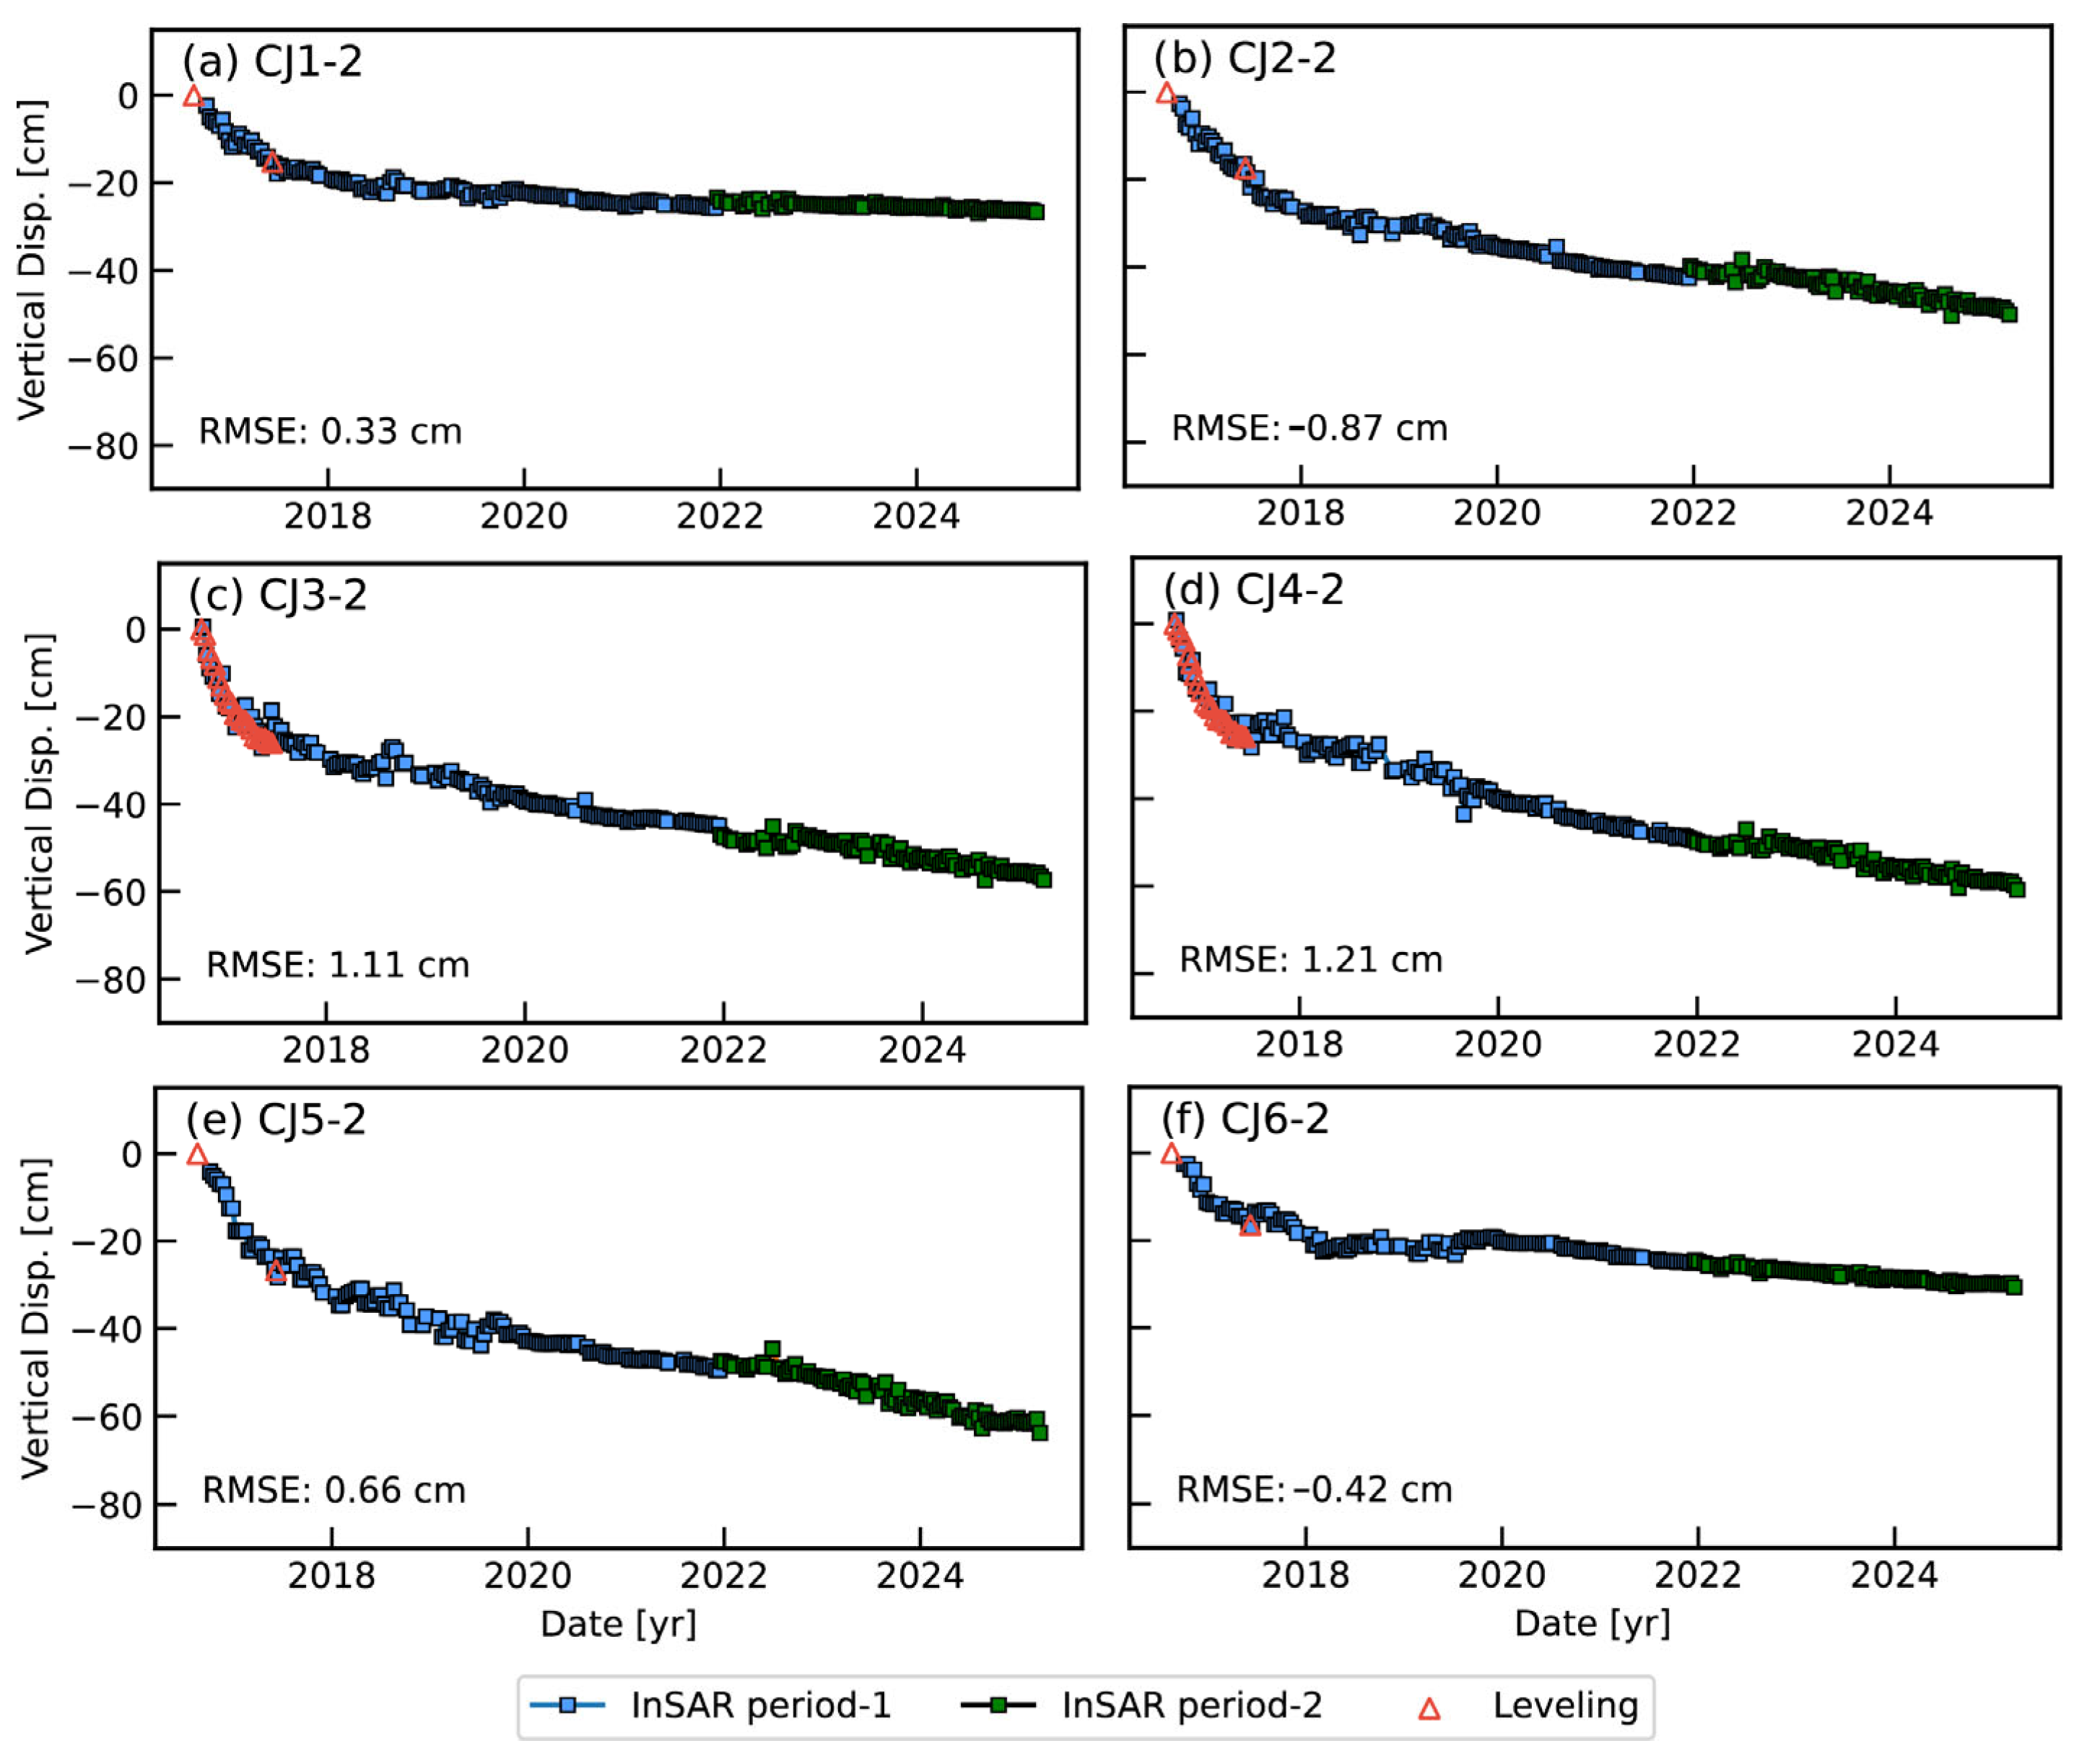
We validated the accuracy of InSAR deformation through two approaches. First, cross-validation of vertical deformation projections from ascending and descending tracks showed a high correlation of 0.93 (Figure 7c). It indicates the vertical motions dominate surface displacement in both the breakwater dam and reclaimed land. Although horizontal deformation may occur on the dam, the medium resolution of Sentinel-1 data cannot fully resolve horizontal displacements at the dam slope. The difference in the projected vertical deformation velocity is 3 mm/yr, revealing the reliability of the estimated velocity. Second, we utilized six leveling sites along the eastern breakwater dam crest (August 2016–June 2017), positioned at profiles DK4+500 (CJ 1-2), DK5+285 (CJ 2-2), DK5+750 (CJ 3-2), DK6+500 (CJ 4-2), DK7+500 (CJ 5-2), and DK7+700 (CJ 6-2) (Figure 7a) [25]. For the central profiles at CJ3-2 and CJ4-2, the monitoring frequency is 15 days, and the RMSE for InSAR vertical deformation and leveling is 1.21 cm, and 1.11 cm, respectively (Figure 8c,d). For other profiles, the average RMSE is 0.57 cm (Figure 8), confirming the high accuracy of InSAR measurements.

3.2. Time-Series Deformation on Breakwater Dams

3.2.1. Eastern Breakwater Dam

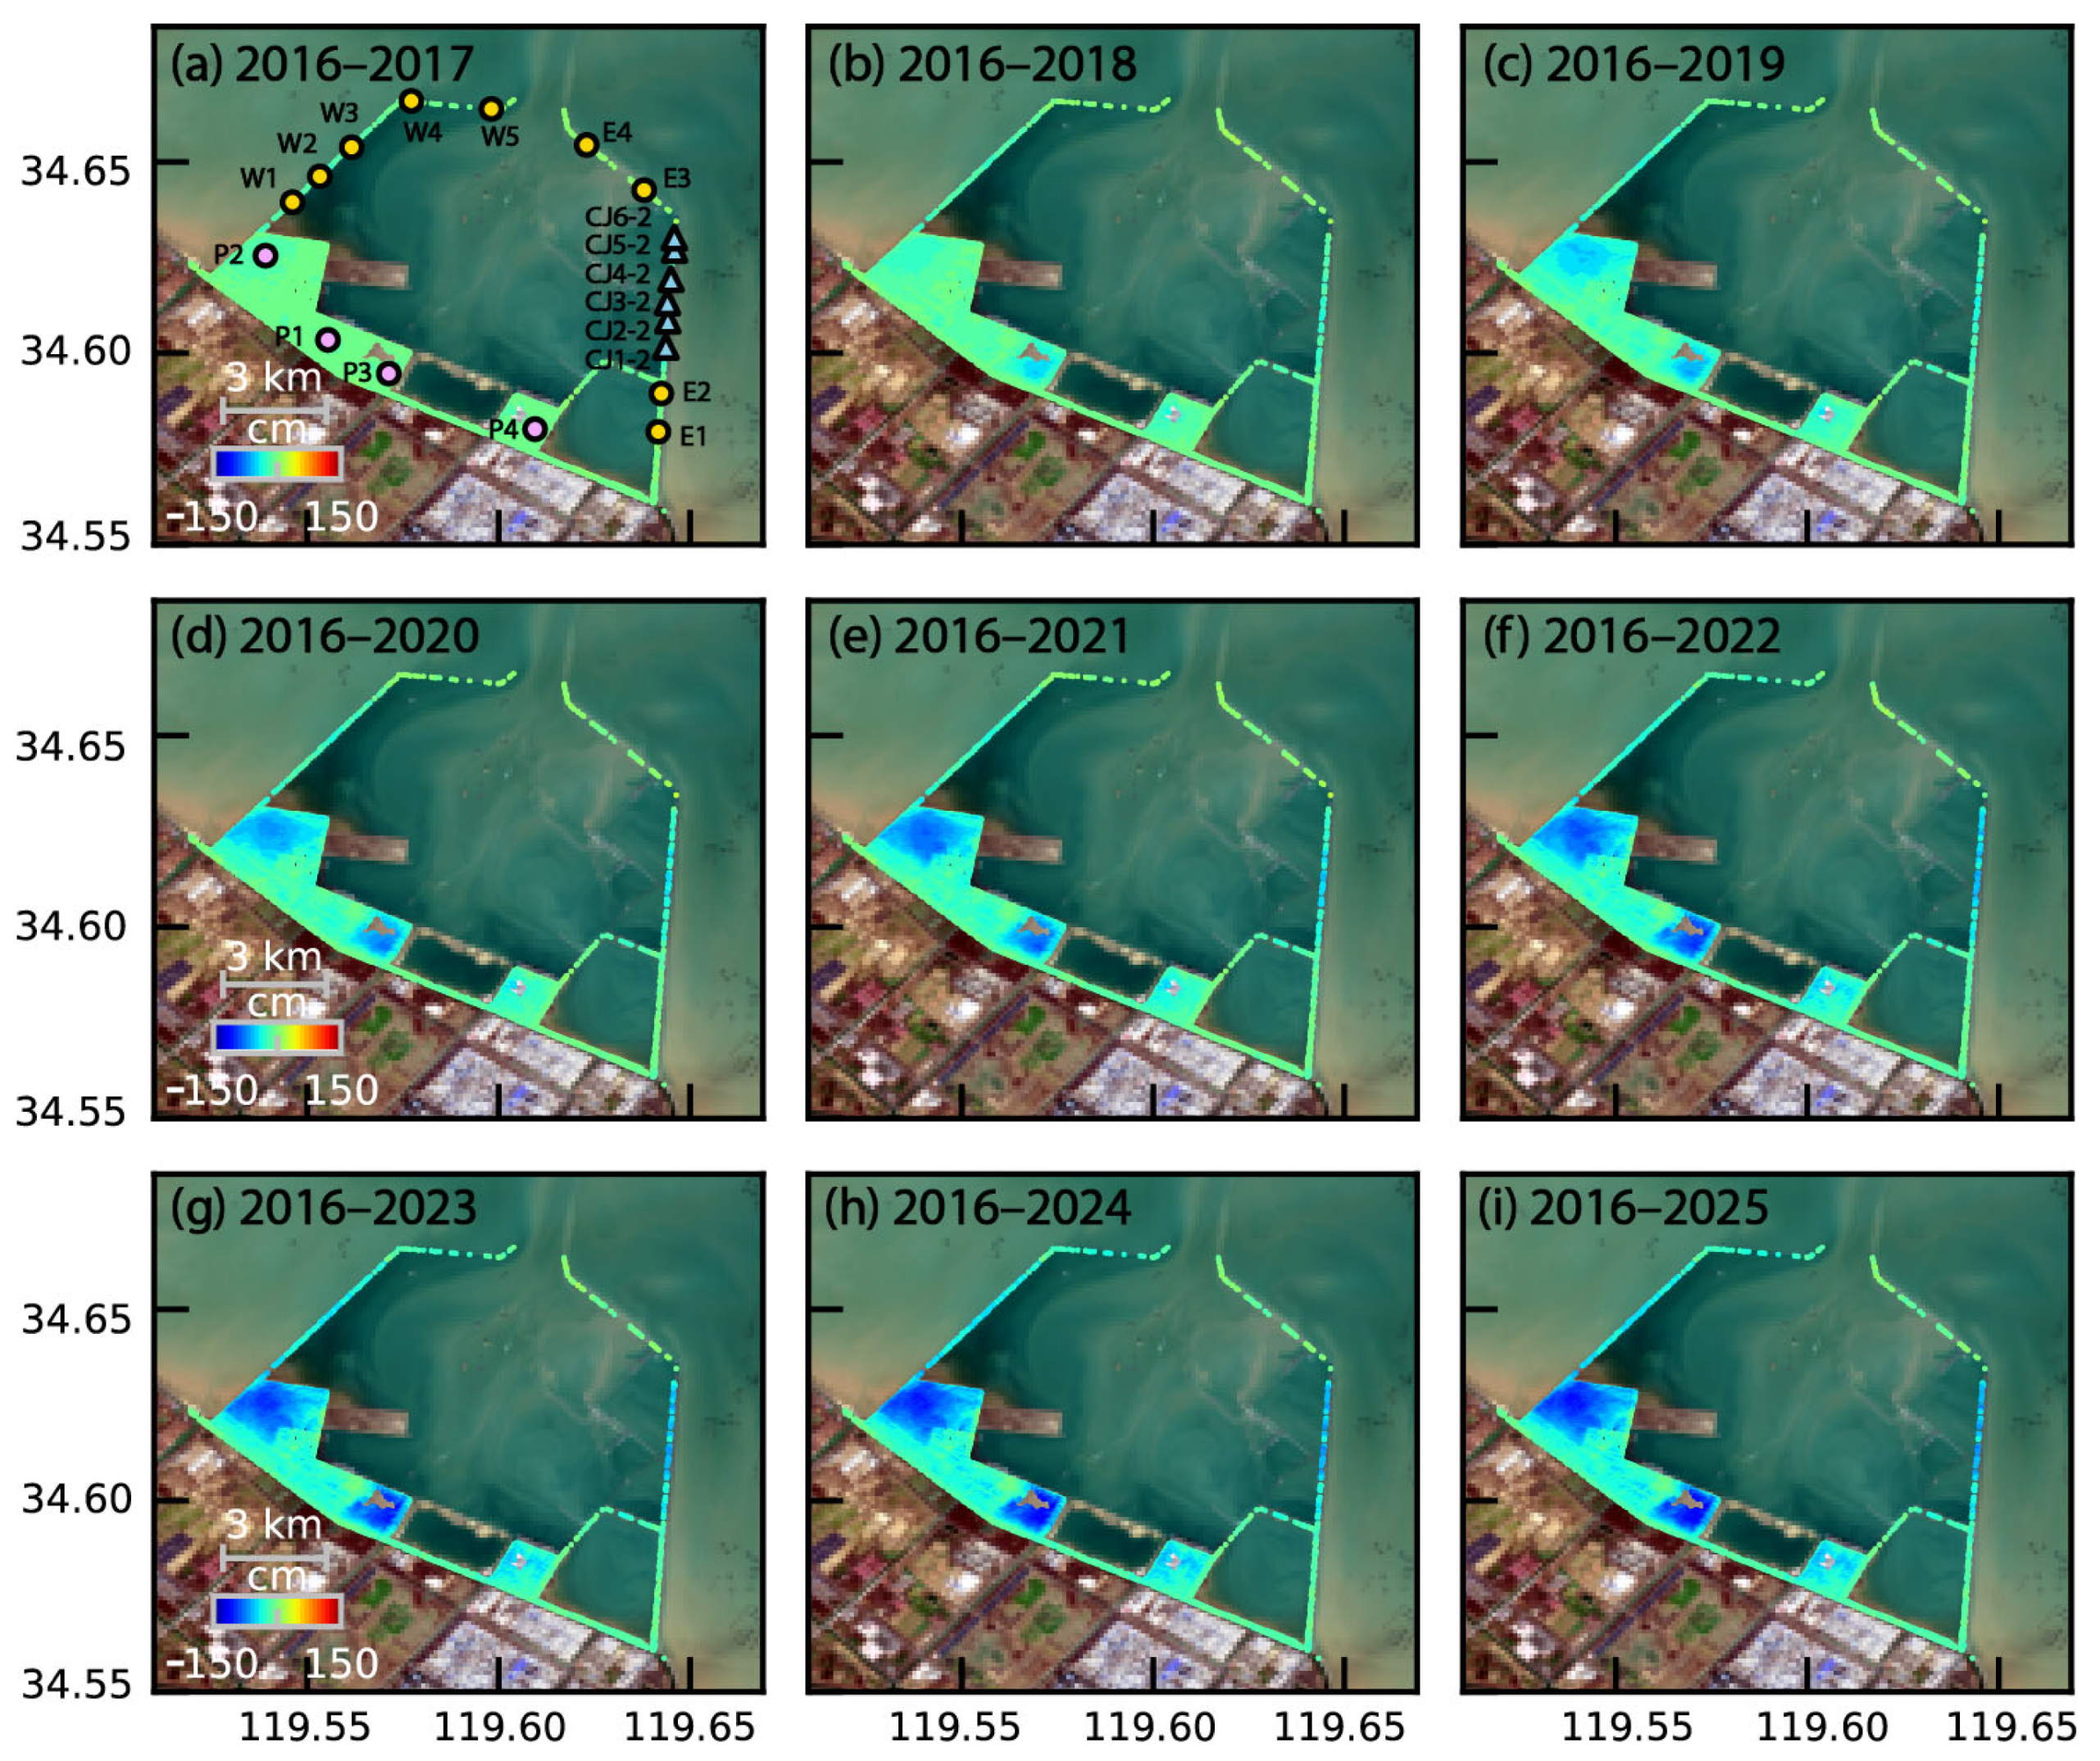
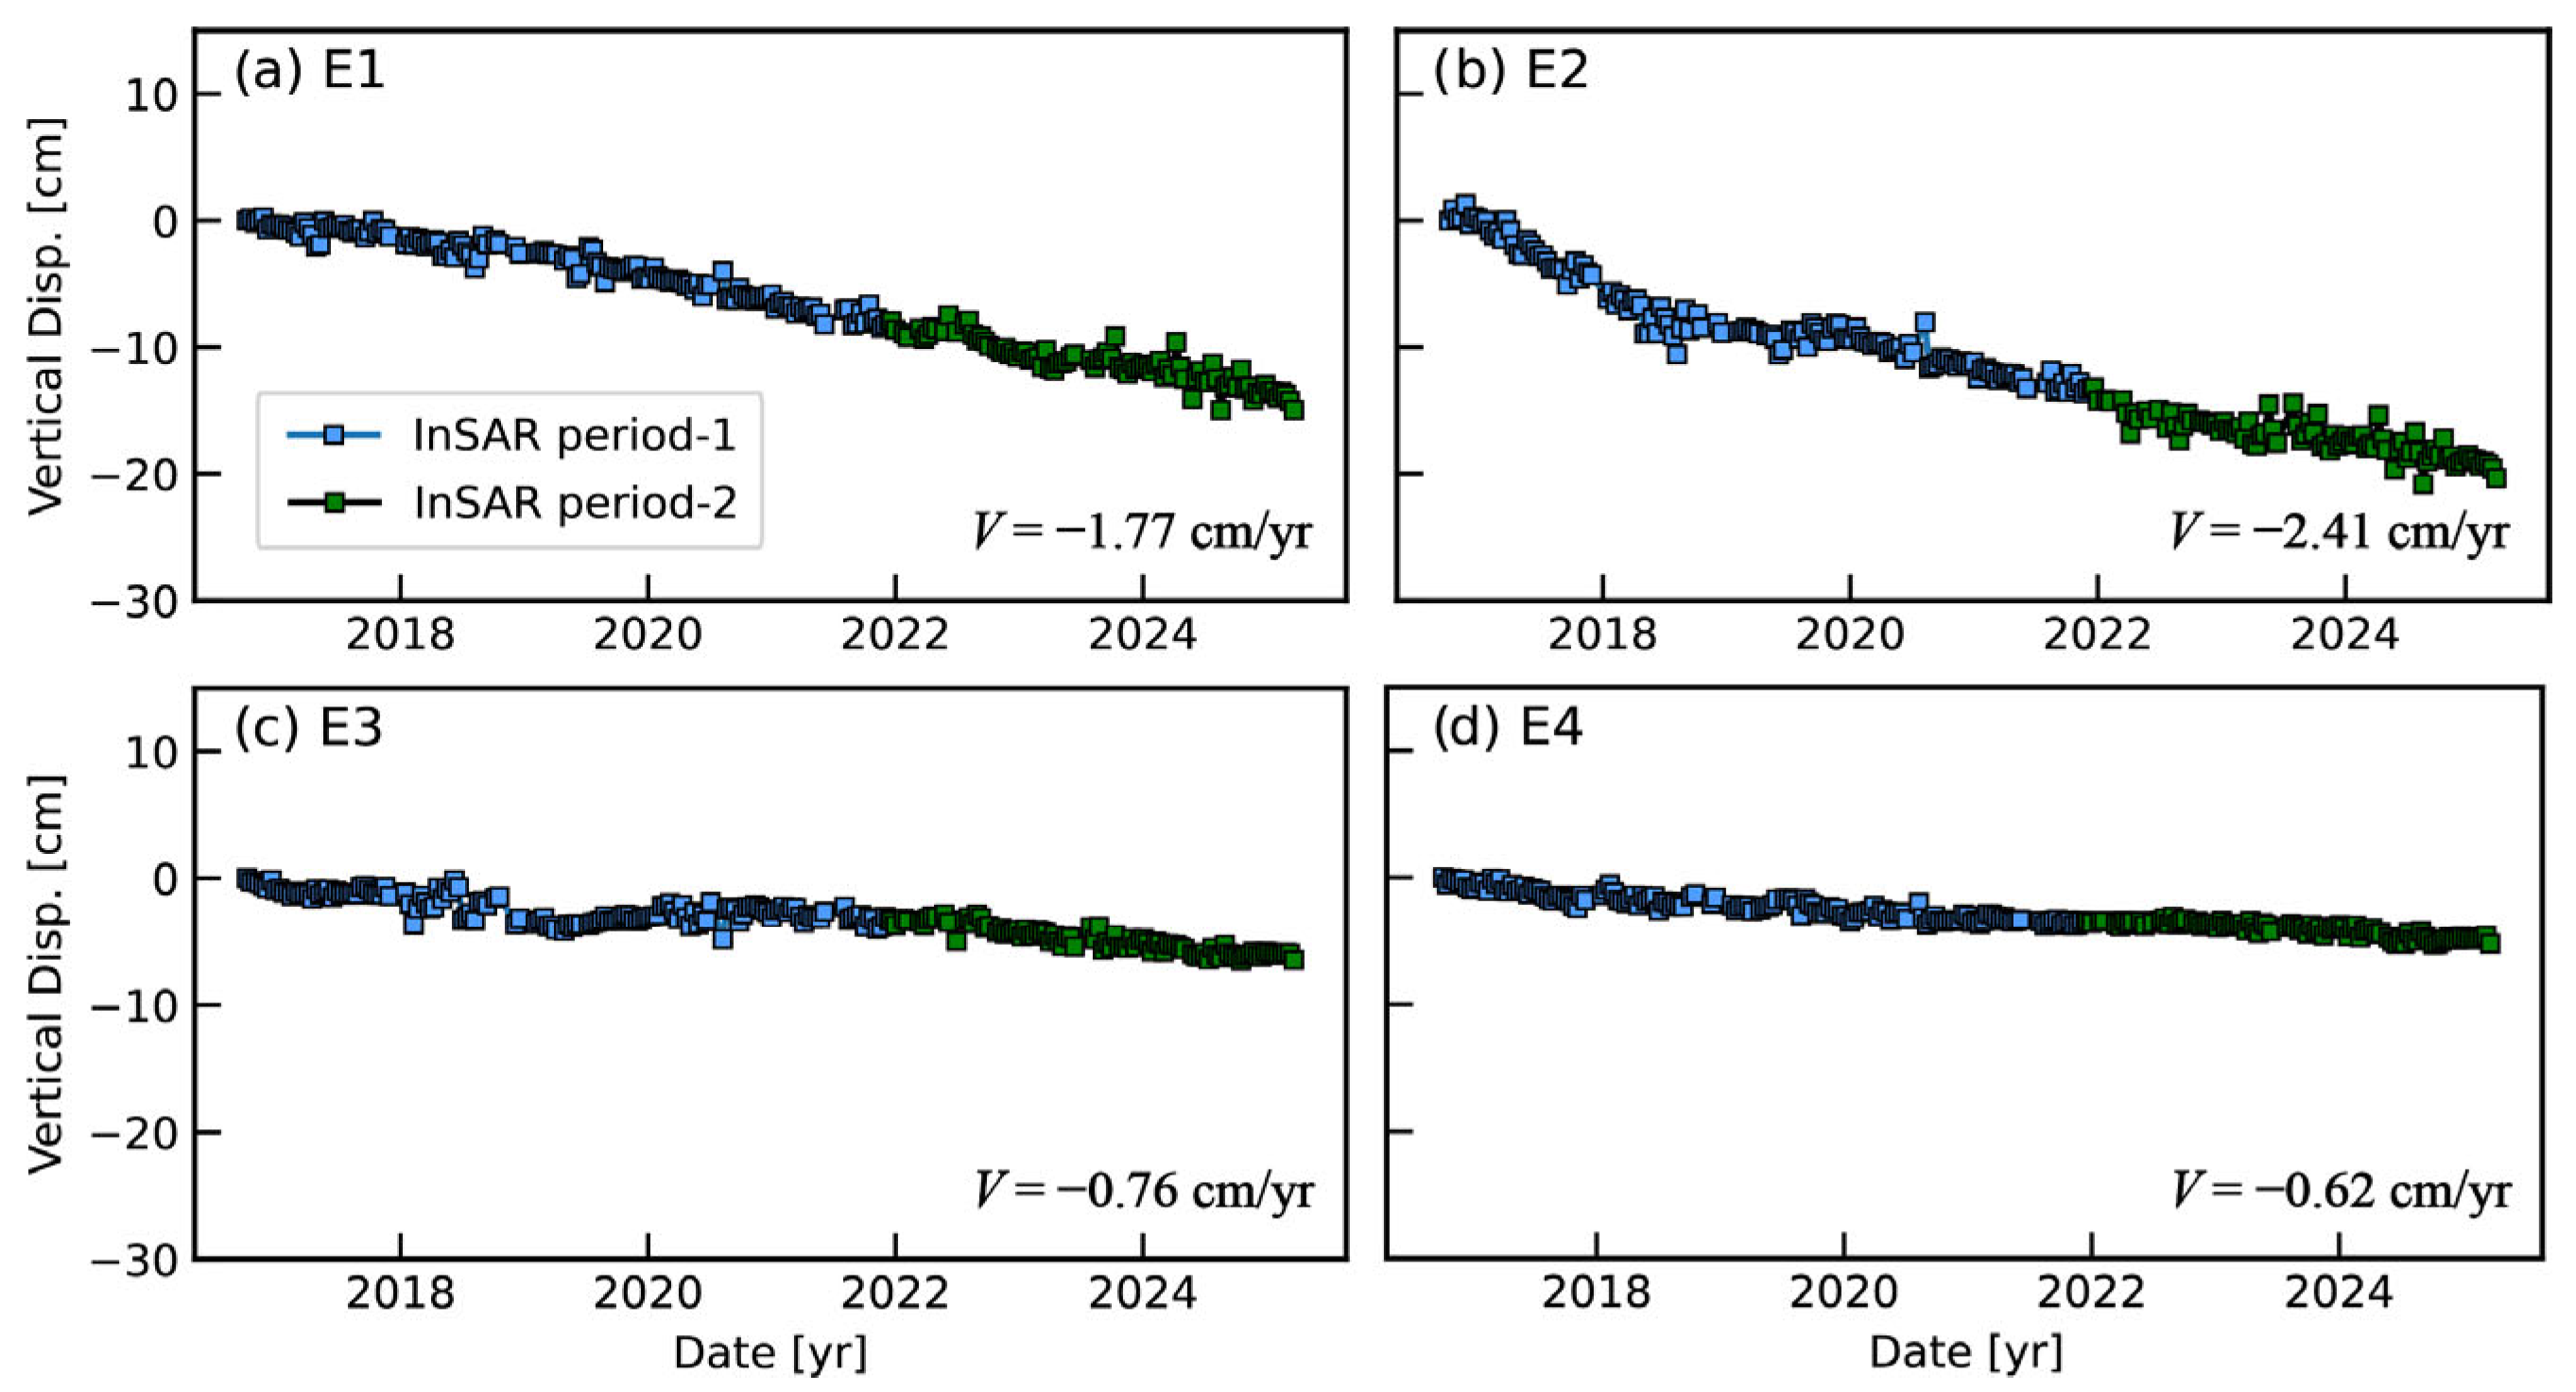
In the eastern breakwater dam, the rock-sand filled dam shows extensive subsidence ranging from −15.0 cm to −63.8 cm. The maximum subsidence is located at the points of CJ4-2 (60.6 cm) and CJ5-2 (63.7 cm) between the profiles DK6+500 and DK7+750 (Figure 9). In contrast, dam terminals show limited settlement, as 15.0 cm at E1, 20.3 cm at E2, and 30.6 cm at CJ06 (Figure 8f and Figure 10a,b). This spatial pattern of deformation correlates with staged construction: terminal sections (E1 and E2) were filled between November 2014 and June 2015, achieving 2-year consolidation before InSAR monitoring commenced in 2016. The central dam section near CJ6-2 site, filled in September 2015, had only 1-year consolidation before the InSAR observation.
In contrast, the concrete tubular dam has minimal linear subsidence: −0.76 cm/yr at E3 and −0.62 cm/yr at E4, with cumulative displacement of −6.5 cm and −5.2 cm (Figure 10c,d). Conversely, the central rock-sand fill section exhibits decelerating subsidence, exemplified by CJ05’s decreasing rates: −22.3 cm/yr (2016–2017), −6.5 cm/yr (2018–2020), and −4.8 cm/yr (2020–2025). This contrast confirms precast concrete units do not experience the consolidation behavior characteristic of filled materials.

3.2.2. Western Breakwater Dam

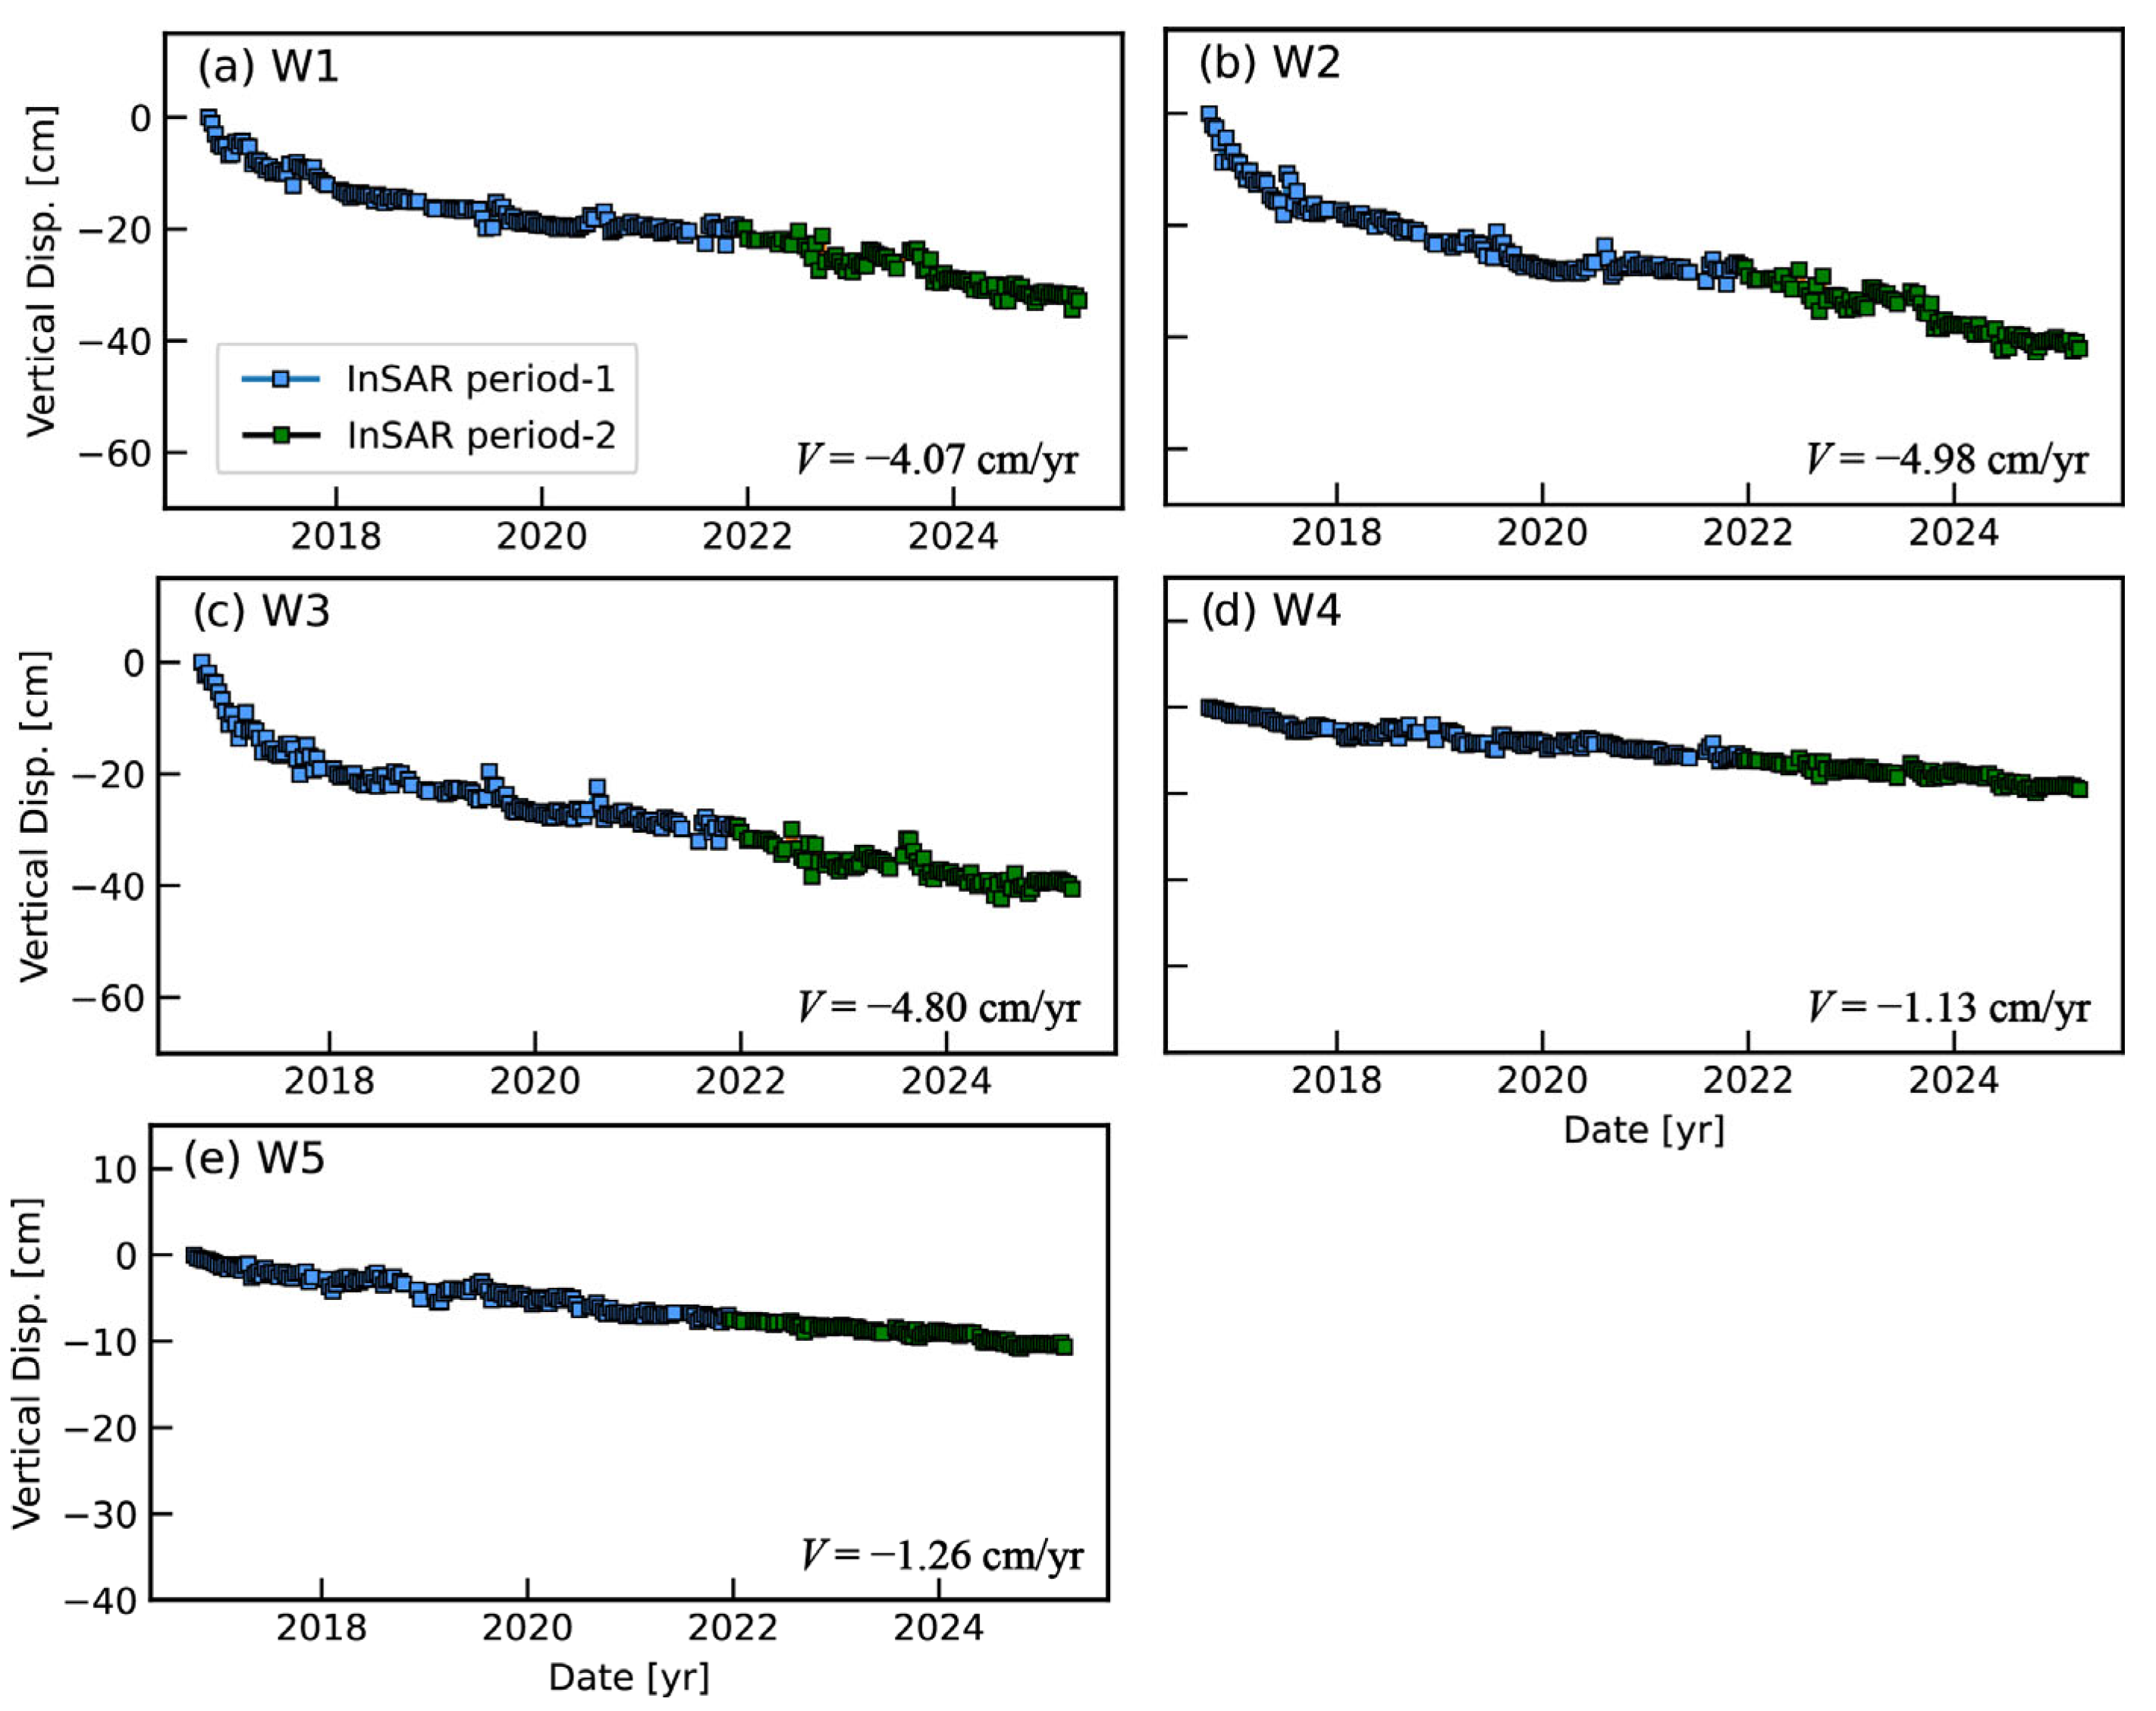
Consistent with the eastern breakwater dam, the western breakwater dam manifests significant post-construction subsidence driven by material consolidation. However, its unidirectional construction procedure from north to south (Figure 2e–g) rather than the central enclosure, results in distinct spatiotemporal deformation patterns compared to the eastern breakwater. The rock-sand fill section displays progressively decaying settlement rates, as in 2016–2017 the subsidence rate of −10.0 cm/yr (W1), −13.8 cm/yr (W2), and −15.4 cm/yr (W3), decreasing to −3.0 cm/yr (W1), −3.5 cm/yr (W2), and −3.0 cm/yr (W3) during 2018–2025 (Figure 11a–c). Conversely, precast concrete segments exhibit near-linear subsidence at rates of −1.1 cm/yr (W3) and −1.3 cm/yr (W4), reflecting elastic deformation characteristics (Figure 11d,e).

3.3. Time-Series Deformation on Reclamation Lands

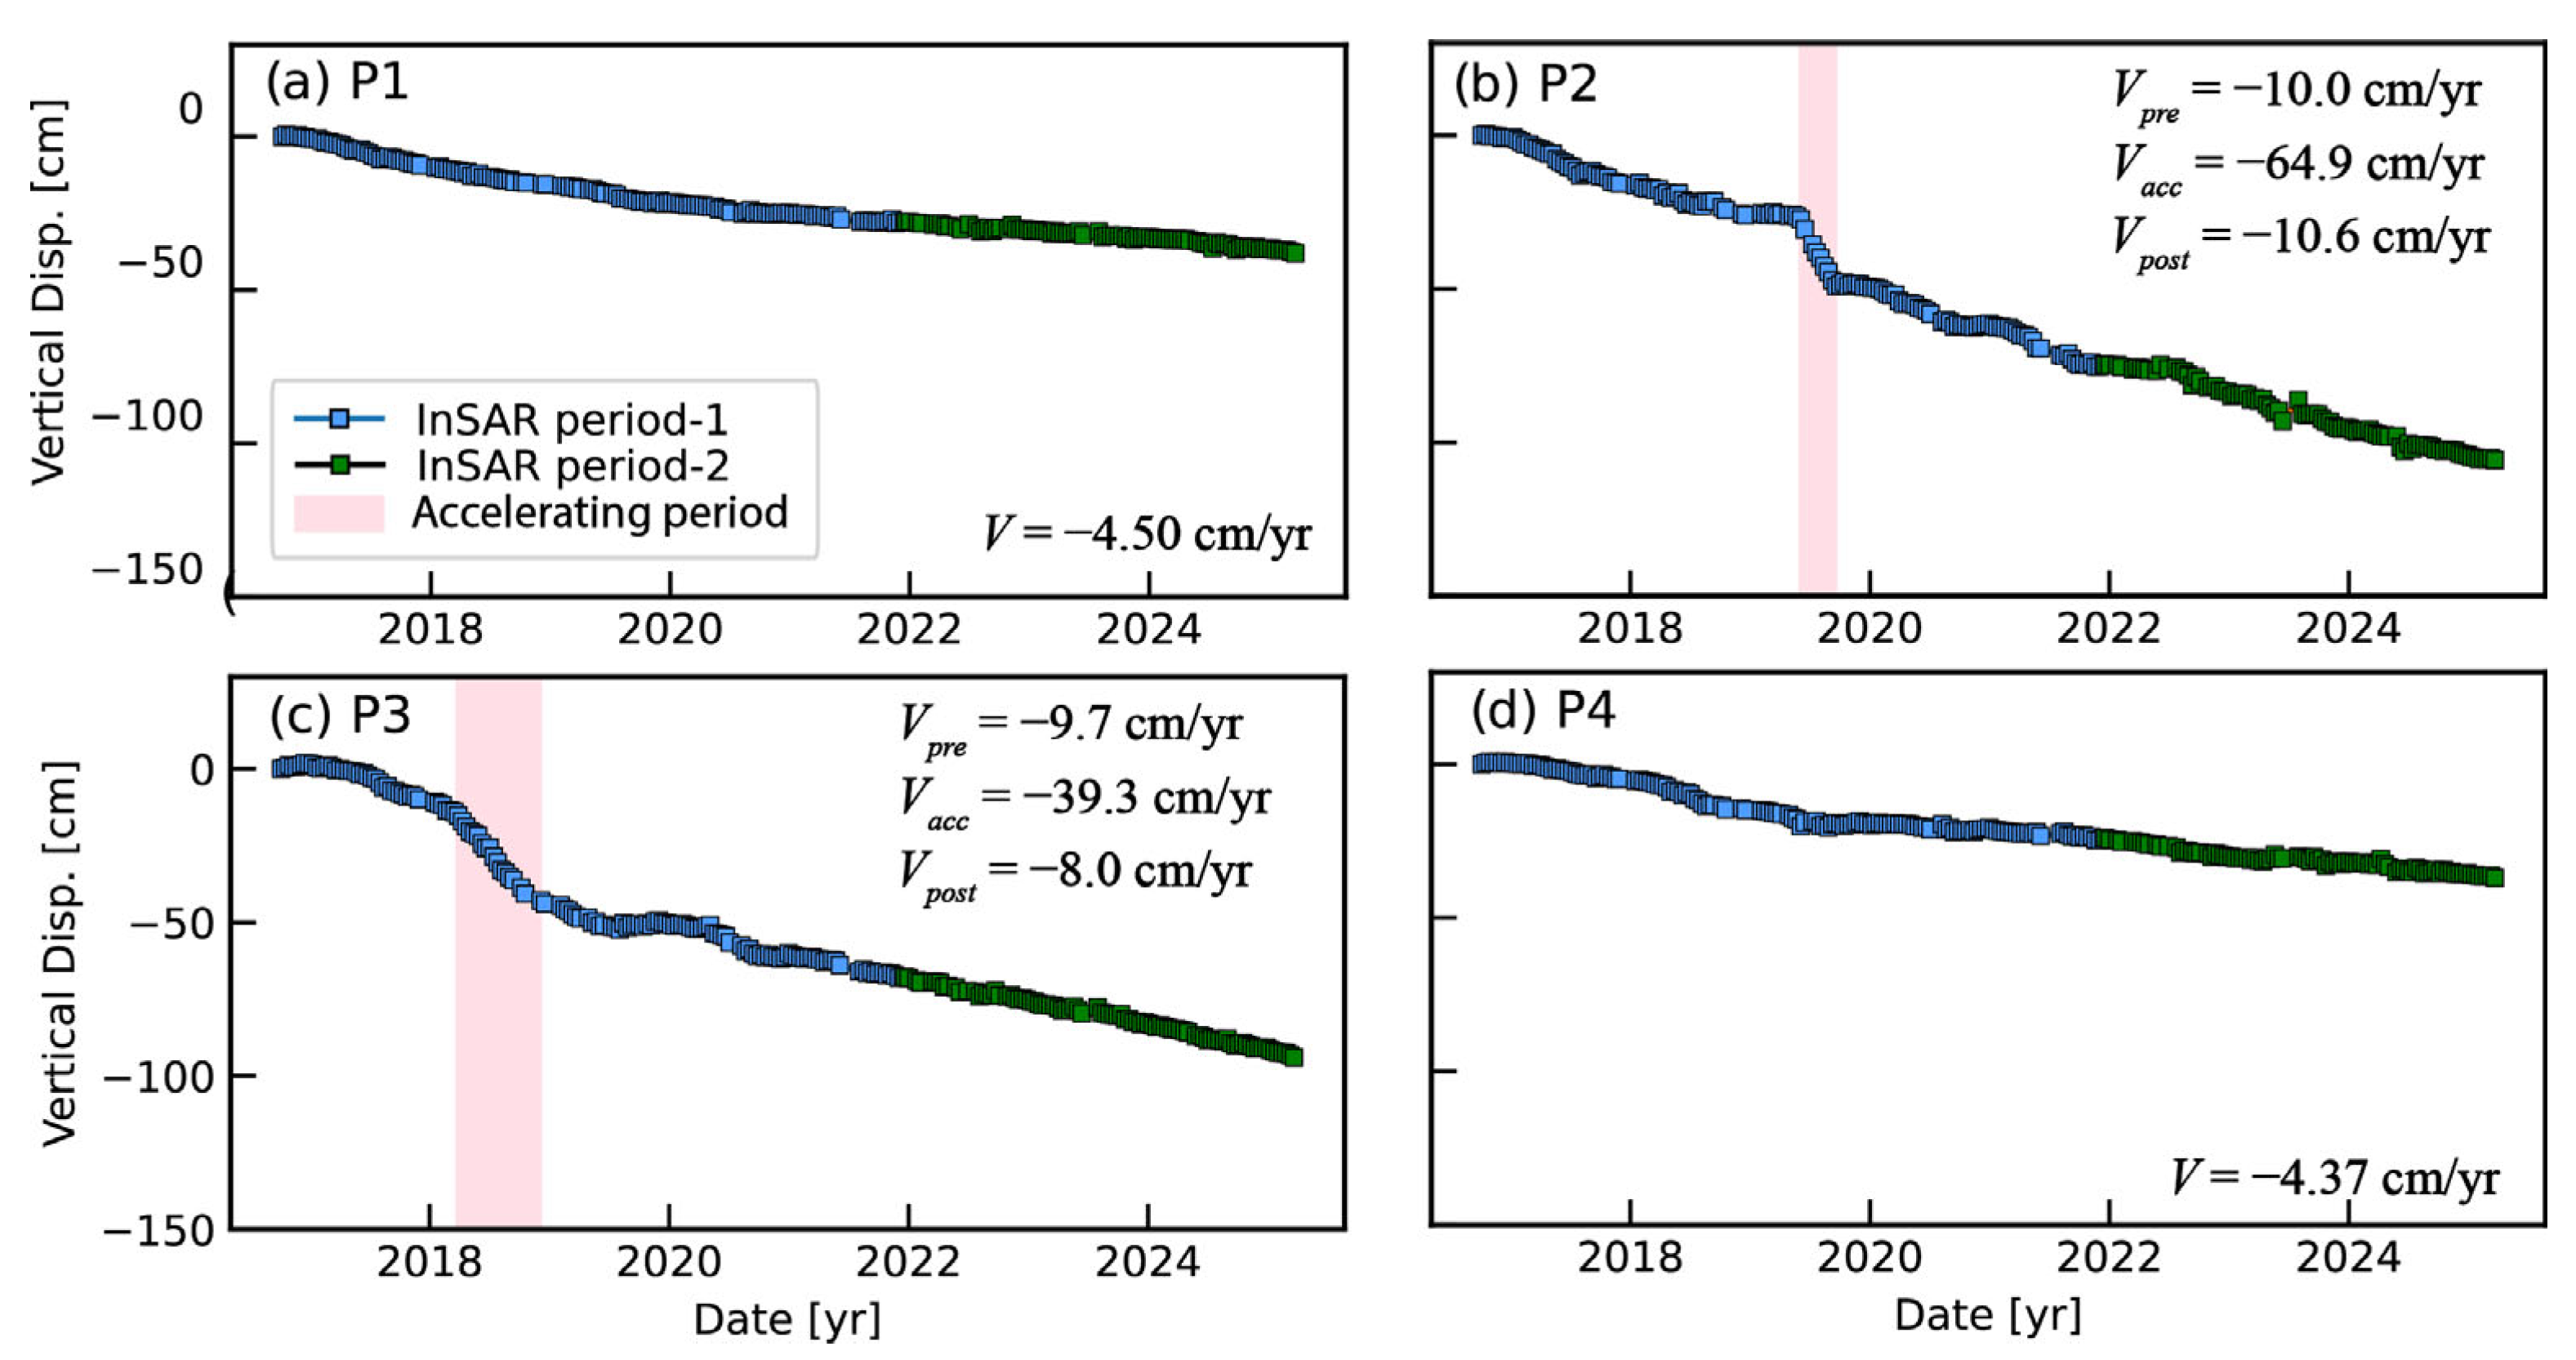
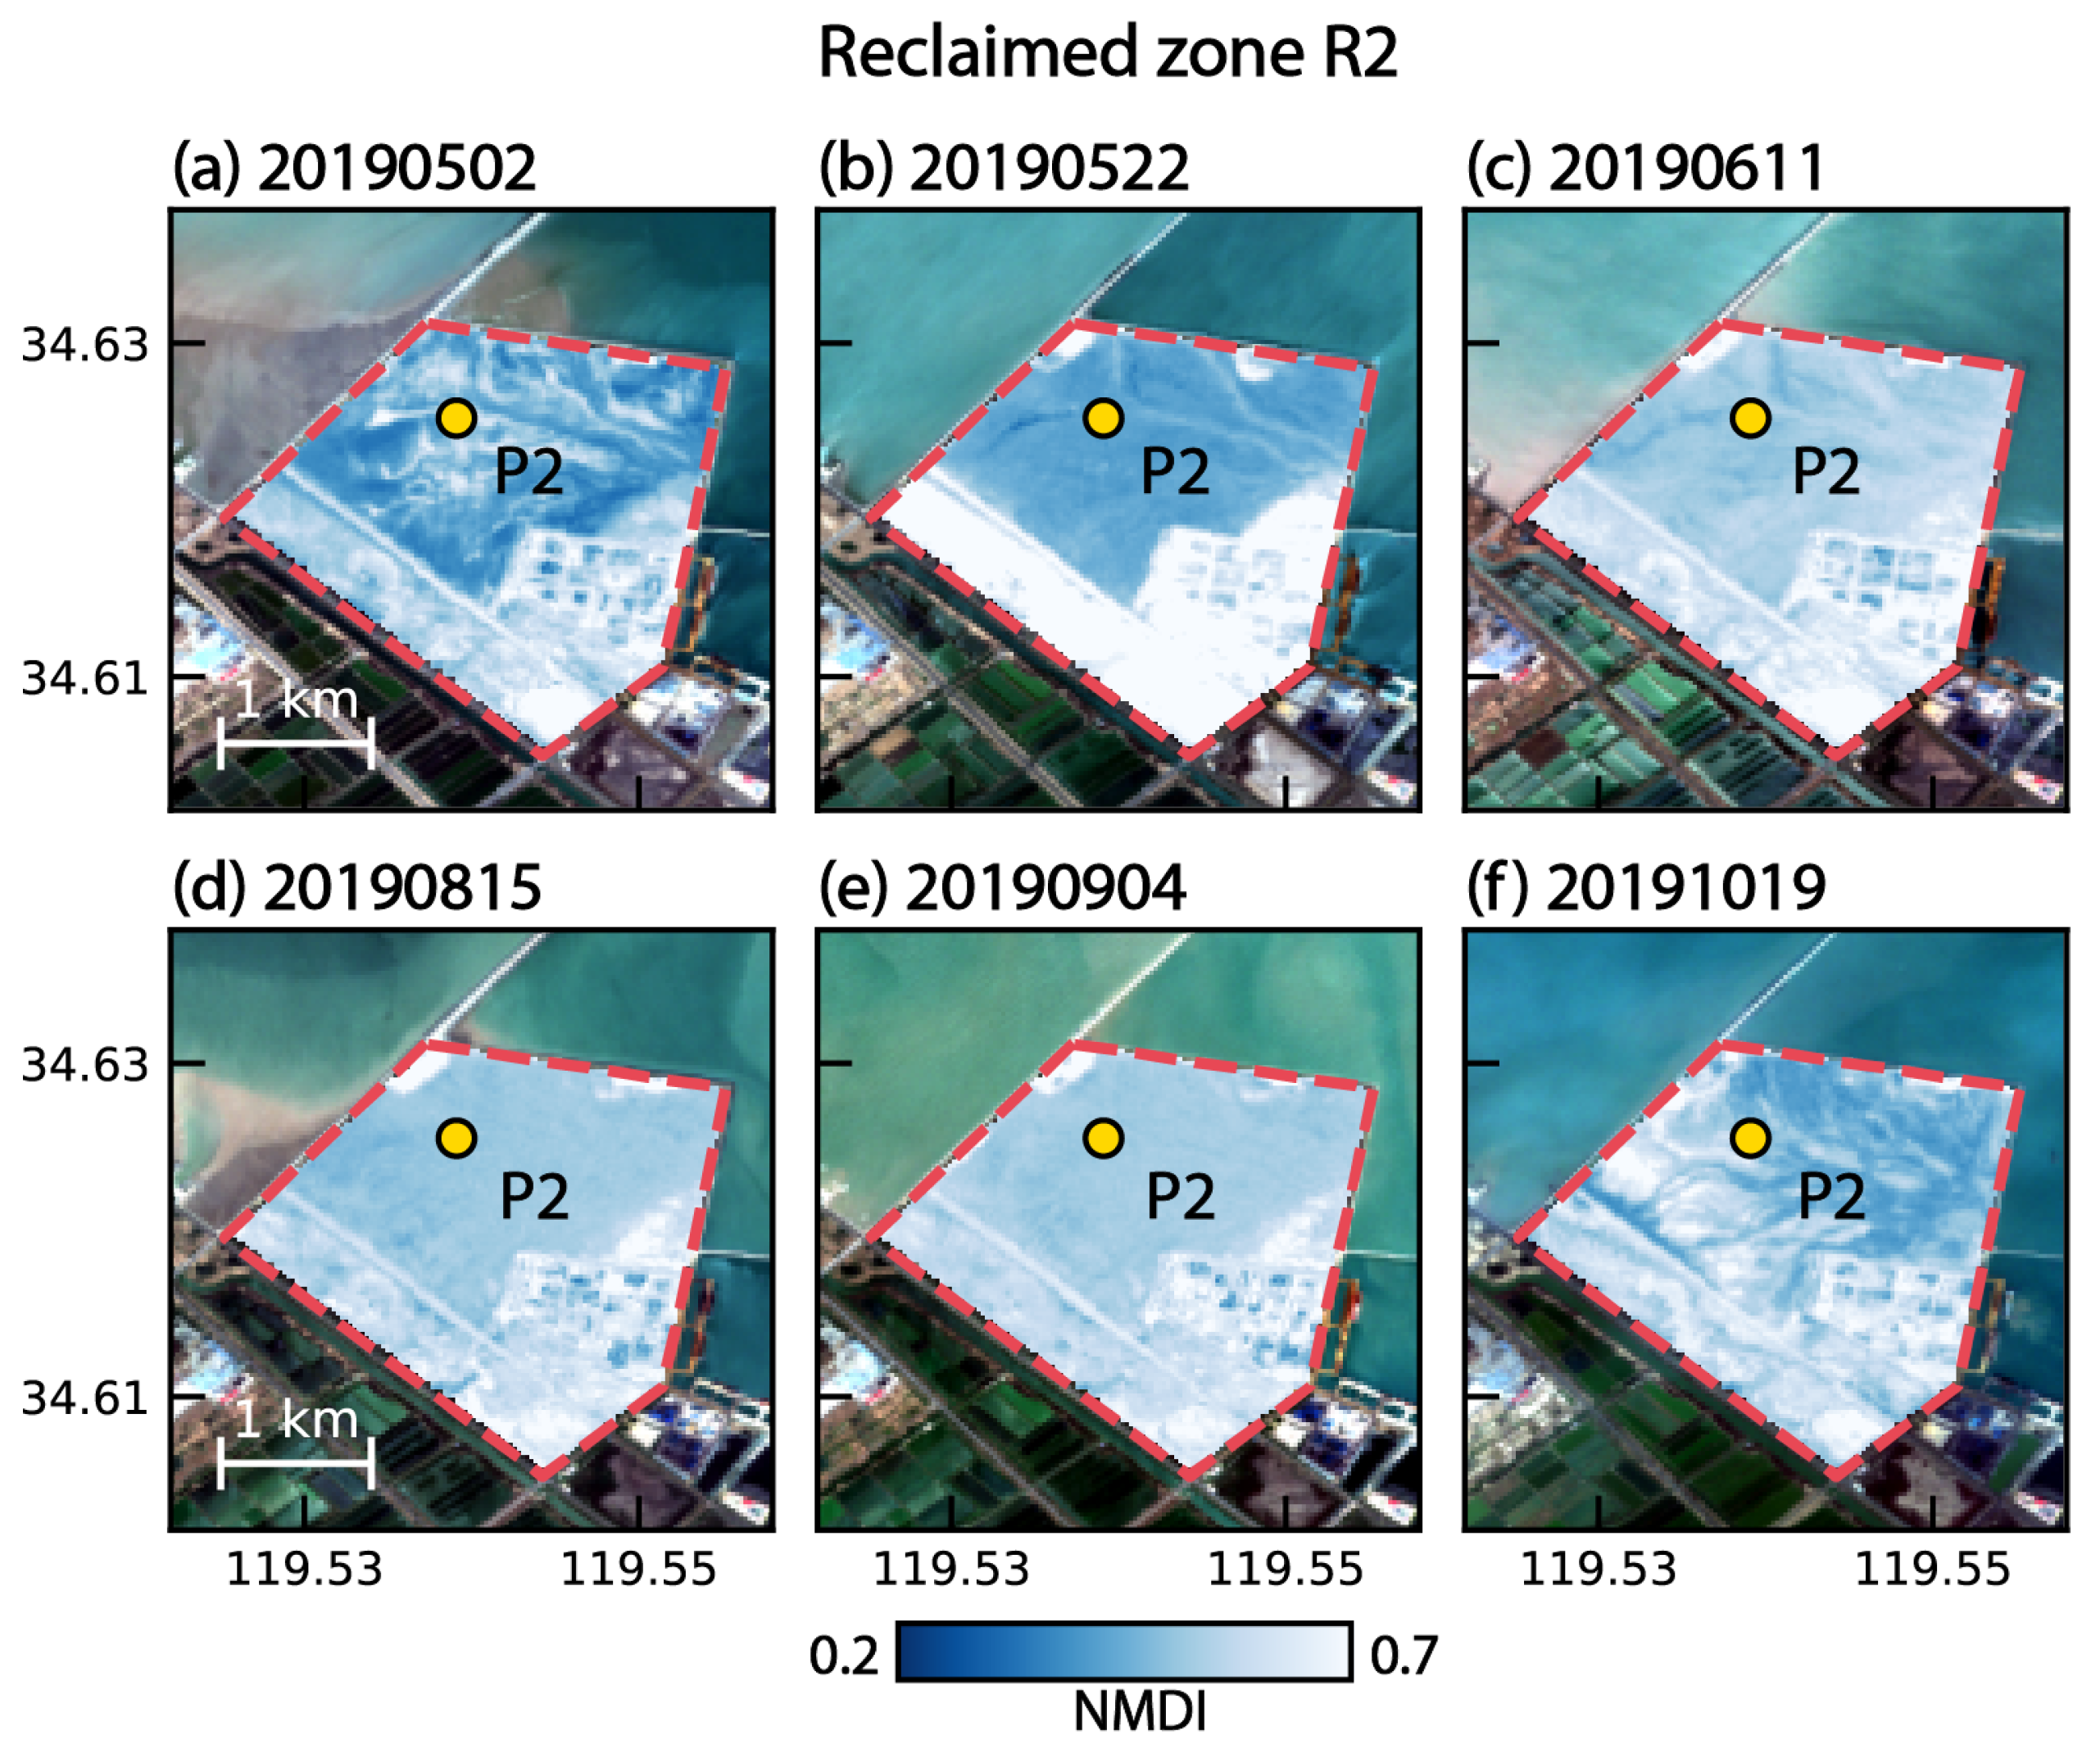
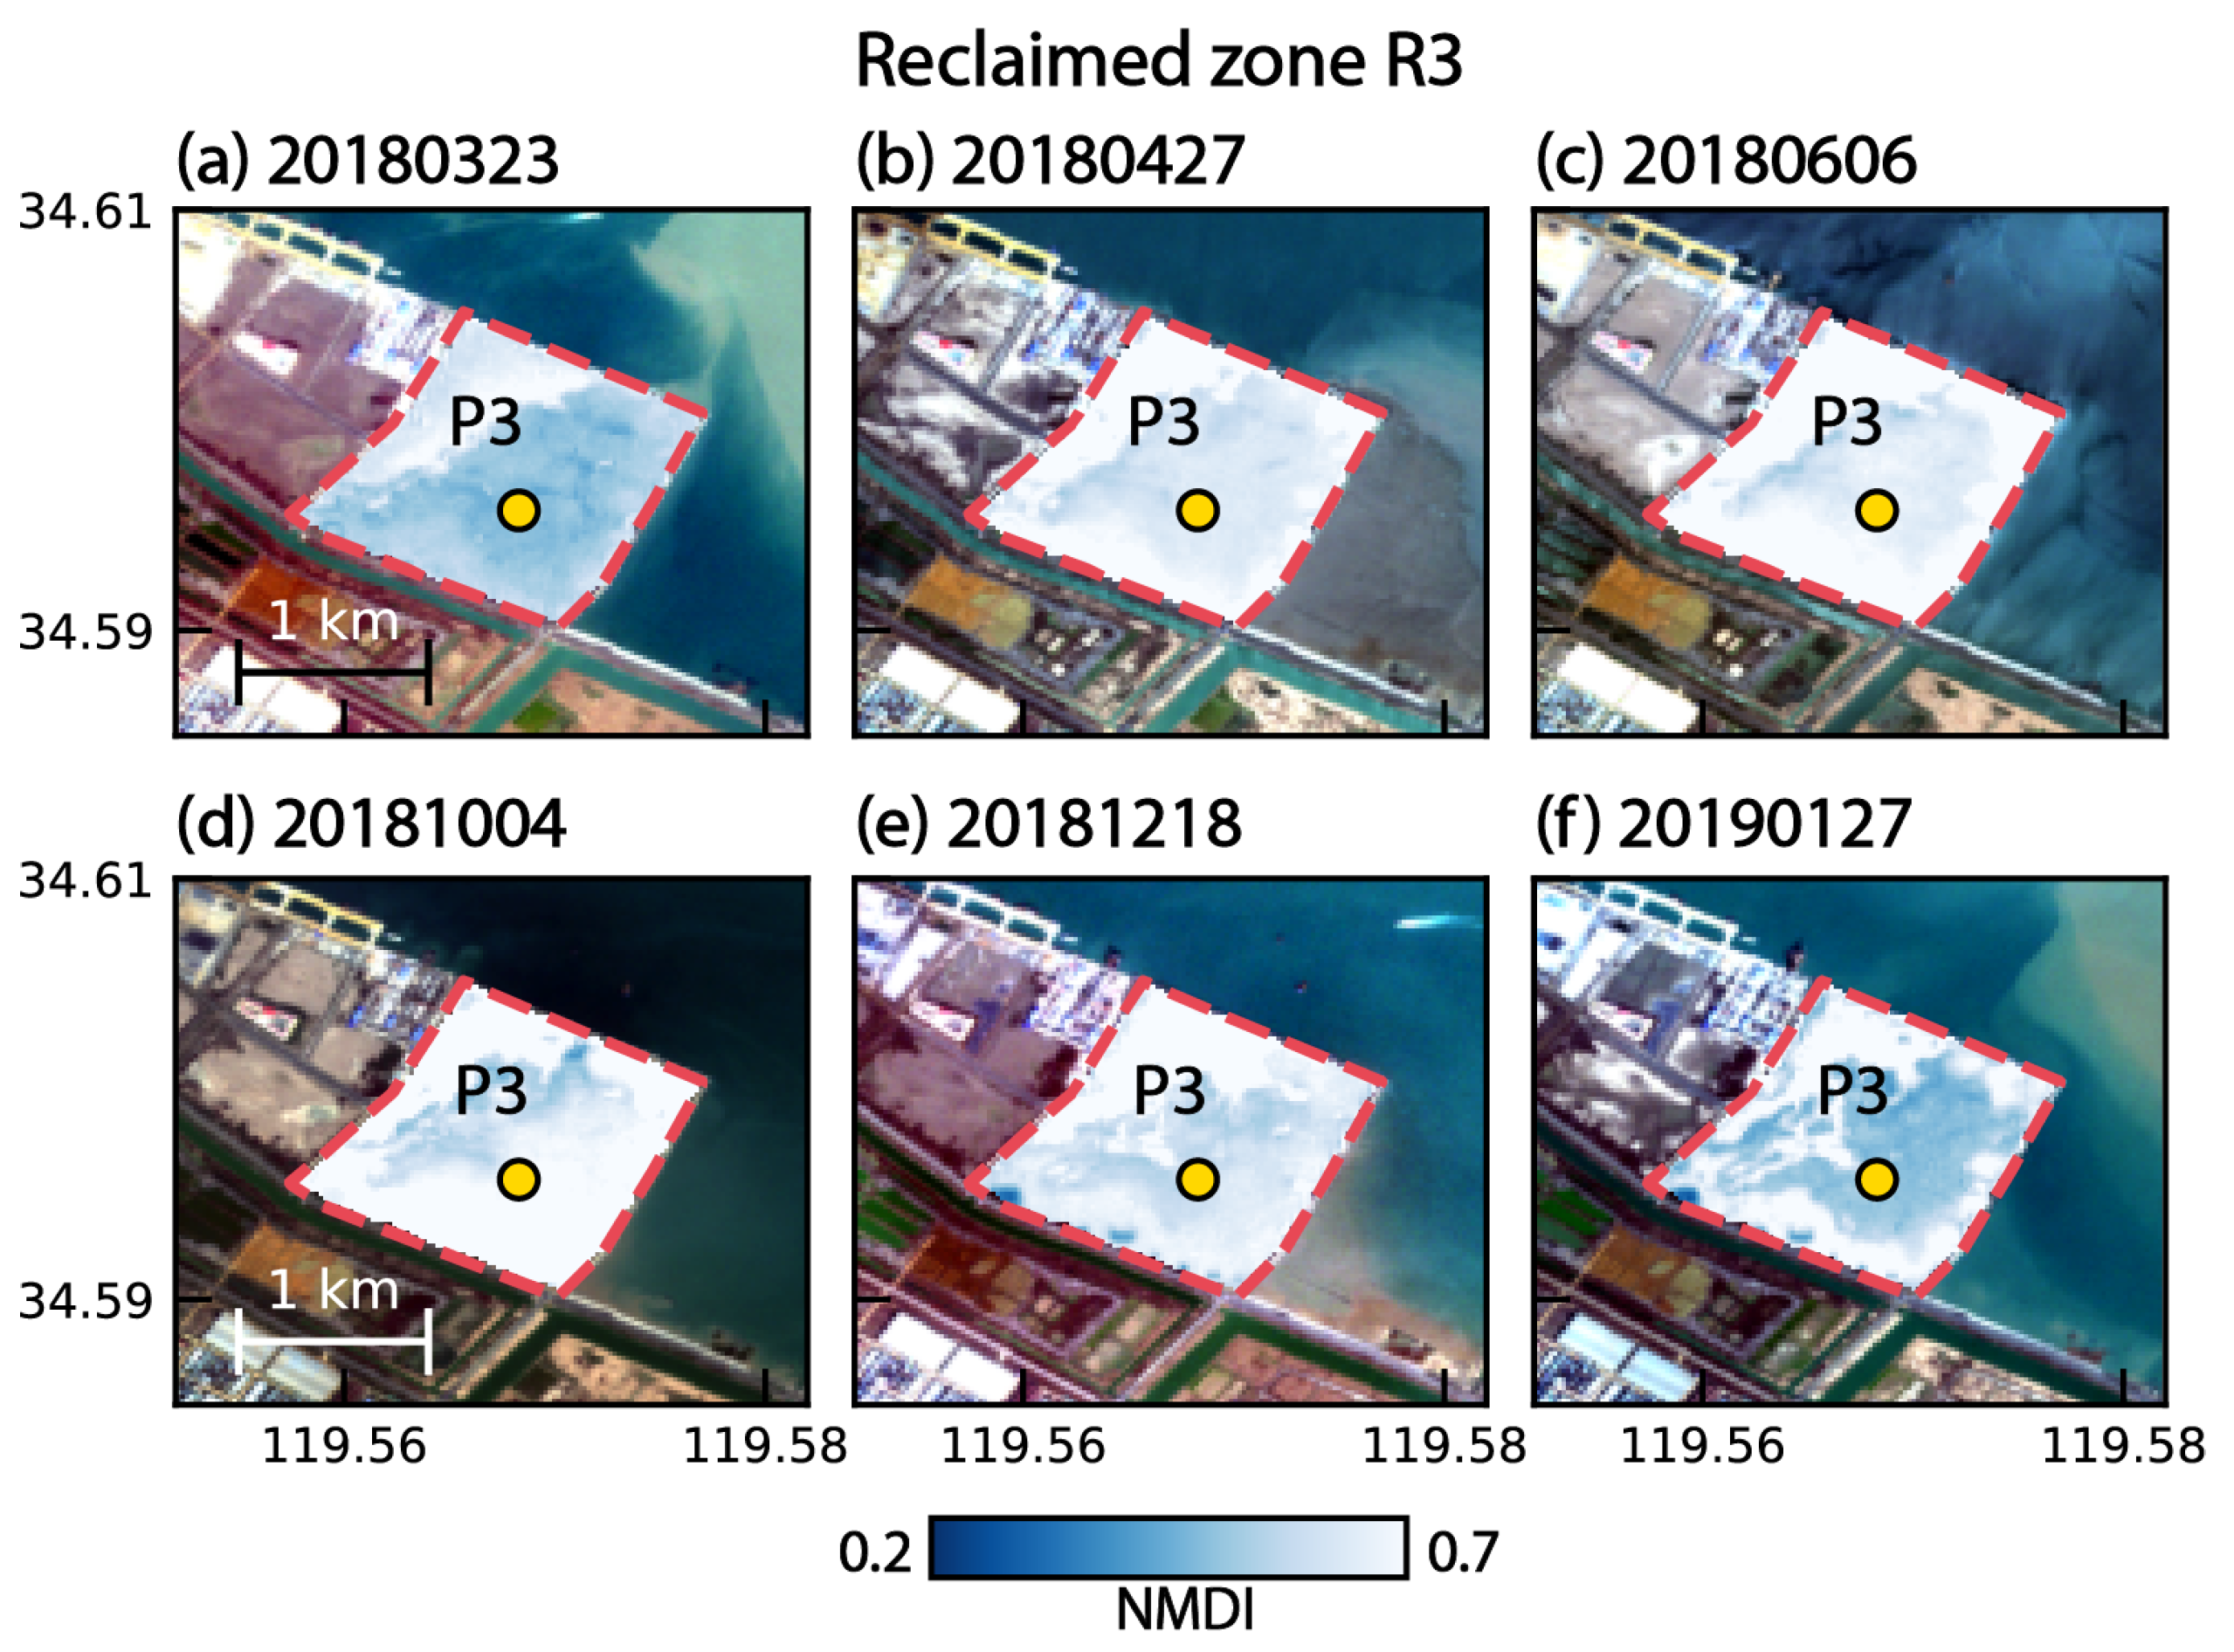
For the four reclamation zones R1–R4 (Figure 1a), maximum deformation points P1–P4 were selected to characterize settlement patterns (Figure 12). At Zone R2 (Point P2), three distinct deformation phases occurred (Figure 12b): (1) a linear trend of −10.0 cm/yr (September 2016 to May 2019); (2) accelerated subsidence at −64.9 cm/yr (June 2019 to early October 2019); (3) post-acceleration stabilization at −10.6 cm/yr from late October 2019 to March 2025. Similar behavior occurred at Zone R3 (Figure 12c), exhibiting acceleration to −39.3 cm/yr (April 2018 to December 2018) with stable rates of −9.7 cm/yr (pre-acceleration) and −8.0 cm/yr (post-acceleration). This acceleration period may correlate with groundwater decline and soil desiccation [5], where reduced pore pressure elevates effective stress in estuarine sediments. Consequently, the soil skeleton undergoes enhanced compression through particle rearrangement and void reduction [37], explaining the observed acceleration in P2 and P3. We further applied the Normalized Multi-band Drought Index (NMDI) to demonstrate this progressive desiccation process [38]. The NMDI exploits differential water absorption characteristics between the shortwave infrared (SWIR) and near-infrared (NIR) spectral bands to soil and vegetation, as defined by Equation (6):
N M D I =   N I R ( S W I R 1 S W I R 2 ) N I R + ( S W I R 1 S W I R 2 )
in which the NIR, SWIR1, and SWIR2 correspond to Sentinel-2 Band 8A, Band 11, and Band 12. In reclaimed zone R2, the pre- and post-acceleration deformation periods show an average NMDI of 0.45 (Figure 13a,b,f), while drier soil conditions between June and September 2019 yielded an NMDI of 0.57 (Figure 13c–e). A similar trend occurred in zone R3, where average NMDI increased from 0.56 to 0.67, indicating progressive drying in April to December, 2018 (Figure 14b–e). Conversely, selected points P1 and P4 exhibit linear subsidence at −4.50 cm/yr and −4.37 cm/yr, respectively, indicating stable consolidation conditions. Building loads in these zones likely drives the consolidation during static external rates [4].

4. Discussion

4.1. The Mechanism of Dam Deformation

To better understand the process and mechanism in breakwater dams, we implemented an analytical model derived from centrifuge experiments, simulating time-dependent self-weight consolidation [39], as follows:
S t = S m ( t λ ) k λ + t λ
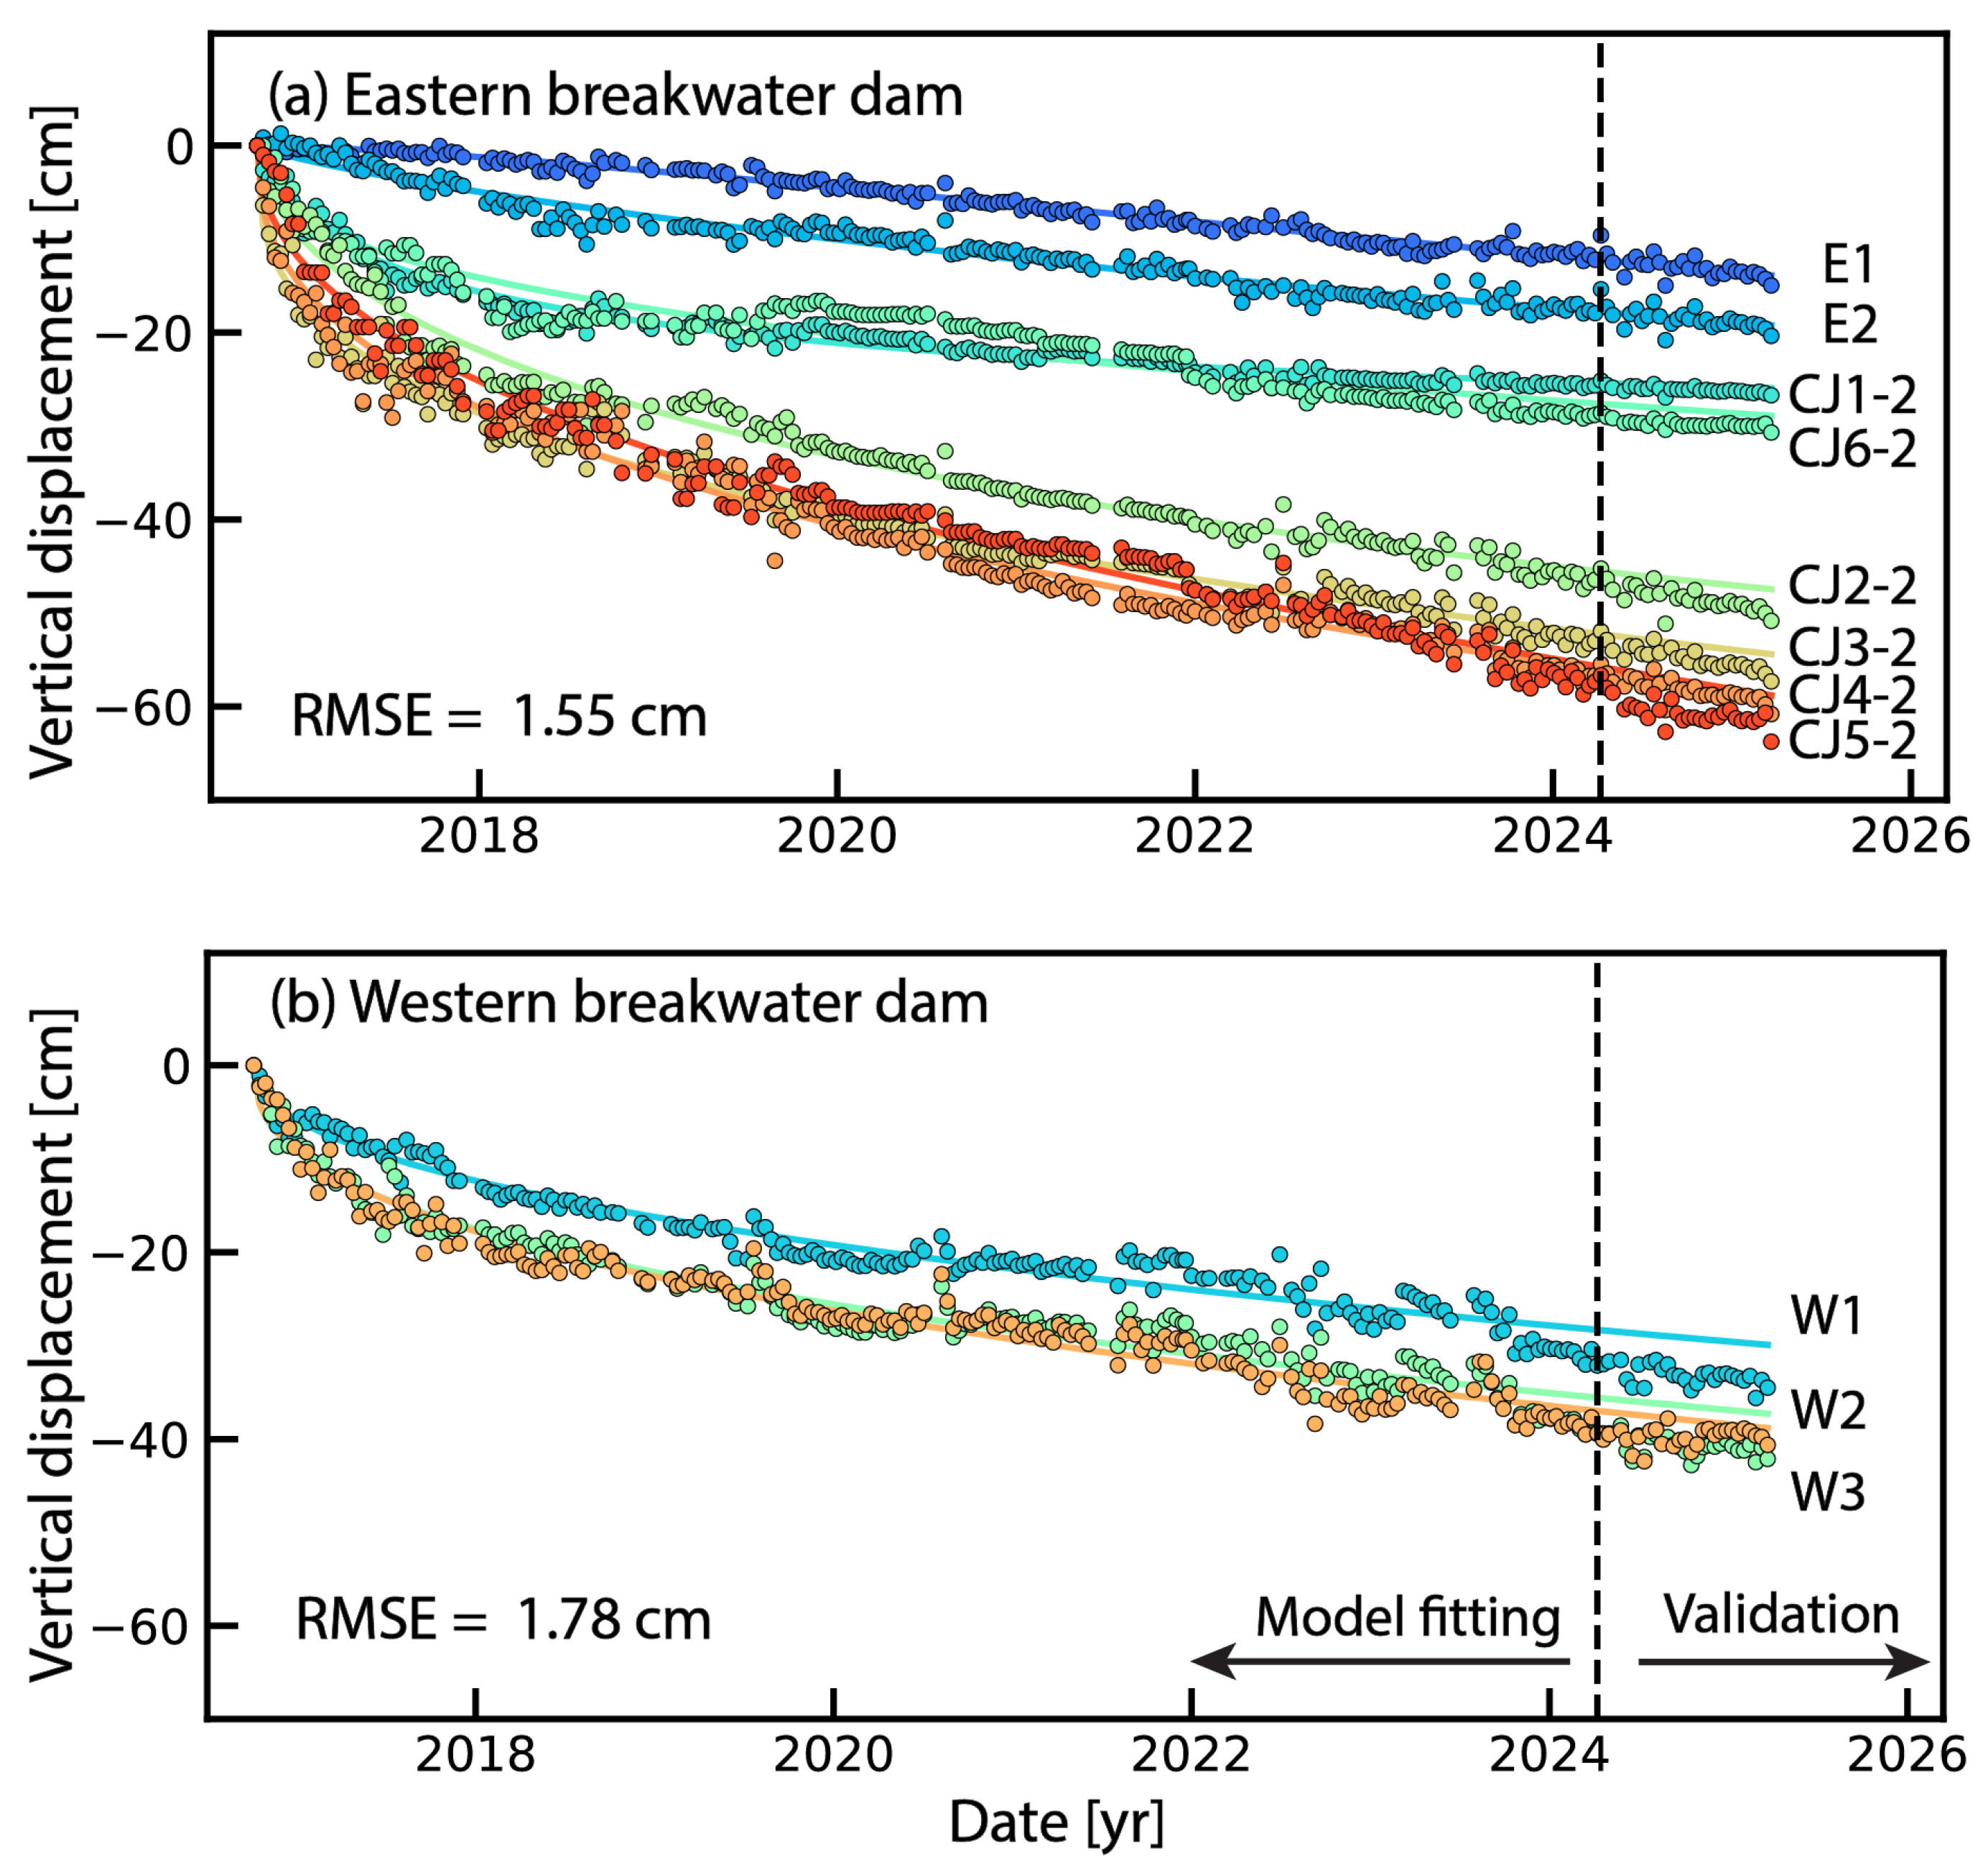
in which S ( t ) and S m represent the subsidence in the time epoch t relative to the starting time, and the ultimate subsidence at the infinity time period, respectively. k and λ are the dimensionless parameters that define the curvature of the time-dependent consolidation process, which need to be calibrated by the observation data. To calibrate the consolidation model with InSAR data, the initial setup of maximum settlement was set to 1.25 times of the 2016–2025 observed maximum deformation with convergence achieved within 10,000 iterations. Model parameters were calibrated using the first 200 epochs (October 2016–March 2024), with the remaining 30 epochs (April 2024–March 2025) reserved for validation. The RMSEs for the observation and consolidation model are 1.55 cm (eastern dam) and 1.78 cm (western dam) (Figure 15). It indicates that the secondary consolidation primarily contributes to the observed deformation [40]. This process occurs under constant effective stress when: (1) primary consolidation completes (i.e., excess pore pressure dissipates); (2) soil skeleton creep initiates time-dependent deformation.
Conversely, precast concrete dams lack consolidation behavior due to their rigid composite structure. Their deformation arises from three mechanisms: elastic response to hydrostatic pressure, thermal effects (internal hydration/external cycles), and foundation compression under dam weight [41,42]. Therefore, as no clear seasonal deformation has been detected from InSAR, the observed linear deformation may have a combination effect for the elastic deformation due to the hydrostatic stress and the compression of foundation.

4.2. The Implications of Port Subsidence and Sea Level Rise

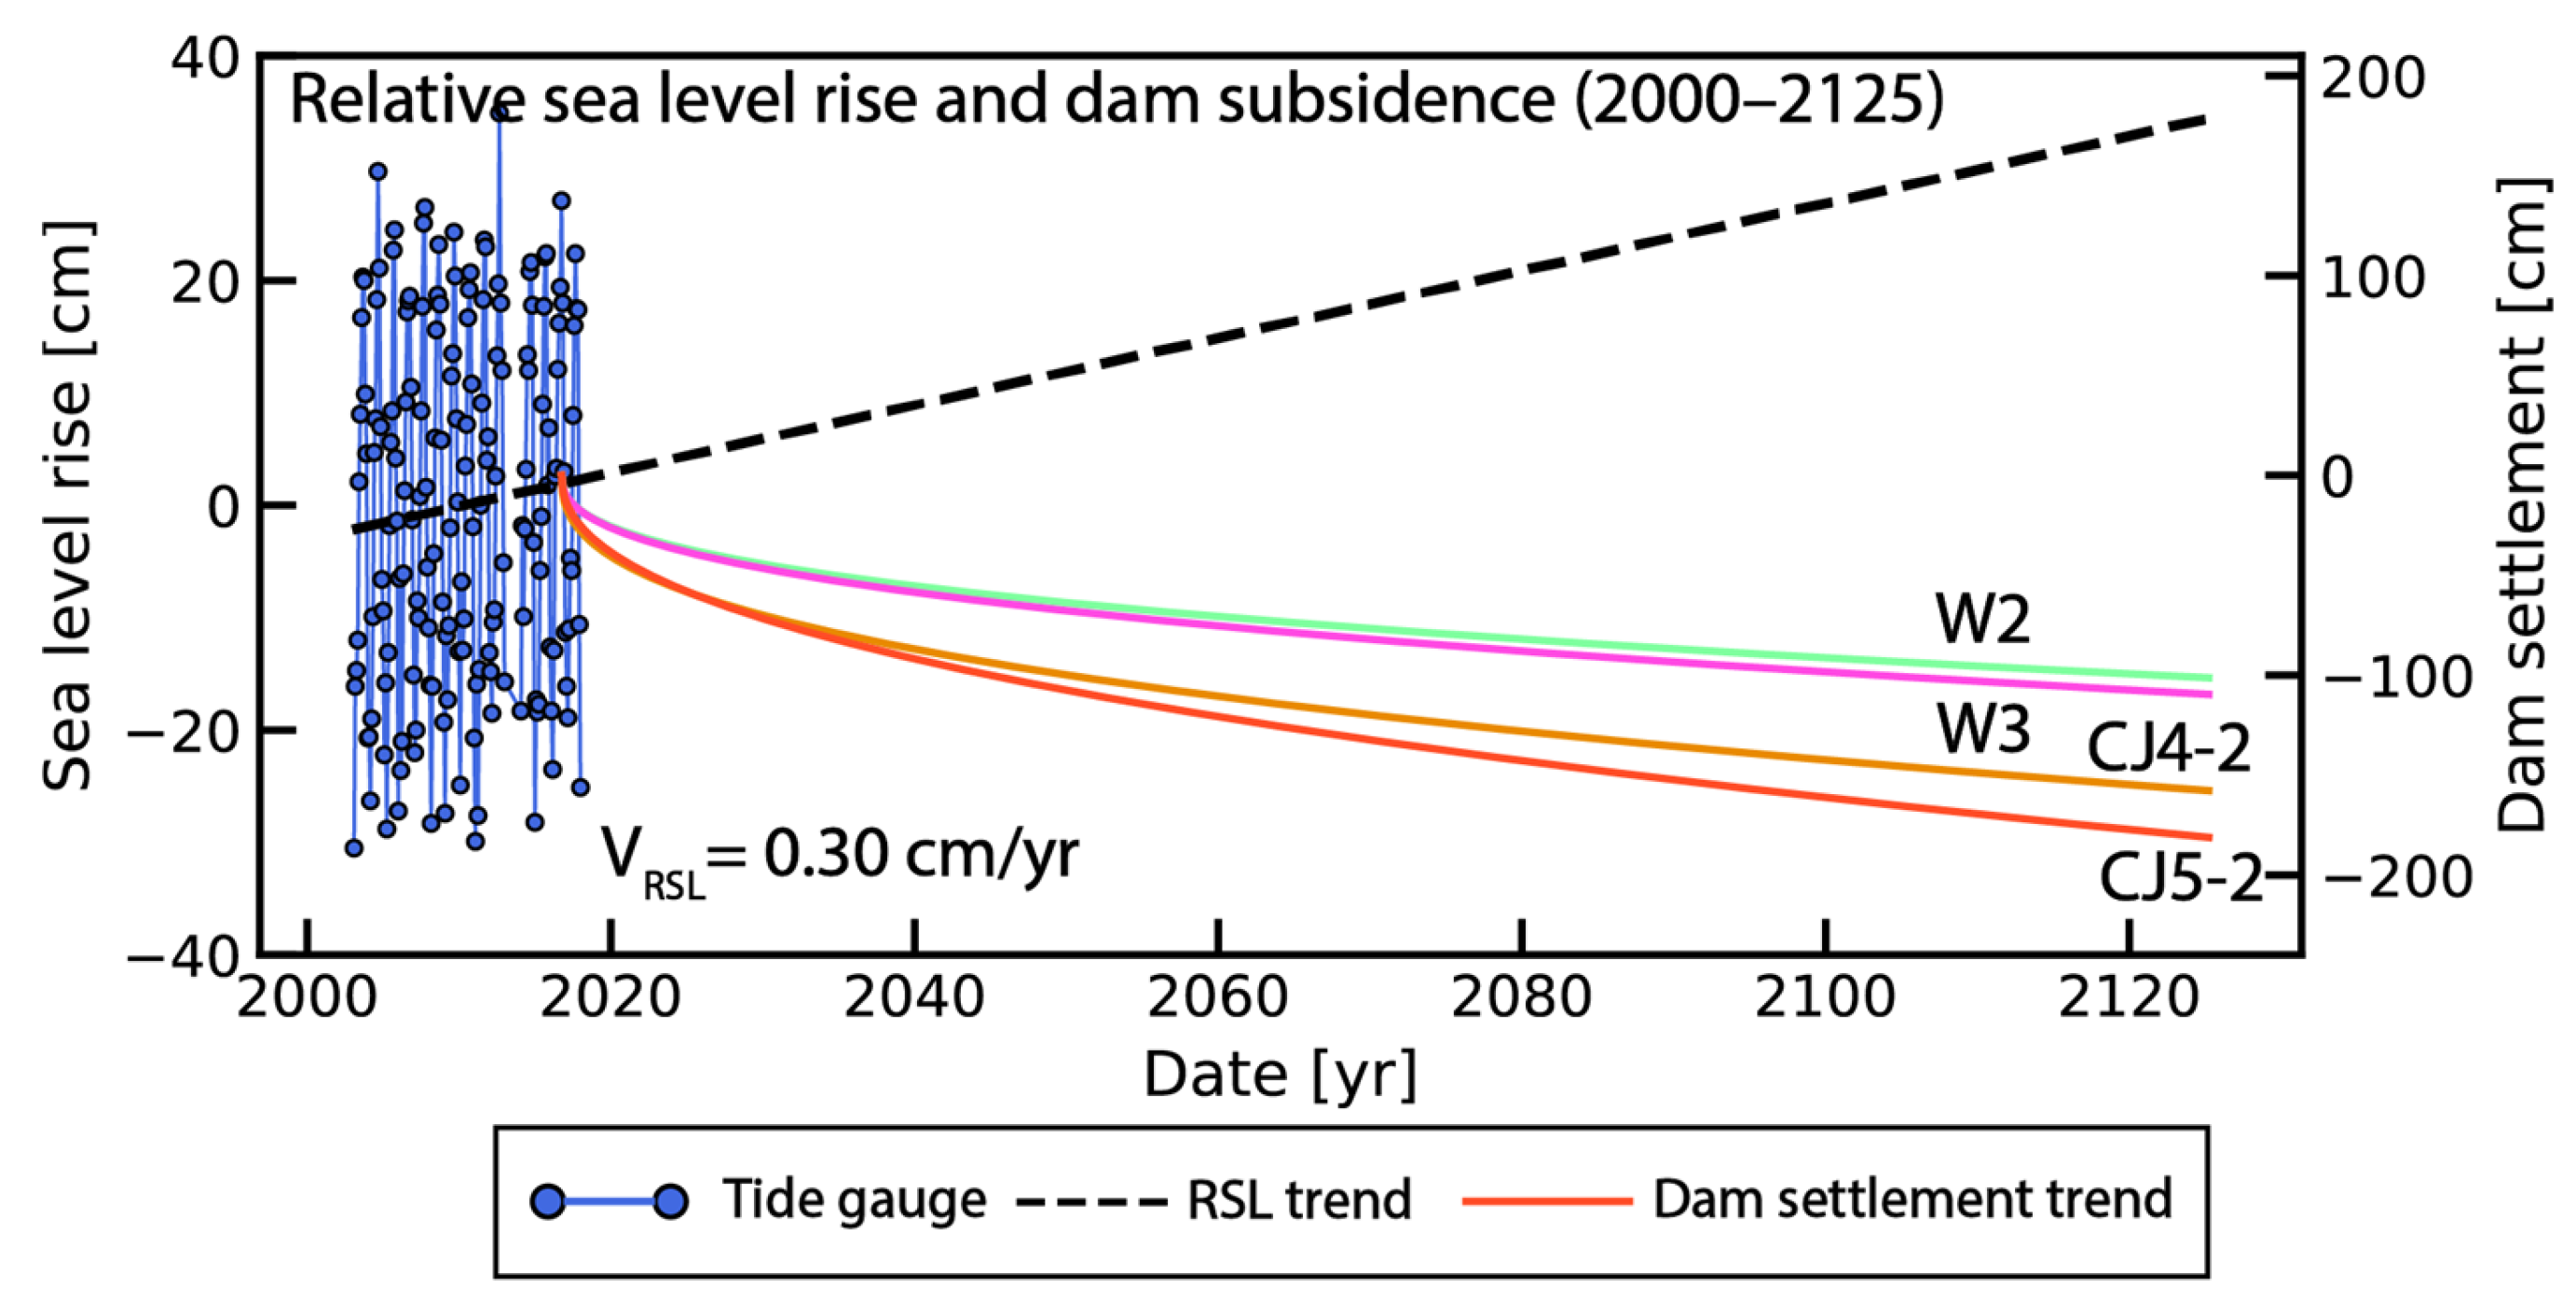
This study demonstrates InSAR capability to monitor long-term heterogeneous deformation across port infrastructure. It also highlights the critical need for subsidence control in harbors, facing accelerated global sea level rise. At Lianyungang, relative sea level rise reached +0.30 cm/yr (2003–2018) [43], exceeding the mean uplift of the Yellow Sea (0.231 ± 0.109 cm/yr). For rock-sand fill breakwater dams, structural elevations for low and high-water levels are +0.47 and +5.41 m, respectively. The base elevation for the bottom mud layer is −4.22 m, the height of the dam crest is +8.00 m, and wave wall is +10.50 m. Thus, this configuration provided +2.6 m freeboard from high water to dam crest and 5.1 m to the top of wave wall. However, the existing subsidence starting from the completion of dam construction may have already exceeded 1.0 m. Therefore, the effective freeboard is reduced to less than 1.6 m. According to the constant rate for the gauge measurement in the last 15 years, the sea level rise should be +0.30 m in the 100-year projection to 2125 (Figure 16). Correspondingly, the consolidation model indicates the subsidence of eastern dam will reach −0.98 m (CJ4-2) to −1.22 m (CJ5-2). The subsidence of western breakwater is −0.64 m (W2) to −0.71 m (W3). Consequently, dam crest to water freeboard will diminish to 0.08–0.31 m. Considering storm surges in Lianyungang may be higher than 1.0 m, although concrete wave wall clearance remains 2.58–2.81 m, this margin presents a threat when combined with projected sea level rise acceleration (2–3 mm/yr) [44,45], and increased extreme event frequency (annual occurrences by 2050), creating substantial flooding risks with continuous deformation on the breakwater dam.

5. Conclusions

In this study, we investigated decadal-scale surface deformation at Xuwei Port, China in the period 2016–2025 using continuous InSAR observations. Combining both the PS-InSAR and DS-InSAR time-series analysis, we resolved heterogeneous deformation patterns across two breakwaters and four reclaimed zones. Cross-validation with multi-track InSAR data and leveling measurements validate the high accuracy of derived deformation with RMSEs of ~0.3 cm and ~1.0 cm, respectively. We found that the rock-sand fill breakwaters experienced substantial subsidence of 15.0–63.8 cm, driven by pore pressure dissipation during soil consolidation. Concrete tubular sections exhibited limited displacement of −5.2 to −10.6 cm, maybe attributable to elastic deformation and foundation compression. Reclamation zones R2 and R3 showed acceleration deformation with the settlement rate of −64.9 cm/yr and −39.3 cm/yr, linked to sediment desiccation, groundwater depletion, and drainage. Consolidation modeling, coupled with sea level projections, indicates that the dam crest freeboard will decline from 1.6 m by 2025 to 0.08–0.31 m by 2125, reducing safety margins over 80%. Our findings highlight the capability of InSAR in monitoring the spatial and temporal deformation patterns for the coastal dams and reclaimed lands in a decadal scale. It also quantifies the critical risks in the scenario of sea level rise, informing the essential adaptation to protect flood-resilient infrastructures. Future high-resolution (e.g., <5 m resolution) and multi-geometry SAR data will facilitate identification of finer-scale deformations across structural components, such as horizontal displacements on the slope and crest. Additionally, tidal effects should be accounted for in assessing both seasonal deformation and dam submergence risks.

Author Contributions

Conceptualization, L.X.; methodology, L.X.; software, L.X.; formal analysis, L.X., J.L., E.A., and W.X.; writing—original draft preparation, L.X.; writing—review and editing, L.X., S.W., W.X., E.A., and X.W.; visualization, L.X., and J.L.; funding acquisition, L.X., and W.X. All authors have read and agreed to the published version of the manuscript.

Funding

The research was funded by the National Natural Science Foundation of China (42304037, 42174023), Hunan Province Dam Safety and Disease Prevention Engineering Research Center (Hndam2023kf05), and Natural Science Foundation of Hunan Province (2025JJ60239).

Data Availability Statement

The data supporting this article will be made available by the authors upon request.

Acknowledgments

We thank for the ESA and USGS for the Sentinel-1/2 and Landsat-7/8 data.

Conflicts of Interest

The authors declare no conflicts of interest.

References

  1. Monioudi, I.Ν.; Asariotis, R.; Becker, A.; Bhat, C.; Dowding-Gooden, D.; Esteban, M.; Feyen, L.; Mentaschi, L.; Nikolaou, A.; Nurse, L.; et al. Climate Change Impacts on Critical International Transportation Assets of Caribbean Small Island Developing States (SIDS): The Case of Jamaica and Saint Lucia. Reg. Environ. Change 2018, 18, 2211–2225. [Google Scholar] [CrossRef]
  2. Esteban, M.; Takagi, H.; Nicholls, R.J.; Fatma, D.; Pratama, M.B.; Kurobe, S.; Yi, X.; Ikeda, I.; Mikami, T.; Valenzuela, P.; et al. Adapting Ports to Sea-Level Rise: Empirical Lessons Based on Land Subsidence in Indonesia and Japan. Marit. Policy Manag. 2020, 47, 937–952. [Google Scholar] [CrossRef]
  3. Mega, V.P. Conscious Coastal Cities: Sustainability, Blue Green Growth, and The Politics of Imagination; Springer International Publishing: Cham, Switzerland, 2016; ISBN 978-3-319-20217-4. [Google Scholar]
  4. Jiang, Z.; Shi, G.; Wu, S.; Ding, X.; Zhao, C.; Wong, M.S.; Lu, Z. Unveiling Multimodal Consolidation Process of the Newly Reclaimed HKIA 3rd Runway from Satellite SAR Interferometry, ICA Analytics and Terzaghi Consolidation Theory. Remote Sens. Environ. 2025, 318, 114561. [Google Scholar] [CrossRef]
  5. Zhang, Z.; Wu, S.; Shi, G.; Ding, X.; Zhao, C.; Zhang, B.; Chen, L.; Lu, Z. Mapping Ground Deformation in the Northern Yangtze River Estuary Using Improved MT-InSAR Based on ICA and Non-Stationary Analysis. Geo-Spat. Inf. Sci. 2025, 1–20. [Google Scholar] [CrossRef]
  6. Aziz Zanjani, F.; Amelung, F.; Piter, A.; Sobhan, K.; Tavakkoliestahbanati, A.; Eberli, G.P.; Haghighi, M.H.; Motagh, M.; Milillo, P.; Mirzaee, S.; et al. InSAR Observations of Construction-Induced Coastal Subsidence on Miami’s Barrier Islands, Florida. Earth Space Sci. 2024, 11, e2024EA003852. [Google Scholar] [CrossRef]
  7. Shen, P.; Wang, C.; An, B. AdpPL: An Adaptive Phase Linking-Based Distributed Scatterer Interferometry with Emphasis on Interferometric Pair Selection Optimization and Adaptive Regularization. Remote Sens. Environ. 2023, 295, 113687. [Google Scholar] [CrossRef]
  8. Martín-Antón, M.; Negro, V.; del Campo, J.M.; López-Gutiérrez, J.S.; Esteban, M.D. Review of Coastal Land Reclamation Situation in the World. J. Coast. Res. 2016, 75, 667–671. [Google Scholar] [CrossRef]
  9. Emadali, L.; Motagh, M.; Haghshenas Haghighi, M. Characterizing Post-Construction Settlement of the Masjed-Soleyman Embankment Dam, Southwest Iran, Using TerraSAR-X SpotLight Radar Imagery. Eng. Struct. 2017, 143, 261–273. [Google Scholar] [CrossRef]
  10. Li, S.; Xu, W.; Li, Z. Review of the SBAS InSAR Time-Series Algorithms, Applications, and Challenges. Geod. Geodyn. 2022, 13, 114–126. [Google Scholar] [CrossRef]
  11. Shen, P.; Wang, C.; Liao, M.; Lu, Z.; Dong, J.; Dai, K. Research Progress of Phase Linking Method in Time-Series InSAR. Geomat. Inf. Sci. Wuhan Univ. 2025, 50, 1483–1497. [Google Scholar] [CrossRef]
  12. Aswathi, J.; Binoj Kumar, R.B.; Oommen, T.; Bouali, E.H.; Sajinkumar, K.S. InSAR as a Tool for Monitoring Hydropower Projects: A Review. Energy Geosci. 2022, 3, 160–171. [Google Scholar] [CrossRef]
  13. Xie, L.; Xu, W.; Aoki, Y. Extracting a Decadal Deformation on Xiaolangdi Upstream Dam Slope Using Seasonally Inundated Distributed Scatterers InSAR (SIDS-InSAR). Int. J. Appl. Earth Obs. Geoinf. 2025, 138, 104462. [Google Scholar] [CrossRef]
  14. Marchamalo-Sacristán, M.; Ruiz-Armenteros, A.M.; Lamas-Fernández, F.; González-Rodrigo, B.; Martínez-Marín, R.; Delgado-Blasco, J.M.; Bakon, M.; Lazecky, M.; Perissin, D.; Papco, J.; et al. MT-InSAR and Dam Modeling for the Comprehensive Monitoring of an Earth-Fill Dam: The Case of the Benínar Dam (Almería, Spain). Remote Sens. 2023, 15, 2802. [Google Scholar] [CrossRef]
  15. Liu, H.; Zhu, M.; Zhu, W.; Zhao, W.; Bai, Z.; Zhou, B.; Li, G.; Wang, Y. Soil and Rockfill Dams Safety Assessment for Henan Province: Monitoring, Analysis and Prediction. Remote Sens. 2023, 15, 4293. [Google Scholar] [CrossRef]
  16. Hanssen, R.F.; van Leijen, F.J. Monitoring Water Defense Structures Using Radar Interferometry. In Proceedings of the 2008 IEEE Radar Conference, Rome, Italy, 26–30 May 2008; pp. 1–4. [Google Scholar]
  17. Pros, F.; Gonzalez-Lopez, S.; Martinez-Benjamin, J.J.; Palau, V.; Duro, J. Breakwater Settlement Monitoring with InSAR Data. In Proceedings of the 2014 IEEE Geoscience and Remote Sensing Symposium, Quebec City, QC, Canada, 16 July 2014; pp. 414–417. [Google Scholar]
  18. Wasowski, J.; Bovenga, F.; Nutricato, R.; Nitti, D.O.; Chiaradia, M.T. High Resolution Satellite Multi-Temporal Interferometry for Monitoring Infrastructure Instability Hazards. Innov. Infrastruct. Solut. 2017, 2, 27. [Google Scholar] [CrossRef]
  19. Xiao, R.; Gao, X.; Wang, X.; Yuan, S.; Wu, Z.; He, X. Measuring Dam Deformation of Long-Distance Water Transfer Using Multi-Temporal Synthetic Aperture Radar Interferometry: A Case Study in South-to-North Water Diversion Project, China. Remote Sens. 2024, 16, 365. [Google Scholar] [CrossRef]
  20. Wang, Q.Q.; Huang, Q.H.; He, N.; He, B.; Wang, Z.C.; Wang, Y.A. Displacement Monitoring of Upper Atbara Dam Based on Time Series InSAR. Surv. Rev. 2020, 52, 485–496. [Google Scholar] [CrossRef]
  21. Huang, J.; Wang, B.; Cai, X.; Yan, B.; Li, G.; Li, W.; Zhao, C.; Yang, L.; Zheng, S.; Cui, L. Coastal Reclamation Embankment Deformation: Dynamic Monitoring and Future Trend Prediction Using Multi-Temporal InSAR Technology in Funing Bay, China. Remote Sens. 2024, 16, 4320. [Google Scholar] [CrossRef]
  22. Xie, L.; Xu, W.; Ding, X.; Bürgmann, R.; Giri, S.; Liu, X. A Multi-Platform, Open-Source, and Quantitative Remote Sensing Framework for Dam-Related Hazard Investigation: Insights into the 2020 Sardoba Dam Collapse. Int. J. Appl. Earth Obs. Geoinf. 2022, 111, 102849. [Google Scholar] [CrossRef]
  23. Xiao, R.; Jiang, M.; Li, Z.; He, X. New Insights into the 2020 Sardoba Dam Failure in Uzbekistan from Earth Observation. Int. J. Appl. Earth Obs. Geoinf. 2022, 107, 102705. [Google Scholar] [CrossRef]
  24. Wang, G.; Li, P.; Li, Z.; Ding, D.; Qiao, L.; Xu, J.; Li, G.; Wang, H. Coastal Dam Inundation Assessment for the Yellow River Delta: Measurements, Analysis and Scenario. Remote Sens. 2020, 12, 3658. [Google Scholar] [CrossRef]
  25. Huang, Q.; Wang, Q.; He, N.; Wang, Y.; Zhou, Y. Monitoring time-series settlements of breakwaters based on PSI. Chin. J. Geotech. Eng. 2019, 41, 761–768. (In Chinese) [Google Scholar] [CrossRef]
  26. Fan, X.; Pan, J. Research on breakwater settlement in Lianyungang by InSAR. Geospat. Inf. 2021, 19, 55–59. (In Chinese) [Google Scholar] [CrossRef]
  27. Huang, F. Analysis of water and sand characteristics along Lianyungang coastal and Xuwei port area. China Water Transp. 2024, 12, 79–80. (In Chinese) [Google Scholar] [CrossRef]
  28. He, Y. Research on Uneven Settlement Law and Its Influence on Crack Propagation of Utility Tunnel of Coastal Soft Foundation. Master Thesis, Henan Polytechnic University, Jiaozuo, China, 2022. (In Chinese). [Google Scholar]
  29. Shen, X.; Qi, X.; Ding, D. Breakwater project of Xuwei District in Lianyungang Port. China Harb. Eng. 2016, 36, 1–5. (In Chinese) [Google Scholar]
  30. Li, D.; Song, J. Formwork design and construction for standard barrel type breakwater Foundation in xuwei port. Constr. Technol. 2015, 44, 93–95. (In Chinese) [Google Scholar] [CrossRef]
  31. Rosen, P.A.; Gurrola, E.; Sacco, G.F.; Zebker, H. The InSAR Scientific Computing Environment; IEEE: Nuremberg, Germany, 2012. [Google Scholar]
  32. Ferretti, A.; Fumagalli, A.; Novali, F.; Prati, C.; Rocca, F.; Rucci, A. A New Algorithm for Processing Interferometric Data-Stacks: SqueeSAR. IEEE Trans. Geosci. Remote Sens. 2011, 49, 3460–3470. [Google Scholar] [CrossRef]
  33. Ansari, H.; De Zan, F.; Bamler, R. Efficient Phase Estimation for Interferogram Stacks. IEEE Trans. Geosci. Remote Sens. 2018, 56, 4109–4125. [Google Scholar] [CrossRef]
  34. Chen, C.W.; Zebker, H.A. Phase Unwrapping for Large SAR Interferograms: Statistical Segmentation and Generalized Network Models. IEEE Trans. Geosci. Remote Sens. 2002, 40, 1709–1719. [Google Scholar] [CrossRef]
  35. Jolivet, R.; Lasserre, C.; Doin, M.-P.; Guillaso, S.; Peltzer, G.; Dailu, R.; Sun, J.; Shen, Z.-K.; Xu, X. Shallow Creep on the Haiyuan Fault (Gansu, China) Revealed by SAR Interferometry: Creep on Haiyuan Fault. J. Geophys. Res. Solid Earth 2012, 117, B06401. [Google Scholar] [CrossRef]
  36. Fattahi, H.; Amelung, F. DEM Error Correction in InSAR Time Series. IEEE Trans. Geosci. Remote Sens. 2013, 51, 4249–4259. [Google Scholar] [CrossRef]
  37. Terzaghi, K.; Peck, R.B.; Mesri, G. Soil Mechanics in Engineering Practice, 3rd ed.; Wiley: New York, NY, USA, 1996; ISBN 978-0-471-08658-1. [Google Scholar]
  38. Wang, L.; Qu, J.J. NMDI: A Normalized Multi-band Drought Index for Monitoring Soil and Vegetation Moisture with Satellite Remote Sensing. Geophys. Res. Lett. 2007, 34, 2007GL031021. [Google Scholar] [CrossRef]
  39. Li, G.; Zhao, C.; Wang, B.; Liu, X.; Chen, H. Land Subsidence Monitoring and Dynamic Prediction of Reclaimed Islands with Multi-Temporal InSAR Techniques in Xiamen and Zhangzhou Cities, China. Remote Sens. 2022, 14, 2930. [Google Scholar] [CrossRef]
  40. Tedd, P.; Charles, C.J.A.; Holton, I.R.; Robertshaw, A.C. The Effect of Reservoir Drawdown and Long-Term Consolidation on the Deformation of Old Embankment Dams. Géotechnique 1997, 47, 33–48. [Google Scholar] [CrossRef]
  41. Kang, F.; Liu, J.; Li, J.; Li, S. Concrete Dam Deformation Prediction Model for Health Monitoring Based on Extreme Learning Machine. Struct. Control Health Monit. 2017, 24, e1997. [Google Scholar] [CrossRef]
  42. Qu, X.; Yang, J.; Chang, M. A Deep Learning Model for Concrete Dam Deformation Prediction Based on RS-LSTM. J. Sens. 2019, 2019, 4581672. [Google Scholar] [CrossRef]
  43. Zhou, D.; Liu, Y.; Feng, Y.; Zhang, H.; Fu, Y.; Liu, Y.; Tang, Q. Absolute Sea Level Changes Along the Coast of China from Tide Gauges, GNSS, and Satellite Altimetry. J. Geophys. Res. Ocean. 2022, 127, e2022JC018994. [Google Scholar] [CrossRef]
  44. Li, W.-S.; Wang, H.; Xiang, W.-X.; Wang, A.-M.; Xu, W.-Q.; Jiang, Y.-X.; Wu, X.-H.; Quan, M.-Y. Sea-Level Change in Coastal Areas of China: Status in 2021. Adv. Clim. Change Res. 2024, 15, 515–524. [Google Scholar] [CrossRef]
  45. Liu, B.; Xu, S.; Yin, K. Spatial Inhomogeneity Analyses of Extreme Sea Levels along Lianyungang Coast Based on Numerical Simulation and Monte Carlo Model. Reg. Stud. Mar. Sci. 2024, 79, 103856. [Google Scholar] [CrossRef]
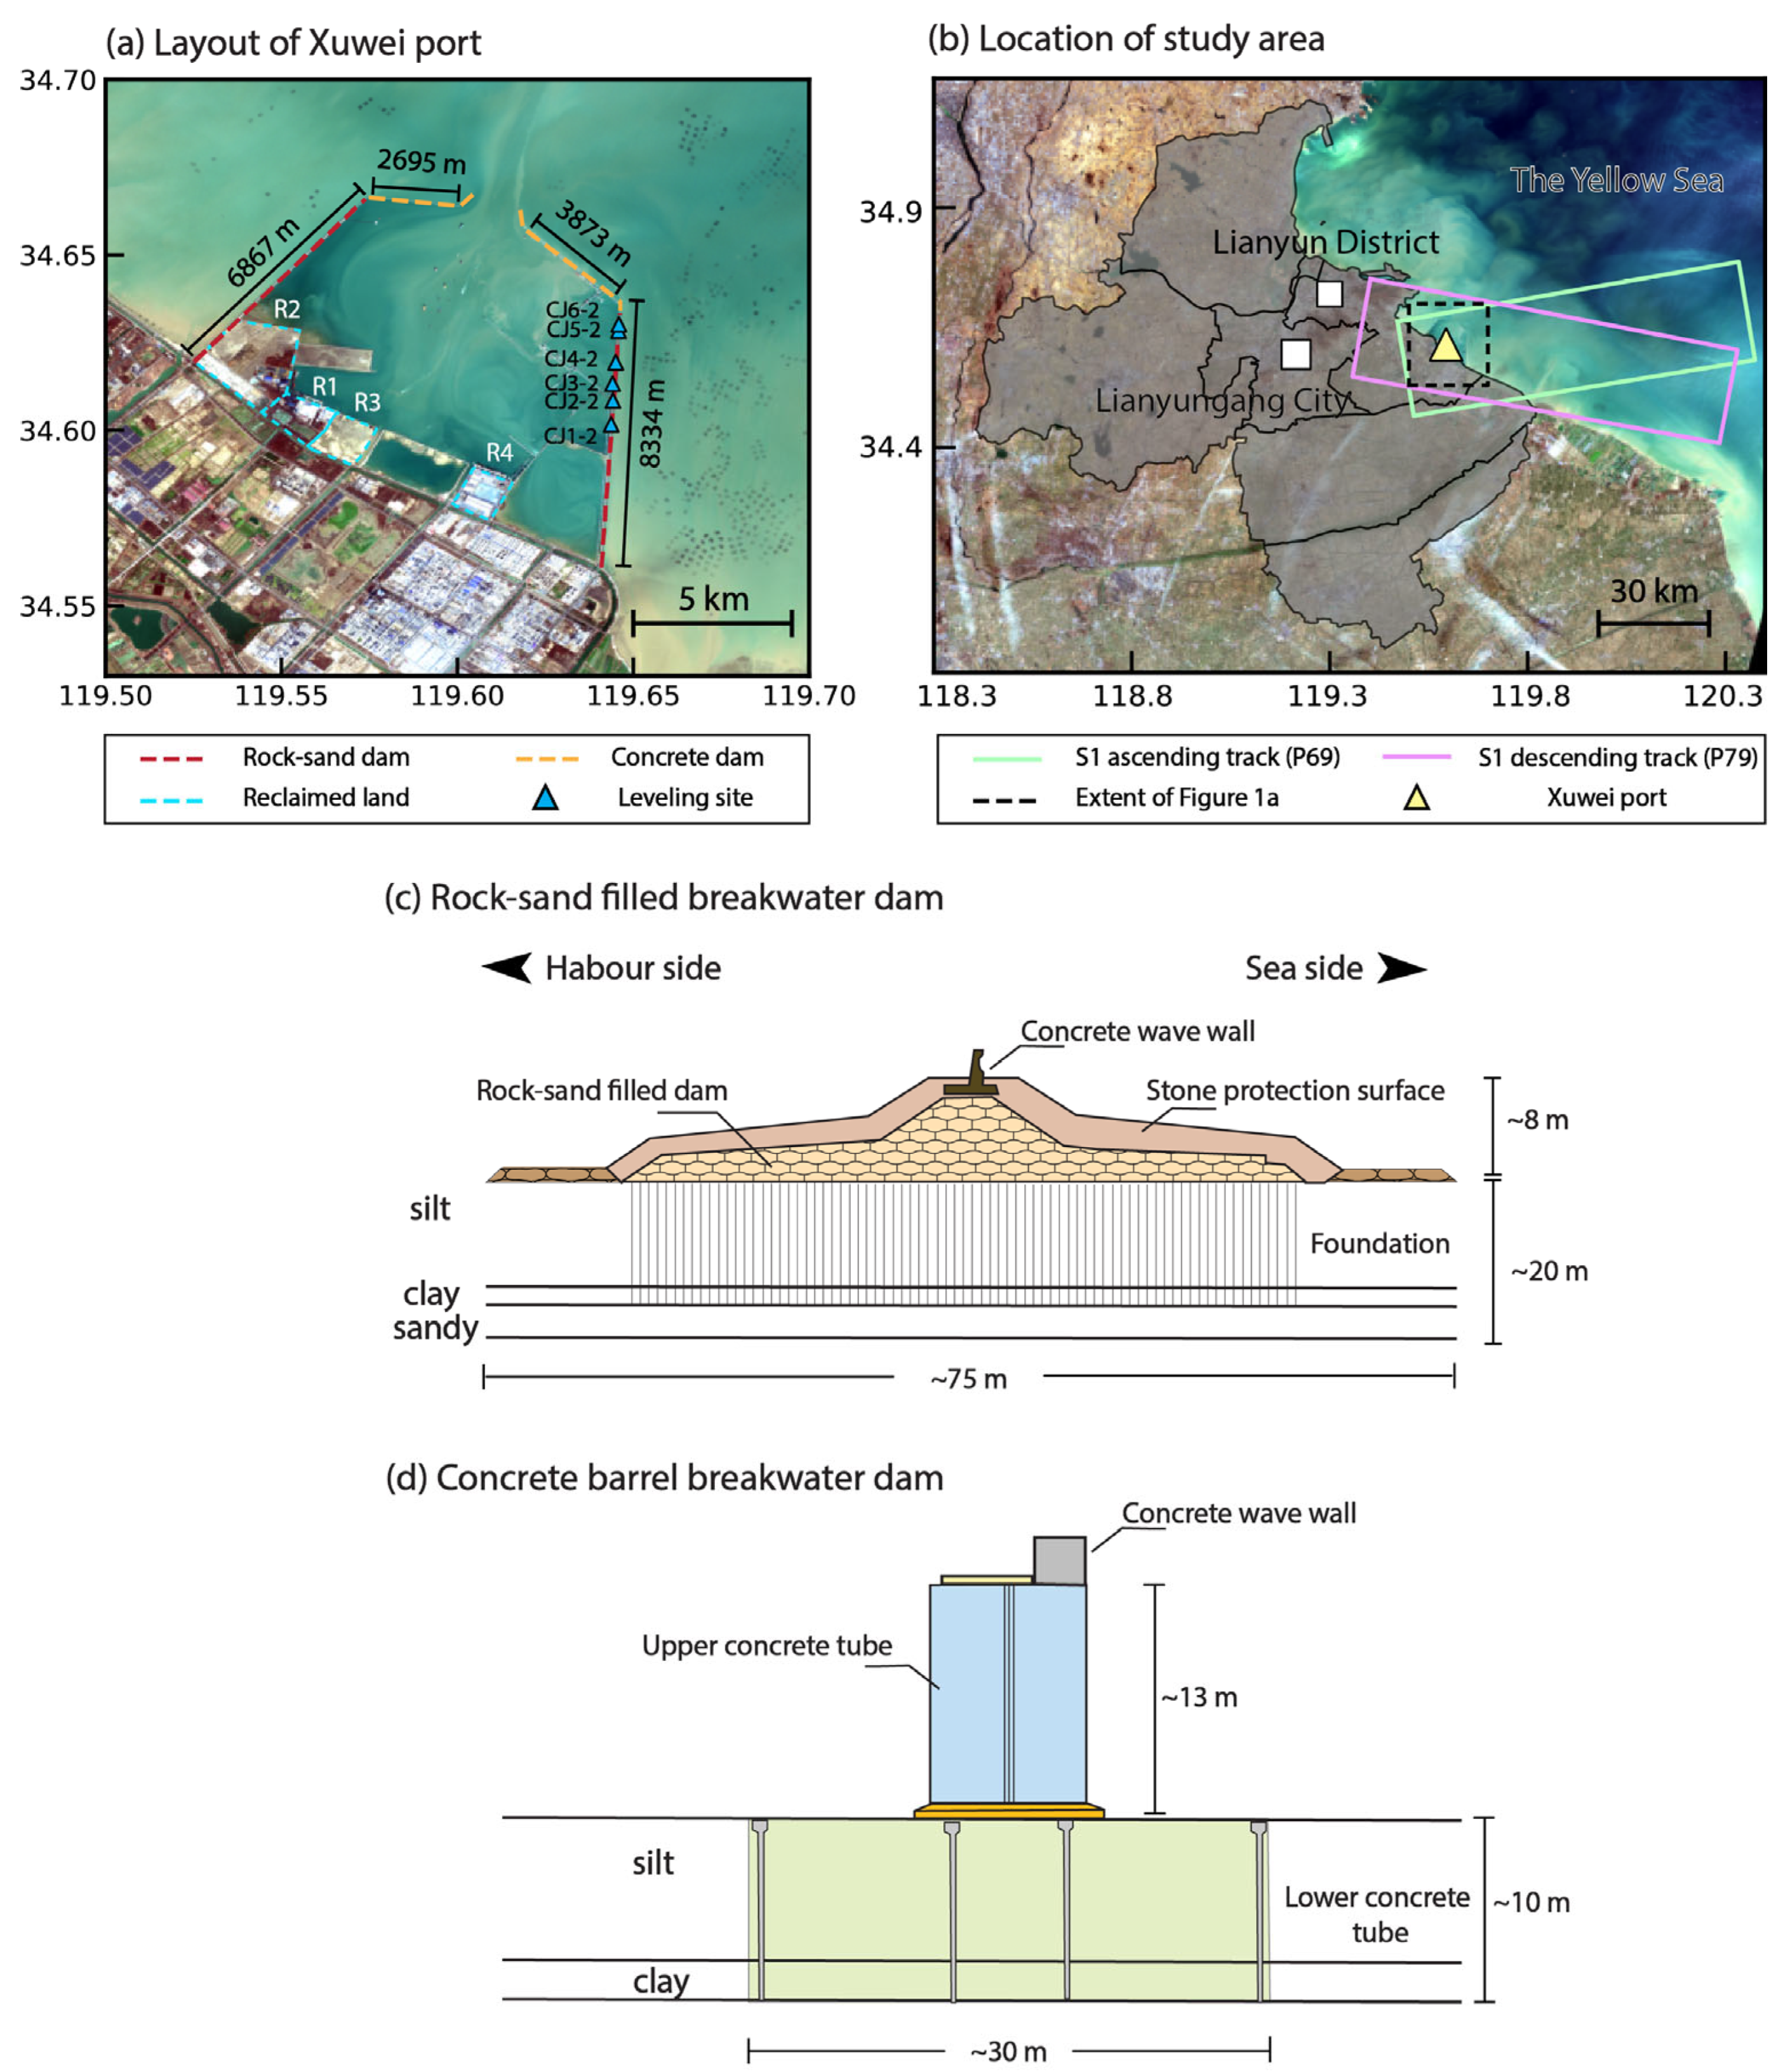
Figure 1. Study area and the layout of dams. (a) Layout of the dams in Xuwei Port. (b) Location of the study area and footprints of the Sentinel-1 data; (c,d) are structure profiles for rock-sand filled dam and concrete tubular dam.
Remotesensing 17 02778 g001
Figure 2. Time elapses of the construction process in Xuwei Port. (a) The original coastal line. (bh) The construction process. (i) The current layout.
Remotesensing 17 02778 g002
Figure 3. The spatial–temporal baseline configurations for ascending and descending tracks. (a) Ascending track (path 69). (b) Descending track (path 76).
Remotesensing 17 02778 g003
Figure 4. Distributions of detected scatterers: (a) Ascending track (2016–2025). (b) Descending track (2016–2021). PS and DS points are depicted in sky-blue dots and yellow dots, respectively.
Remotesensing 17 02778 g004
Figure 5. Cumulative LOS deformation in ascending track (2016–2025). Note, the blue-ward color indicates the away motion in satellite LOS direction.
Remotesensing 17 02778 g005
Figure 6. Similar to Figure 5 but for cumulative LOS deformation in descending track (2016–2021).
Remotesensing 17 02778 g006
Figure 7. Cross-validation of LOS velocity correlation. (a) Ascending track. (b) Descending track. (c) Density scatter for the correlation analysis. (d) Histogram of differences in LOS velocity.
Remotesensing 17 02778 g007
Figure 8. Comparison of InSAR and leveling at the eastern breakwater dam. InSAR period-1 refers to 2016–2021, in which the vertical displacement is decomposed by two-track observations. InSAR period-2 refers to 2022–2025, in which the vertical deformation is projected according to the ascending track.
Remotesensing 17 02778 g008
Figure 9. Cumulative subsidences in Xuwei Port from 2016 to 2025. Note, the blue triangles, pink points, and yellow points denote the leveling site, selected points on the breakwater dam, and selected points on reclaimed land respectively.
Remotesensing 17 02778 g009
Figure 10. Time-series of selected points on the eastern breakwater dam: (a,b) rock-sand filled dam; (c,d) concrete dam.
Remotesensing 17 02778 g010
Figure 11. Time-series of selected points on the western breakwater dam: (ac) rock-sand filled dam; (d,e) concrete dam.
Remotesensing 17 02778 g011
Figure 12. Time-series of selected points P1–P4 on reclaimed zones R1–R4. The pink-shaded areas indicate the accelerating periods in P2 and P3.
Remotesensing 17 02778 g012
Figure 13. The drought conditions quantified by NMDI during the accelerating deformation period in reclaimed zone R2.
Remotesensing 17 02778 g013
Figure 14. The drought conditions quantified by NMDI during the accelerating deformation period in reclaimed zone R3.
Remotesensing 17 02778 g014
Figure 15. Consolidation model calibrated by InSAR vertical deformation at the rock-sand fill section of breakwater dams. Note, the data from October 2016 to March 2024 are used for the model fitting, and the April 2024 to March 2025 are used for the validation.
Remotesensing 17 02778 g015
Figure 16. Observations and predictions of relative sea level rise and dam subsidence during the period of 2000–2125.
Remotesensing 17 02778 g016
Table 1. SAR satellite parameters used in this study.
SatelliteFlight DirectionOrbit PathIW No.Burst No.PeriodScene No.
Sentinel-1Ascending693329 September 2016–22 March 2025307
Descending76125 October 2016–14 December 2021140
Disclaimer/Publisher’s Note: The statements, opinions and data contained in all publications are solely those of the individual author(s) and contributor(s) and not of MDPI and/or the editor(s). MDPI and/or the editor(s) disclaim responsibility for any injury to people or property resulting from any ideas, methods, instructions or products referred to in the content.