Article

Diverse Techniques in Estimating Integrated Water Vapor for Calibration and Validation of Satellite Altimetry

by
Stelios P. Mertikas
1,*,
Craig Donlon
2,
Achilles Tripolitsiotis
3,
Costas Kokolakis
3,
Antonio Martellucci
2,
Ermanno Fionda
4,
Maria Cadeddu
5,
Dimitrios Piretzidis
3,
Xenofon Frantzis
1,
Theodoros Kalamarakis
1 and
Pierre Femenias
6
1
Geodesy and Geomatics Engineering Laboratory, Technical University of Crete, GR-73100 Chania, Greece
2
European Space and Technology Center, European Space Agency, 2201 AZ Noordwijk, The Netherlands
3
Space Geomatica P.C., GR-73134 Chania, Greece
4
CETEMPS, Università dell’Aquila, 67100 L’Aquila, Italy
5
Argonne National Laboratory, 9700 S. Cass Avenue, Lemont, IL 60439, USA
6
European Space Research Institute (ESRIN), ESA, Largo Galileo Galilei 1, 00044 Roma, Italy
*
Author to whom correspondence should be addressed.
Remote Sens. 2025, 17(16), 2779; https://doi.org/10.3390/rs17162779
Submission received: 21 June 2025 / Revised: 30 July 2025 / Accepted: 7 August 2025 / Published: 11 August 2025
(This article belongs to the Special Issue Applications of Satellite Geodesy for Sea-Level Change Observation)

Abstract

In satellite altimetry calibration, the atmosphere’s integrated water vapor content has been customarily derived through the Global Navigation Satellite Systems (GNSS), principally over land where the satellite radiometer is not operational. Progressively, several alternative methods have emerged to estimate this wet troposphere component with ground instruments, alternative satellite sensors, and global models. For any ground calibration facility, integration of various approaches is required to arrive at an optimum value of a calibration constituent and in accordance with the strategy of Fiducial Reference Measurements (FRM). In this work, different estimation methods and instruments are evaluated for wet troposphere delays, especially when transponder and corner reflectors are employed at the Permanent Facility for Altimetry Calibration of the European Space Agency. Evaluation includes, first, ground instruments with microwave radiometers and radiosondes; second, satellite sensors with the Ocean Land Color Instrument (OLCI) and the Sea Land Surface Temperature Radiometer (SLSTR) of the Copernicus Sentinel-3 altimeter, as well as the TROPOMI spectrometer on the Sentinel-5P satellite; and finally with global atmospheric models, such as the European Center for Medium-Range Weather Forecasts. Along these lines, multi-sensor and redundant values for the troposphere delays are thus integrated and used for the calibration of Sentinel-6 MF and Sentinel-3A/B satellite altimeters. All in all, the integrated water vapor value of the troposphere is estimated with an FRM uncertainty of ±15 mm. In the absence of GNSS stations, it is recommended that the OLCI and SLSTR measurements be used for determining tropospheric delays in daylight and night operations, respectively. Ground microwave radiometers can also be used to retrieve tropospheric data with high temporal resolution and accuracy, provided that they are properly installed and calibrated and operated with site-specific parameters. Finally, the synergy of ground radiometers with instruments on board other Copernicus satellites should be further investigated to ensure redundancy and diversity of the produced values for the integrated water vapor.

1. Introduction

Satellite altimetry is used for monitoring ocean circulation, sea level rise, hydrosphere (ice, inland waters), sea state, wind, coastal oceanography, etc. [1]. A 30-year record of altimetry-derived sea levels supports the development of accurate models for the global mean sea level (GMSL) [2] and provides projections of sea level change in the future [3]. Based on altimetry records spanning from 1993 to 2021, the GMSL is currently estimated to be 3.3 ± 0.3 mm/yr, with an acceleration rate of 0.12 ± 0.05 mm/yr [4].
Attributes of accuracy, consistency, and reliability in products of satellite altimetry are those that establish confidence in the GMSL models and subsequently accompany the effectiveness of mitigation and adaptation strategies to eminent sea-level rise [5]. Instrument errors, atmospheric effects, orbit disturbances and anomalies, processing and interpretation errors, etc., are some of the sources of error to generally accompany the generation of altimetric data. Accurate quantification and reporting of satellite altimetry biases and errors constitute an arduous task. It involves orbit calibration and validation [6,7] and external calibration using ground reference facilities. Calibration/Validation (Cal/Val) of a satellite altimeter also includes algorithm verification, validation of geophysical data, and specific satellite performance against other missions [8].
First, all sensors and components of every satellite altimeter are thoroughly calibrated and characterized before launch, under controlled laboratory conditions and adhering to metrological standards. After launch, the satellite’s payload cannot be monitored in the same way as on the ground.
When in orbit, these activities are primarily carried out at permanent research infrastructures, such as the Permanent Facility for Altimetry Calibration (PFAC) of the European Space Agency (ESA) in Crete, Greece. The ESA-PFAC supports absolute and relative Cal/Val of satellite altimeters using redundant instrumentation with alternative technologies and instruments, diverse processing, and at different settings and locations (Figure 1). Direct comparison of range, backscatter coefficient, and sea surface height, produced by an altimeter, is thus routinely carried out against concurrent ground-truth measurements.
Microwave transponders and corner reflectors are also used for altimeter calibration on land. A transponder receives the altimeter’s radar pulses, amplifies their signal, and re-transmits them back to the altimeter. The transponder’s echo is then presented in the altimetric records as a strong and distinct response of a point target.
Corner reflectors have been regularly used for radiometric calibration in imaging radar satellites, such as Sentinel-1 [9]. Recently, the advent of the fully-focused SAR (Synthetic Aperture Radar) processing enabled the use of corner reflectors for altimetry calibration, when their dimensions are sizeable and thus can produce a distinct response against the background clutter [10]. They can thus serve as an alternative and complementary technique to transponder calibration. Corner reflectors cannot, however, reach the same level of signal amplification as transponders do, thus requiring careful selection of their candidate locations on the ground. They only work with the fully-focused SAR technique.
The ESA-PFAC instrumentation, infrastructure, and Cal/Val techniques applied have been presented in [11]. This PFAC provides in situ reference measurements of Fiducial Reference Measurements (FRM) quality. The FRM strategy has been established and endorsed by ESA to set practical guidelines on how Cal/Val facilities should operate and report their results, whenever possible, with metrological traceability [12]. The sources of uncertainty in both transponder and sea-surface calibration techniques, as implemented at the PFAC, have been identified and reported in [13].
A satellite altimeter transmits microwave pulses and then records the reflected returns of these pulses by the Earth’s surface. Precise measurements of the time between the pulse transmission and echo reception enable determination of the range between the satellite and the reflecting target on the ground. During the signal’s travel from the satellite and back, the atmospheric refractivity (i.e., due to troposphere, stratosphere, and ionosphere) affects the propagation path of the satellite radar signal. This causes a speed deceleration compared to vacuum and deviates its signal path from a straight line. These effects introduce errors in range measurement, which need to be accurately determined and corrected as part of the PFAC FRM uncertainty budget analysis.
Over the ocean, ionospheric delays are usually determined by exploiting two distinct operating frequencies (e.g., Ku-band, C-band) of satellite altimeters [14]. This is because of the dispersive property of the ionosphere with electromagnetic signals. In the case of land, this cannot be done. Ionosphere delays for an altimeter are derived otherwise through dedicated stations of the Global Navigation Satellite Systems (GNSS), global ionospheric maps, or other models, after a reduction to the altimeter orbit [15].
On the other hand, the lower part of the atmosphere, including the troposphere and stratosphere, is electrically neutral. Its refractivity index is mostly non-dispersive at the altimeter operating frequencies (i.e., C-, Ku-, Ka-band).
Microwave radiometers onboard altimetry satellites (MWR-sat) are used to quantify the tropospheric delays of the radar signals over open sea [16]. However, MWR-sat measurements are distorted and contaminated by land and thus cannot support satellite altimetry Cal/Val over land surfaces, coastal areas, and inland waters [17].
Over these areas, numerical weather models are usually employed to calculate troposphere delays [18]. Moreover, in wide-swath altimetry missions, significant residual errors appear to persist in the estimation of wet tropospheric delay using onboard satellite radiometers [19]. Hence, an independent assessment of the tropospheric delay is needed.
The total tropospheric delay is the combination of two components, the “hydrostatic”, which relates air total pressure to air density up to the stratosphere, and the residual “wet” delay [20]. The hydrostatic delay is the larger contributor to total tropospheric delay. It can be accurately estimated using appropriate models with atmospheric pressure and temperature measurements on the Earth’s surface [21]. On the other hand, the wet total delay (WTD) is difficult to estimate. It accounts for the effect of water vapor pressure and air temperature profiles in the troposphere. The large spatial and quick temporal variations of tropospheric humidity make its assessment with ground data less accurate than the dry component [22,23]. Therefore, the tropospheric wet delay (TWD) on altimetric signals is one of the main constituents in the GMSL uncertainty budget [24]. It is thus vital to determine its magnitude precisely, along with its associated uncertainty.
The total mass of water vapor in a vertical column of the atmosphere (Integrated Water vVapor—IWV) can be calculated from the WTD using surface temperature and pressure-dependent conversion factors. Moreover, the total column water vapor (TCWV) corresponding to the vertically integrated water vapor content is theoretically similar to IWV, but produced using distinct observational methodologies. Since the TWD, WTD, IWV, and TCWV are closely linked to several remote sensing techniques, independent water vapor observations have been developed for their proper determination. Those include GNSS meteorology [25], radiosondes sensors [26], ground microwave radiometers [27], infrared thermometers [28], and satellite atmospheric remote sensing.
Satellite altimeters, such as Sentinel-6 Michael Freilich (S6-MF), carry the Advanced Microwave Radiometer—Climate Quality [29], and the Sentinel-3A/B the Ocean Land Color Instrument (OLCI) [30], and Sea Land Surface Temperature Radiometer (SLSTR) [31] instruments to measure the IWV content. Spectrometers onboard the Sentinel-5 satellite, such as the TROPOMI, can also be used for the determination of the integrated water vapor content of the troposphere [32].
This work aims at responding to the following questions: How should tropospheric corrections of FRM-quality be estimated by a Cal/Val facility of satellite altimetry? Furthermore, what uncertainty accompanies these corrections for the troposphere delays of radar signals? The goal is to arrive at uncertainties in the ZWD of ±10 mm with Non-Time Critical orbits as required by ESA for the operational altimeter of Sentinel-6.
The paper is organized as follows: The dataset used to determine the tropospheric delays using ground instruments, satellite sensor products, and global models are described in Section 2. Section 3 presents the methodology that each sensor employs to determine the water vapor content. In the sequel, Section 4 compares and evaluates the estimated tropospheric delays given by a set of multi-disciplinary and multi-sensor approaches. Finally, Section 5 summarizes the key findings of this research and provides recommendations on how operational satellite altimetry Cal/Val should estimate the water vapor content of the troposphere.

2. Data and Instruments

In PFAC, the Cal/Val techniques with transponders and corner reflectors make use of GNSS-derived tropospheric delays as reference. This is because of their accuracy and precision, low capital and maintenance cost of GNSS stations, but most importantly their continuous operations, which make them useful for any satellite altimeter irrespective of overpass time. The FRM-strategy requires that each parameter (such as tropospheric delays) inserted into the Cal/Val process should be estimated using diverse, redundant, and independent techniques and instrumentation. In the following, a brief description of the instrumentation employed to estimate tropospheric delays during PFAC Cal/Val operations is given.

2.1. GNSS Meteorology

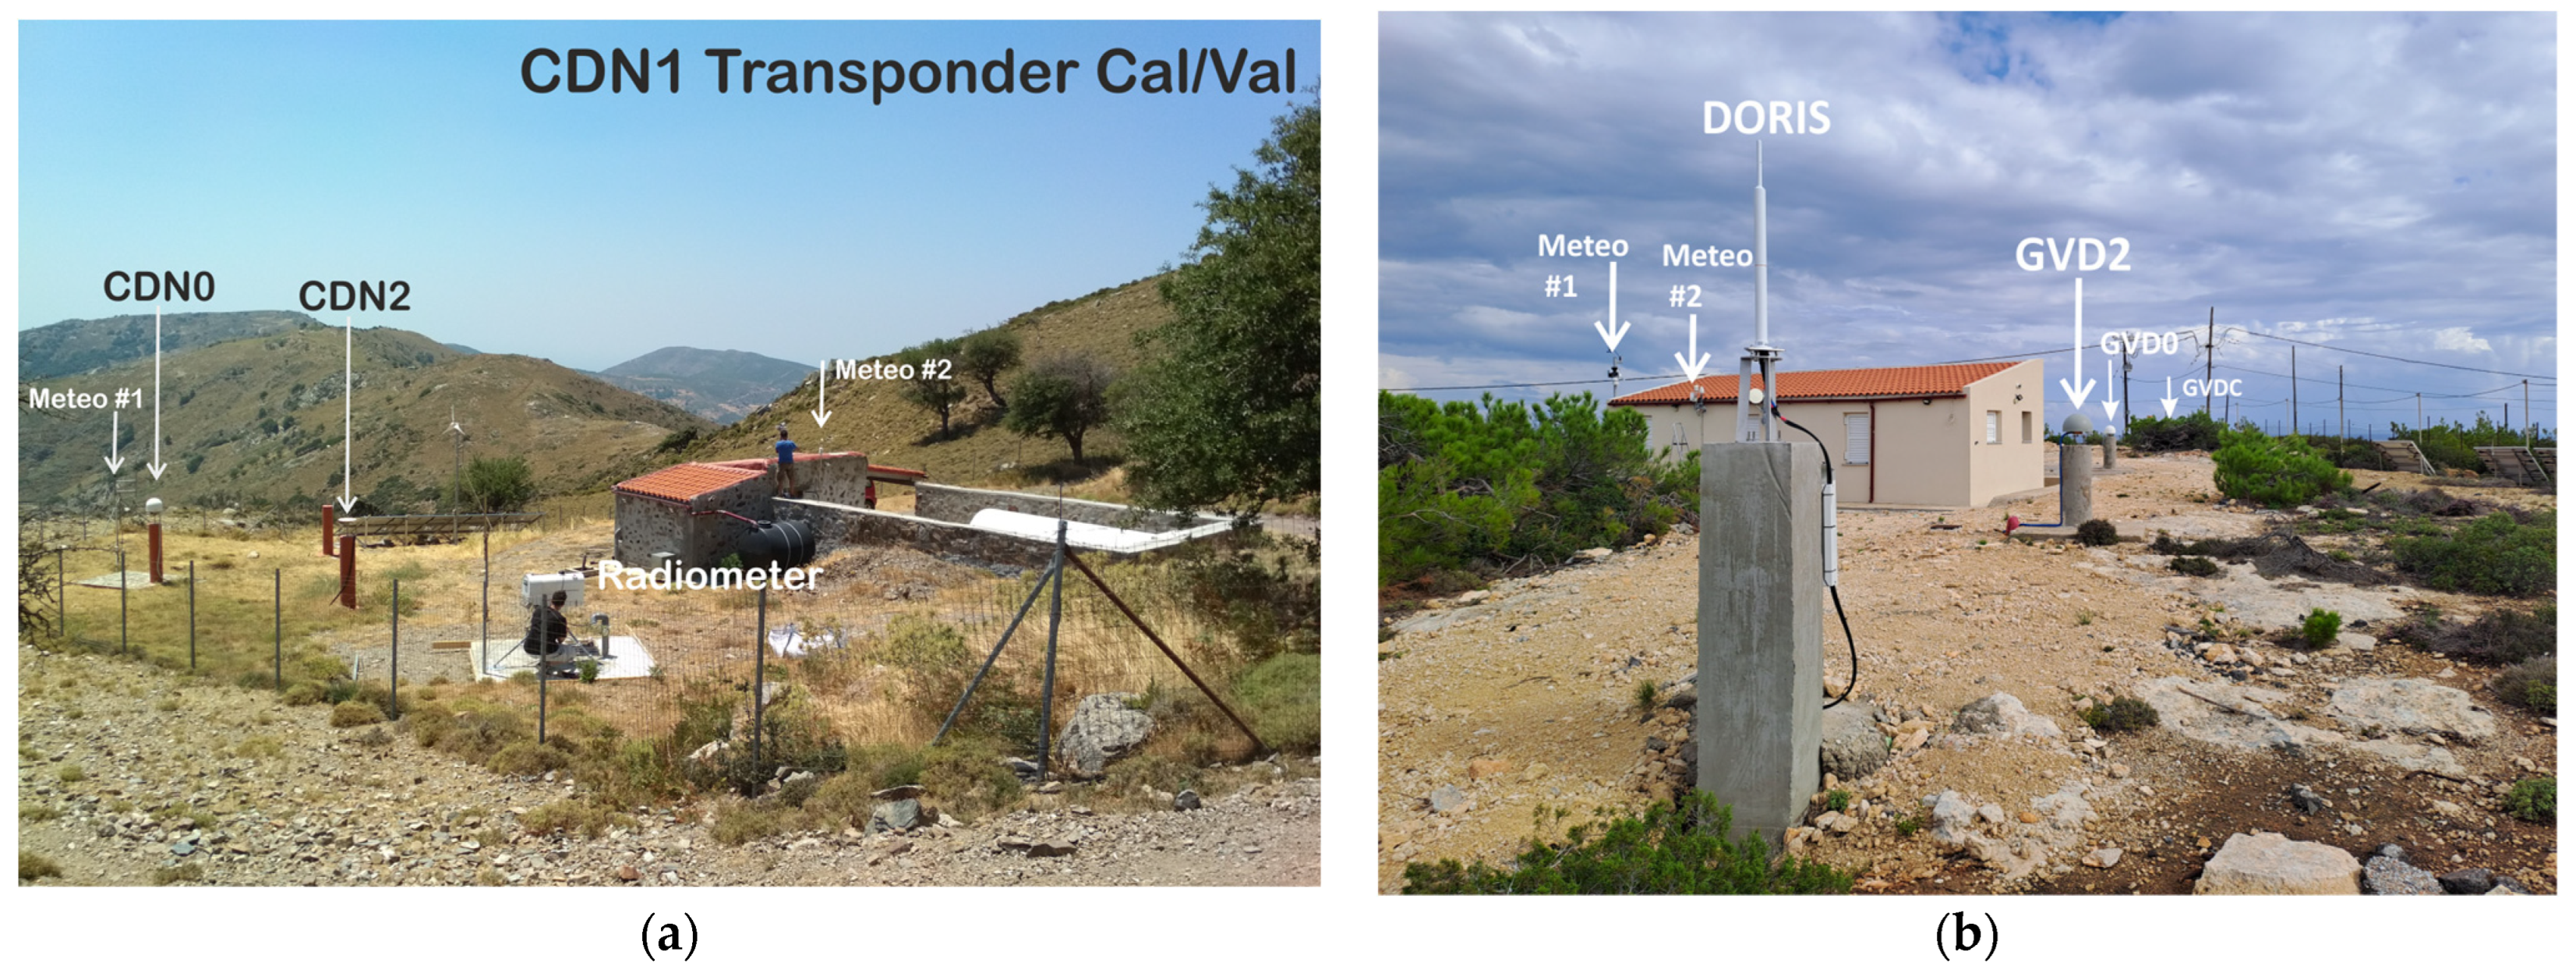
In PFAC, each transponder Cal/Val site is equipped with at least two continuously operating reference GNSS stations that comply with International GNSS Service conventions and guidelines [33]. Each GNSS station is collocated with meteorological sensors recording atmospheric temperature and pressure, relative humidity, and wind speed and direction (Figure 2). These meteorological parameters are used for the determination of the wet troposphere delay derived from GNSS observations. Table 1 presents the coordinates of these GNSS stations along with the dataset available for evaluation.

2.2. Radiosondes

Radiosondes are instrument packages that provide observations for temperature, relative humidity, pressure, wind direction and speed, etc., of the atmosphere at various vertical profiles. They are usually carried on weather ballons launched twice a day (00:00 UTC and 12:00 UTC) at about 800 dedicated sites all over the world [34]. Also, drones have been experimentally used as flying platforms for radiosonde measurements [35].
For this investigation, radiosonde measurements were retrieved from the Integrated Global Radiosonde Archive version 2 database [36] for the Herakleion site (ID: GRM00016754), located about 130km from the CDN1 transponder Cal/Val site in Crete.

2.3. Ground-Based Μicrowave Radiometer

Ground microwave radiometers measure, at several frequencies, the power emitted spontaneously by the atmosphere. Power is expressed as the equivalent brightness temperature of a blackbody emitting at the same frequency. Measurements are made at two frequencies, at least: 23.8 GHz and 30 GHz. The first frequency of 23.8 GHz is near the water vapor absorption peak of the atmosphere. The second one of 30 GHz lies in the spectral window between water vapor and oxygen absorption peak, and is most sensitive to liquid cloud emission [37].
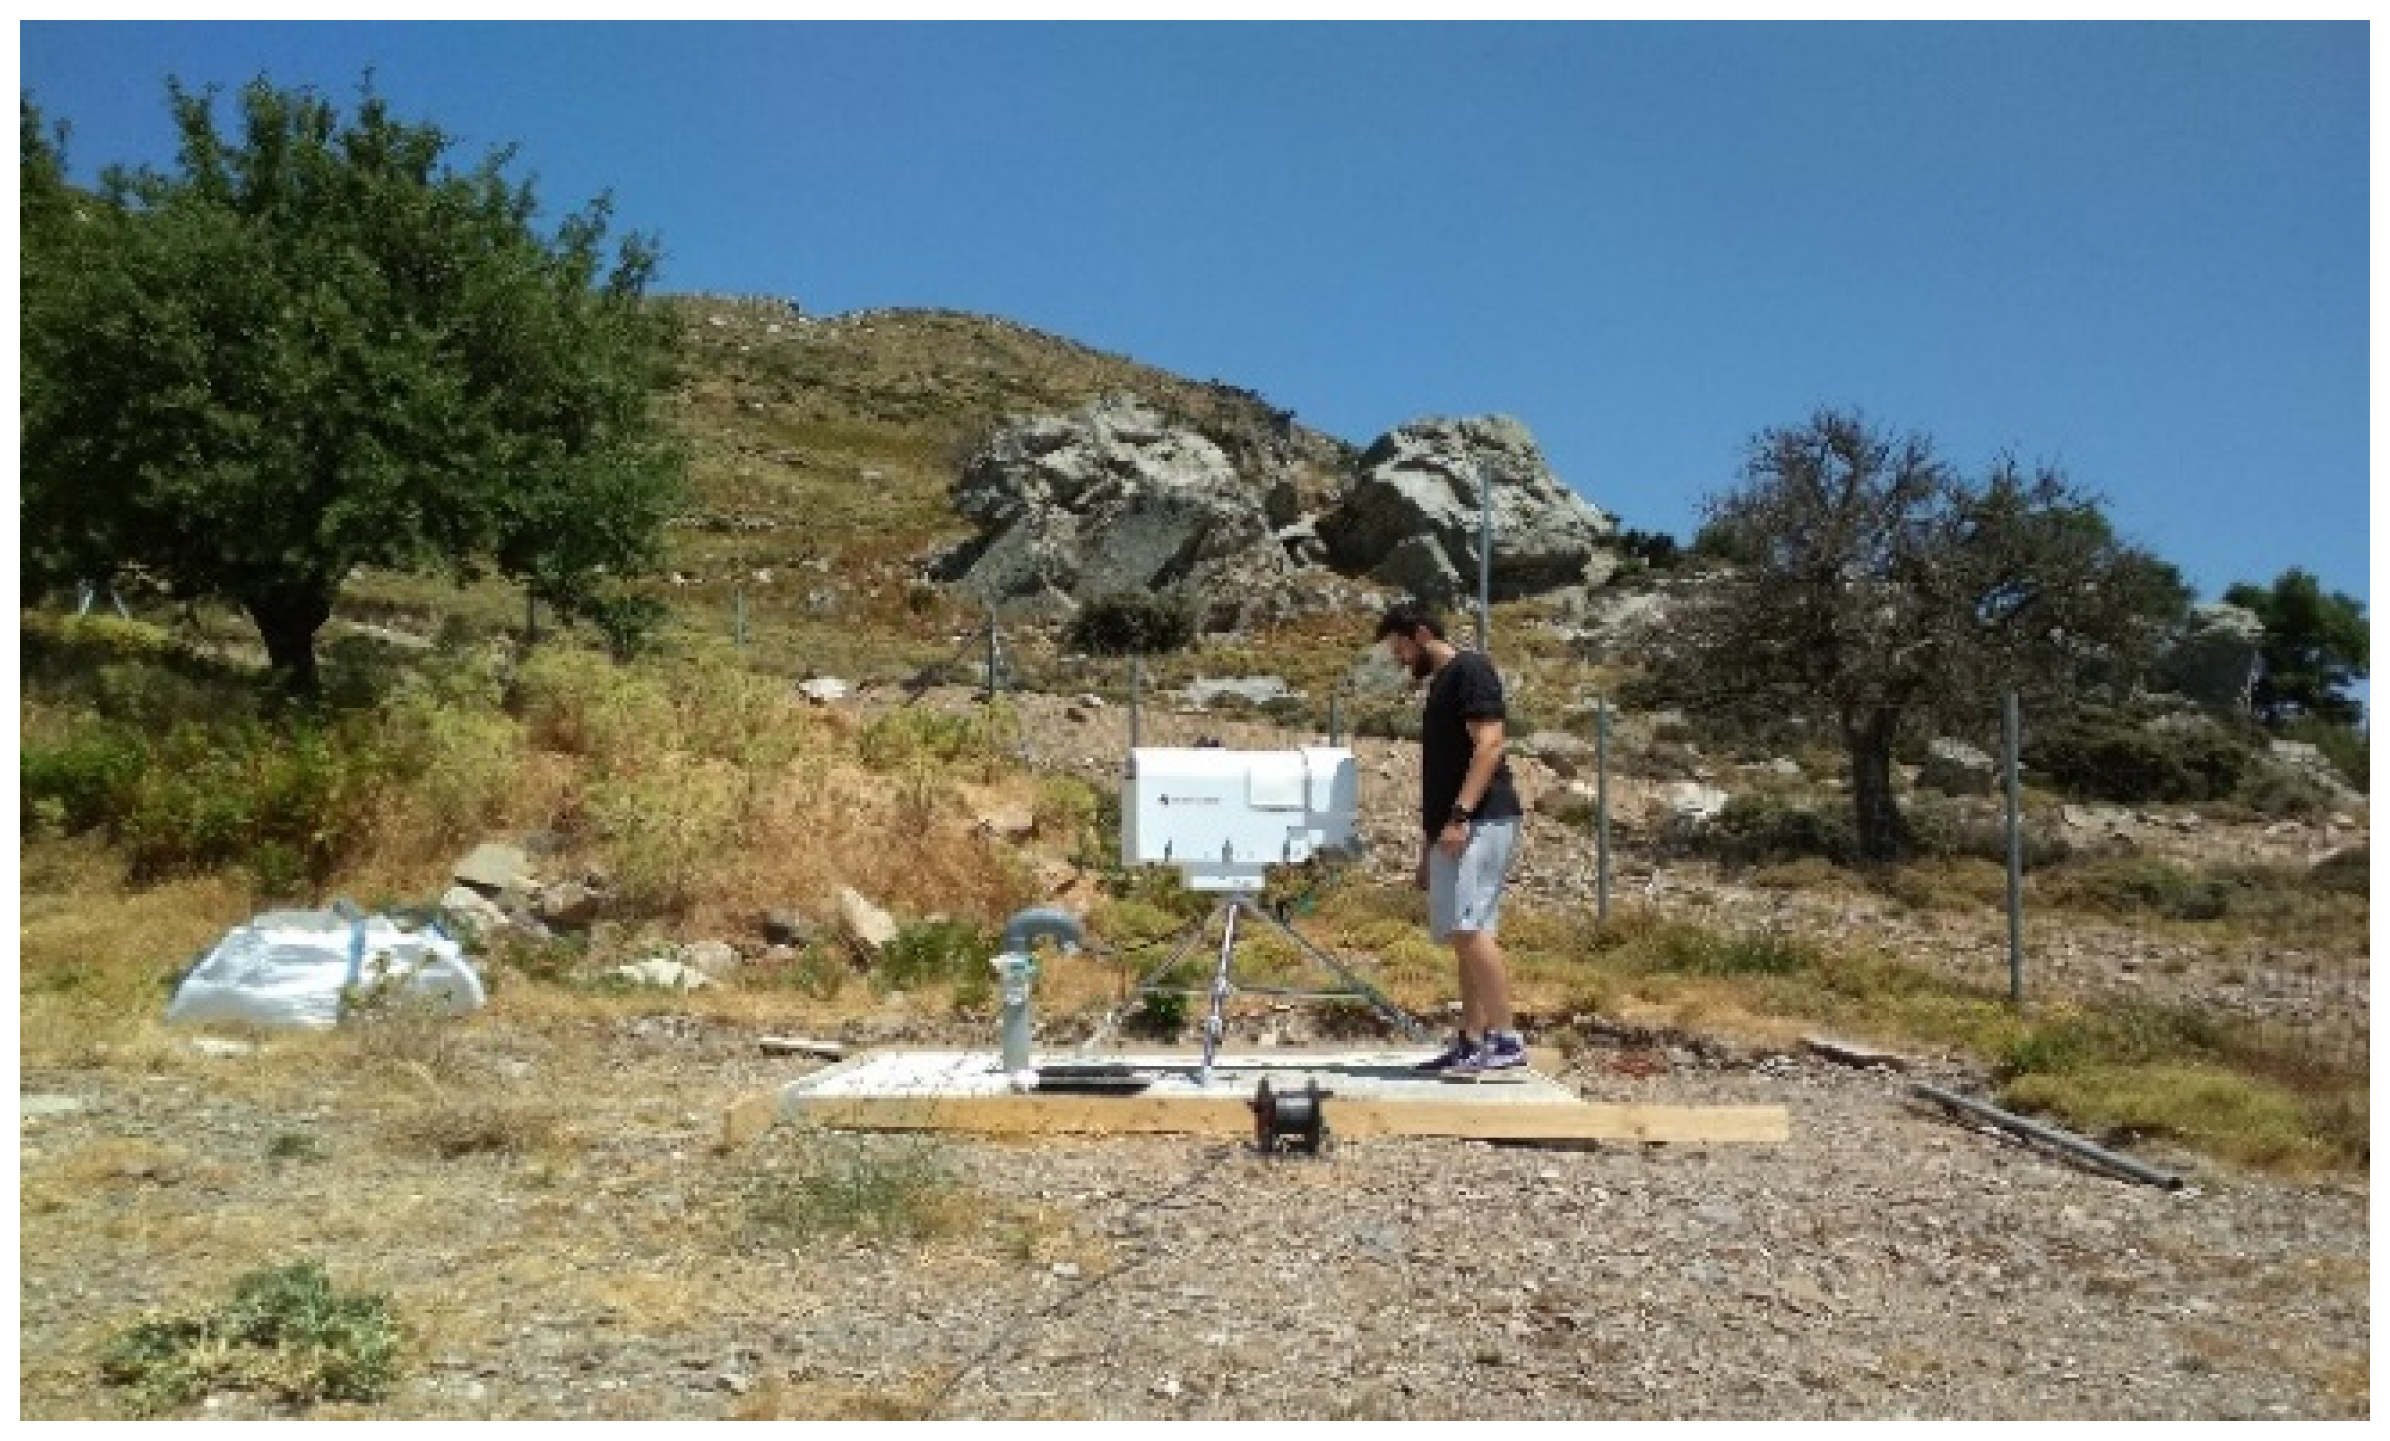
On 10 September 2019, a microwave radiometer model MP-3000A (built by Radiometrics Corp., Frederick, CO, USA) was provided by ESA as an in-kind contribution to the PFAC. It was installed at the CDN1 transponder Cal/Val site on the mountains of west Crete (Figure 3). The radiometer was equipped with an elevation and azimuth pointing system, to perform regular tip curve calibrations along the direction with a free line of view and to point to zenith during measurement periods.
The instrument collected atmospheric brightness temperatures at 21 channels at Ka band (for water vapor and cloud liquid remote sensing) and 14 channels at V band (for air temperature profiling), with a 200 ms integration time for each frequency and a sampling time of a few seconds. The radiometer operated continuously until 17 September 2020, when a malfunction of the frequency synthesizer in the master control module disrupted its nominal operations, and thus measurements discontinued.

2.4. Satellite Sensors for the IWV Estimation

Several passive sensors operating at different spectral regions (i.e., visible, near-infrared, thermal infrared, microwave, etc.) can also be used to retrieve the integrated water vapor in the atmosphere [38]. Sentinel-3A and Sentinel-3B satellites are, respectively, equipped with the OLCI and the SLSTR instruments. The OLCI is a multi-spectral (390 nm to 1040 nm in 21 spectral bands) imaging spectrometer with a 1270 km swath and a pixel resolution of the order of 300 m.
The OLCI instrument provides measurements of the IWV over land and sea but only when solar radiation is available, thus restricting its applicability to daytime operations. To mitigate this limitation, the PFAC investigated the potential of using the SLSTR as well for the wet troposphere delay.
The SLSTR instrument, an advanced version of the Along-Track Scanning Radiometers (ATSR), maintains continuity with its predecessors for accurate measurement of sea and land surface temperature. The SLSTR operates at nine spectral bands (550–12,000 nm) and uses two conical scans at nadir and oblique angles, to provide accurate atmospheric correction [39]. These scans are executed by two separate mirrors rotating at 200 scans per minute, covering an area of 2 km per scan. The instrument captures a 1400 km-wide swath region at nadir and 740 km at the oblique angle. Built-in calibration sources are viewed in each scan cycle on the satellite, eliminating the need for special calibration modes.
The dataset used in the present analysis includes OLCI and SLSTR products from the launch of the two satellite missions (i.e., May 2016 for Sentinel-3A and May 2018 for Sentinel-3B) until May 2024.
Finally, the TROPOMI instrument onboard the Sentinel-5P mission covers the same geographical area once per day in most cases. TROPOMI offers a Total Column Water Vapor (TCWV) product, which is mostly derived from short-wave infrared data over land and Near-Infrared measurements over the ocean. The TCWV product’s high geographic resolution (~5 × 7 km2) and daily global coverage make it useful for investigating atmospheric moisture distribution hydrological cycles, and verifying weather and climate models. The TCWV products of TROPOMI used in this work were downloaded from the S5P-PAL Data Portal (PAL: Product Algorithm Laboratory). The period covered was May 2018 to May 2024.

2.5. Atmospheric Models

The diversity of the above ground and satellite techniques in terms of observation times, pixel resolution, footprint size, spectral bands used, etc., makes the intercomparison of associated products for the wet troposphere challenging. Data from reanalysis models, such as the ERA5 global atmospheric reanalysis model [40] produced by the European Center for Medium-Range Weather Forecasts (ECMWF), are also used for validation purposes as an external reference.

3. Methods

This section provides a concise overview of the theoretical formulations used to derive tropospheric delays from each observational instrument employed in this work.

3.1. GNSS Meteorology

The neutral atmosphere affects both altimetric and GNSS signals [41]. The total tropospheric delay in the GNSS signals is, as a matter of usual practice, determined through the residual error in their phase observations [42]. The zenith hydrostatic delay is estimated by way of models such as Hopfield [43] or Saastamoinen [44], and the meteorological records of temperature, pressure, and relative humidity at the ground reference site. Then, subtracting the hydrostatic delay from the total tropospheric delay, the zenith wet delay (ZWD) is determined with GNSS. The relation between ZWD and the ΙWV is described by [45,46]:
I W V = Π · Z W D = 10 6 ρ · R v ( C 1 70.20 + 0.72 · T s + C 2 ) · Z W D
where IWV is the total water vapor contained in a vertical column of the atmosphere in [kg/m2], ρ is the mass density of water (=1 gr/cm3), R v is the gas constant for water vapor ( R v  = 461.5 [J/(K kg)]), C 1 (=3.776 × 10⁵ K2∙hPa−1) and C 2 (=22.10 K hPa−1) are refractivity coefficients, and T s is the ambient surface temperature in K.

3.2. Ground-Based Μicrowave Radiometer and Radiosondes

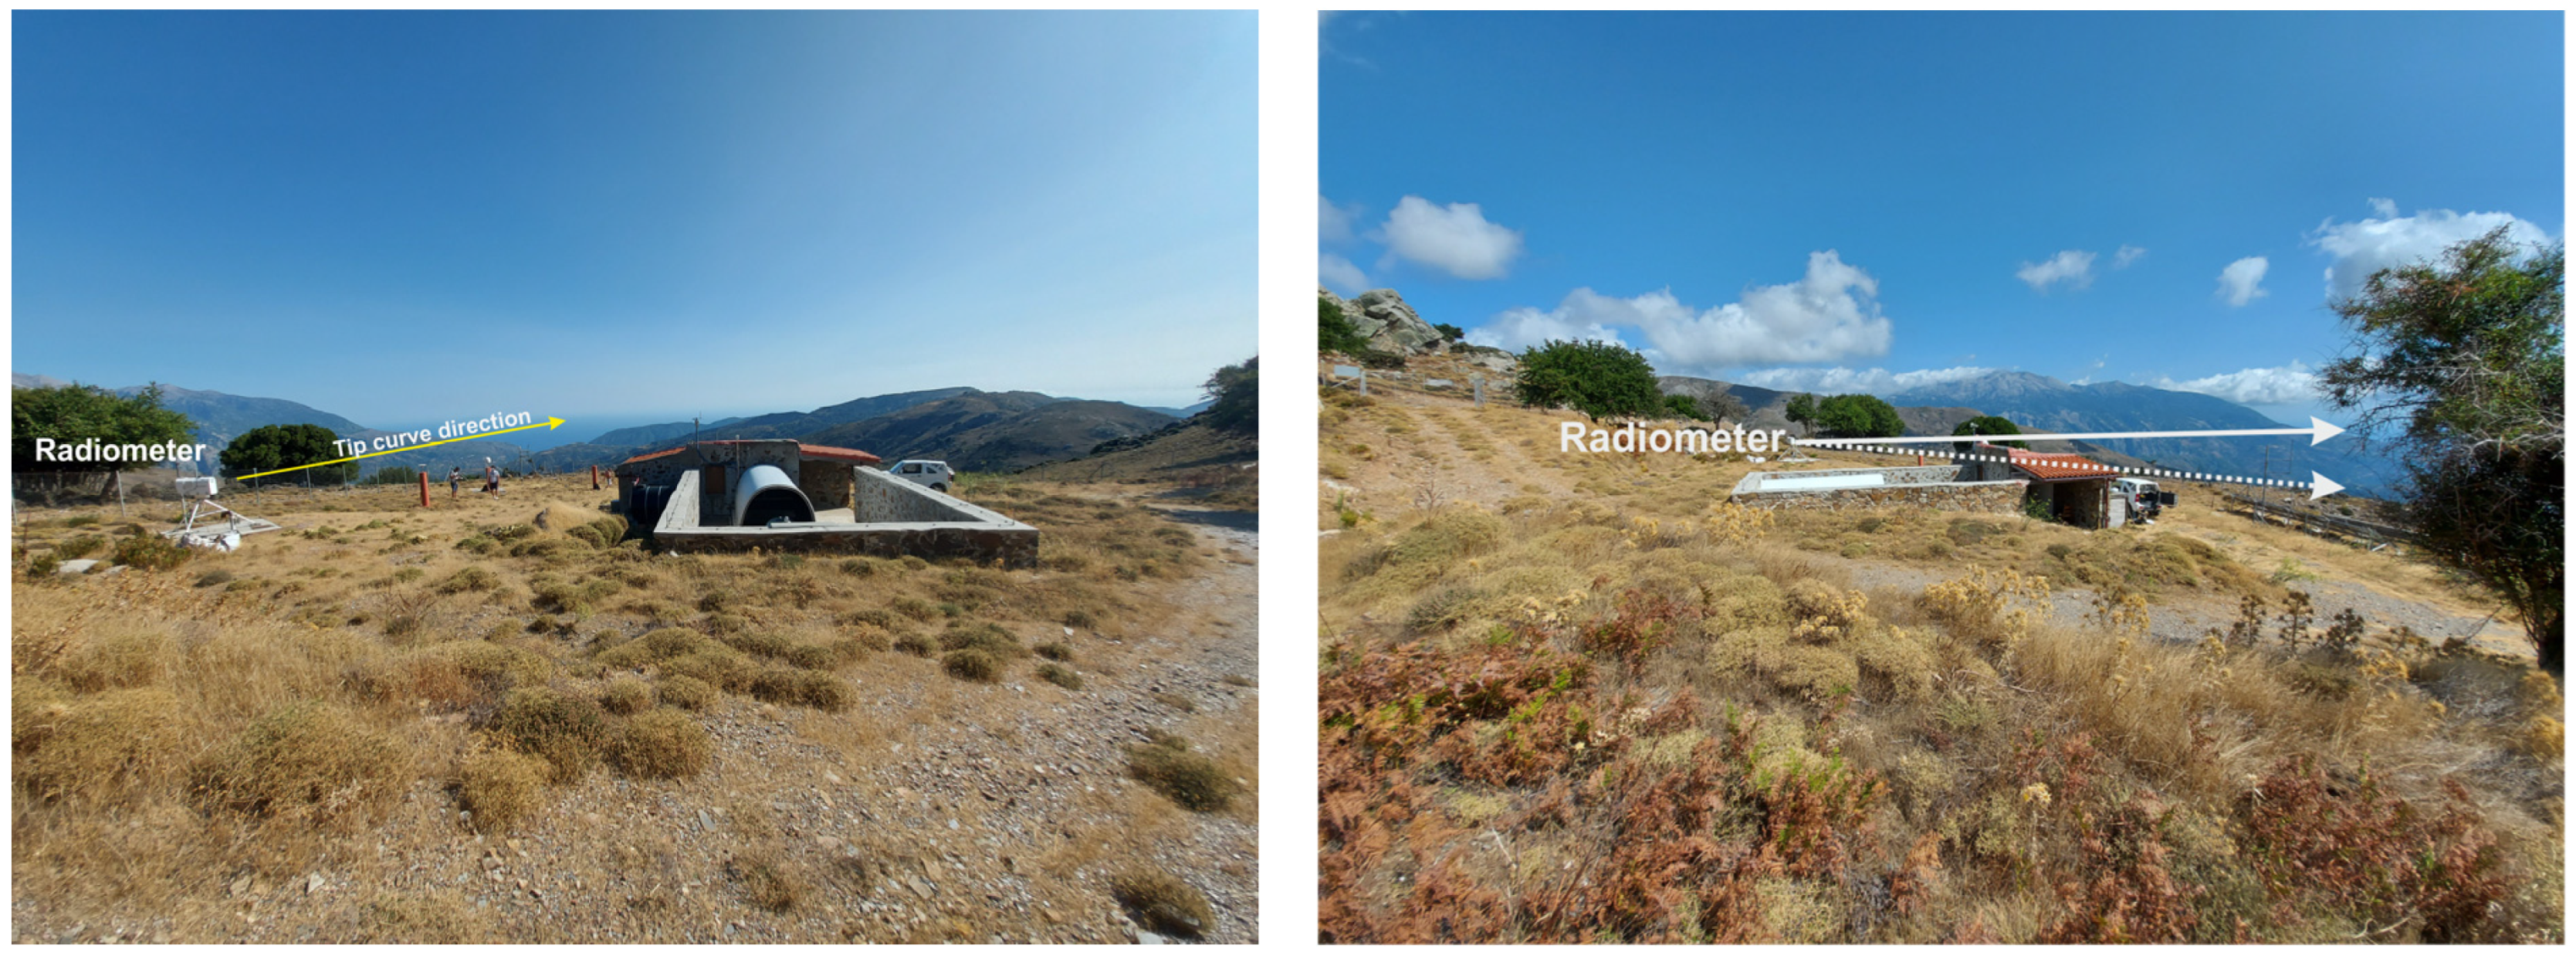
The first step in the determination of water vapor content using ground-based radiometers involves accurate instrument calibration. The tipping-curve method [47] was employed for the calibration of the CDN1 ground radiometer in Crete and the estimation of the radiometer’s effective system temperature and calibration constant (Figure 4). Four elevation angles from one side of the scan were used to estimate the effective noise diode temperature following the methodology in [48], and only tip curves that had a correlation coefficient of r = 0.995 or higher were considered for further analysis.
To convert measured brightness temperatures of the ground radiometer into integrated water vapor and zenith wet delay, an inversion algorithm based on atmospheric radiative transfer model MonoRTM [49] was used as in [50]. The radiometric retrieval coefficients of the inversion algorithm were established from radiosonde observations at the Heraklion Airport, Crete station between 2005 and 2020.
Radiosonde measurements of temperature and relative humidity are used at a site to determine the absolute humidity at different altitudes up to 12 km. Then, integrating the absolute humidity of the atmospheric column gives the water vapor content of the troposphere [51].
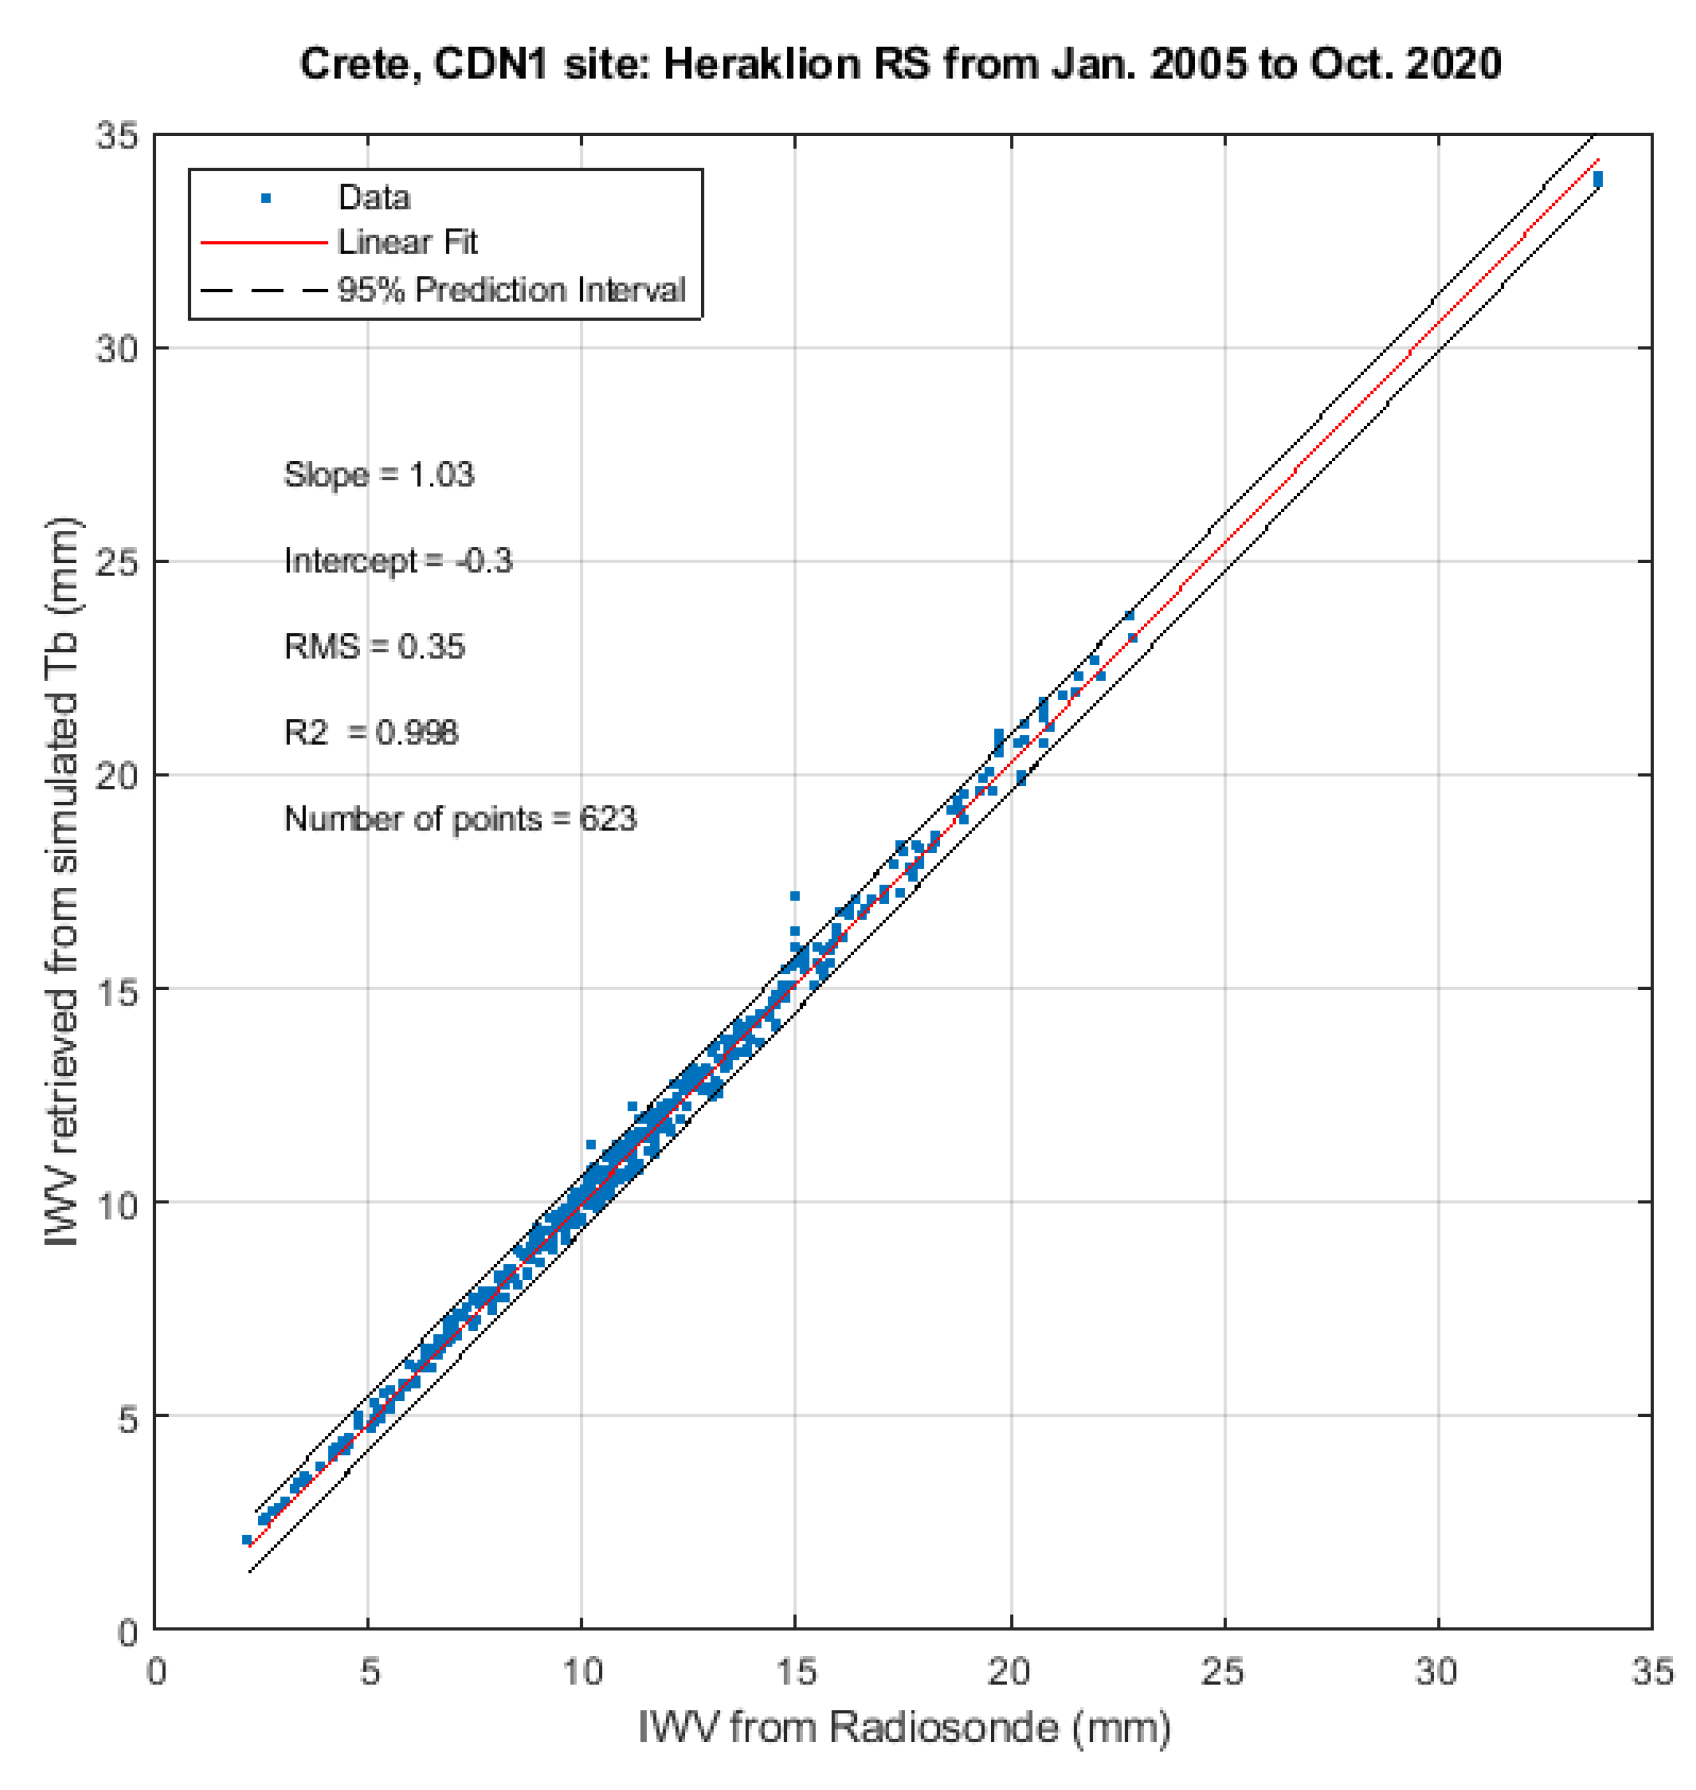
The radiosonde launch site in Heraklion is located near sea level about 130 km east of the CDN1 site. Thus, the radiosonde profiles were truncated below the altitude of the radiometer’s altitude (~1 km) to exclude from the calculations the effect of the lower part of the troposphere above Heraklion Airport. It is also assumed that the atmospheric parameters of the higher layers of the troposphere remain correlated over the distance between Heraklion Airport and the CDN1 Cal/Val site. The accuracy of the radiometric inversion algorithm in this configuration has been validated using a radiosonde test dataset of about 15 years (Figure 5).
This is done by applying retrieval coefficients to the simulated brightness temperature derived from radiosonde data using the radiative transfer model. Then, the retrieved IVW is compared with the actual value measured by the radiosonde during its ascent. This verification guarantees that when the local retrieval coefficients are used with data from a calibrated radiometer, accurate IVW is derived.
Using the same approach, the radiosonde test dataset was also used to derive the relationship between retrieved IWV and ZWD for the CDN1 site in west Crete. The slope of the best linear fit between IWV and ZWD is b = 1.5997, representing the conversion coefficient ( Π ) in Equation (1). With this Π coefficient, the ZWD data derived by GNSS observations on the calibration site can be converted into IWV values and intercompared with the MWR measurements.
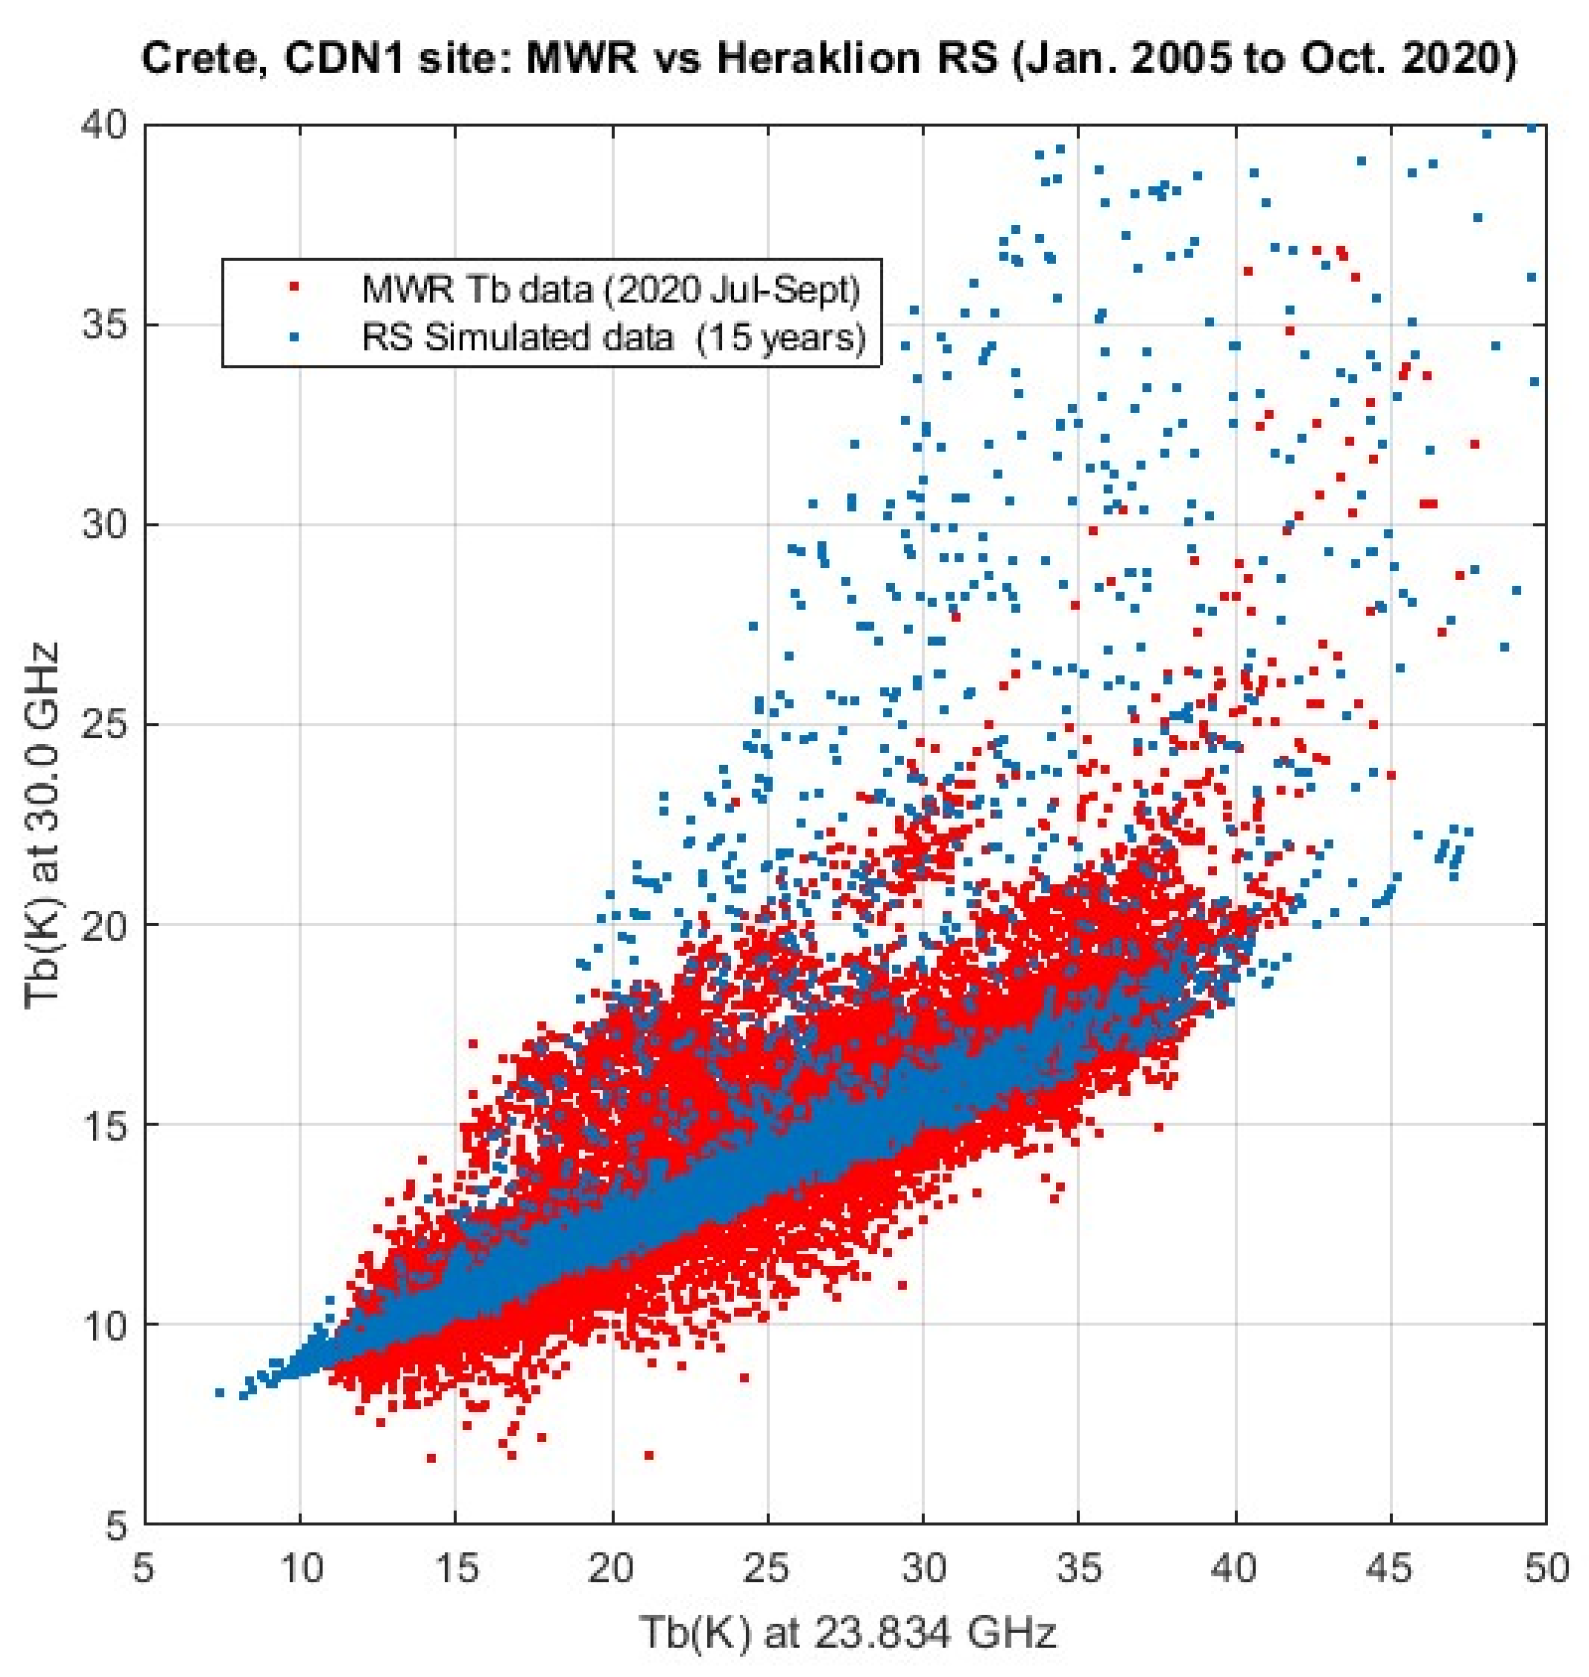
The radiometer internal parameters and measurements collected were analyzed and reprocessed to remove residual instrumental biases. The results were then verified by comparing the frequency scaling relationship of measured atmospheric brightness temperature at the retrieval channels (23.834 and 30 GHz) with long-term data simulated from radiosonde data and the radiative transfer model (Figure 6). The datasets appear to be in agreement in clear sky conditions (i.e., when Tb is lower than 50 and 20 K at 23.834 and 30 GHz, respectively), confirming the validity of calibration and data processing.
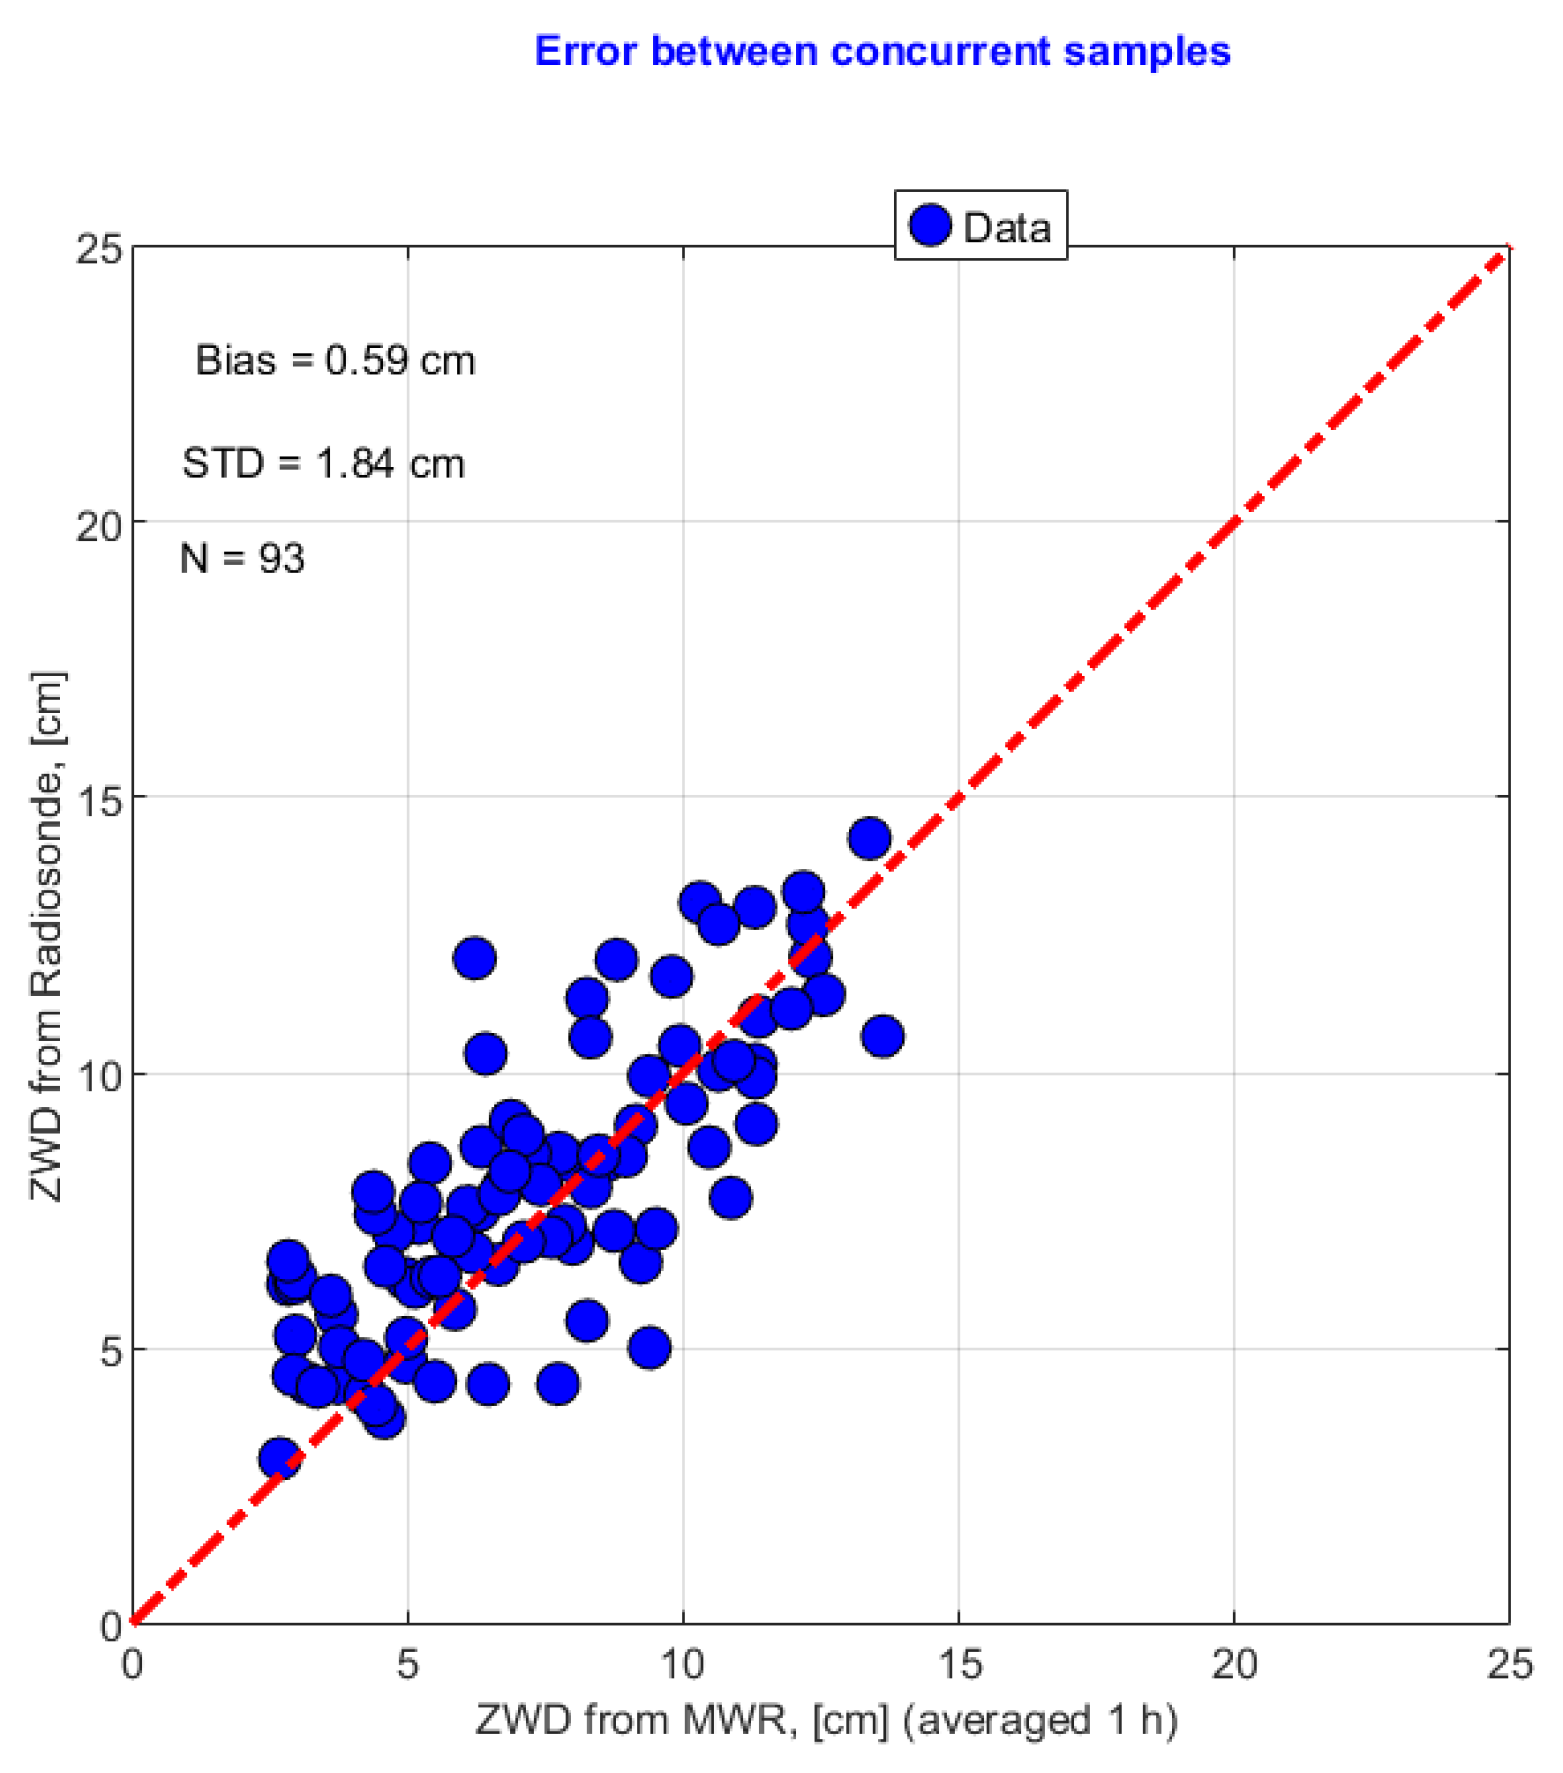
After the validation of retrieval algorithms, discussed in Figure 5, and the verification of radiometric calibration and data correction procedures, presented in Figure 6, an initial verification of the accuracy of the radiometric measurements is carried out using concurrent radiosonde observations collected at Heraklion airport. The MWR observations are averaged over an 1 h interval to account for the radiosonde ascent time along the troposphere. This is done using ZWD, as this is the parameter for calibration of altimetry data. It can be seen from Figure 7 that there is a bias of the order of +6 mm with a standard deviation of ±2 cm for radiometer observations at the CDN1 Cal/Val site. This relatively large standard deviation of ±2 cm may be attributed to the distance between the two sites (about 130 km between Heraklion and CDN1), the ascent time of the radiosonde and its lateral drifts of radiosondes caused by wind during this interval, etc.

3.3. Satellite Sensors for the IWV Estimation

The differential absorption technique is employed to calculate the IWV using the OLCI observations at the 885 nm and 900 nm spectral bands using [52]:
I W V = 1 k 19 ln L 19 L 18
where L 18 , L 19 are the measured spectral radiances at the 885 nm and 900 nm spectral bands, respectively, and k 19 is the mass extinction coefficient of water vapor at 900 nm corresponding to the presumed vertical profile of temperature, pressure, and water vapor over that wavelength.
The AIRWAVE algorithm [53], originally developed to retrieve the integrated water vapor column from the ATSR (Along-Track Scanning Radiometer) measurements over the sea, has been adapted to meet the SLSTR specifications [54]. In [55], an algorithm which links the transmittance ratios τ ( S 8 ) , τ S 9 on SLSTR spectral bands S8 (10,854 nm ± 776 nm) and S9 (12,022.50 nm ± 905 nm), respectively, with the integrated water vapor content in [kg/m2] is given as:
I W V   [ K g m 2 ] = 137.3 136.22 τ ( S 9 ) τ ( S 8 )
The determination of the integrated water vapor using observations of the SLSTR instrument for the radiation coming from a material’s surface is described by Equation (3). Our analysis follows [55] by employing the same assumptions over a surface region of 10 km × 10 km, as well as processing parameters, metrics, threshold criteria, etc., to ensure consistency and facilitate direct comparison with their findings.
For each spectral channel A and B of the SLSTR, the transmittance ratio ( τ ( B ) τ ( A ) ) of radiant energy is calculated using linear regression over the brightness temperature over the surface region within the image frame:
τ ( B ) τ ( A ) = ϵ B ϵ A · R B A ,   w i t h   R B A =   k N T A k T A ¯ [ ( T B k T B ¯ ] k N T A k T A ¯ 2
τ ( A ) τ ( B ) = ϵ A ϵ B · R A B ,   w i t h   R A B = k N T A k T A ¯ [ ( T B k T B ¯ ] k N T B k T B ¯ 2
where A and B are the two SLSTR channels, k indicates the pixel, N is the maximum number of pixels in an image frame, ϵ A ϵ B is the emissivity ratio of the two receiving channels A and B, T A k and T B k indicate the brightness temperature of pixel k in channel A and B, and T A ¯ and T B ¯ are the estimated means (statistical location parameters) for the brightness temperature of the number of pixels contained within the image frame of channels A and B.
To verify the validity of these SLSTR data and the assumptions made for deriving Equation (3) as described in [54], we treat the transmittance ratios τ ( B ) τ ( A ) and τ ( A ) τ ( B ) as separate entities. Each ratio of atmosphere transmittance was analyzed using different linear regressions. Verification was established by calculating the product of transmittance ratios ( τ ( B ) τ ( A ) ) · ( τ ( A ) τ ( B ) ) . This product should ideally be close to 1. In our SLSTR image analysis, the brightness temperature was calculated from a surface area of about 10 km × 10 km (10 × 10 pixels), centered at each transponder site (either the CDN1 in Crete or GVD1 site in Gavdos).
Several tests were carried out to verify the coefficients given in Equation (3) [55]. For example, a linear regression of SLSTR observations was compared against the local GNSS-derived IWV as well as the ECMWF values. Parameters of each linear regression were estimated using both the least squares and the least absolute deviation as an alternative and robust regression method. For each dataset, the method that yielded the higher “squared” correlation coefficient (i.e., r 2 0.95 ) was retained.
The main advantage of the SLSTR with respect to the OLCI instrument is its continuous operation during day and night. Thus, the SLSTR sensor totally supports the estimation of the IWV values during transponder calibrations, as Sentinel-3A and Sentinel-3B fly over the CDN1 at 20:00 (night) and 08:48 (daylight) UTC, respectively.
Finally, the Differential Optical Absorption Spectrometry (DOAS) technique is employed to retrieve the water vapor content from the TROPOMI instrument measurements of Sentinel-5P in the blue spectral band (435–455 nm). Details on the algorithm used to produce the TROPOMI total column water vapor product are provided in [56].

3.4. Atmospheric Models

The ERA5 reanalysis dataset was created using the Integrated Forecasting System (IFS). This system uses a complex 4D-Var (four-dimensional variational) data assimilation strategy that ideally blends a large number of observations with a short-term model projection. Assimilation of observations includes radiosonde data, ground-based GNSS zenith total delays (ZTDs), satellite radiances, GPS radio occultation measurements, airplane reports, and surface meteorological observations [40]. For any given location and time, the hydrostatic and wet components of tropospheric delays are calculated by vertically integrating refractivity, which is obtained directly from these high-resolution pressure, temperature, and humidity fields.

4. Results

In PFAC, the reference ZWD values for the satellite altimeter are the ones derived from GNSS measurements, after altitude reduction, and processed with the GAMIT software package [57] using Relative Positioning. The GNSS processing strategy followed has been previously described in [11,58]. The uncertainty of these ZWD results is estimated by direct comparison against those obtained by different GNSS processing and/or other techniques presented in Section 2. This intercomparison is performed at the time when the satellite altimeters overpass the PFAC facility. However, if the number of overpasses does not provide a statistically significant sample size, the comparison of the IWV estimates from different techniques is extended to include the entire dataset and not limited to overpass dates.

4.1. Total Tropospheric Delay from GNSS

The GNSS technique of Precise Point Positioning (PPP) with Ambiguity Resolution (AR) is used as an alternative to the Relative Positioning (RP) method to determine the ZWD. This PPP-AR procedure is carried out using the online service provided by the Canadian Geodetic Survey of National Resources [59]. Apart from the diverse GNSS processing, the two ZWD solutions apply different atmospheric parameters as input. For example, the GAMIT-derived ZWD takes into account the local meteorological measurements from the collocated meteorological sensors, whereas the PPP-AR relies on global tropospheric models, such as the Vienna Mapping Function (VMF1) grids derived from the ECMWF’s operational numerical weather model.
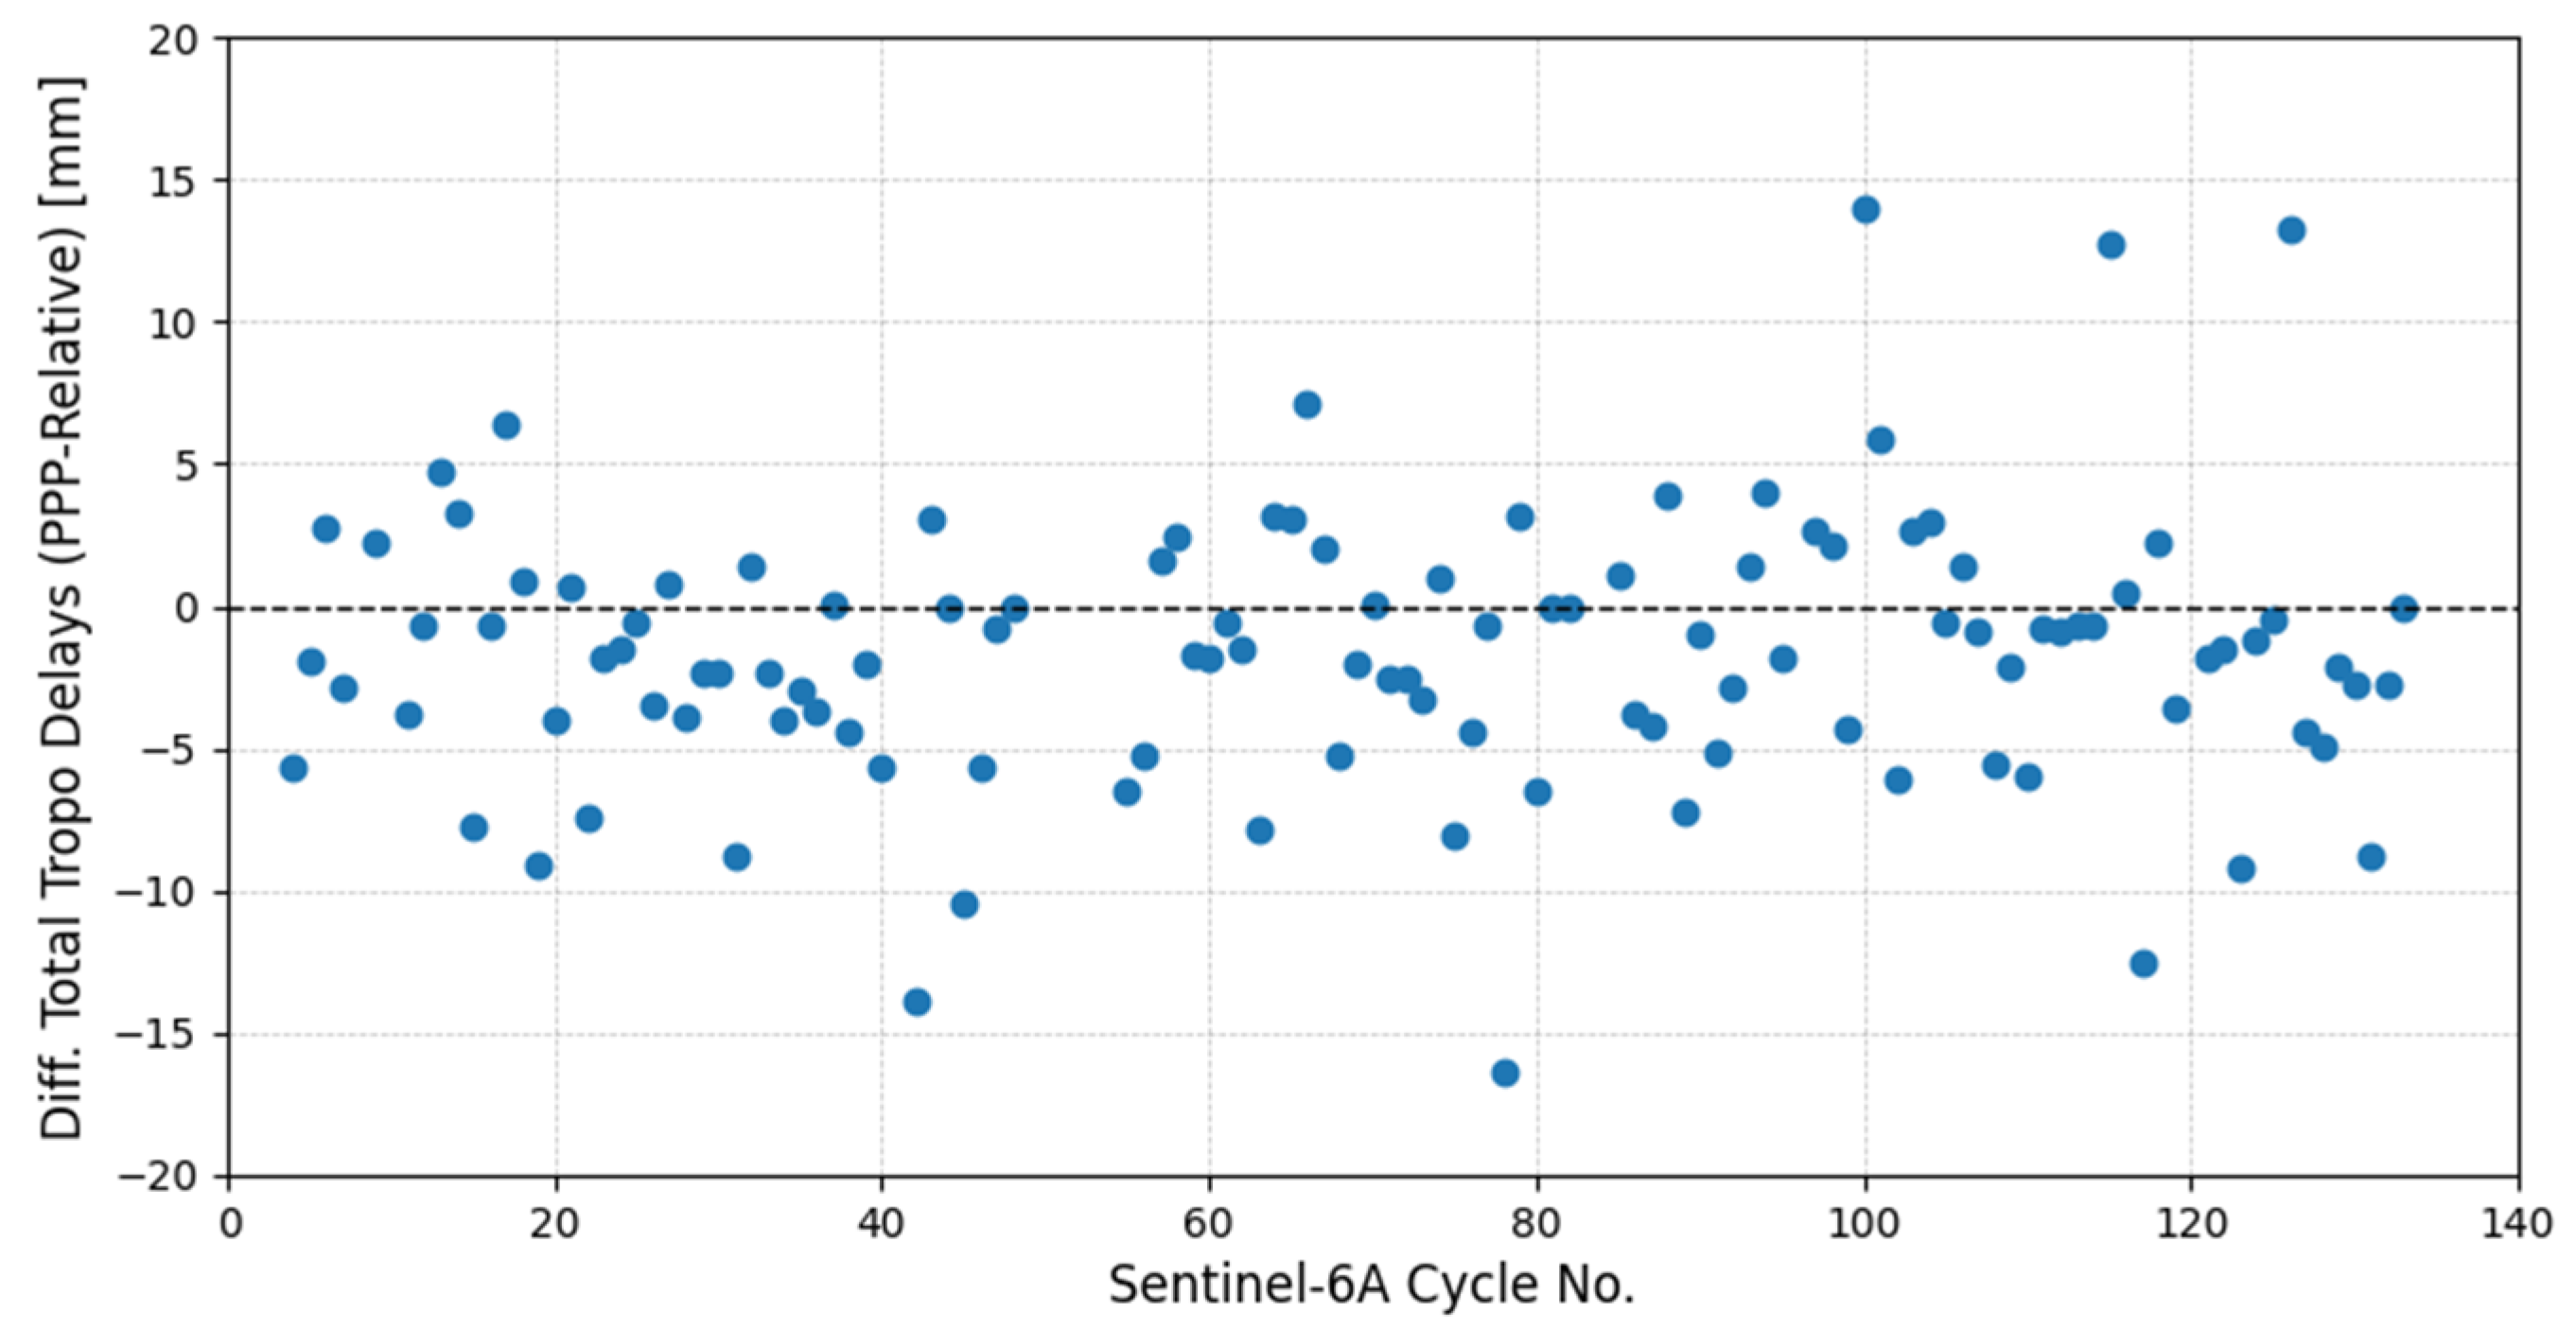
Figure 8 illustrates the difference in the total tropospheric delay between the two processing techniques (PPP minus Relative Positioning) for the same permanent GNSS station (i.e., the CDN2 station in Crete) and during the Sentinel-6 MF transponder calibrations in the period from 18 December 2020 (Cycle 4) to 19 June 2024 (Cycle 133). The average difference in the total tropospheric delay is calculated to be −1.83 mm, with a standard deviation for each observation of ±6 mm. For altimetry Cal/Val, this difference at each satellite cycle is important, as it controls the relevant constituent of uncertainty to be introduced in the FRM uncertainty budget. In this example, the min/max values in the total tropospheric delay are −20 mm and +15 mm, respectively. Similar values resulted from the other GNSS station of CDN0 at the same Cal/Val transponder site in Crete.

4.2. Integrated Water Vapor Derived from Satellite Sensors

4.2.1. The OLCI Instrument of Sentinel-3A/B

The performance of the OLCI instruments onboard the Sentinel-3A and Sentinel-3B satellites was already validated against the regional GNSS array of PFAC in Crete [60]. A similar analysis is now carried out, but only when the descending pass D335 of Sentinel-3A and the Sentinel-3B pass at the same daylight time of 08:48 UTC over the GVD1 transponder in Gavdos and the CDN1 transponder in Crete, respectively. Calibration for Sentinel-3B with the CDN1 transponder was initiated on 9 January 2019, while the GVD1 transponder in Gavdos has been supporting the Sentinel-3A calibration since 21 October 2021.
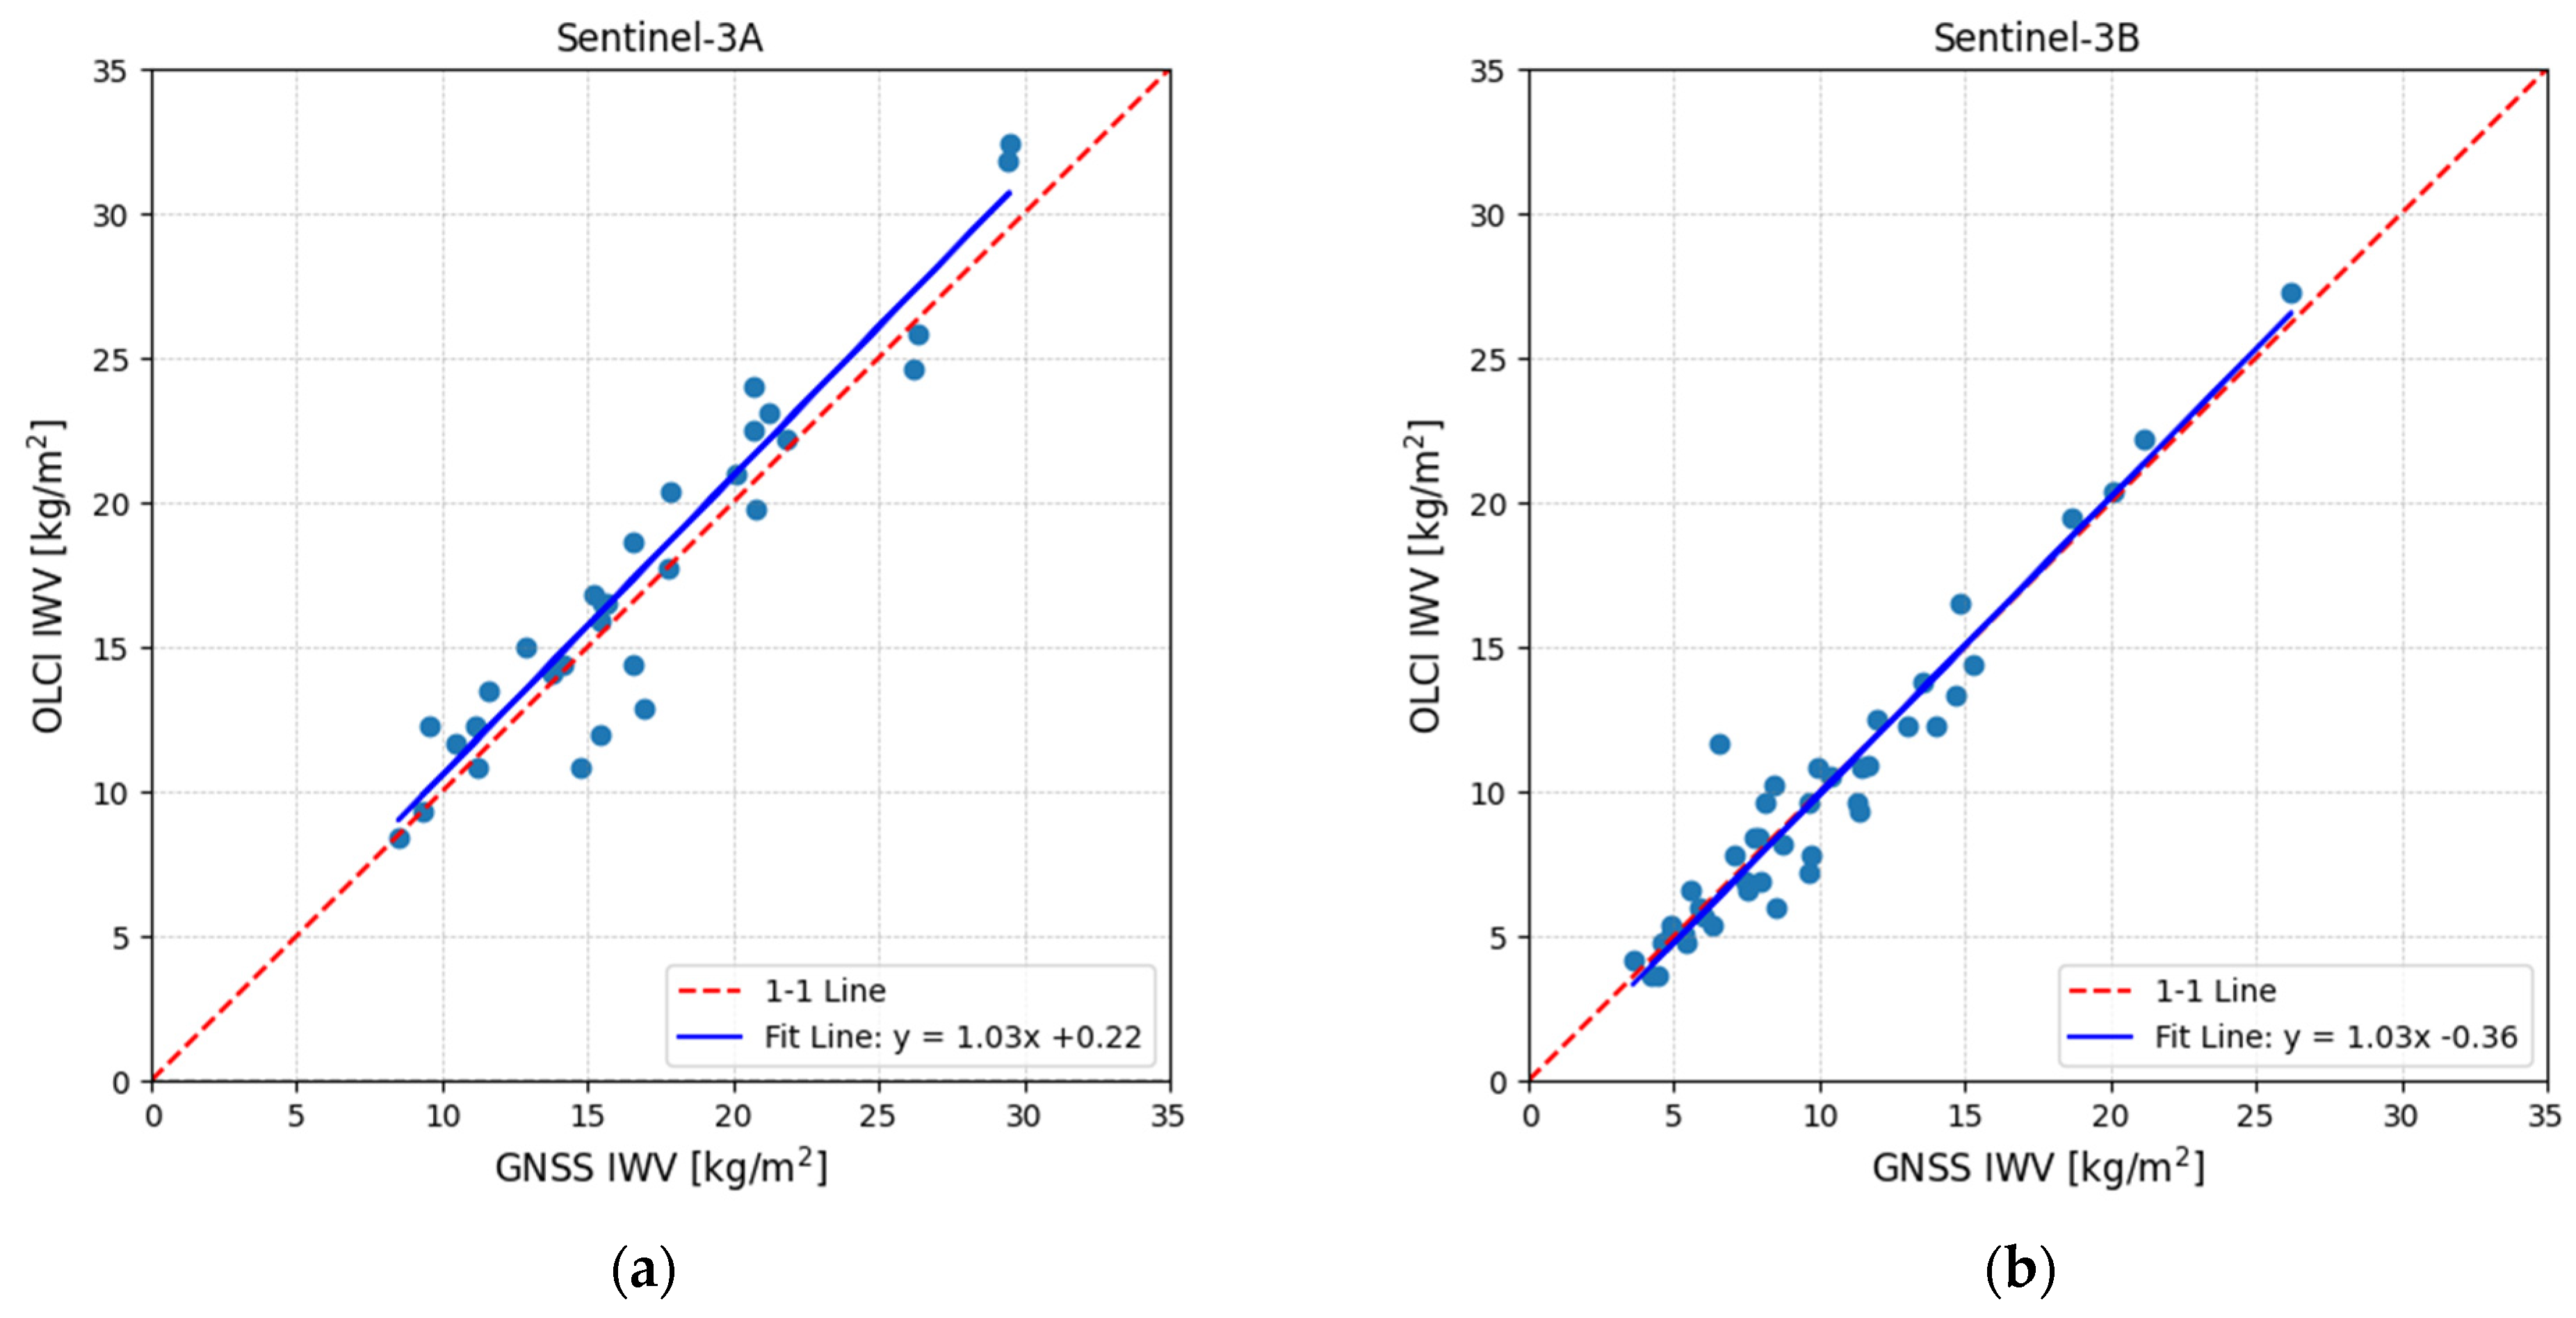
Valid OLCI measurements are available for 31 Sentinel-3A and 46 Sentinel-3B transponder calibrations (Figure 9). The Sentinel-3A and Sentinel-3B D335 OLCI IWV measurements are validated against the GVD0 (S3A) and CDN0 GNSS-derived IWV measurements, respectively. Determination of the GNSS-derived IWV is made using zenith wet delays and Equation (1). The average IWV difference is −0.64 kg/m2 ± 1.78 kg/m2 and +0.14 kg/m2 ± 1.18 kg/m2 for Sentinel-3A and Sentinel-3B, respectively, which corresponds to ±4 mm wet troposphere delay. In both cases, the min/max difference values are within the ±5 kg/m2 range, which corresponds to ±30 mm. These results confirm the consistency and reliability of the IWV measurements of the OLCI sensors in Sentinel-3A and Sentinel-3B and support their use in monitoring atmospheric water vapor.

4.2.2. The SLSTR Instrument of Sentinel-3A/B

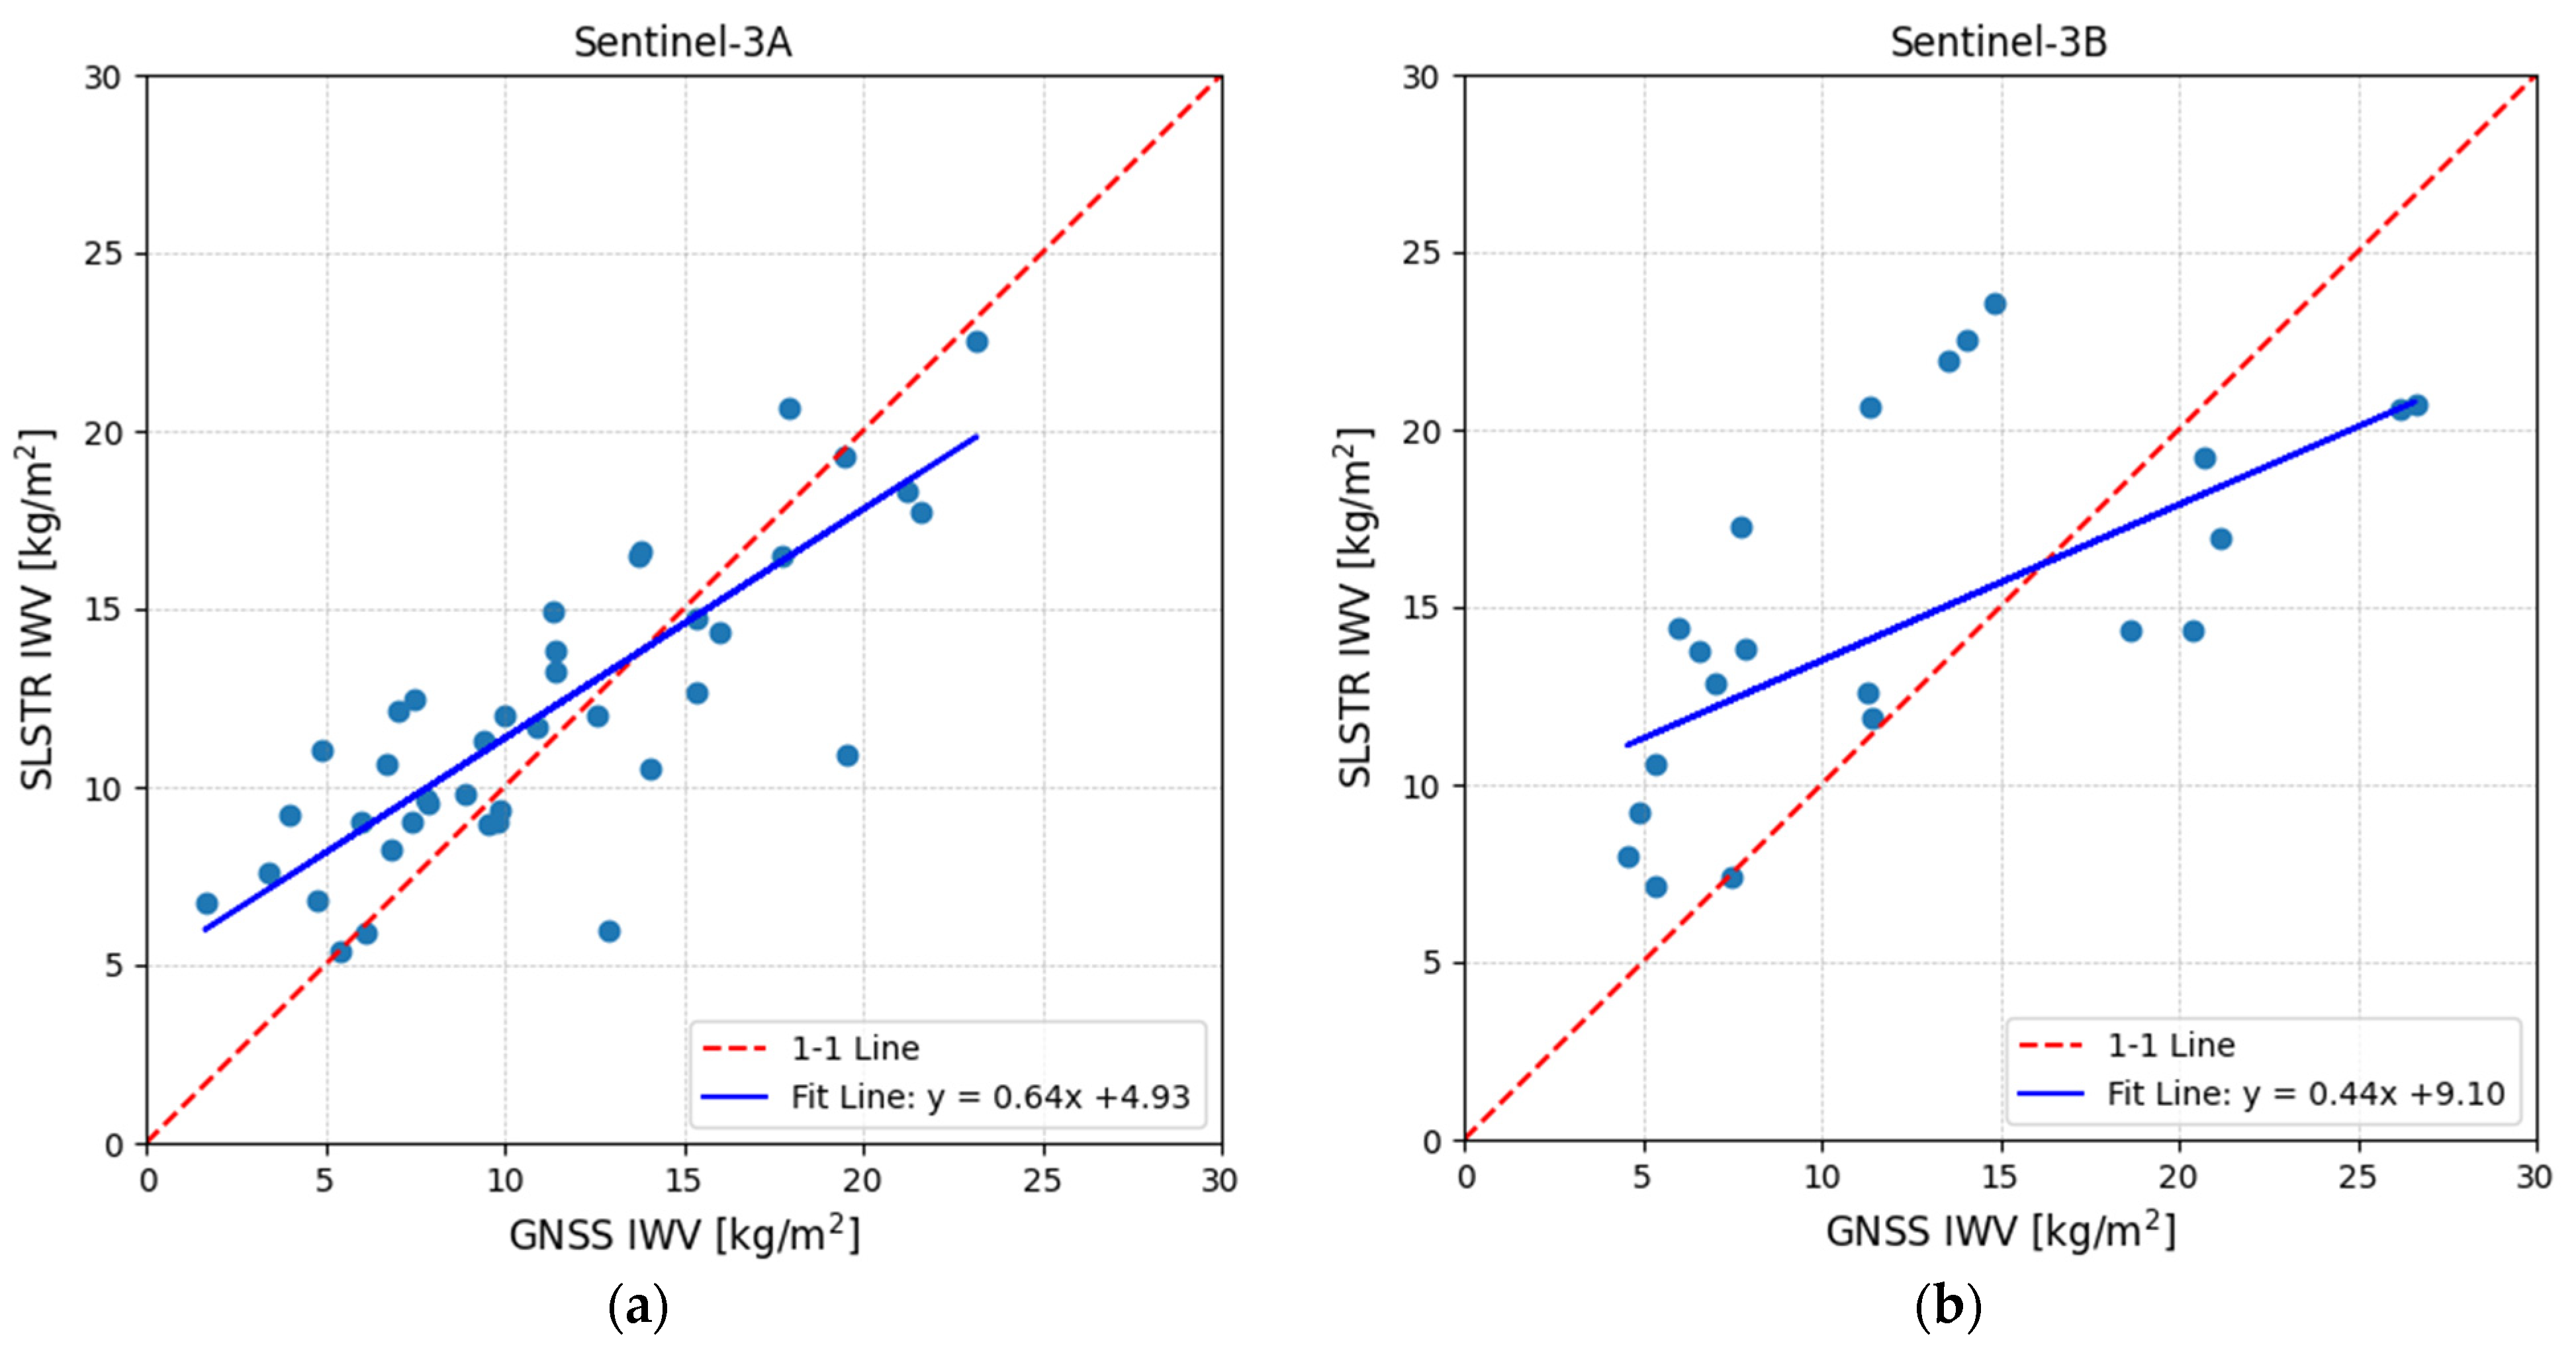
Figure 10 presents the SLSTR IWV measurements in relation to the IWV derived from the GNSS at the CDN1 transponder Cal/Val site, covering the period from May 2018 to April 2023 for Sentinel-3A and from January 2019 to March 2023 for Sentinel-3B. The data for the Sentinel-3A appear to be closer and gather around a straight line, while those for Sentinel-3B are noisier and more dispersed.
The average difference in the integrated water vapor (SLSTR- minus GNSS-derived) is determined to be 2.77 kg/m2 ± 5.5 kg/m2 for Sentinel-3B (daylight) and 0.5 kg/m2 ± 3 kg/m2 for Sentinel-3A (night) overpasses. In both cases, the independent (per pass) differences are within the ±10 kg/m2 range. Although the sample of available concurrent SLSTR- and GNSS-derived IWV measurements is rather small (N = 22 for Sentinel-3A and N = 34 for Sentinel-3B), the SLSTR can serve as a redundant source for the determination of the integrated water vapor of the atmosphere when transponder calibrations are carried out during the night (Sentinel-3A in this case).

4.2.3. The TROPOMI Instrument of Sentinel-5P

The Copernicus Sentinel-5P satellite was launched on 13 October 2017, but the integrated water vapor products of TROPOMI over the PFAC ground facility in Crete have been available since 5 May 2018. The acquisition time of TROPOMI over Crete is between 10:00 and 12:00 UTC. This makes it impossible to acquire the TROPOMI IWV values during Sentinel-3A/B Cal/Val, as these altimeters fly over the PFAC at 08:48 and at 20:00 UTC, respectively. Moreover, Sentinel-6 MF has an approximate repeat cycle of 9 days and 22 h, with an orbit duration of about 112 min [61]. This implies that the satellite overflies the same location and shifts about 2 h at successive cycles. Thus, there are a few days when the Sentinel-6 MF pass is within this 2 h period (i.e., 10:00–12:00 UTC) of the TROPOMI instrument, and thus the IWV can be estimated.
Therefore, the TROPOMI products cannot support the altimetry Cal/Val at this specific PFAC ground infrastructure and the specific overflies of these altimeters. However, this might not be the case with other international missions and Cal/Val facilities.
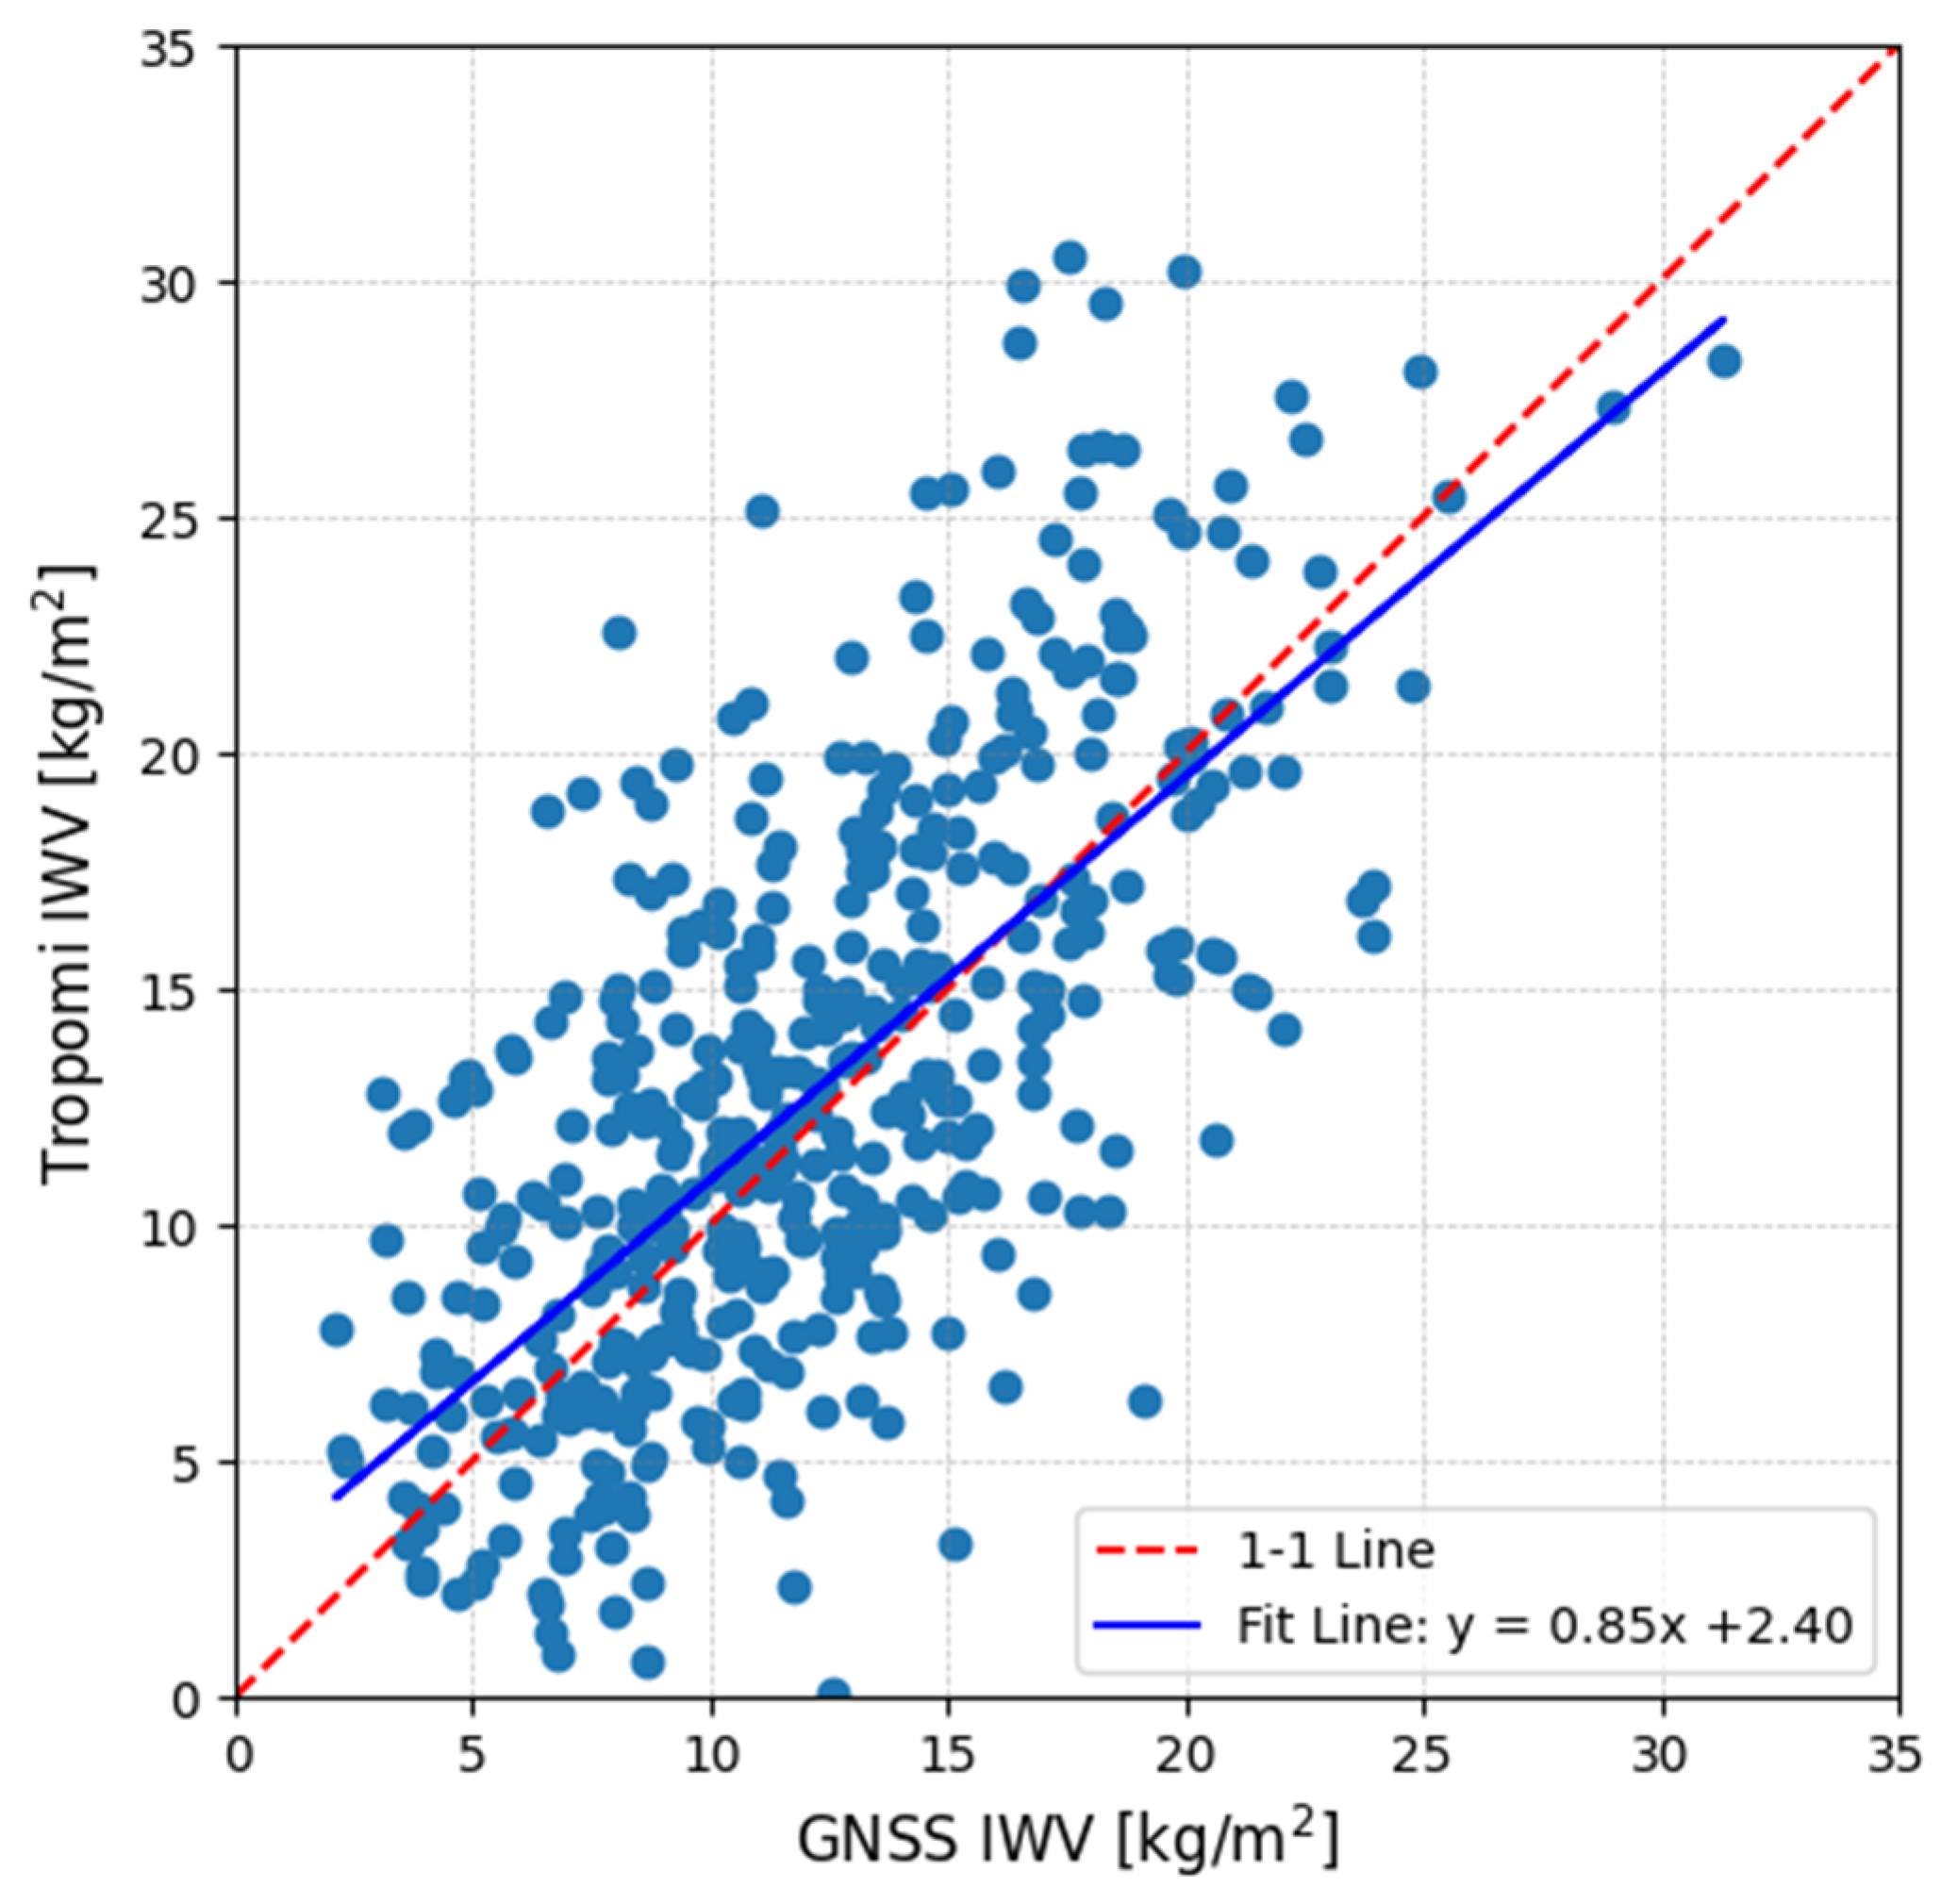
A sample of 432 simultaneous TROPOMI- and GNSS-derived IWV values at the days of multi-mission (i.e., Sentinel-6, Sentinel-3A/B, CryoSat-2, Jason-2/3) transponder Cal/Val at the CDN1 site in Crete have been analyzed in the period of May 2018–May 2024 (Figure 11). The average difference of the integrated water vapor (TROPOMI- minus GNSS-derived) is less than 1 kg/m2 ± 5 kg/m2. The min/max differences are within the ±15 kg/m2 range.
Table 2 reports the mean difference, the standard deviation, the Pearson correlation coefficient, and regression parameters of the GNSS-derived IWV values with respect to the satellite sensors (i.e., OLCI, SLSTR, TROPOMI). From the above results, it could be concluded that OLCI is the optimal complementary instrument for supporting altimetry Cal/Val on land.

4.3. Ground Radiometer Measurements in Crete

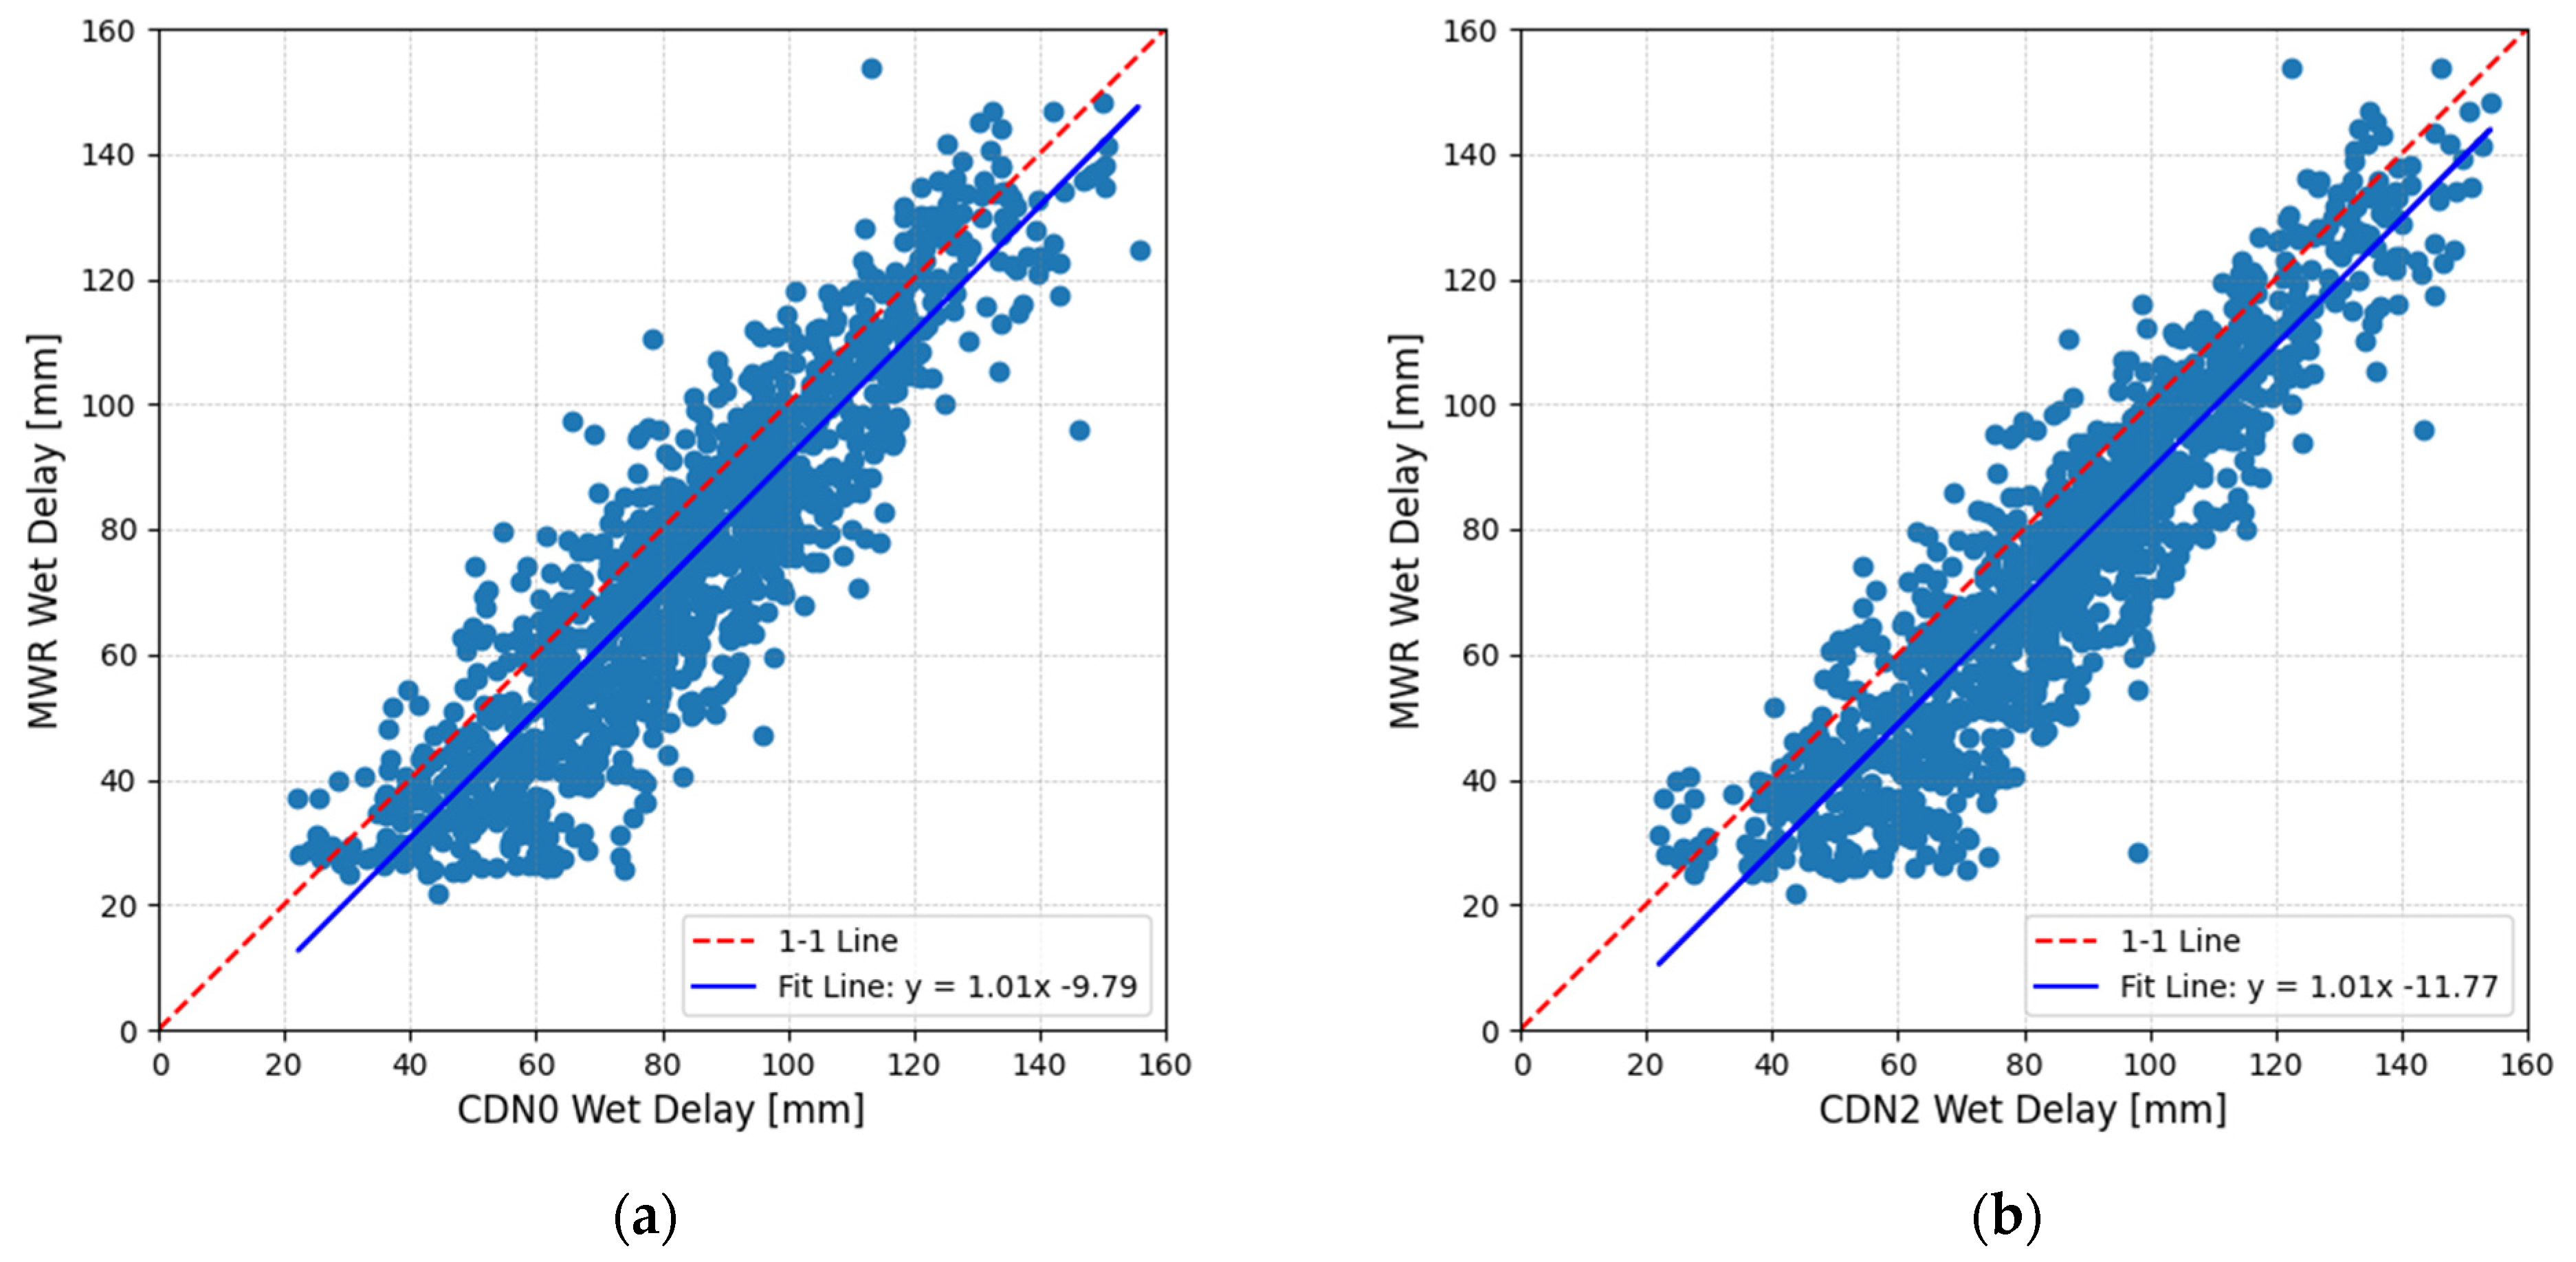
Figure 12 presents the scatterplots of the concurrent hourly wet tropospheric delays as derived by the two GNSS stations and the ESA radiometer using the IWV–ZWD conversion determined by the Radiosonde–Microwave Radiometer (MWR) comparison. This analysis indicated that the difference [MWR-GNSS] is −9.90 mm ± 12.2 mm for CDN0 and −11.40 mm ± 11.80 mm for CDN2 GNSS station at the CDN1 site in west Crete.
The large variation of MWR values when compared with concurrent GNSS data from both receivers could be caused by the different temporal and spatial resolutions of the two instruments, i.e., the microwave radiometer and the GNSS. The MWR measurements are collected directly along the path to the satellite altimeters with a high temporal resolution, while the GNSS IVW observations are the result of larger spatial and longer temporal averaging, because of the processing of navigation data from various GNSS satellites.
From July to September 2020, there were only nine (N = 9) transponder calibrations (five for Jason-3, two for Sentinel-3A, and two for Sentinel-3B) with concurrent radiometric and GNSS IWV measurements (Table 3). The average difference of the integrated water vapor [MWR-GNSS] is −2.50 kg/m2 ± 1.50 kg/m2 for the CDN0 GNSS station, with min/max values in the range of ±5 kg/m2.

4.4. The ECMWF Operational Analysis

The integrated water vapor values derived from the GNSS stations at the CDN1 transponder site were cross-examined against those obtained from the ECWMF models. The Geophysical Data Records of every satellite altimeter contain IWV values as estimated from the ECMWF operational analysis at the same spatial and temporal resolution as the altimeter measurements [62].
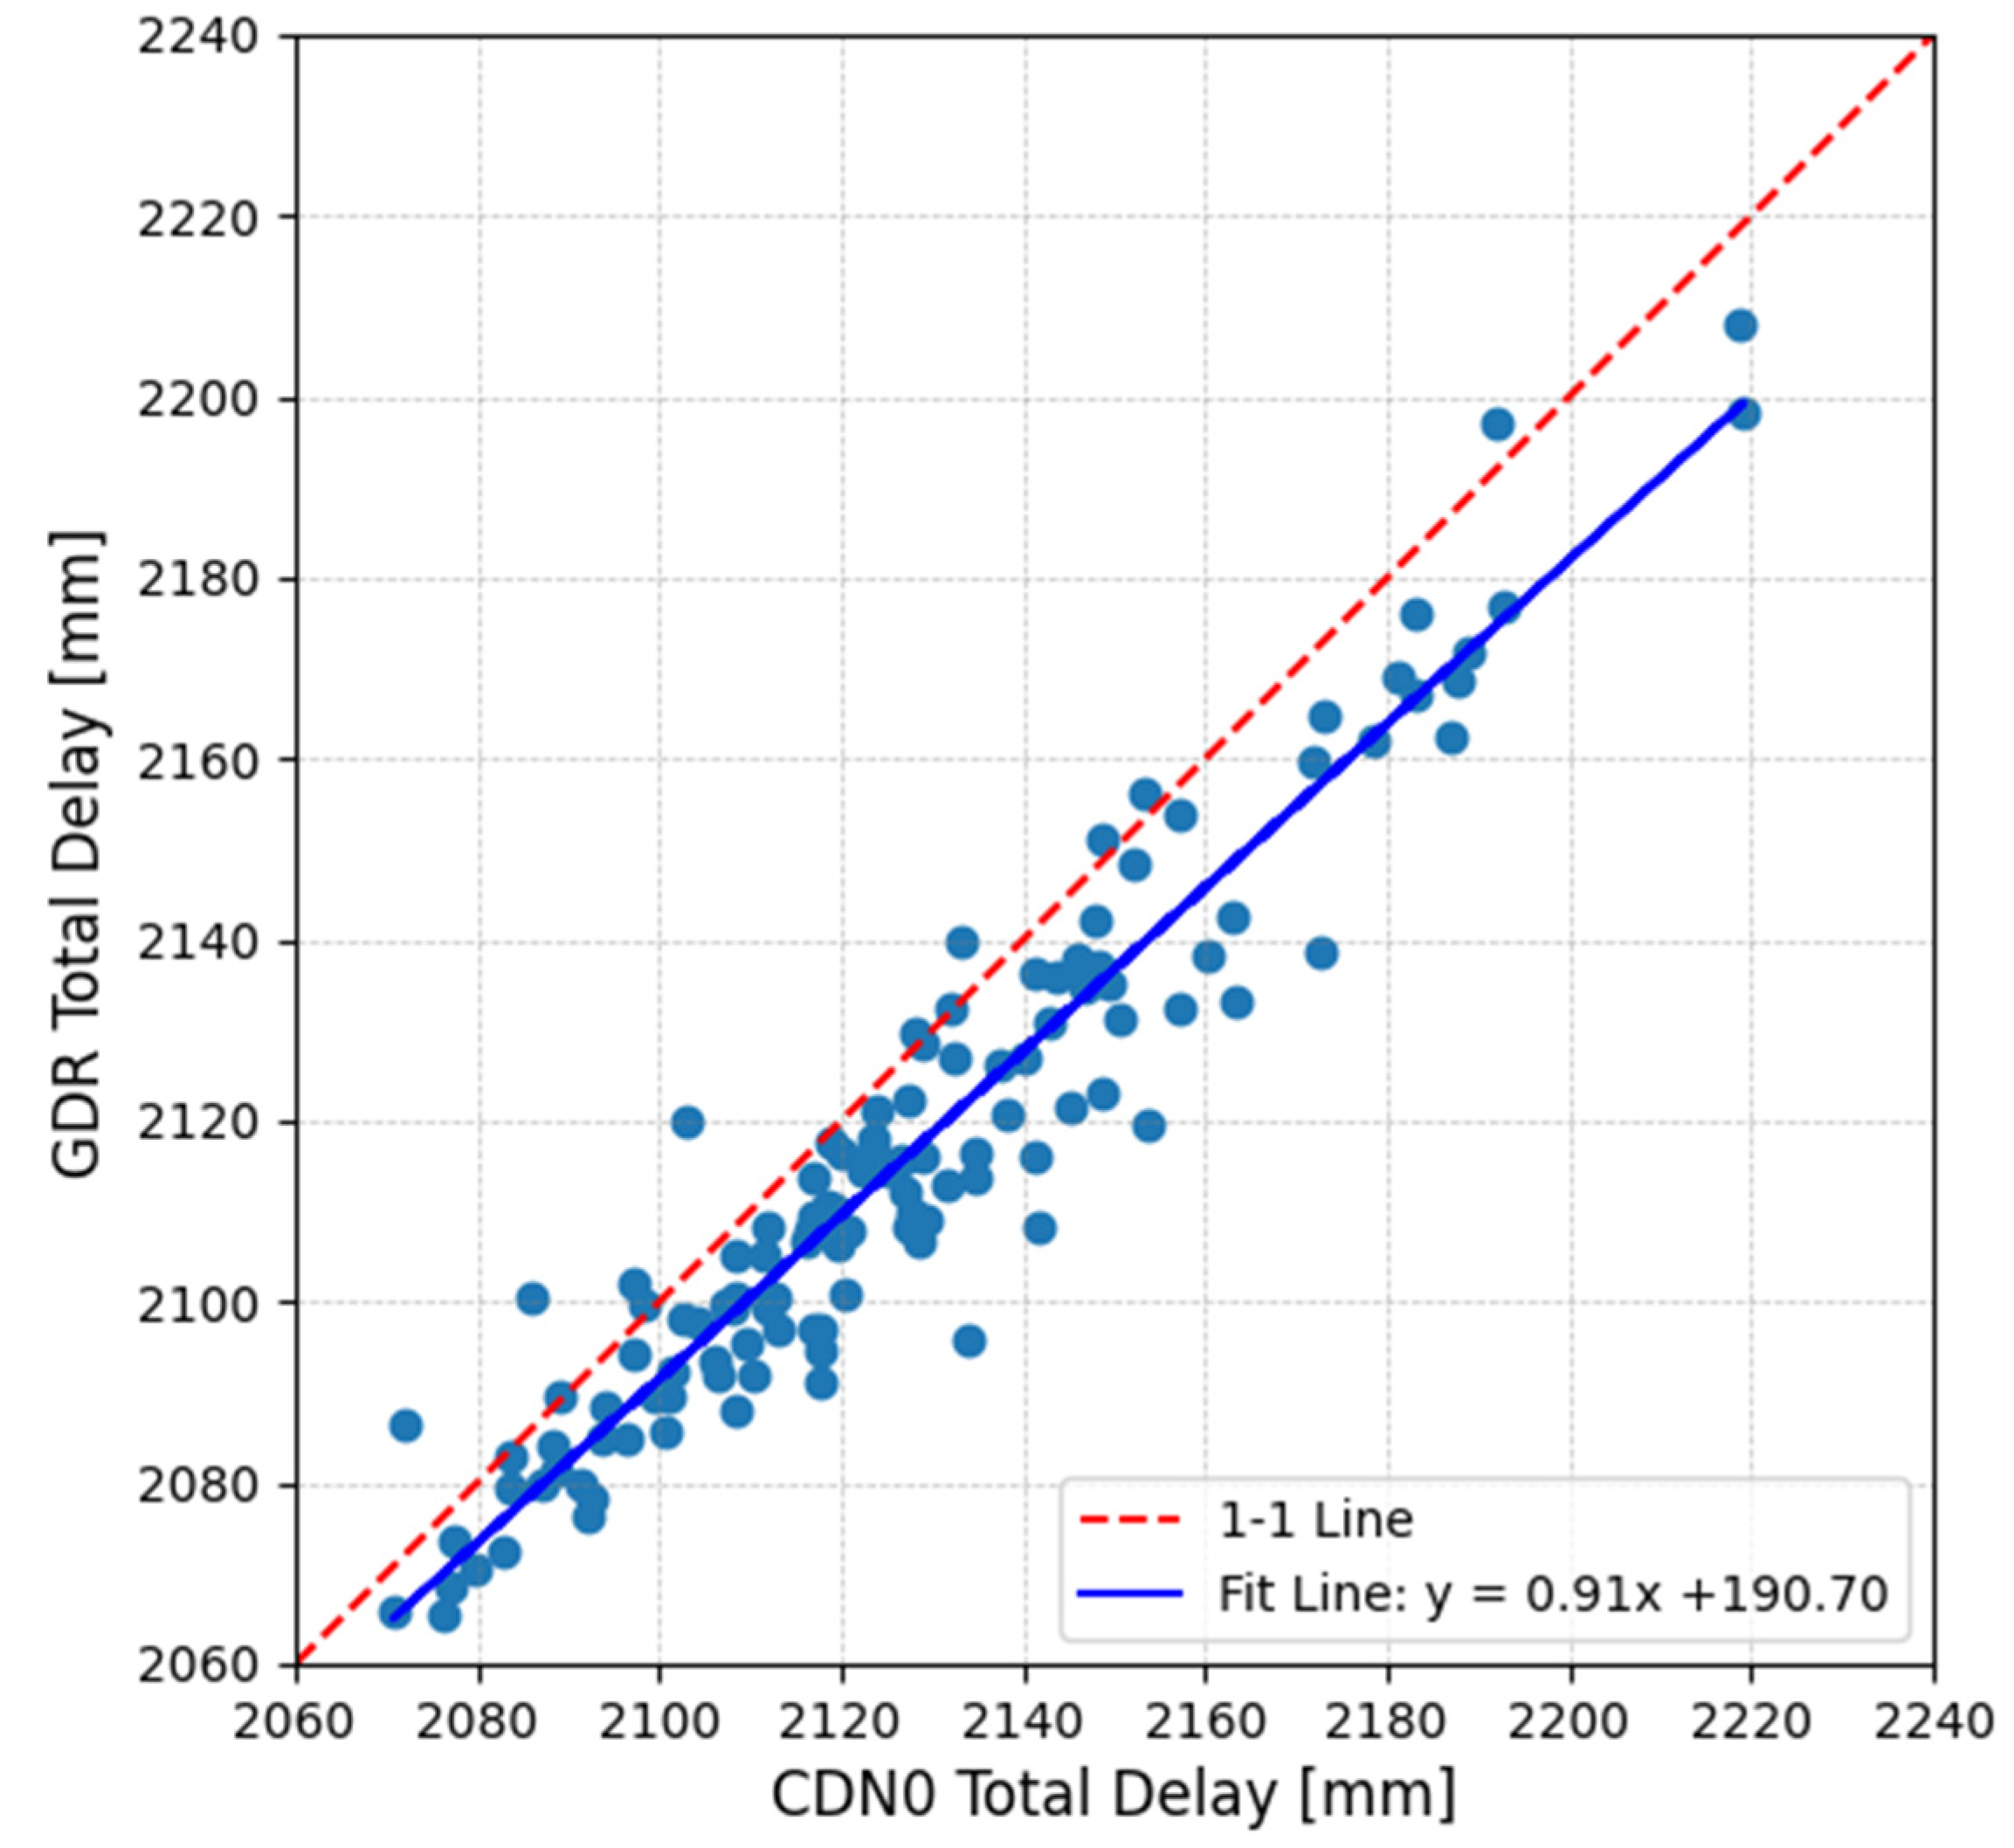
Figure 13 presents the zenith troposphere delay as determined by the CDN0 GNSS station during 121 transponder calibrations of Sentinel-6 MF along the descending pass D18 at the CDN1 Cal/Val site with respect to the associated values given at the altimetric product. Note that the PFAC GNSS stations’ observations are not assimilated in ECMWF operational products.
Thus, the two data sources are independent, and their intercomparison is conclusive. The average difference of the total tropospheric delay (ECMWF- minus GNSS-derived) is determined to be −11 mm ± 9.5 mm, and the min/max differences are −40 mm and +17 mm, respectively. The Pearson correlation coefficient is determined to be r = 0.9528.

5. Discussion and Concluding Remarks

Meteorological and climatological investigations and satellite altimetry Cal/Val activities rely upon accurate and reliable estimation of the atmosphere’s integrated water vapor content [63]. This is a challenging task because of the high IWV spatiotemporal variability. The selection of the optimal technique(s) and instrumentation for precise determination of the IWV content depends on the application, the availability of instrumentation, financial resources, environmental factors which impact the efficacy of each technique, etc. For example, the temporal resolution in meteorological investigations should be as small as possible, whereas in satellite altimetry calibration carried out on land, the instantaneous IWV value at the exact time of altimeter overpass is of utmost importance.
Diverse techniques such as GNSS meteorology, ground radiometers, radiosondes, satellite sensors, etc., have been implemented in this work to produce IWV values to be used in satellite altimetry Cal/Val. All the different IWV results have been compared and evaluated (see Table 2 and Table 3), based on which the following summary and conclusions have been reached:
  • GNSS meteorology is currently the reference technique for the integrated water vapor estimation in support of satellite altimetry Cal/Val, due to its proven accuracy, temporal continuity, and robustness under a wide range of weather conditions.
  • Diverse GNSS processing techniques (i.e., relative positioning and PPP-AR) should be employed to reduce the uncertainty of GNSS-derived IWV results, particularly in high-precision applications like Cal/Val.
  • Complementary use of satellite-based IWV products from Copernicus Sentinel missions (e.g., OLCI, SLSTR, TROPOMI) provides valuable redundancy and spatial coverage, enhancing the reliability of Cal/Val operations, especially when ground-based data are limited.
  • Ground-based microwave radiometers provide accurate integrated water vapor values and wet troposphere delay measurements directly along the path to the satellite (due to the narrow field of view) and with high temporal resolution, when compared to GNSS-derived observations. In addition, ground radiometers can operationally provide other atmospheric and propagation parameters, like total cloud liquid content, vertical profiles of temperature and water vapor, and atmospheric attenuation at any frequency between Ka-band and V-band. However, operating ground-based microwave radiometers at remote, high-altitude sites such as CDN1 presents major challenges, primarily due to their high and continuous power requirements. Furthermore, the reliance on precipitation-free circumstances for data retrieval raises the possibility of irregular observations of zenith wet delay. This limitation is especially problematic for satellite altimetry calibration and validation that require ZWD data only during satellite overpasses. Despite these operational challenges, ground radiometers are extremely useful for intercomparison with co-located GNSS observations. Based on our experience, ground MWRs are very effective for short-term intercalibration campaigns at various Cal/Val sites, ideally conducted during the summer months to take advantage of clear sky and the benefit of better power supply conditions.
  • Future work will focus on optimizing the use of SLSTR-derived IWV data, with an emphasis on tailoring the processing chain for the ESA Primary Fiducial Reference Cal/Val site.
  • Extending MWR intercalibration campaigns to additional ESA PFAC Cal/Val sites (e.g., GVD1 transponder in Gavdos and the ALX1/ALX2 corner reflectors in Crete) would improve spatial coverage and support comprehensive validation of satellite altimeters.

Author Contributions

Conceptualization, C.K., S.P.M. and C.D.; methodology, S.P.M., C.K., E.F. and A.M.; investigation, A.T. and C.K.; resources, A.M., A.T., C.K., X.F., E.F. and M.C.; data curation, A.T., C.K., A.M., E.F., M.C., D.P. and X.F.; supervision, S.P.M., E.F. and C.D.; writing—original draft preparation, A.T. and C.K.; writing—review and editing, S.P.M., E.F., A.M., M.C., D.P. and T.K.; project administration, S.P.M., E.F. and P.F.; funding acquisition, S.P.M., C.D. and A.M. All authors have read and agreed to the published version of the manuscript.

Funding

This research was partially funded by the European Union and the European Space Agency (Grant number: 4000129892/20/NL/FF/ab and 4000122240/17/I-BG).

Data Availability Statement

Sentinel-3 and Sentinel-6 products used for calibration processing are available from the centralized EUMETSAT site: https://data.eumetsat.int (accessed on 2 July 2024). Sentinel-5P products were retrieved through the S5P-PAL Data Portal (https://data-portal.s5p-pal.com/products/tcwv.html, accessed on 2 July 2024). Radiosonde measurements were retrieved from the Integrated Global Radiosonde Archive version 2 database (https://climatedataguide.ucar.edu/climate-data/integrated-global-radiosonde-archive-igra, accessed on 2 July 2024).

Acknowledgments

In this section, you can acknowledge any support given which is not covered by the author’s contribution or funding sections. This may include administrative and technical support, or donations in kind (e.g., materials used for experiments).

Conflicts of Interest

The authors declare no conflicts of interest.

Abbreviations

The following abbreviations are used in this manuscript:
ARAmbiguity Resolution
ATSRAlong-Track Scanning Radiometers
Cal/ValCalibration and Validation
DOASDifferential Optical Absorption Spectrometry
ECMWFEuropean Center for Medium-Range Weather Forecasts
ESAEuropean Space Agency
FRMFiducial Reference Measurements
GMSLGlobal Mean Sea Level
GNSSGlobal Navigation Satellite Systems
IWVIntegrated Water Vapor
MWRMicrowave Radiometer
OLCIOcean Land Color Instrument
PFACPermanent Facility for Altimetry Calibration
PPPPrecise Point Positioning
RPRelative Positioning
SARSynthetic Aperture Radar
S6-MFSentinel-6 Michael Freilich
SLSTRSea Land Surface Temperature Radiometer
TCWVTotal Column Water Vapor
TWDTropospheric Wet Delay
ZWDZenith Wet Delay

References

  1. International Altimetry Team; Verron, J.; Ryan, B.; Bonnefond, P.; Benveniste, J. Altimetry for the future: Building on 25 years of progress. Adv. Space Res. 2021, 68, 319–363. [Google Scholar] [CrossRef]
  2. Veng, T.; Andersen, O.B. Consolidating sea level acceleration estimates from satellite altimetry. Adv. Space Res. 2021, 68, 496–503. [Google Scholar] [CrossRef]
  3. Nerem, R.S.; Frederikse, T.; Hamlington, B.D. Extrapolating empirical models of satellite-observed global mean sea level to estimate future sea level change. Earth’s Future 2022, 10, e2021EF002290. [Google Scholar] [CrossRef]
  4. Guérou, A.; Meyssignac, B.; Prandi, P.; Ablain, M.; Ribes, A.; Bignalet-Cazalet, F. Current observed global mean sea level rise and acceleration estimated from satellite altimetry and the associated measurement uncertainty. Ocean Sci. 2023, 19, 431–451. [Google Scholar] [CrossRef]
  5. Legeais, J.-F.; Meyssignac, B.; Faugère, Y.; Guerou, A.; Ablain, M.; Pujol, M.-I.; Dufau, C.; Dibarboure, G. Copernicus Sea Level Space Observations: A Basis for Assessing Mitigation and Developing Adaptation Strategies to Sea Level Rise. Front. Mar. Sci. 2021, 8, 704721. [Google Scholar] [CrossRef]
  6. Hunt, S.E.; Albinet, C.; Nickeson, J.; Hall, A.; Fox, N.; Boccia, V.; Goryl, P. A Quality Assurance Framework for Satellite Earth Observation Missions. In Proceedings of the 2021 IEEE International Geoscience and Remote Sensing Symposium IGARSS, Brussels, Belgium, 11–16 July 2021; pp. 608–611. [Google Scholar] [CrossRef]
  7. Niro, F.; Cosh, M.; Nickeson, J. Trustworthy satellite Earth observations for science and society. Eos 2024, 105. [Google Scholar] [CrossRef]
  8. Sterckx, S.; Brown, I.; Kääb, A.; Krol, M.; Morrow, R.; Veefkind, P.; Folkert Boersma, K.; De Mazière, M.; Fox, N.; Thorne, P. Towards a European Cal/Val service for earth observation. Int. J. Remote Sens. 2020, 41, 4496–4511. [Google Scholar] [CrossRef]
  9. Badatala, S.; Sharma, S.; Tripathi, S.; Patel, P.R.; Mathur, A.K. Radiometric calibration stability assessment of Sentinel-1B using point targets at Surat Basin, Australia. Int. J. Microw. Wirel. Technol. 2022, 14, 1262–1269. [Google Scholar] [CrossRef]
  10. Gibert, F.; Gómez-Olivé, A.; Garcia-Mondéjar, A.; Francis, R.; Hernández, S.; Flores de la Cruz, A.; Vendrell, E.; Roca, M. A trihedral corner reflector for radar altimeter calibration. IEEE Trans. Geosci. Remote Sens. 2023, 61, 5101408. [Google Scholar] [CrossRef]
  11. Mertikas, S.P.; Donlon, C.; Kokolakis, C.; Piretzidis, D.; Cullen, R.; Féménias, P.; Fornari, M.; Frantzis, X.; Tripolitsiotis, A.; Bouffard, J.; et al. The ESA Permanent Facility for Altimetry Calibration in Crete: Advanced Services and the Latest Cal/Val Results. Remote Sens. 2024, 16, 223. [Google Scholar] [CrossRef]
  12. Goryl, P.; Fox, N.; Donlon, C.; Castracane, P. Fiducial Reference Measurements (FRMs): What are They? Remote Sens. 2023, 15, 5017. [Google Scholar] [CrossRef]
  13. Mertikas, S.P.; Donlon, C.; Féménias, P.; Cullen, R.; Galanakis, D.; Frantzis, X.; Tripolitsiotis, A. Fiducial Reference Measurements for Satellite Altimetry Calibration: The Constituents. In Fiducial Reference Measurements for Altimetry. International Association of Geodesy Symposia; Mertikas, S., Pail, R., Eds.; Springer: Cham, Switzerland, 2019; Volume 150. [Google Scholar]
  14. Dettmering, D.; Schwatke, C. Ionospheric Correction for Satellite Altimetry—Impact on Global Mean Sea Level Trends. Earth Space Sci. 2022, 9, e2021EA002098. [Google Scholar] [CrossRef]
  15. Hernández-Pajares, M.; Juan, J.M.; Sanz, J.; Orus, R.; Garcia-Rigo, A.; Feltens, J.; Komjathy, A.; Schaer, S.C.; Krankowski, A. The IGS VTEC maps: A reliable source of ionospheric information since 1998. J. Geod. 2009, 83, 263–275. [Google Scholar] [CrossRef]
  16. Frery, M.-L.; Siméon, M.; Goldstein, C.; Féménias, P.; Borde, F.; Houpert, A.; Olea Garcia, A. Sentinel-3 Microwave Radiometers: Instrument Description, Calibration and Geophysical Products Performances. Remote Sens. 2020, 12, 2590. [Google Scholar] [CrossRef]
  17. Prado, A.; Vieira, T.; Pires, N.; Fernandes, M.J. Wet tropospheric correction for satellite altimetry using SIRGAS-CON products. J. Geod. Sci. 2022, 12, 211–229. [Google Scholar] [CrossRef]
  18. Fernandes, M.J.; Lazaro, C.; Viera, T. On the role of the troposphere in satellite altimetry. Remote Sens. Environ. 2021, 252, 112149. [Google Scholar] [CrossRef]
  19. Hay, A.; Watson, C.; Legresy, B.; King, M.; Beardsley, J. Small scale variability in the wet troposphere impacts the interpretation of SWOT satellite observations. Geophys. Res. Lett. 2025, 52, e2024GL112778. [Google Scholar] [CrossRef]
  20. Mendes, V.B. Modeling the Neutral-Atmosphere Propagation Delay in Radiometric Space Techniques. Ph.D. Thesis, Department of Geodesy and Geomatics Engineering Technical Report No. 199. University of New Brunswick, Fredericton, NB, Canada, 1999; 353p. [Google Scholar]
  21. Li, L.; Wu, S.; Zhang, K.; Wang, X.; Li, W.; Shen, Z.; Zhu, D.; He, Q.; Wan, M. A new zenith hydrostatic delay model for real-time retrievals of GNSS-PWV. Atmos. Meas. Tech. 2021, 14, 6379–6394. [Google Scholar] [CrossRef]
  22. Vieira, E.; Lazaro, C.; Fernandes, M.J. Spatio-temporal variability of the wet component of the troposphere—Application to satellite altimetry. Adv. Space Res. 2018, 63, 1737–1753. [Google Scholar] [CrossRef]
  23. Hadas, T.; Hobiger, T.; Hordyniec, P. Considering different recent advancements in GNSS on real-time zenith troposphere estimates. GPS Solut. 2020, 24, 99. [Google Scholar] [CrossRef]
  24. Ablain, M.; Meyssignac, B.; Zawadzki, L.; Jugier, R.; Ribes, A.; Spada, G.; Benveniste, J.; Cazenave, A.; Picot, N. Uncertainty in satellite estimates of global mean sea level changes, trends and acceleration. Earth Syst. Sci. Data 2019, 11, 1189–1202. [Google Scholar] [CrossRef]
  25. Vaquero-Martínez, J.; Antón, M. Review on the Role of GNSS Meteorology in Monitoring Water Vapor for Atmospheric Physics. Remote Sens. 2021, 13, 2287. [Google Scholar] [CrossRef]
  26. Muñoz, L.E.; Campozano, L.V.; Guevara, D.C.; Parra, R.; Tonato, D.; Suntaxi, A.; Maisincho, L.; Páez, C.; Villacís, M.; Córdova, J.; et al. Comparison of Radiosonde Measurements of Meteorological Variables with Drone, Satellite Products, and WRF Simulations in the Tropical Andes: The Case of Quito, Ecuador. Atmosphere 2023, 14, 264. [Google Scholar] [CrossRef]
  27. Gradinarsky, L.P.; Haas, R.; Elgered, G.; Johansson, J.M. Wet path delay and delay gradients inferred from microwave radiometer, GPS and VLBI observations. Earth Planet 2000, 52, 695–698. [Google Scholar] [CrossRef]
  28. Aparicio, A.J.P.; Vaquero-Martinez, J.; Gallego, M.C.; Anton, M.; Vaqueto, J.M. Validation of precipitable water vapor estimates from an inexpensive infrared thermometer. J. Atmos. Sol. Terr. Phys. 2023, 249, 106107. [Google Scholar] [CrossRef]
  29. Kloosterman, J.L.; Brown, S.; Koch, T.; Vo, N.; Nicaise, F.; Schlecht, E.; Bloom, M.; Milligan, L.; Scott Tripp, K.; Kangaslahti, P.; et al. The Advanced Microwave Radiometer—Climate Quality (AMR-C) Instrument for Sentinel-6. In Proceedings of the 28th International Symposium on Space Terahertz Technology, Cologne, Germany, 13–15 March 2017. [Google Scholar]
  30. Preusker, R.; Carbajal Henken, C.; Fischer, J. Retrieval of Daytime Total Column Water Vapour from OLCI Measurements over Land Surfaces. Remote Sens. 2021, 13, 932. [Google Scholar] [CrossRef]
  31. Coppo, P.; Mastrandrea, C.; Stagi, M.; Calamai, L.; Nieke, J. Sea and Land Surface Temperature Radiometer detection assembly design and performance. J. Appl. Remote Sens. 2014, 8, 084979. [Google Scholar] [CrossRef]
  32. Vaquero-Martinez, J.; Anton, M.; Chan, K.L.; Loyola, D. Evaluation of Water Vapor Product from TROPOMI and GOME-2 Satellites Against Ground-Based GNSS Data over Europe. Atmosphere 2022, 13, 1079. [Google Scholar] [CrossRef]
  33. International GNSS Service. Guidelines for Continuously Operating Reference Stations in the IGS. Available online: https://igs.org/news/new-cors-guidelines/ (accessed on 15 July 2025).
  34. Vömel, H.; Ingleby, B. Ballon-borne radiosondes. In Field Measurements for Passive Environmental Remote Sensing; Nalli, N.R., Ed.; Elsevier: Amsterdam, The Netherlands, 2023; Chapter 2; pp. 23–35. [Google Scholar] [CrossRef]
  35. Wilgan, K.; Stauffer, R.; Meindl, M.; Geiger, A. Comparison of tropospheric parameters from Meteodrone measurements with GNSS estimated from ground-based stations. Adv. Space Res. 2020, 66, 2812–2826. [Google Scholar] [CrossRef]
  36. Imke, D.; Yin, X.; Russell, S.V.; Scott, A.; Jeff, A.; Bryant, K.; Bruce, H. Integrated Global Radiosonde Archive (IGRA), Version 2; NOAA National Centers for Environmental Information: Asheville, NC, USA, 2016. [CrossRef]
  37. Karavaev, D.M.; Shchukin, G.G.; Efremenko, A.N. Ground-based microwave radiometry for measurements of atmospheric water vapour and cloud liquid water contents. J. Phys. Conf. Ser. 2020, 1632, 012026. [Google Scholar] [CrossRef]
  38. Borger, C.; Beirle, S.; Wagner, T. A 16-year global climate data record of total column water vapour generated from OMI observations in the visible blue spectral range. Earth Syst. Sci. Data 2023, 15, 3023–3049. [Google Scholar] [CrossRef]
  39. Smith, D.; Barillot, M.; Bianchi, S.; Brandani, F.; Coppo, P.; Etxaluze, M.; Frerick, J.; Kirschstein, S.; Lee, A.; Maddison, B.; et al. Sentinel-3A/B SLSTR Pre-Launch Calibration of the Thermal InfraRed Channels. Remote Sens. 2020, 12, 2510. [Google Scholar] [CrossRef]
  40. Herbach, H.; Bell, B.; Berrisford, P.; Hirahara, S.; Horanyl, A.; Munoz-Sabater, J.; Nicolas, J.; Peubey, C.; Radu, E.; Schepers, D.; et al. The ERA5 global reanalysis. Q. J. R. Meteorol. Soc. 2020, 146, 1999–2049. [Google Scholar] [CrossRef]
  41. Jin, S.; Wang, Q.; Dardanelli, G. A Review on Multi-GNSS for Earth Observation and Emerging Applications. Remote Sens. 2022, 14, 3930. [Google Scholar] [CrossRef]
  42. Zhao, Q.; Yaho, Y.; Yao, W.; Li, Z. Real-time precise point positioning-based zenith tropospheric delay for precipitation forecasting. Sci. Rep. 2018, 8, 7939. [Google Scholar] [CrossRef]
  43. Hopfield, H.S. Two-quartic tropospheric refractivity profile for correction satellite data. J. Geophys. Res. 1969, 74, 4487–4499. [Google Scholar] [CrossRef]
  44. Saastamoinen, J. Atmospheric correction for the troposphere and stratosphere in radio ranging satellites. Geophys. Monogr. Ser. 1972, 15, 247–251. [Google Scholar] [CrossRef]
  45. Zhao, Q.; Liu, K.; Zhang, T.; He, L.; Shen, Z.; Xiong, S.; Shi, Y.; Chen, L.; Liao, W. A Global Conversion Factor Model for Mapping Zenith Total Delay onto Precipitable Water. Remote Sens. 2022, 14, 1086. [Google Scholar] [CrossRef]
  46. Bevis, M.; Businger, S.; Chiswell, S.; Herring, T.A.; Anthes, R.A.; Rocken, C.; Ware, R.H. GPS Meteorology: Mapping Zenith Wet Delays onto Precipitable Water. J. Appl. Meteorol. Climatol. 1994, 33, 379–386. [Google Scholar] [CrossRef]
  47. Han, Y.; Westwater, R. Analysis and improvement of tipping calibration for ground-based microwave radiometers. IEEE Trans. Geosci. Remote Sens. 2000, 38, 1260–1276. [Google Scholar] [CrossRef]
  48. Liljegren, J.C. Automatic self-calibration of ARM microwave radiometers. In Microwave Radiometry and Remote Sensing of the Earth’s Surface and Atmosphere; Pampaloni, P., Paloscia, S., Lorton, V.A., Eds.; VSP Book: Herndon, VA, USA, 2000; pp. 433–443. [Google Scholar]
  49. Clough, S.A.; Shephard, M.W.; Mlawer, E.J.; Delamere, J.S.; Iacono, M.J.; Cady-Pereira, K.; Boukabara, S.; Brown, P.D. Atmospheric radiative transfer modeling: A summary of the AER codes. J. Quant. Spectrosc. Radiat. Transf. 2005, 91, 233–244. [Google Scholar] [CrossRef]
  50. Fionda, E.; Cadeddu, M.; Mattioli, V.; Pacione, R. Intercomparison of Integrated Water Vapor Measurements at High Latitudes from Co-Located and Near-Located Instruments. Remote Sens. 2019, 11, 2130. [Google Scholar] [CrossRef]
  51. Negusini, M.; Petkov, B.H.; Tornatore, V.; Barindelli, S.; Martelli, L.; Sarti, P.; Tomasi, C. Water Vapour Assessment Using GNSS and Radiosondes over Polar Regions and Estimation of Climatological Trends from Long-Term Time Series Analysis. Remote Sens. 2021, 13, 4871. [Google Scholar] [CrossRef]
  52. Leinweber, R. Remote Sensing of Atmospheric Water Vapor over Land Areas Using MERIS Measurements and Application to Numerical Weather Prediction Model Validation. Ph.D. Thesis, Freien Universität Berlin, Berlin, Germany, 22 June 2010. [Google Scholar]
  53. Casadio, S.; Castelli, E.; Papandrea, E.; Dinelli, B.M.; Pisacane, G.; Burini, A.; Bojkov, B.R. Total column water vapour from along track scanning radiometer series using thermal infrared dual view ocean cloud free measurements: The advanced infrared water vapour estimator (AIRWAVE) algorithm. Remote Sens. Environ. 2016, 172, 1–14. [Google Scholar] [CrossRef]
  54. Castelli, E.; Papandrea, E.; Di Roma, A.; Dinelli, B.M.; Casadio, S.; Bojkov, B. The advanced infrared water vapour estimator (AIRWAVE) version 2: Algorithm evolution, dataset description and performance improvements. Atmos. Meas. Tech. 2019, 12, 371–388. [Google Scholar] [CrossRef]
  55. Li, Z.L.; Jia, L.; Su, Z.; Wan, Z.; Zhang, R. A new approach for retrieving precipitable water from ATSR2 split-window channel data over land area. Int. J. Remote Sens. 2003, 24, 5095–5117. [Google Scholar] [CrossRef]
  56. Chan, K.L.; Slijkhuis, S. S5P/TROPOMI Total Column Water Vapour Algorithm Theoretical Basis Document. DLR 2021, S5P-L2-DLR-ATBD-TCWV. Available online: https://data-portal.s5p-pal.com/product-docs/tcwv/S5P-L2-DLR-ATBD-TCWV_1.2_signed.pdf (accessed on 24 April 2024).
  57. Herring, T.A.; King, R.W.; McClusky, S.C. GAMIT Reference Manual: GPS Analysis at MIT, Release 10.7; Massachesetts Institue of Technology: Cambridge, MA, USA, 2018; Available online: http://geoweb.mit.edu/gg/docs/GAMIT_Ref.pdf (accessed on 14 February 2024).
  58. Tserolas, V.; Mertikas, S.P.; Frantzis, X. The western Crete geodetic infrastructure: Long-range power law correlations in GPS time series using Detrended Fluctuation Analysis. Adv. Space Res. 2013, 51, 1448–1467. [Google Scholar] [CrossRef]
  59. Banville, S.; Hassen, E.; Lamothe, P.; Farinaccio, J.; Donahue, B.; Mireault, Y.; Goudarzi, M.A.; Collins, P.; Ghoddousi-Fard, R.; Kamali, O. Enabling ambiguity resolution in CSRS-PPP. Navigation 2021, 68, 433–451. [Google Scholar] [CrossRef]
  60. Mertikas, S.; Partsinevelos, P.; Tripolitsiotis, A.; Kokolakis, C.; Petrakis, G.; Frantzis, X. Validation of Sentinel-3 OLCI Integrated Water Vapor Products Using Regional GNSS Measurements in Crete, Greece. Remote Sens. 2020, 12, 2606. [Google Scholar] [CrossRef]
  61. Donlon, J.C.; Cullen, R.; Giulicchi, L.; Vuilleumier, P.; Francis, R.; Kuschnerus, M.; Simpson, W.; Bouridah, A.; Caleno, M.; Bertoni, R.; et al. The Copernicus Sentinel-6 mission: Enhanced continuity of satellite sea level measurements from space. Remote Sens. Environ. 2021, 258, 112395. [Google Scholar] [CrossRef]
  62. Sentinel-3/Jason-CS-Sentinel-6 Product Handbook, Issue 5 rev.1, 2024, SALP-MU-P-EA-23014-CLS. Available online: https://www.aviso.altimetry.fr/fileadmin/documents/data/tools/hdbk_L2P_S3_S6.pdf (accessed on 14 February 2024).
  63. Campanelli, M.; Mascitelli, A.; Sano, P.; Diemoz, H.; Estelles, V.; Federic, S.; Lannarelli, A.M.; Fratarcangeli, F.; Mazzoni, A.; Realini, E.; et al. Precipitable water vapour content from ESR/SKYNET sun–sky radiometers: Validation against GNSS/GPS and AERONET over three different sites in Europe. Atmos. Meas. Tech. 2018, 11, 81–94. [Google Scholar] [CrossRef]
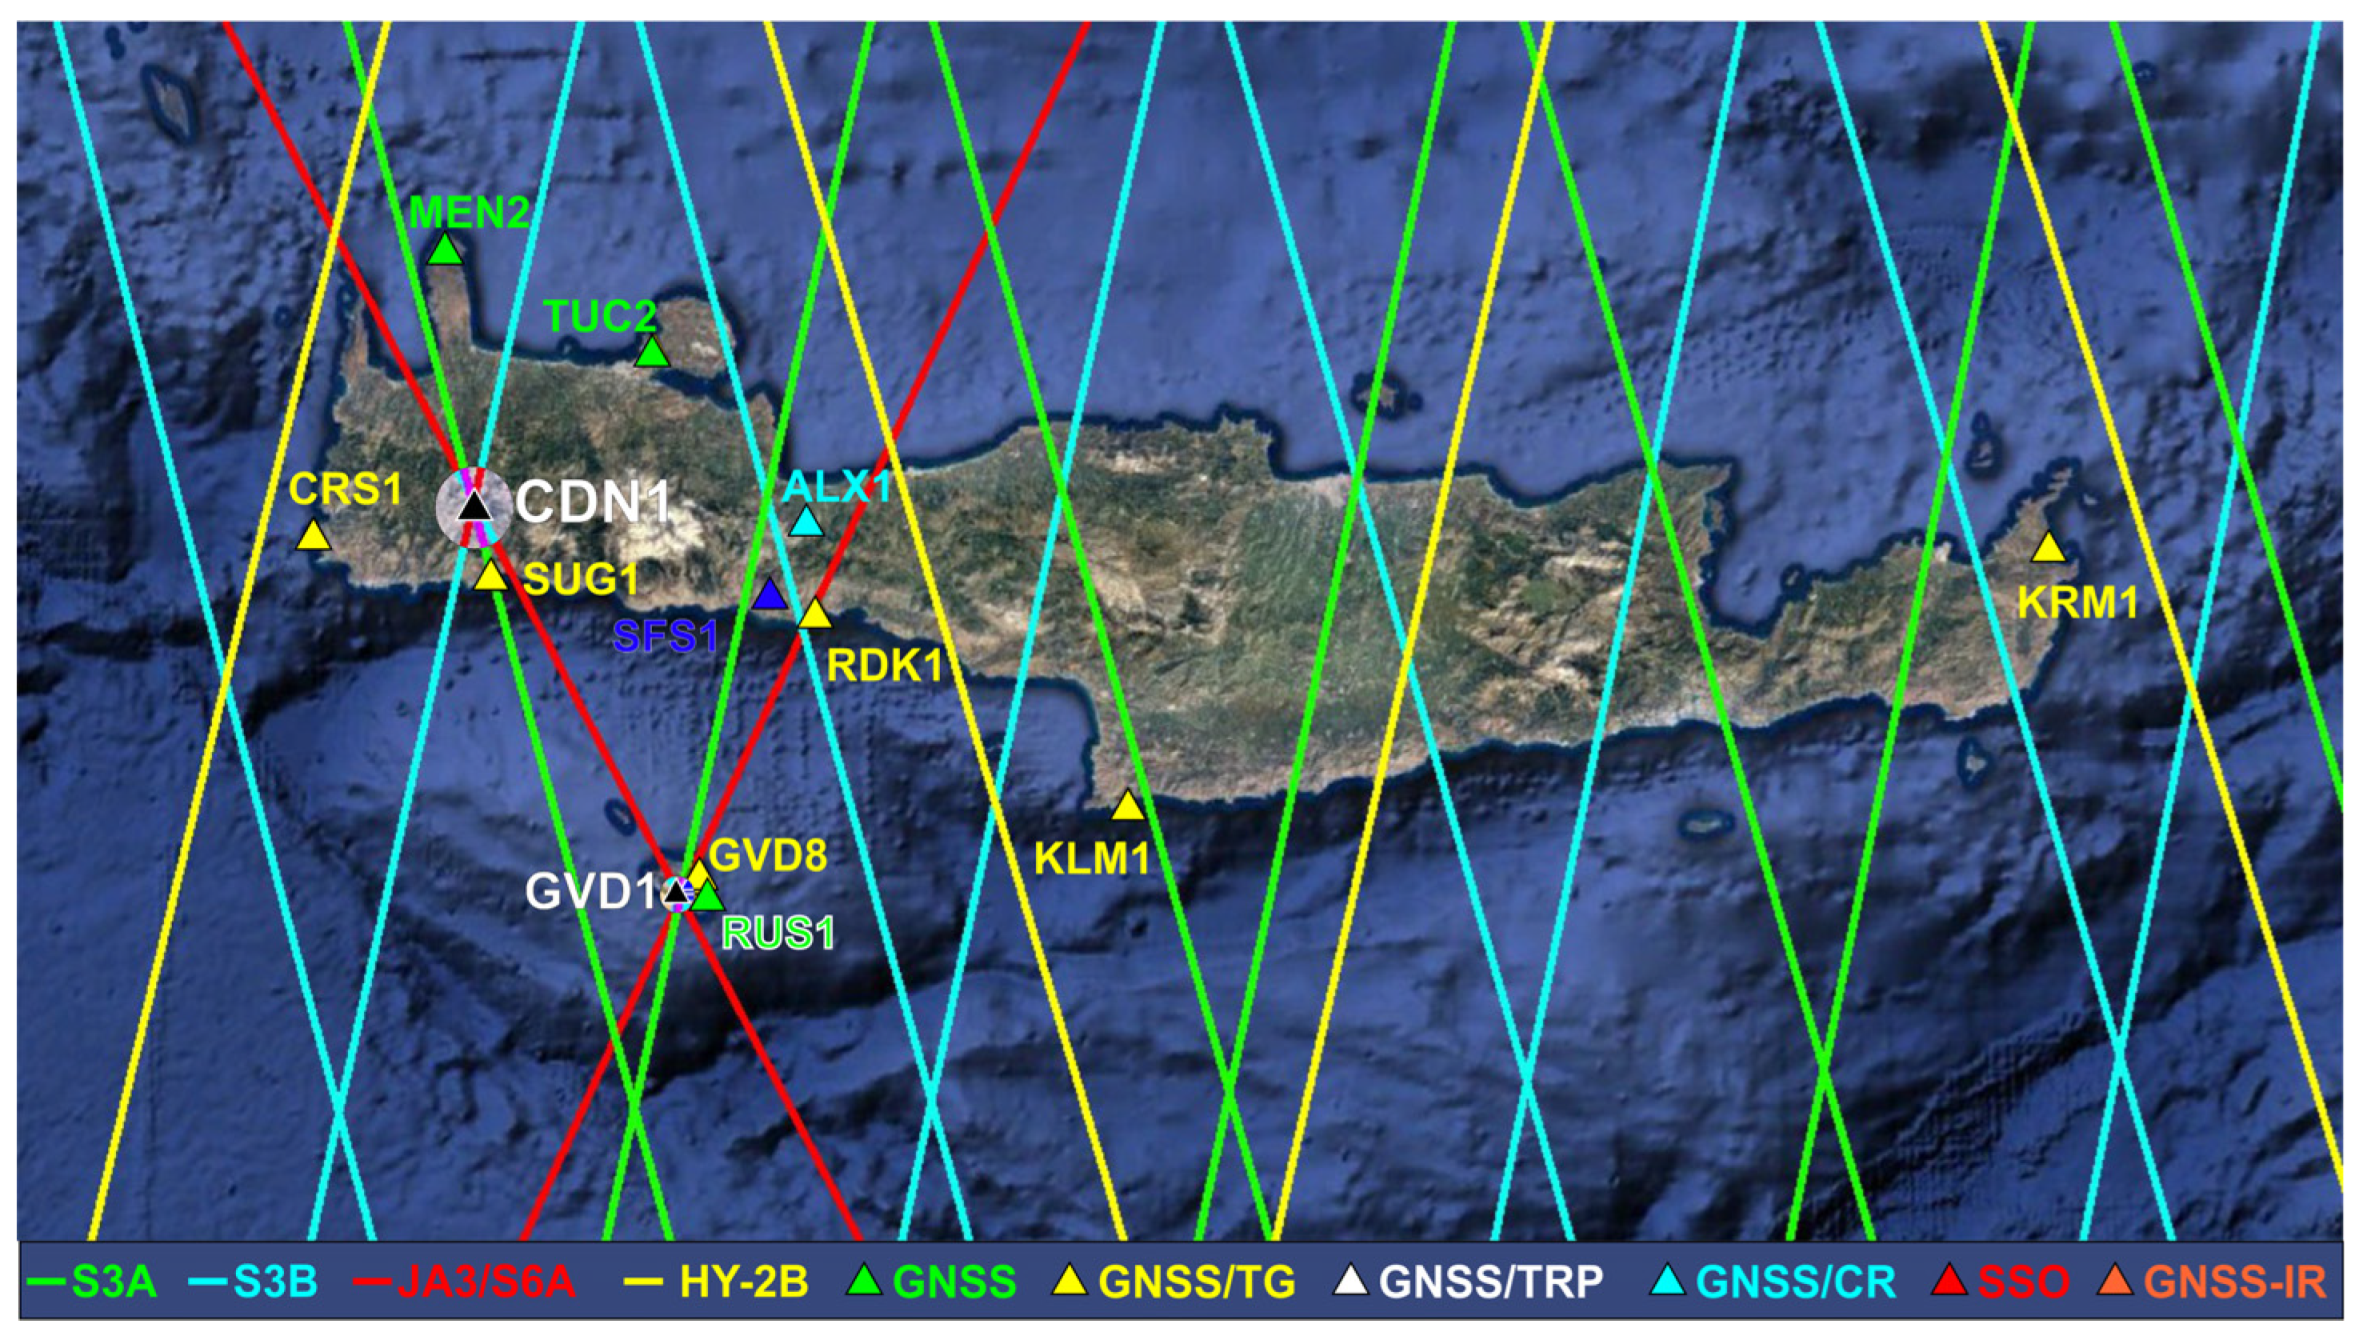
Figure 1. The Permanent Facility for Altimeter Calibration of the European Space Agency in Crete, Greece. The independent Cal/Val sites apply diverse techniques (i.e., transponder, corner reflectors, sea-surface Cal/Val sites, and sea state optical infrastructure, as well as GNSS Interferometric Reflectometry). Cal/Val sites are shown along with the groundtracks of the operational satellite altimeters (Sentinel-3A/B, Sentinel-6A MF, HY-2B).
Remotesensing 17 02779 g001
Figure 2. The GNSS receivers (CDN0, CDN2, GVD0, GVD2) and meteorological sensors operating at the Crete “CDN1” (a) and Gavdos “GVD1” (b) transponder Cal/Val sites.
Remotesensing 17 02779 g002
Figure 3. The ESA MP-3000A ground-based microwave radiometer at the CDN1 transponder Cal/Val site on the mountains of west Crete.
Remotesensing 17 02779 g003
Figure 4. Left: The radiometer’s calibration using the tipping-curve method was successful when the tip curve pointed to the south. Right: The arrow indicated the minimum tip curve elevation, whereas the dashed line corresponds to zero tip curve elevation.
Remotesensing 17 02779 g004
Figure 5. Validation of radiometric retrieval algorithm using a test dataset of IWV from radiosonde observations (x-axis) and retrieved from simulated brightness temperature using an independent radiosonde dataset (y-axis). Data refer to the CDN1 transponder Cal/Val site using radiosonde profiles from 2005 to 2020, launched at Heraklion Airport, Crete, about 130 km east.
Remotesensing 17 02779 g005
Figure 6. Intercomparison of atmospheric brightness temperature at 23.834 GHz (x-axis) and 30 GHz (y-axis) measured by the microwave radiometer operating at the CDN1 Cal/Val site (red dots) and derived from 15-year radiosonde test datasets at the Heraklion airport (blue dots), in both clear-sky (i.e., when Tb is lower than 50 and 20 K at 23.834 and 30 GHz, respectively) and cloudy conditions. Differences in cloudy conditions are due to the cloud detection algorithm applied to radiosonde data.
Remotesensing 17 02779 g006
Figure 7. Intercomparison of hourly ZWD as derived by the microwave radiometer operating at the CDN1 Cal/Val site (x-axis) and concurrent radiosonde profile measurements (y-axis) at Heraklion Airport for the period of July–September 2020.
Remotesensing 17 02779 g007
Figure 8. Difference in total tropospheric delay estimation between PPP- and RP-derived values at the CDN2 GNSS station in Crete transponder site.
Remotesensing 17 02779 g008
Figure 9. Scatterplots of concurrent Integrated Water Vapor values derived by OLCI versus those through GNSS during the Sentinel-3A (period: October 2021–May 2024) and Sentinel-3B (period: January 2019–May 2024) transponder calibrations at the GVD1 (a) and CDN1 (b) Cal/Val sites, respectively.
Remotesensing 17 02779 g009
Figure 10. Scatterplots of concurrent SLSTR- versus GNSS-derived IWV values (Station CDN0) during the (a) Sentinel-3A (night pass) and (b) Sentinel-3B (daylight pass) transponder calibrations at the CDN1 Cal/Val site in Crete.
Remotesensing 17 02779 g010
Figure 11. Scatterplot of concurrent TROPOMI- versus GNSS-derived IWV values during multi-mission transponder calibrations at the CDN1 Cal/Val site between May 2018 and May 2024.
Remotesensing 17 02779 g011
Figure 12. Scatterplots of concurrent hourly wet troposphere delays derived using CDN0 (a) and CDN2 (b) GNSS stations’ observations and MWR measurements.
Remotesensing 17 02779 g012
Figure 13. Scatterplot of concurrent values of the total troposphere delays from ECMWF versus GNSS during Sentinel-6 MF transponder calibrations at the CDN1 Cal/Val site in the period of December 2020–July 2024.
Remotesensing 17 02779 g013
Table 1. GNSS observations and associated meteorological records for the present investigation at the transponder Cal/Val sites.
GNSS Station IDLatitude Longitude Time Span (Years)
Crete: “CDN1” Transponder Cal/Val
CDN035°20′16.0236″ N23°46′46.855153″ E30 August 2014–25 May 2025
CDN235°20′16.2903″ N23°46′46.829304″ E27 May 2016–25 May 2025
Gavdos: “GVD1” Transponder Cal/Val
GVD034°50′18.5775″ N24°06′31.9084″ E15 January 2003–25 May 2025
GVD234°50′18.5775″ N24°06′31.3900″ E9 October 2021–25 May 2025
Table 2. Statistical and regression parameters for the intercomparison of IWV values derived by OLCI, SLSTR, and TROPOMI satellite sensors and concurrent GNSS-derived IWV products.
Altimetry MissionS3A D335S3B D335S3A A14S3B D335Multi-Mission
Satellite InstrumentOLCIOLCISLSTRSLSTRTROPOMI
GNSS StationGVD0 (Gavdos)CDN0 (Crete)CDN0 (Crete)CDN0 (Crete)CDN0 (Crete)
Sample SizeN = 31N = 46N = 22N = 34N = 432
Bias −0.64 kg/m20.14 kg/m2−1.01 kg/m2−2.78 kg/m2−0.76 kg/m2
Standard Deviation±1.79 kg/m2±1.19 kg/m2±3.02 kg/m2±6.19 kg/m2±4.66 kg/m2
Regression Fit Slope 1.031.030.640.440.85
Regression Fit Offset0.22−0.364.939.102.40
Pearson Coefficient0.94950.96580.81010.63740.631
Table 3. Concurrent radiometer and GNSS IWV values during transponder calibrations at CDN1 in the period of July–Sept 2020.
DateSatellite AltimeterRadiometer [kg/m2]CDN0 GNSS [kg/m2]IWV Difference [kg/m2]
02-July-2020Sentinel-3B11.0014.86−3.86
02-July-2020Jason-36.949.94−1.00
12-July-2020Jason-35.907.54−1.64
22-July-2020Jason-34.429.17−4.75
23-July-2020Sentinel-3A7.809.54−1.74
29-July-2020Sentinel-3B10.0211.01−0.99
01-August-2020Jason-310.7912.62−1.83
19-August-2020Sentinel-3A12.9115.34−2.43
09-September-2020Jason-310.1414.75−4.61
Disclaimer/Publisher’s Note: The statements, opinions and data contained in all publications are solely those of the individual author(s) and contributor(s) and not of MDPI and/or the editor(s). MDPI and/or the editor(s) disclaim responsibility for any injury to people or property resulting from any ideas, methods, instructions or products referred to in the content.