Abstract
The extreme conditions of polar and mountain regions foster uniquely adapted wildlife. Given that climate shifts are more extreme in those regions, monitoring animal species is essential for effective conservation measures. Earth observation data offer considerable advantages in areas that are difficult to reach using traditional ground-based methods. This systematic review, based on 145 SCI-journal publications between 2000 and 2024, examines how Earth observation is used in wildlife ecology research in these regions. We give an extensive overview of the Earth observation sensors used, spatial and temporal resolution of studies, studied animal species, methods used, amount of aerial imagery linked to satellite-based Earth observation, and research objectives. Bird (52 studies) and ungulate (38 studies) species are primarily investigated in relation to animal monitoring, distribution and foraging behavior. Products of Landsat (63 studies) and MODIS (52 studies) are used in most reviewed studies, but the potential of freely available, higher spatial and temporal resolution data like Sentinel-2 (seven studies), as well as AI methods are not yet fully utilized. Linking Earth observation data in polar and mountain regions to wildlife ecology research should be facilitated by encouraging interdisciplinary working groups. Two major crises can be tackled at once, climate change and biodiversity loss.
1. Introduction
Polar and mountain regions are particularly influenced by the effects of climate change. In these regions the temperature increases up to three times faster compared to the global mean [1,2,3]. In addition to the effects of climate change, the unique biodiversity of polar and mountain regions is impacted by increasing human activities [2]. Animal species adapt to change but struggle to keep pace with the rapid and accelerating rate of global warming [4,5,6,7,8]. Monitoring these areas is therefore critical, but polar and mountain regions are difficult to access throughout the entire year due to their remoteness, complex terrain, and extreme weather conditions. In such cases when in situ data collection is limited, Earth observation (EO) methods can be particularly valuable by providing remote insights into land surface dynamics [2,9,10]. Interdisciplinary research that applies EO for wildlife ecology plays a substantial role in understanding ongoing environmental change and informing conservation and adaptation measures [11,12,13]. Therefore, a precise state-of-the-art analysis of EO applications in wildlife ecology research in polar and mountain regions is needed.
1.1. Relevance of Wildlife Ecology Research in Polar and Mountain Regions
Polar and mountain regions are particularly demanding to their living inhabitants due to extreme temperatures, light conditions and complex terrain. These challenging conditions have created a hotspot of specialized and unique biodiversity. Species that adapted over millions of years to survive in these conditions now experience rapid changes of the so-called Anthropocene, a geologic era characterized by major impacts of anthropogenic disturbance on natural habitats [9,14,15,16,17,18]. Sea ice formation is changing rapidly. As a result, the artic archipelago could be ice-free by summer 2030 [3]. Every year, snowfall starts later, snow-melt begins earlier, permafrost increasingly thaws, and vegetation phenology shifts [19]. Mountain regions warm two–three times faster than the global mean [1]. These changes may be occurring too rapidly for many species, bringing them to the edge of extinction [2,8].
Monitoring wildlife ecology is critical for preserving biodiversity [20,21,22,23,24,25,26,27,28,29]. For example, penguin species react to changing ice conditions because ice conditions have a significant influence on krill occurrence, their main food resource. This in turn impacts the fishing industry [30,31,32,33,34]. Agricultural farmland in the subpolar part of the Northern Hemisphere is influenced by changing stop-over sites of migratory geese [35,36,37]. Human–wildlife conflicts increase when polar bears move south in search for food because they lose their hunting areas as sea-ice retreats in summer [38,39,40,41]. Therefore, monitoring wildlife provides information about ongoing changes that impact wildlife as well as human societies.
1.2. Relevance of EO for Wildlife Ecology Research
EO methods enable remote and constant monitoring of wide areas that are not easy to access. Polar and mountain regions are often difficult and even dangerous to reach throughout the whole year. Furthermore, open-source software solutions and freely available satellite data enable easy access to a wide variety of EO products [42,43,44,45].
EO datasets can provide important data for wildlife ecology research in topics such as animal behavior, species distribution and animal movement. However, wildlife can also complement EO-derived insights. Animals can be indicators and can carry sensors themselves [11,12,13,46]. GPS transmitters fixed on animals can provide geographical positions as well as data concerning the surrounding environment. For example, bird-attached sensors measure temperatures when circling in thermal updrafts to gain height while crossing mountains [47]. Penguins, seals, and whales are equipped with sensors that collect data concerning the salinity of water, sea temperature and chlorophyll concentration [48,49]. Therefore, animal-borne sensor data can bolster EO data, e.g., by land cover classifications. Storks for example use meadows for foraging, but prefer managed meadows due to easier food access, especially after mowing events. Thus, stork’s movement data can reveal land use that is not detected by EO data alone. The spectral signature of an image can be the same, but the behavior of animal reveals different land use (personal communication and [50]).
1.3. Objective and Structure of This Review
The aim of this review is to give an overview of satellite-based EO opportunities and challenges for wildlife ecology studies in terrestrial polar and mountain areas. The review is limited to the described geographical area because of the substantially higher impact of climate change compared to the global mean [3,9,14,26]. We focus on satellite-based EO data because it is long-term, large-scale and often freely available and does not need in situ data collection. For this reason, we excluded studies that collect data solely by ground-based EO (e.g., unmanned aerial vehicles (UAV)). Studies that worked with ground-based EO (UAV and aerial imagery) in addition to satellite-based EO data were included in the review. Moreover, we focus only on land surfaces and exclude studies on animals such as whales that are restricted to water environments. Studies on animals that occupy both environments, such as polar bears, penguins, walruses, and seals, are included. Figure 1 summarizes how EO data can be applied to wildlife ecology research. EO sensors collect information about the environment, for example, measuring snow cover and vegetation cover and detecting species individuals and groups [51,52,53,54,55,56].
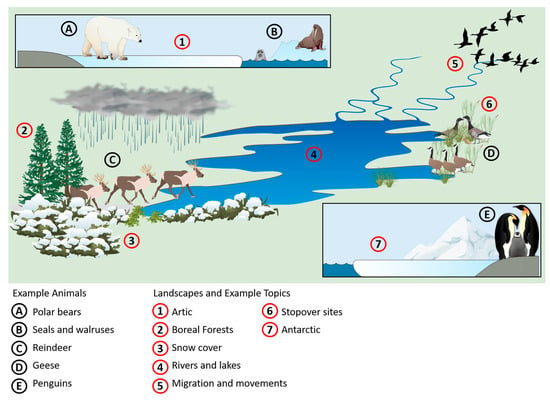
Figure 1.
Overview of example animals, landscapes, and topics that can be of interest for wildlife ecology research in polar and mountain areas.
2. Materials and Methods
We reviewed satellite-based EO applications for wildlife ecology research in polar and mountain regions. The literature review was conducted in the Web of Science database (WoS; last accessed: 6 January 2025) and follows the PRISMA guidelines, see Figure S1 [57,58]. WoS enables literature research based on keyword conditions and additional filtering. The workflow that resulted in 145 reviewed publications is outlined in Figure 2. This review method is proven common and well-accepted by Spanier and Kuenzer, Baumhoer et al., Hu et al., Koehler and Kuenzer, Schilling et al., Tsai et al. and Wenzl et al. [59,60,61,62,63,64,65]. Selected publications must address at least one keyword out of three thematic foci: animal species, geographical area, and EO sensors. Since diverse sensors can be chosen and different animal species can be studied, we defined a range of synonyms to cover the thematic foci and the region of interest. A complete overview of all thematic keywords is listed in Appendix A.
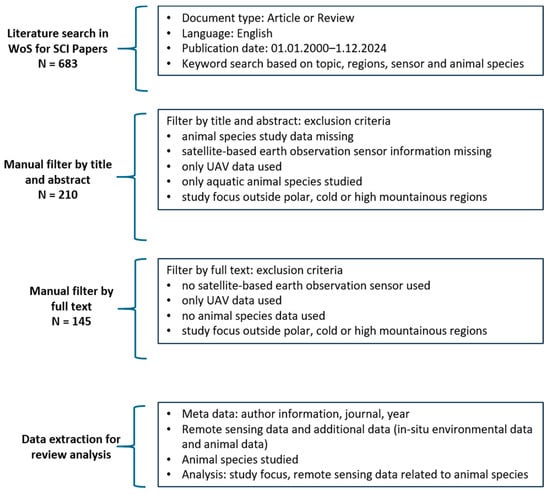
Figure 2.
Web of Science filtering process, resulting in 145 publications for review.
First, a search string for automated literature research was created using the described thematic keywords. In addition, publications were limited to English language and SCI-journal style. We also restricted our search to the years 2000–2024, focusing on the most relevant and latest studies. A preliminary glimpse into the WoS database revealed that many new relevant techniques, methods, and scientific research approaches in EO and ecology were published in that period of time. We state, therefore, that this time period is fairly inclusive of studies that are still relevant in the present. We suggest important studies published before 2000 and still relevant for the present to be mentioned in recent studies and developed further. Therefore, we do not exclude them in the set review timeframe. In addition, 2000 is the year in which data from the Moderate Resolution Imaging Spectroradiometer (MODIS) sensor became available, representing a substantial change in EO data availability. The described automatic search steps returned more than 3000 publications. Therefore, we added another filtering step by using the “Web of Science Category” search. “Ecology” and “Remote Sensing” were chosen as categories to filter publications by disciplines related to our research question. These categories were validated by manually checking the abstracts after the selection of different Web of Science Categories. The automatic literature search in WoS resulted in 683 publications.
Furthermore, we filtered all 683 publications manually by reading through paper abstracts. Animal ecology related keywords such as ‘polar bear’ can appear in an abstract because of a study’s relevance to that species without being study subjects. Therefore, we excluded publications that did not focus on the interdisciplinarity between EO and wildlife ecology research and only mentioned specific species for topic relevance in their abstracts. The same ambiguity can appear for some satellite sensors. “Planet”, for example, is the name of a company which provides high-resolution EO data, but the word can also refer to astronomical objects. These latter publications were therefore excluded. This first manual filtering resulted in 210 publications for review. Full text reads of these papers revealed that some studies were missing information about sensor or animal species data, investigated areas outside polar and mountain areas, or collected data only by ground-based EO [54,66,67]. These studies were excluded from this review, resulting in a total of 145 publications. The manual screening process was conducted by one author (H.W.). Ambiguous studies were discussed with the co-author (A.D.) to ensure the fewest mistaken exclusions.
In the following review, we manually analyzed: the number of publications over time, first author country affiliation, spatial coverage, spatial resolution of EO data, studied species, EO sensors and sensor types, temporal resolutions of EO data and general methods used in all reviewed studies. In addition, we analyzed how often ground-based unmanned aerial vehicle and aerial photography data are added to satellite-based EO data, research objectives generally and split by main animal groups and in which way the impact of environmental change, including climate change, is mentioned.
Results of metrics such as animal species studies, spatial resolution, and sensors can result in more than the total amount of selected publications (n = 145), because some studies investigate more than one animal species or use more than one EO sensor. Animal species were further grouped into main categories. The spatial resolution of used sensors was grouped in categories aligning with the spatial ranges of main satellite sensors: ≤5 m, 5 m to ≤20 m, 20 m to ≤30 m, 30 m to ≤250 m, and >250 m. The methodological and thematic part of this review is based on the main research objectives and environmental data, identified after reading through all 145 publications and is organized as follows:
- Method groups: landcover classification, habitat modelling, correlation analysis, change detection, manual animal detection, movement analysis, automated animal detection, trend analysis and object-based image-analysis.
- Research objective groups: distribution, foraging, landcover change, reproduction, movement and insect outbreak.
- Environmental data groups: vegetation cover, snow cover, ice cover, single animals, guano, forest, land cover and land use, and multi-environmental data studies.
3. Results
3.1. Quantitative Analysis of Publication Meta Data
3.1.1. Development of Research Interest over Time
Figure 3 shows the number of publications increasing until 2016 and stabilizing afterwards. Beginning in 2000, only one article was published. Between 2016 and 2021, numbers increased to 11 published articles per year on average. The number of publications declined notably in 2022 and 2023. However, from 2023 to 2024 an increase is seen again. The number of publications per year is categorized by the use of multiple sensors or a single sensor in each study. We define multi-sensor use by more than one satellite sensor used for the analysis, independent of sensor types. As the total number of publications grows, so does the proportion of studies that use more than one sensor, although there is no significant trend in either of the categories. Overall, the interest in interdisciplinary research of EO applications for wildlife ecology in polar and mountain regions increases over time.
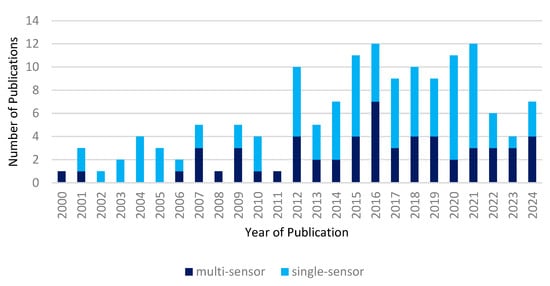
Figure 3.
Increasing number of publications stacked by use of multiple satellite sensors or a single sensor. Each individual sensor is counted as unique even if sensors are of the same type.
3.1.2. Spatial Analysis of First Author Countries
First author country affiliation for publications in this review (Figure 4) is dominated by countries of the Northern Hemisphere, particularly the USA (n = 48) and Canada (n = 37). No first author affiliations were identified from South American countries. In Europe, (Figure 4, inset) most of the first authors (n = 8) are located in France. Polar and mountain areas are of interest for France not only because of the European Alps but also because of overseas regions like Crozet Islands in the Southern Ocean. Norway (n = 7) and Finland (n = 6) contribute a comparable number. These two countries belong to an area of wide boreal forests. Similar to France, polar regions are important to the United Kingdom (UK) (n = 7) because of overseas territories. Territories such as the South Georgia Islands in the southern Atlantic Ocean are still part of the UK. Additionally, the UK claims sovereignties of the Antarctic Continent since 1908. First author country affiliations located in the Southern Hemisphere are solely represented by New Zealand (n = 3) and Australia (n = 2).
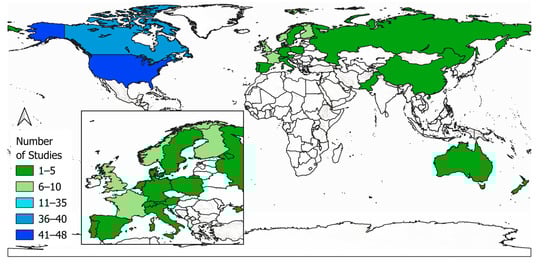
Figure 4.
Spatial distribution of first author affiliation by countries worldwide, including a closer look to Europe (inset map, bottom-left).
3.2. Spatial Analysis of Studied Countries and Study Locations
Figure 5 displays the spatial distribution of studied areas on country level. Canada (n = 43) and Antarctica (n = 40) make up roughly a third of all publications, followed by the USA (n = 19), Norway (n = 16) and Russia (n = 12). Finland (n = 6), Sweden (n = 5) and Greenland (n = 4) are studied in only a small number of publications. High elevation mountain areas are represented by single studies in Georgia, Pakistan, Italy and Spain [68]. No publications investigated high elevation mountain areas in South America and Africa such as Patagonia and the Atlas Mountains.
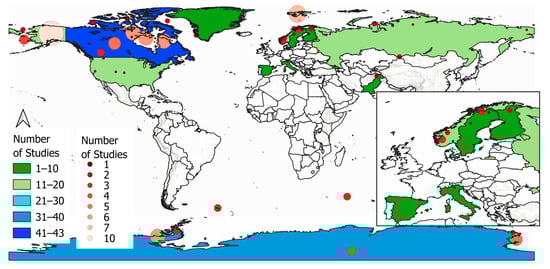
Figure 5.
Spatial distribution of study areas by countries worldwide, including a closer look at Europe (inset, bottom-right) and number of studies by study location.
Figure 5 additionally displays the actual location of the study areas within the study countries. Larger and brighter circles represent greater numbers of studies in that specific location. Concrete study area size information is missing in most of the studies. Therefore, a comparison of the actual study area size was not possible. Nevertheless, inside Canada, most of the studies are located in the north-western part of Nunavut and particularly the Hudson Bay. In the Antarctic, most of the studies are located either at the Ross sea or the Antarctic peninsula. In the Southern Ocean, Crozet Island (n = 3) and the South Georgia islands (n = 2) are investigated. Nearly all of the studies in the USA occurred in the state of Alaska (n = 9). Most of the studies in European countries are located on the Norwegian island Svalbard (n = 7). Studies in countries in relatively warm climatic zones like Italy, Spain, and Georgia occurred in countries′ mountain regions (the Alps, the Pyrenees, and the Caucasus Mountains, respectively). Two studies in Pakistan occurred in the Himalayan mountains.
3.3. Studied Animal Species
Publications using EO data for wildlife ecology research in polar and mountain regions mostly investigate bird (52 studies) and ungulate (38 studies) species (Figure 6). Less frequently studied were seals (16 studies), multiple species in one study (11 studies), insects (10 studies) and polar bears (8 studies). Five or fewer studies per animal investigated walruses, wolves, snow leopards and bats. We further analyzed specific species of the two main animal groups, birds and ungulates, represented in the purple pie chart for bird species and the green pie chart for ungulate species. Of all studies on birds, 25 studies focused on penguin species [52,54,55,69,70] and 12 studies focused on geese [35,37,71,72]. Of all studies addressing ungulate species, 29 studies address reindeers [21,24,73,74,75,76], 4 studies investigate moose [77,78,79,80,81], 4 studies focus on dall sheep [82,83,84] and only a single study each focuses on musk oxen and chamois, respectively [85,86]. Multi-species studies primarily investigate species interactions between prey and predator behavior, movement, and habitat use comparisons of reindeer, wolves and moose. Whale studies are excluded, because we solely focus on animal species that are related to land surface dynamics.
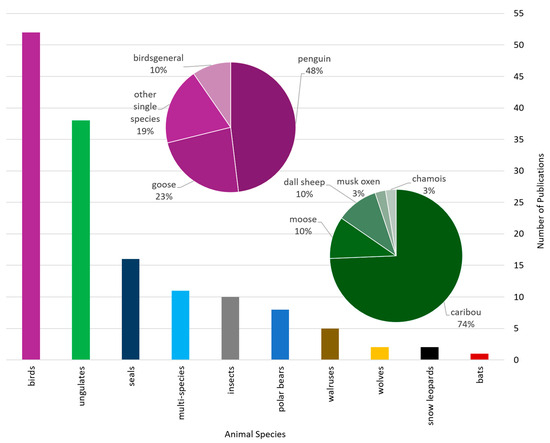
Figure 6.
Studied species in all reviewed articles, grouped by main animal groups. Pie charts display more specific distributions of the two most frequent animal groups: birds (purple) and ungulates (green).
Research interest tends to favor large animal species. Smaller species, e.g., polar foxes, snow rabbits, mice moving underneath snow-covered fields, were not investigated in any of the reviewed studies. Because we focus on satellite-based EO applications for wildlife ecology research from a more technical, EO data perspective, we cannot state if the animal species investigated are well-enough representative for polar and cold regions. We expected large charismatic species like polar bears, snow leopards, and chamois to have a higher research interest however this was not the case in this review. Especially in the case of chamois, which have a particularly large range and inhabit several mountain ranges.
3.4. Satellite Based EO Sensors and Sensor Types
A wide range of EO sensors were used in the reviewed publications (Figure 7), with optical/multispectral (passive) and radar sensors (active) being the most frequently used. Of all, 125 studies used passively sensed EO data. Actively sensed EO data were used in 14 studies (Figure 8, pie chart) [83,84,87,88,89,90], six studies used passive data combined with active satellite data [91,92], while five studies used additional thermal sensors of AVHRR, Landsat or MODIS [93,94]. Ten studies used imagery of AVHRR that also has a thermal band spectrum, but no hyperspectral sensors were used [95]. Landsat and MODIS sensor data are used by 63 and 52 studies, respectively [85,96,97,98]. These sensors are followed by high-resolution data of commercial satellite sensors (23 studies). Worldview, Rapid Eye, Planet Scope, SPOT, and GeoEye are regularly used. In comparison, relatively new sensors, without any limitations in data access and short revisiting times, are used less frequently. Sentinel-2 and Sentinel-1 were used in only seven studies [49,99,100] and four studies [101,102], respectively. Studies using passive and active data combined mainly investigated snow cover and sea ice in relation to animals’ habitats, foraging areas and movement. Gautier et al. analyzed the change in caribou movements across inland water bodies due to changing ice conditions [103]. Jensen et al. investigated the influence of changing snow cover on geese breeding success and population development [104].
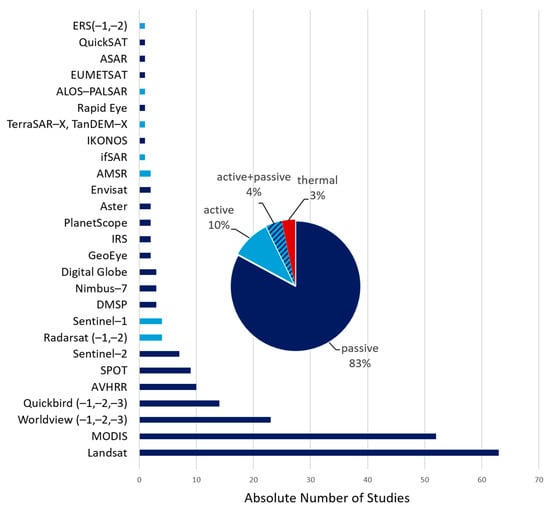
Figure 7.
Overview of different satellite-based EO sensors used in all reviewed studies and the relative distribution of sensor types.
3.5. Spatial Scale
Figure 8 displays the spatial resolution chosen from different sensors in each study, split by main animal species groups. The information about the spatial scale was taken directly from the publications text. This is of importance, because the spatial resolution differs between different wavelength bands of each sensor. Of all reviewed studies, 51 studies used EO data at a spatial resolution between 20 m and 30 m. This aligns to the spectrum of NASA’s Landsat and the European Space Agency’s Sentinel satellites. Sentinel’s wavelength bands range between 10 m–60 m spatial resolution. Landsat’s wavelength bands range between 15 m–100 m resolution. The most commonly used are at 10 m–20 m spatial resolution for Sentinel and 30 m spatial resolution for Landsat [71,72,73,74,105]. Lower spatial resolution between 30 m–250 m was used in 39 studies [23,28,40,106,107]. This spatial resolution aligns again with Landsat and the highest spatial resolution of MODIS, a NASA sensor on the Terra and Aqua satellites in orbit since 2000 that collects data at high temporal but low spatial resolution. The spatial resolution of MODIS ranges between 250–1000 m. The most commonly used in analysis-ready products are at 250 m–500 m spatial resolution, visible in 29 studies with a spatial scale of >250 m and MODIS as one of the most used sensors (Figure 7). A spatial resolution between 5 m and 20 m was chosen in 10 studies. Sentinel-1 and Sentinel-2 sensors do also provide data in a spatial resolution of 10 m. A spatial resolution of even less than 5 m was chosen in 25 studies. Satellites like Quickbird and Worldview qualify in this range category [85,108,109,110,111]. Of all reviewed studies, 12 studies did not give any information about the spatial resolution used. Those are shown as “NA” in Figure 8.
In addition to the spatial resolution, Figure 8 displays the distribution of main animal species groups within the spatial scale that was used in all studies. The two main animal species groups of birds and ungulates do not dominate every spatial resolution group. The group of very high-resolution sensors is mostly used in bird studies, followed by seals. This relates to automated animal detection studies of penguin colonies in the Antarctic, bird breeding colonies and seals resting [33,112,113]. Birds and insects dominate spatial scales between 5 m–20 m. Lower spatial resolutions are dominated by the two main animal species groups of birds and ungulates. A spatial resolution between 20–30 m was most commonly used when working with ungulate data. This corresponds to the spatial range of Landsat sensors and relates to the large number of vegetation and landcover change studies (see review on study topics in Section 3.9) connected to ungulate movements [88,106,109,110]. Interestingly, when studying polar bears most of the time a spatial resolution of more than 250 m was used, corresponding to MODIS sensors.

Figure 8.
Spatial resolution of all reviewed studies split by animal species groups.
Figure 8.
Spatial resolution of all reviewed studies split by animal species groups.

3.6. Temporal Resolutions of EO Data
Wildlife ecology research requires spatial and temporal resolution that match the needs of research questions. When monitoring scenarios of the influence of landcover change on wildlife ecology [24,40,75,106,107], it is important to have recent data concerning the environment on a regular basis. Single timestep studies such as the impact of a single rain event on reindeer movement ability in Scandinavian forests for example do not need high temporal resolution data [24]. All studies were sorted by the following temporal categories: multi-temporal (several timesteps, but irregular), time series (several timesteps, regular), multi-annual (several timesteps in one year, but irregular) and mono-temporal (one timestep). Of all studies, 66 were multi-temporal, 51 were time series, 14 were multi-annual, and 13 were mono-temporal (Figure 9). Figure 9 also displays the length of the reviewed studies in years related to the publication year. Although, more EO data are accessible and sensor operation time increases, there is no increase in study length for studies that used multi-temporal, multi-annual or time series resolution visible. The mean study length is between 8–10 years.
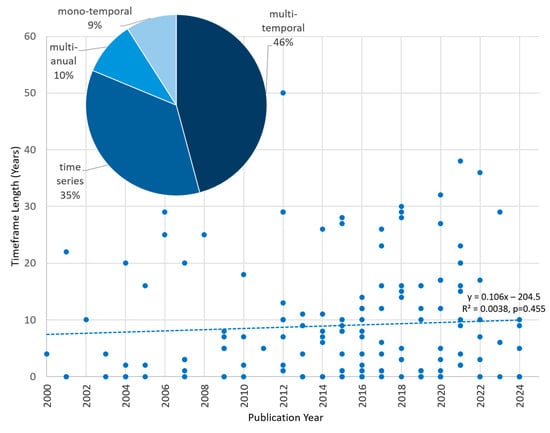
Figure 9.
Relative distribution of different temporal resolutions of all studies (pie chart) and linear trend of study length over time.
3.7. Methods Used
We investigated the main satellite-based EO methods for analysing wildlife ecology in terrestrial polar and mountain regions (Figure 10). Generally, animal species are rather difficult to monitor, because they move in space and time. Furthermore, in situ animal population counts are more difficult in polar and mountain regions. Animal species differ in size between some meters (polar bears and seals) to centimeters (small bird species and rodents). The appearance of a single animal has to match spatial and temporal scale of EO satellite sensors to be detectable. More animal species occurring in groups, for example breeding penguin colonies, increase the chance of detection via satellite imagery. Single species detection, single individuals or population groups, was a method used in 26 of all studies. Manual animal detection was used in 15 studies and automated animal detection was used in 11 studies. Still, even penguin colonies bigger than 10 m in size, could be seen in Sentinel imagery, yet this was not a common method. The first study of manual animal detection since 2000 was conducted in 2011 [56,114,115,116]. From then this method is used regularly but not increasingly. The first study of automated animal detection since 2000 was conducted in 2007. Again, since then, the method is used regularly, but not increasingly [112,113].
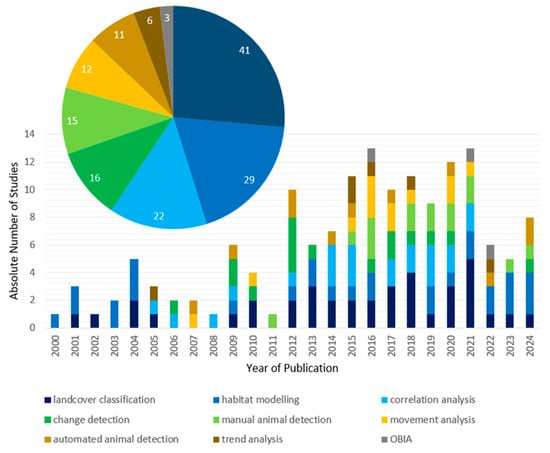
Figure 10.
Main methods used in all reviewed studies between 2000 and 2024 and absolute number of main methods used (pie chart).
Often satellite-based EO data are used indirectly to determine animal occurrence. Landcover classification methods were conducted in 41 studies and across the entire timeframe of the review between 2000 and 2024. Landcover classifications relate to wildlife ecology in terrestrial polar and mountain regions when for example animal breeding and foraging habitats are investigated. The most commonly used landcover classification methods are traditional supervised maximum likelihood classifications and well-established machine learning methods. Shen et al. and Romàn et al. compared random forest, support vector machines and neural network models for detection of penguin colonies in Landsat and Sentinel imagery. In the first study neural networks and in the second support vector machines achieved the highest model accuracy [100,117]. Similar statistical methods are conducted for habitat modelling, beside general additive models and resource selection functions. Santora et al. for example used general additive models for a geographic structuring of penguin colonies across the whole Artic [118]. Gagne et al. investigated habitat interactions between caribous, moose and wolves by resource selection functions. Many habitat modelling methods relied on animal GPS occurrence data in addition to satellite imagery [82]. Habitat modelling methods specifically appear less frequently, in 29 studies for the entire study period [119,120,121].
Correlation analysis methods (22 studies) and change detection methods (16 studies) are used starting from 2005 and 2006 respectively. Correlation analysis methods relate for example to the dependence of geese breeding phenology and reindeer calving phenology to vegetation changes that are employed in change detection analyses [93,104,122].
Animals are more difficult to investigate because of their movement behavior, but methods have been developed to address that behavior and its responses to environmental changes, specifically. Of all review studies, 12 conduct movement analysis methods, for example reindeer movement behavior reactions to fire events or polar bear movements in relation to sea ice patterns [75,85,123,124].
Trend analysis methods and object-based image analysis (OBIA) methods are only conducted in six and three studies, respectively. Trend analysis could also be grouped with change detection, but in these cases the focus was clearly on trends and single changes which can occur without any clear trends. Trend analysis methods were used to uncover the influence of vegetation changes on reindeer and geese [125,126]. The first trend analysis study was published in 2006, followed by single studies in 2015, 2016, 2019 and 2022. OBIA can be used for automated animal detection, because it can identify specific objects in single images. Nevertheless, in the reviewed studies the focus was on detection of ice landscapes and penguin guano and therefore considered separately. These studies were published only recently in 2016, 2021 and 2022 [52,127,128].
3.8. Use of UAV Data in Addition to Satellite-Based EO Data
The main goal of this review was to analyse studies that investigate wildlife ecology in terrestrial polar and mountain regions by satellite-based EO. In addition to satellite-based EO data, 15 studies utilized aerial photographs (AP) and 8 studies added UAV imagery. Figure 11 shows the development of satellite-based, UAV, and AP (in combination with satellite-based EO data) in wildlife ecology research in terrestrial polar and mountain regions between 2000 and 2024. While the solely use of satellite-based EO is increasing, the use of UAV and AP in addition to satellite imagery was constant over time.
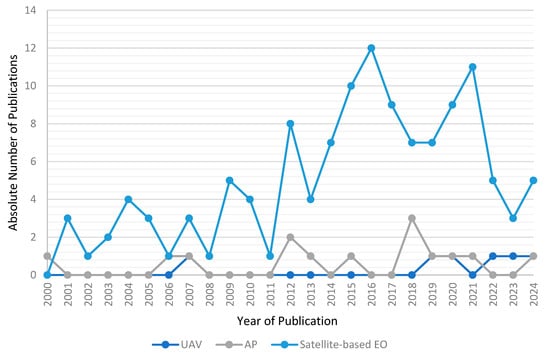
Figure 11.
Development of studies that solely use satellite-based EO data, UAV and satellite-based EO data, and AP and satellite-based EO data.
Regarding animal species groups (Figure 12), UAV and AP data supplemented bird and ungulate species studies, followed by studies investigating seals (UAV and AP), walruses (UAV), multi-species (UAV) and polar bears (AP). Regarding bird species, studies use UAV and AP data in addition to satellite imagery for single species detections [102,129]. Single species detections in UAV and AP data can be upscaled to satellite imagery and used for population density calculations. Similar studies are conducted for seals and walruses [51,130]. For ungulate and multi-species studies for example, UAV and AP data was additionally used to verify habitat variables that were generated by Landsat satellite imagery. Similar to ungulate species studies, a polar bear habitat study was verified using AP data taken during flight campaigns [119,131].
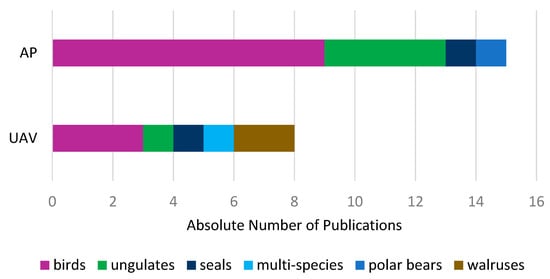
Figure 12.
Additional UAV and AP data split by animal species groups.
UAV and AP data are helpful to upscale animal species information that cannot be collected by satellite-based EO sensors, for example when spatial and temporal resolutions are too coarse and for analysis validations. Interestingly, the use of that data does not increase. That could be related to high-resolution satellite-based EO data, becoming available out of costs. Also, during the Covid pandemic, it was not possible to conduct field work. But that only refers to the last five years. Stationary climate and weather data can also be added to satellite imagery. Data from GPS loggers attached to individual animals were analysed in relation to satellite imagery for habitat analysis and movement behavior in 29 studies [13,28,106,132].
3.9. Thematic Review of Study Foci
3.9.1. General Thematic Review of Study Foci
Finally, we analyzed the thematic context and relevance of studies. First, all studies were grouped by journal topic. Seventy-seven percent of all articles were published in journals focusing on ecology. Roughly a quarter (23%) were published in EO-specific journals. A list of all journals can be found in Appendix A, Figure A1. “Remote Sensing of the Environment” and “Remote Sensing” are the most frequent EO journals (17 and 9 articles, respectively). Within ecology journals, “Polar Biology” and “Marine Ecology Progress Series” published 20 and 12 articles each. Apart from “Global Change Biology” (6 articles), all other journals generally published one to two articles each.
Figure 13 displays main research topics (left nodes) in relation to main animal species groups (right node). Sankey charts support complex connections between different foci. Species investigated only by a single study are combined in one group called “other-species”. Studies that investigated multiple species and their interactions are summarized in a group called “multi-species.” Species distribution studies, the most common focus in this review, are dominated by birds, seals and walruses, followed by ungulates and multi-species studies. Studies investigating ungulates and their ecology mostly emphasize their foraging behavior and the influence of landcover change [108,109,119,133]. Nearly all studies describing insect species discuss insect outbreaks [95,134,135]. Land cover change studies focus mostly on birds and ungulates as well as on polar bears, multi-species, insect, and other-species to a small degree [29,107,136,137]. Reproduction studies focus in the majority on birds but one study each focused on ungulates, seals and walruses, polar bears and other species [129,138,139,140]. Movement studies are conducted mostly for ungulate species although they occur for birds, polar bears, and seals and walruses [92,132,141].
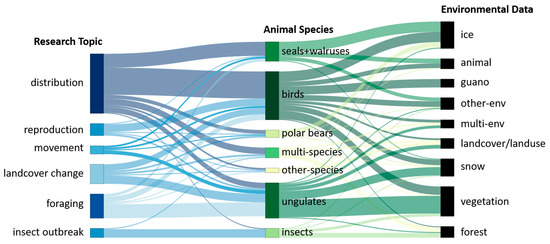
Figure 13.
Sankey chart of main topics (left) and data concerning the environment collected (right), both split by main animal species groups (center).
The right-most node in Figure 13 displays which environmental data were collected in relation to studied animal species. Studies that collected multiple types of environmental data are combined in the group “multi-env.” Types of environmental data that were collected only one to three times are combined in the group of “other-env”. “Animal” is added as category due to studies that solely focus on the detection of individual animals without any other environmental data. “Forest” is shown separately from “vegetation”. “Vegetation” summarizes meadows, fields and grassland, and other types of vegetation that is not related to forests. This ensures a clearer differentiation in the use of “forest” and other “vegetation” that are used mainly by different animal groups. The figure reveals that most studies that investigate ungulates collect data concerning vegetation, not forested areas, and snow. For studies on bird species, a variety of environmental data were used, including snow, ice, and vegetation. Studies on birds use data on guano, bird fecal deposit, more frequently than forest data [35,142,143,144,145]. Insect studies mostly used forest data followed by vegetation data, and only single studies each used snow and “other-env” data. Studies focusing on the ecology of polar bears and seals and walruses mainly used ice data. Seals and walruses additionally used animal and “others-env” data. Multi-species studies used diverse environmental information including vegetation, snow, ice, land cover, guano, forest and animal data.
3.9.2. Sensor and Sensor Type Specific Review of Study Foci
Figure 14 displays the satellite sensors used for the collection of different environmental datasets. High-resolution satellites, Quickbird, SPOT and Worldview, are more often chosen for the detection of guano and individual animals [51,52,142]. Landsat and MODIS, the sensors used for more than half of all studies, were used to collect nearly every type of environmental data. Snow and ice data are more often collected by MODIS (24 studies). In contrast, vegetation and land cover/land use data are mostly collected by Landsat sensors (27 studies), despite MODIS also providing ready-to-use vegetation index datasets [97,146]. Satellite sensors used in less than three studies are grouped as “other-sensors.” Some active sensors are grouped in “other-sensors” and seem to be more relevant for icescapes [147]. Data concerning forests are collected by both Landsat and MODIS in most cases. Generally, environmental datasets can be recorded by different satellite sensors and there seems to be no sensors that are used for only one specific variable. Sensors in higher spatial and temporal resolution (e.g., Sentinel-2) collect five out of nine datasets important to wildlife ecology research, but they are not yet used as often as Landsat and MODIS.
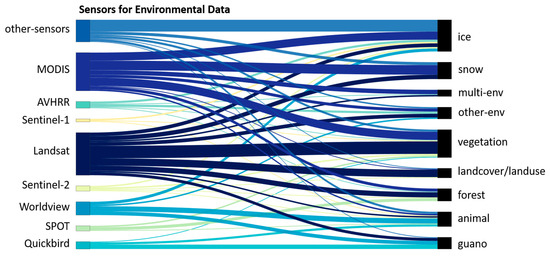
Figure 14.
Sankey chart of satellite sensors and data concerning the environment they collect.
In addition to Figure 14, Figure 15 shows which sensor type was used to retrieve information about types of environment. Information about the environment is summarized the same way as in Figure 14. Sensor types are split by passive (multispectral and thermal), active (SAR), active combined with passive. As mentioned in Section 3.4 in all reviewed studies, hyperspectral sensors were not used. Multispectral EO data are used to generate all types of environmental information, mostly to get information on vegetation. However, vegetation is generally the most required environmental information. In contrast, SAR data are only used to gain insight about vegetation cover (active combined with passive), other-env, snow and mostly ice. In 16 studies and 3 studies (active combined with passive) information about ice cover is generated by SAR sensors. Henderson et al. for example investigated sea ice cover in relation to polar bear movements while hunting [141] and Massom et al. mapped interannual variability of fast ice and related consequences for emperor penguins [93]. Thermal sensors are used in 6 studies of 145 reviewed studies. One each to gain additional information on forest, vegetation, other-env and two related to ice. Labrousse et al. showed the effect of landfast ice on breeding success of emperor penguins. They mapped areas of landfast ice by visible and thermal infrared AVHRR bands. Kharuk et al. mapped insect outbreaks in boreal forests with support of the AVHRR thermal infrared bands and Kennedy et al. classified landcover change in ungulate species habitats by visible and thermal infrared Landsat bands. MODIS thermal infrared bands were used together with seal-borne sensors by Savidge to map polynya structure at the Pine Island glacier [94,107,145].
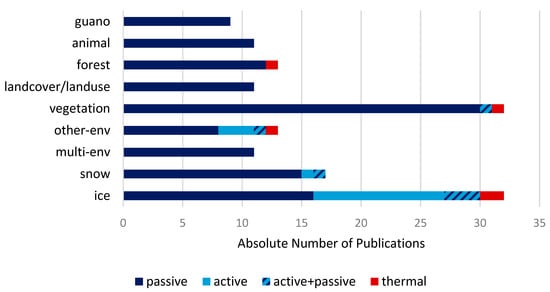
Figure 15.
Satellite sensor type (passive, active, active + passive and thermal) used to obtain environmental data.
3.9.3. Animal Specific Review of Study Foci
The main focus of bird studies (Figure 16) is distribution (54%), specifically connected to guano, snow and ice and animals. For example, Le et al. set up a convolutional neural network to automatically detect penguin colonies in the Antarctic using high-resolution Worldview and Quickbird imagery. Specifically, they classified the unique-colored guano stain and fecal deposits of seabirds [112]. However, even lower spatial resolution can successfully detect penguin colonies using guano stains, as demonstrated by Fretwell et al. 2015 [143]. They compared freely accessible Landsat data to in situ spectrometer measurements and were able to tie field data to satellite-based EO data [142,148]. Another method for detecting birds without any other environmental data like guano is through manual counts in single satellite images [149,150]. In these studies, high-resolution imagery of Quickbird, SPOT and GeoEye were used. They were able to generate absolute colony numbers, particularly important because large movements can occur between colonies [150,151]. Data concerning the environment like snow and ice, vegetation, and land cover are used for habitat mapping in various studies for multiple types of birds. Vegetation data were also used, although less often than other data types, to study distribution of birds. Ktitorov et al. investigated passerine species by shrub cover classification and Normalized Difference Vegetation Index (NDVI) land cover change using Landsat data [142].
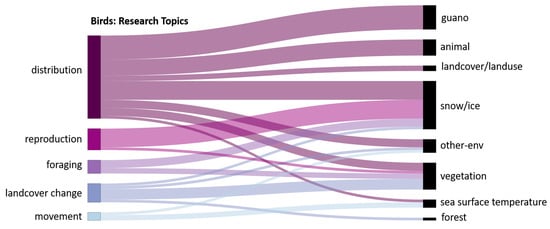
Figure 16.
Relative distribution of main topics in studies investigating bird species in relation to data collected about the environment.
Studies that focus on bird reproduction areas and needs (16% of bird studies) frequently used snow/ice data. Labrousse et al. analyzed the impacts of landfast ice changes on penguin colony breeding success by obtaining data concerning icescapes from MODIS and AVHRR [145]. Jensen et al. used MODIS and QuickSAT-generated snow cover information to understand breeding success or failure of pink-footed geese [104]. Lameris et al. investigated the effect of climate change on Barnacle goose habitat use and reproduction success in the Barents sea, Russia, by analyzing MODIS snow cover data [129]. Meyer et al. investigated breeding success of arctic sand pipers in relation to primary productivity measured by MODIS [152].
Studies focused on the influence of land cover change mostly used vegetation data. For example, Tombre et al. and Jefferies et al. studied the rising conflicts between farmers and geese that occur when overgrazing appears on geese migration stopover sites. They found that farmers are in need of developing new strategies to deter geese [36,105].
Studies on foraging behavior used data concerning snow/ice and vegetation. Hogrefe et al. calculated the NDVI from MODIS data to estimate the foraging area of lesser snow geese in the arctic coastal plains of Alaska, USA [153]. Ice cover trend analyses were conducted by Kavanaugh et al. and Gremillet et al. to collect information about changes in foraging behavior of Adélie penguins and little auks [19,105,152]. Only three studies focused on movement, e.g., ecological niche modelling of MODIS sea surface temperature data products related to albatross movement data [31,154,155,156].
Ungulate studies (Figure 17), the second biggest group of species studied in all reviewed articles, mostly used EO data concerning vegetation structures and conditions (53%). The influence of vegetation on movement and reproduction was investigated by Rickbeil et al. and Mallory et al. They use MODIS and Landsat data to calculate vegetation indices that are correlated to reindeer movements and calving phenology [96,157]. Most of the studies using vegetation data focus on ungulate distribution, foraging behavior, and influences of land cover change. Sharma et al., for example, create species distribution models based on vegetation classifications derived from high-resolution SPOT imagery to investigate seasonal changes of reindeer distributions under different climate change scenarios [23]. Macander et al. map lichen cover, the main food resource of reindeer, using Landsat imagery for habitat classification and foraging behavior [119]. Forest cover change in Landsat and SPOT images is also used to investigate foraging behavior in a study by Komers et al. [108]. Land cover classifications derived from Landsat images were used to generate habitat models for moose in Nikula et al. and Dettki et al. [77,79].
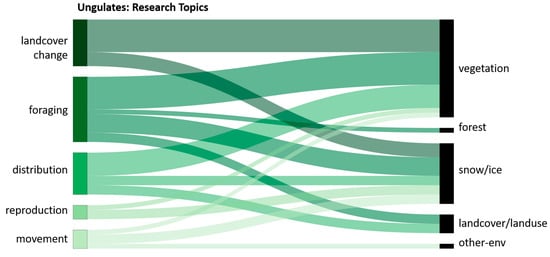
Figure 17.
Relative distribution of main topics in studies investigating ungulate species in relation to data collected concerning the environment.
Snow/ice data are used in 33% of all ungulate studies for many different foci including distribution, foraging behavior, land cover change, reproduction, and movement. All these foci are relevant to the increasingly common occurrence of rain on snow (ROS) events, mentioned by several studies. Rain that falls on snowy fields creates icy crusts that make it impossible for reindeers to reach their food sources under crusts and are dangerous to move through. The probability of crashing through those icy crusts is high, resulting in severe leg injuries or even death. Bartsch et al., for example, detect snow surface thawing and refreezing events using QuickSAT imagery [24] and Leblond et al. tie caribou GPS movement data in step selection functions to ice characteristics using MODIS products [28]. In reproduction-focused studies that use snow cover data, Mallory et al. characterize the change between vegetation and snow cover in spring phenology and its influences on successful calving seasons [157]. Earlier spring green-ups influence reindeers in reproduction success or failure, but reindeers can also have a substantial effect on slowing arctic greening. Newton et al. study those effects by correlating multi-temporal vegetation indices with aerial counts of caribou herds. Snow cover data are also important for understanding foraging area possibilities of dall sheep, as described in Verbyla et al. This study found a negative correlation between Landsat- and MODIS-derived snow cover data and dall sheep population numbers [82]. Van de Kerk et al. analyzed MODIS snow cover products in step selection functions correlated to dall sheep GPS movement data to obtain information about their ability to move through snow [83].
Seals and walruses, studied in 20 publications, are mostly investigated within the context of distribution monitoring (70%) and classification of sea ice and landfast ice, their main habitat used as, resting, so called haul-out, sites. Olsen et al., for example, not only use MODIS snow cover and sea ice products for mapping potential seal habitats, but also integrate indigenous knowledge of seal habitat characteristics into their ecological nice modelling approach [158]. Goncalves et al. developed an automated seal detection algorithm in very high-resolution Worldview imagery [33]. Seal and walrus color contracts fairly starkly against pack ice. Therefore, detecting individuals in high-resolution imagery can even be accomplished by non-scientific volunteers, supporting the development and training of automatic detection approaches [56,116,159,160]. Reproduction success and movement studies also use snow and ice data (6% of all seal/walrus studies). Jay et al., for example, investigated divergent movements of walruses to sea ice [132] and Iacozza et al. analyzed the link between snow cover on sea ice on cub survival rates [140].
When insects were studied in cold and polar regions, it was mainly correlated to insect outbreaks that have an impact on forest cover and vegetation change. Kharuk et al., Jepsen et al., and Babst et al. mapped forest degradation by classifying affected areas using vegetation indices like NDVI derived from multispectral Landsat images or ready-to-use MODIS products [134,161,162].
Polar bears, a flagship species of polar regions, are not frequently studied in reviewed publications as expected. Durner et al. and Stirling et al. investigated the movement of female polar bears and their cubs during spring [39,163]. LaRue et al. demonstrated methods for manual detection of individuals in high-resolution Worldview satellite imagery supported by UAV-generated ground truth data [164]. Rising risk of polar bear encounters to human settlements are investigated by Henderson et al. and LaRue et al. Polar bears depend on sea ice to hunt for seals, their main food source, but are increasingly forced to spend more time on land due to declining summer sea ice [141,164].
Eleven studies investigated multiple species within a single study. In some instances, this occurs because researchers consider entire habitats, which encompasses multiple animals. For example, Wing et al. examined the influence of penguin and seal feeding behavior on nutrient fluxes in the sea using MODIS products [165]. In other studies, species interactions were investigated. For example, Jean-Gagnon et al. and Bleyhl et al. studied the prey-predator relationships of moose, wolves, and reindeer in boreal forest-logging areas as well as their changes in movement patterns and habitat use [98,166]. Razenkova et al. analyzed several northern boreal forest species, like brown bear, lynx and moose, and they explained inter-species abundance patterns using MODIS vegetation and snow cover products [167].
3.10. Evaluation of the Impacts of Environmental Changes
All of the above discussed study foci can be affected by environmental changes, including climate change, which has a greater impact on polar and mountain regions [1,2]. In the following we additionally describe in more detail how environmental changes, especially climate change, are mentioned in all reviewed articles. Generally, when searching for keywords, “climate change”, “climate warming” and “change” in all titles, abstracts and publication keywords, 45, 15 and 81 studies respectively were listed. Figure 18 describes climate change related changes of the environment impacting wildlife biodiversity. Of all reviewed studies 59 do not mention any environmental change as specific impact to an investigated species. Those studies are excluded from Figure 18 (right). Figure 18 (left) shows how environmental changes have not been mentioned as influence of a study focus in roughly the first half of the review study period. In more recent years, nearly all studies have discussed environmental and climate change impacts as part of their study foci. Studies that did discuss the influence of environmental changes mostly mention the importance of population monitoring due to climate change. This is in many cases when penguin species colonies are mapped by EO satellites from space and algorithms are further developed to detect walrus and seal species. Their monitoring was only possible on site at very high costs in earlier years. In more recent years, UAV data have complemented EO satellite imagery to detect animal colonies or groups in satellite imagery alone. Even trained citizen science campaigns can help experts when searching for single walruses on haul-out in satellite imagery [56,69,160]. Changes in sea ice, especially sea ice decline, has the second highest influence on wildlife biodiversity in polar regions. Polar bears depend on sea ice for hunting seals, but summer seasons without any sea ice are getting longer. Seals struggle because sea ice decline results in a lack of haul-out areas to keep their pups. Walrus populations rely on sea ice in the same way [38,40,94,168]. Penguin colonies also suffer from declining landfast ice areas. They tend to breed close to the ice shore for foraging area access and avoid inland areas because of steep slopes. Increasing summer seasons, retreating ice shorelines, and smaller landfast ice areas decreases their breeding habitat and even results in complete breeding failure [93,139]. Ungulate species are negatively as well as positively impacted by changing environmental conditions. Caribou populations suffer from rain on snow events and earlier thawing of seas and lakes they used to move on, but might also play an important role in slowing down shrubification and arctic greening [75,85,110]. Still, caribou also have to adapt their own calving phenology to a changing vegetation phenology in the artic. Dall sheep also have to adapt to a changing vegetation phenology. These animals tend to favor earlier springs and less snow during winter times which makes it easier to move between habitats [82,89]. Insects benefit from a warming climate, but cause stress to forest ecosystems, because insect outbreaks can weaken trees, a trend which tends to increase due to climate change [95,124].
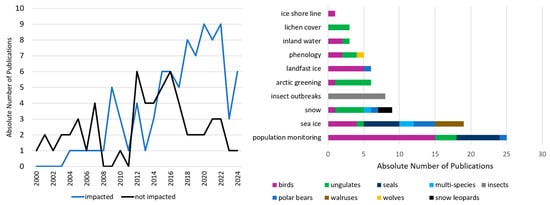
Figure 18.
Studies focusing on the impact of environmental change, including climate change or not (left) and environmental changes that influence study foci plotted by animal species groups (right).
4. Discussion
4.1. Main Findings After Reviewing 145 Studies
Generally, wildlife ecology research in polar and mountain regions demonstrates many advantages of satellite-based EO, continuously, at large scales, and without the need for being on site. In polar and mountain regions, in situ data collection incur high costs and safety risks. This systematic review summarizes studies that focus on the use of satellite-based EO data in polar and mountain regions to answer questions related to wildlife ecology research. Increasing possibilities and developments of EO methods align with an increasing number of publications until 2016. Between 2016 and 2021, the number of publications stabilized and declined in 2022, followed only by a small increase in 2024. Despite the increasing number of operational EO missions, the availability of analysis-ready products, and the overall length of available time series, the length of study periods has not increased. Similar gaps are apparent in the usage of available new sensors and higher spatial resolution of EO satellite data. MODIS and Landsat, used in the majority of studies, have been in operation for more than 20 years, and their level-2 and level-3 products are easy to access free of charge. MODIS Terra, MODIS Aqua, and Landsat were launched in 1999, 2002, and 1972, respectively. Free access to data from both platforms began in 2000 for MODIS and in 2008 for Landsat. Based on the start of freely available satellite data we set the review timeframe between 2000 and 2024. While Landsat and MODIS are used widely, newer but similarly free satellite sensors have been only minimally used. For example, the European Space Agency’s Sentinel program, operating since 2014, offers high spatial resolution (up to 10 m/pixel) and high temporal resolution (revisit time of 4–6 days), but was not frequently used. This suggests a potential knowledge gap of sensor availability and sensor specific analysis and preprocessing steps in wildlife ecology. The majority of all reviewed articles is published in ecology related journals. That states a big interest in using EO methods. It can be assumed that EO data are not used in full potential, because interdisciplinary work between ecologists and EO scientists is still not promoted enough to keep ecologists updated, at least in polar and mountain area research [12,46,169]. Possibilities of support for easier access to new EO data and information about EO data developments should be encouraged in interdisciplinary working groups. One outstanding example is the “ROOT: Real-time Earth observation of fOrest dynamics and biodiversity (ROOT)” project at the university of Wuerzburg. It is an interdisciplinary project between forest ecologists, Earth observation scientists and computer scientists [170]. More extensive exchange between wildlife ecologists and EO data scientists like the one described is needed to push studies addressing present challenges of climate change and biodiversity loss at the same time.
When investigating wildlife ecology in the vast areas of polar and mountain regions, three main objectives are the focus of all reviewed articles: monitoring animal populations by number, home ranges and habitats; measuring the influence of environmental changes on animal habitats and movements; and mapping habitats using animal-borne sensors. The last-mentioned objective collects data in addition to EO, but requires being on site at least once for animal transmitter attachment. The same refers to additional UAV data and AP data collections. Ground-based EO data are collected at very high spatial resolution, which is necessary to upscale small-scale information to satellite-based EO sensor resolutions. For example, when investigating animal colony density, UAV data collect information about the actual number of individuals that is upscaled to satellite-based EO sensors. Therefore, colony monitoring is carried out using higher temporal but lower spatial resolution data. Still, UAV data ground-truthing will be important for species density adjustments due to changes that cannot be observed from space [100,171,172]. In addition to personal risks on sites during field data collections in polar and mountain regions, disturbance of the ecosystem and animals, especially during breeding time, should be kept in mind [173,174].
EO data are collected on different spatial, temporal and spectral resolutions. In this review, snow, ice, vegetation data were most frequently applied to animal distribution studies. Freely available and commercially sold EO data provide information about the environment for such research questions. Limitations that cannot always be overcome are suitable connections between the needed and available resolutions in space and time, depending on the study question. Furthermore, passive EO data rely on clear, cloudless conditions during the daytime, all of which occur somewhat infrequently in polar and mountain regions. SAR data are independent of light and penetrates clouds, but was only utilized in 14% of all reviewed studies. Thermal infrared bands were only part of 3% of all studies, while hyperspectral sensors are not used at all. Generally, only a few studies provided information on wavelength bands utilized. This lack of information on EO metadata suggests that because most studies are published in ecology related journals, their focus is on ecology related outcomes and not on remote sensing methods.
Monitoring specific species provides insights beyond species ecology, indicating changes in their habitats, adjacent economic sectors, and human use. Penguin species, for example, are described as important indicators of climate change impacts. Their feeding behavior (primarily feeding on fish, krill, and squid) can predict effects on fishing industries [128,151]. When EO data are applied to penguin ecology, it is mostly for the detection of new colonies and the monitoring of previously identified colonies. Changes in penguin colony distributions are also clear indicators of climate change impacts, because snow and icescapes (e.g., the penguin resting and breeding sites) are affected to a great extent [55,113,114,149]. Similarly, reindeer ecology has direct effects on economics. Their survival is linked to the survival of people, especially for indigenous communities which keep traditions alive and rely on them for food and warmth. Their change in movement behavior indicates changes in plant and snow cover phenology [88,157]. Adapting to earlier spring and longer lasting autumn temperatures is challenging for raising offspring. Furthermore, ROS events threaten their ability to find food and move between habitats. Currently, EO data are mainly used to monitor changes in vegetation and snow conditions for managing and mapping wild and herded reindeer populations. Freely available satellite imagery at high temporal resolution would allow near real-time mapping of ROS events and could enhance and enable effective responses [24,88]. In summary, EO data contribute to wildlife ecology research mostly through the use of freely available datasets to measure snow, ice and vegetation data. Individual animals can be monitored by very high-resolution EO data of less than 5 m, but those datasets must be purchased.
4.2. Limitations and Benefits of Using EO for Wildlife Ecology Research
Limitations that cannot yet be overcome are costly very high spatial resolution datasets and constraints due to unsuitable weather conditions. Multispectral sensors face the additional limitation of requiring daylight for data collection. Furthermore, detectable object size and imagery costs determine the feasibility and applicability of various satellite sensors. Freely available satellite imagery is restricted to 10 m spatial resolution of Sentinel-2 [45,175,176]. In contrast, very high-resolution satellite imagery such as Worldview or Quickbird offers 2–3 m spatial resolution but must be purchased. Very high-resolution imagery allows the detection of single individuals in a penguin colony or seal haul-out [53,54]. As of today, Sentinel-2 is not suitable for counting single individuals of a population, but it is very valuable for population monitoring and detecting habitat use change. Therefore, studies are largely only limited by spatial scale if they aim to count individuals using freely available data. However, in many cases, monitoring whole populations can be achieved using coarser resolutions. These same limitations and opportunities exist for studies analyzing animal movement. In movement studies, deciding for suitable temporal resolutions is even more challenging. Animals transmitters can collect data up to several times in a second, but no satellite sensors collect data in that very high temporal resolution. It is a spatial mismatch between animal transmitters and satellite imagery that needs to be overcome.
Still, depending on the research question of each study, EO data offer the major advantages of high temporal resolution and wide coverage. Satellite imagery covers the whole planet with revisiting times as short as one day. In situ data collection in polar and mountain regions is mainly restricted by daylight and suitable weather conditions, and it incurs high costs and substantial safety risks. In contrast, EO data are generated year-round by day and night without end-user costs or scientists exposed to extreme weather conditions.
4.3. Future Perspectives
EO sensors and methods continuously develop and advance. The first Sentinel satellites from the European Copernicus program were launched in 2014 and commercial very high-resolution satellite data are partially freely available. Companies such as Planet, for example, work with big numbers of very small nanosatellites, CubeSats, in the PlanetScope constellation. Very high-resolution data can be requested under special funding conditions, and data of lower spatial resolution, but daily temporal resolution is accessible freely on Planet Labs. Although the spatial resolution of available EO satellite data increased over time, there is no visible trend yet to the use of higher spatial resolution in more recent years. Of additional interest for biodiversity monitoring will be CHIME, the European Copernicus hyperspectral imaging mission, starting in 2028 with a free and open data policy. In all reviewed studies of this review, none used hyperspectral data. These developments suggest that, although previous research has focused mostly on multispectral EO data for wildlife ecology research in polar and mountain regions, higher resolution data may be able to answer research questions in greater detail of, e.g., ROS events, near real-time monitoring of animal movement reactions on changing weather condition.
In remote areas like polar regions, with little to no daylight for long periods, SAR (synthetic aperture radar) data might offer opportunities that multispectral satellite sensors are not able to provide. Because they can penetrate clouds and are independent of illumination conditions, SAR sensors could be useful for polar and mountain regions during winter seasons [177]. Although limited by additional constraints of more complex processing, few ready to use products, shorter time series, and lack of daily observations, SAR still offers high potential for wildlife and ecology research. In current studies, SAR data are mainly used to retrieve information about sea ice changes and influences on for example caribou movements on inland water bodies or penguin habitat selection [24,141,178]. Advantages of SAR over optical data to overcome limitations of cloud cover or darkness are under-utilized. In addition to detecting sea ice, SAR can offer advanced insights such as wet snow extent and vegetation characteristics, or might even be able to detect animal colonies during cloudy and polar night days [175,176,179,180,181,182,183,184].
Artificial intelligence (AI) is receiving increased attention in science, as it enables novel approaches in many different application areas. Machine learning algorithms are used by random forest models and neural networks in EO for landcover classifications, single object detection, and change detections [185,186]. In landcover classifications, AI methods are commonly used over traditional methods of supervised- and unsupervised classifications. Romàn et al. compare the power of different machine learning classification methods for guano and landcover classifications. The best results were achieved with support vector machines and random forest models [100]. In single species detection, Le et al. used convolutional neural networks in several learning steps to detect single penguins in very-high resolution imagery [112]. Comparable convolutional neural networks are applied by Goncalves et al. for automatic detection of seals on haul-outs [33,187]. Automated single species detections in satellite imagery much more efficient than traditional on site and manual counts. In addition to detecting single individuals, complex analyses of Sentinel-1 SAR data could be streamlined when combined with ready-to-use AI generated algorithms. Shorter response times could be enabled by AI based near real-time analyses, for example, in the cases of reindeer herding management or agricultural field management during geese migration. Future access to EO satellite data in higher spatial and temporal resolution combined with AI algorithms can enable further analysis including tracking penguin colony changes related to snow and ice data.
Moreover, in addition to rapid growth in EO satellite sensors and AI methods, the possibilities of animals being sensors for the environment themselves develops in line. Transmitters are fixed onto the back of birds, mammals and water living species, collecting data not only about the animals position, but temperature, air pressure, salinity, chlorophyll-a, or height [12,188,189]. Transmitters get smaller and the influence of transmitters on the animal behavior is investigated to account for side effects [190]. Still, to mount transmitters onto animals, at least one on site action has to take place. After that, the animal borne sensor data are collected remotely. For that reason, not only developments in EO pushing ecology research and animal monitoring forward, but also ecology supporting EO should be kept in mind. Animal borne sensors and EO sensors that complement each other might be a step stone for better exchange between ecology research and EO scientists. Methods, research needs, and skills can be mutually shared and two big environmental crises (climate change and biodiversity loss) can be approached by interdisciplinary work.
5. Conclusions
Environmental information that is needed by wildlife ecologists for research in polar and mountain regions can be provided at high spatial and temporal resolution by Earth observation data not only from the ground, but from space. A total of 145 studies are reviewed and analyzed with respect to publications published between 2000 and 2024, study areas, animal species studied, sensors used, spatial and temporal resolutions needed, and main research objectives. Below, we summarize the main findings of this review:
- Interest in EO data for wildlife ecology research in polar and mountain regions increased from one publication in 2000 to a maximum of 12 publications in 2016 and 2021. On a country level, the majority of studies are located in Canada (43 studies) and the Antarctic (40 studies). Regionally, study locations are dominated by the Antarctic peninsula, Nunavut in Canada, Svalbard in Europe, and Alaska as part of the USA. Most of the authors are affiliated with the USA (48 studies) and Canada (37 studies).
- Bird (52 studies) and ungulate species (38 studies) are the main animal groups and are dominated by penguin species (25 studies) and reindeers (29 studies), respectively.
- A total of 130 studies used multispectral data, while only 15 studies used SAR data. The majority of studies applied Landsat data (63 studies) and MODIS data (52 studies). This aligns with the findings that spatial resolutions of 20 m–30 m were used for 44 studies and resolutions of 30 m–250 m were used for 31 studies. Despite long-running satellites (e.g., Landsat and MODIS) and the majority of the studies being multi-temporal (66 studies) and time series analysis (51 studies), there is no increase in study length.
- Environmental EO datasets were most frequently accessed for vegetation (32 studies), ice (29 studies), and snow (19 studies). Research focused mainly on distribution mapping (64 studies) and foraging area analyses (26 studies). Landcover classification and (41 studies) and habitat modelling (29 studies) are the methods applied most of the time.
- Major challenges of interdisciplinary work include the promotion of unused opportunities and expanding study areas to eastern regions. The potential of available Sentinel-1, and -2 data, new sensors like CHIME, and AI concepts are not fully realized.
- Choosing an EO dataset that fits in spatial and temporal resolution seems to be challenging in the wildlife ecology community. Interdisciplinary working groups should be encouraged.
- Rapid changes in climate and landscapes require efficient, continuous monitoring of environments and their inhabitants. Near real-time data collection and connection to animal species data should be discussed for short-time management planning and climate change related adaptations.
Supplementary Materials
The following supporting information can be downloaded at: https://www.mdpi.com/article/10.3390/rs17162780/s1, Figure S1: PRISMA flow diagram.
Author Contributions
Conceptualization, H.W., A.D., and C.K.; writing—original draft preparation, H.W.; writing—review and editing, H.W., A.D., S.K., and C.K.; visualization, H.W.; supervision, A.D. and C.K. All authors have read and agreed to the published version of the manuscript.
Funding
This work was funded by the Deutsche Forschungsgemeinschaft (DFG, German Research Foundation)—510552229 in the context of the DFG Research Unit 5696, “SOS: Serverless Scientific Computing and Engineering for Earth observation and Sustainability Research” (https://dfg-sos.de, accessed on 30 May 2025).
Data Availability Statement
No new data were created or analyzed in this study. Data sharing is not applicable to this article.
Acknowledgments
We thank Karina Raquel Alvarez and Kjirsten Coleman, native speakers of the English language, for reading through the final manuscript and for the support with writing and editing. Also, we want to thank the colleagues of the DFG Research Unit “SOS” for stressing the need of developments in interdisciplinary work of EO and wildlife ecology research.
Conflicts of Interest
The authors declare no conflicts of interest.
Appendix A. List of Keywords for Web of Science Search String and List of Journals
At least one of each term of all three groups had to appear in a publications title, abstract, or keyword (conditional search argument):
Remote sensing and Earth observation: “remote sensing”, “satellite remote sensing”, “satellite image”, “satellite imagery”, “Earth observation”, “eo”, “satellite data”, “remotely sensed data”, “Sentinel-1”, “Sentinel-2”, “Landsat”, “MODIS”, “IKONOS”, “Quickbird”, “WorldView”, “Pleiades”, “RapidEye”, “GeoEye”, “planet”, “skysat”, “SPOT”, “AVHRR”, “Envisat”, “Aster”, “ALOS”, “TanDEM-X”, “TerraSAR-X”, “DESIS”, “PRISMA”, “EnMAP”, “Hyperion”, “GEDI”, “Synthetic Aperture Radar”, “Radar”, “RadarSat”, “COSMO”, “SRTM”, “microwave satellite”, “multispectral satellite”, “hyperspectral satellite”, “thermal satellite”, “Cryosat”, “icers”, “malar”.
Wildlife Ecology: “mammal”, “birds”, “bird migration”, “animal movement”, “animal migration”, “animal habitat”, “polar bear”, “snow leopard”, “reindeer”, “caribou”, “walrus”, “seal”, “polar fox”, “albatross”, “puffin”, “guillemot”, “musk oxen”, “insect”, “rabbit”, “hare”, “mouse”, “gazelle”, “avian”, “eagle”,, “Antarctic orca”, “petrel”, “cormorant”, “gull”, “penguin”, “tern”, “imperial shag”, “skua”, “snowy sheathbill”, “wolf”, “wolverine”, “lemming”, “moose”, “Hermine”, “stoat”, “dall sheep”, “arctic ground squirrel”, “ptarmigan”, “sea otter”, “goose”, “bees”, “wasps”, “plant lice”, “butterflies”, “moths”, “mosquitos”, “flies”, “caddisflies”.
Polar and mountain regions: “glacial”, “polar”, “subpolar”, “cold region”, “alpine environment”, “high mountains”, “northern latitudes”, “snow biome”, “winter”, “ice”, “permafrost”, “winter landscape”, “snow cover”, “snowpack”, “tundra”, “taiga”, “boreal”, “arctic”, “Antarctic”.

Figure A1.
List of Earth observation and ecology related journals.
Figure A1.
List of Earth observation and ecology related journals.

References
- Nogués-Bravo, D.; Araújo, M.B.; Errea, M.P.; Martínez-Rica, J.P. Exposure of Global Mountain Systems to Climate Warming during the 21st Century. Glob. Environ. Change 2007, 17, 420–428. [Google Scholar] [CrossRef]
- Calvin, K.; Dasgupta, D.; Krinner, G.; Mukherji, A.; Thorne, P.W.; Trisos, C.; Romero, J.; Aldunce, P.; Barrett, K.; Blanco, G.; et al. Contribution of Working Groups I, II and III to the Sixth Assessment Report of the Intergovernmental Panel on Climate Change. In Climate Change 2023: Synthesis Report; Lee, H., Romero, J., Eds.; IPCC: Geneva, Switzerland, 2023. [Google Scholar]
- Kim, Y.-H.; Min, S.-K.; Gillett, N.P.; Notz, D.; Malinina, E. Observationally-Constrained Projections of an Ice-Free Arctic Even under a Low Emission Scenario. Nat. Commun. 2023, 14, 3139. [Google Scholar] [CrossRef] [PubMed]
- Hoffmann, A.A.; Sgrò, C.M. Climate Change and Evolutionary Adaptation. Nature 2011, 470, 479–485. [Google Scholar] [CrossRef]
- Pacifici, M.; Visconti, P.; Butchart, S.H.M.; Watson, J.E.M.; Cassola, F.M.; Rondinini, C. Species’ Traits Influenced Their Response to Recent Climate Change. Nat. Clim. Change 2017, 7, 205–208. [Google Scholar] [CrossRef]
- Radchuk, V.; Reed, T.; Teplitsky, C.; van de Pol, M.; Charmantier, A.; Hassall, C.; Adamík, P.; Adriaensen, F.; Ahola, M.P.; Arcese, P.; et al. Adaptive Responses of Animals to Climate Change Are Most Likely Insufficient. Nat. Commun. 2019, 10, 3109. [Google Scholar] [CrossRef] [PubMed]
- Thomas, C.D.; Cameron, A.; Green, R.E.; Bakkenes, M.; Beaumont, L.J.; Collingham, Y.C.; Erasmus, B.F.N.; de Siqueira, M.F.; Grainger, A.; Hannah, L.; et al. Extinction Risk from Climate Change. Nature 2004, 427, 145–148. [Google Scholar] [CrossRef]
- Rosenzweig, C.; Karoly, D.; Vicarelli, M.; Neofotis, P.; Wu, Q.; Casassa, G.; Menzel, A.; Root, T.L.; Estrella, N.; Seguin, B.; et al. Attributing Physical and Biological Impacts to Anthropogenic Climate Change. Nature 2008, 453, 353–357. [Google Scholar] [CrossRef]
- Burek, K.A.; Gulland, F.M.D.; O’Hara, T.M. Effects of Climate Change on Arctic Marine Mammal Health. Ecol. Appl. 2008, 18, S126–S134. [Google Scholar] [CrossRef]
- Campbell, T.K.F.; Lantz, T.C.; Fraser, R.H. Impacts of Climate Change and Intensive Lesser snow goose (Chen caerulescens caerulescens) Activity on Surface Water in High Arctic Pond Complexes. Remote Sens. 2018, 10, 1892. [Google Scholar] [CrossRef]
- Rocchini, D.; Boyd, D.S.; Féret, J.-B.; Foody, G.M.; He, K.S.; Lausch, A.; Nagendra, H.; Wegmann, M.; Pettorelli, N. Satellite Remote Sensing to Monitor Species Diversity: Potential and Pitfalls. Remote Sens. Ecol. Conserv. 2016, 2, 25–36. [Google Scholar] [CrossRef]
- Pettorelli, N.; Schulte to Bühne, H.; Tulloch, A.; Dubois, G.; Macinnis-Ng, C.; Queirós, A.M.; Keith, D.A.; Wegmann, M.; Schrodt, F.; Stellmes, M.; et al. Satellite Remote Sensing of Ecosystem Functions: Opportunities, Challenges and Way Forward. Remote Sens. Ecol. Conserv. 2018, 4, 71–93. [Google Scholar] [CrossRef]
- Remelgado, R.; Leutner, B.; Safi, K.; Sonnenschein, R.; Kuebert, C.; Wegmann, M. Linking Animal Movement and Remote Sensing—Mapping Resource Suitability from a Remote Sensing Perspective. Remote Sens. Ecol. Conserv. 2018, 4, 211–224. [Google Scholar] [CrossRef]
- Evans, P.G.H.; Pierce, G.J.; Panigada, S. Climate Change and Marine Mammals. J. Mar. Biol. Assoc. UK 2010, 90, 1483–1487. [Google Scholar] [CrossRef]
- MacCracken, J.G. Pacific walrus and Climate Change: Observations and Predictions. Ecol. Evol. 2012, 2, 2072–2090. [Google Scholar] [CrossRef]
- Obbard, M.E.; Cattet, M.R.L.; Howe, E.J.; Middel, K.R.; Newton, E.J.; Kolenosky, G.B.; Abraham, K.F.; Greenwood, C.J. Trends in Body Condition in Polar Bears (Ursus maritimus) from the Southern Hudson Bay Subpopulation in Relation to Changes in Sea Ice. Arct. Sci. 2016, 2, 15–32. [Google Scholar] [CrossRef]
- Huntington, H.P.; Quakenbush, L.T.; Nelson, M. Evaluating the Effects of Climate Change on Indigenous Marine Mammal Hunting in Northern and Western Alaska Using Traditional Knowledge. Front. Mar. Sci. 2017, 4, 319. [Google Scholar] [CrossRef]
- Gulland, F.M.D.; Baker, J.D.; Howe, M.; LaBrecque, E.; Leach, L.; Moore, S.E.; Reeves, R.R.; Thomas, P.O. A Review of Climate Change Effects on Marine Mammals in United States Waters: Past Predictions, Observed Impacts, Current Research and Conservation Imperatives. Clim. Change Ecol. 2022, 3, 100054. [Google Scholar] [CrossRef]
- Barber, D.G.; Lukovich, J.V.; Keogak, J.; Baryluk, S.; Fortier, L.; Henry, G.H.R. The Changing Climate of the Arctic. Arctic 2008, 61, 7–26. [Google Scholar] [CrossRef]
- Hulme, P. Adapting to Climate Change: Is There Scope for Ecological Management in the Face of a Global Threat? J. Appl. Ecol. 2005, 42, 784–794. [Google Scholar] [CrossRef]
- Tveraa, T.; Fauchald, P.; Yoccoz, N.G.; Ims, R.A.; Aanes, R.; Hogda, K.A. What Regulate and Limit Reindeer Populations in Norway? Oikos 2007, 116, 706–715. [Google Scholar] [CrossRef]
- Mawdsley, J.; O’malley, R.; Ojima, D. A Review of Climate—Change Adaptation Strategies for Wildlife Management and Biodiversity Conservation. Conserv. Biol. 2009, 23, 1080–1089. [Google Scholar] [CrossRef] [PubMed]
- Sharma, S.; Couturier, S.; Cote, S.D. Impacts of Climate Change on the Seasonal Distribution of Migratory Caribou. Glob. Change Biol. 2009, 15, 2549–2562. [Google Scholar] [CrossRef]
- Bartsch, A.; Kumpula, T.; Forbes, B.C.; Stammler, F. Detection of Snow Surface Thawing and Refreezing in the Eurasian Arctic with QuikSCAT: Implications for Reindeer Herding. Ecol. Appl. 2010, 20, 2346–2358. [Google Scholar] [CrossRef]
- Franks, S.; Hoffmann, A. Genetics of Climate Change Adaptation. Annu. Rev. Genet. 2012, 46, 185–208. [Google Scholar] [CrossRef]
- Stein, B.; Staudt, A.; Cross, M.S.; Dubois, N.S.; Enquist, C.; Griffis, R.; Hansen, L.; Hellmann, J.; Lawler, J.; Nelson, E.; et al. Preparing for and Managing Change: Climate Adaptation for Biodiversity and Ecosystems. Front. Ecol. Environ. 2013, 11, 502–510. [Google Scholar] [CrossRef]
- Jenkins, D.A.; Lecomte, N.; Schaefer, J.A.; Olsen, S.M.; Swingedouw, D.; Cote, S.D.; Pellissier, L.; Yannic, G. Loss of Connectivity among Island-Dwelling Peary Caribou Following Sea Ice Decline. Biol. Lett. 2016, 12, 20160235. [Google Scholar] [CrossRef]
- Leblond, M.; St-Laurent, M.-H.; Cote, S.D. Caribou, Water, and Ice—Fine-Scale Movements of a Migratory Arctic Ungulate in the Context of Climate Change. Mov. Ecol. 2016, 4, 14. [Google Scholar] [CrossRef]
- John, C.; Miller, D.; Post, E. Regional Variation in Green-up Timing along a Caribou Migratory Corridor: Spatial Associations with Snowmelt and Temperature. Arct. Antarct. Alp. Res. 2020, 52, 416–423. [Google Scholar] [CrossRef]
- Goebel, M.E.; Perryman, W.L.; Hinke, J.T.; Krause, D.J.; Hann, N.A.; Gardner, S.; LeRoi, D.J. A Small Unmanned Aerial System for Estimating Abundance and Size of Antarctic Predators. Polar Biol. 2015, 38, 619–630. [Google Scholar] [CrossRef]
- Kavanaugh, M.T.; Abdala, F.N.; Ducklow, H.; Glover, D.; Fraser, W.; Martinson, D.; Stammerjohn, S.; Schofield, O.; Doney, S.C. Effect of Continental Shelf Canyons on Phytoplankton Biomass and Community Composition along the Western Antarctic Peninsula. Mar. Ecol. Prog. Ser. 2015, 524, 11–26. [Google Scholar] [CrossRef]
- Herr, H.; Viquerat, S.; Siegel, V.; Kock, K.-H.; Dorschel, B.; Huneke, W.G.C.; Bracher, A.; Schroeder, M.; Gutt, J. Horizontal Niche Partitioning of Humpback and Fin Whales around the West Antarctic Peninsula: Evidence from a Concurrent Whale and Krill Survey. Polar Biol. 2016, 39, 799–818. [Google Scholar] [CrossRef]
- Goncalves, B.C.; Spitzbart, B.; Lynch, H.J. SealNet: A Fully-Automated Pack-Ice Seal Detection Pipeline for Sub-Meter Satellite Imagery. Remote Sens. Environ. 2020, 239, 111617. [Google Scholar] [CrossRef]
- Wege, M.; Salas, L.; LaRue, M. Ice Matters: Life-History Strategies of Two Antarctic Seals Dictate Climate Change Eventualities in the Weddell Sea. Glob. Change Biol. 2021, 27, 6252–6262. [Google Scholar] [CrossRef] [PubMed]
- Abraham, K.; Jefferies, R.; Alisauskas, R. The Dynamics of Landscape Change and Snow Geese in Mid-Continent North America. Glob. Change Biol. 2005, 11, 841–855. [Google Scholar] [CrossRef]
- Tombre, I.; Madsen, J.; Tommervik, H.; Haugen, K.; Eythorsson, E. Influence of Organised Scaring on Distribution and Habitat Choice of Geese on Pastures in Northern Norway. Agric. Ecosyst. Environ. 2005, 111, 311–320. [Google Scholar] [CrossRef]
- Tombre, I.; Tommervik, H.; Madsen, J. Land Use Changes and Goose Habitats, Assessed by Remote Sensing Techniques, and Corresponding Goose Distribution, in Vesteralen, Northern Norway. Agric. Ecosyst. Environ. 2005, 109, 284–296. [Google Scholar] [CrossRef]
- Barber, D.; Iacozza, J. Historical Analysis of Sea Ice Conditions in M’Clintock Channel and the Gulf of Boothia, Nunavut: Implications for Ringed Seal and Polar Bear Habitat. Arctic 2004, 57, 1–14. [Google Scholar] [CrossRef][Green Version]
- Stirling, I.; Parkinson, C.L. Possible Effects of Climate Warming on Selected Populations of Polar Bears (Ursus Maritimus) in the Canadian Arctic. Arctic 2006, 59, 261–275. [Google Scholar] [CrossRef]
- Sahanatien, V.; Derocher, A.E. Monitoring Sea Ice Habitat Fragmentation for Polar Bear Conservation. Anim. Conserv. 2012, 15, 397–406. [Google Scholar] [CrossRef]
- Young, K.L.; Brown, L.; Labine, C. Snow Cover Variability at Polar Bear Pass, Nunavut. Arct. Sci. 2018, 4, 669–690. [Google Scholar] [CrossRef]
- Awange, J.; Kiema, J. Fundamentals of Remote Sensing. In Environmental Geoinformatics; Springer: Berlin/Heidelberg, Germany, 2004. [Google Scholar] [CrossRef]
- Kennedy, R.; Townsend, P.; Gross, J.; Cohen, W.; Bolstad, P.; Wang, Y.; Adams, P. Remote Sensing Change Detection Tools for Natural Resource Managers: Understanding Concepts and Tradeoffs in the Design of Landscape Monitoring Projects. Remote Sens. Environ. 2009, 113, 1382–1396. [Google Scholar] [CrossRef]
- Toth, C.; Jóźków, G. Remote Sensing Platforms and Sensors: A Survey. ISPRS J. Photogramm. Remote Sens. 2016, 115, 22–36. [Google Scholar] [CrossRef]
- Wang, Q.; Shi, W.; Li, Z.; Atkinson, P. Fusion of Sentinel-2 Images. Remote Sens. Environ. 2016, 187, 241–252. [Google Scholar] [CrossRef]
- Pettorelli, N.; Safi, K.; Turner, W. Satellite Remote Sensing, Biodiversity Research and Conservation of the Future. Philos. Trans. R. Soc. B Biol. Sci. 2014, 369, 20130190. [Google Scholar] [CrossRef]
- Wehner, H.; Fritz, J.; Voelkl, B. Soaring and Intermittent Flap-Gliding during Migratory Flights of Northern Bald Ibis. J. Ornithol. 2022, 163, 671–681. [Google Scholar] [CrossRef]
- Laidre, K.L.; Heide-Jorgensen, M.P.; Logsdon, M.L.; Delwiche, L.; Nielsen, T.G. A Whale of an Opportunity: Examining the Vertical Structure of Chlorophyll-a in High Arctic Waters Using Instrumented Marine Predators. Mar. Biol. Res. 2010, 6, 519–529. [Google Scholar] [CrossRef]
- Linsky, J.M.J.; Wilson, N.; Cade, D.E.; Goldbogen, J.A.; Johnston, D.W.; Friedlaender, A.S. The Scale of the Whale: Using Video-Tag Data to Evaluate Sea-Surface Ice Concentration from the Perspective of Individual Antarctic Minke Whales. Anim. Bio. 2020, 8, 31. [Google Scholar] [CrossRef]
- Remelgado, R.; Safi, K.; Wegmann, M. From Ecology to Remote Sensing: Using Animals to Map Land Cover. Remote Sens. Ecol. Conserv. 2020, 6, 93–104. [Google Scholar] [CrossRef]
- Larue, M.A.; Knight, J. Applications of Very High-Resolution Imagery in the Study and Conservation of Large Predators in the Southern Ocean. Conserv. Biol. 2014, 28, 1731–1735. [Google Scholar] [CrossRef]
- Witharana, C.; Lynch, H.J. An Object-Based Image Analysis Approach for Detecting Penguin Guano in Very High Spatial Resolution Satellite Images. Remote Sens. 2016, 8, 375. [Google Scholar] [CrossRef]
- Witharana, C.; LaRue, M.A.; Lynch, H.J. Benchmarking of Data Fusion Algorithms in Support of Earth Observation Based Antarctic Wildlife Monitoring. ISPRS J. Photogramm. Remote Sens. 2016, 113, 124–143. [Google Scholar] [CrossRef]
- Rees, W.G.; Brown, J.A.; Fretwell, P.T.; Trathan, P.N. What Colour Is Penguin Guano? Antarct. Sci. 2017, 29, 417–425. [Google Scholar] [CrossRef]
- Larue, M.; Iles, D.; Labrousse, S.; Salas, L.; Ballard, G.; Ainley, D.; Saenz, B. A Possible Adelie Penguin Sub-Colony on Fast Ice by Cape Crozier, Antarctica. Antarct. Sci. 2019, 31, 189–194. [Google Scholar] [CrossRef]
- LaRue, M.A.; Ainley, D.G.; Pennycook, J.; Stamatiou, K.; Salas, L.; Nur, N.; Stammerjohn, S.; Barrington, L. Engaging ‘the Crowd’ in Remote Sensing to Learn about Habitat Affinity of the Weddell Seal in Antarctica. Remote Sens. Ecol. Conserv. 2020, 6, 70–78. [Google Scholar] [CrossRef]
- Haddaway, N.R.; Page, M.J.; Pritchard, C.C.; McGuinness, L.A. PRISMA2020: An R Package and Shiny App for Producing PRISMA 2020-Compliant Flow Diagrams, with Interactivity for Optimised Digital Transparency and Open Synthesis. Campbell Syst. Rev. 2022, 18, e1230. [Google Scholar] [CrossRef]
- Page, M.J.; McKenzie, J.E.; Bossuyt, P.M.; Boutron, I.; Hoffmann, T.C.; Mulrow, C.D.; Shamseer, L.; Tetzlaff, J.M.; Akl, E.A.; Brennan, S.E.; et al. The PRISMA 2020 Statement: An Updated Guideline for Reporting Systematic Reviews. BMJ 2021, 372, n71. [Google Scholar] [CrossRef]
- Spanier, R.; Kuenzer, C. Marine Infrastructure Detection with Satellite Data—A Review. Remote Sens. 2024, 16, 1675. [Google Scholar] [CrossRef]
- Baumhoer, C.A.; Dietz, A.J.; Dech, S.; Kuenzer, C. Remote Sensing of Antarctic Glacier and Ice-Shelf Front Dynamics—A Review. Remote Sens. 2018, 10, 1445. [Google Scholar] [CrossRef]
- Hu, Z.; Kuenzer, C.; Dietz, A.J.; Dech, S. The Potential of Earth Observation for the Analysis of Cold Region Land Surface Dynamics in Europe—A Review. Remote Sens. 2017, 9, 1067. [Google Scholar] [CrossRef]
- Koehler, J.; Kuenzer, C. Forecasting Spatio-Temporal Dynamics on the Land Surface Using Earth Observation Data—A Review. Remote Sens. 2020, 12, 3513. [Google Scholar] [CrossRef]
- Schilling, S.; Dietz, A.; Kuenzer, C. Snow Water Equivalent Monitoring—A Review of Large-Scale Remote Sensing Applications. Remote Sens. 2024, 16, 1085. [Google Scholar] [CrossRef]
- Tsai, Y.-L.S.; Dietz, A.; Oppelt, N.; Kuenzer, C. Remote Sensing of Snow Cover Using Spaceborne SAR: A Review. Remote Sens. 2019, 11, 1456. [Google Scholar] [CrossRef]
- Wenzl, M.; Baumhoer, C.A.; Dietz, A.J.; Kuenzer, C. Vegetation Changes in the Arctic: A Review of Earth Observation Applications. Remote Sens. 2024, 16, 4509. [Google Scholar] [CrossRef]
- Leblanc, G.; Francis, C.M.; Soffer, R.; Kalacska, M.; de Gea, J. Spectral Reflectance of Polar Bear and Other Large Arctic Mammal Pelts; Potential Applications to Remote Sensing Surveys. Remote Sens. 2016, 8, 273. [Google Scholar] [CrossRef]
- Richter, S.; Gerum, R.C.; Schneider, W.; Fabry, B.; Le Bohec, C.; Zitterbart, D.P. A Remote-Controlled Observatory for Behavioural and Ecological Research: A Case Study on Emperor Penguins. Methods Ecol. Evol. 2018, 9, 1168–1178. [Google Scholar] [CrossRef]
- Hani, U.E.; Haq, S.M.; Shabbir, R.; Waheed, M.; Jabeen, A.; Hussain, M.; Najar, Z.H.; Alhimaidi, A.R.; Amran, R.A.; Bussmann, R.W. Geospatial Assessment of Climate and Human Pressure on Snow Leopard Habitat in the Trans-Himalayan Region of Pakistan. Glob. Ecol. Conserv. 2024, 53, e03024. [Google Scholar] [CrossRef]
- Barber-Meyer, S.M.; Kooyman, G.L.; Ponganis, P.J. Estimating the Relative Abundance of Emperor Penguins at Inaccessible Colonies Using Satellite Imagery. Polar Biol. 2007, 30, 1565–1570. [Google Scholar] [CrossRef]
- LaRue, M.; Iles, D.; Labrousse, S.; Fretwell, P.; Ortega, D.; Devane, E.; Horstmann, I.; Viollat, L.; Foster-Dyer, R.; Le Bohec, C.; et al. Advances in Remote Sensing of Emperor Penguins: First Multi-Year Time Series Documenting Trends in the Global Population. Proc. R. Soc. B Biol. Sci. 2024, 291, 20232067. [Google Scholar] [CrossRef]
- Madsen, J.; Tamstorf, M.; Klaassen, M.; Eide, N.; Glahder, C.; Riget, F.; Nyegaard, H.; Cottaar, F. Effects of Snow Cover on the Timing and Success of Reproduction in High-Arctic Pink-Footed Geese Anser Brachyrhynchus. Polar Biol. 2007, 30, 1363–1372. [Google Scholar] [CrossRef]
- Slattery, S.M.; Alisauskas, R.T. Distribution and Habitat Use of Ross’s and Lesser Snow Geese during Late Brood Rearing. J. Wildl. Manag. 2007, 71, 2230–2237. [Google Scholar] [CrossRef]
- Hansen, M.; Franklin, S.; Woudsma, C.; Peterson, M. Caribou Habitat Mapping and Fragmentation Analysis Using Landsat MSS, TM, and GIS Data in the North Columbia Mountains, British Columbia, Canada. Remote Sens. Environ. 2001, 77, 50–65. [Google Scholar] [CrossRef]
- Bechtel, R.; Sanchez-Azofeifa, A.; Rivard, B. Associations between Woodland Caribou Telemetry Data and Landsat TM Spectral Reflectance. Int. J. Remote Sens. 2004, 25, 4813–4827. [Google Scholar] [CrossRef]
- Verma, M.; Buehne, H.S.T.; Lopes, M.; Ehrich, D.; Sokovnina, S.; Hofhuis, S.P.; Pettorelli, N. Can Reindeer Husbandry Management Slow down the Shrubification of the Arctic? J. Environ. Manage. 2020, 267, 110636. [Google Scholar] [CrossRef]
- Romtveit, L.; Strand, O.; Mossing, A.; Kastdalen, L.; Hjeltnes, A.W.; Bjerketvedt, D.K.; Odland, A.; Heggenes, J. Optimal Foraging by a Large Ungulate in an Extreme Environment: Wild Mountain Reindeer Select Snow-Free Feeding Habitats in Winter. Ecol. Evol. 2021, 11, 10409–10420. [Google Scholar] [CrossRef] [PubMed]
- Dettki, H.; Lofstrand, R.; Edenius, L. Modeling Habitat Suitability for Moose in Coastal Northern Sweden: Empirical vs Process-Oriented Approaches. AMBIO 2003, 32, 549–556. [Google Scholar] [CrossRef]
- Nikula, A.; Heikkinen, S.; Helle, E. Habitat Selection of Adult Moose Alces Alces at Two Spatial Scales in Central Finland. Wildl. Biol. 2004, 10, 121–135. [Google Scholar] [CrossRef]
- Michaud, J.-S.; Coops, N.C.; Andrew, M.E.; Wulder, M.A.; Brown, G.S.; Rickbeil, G.J.M. Estimating Moose (Alces alces) Occurrence and Abundance from Remotely Derived Environmental Indicators. Remote Sens. Environ. 2014, 152, 190–201. [Google Scholar] [CrossRef]
- Rae, L.F.; Whitaker, D.M.; Warkentin, I.G. Multiscale Impacts of Forest Degradation through Browsing by Hyperabundant Moose (Alces alces) on Songbird Assemblages. Divers. Distrib. 2014, 20, 382–395. [Google Scholar] [CrossRef]
- Gagne, C.; Mainguy, J.; Fortin, D. The Impact of Forest Harvesting on Caribou–Moose–Wolf Interactions Decreases along a Latitudinal Gradient. Biol. Conserv. 2016, 197, 215–222. [Google Scholar] [CrossRef]
- Verbyla, D.; Hegel, T.; Nolin, A.W.; van de Kerk, M.; Kurkowski, T.A.; Prugh, L.R. Remote Sensing of 2000–2016 Alpine Spring Snowline Elevation in Dall Sheep Mountain Ranges of Alaska and Western Canada. Remote Sens. 2017, 9, 1157. [Google Scholar] [CrossRef]
- van de Kerk, M.; Verbyla, D.; Nolin, A.W.; Sivy, K.J.; Prugh, L.R. Range-Wide Variation in the Effect of Spring Snow Phenology on Dall Sheep Population Dynamics. Environ. Res. Lett. 2018, 13, 075008. [Google Scholar] [CrossRef]
- Van de Kerk, M.; Arthur, S.; Bertram, M.; Borg, B.; Herriges, J.; Lawler, J.; Mangipane, B.; Koizumi, C.L.; Wendling, B.; Prugh, L. Environmental Influences on Dall’s Sheep Survival. J. Wildl. Manag. 2020, 84, 1127–1138. [Google Scholar] [CrossRef]
- Maher, A.I.; Treitz, P.M.; Ferguson, M.A.D. Can Landsat Data Detect Variations in Snow Cover within Habitats of Arctic Ungulates? Wildl. Biol. 2012, 18, 75–87. [Google Scholar] [CrossRef]
- Villamuelas, M.; Fernandez, N.; Albanell, E.; Galvez-Ceron, A.; Bartolome, J.; Mentaberre, G.; Lopez-Olvera, J.R.; Fernandez-Aguilar, X.; Colom-Cadena, A.; Maria Lopez-Martin, J.; et al. The Enhanced Vegetation Index (EVI) as a Proxy for Diet Quality and Composition in a Mountain Ungulate. Ecol. Indic. 2016, 61, 658–666. [Google Scholar] [CrossRef]
- Edenius, L.; Vencatasawmy, C.; Sandstrom, P.; Dahlberg, U. Combining Satellite Imagery and Ancillary Data to Map Snowbed Vegetation Important to Reindeer Rangifer Tarandus. Arct. Antarct. Alp. Res. 2003, 35, 150–157. [Google Scholar] [CrossRef]
- Falldorf, T.; Strand, O.; Panzacchi, M.; Tommervik, H. Estimating Lichen Volume and Reindeer Winter Pasture Quality from Landsat Imagery. Remote Sens. Environ. 2014, 140, 573–579. [Google Scholar] [CrossRef]
- Mahoney, P.J.; Liston, G.E.; LaPoint, S.; Gurarie, E.; Mangipane, B.; Wells, A.G.; Brinkman, T.J.; Eitel, J.U.H.; Hebblewhite, M.; Nolin, A.W.; et al. Navigating Snowscapes: Scale-Dependent Responses of Mountain Sheep to Snowpack Properties. Ecol. Appl. 2018, 28, 1715–1729. [Google Scholar] [CrossRef]
- MacSween, J.; Leroux, S.J.; Oakes, K.D. Cross-Ecosystem Effects of a Large Terrestrial Herbivore on Stream Ecosystem Functioning. Oikos 2019, 128, 135–145. [Google Scholar] [CrossRef]
- McLeod, L.J.T.; DeLancey, E.R.; Bayne, E.M. Spatially Explicit Abundance Modeling of a Highly Specialized Wetland Bird Using Sentinel-1 and Sentinel-2 Modélisation Spatialement Explicite de l’abondance d’un Oiseau Très Spécifique Aux Zones Humides à l’aide de Sentinel-1 et de Sentinel-2. Can. J. Remote Sens. 2022, 48, 37–54. [Google Scholar] [CrossRef]
- Cotte, C.; Park, Y.-H.; Guinet, C.; Bost, C.-A. Movements of Foraging King Penguins through Marine Mesoscale Eddies. Proc. R. Soc. B-Biol. Sci. 2007, 274, 2385–2391. [Google Scholar] [CrossRef]
- Massom, R.A.; Hill, K.; Barbraud, C.; Adams, N.; Ancel, A.; Emmerson, L.; Pook, M.J. Fast Ice Distribution in Adélie Land, East Antarctica: Interannual Variability and Implications for Emperor Penguins Aptenodytes Forsteri. Mar. Ecol. Prog. Ser. 2009, 374, 243–257. [Google Scholar] [CrossRef]
- Savidge, E.; Snow, T.; Siegfried, M.R.; Zheng, Y.; Bôas, A.B.V.; Bortolotto, G.A.; Boehme, L.; Alley, K.E. Wintertime Polynya Structure and Variability From Thermal Remote Sensing and Seal-Borne Observations at Pine Island Glacier, West Antarctica. IEEE Trans. Geosci. Remote Sens. 2023, 61, 4300813. [Google Scholar] [CrossRef]
- Kharuk, V.; Ranson, K.; Kozuhovskaya, A.; Kondakov, Y.; Pestunov, I. NOAA/AVHRR Satellite Detection of Siberian Silkmoth Outbreaks in Eastern Siberia. Int. J. Remote Sens. 2004, 25, 5543–5555. [Google Scholar] [CrossRef]
- Rickbeil, G.J.M.; Hermosilla, T.; Coops, N.C.; White, J.C.; Wulder, M.A. Barren-Ground Caribou (Rangifer Tarandus Groenlandicus) Behaviour after Recent Fire Events; Integrating Caribou Telemetry Data with Landsat Fire Detection Techniques. Glob. Change Biol. 2017, 23, 1036–1047. [Google Scholar] [CrossRef] [PubMed]
- Jepsen, J.U.; Hagen, S.B.; Hogda, K.A.; Ims, R.A.; Karlsen, S.R.; Tommervik, H.; Yoccoz, N.G. Monitoring the Spatio-Temporal Dynamics of Geometrid Moth Outbreaks in Birch Forest Using MODIS-NDVI Data. Remote Sens. Environ. 2009, 113, 1939–1947. [Google Scholar] [CrossRef]
- Bleyhl, B.; Baumann, M.; Griffiths, P.; Heidelberg, A.; Manvelyan, K.; Radeloff, V.C.; Zazanashvili, N.; Kuemmerle, T. Assessing Landscape Connectivity for Large Mammals in the Caucasus Using Landsat 8 Seasonal Image Composites. Remote Sens. Environ. 2017, 193, 193–203. [Google Scholar] [CrossRef]
- Sittler, K.L.; Parker, K.L.; Gillingham, M.P. Vegetation and Prescribed Fire: Implications for Stone’s Sheep and Elk. J. Wildl. Manag. 2019, 83, 393–409. [Google Scholar] [CrossRef]
- Roman, A.; Navarro, G.; Caballero, I.; Tovar-Sanchez, A. High-Spatial Resolution UAV Multispectral Data Complementing Satellite Imagery to Characterize a Chinstrap Penguin Colony Ecosystem on Deception Island (Antarctica). GIScience Remote Sens. 2022, 59, 1159–1176. [Google Scholar] [CrossRef]
- Ferguson, S.; Taylor, M.; Messier, F. Influence of Sea Ice Dynamics on Habitat Selection by Polar Bears. Ecology 2000, 81, 761–772. [Google Scholar] [CrossRef]
- Doniol-Valcroze, T.; Berteaux, D.; Larouche, P.; Sears, R. Influence of Thermal Fronts on Habitat Selection by Four Rorqual Whale Species in the Gulf of St. Lawrence. Mar. Ecol. Prog. Ser. 2007, 335, 207–216. [Google Scholar] [CrossRef]
- Gautier, C.; Langlois, A.; Sasseville, V.; Neave, E.; Johnson, C.A. Remote Sensing, Snow Modelling, Survey Data and Indigenous Knowledge Show How Snow and Sea-Ice Conditions Affect Peary Caribou (Rangifer Tarandus Pearyi) Distribution and Inter-Island and Island–Mainland Movements. Polar Res. 2022, 41, 7964. [Google Scholar] [CrossRef]
- Jensen, G.H.; Madsen, J.; Johnson, F.A.; Tamstorf, M.P. Snow Conditions as an Estimator of the Breeding Output in High-Arctic Pink-Footed Geese Anser Brachyrhynchus. Polar Biol. 2014, 37, 1–14. [Google Scholar] [CrossRef]
- Jefferies, R.; Jano, A.; Abraham, K. A Biotic Agent Promotes Large-Scale Catastrophic Change in the Coastal Marshes of Hudson Bay. J. Ecol. 2006, 94, 234–242. [Google Scholar] [CrossRef]
- Rickbeil, G.J.M.; Hermosilla, T.; Coops, N.C.; White, J.C.; Wulder, M.A.; Lantz, T.C. Changing Northern Vegetation Conditions Are Influencing Barren Ground Caribou (Rangifer Tarandus Groenlandicus) Post-Calving Movement Rates. J. Biogeogr. 2018, 45, 702–712. [Google Scholar] [CrossRef]
- Kennedy, B.; Pouliot, D.; Manseau, M.; Fraser, R.; Duffe, J.; Pasher, J.; Chen, W.; Olthof, I. Assessment of Landsat-Based Terricolous Macrolichen Cover Retrieval and Change Analysis over Caribou Ranges in Northern Canada and Alaska. Remote Sens. Environ. 2020, 240, 111694. [Google Scholar] [CrossRef]
- Komers, P.E.; Stanojevic, Z. Rates of Disturbance Vary by Data Resolution: Implications for Conservation Schedules Using the Alberta Boreal Forest as a Case Study. Glob. Change Biol. 2013, 19, 2916–2928. [Google Scholar] [CrossRef]
- Nelson, P.R.; Roland, C.; Macander, M.J.; McCune, B. Detecting Continuous Lichen Abundance for Mapping Winter Caribou Forage at Landscape Spatial Scales. Remote Sens. Environ. 2013, 137, 43–54. [Google Scholar] [CrossRef]
- Newton, E.J.; Pond, B.A.; Brown, G.S.; Abraham, K.F.; Schaefer, J.A. Remote Sensing Reveals Long-Term Effects of Caribou on Tundra Vegetation. Polar Biol. 2014, 37, 715–725. [Google Scholar] [CrossRef]
- Keim, J.L.; DeWitt, P.D.; Fitzpatrick, J.J.; Jenni, N.S. Estimating Plant Abundance Using Inflated Beta Distributions: Applied Learnings from a Lichen-Caribou Ecosystem. Ecol. Evol. 2017, 7, 486–493. [Google Scholar] [CrossRef]
- Le, H.; Samaras, D.; Lynch, H.J. A Convolutional Neural Network Architecture Designed for the Automated Survey of Seabird Colonies. Remote Sens. Ecol. Conserv. 2022, 8, 251–262. [Google Scholar] [CrossRef]
- Bird, C.N.; Dawn, A.H.; Dale, J.; Johnston, D.W. A Semi-Automated Method for Estimating Adelie Penguin Colony Abundance from a Fusion of Multispectral and Thermal Imagery Collected with Unoccupied Aircraft Systems. Remote Sens. 2020, 12, 3692. [Google Scholar] [CrossRef]
- Wu, J.; Xu, W.; He, J.; Lan, M. YOLO for Penguin Detection and Counting Based on Remote Sensing Images. Remote Sens. 2023, 15, 2598. [Google Scholar] [CrossRef]
- Lynch, H.J.; White, R.; Black, A.D.; Naveen, R. Detection, Differentiation, and Abundance Estimation of Penguin Species by High-Resolution Satellite Imagery. Polar Biol. 2012, 35, 963–968. [Google Scholar] [CrossRef]
- Fischbach, A.S.; Douglas, D.C. Evaluation of Satellite Imagery for Monitoring Pacific Walruses at a Large Coastal Haulout. Remote Sens. 2021, 13, 4266. [Google Scholar] [CrossRef]
- Shen, X.-Y.; Ke, C.-Q.; Miao, X.; Zhang, X.; Zhang, J. An Automated Method for the Detection of Emperor Penguin Colonies from Landsat 8 Imagery. Remote Sens. Lett. 2017, 8, 596–605. [Google Scholar] [CrossRef]
- Santora, J.A.; LaRue, M.A.; Ainley, D.G. Geographic Structuring of Antarctic Penguin Populations. Glob. Ecol. Biogeogr. 2020, 29, 1716–1728. [Google Scholar] [CrossRef]
- Macander, M.J.; Palm, E.C.; Frost, G.V.; Herriges, J.D.; Nelson, P.R.; Roland, C.; Russell, K.L.M.; Suitor, M.J.; Bentzen, T.W.; Joly, K.; et al. Lichen Cover Mapping for Caribou Ranges in Interior Alaska and Yukon. Environ. Res. Lett. 2020, 15, 055001. [Google Scholar] [CrossRef]
- Schwaller, M.R.; Lynch, H.J.; Tarroux, A.; Prehn, B. A Continent-Wide Search for Antarctic Petrel Breeding Sites with Satellite Remote Sensing. Remote Sens. Environ. 2018, 210, 444–451. [Google Scholar] [CrossRef]
- Cohen, J.Y.; Pulliainen, J.; Menard, C.B.; Johansen, B.; Oksanen, L.; Luojus, K.; Ikonen, J. Effect of Reindeer Grazing on Snowmelt, Albedo and Energy Balance Based on Satellite Data Analyses. Remote Sens. Environ. 2013, 135, 107–117. [Google Scholar] [CrossRef]
- Laidre, K.L.; Heide-Jorgensen, M.P.; Nyeland, J.; Mosbech, A.; Boertmann, D. Latitudinal Gradients in Sea Ice and Primary Production Determine Arctic Seabird Colony Size in Greenland. Proc. R. Soc. B-Biol. Sci. 2008, 275, 2695–2702. [Google Scholar] [CrossRef]
- Muukkonen, P.; Angervuori, A.; Virtanen, T.; Kuparinen, A.; Merila, J. Loss and Fragmentation of Siberian Jay (Perisoreus infaustus) Habitats. Boreal Environ. Res. 2012, 17, 59–71. [Google Scholar]
- Prendin, A.L.; Carrer, M.; Karami, M.; Hollesen, J.; Pedersen, N.B.; Pividori, M.; Treier, U.A.; Westergaard-Nielsen, A.; Elberling, B.; Normand, S. Immediate and Carry-over Effects of Insect Outbreaks on Vegetation Growth in West Greenland Assessed from Cells to Satellite. J. Biogeogr. 2020, 47, 87–100. [Google Scholar] [CrossRef]
- Johnson, H.E.; Gustine, D.D.; Golden, T.S.; Adams, L.G.; Parrett, L.S.; Lenart, E.A.; Barboza, P.S. NDVI Exhibits Mixed Success in Predicting Spatiotemporal Variation in Caribou Summer Forage Quality and Quantity. Ecosphere 2018, 9, e02461. [Google Scholar] [CrossRef]
- Rickbeil, G.J.M.; Coops, N.C.; Adamczewski, J. The Grazing Impacts of Four Barren Ground Caribou Herds (Rangifer Tarandus Groenlandicus) on Their Summer Ranges: An Application of Archived Remotely Sensed Vegetation Productivity Data. Remote Sens. Environ. 2015, 164, 314–323. [Google Scholar] [CrossRef]
- Himmelberger, A.; Frey, K.E.; Sangermano, F. Applying Landscape Fragmentation Analysis to Icescape Environments: Potential Impacts for the Pacific Walrus (Odobenus rosmarus divergens). Polar Res. 2022, 41, 5169. [Google Scholar] [CrossRef]
- Chen, X.; Chen, J.; Cheng, X.; Zhu, L.; Li, B.; Li, X. Retreating Shorelines as an Emerging Threat to Adelie Penguins on Inexpressible Island. Remote Sens. 2021, 13, 4718. [Google Scholar] [CrossRef]
- Lameris, T.K.; de Jong, M.E.; Boom, M.P.; van der Jeugd, H.P.; Litvin, K.E.; Loonen, M.J.J.E.; Nolet, B.A.; Prop, J. Climate Warming May Affect the Optimal Timing of Reproduction for Migratory Geese Differently in the Low and High Arctic. Oecologia 2019, 191, 1003–1014. [Google Scholar] [CrossRef]
- Dickens, J.; Hollyman, P.R.; Hart, T.; Clucas, G.V.; Murphy, E.J.; Poncet, S.; Trathan, P.N.; Collins, M.A. Developing UAV Monitoring of South Georgia and the South Sandwich Islands’ Iconic Land-Based Marine Predators. Front. Mar. Sci. 2021, 8, 654215. [Google Scholar] [CrossRef]
- Stirling, I.; Lunn, N.; Iacozza, J.; Elliott, C.; Obbard, M. Polar Bear Distribution and Abundance on the Southwestern Hudson Bay Coast during Open Water Season, in Relation to Population Trends and Annual Ice Patterns. Arctic 2004, 57, 15–26. [Google Scholar] [CrossRef]
- Jay, C.V.; Udevitz, M.S.; Kwok, R.; Fischbach, A.S.; Douglas, D.C. Divergent Movements of Walrus and Sea Ice in the Northern Bering Sea. Mar. Ecol. Prog. Ser. 2010, 407, 293–302. [Google Scholar] [CrossRef]
- Colpaert, A.; Kumpula, J. Detecting Changes in the State of Reindeer Pastures in Northernmost Finland, 1995–2005. Polar Rec. 2012, 48, 74–82. [Google Scholar] [CrossRef]
- Babst, F.; Esper, J.; Parlow, E. Landsat TM/ETM plus and Tree-Ring Based Assessment of Spatiotemporal Patterns of the Autumnal Moth (Epirrita Autumnata) in Northernmost Fennoscandia. Remote Sens. Environ. 2010, 114, 637–646. [Google Scholar] [CrossRef]
- Joutsensaari, J.; Yli-Pirila, P.; Korhonen, H.; Arola, A.; Blande, J.D.; Heijari, J.; Kivimaenpaa, M.; Mikkonen, S.; Hao, L.; Miettinen, P.; et al. Biotic Stress Accelerates Formation of Climate-Relevant Aerosols in Boreal Forests. Atmos. Chem. Phys. 2015, 15, 12139–12157. [Google Scholar] [CrossRef]
- Allard, M.; Fournier, R.A.; Grenier, M.; Lefebvre, J.; Giroux, J.-F. Forty Years of Change in the Bulrush Marshes of the St. Lawrence Estuary and The Impact of the Greater Snow Goose. Wetlands 2012, 32, 1175–1188. [Google Scholar] [CrossRef]
- Olofsson, J.; Tommervik, H.; Callaghan, T.V. Vole and Lemming Activity Observed from Space. Nat. Clim. Change 2012, 2, 880–883. [Google Scholar] [CrossRef]
- Boelman, N.T.; Liston, G.E.; Gurarie, E.; Meddens, A.J.H.; Mahoney, P.J.; Kirchner, P.B.; Bohrer, G.; Brinkman, T.J.; Cosgrove, C.L.; Eitel, J.U.H.; et al. Integrating Snow Science and Wildlife Ecology in Arctic-Boreal North America. Environ. Res. Lett. 2019, 14, 010401. [Google Scholar] [CrossRef]
- Fretwell, P.T.; Trathan, P.N. Emperors on Thin Ice: Three Years of Breeding Failure at Halley Bay. Antarct. Sci. 2019, 31, 133–138. [Google Scholar] [CrossRef]
- Iacozza, J.; Ferguson, S.H. Spatio-Temporal Variability of Snow over Sea Ice in Western Hudson Bay, with Reference to Ringed Seal Pup Survival. Polar Biol. 2014, 37, 817–832. [Google Scholar] [CrossRef]
- Henderson, E.M.; Derocher, A.E.; Lunn, N.J.; Montpetit, B.; Merrill, E.H.; Richardson, E.S. Polar Bear Ursus Maritimus Use of the Western Hudson Bay Flaw Lead. Mar. Ecol. Prog. Ser. 2021, 664, 227–242. [Google Scholar] [CrossRef]
- Ktitorov, P.; Ivanov, S.; Kornilova, E.; Kulikova, O.; Ris, H.; Sokolovskis, K.; Solovyeva, D. Shrub-Dwelling Species Are Joining the Arctic Passerine Bird Community in the Chaun Delta (Western Chukotka, Russia). Polar Biol. 2021, 44, 1847–1857. [Google Scholar] [CrossRef]
- Fretwell, P.T.; Phillips, R.A.; de L. Brooke, M.; Fleming, A.H.; McArthur, A. Using the Unique Spectral Signature of Guano to Identify Unknown Seabird Colonies. Remote Sens. Environ. 2015, 156, 448–456. [Google Scholar] [CrossRef]
- Gremillet, D.; Fort, J.; Amelineau, F.; Zakharova, E.; Le Bot, T.; Sala, E.; Gavrilo, M. Arctic Warming: Nonlinear Impacts of Sea-Ice and Glacier Melt on Seabird Foraging. Glob. Change Biol. 2015, 21, 1116–1123. [Google Scholar] [CrossRef] [PubMed]
- Labrousse, S.; Fraser, A.D.; Sumner, M.; Le Manach, F.; Sauser, C.; Horstmann, I.; Devane, E.; Delord, K.; Jenouvrier, S.; Barbraud, C. Landfast Ice: A Major Driver of Reproductive Success in a Polar Seabird. Biol. Lett. 2021, 17, 20210097. [Google Scholar] [CrossRef] [PubMed]
- Snapir, B.; Momblanch, A.; Jain, S.K.; Waine, T.W.; Holman, I.P. A Method for Monthly Mapping of Wet and Dry Snow Using Sentinel-1 and MODIS: Application to a Himalayan River Basin. Int. J. Appl. Earth Obs. Geoinf. 2019, 74, 222–230. [Google Scholar] [CrossRef]
- Imhoff, M.; Sisk, T.; Milne, A.; Morgan, G.; Orr, T. Remotely Sensed Indicators of Habitat Heterogeneity: Use of Synthetic Aperture Radar in Mapping Vegetation Structure and Bird Habitat. Remote Sens. Environ. 1997, 60, 217–227. [Google Scholar] [CrossRef]
- Fretwell, P.T.; Trathan, P.N. Penguins from Space: Faecal Stains Reveal the Location of Emperor Penguin Colonies. Glob. Ecol. Biogeogr. 2009, 18, 543–552. [Google Scholar] [CrossRef]
- LaRue, M.A.; Lynch, H.J.; Lyver, P.O.B.; Barton, K.; Ainley, D.G.; Pollard, A.; Fraser, W.R.; Ballard, G. A Method for Estimating Colony Sizes of Adélie Penguins Using Remote Sensing Imagery. Polar Biol. 2014, 37, 507–517. [Google Scholar] [CrossRef]
- Weimerskirch, H.; Le Bouard, F.; Ryan, P.G.; Bost, C.A. Massive Decline of the World’s Largest King Penguin Colony at Ile Aux Cochons, Crozet. Antarct. Sci. 2018, 30, 236–242. [Google Scholar] [CrossRef]
- LaRue, M.A.; Kooyman, G.; Lynch, H.J.; Fretwell, P. Emigration in Emperor Penguins: Implications for Interpretation of Long-Term Studies. Ecography 2015, 38, 114–120. [Google Scholar] [CrossRef]
- Meyer, N.; Bollache, L.; Galipaud, M.; Moreau, J.; Dechaume-Moncharmont, F.-X.; Afonso, E.; Angerbjorn, A.; Bety, J.; Brown, G.; Ehrich, D.; et al. Behavioural Responses of Breeding Arctic Sandpipers to Ground-Surface Temperature and Primary Productivity. Sci. Total Environ. 2021, 755, 142485. [Google Scholar] [CrossRef]
- Hogrefe, K.R.; Patil, V.P.; Ruthrauff, D.R.; Meixell, B.W.; Budde, M.E.; Hupp, J.W.; Ward, D.H. Normalized Difference Vegetation Index as an Estimator for Abundance and Quality of Avian Herbivore Forage in Arctic Alaska. Remote Sens. 2017, 9, 1234. [Google Scholar] [CrossRef]
- Jakubas, D.; Iliszko, L.M.; Strom, H.; Darecki, M.; Jerstad, K.; Stempniewicz, L. Foraging Behavior of a High-Arctic Zooplanktivorous Alcid, the Little Auk, at the Southern Edge of Its Breeding Range. J. Exp. Mar. Biol. Ecol. 2016, 475, 89–99. [Google Scholar] [CrossRef]
- Jakubas, D.; Wojczulanis-Jakubas, K.; Iliszko, L.M. Sex Differences in Foraging Ecology of a Zooplanktivorous Little Auk Alle Alle during the Pre-Laying Period: Insights from Remote Sensing and Animal-Tracking. Front. Zool. 2024, 21, 12. [Google Scholar] [CrossRef] [PubMed]
- Scales, K.L.; Miller, P.I.; Ingram, S.N.; Hazen, E.L.; Bograd, S.J.; Phillips, R.A. Identifying Predictable Foraging Habitats for a Wide-Ranging Marine Predator Using Ensemble Ecological Niche Models. Divers. Distrib. 2016, 22, 212–224. [Google Scholar] [CrossRef]
- Mallory, C.D.; Williamson, S.N.; Campbell, M.W.; Boyce, M.S. Response of Barren-Ground Caribou to Advancing Spring Phenology. Oecologia 2020, 192, 837–852. [Google Scholar] [CrossRef]
- Olsen, P.M.; Kolden, C.A.; Gadamus, L. Developing Theoretical Marine Habitat Suitability Models from Remotely-Sensed Data and Traditional Ecological Knowledge. Remote Sens. 2015, 7, 11863–11886. [Google Scholar] [CrossRef]
- LaRue, M.A.; Rotella, J.J.; Garrott, R.A.; Siniff, D.B.; Ainley, D.G.; Stauffer, G.E.; Porter, C.C.; Morin, P.J. Satellite Imagery Can Be Used to Detect Variation in Abundance of Weddell Seals (Leptonychotes weddellii) in Erebus Bay, Antarctica. Polar Biol. 2011, 34, 1727–1737. [Google Scholar] [CrossRef]
- Cubaynes, H.C.; Forcada, J.; Kovacs, K.M.; Lydersen, C.; Downie, R.; Fretwell, P.T. Walruses from Space: Walrus Counts in Simultaneous Remotely Piloted Aircraft System versus Very High-resolution Satellite Imagery. Remote Sens. Ecol. Conserv. 2024, 10, 584–596. [Google Scholar] [CrossRef]
- Kharuk, V.I.; Ranson, K.J.; Im, S.T. Siberian Silkmoth Outbreak Pattern Analysis Based on SPOT VEGETATION Data. Int. J. Remote Sens. 2009, 30, 2377–2388. [Google Scholar] [CrossRef]
- Kharuk, V.I.; Demidko, D.A.; Fedotova, E.V.; Dvinskaya, M.L.; Budnik, U.A. Spatial and Temporal Dynamics of Siberian Silk Moth Large-Scale Outbreak in Dark-Needle Coniferous Tree Stands in Altai. Contemp. Probl. Ecol. 2016, 9, 711–720. [Google Scholar] [CrossRef]
- Durner, G.M.; Simac, K.; Amstrup, S.C. Mapping Polar Bear Maternal Denning Habitat in the National Petroleum Reserve-Alaska with an IfSAR Digital Terrain Model. Arctic 2013, 66, 197–206. [Google Scholar] [CrossRef]
- LaRue, M.A.; Stapleton, S. Estimating the Abundance of Polar Bears on Wrangel Island during Late Summer Using High-Resolution Satellite Imagery: A Pilot Study. Polar Biol. 2018, 41, 2621–2626. [Google Scholar] [CrossRef]
- Wing, S.R.; Wing, L.C.; O’Connell-Milne, S.A.; Barr, D.; Stokes, D.; Genovese, S.; Leichter, J.J. Penguins and Seals Transport Limiting Nutrients Between Offshore Pelagic and Coastal Regions of Antarctica Under Changing Sea Ice. Ecosystems 2021, 24, 1203–1221. [Google Scholar] [CrossRef]
- Jean-Gagnon, F.; Legagneux, P.; Gilchrist, G.; Belanger, S.; Love, O.P.; Bety, J. The Impact of Sea Ice Conditions on Breeding Decisions Is Modulated by Body Condition in an Arctic Partial Capital Breeder. Oecologia 2018, 186, 1–10. [Google Scholar] [CrossRef]
- Razenkova, E.; Dubinin, M.; Pidgeon, A.M.; Hobi, M.L.; Zhu, L.; Bragina, E.V.; Allen, A.M.; Clayton, M.K.; Baskin, L.M.; Coops, N.C.; et al. Abundance Patterns of Mammals across Russia Explained by Remotely Sensed Vegetation Productivity and Snow Indices. J. Biogeogr. 2023, 50, 932–946. [Google Scholar] [CrossRef]
- Lindsay, J.; Hauser, D.; Mahoney, A.; Laidre, K.; Goodwin, J.; Harris, C.; Schaeffer, R.; Schaeffer, R.; Whiting, A.; Boveng, P.; et al. Characteristics of Ringed Seal Pusa hispida (‘Natchiq’) Denning Habitat in Kotzebue Sound, Alaska, during a Year of Limited Sea Ice and Snow. Mar. Ecol. Prog. Ser. 2023, 705, 1–20. [Google Scholar] [CrossRef]
- Kuenzer, C.; Ottinger, M.; Wegmann, M.; Guo, H.; Wang, C.; Zhang, J.; Dech, S.; Wikelski, M. Earth Observation Satellite Sensors for Biodiversity Monitoring: Potentials and Bottlenecks. Int. J. Remote Sens. 2014, 35, 6599–6647. [Google Scholar] [CrossRef]
- Continuous Earth Observation of Forest Dynamics and Biodiversity|BibSonomy. Available online: https://www.bibsonomy.org/bibtex/2c7727a181131f4a8275fb6d14f25e94e/nikolas.herbst (accessed on 8 May 2025).
- Pfeifer, C.; Barbosa, A.; Mustafa, O.; Peter, H.-U.; Rümmler, M.-C.; Brenning, A. Using Fixed-Wing UAV for Detecting and Mapping the Distribution and Abundance of Penguins on the South Shetlands Islands, Antarctica. Drones 2019, 3, 39. [Google Scholar] [CrossRef]
- Román, A.; Tovar-Sánchez, A.; Fernández-Marín, B.; Navarro, G.; Barbero, L. Characterization of an Antarctic Penguin Colony Ecosystem Using High-Resolution UAV Hyperspectral Imagery. Int. J. Appl. Earth Obs. Geoinf. 2023, 125, 103565. [Google Scholar] [CrossRef]
- Attard, M.R.G.; Phillips, R.A.; Bowler, E.; Clarke, P.J.; Cubaynes, H.; Johnston, D.W.; Fretwell, P.T. Review of Satellite Remote Sensing and Unoccupied Aircraft Systems for Counting Wildlife on Land. Remote Sens. 2024, 16, 627. [Google Scholar] [CrossRef]
- Wang, D.; Shao, Q.; Yue, H. Surveying Wild Animals from Satellites, Manned Aircraft and Unmanned Aerial Systems (UASs): A Review. Remote Sens. 2019, 11, 1308. [Google Scholar] [CrossRef]
- Vreugdenhil, M.; Wagner, W.; Bauer-Marschallinger, B.; Pfeil, I.; Teubner, I.; Rüdiger, C.; Strauss, P. Sensitivity of Sentinel-1 Backscatter to Vegetation Dynamics: An Austrian Case Study. Remote Sens. 2018, 10, 1396. [Google Scholar] [CrossRef]
- Bousbih, S.; Zribi, M.; Lili-Chabaane, Z.; Baghdadi, N.; El Hajj, M.; Gao, Q.; Mougenot, B. Potential of Sentinel-1 Radar Data for the Assessment of Soil and Cereal Cover Parameters. Sensors 2017, 17, 2617. [Google Scholar] [CrossRef]
- Marino, A. A Notch Filter for Ship Detection With Polarimetric SAR Data. IEEE J. Sel. Top. Appl. Earth Obs. Remote Sens. 2013, 6, 1219–1232. [Google Scholar] [CrossRef]
- Trathan, P.N.; Wienecke, B.; Fleming, A.; Ireland, L. Using Telemetry Data and the Sea Ice Satellite Record to Identify Vulnerabilities in Critical Moult Habitat for Emperor Penguins in West Antarctica. Polar Biol. 2024, 47, 533–547. [Google Scholar] [CrossRef]
- Buchelt, S.; Skov, K.; Rasmussen, K.K.; Ullmann, T. Sentinel-1 Time Series for Mapping Snow Cover Depletion and Timing of Snowmelt in Arctic Periglacial Environments: Case Study from Zackenberg and Kobbefjord, Greenland. Cryosphere 2022, 16, 625–646. [Google Scholar] [CrossRef]
- Nagler, T.; Rott, H.; Ripper, E.; Bippus, G.; Hetzenecker, M. Advancements for Snowmelt Monitoring by Means of Sentinel-1 SAR. Remote Sens. 2016, 8, 348. [Google Scholar] [CrossRef]
- He, G.; Feng, X.; Xiao, P.; Xia, Z.; Wang, Z.; Chen, H.; Li, H.; Guo, J. Dry and Wet Snow Cover Mapping in Mountain Areas Using SAR and Optical Remote Sensing Data. IEEE J. Sel. Top. Appl. Earth Obs. Remote Sens. 2017, 10, 2575–2588. [Google Scholar] [CrossRef]
- Mérmoz, S.; Réjou-Méchain, M.; Villard, L.; Toan, T.; Rossi, V.; Gourlet-Fleury, S. Decrease of L-Band SAR Backscatter with Biomass of Dense Forests. Remote Sens. Environ. 2015, 159, 307–317. [Google Scholar] [CrossRef]
- Niculescu, S.; Billey, A.; Talab-Ou-Ali, H. Random Forest Classification Using Sentinel-1 and Sentinel-2 Series for Vegetation Monitoring in the Pays de Brest (France). In Proceedings of the SPIE Remote Sensing, Berlin, Germany, 9 October 2018; Volume 10783. [Google Scholar] [CrossRef]
- Corbeil-Robitaille, M.-Z.; Duchesne, É.; Fortier, D.; Kinnard, C.; Bêty, J. Linking Geomorphological Processes and Wildlife Microhabitat Selection: Nesting Birds Select Refuges Generated by Permafrost Degradation in the Arctic. Biogeosciences 2024, 21, 3401–3423. [Google Scholar] [CrossRef]
- Janga, B.; Asamani, G.P.; Sun, Z.; Cristea, N. A Review of Practical AI for Remote Sensing in Earth Sciences. Remote Sens. 2023, 15, 4112. [Google Scholar] [CrossRef]
- Gevaert, C.M. Explainable AI for Earth Observation: A Review Including Societal and Regulatory Perspectives. Int. J. Appl. Earth Obs. Geoinf. 2022, 112, 102869. [Google Scholar] [CrossRef]
- Gonçalves, B.C.; Wethington, M.; Lynch, H.J. SealNet 2.0: Human-Level Fully-Automated Pack-Ice Seal Detection in Very-High-Resolution Satellite Imagery with CNN Model Ensembles. Remote Sens. 2022, 14, 5655. [Google Scholar] [CrossRef]
- Kölzsch, A.; Davidson, S.C.; Gauggel, D.; Hahn, C.; Hirt, J.; Kays, R.; Lang, I.; Lohr, A.; Russell, B.; Scharf, A.K.; et al. MoveApps: A Serverless No-Code Analysis Platform for Animal Tracking Data. Mov. Ecol. 2022, 10, 30. [Google Scholar] [CrossRef]
- Kays, R.; Crofoot, M.C.; Jetz, W.; Wikelski, M. Terrestrial Animal Tracking as an Eye on Life and Planet. Science 2015, 348, aaa2478. [Google Scholar] [CrossRef]
- Mizrahy-Rewald, O.; Winkler, N.; Amann, F.; Neugebauer, K.; Voelkl, B.; Grogger, H.A.; Ruf, T.; Fritz, J. The Impact of Shape and Attachment Position of Biologging Devices in Northern Bald Ibises. Anim. Biotelemetry 2023, 11, 8. [Google Scholar] [CrossRef]


Disclaimer/Publisher’s Note: The statements, opinions and data contained in all publications are solely those of the individual author(s) and contributor(s) and not of MDPI and/or the editor(s). MDPI and/or the editor(s) disclaim responsibility for any injury to people or property resulting from any ideas, methods, instructions or products referred to in the content. |
© 2025 by the authors. Licensee MDPI, Basel, Switzerland. This article is an open access article distributed under the terms and conditions of the Creative Commons Attribution (CC BY) license (https://creativecommons.org/licenses/by/4.0/).