Author Contributions
G.Z.: Conceptualization, Writing of the original draft, Methodology, Project administration and funding acquisition. Y.L.: Conceptualization, Writing of the original draft, Methodology, Formal analysis and data curation. Z.C.: Conceptualization, Writing—original draft, Methodology, Investigation and Project administration. Z.X.: Data curation, Validation, Writing, review and editing. Y.Y.: Data curation, Writing, review and editing. S.W.: Data curation, writing, review, and editing. W.L.: Data curation and Validation. H.X.: Data curation and Validation. Z.D.: Writing, review, and editing. R.W.: Writing, review, and editing. All authors have read and agreed to the published version of the manuscript.
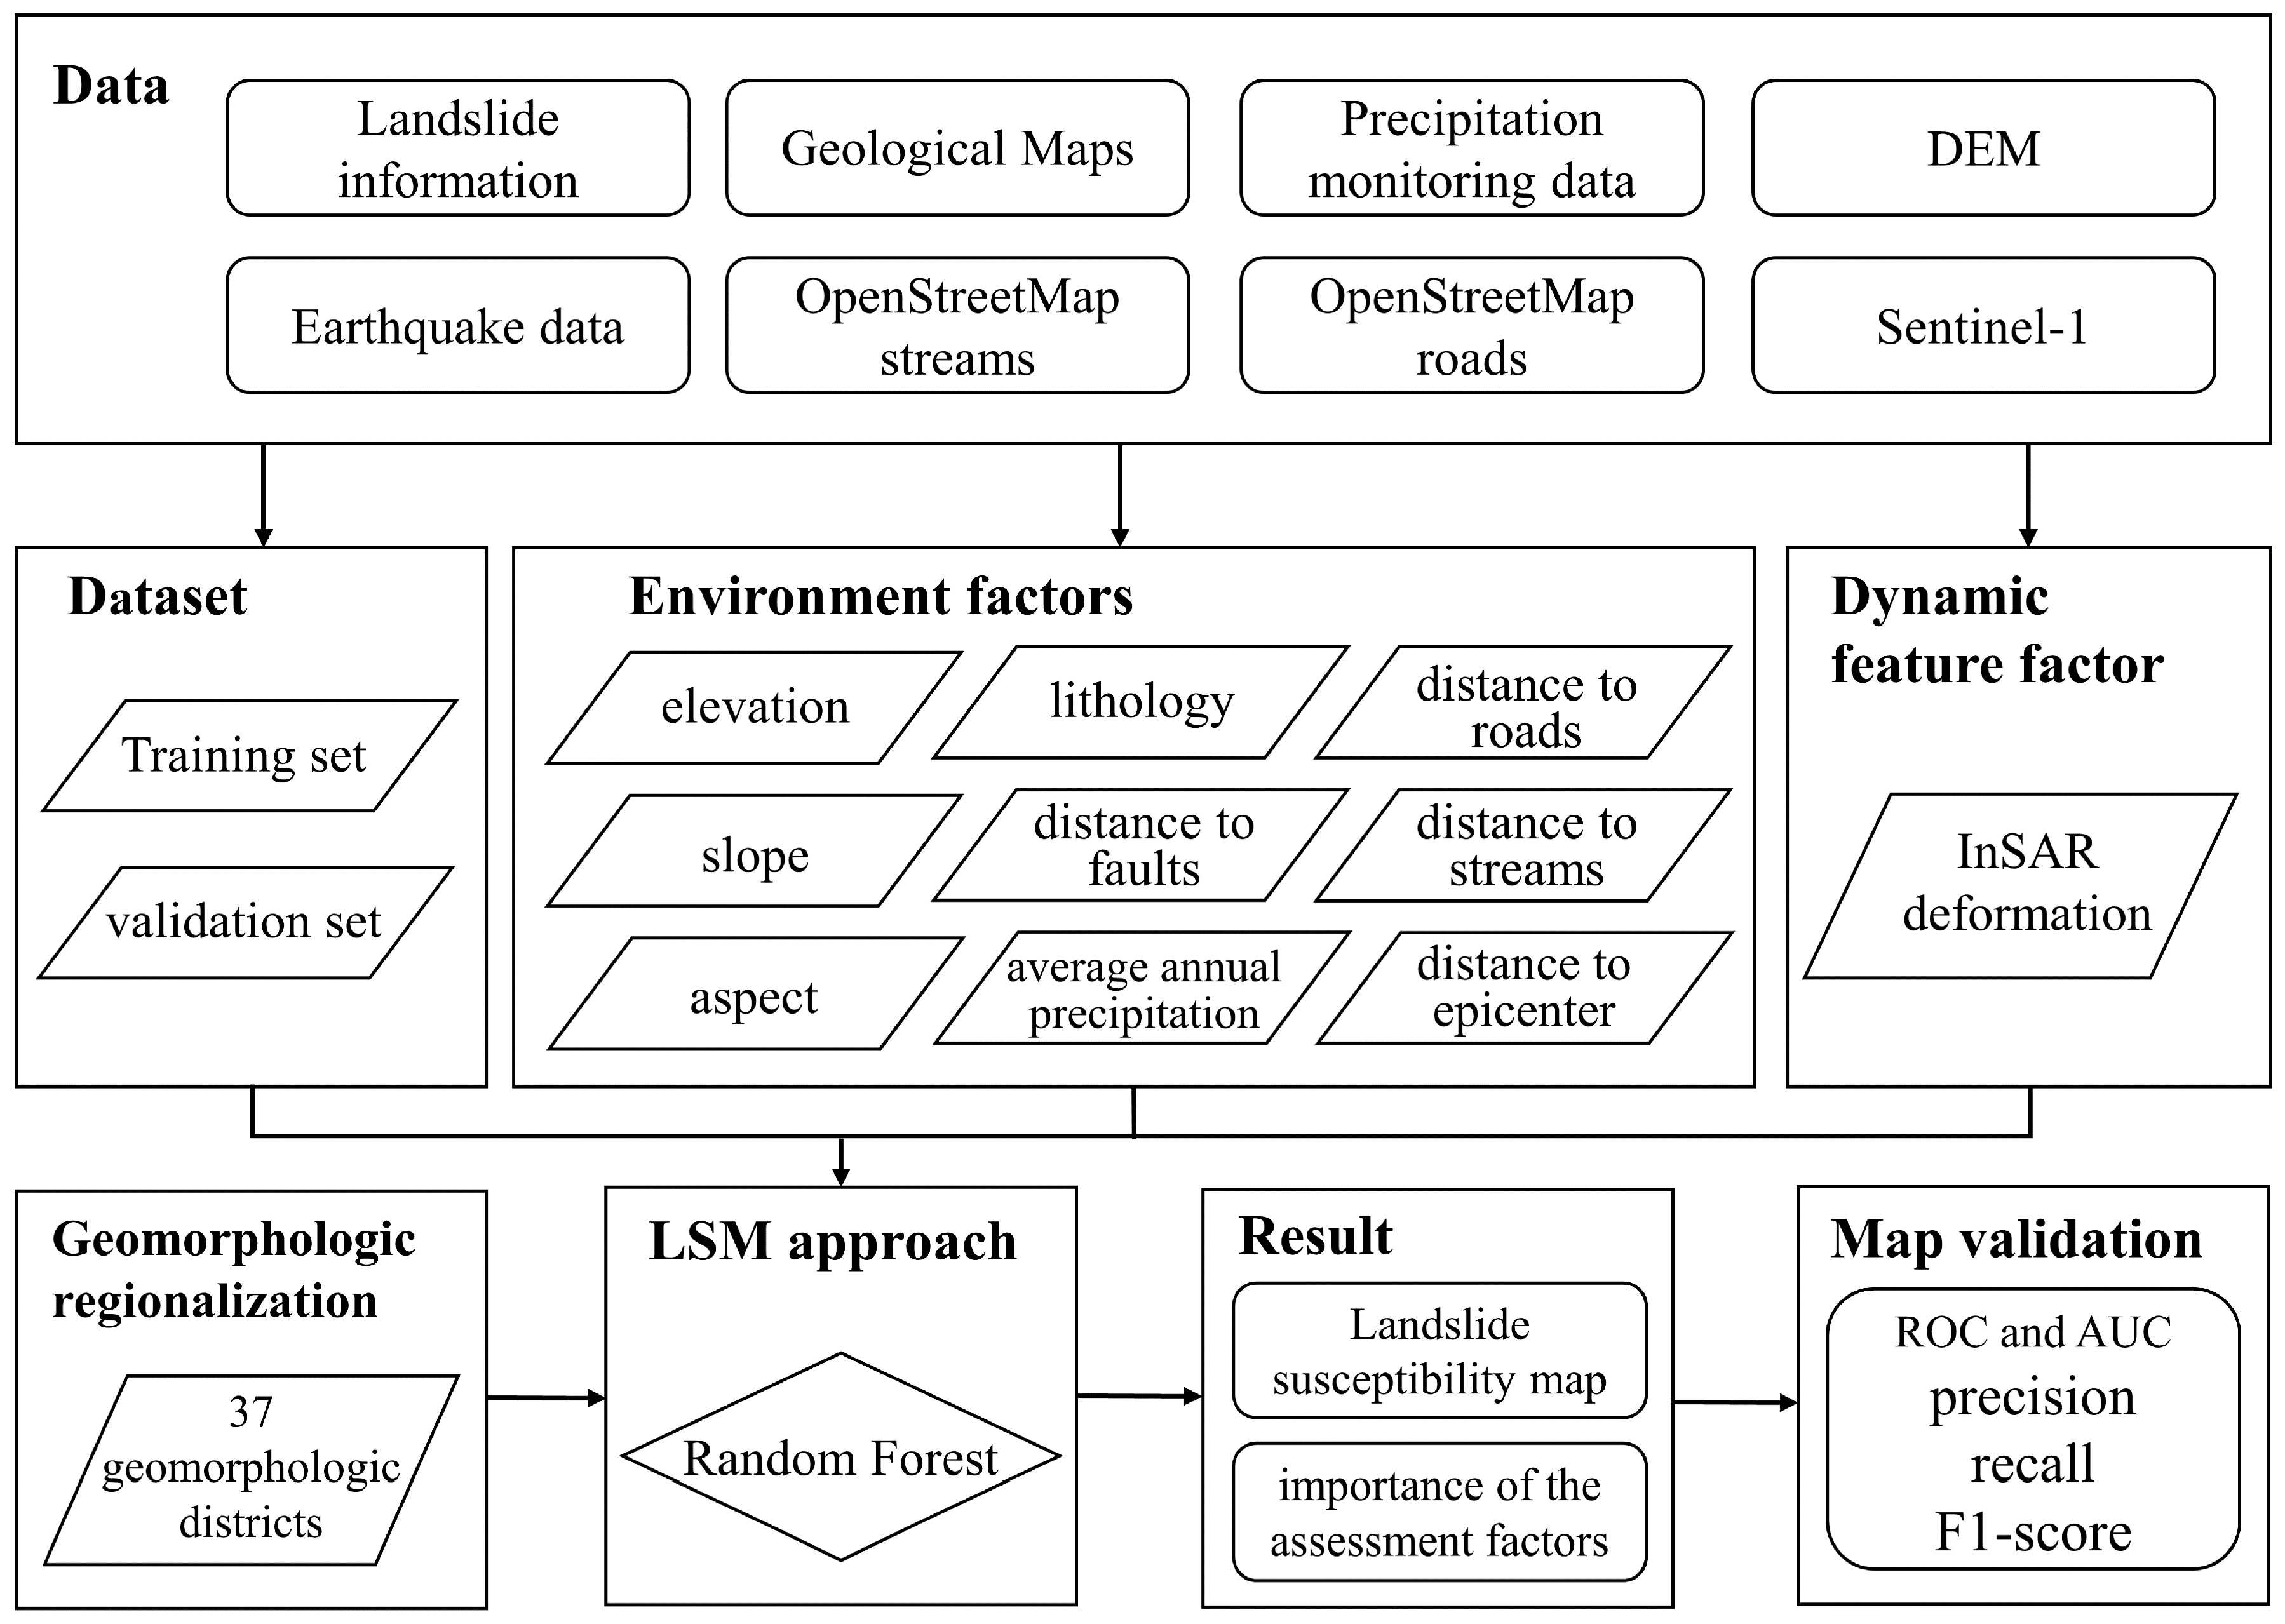
Figure 1.
Schematic flow chart of the research.
Figure 1.
Schematic flow chart of the research.
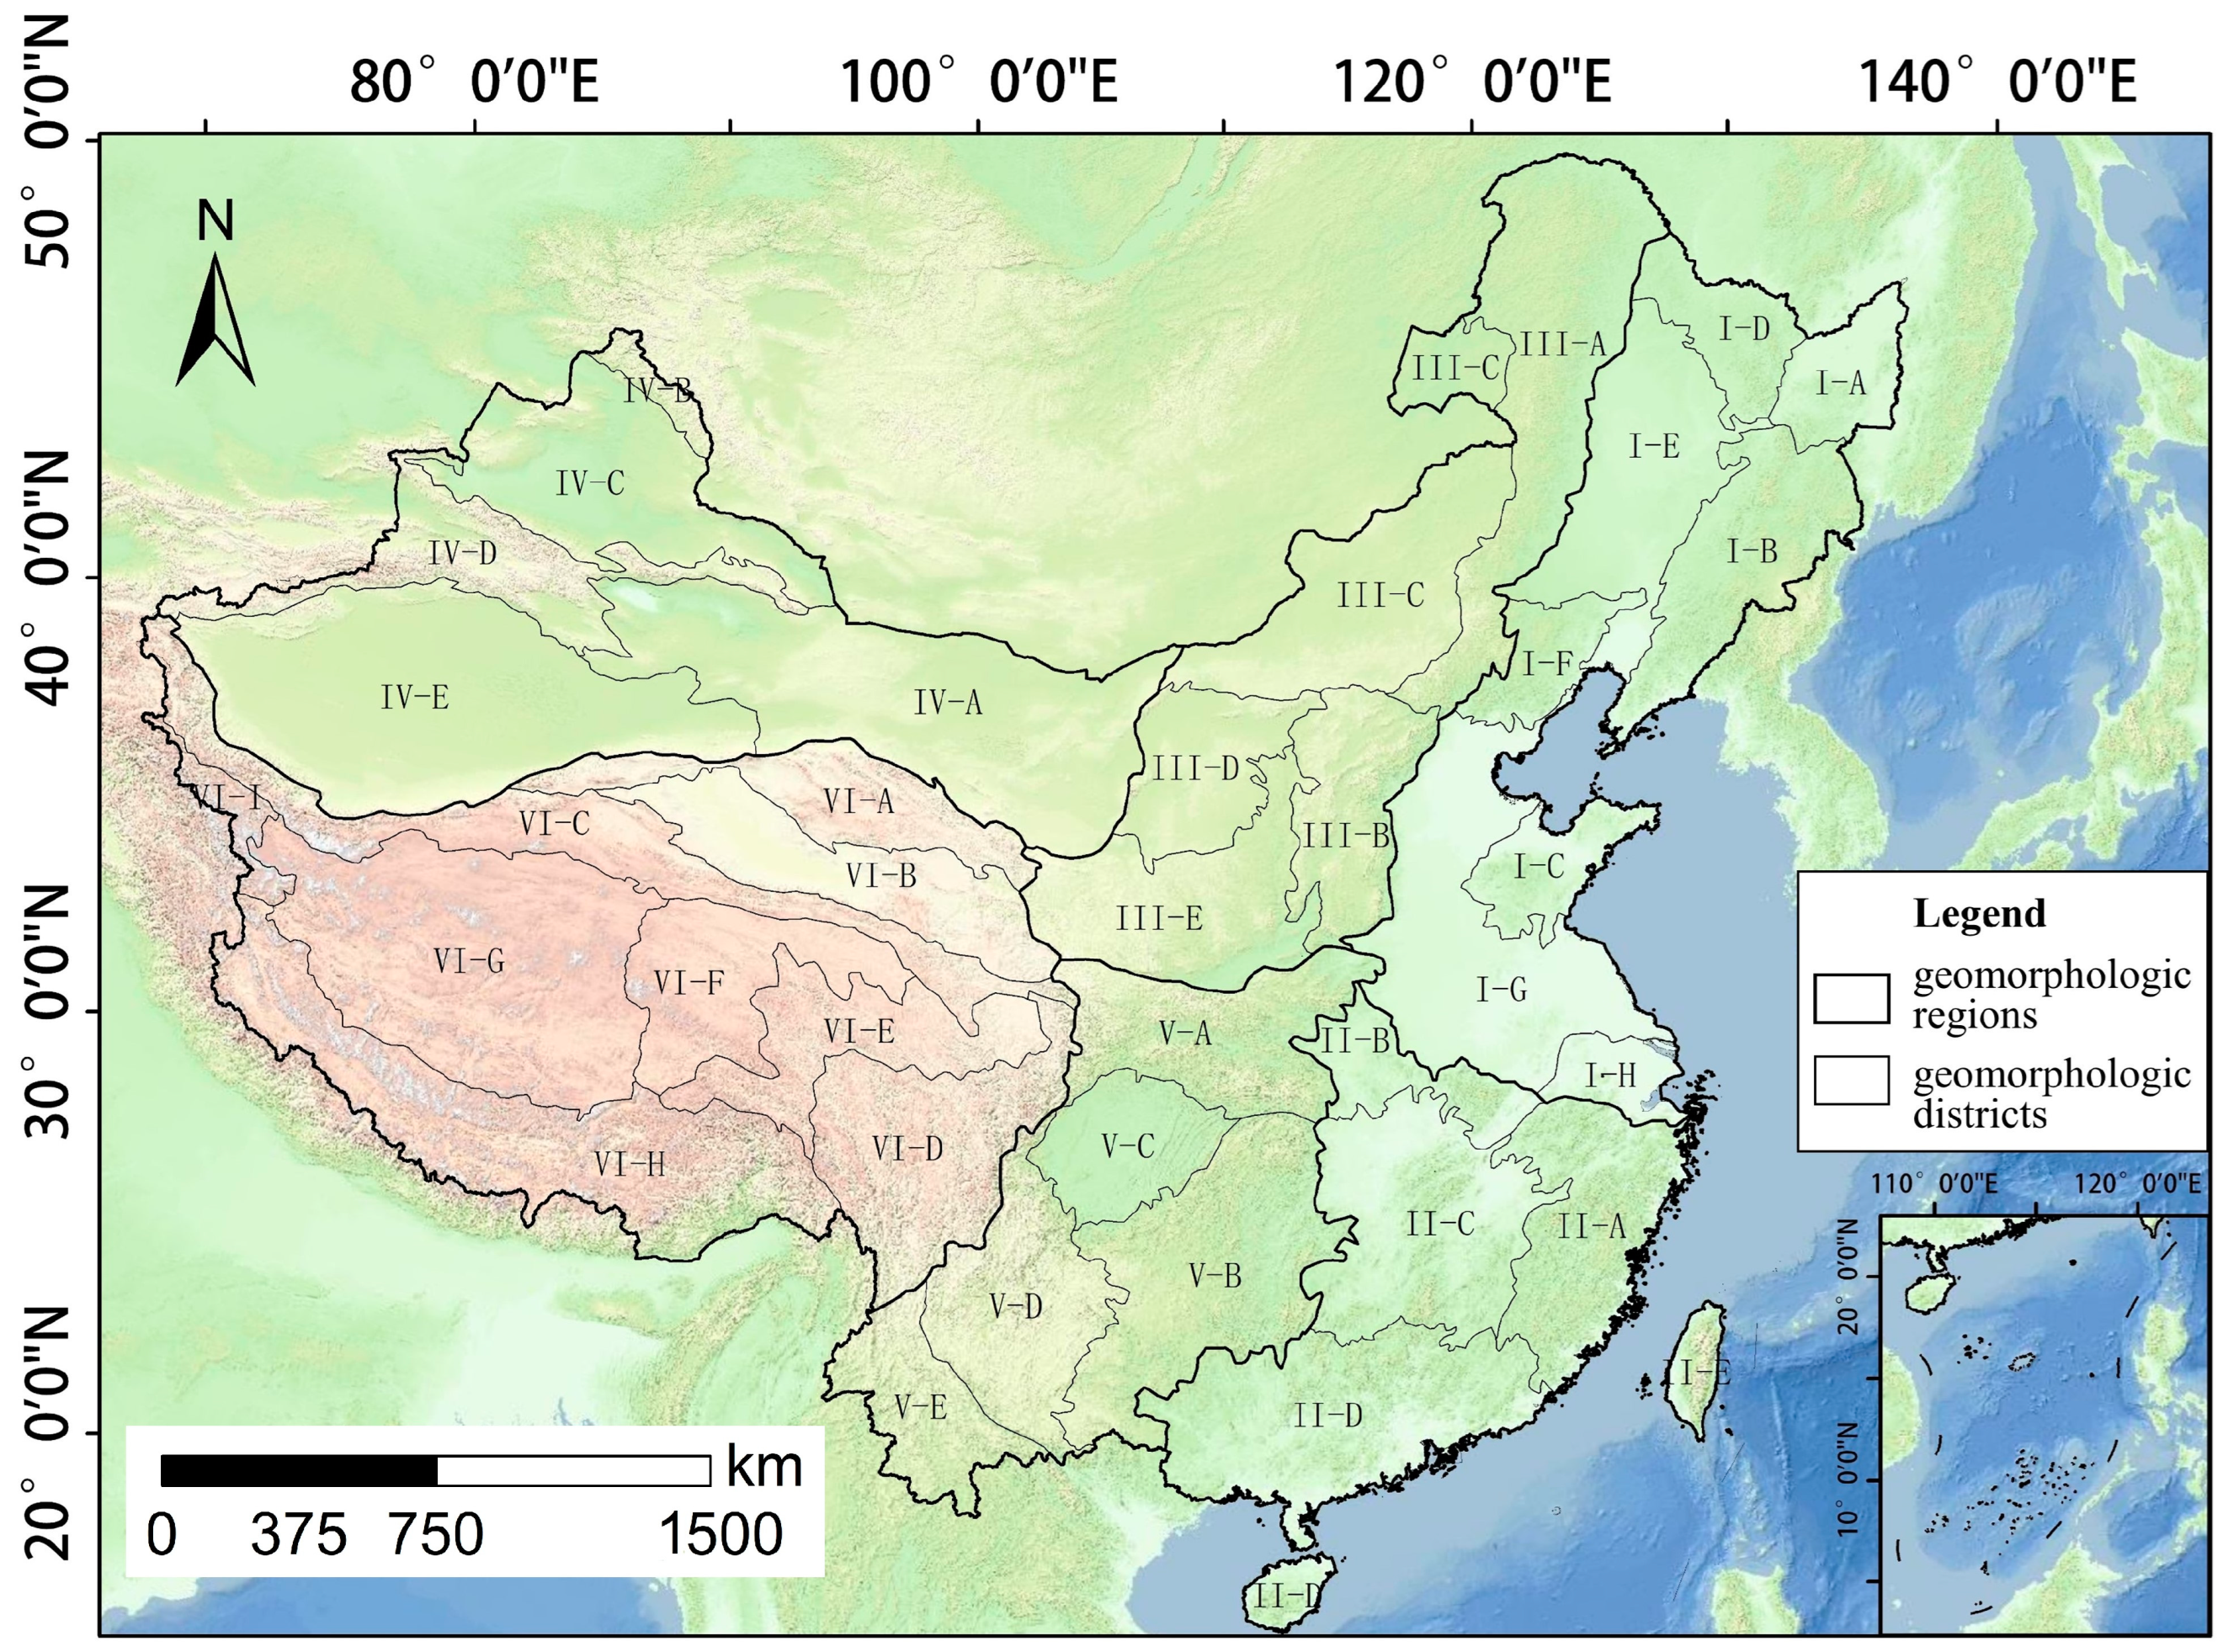
Figure 2.
Geomorphological regionalization of China.
Figure 2.
Geomorphological regionalization of China.
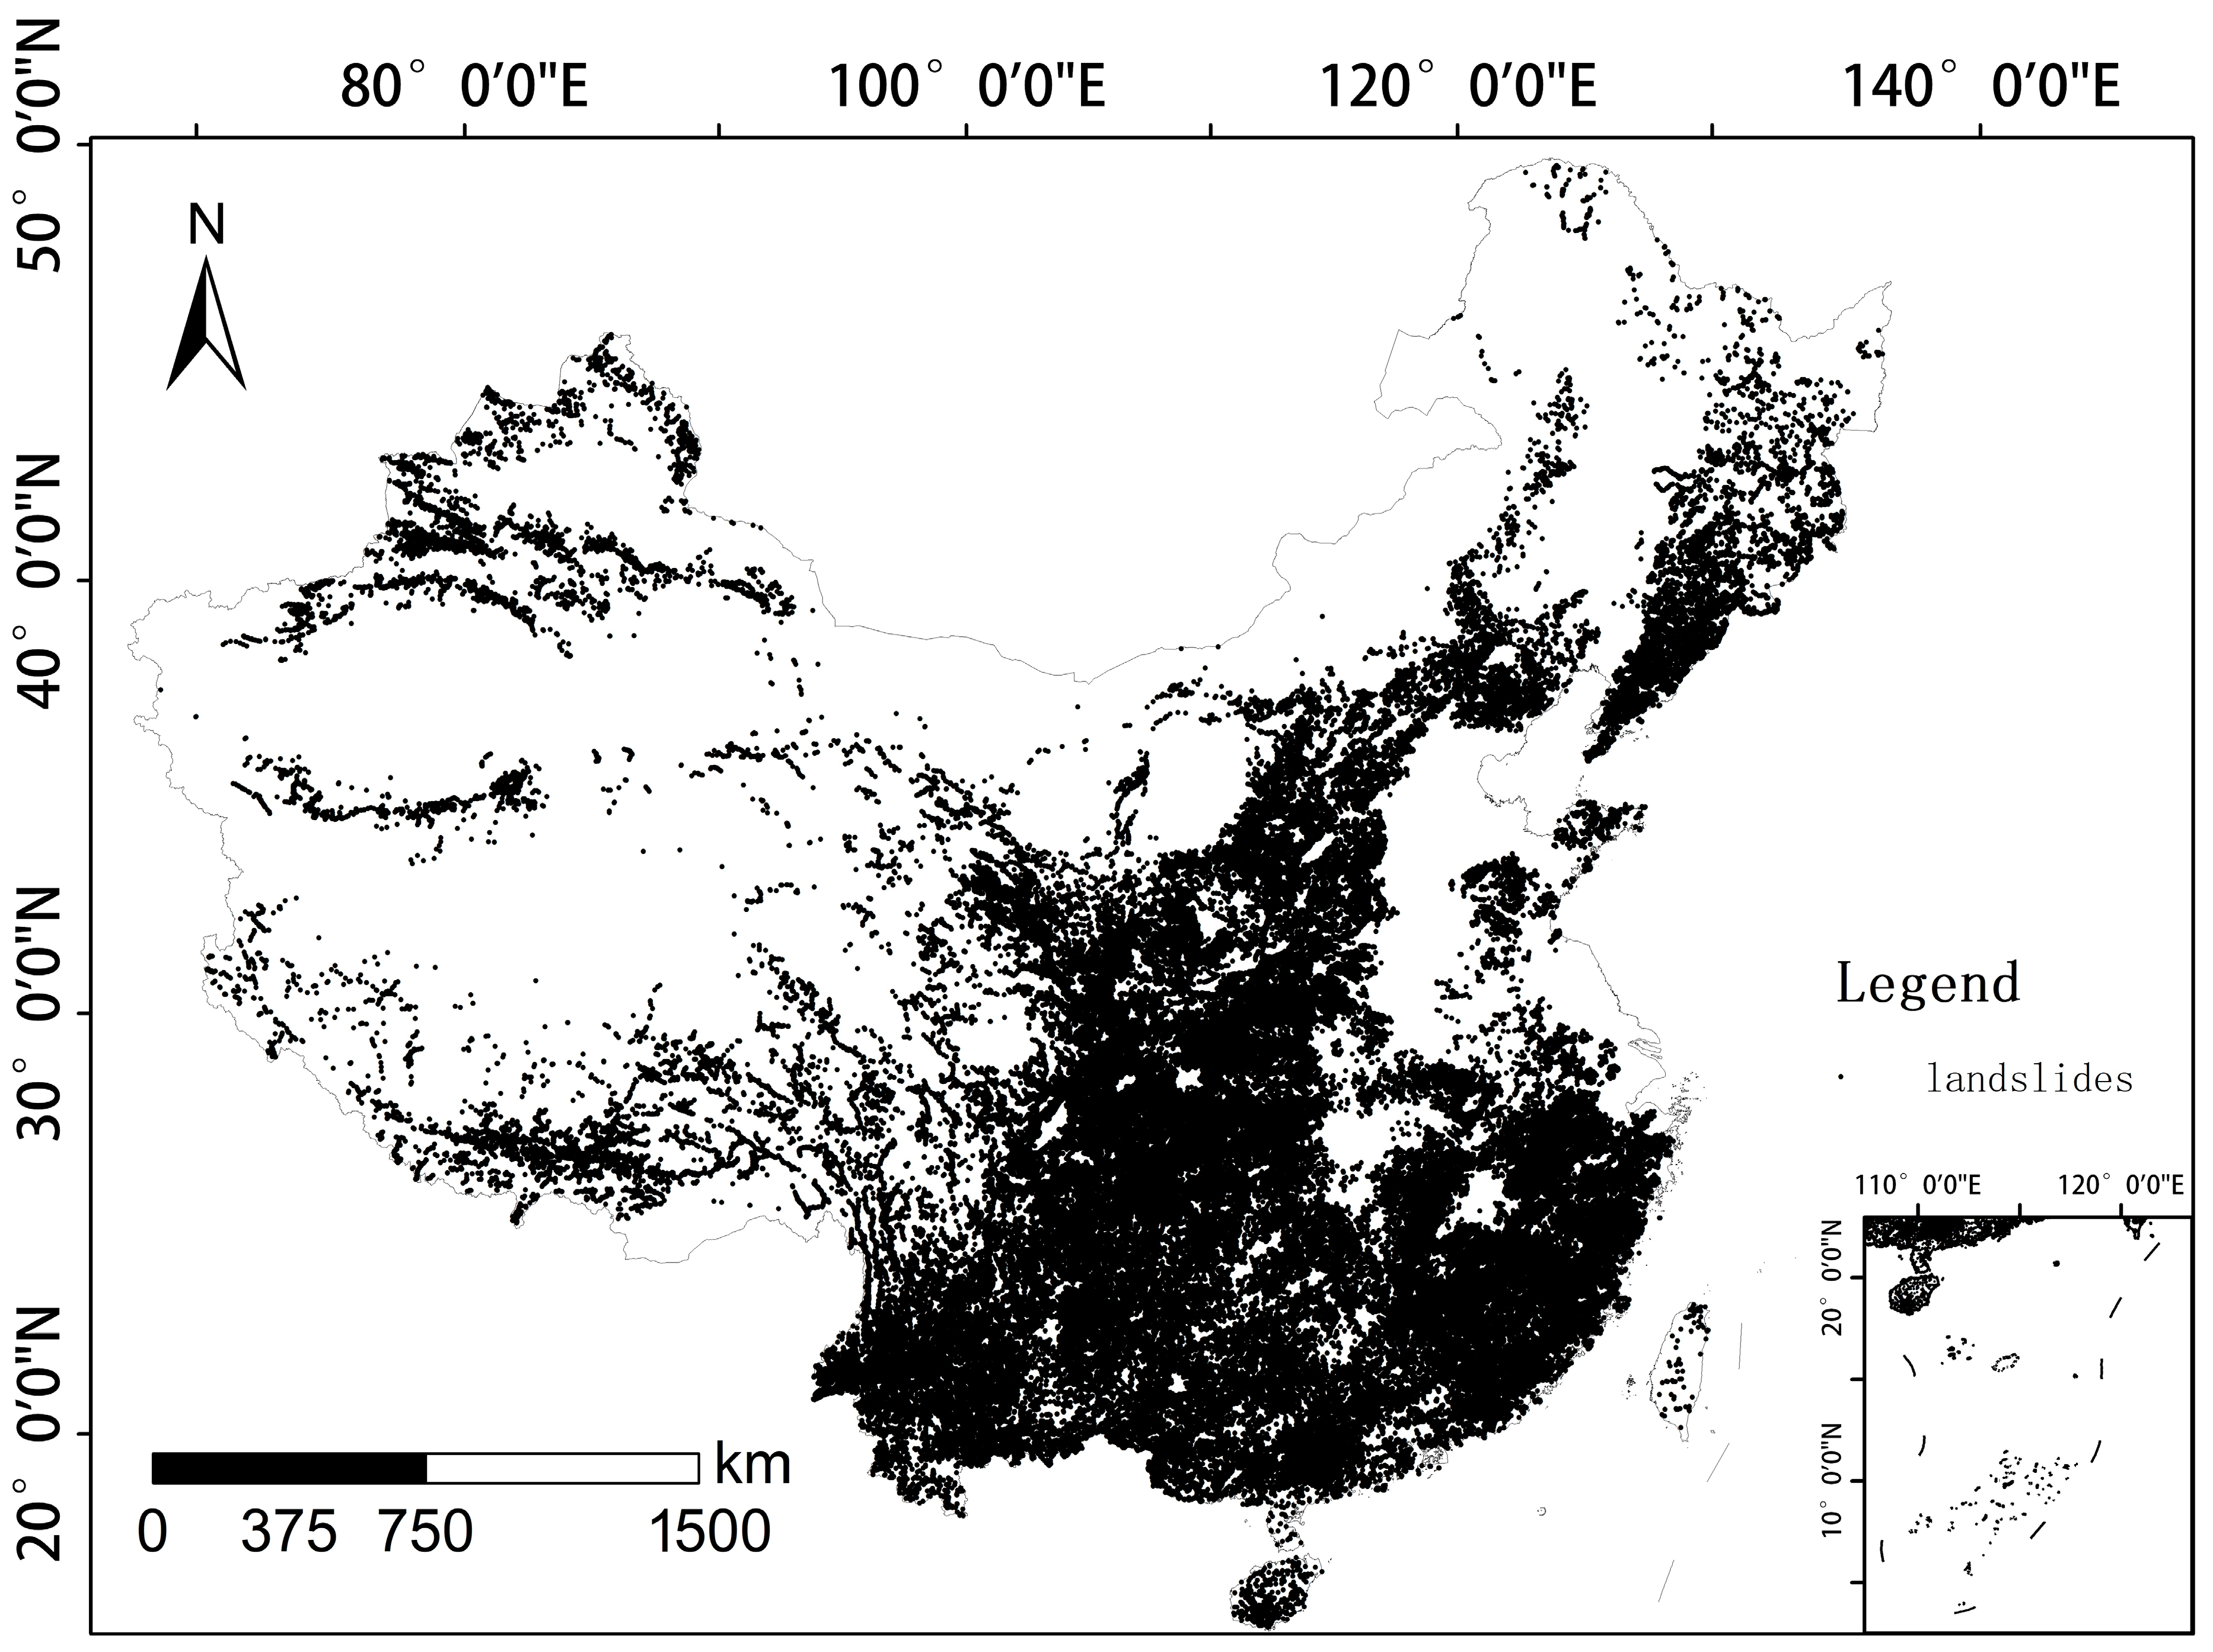
Figure 3.
Landslide distribution map of China.
Figure 3.
Landslide distribution map of China.
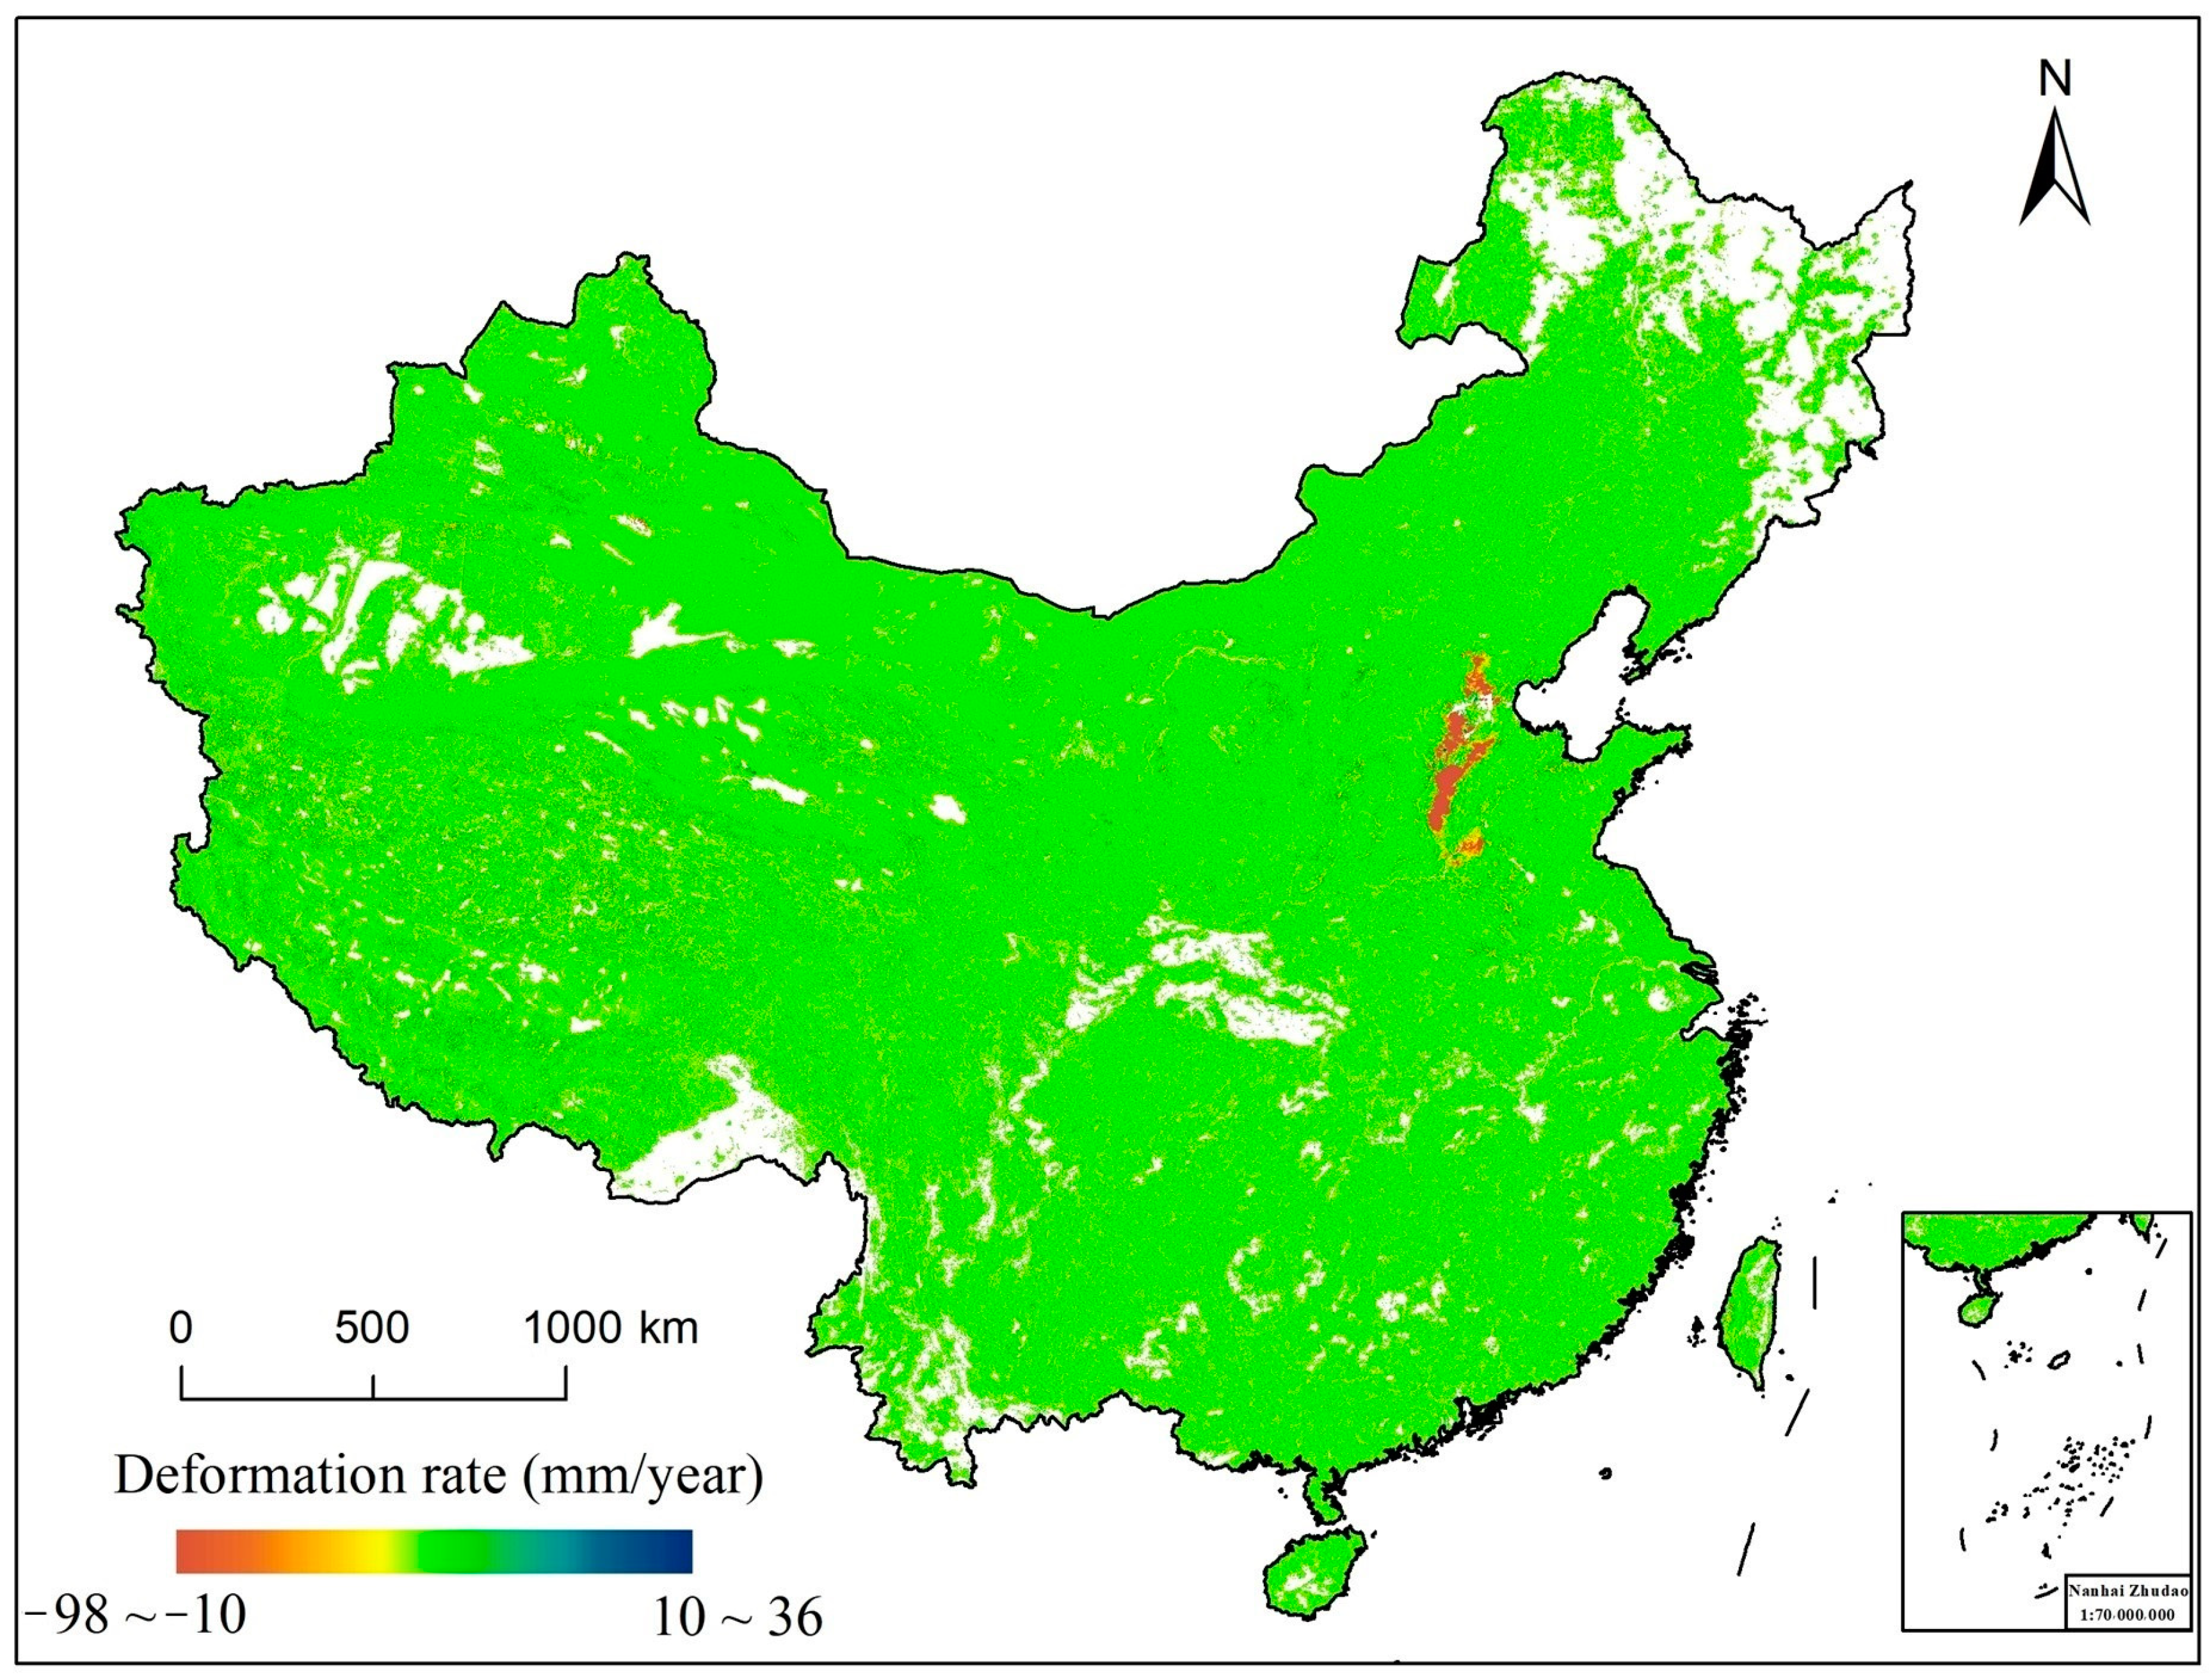
Figure 4.
Map of ground deformation rate of China.
Figure 4.
Map of ground deformation rate of China.
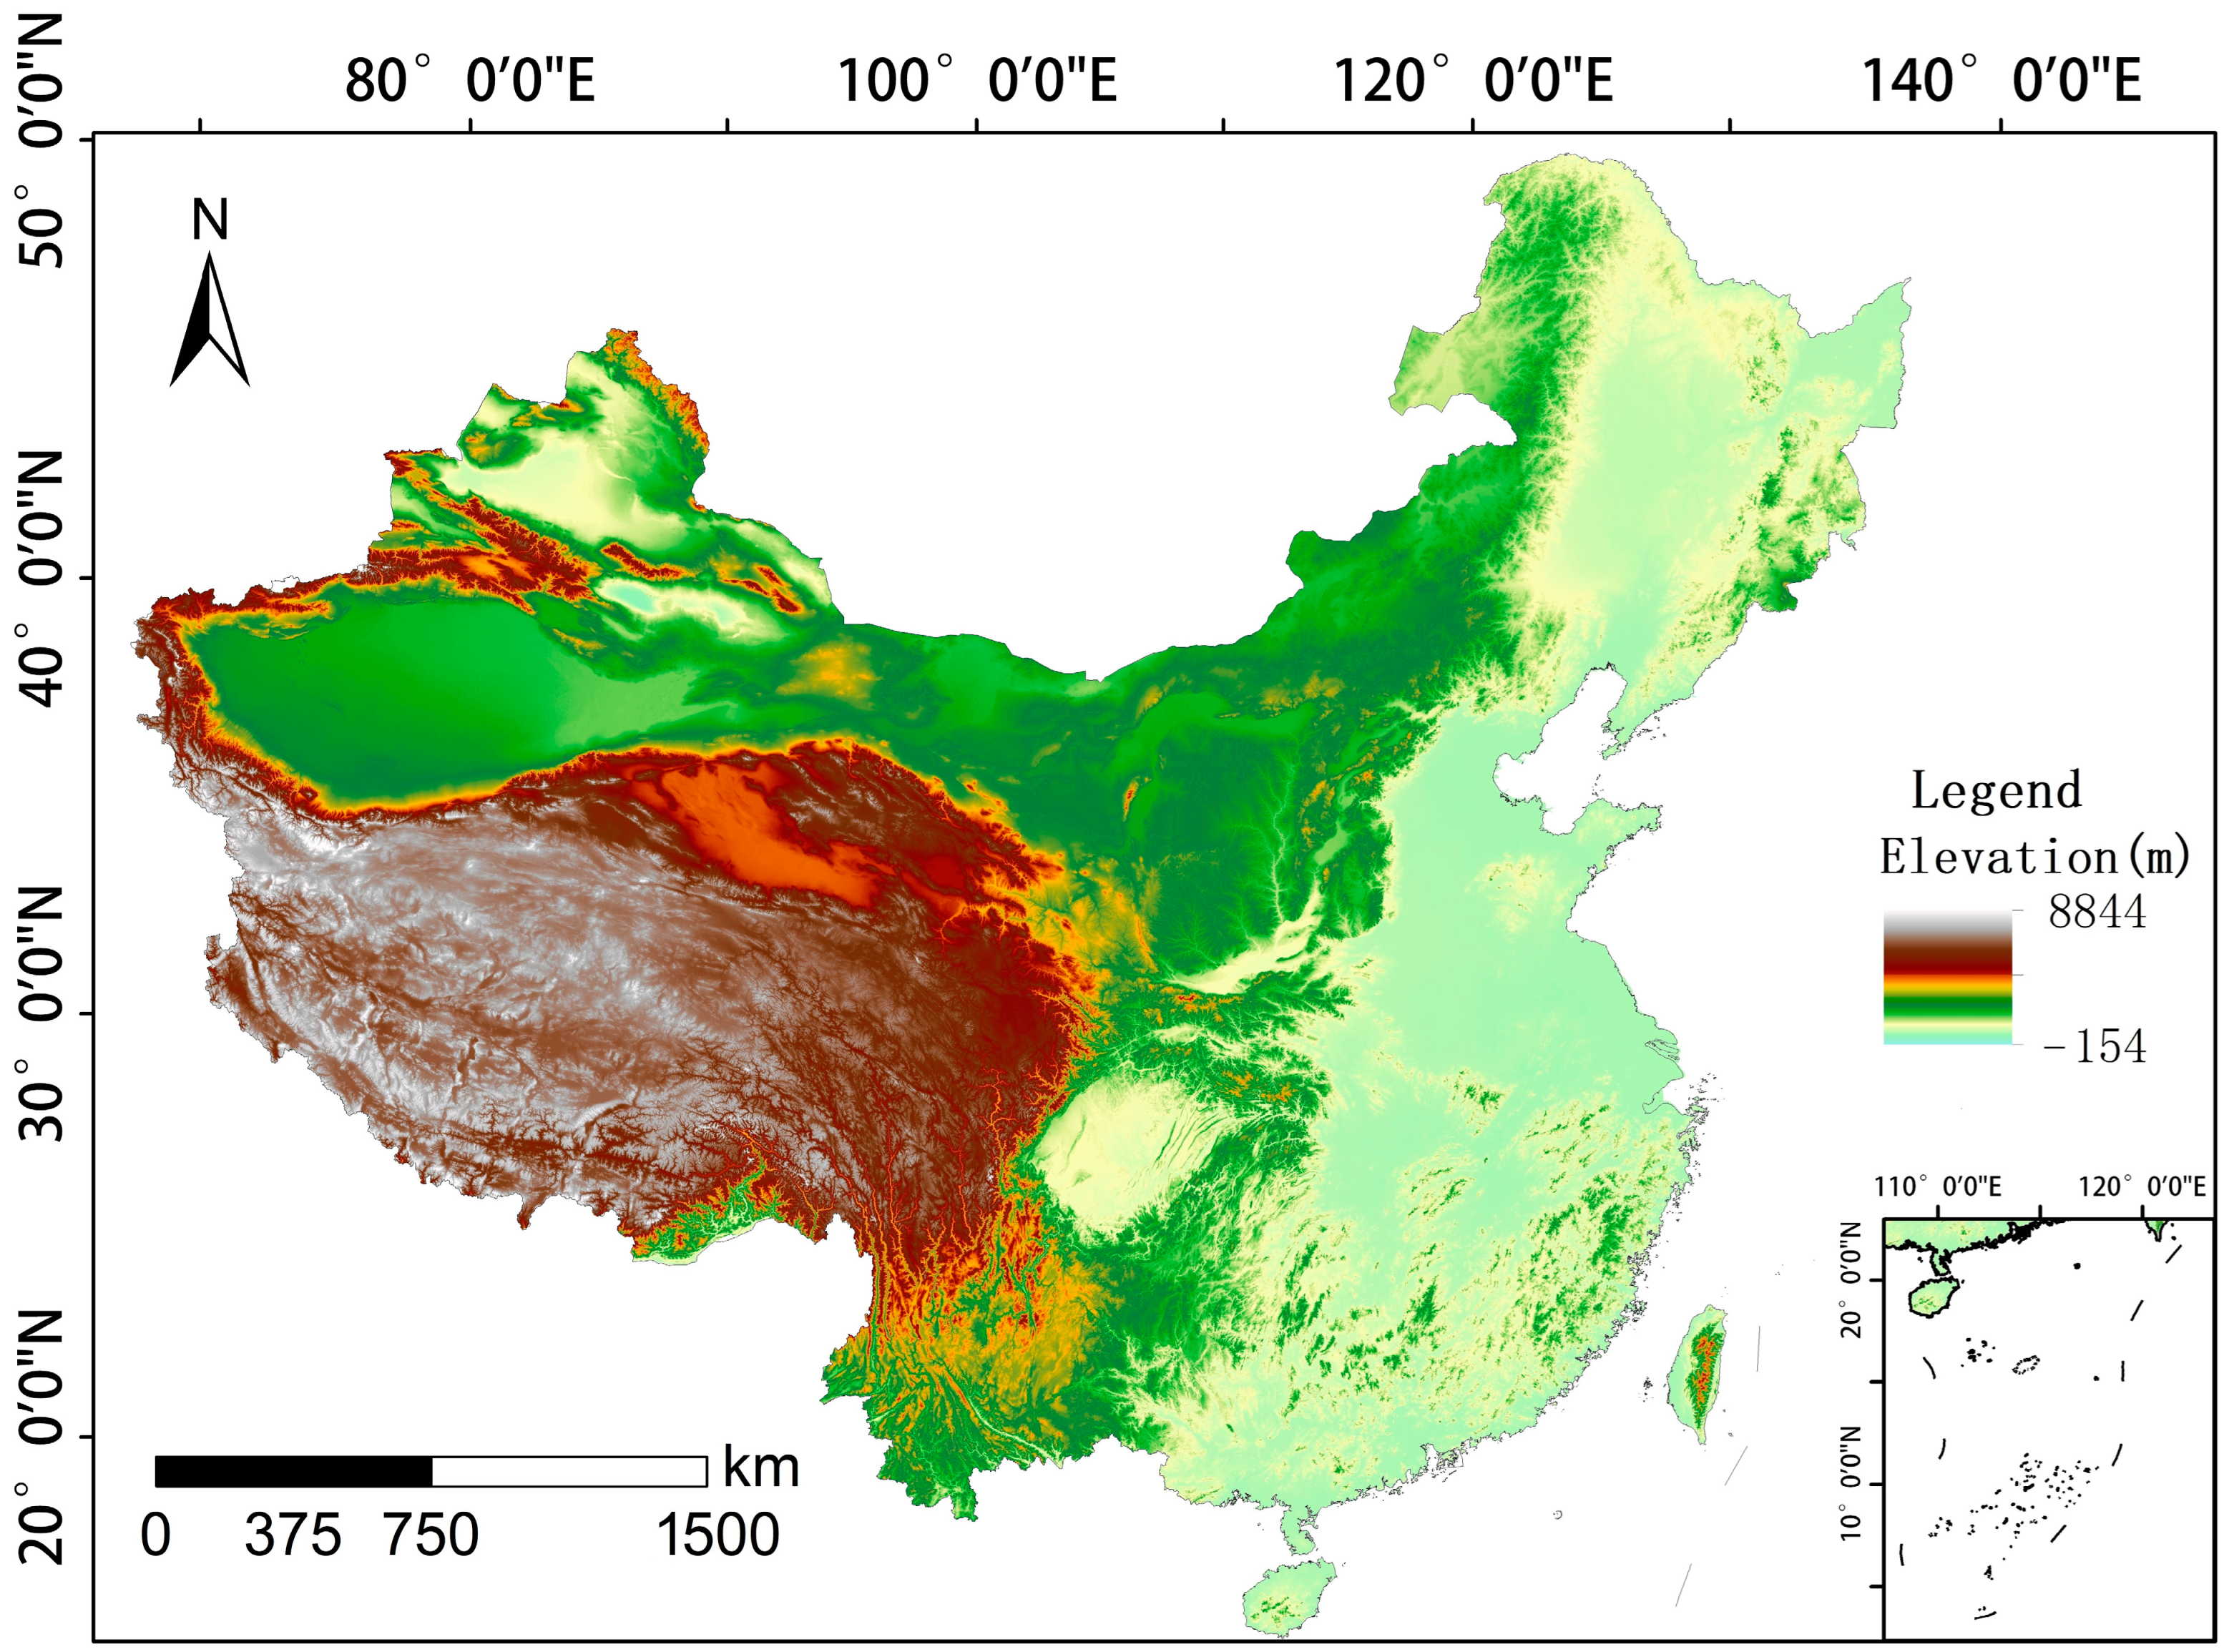
Figure 5.
Elevation map of China.
Figure 5.
Elevation map of China.
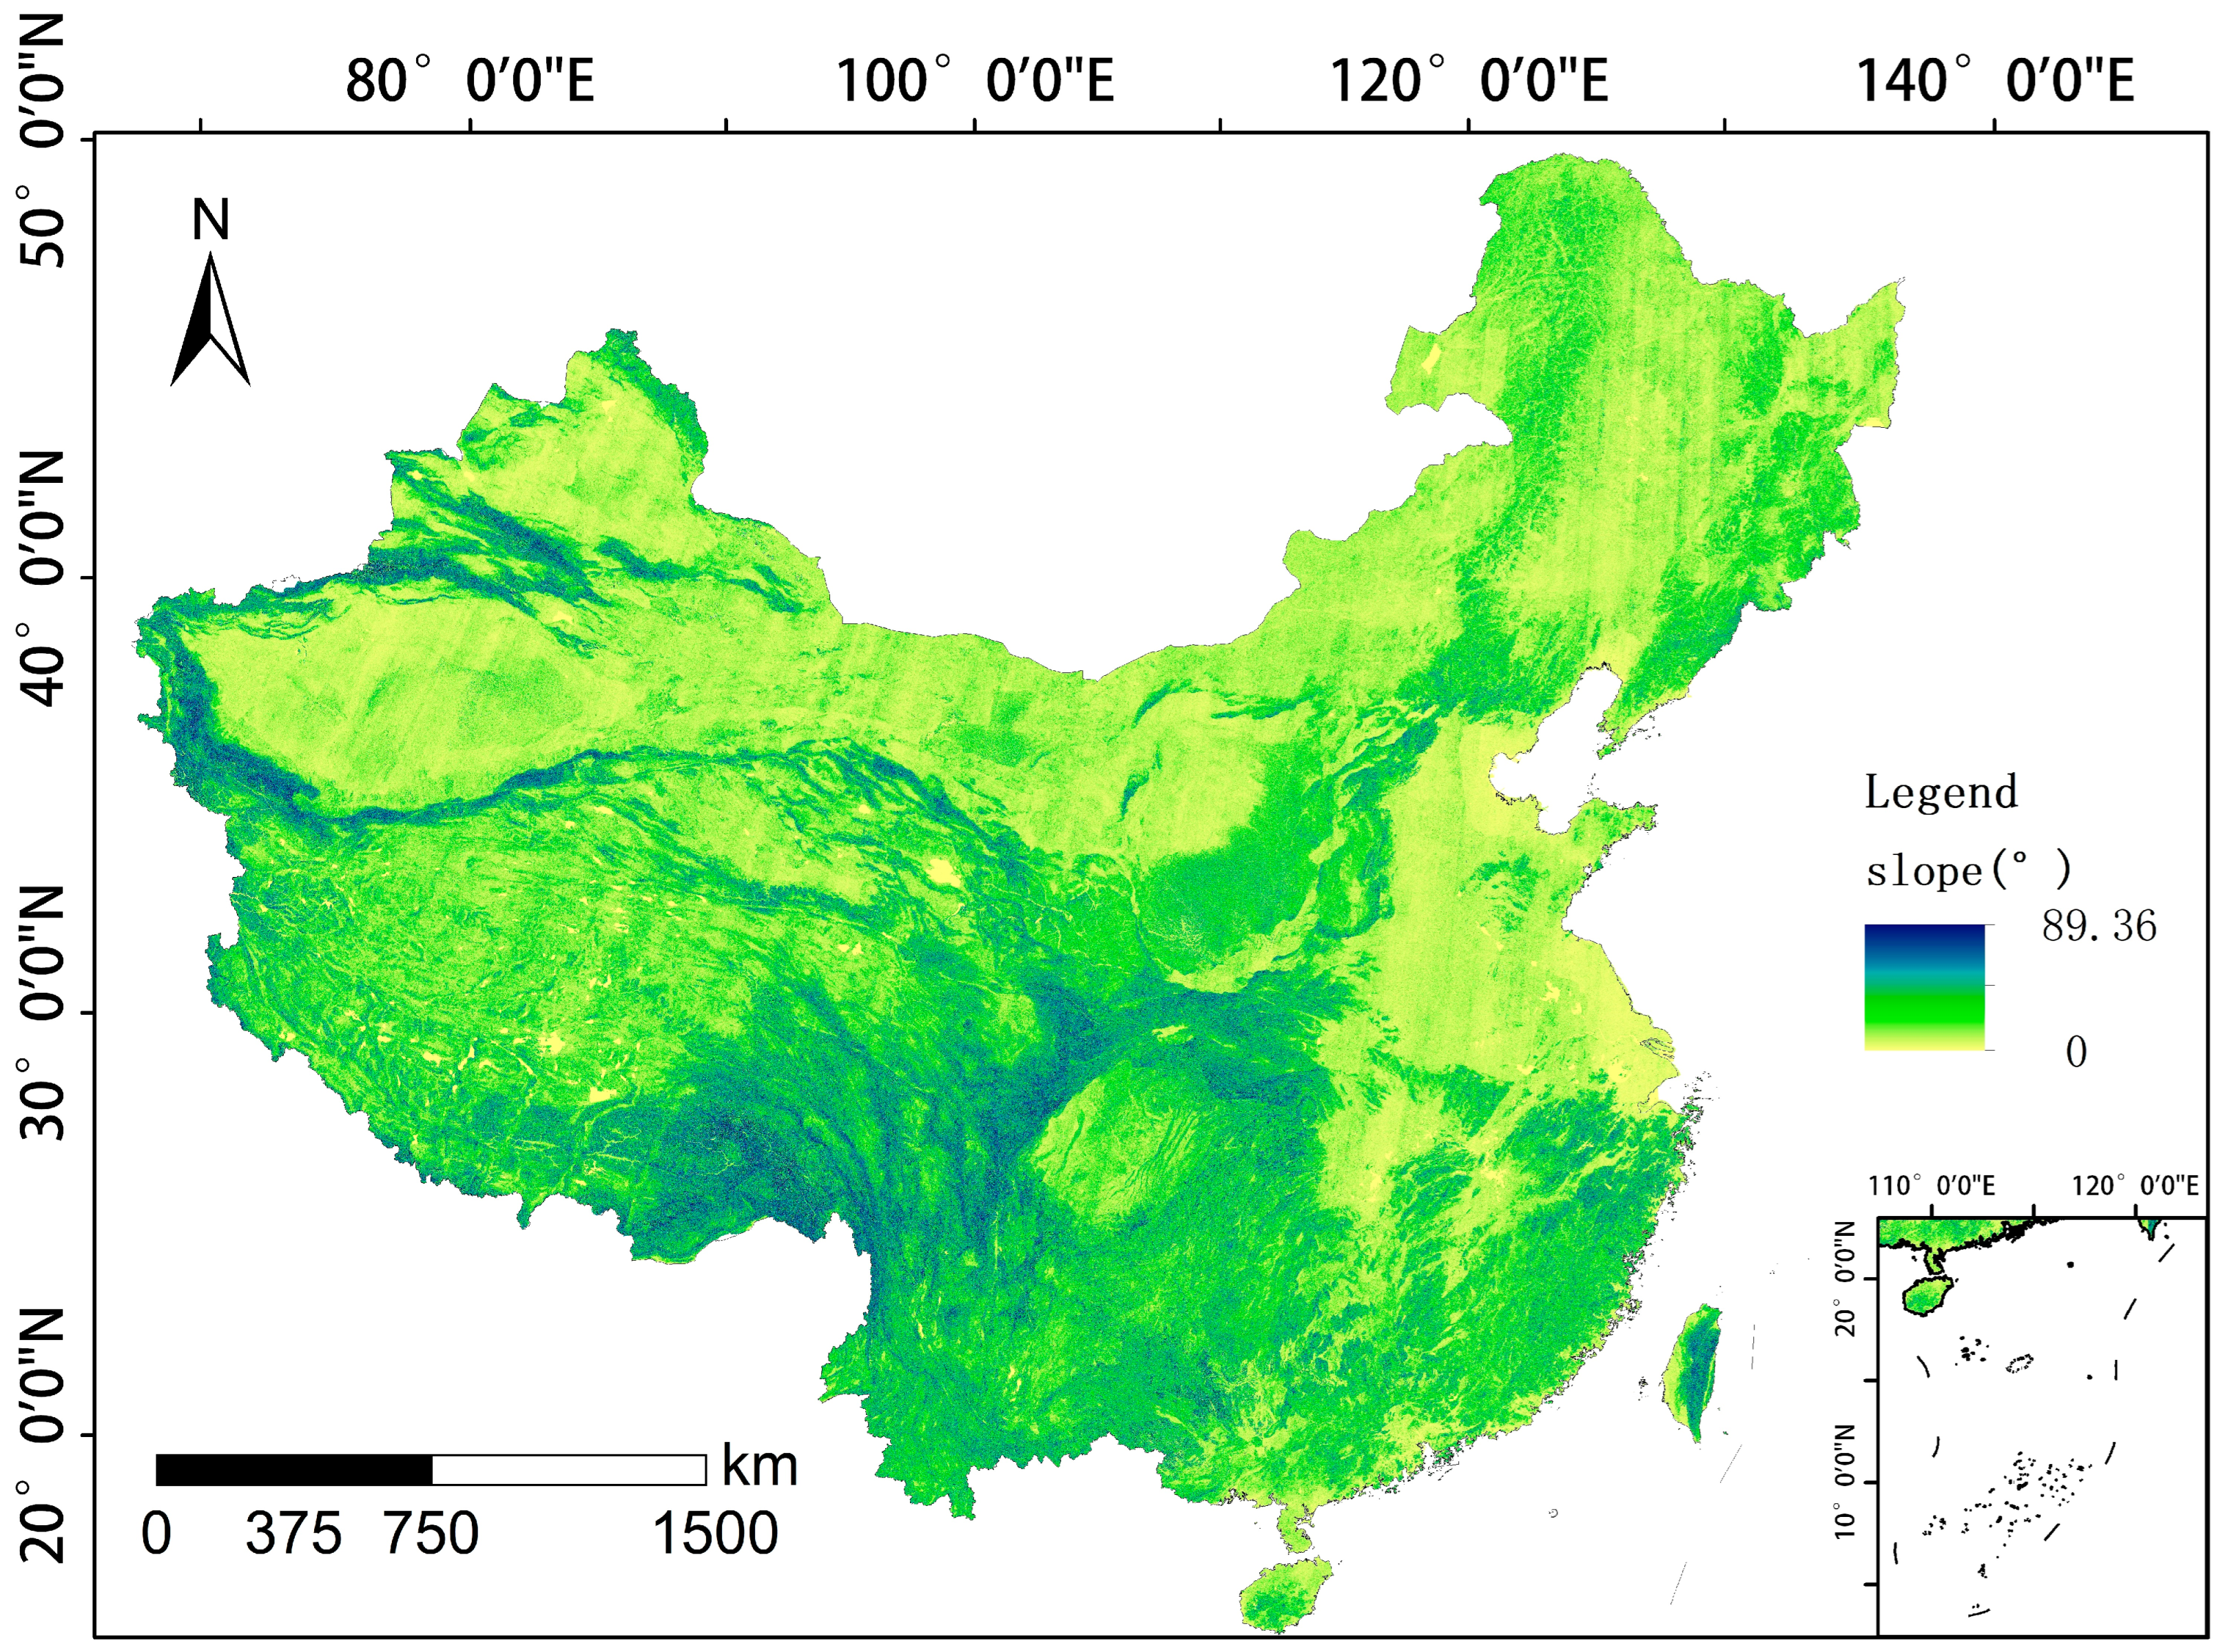
Figure 6.
Slope map of China.
Figure 6.
Slope map of China.
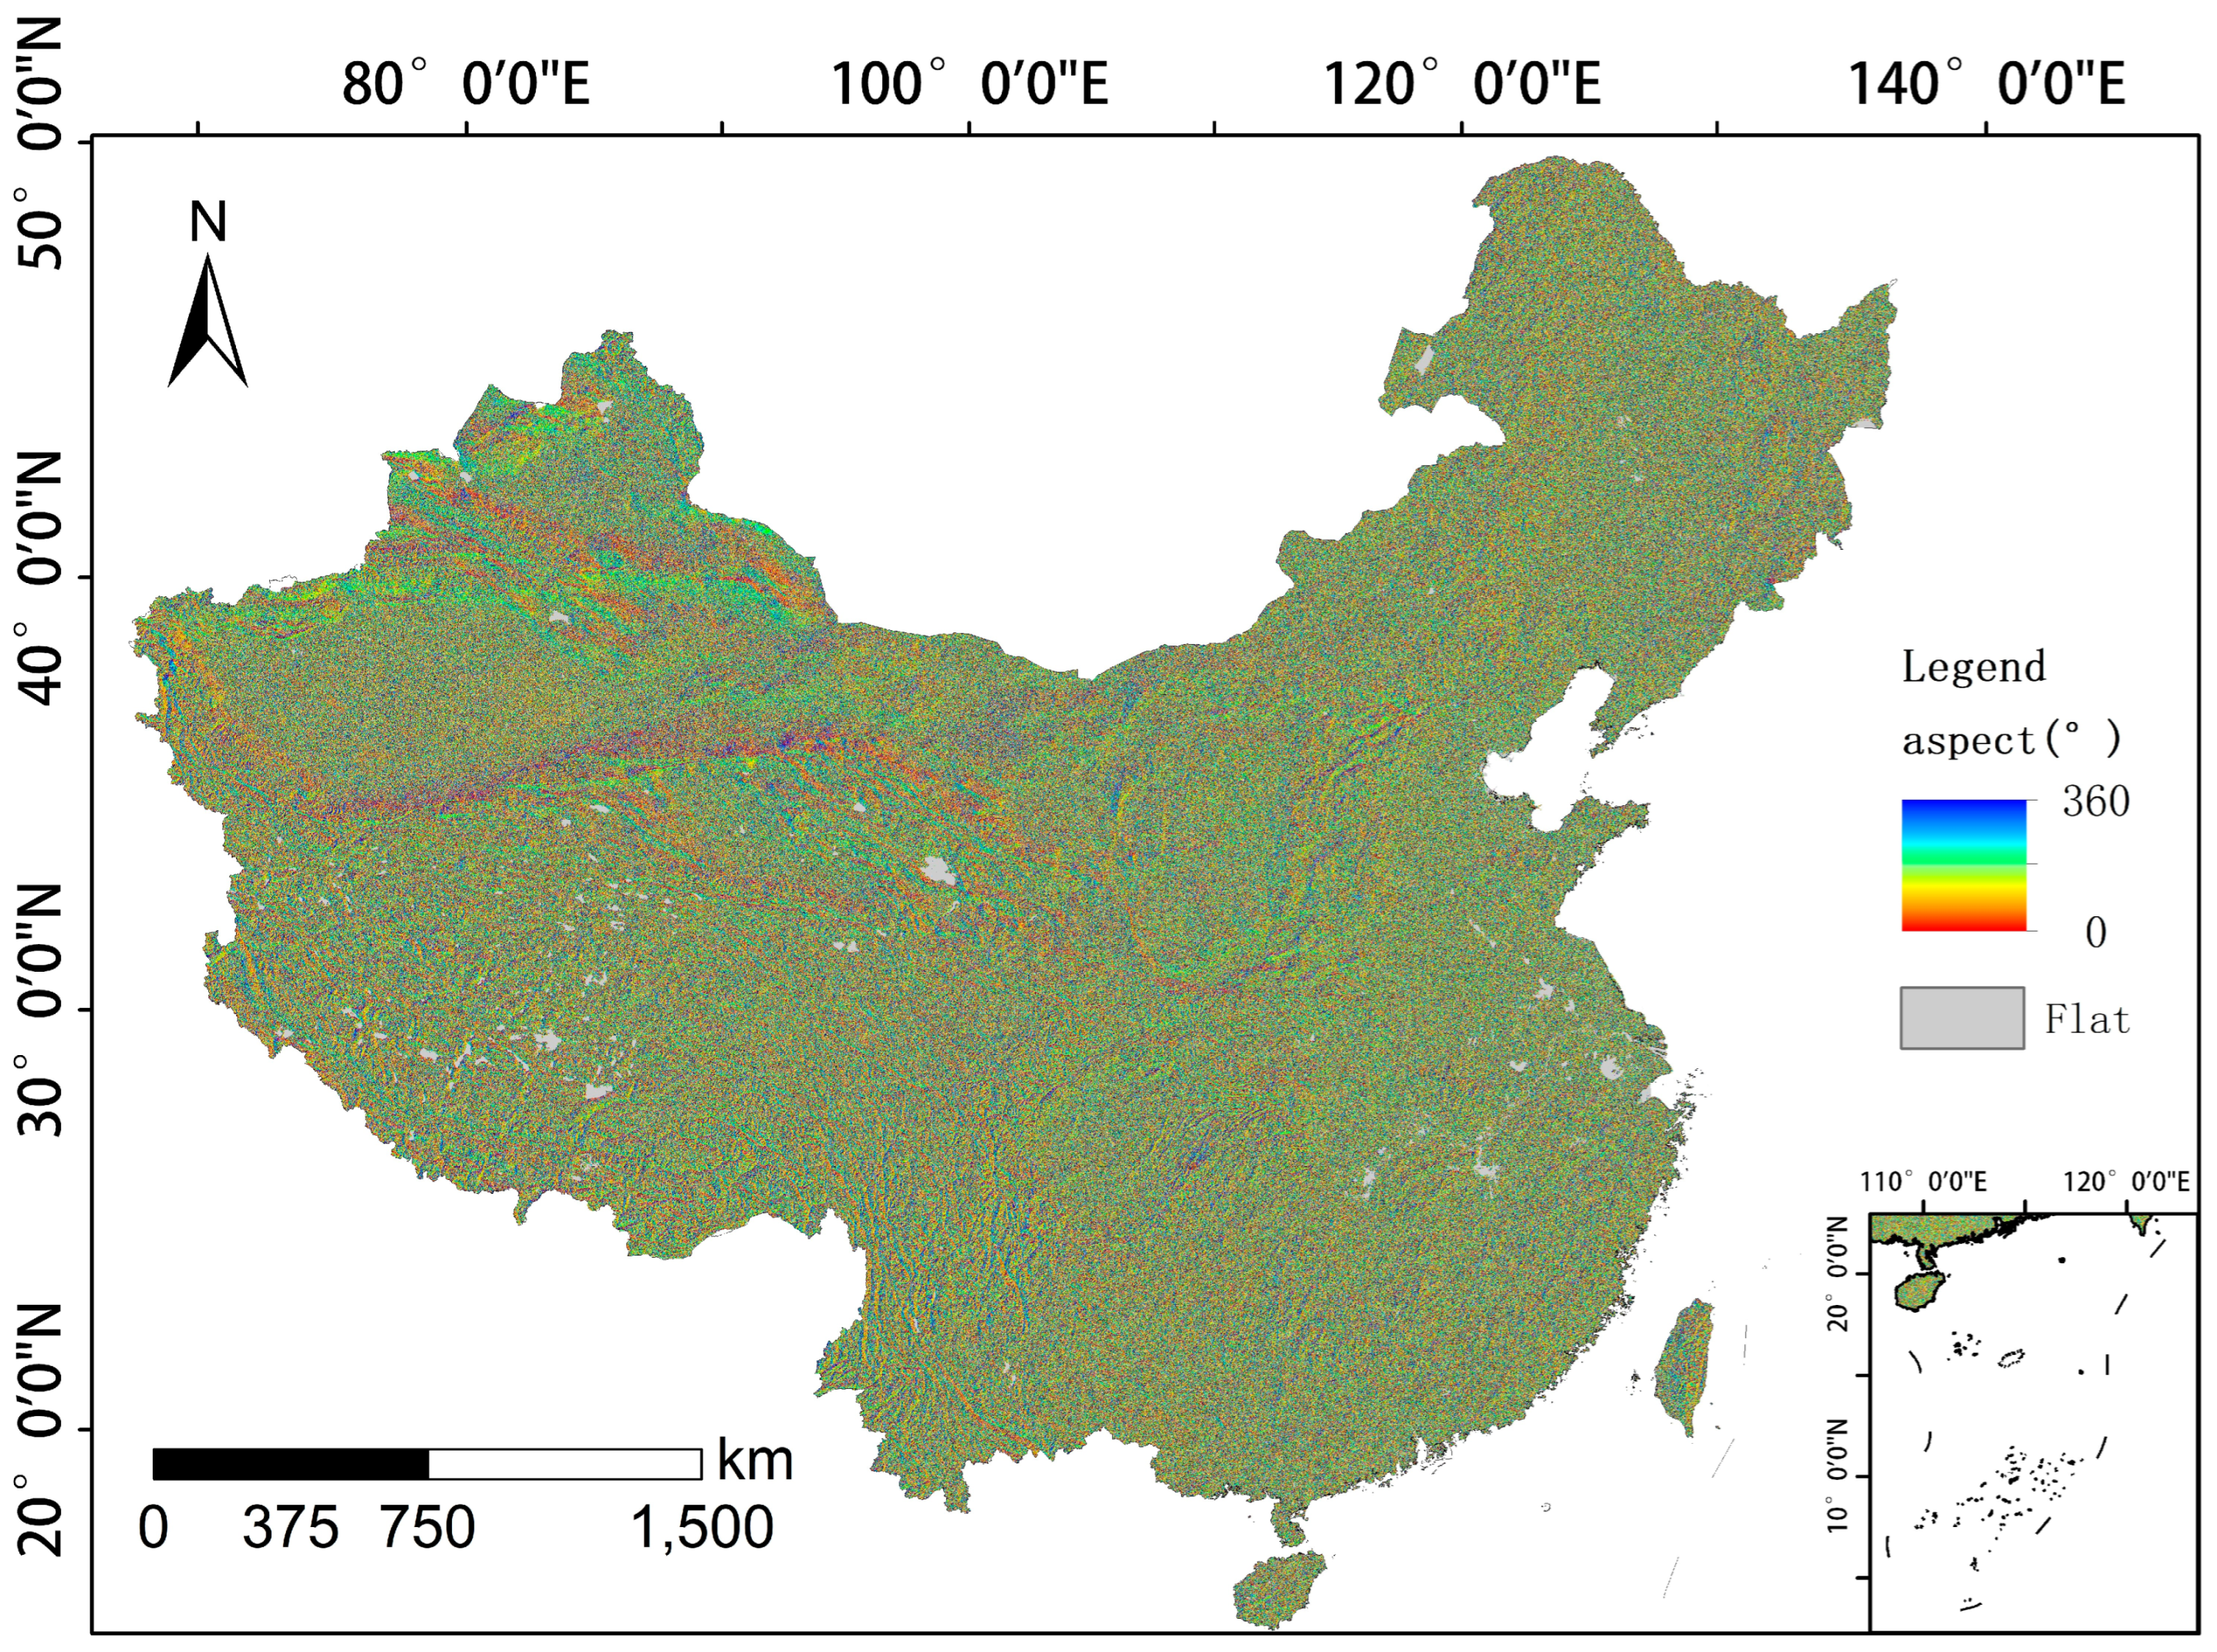
Figure 7.
Aspect map of China.
Figure 7.
Aspect map of China.
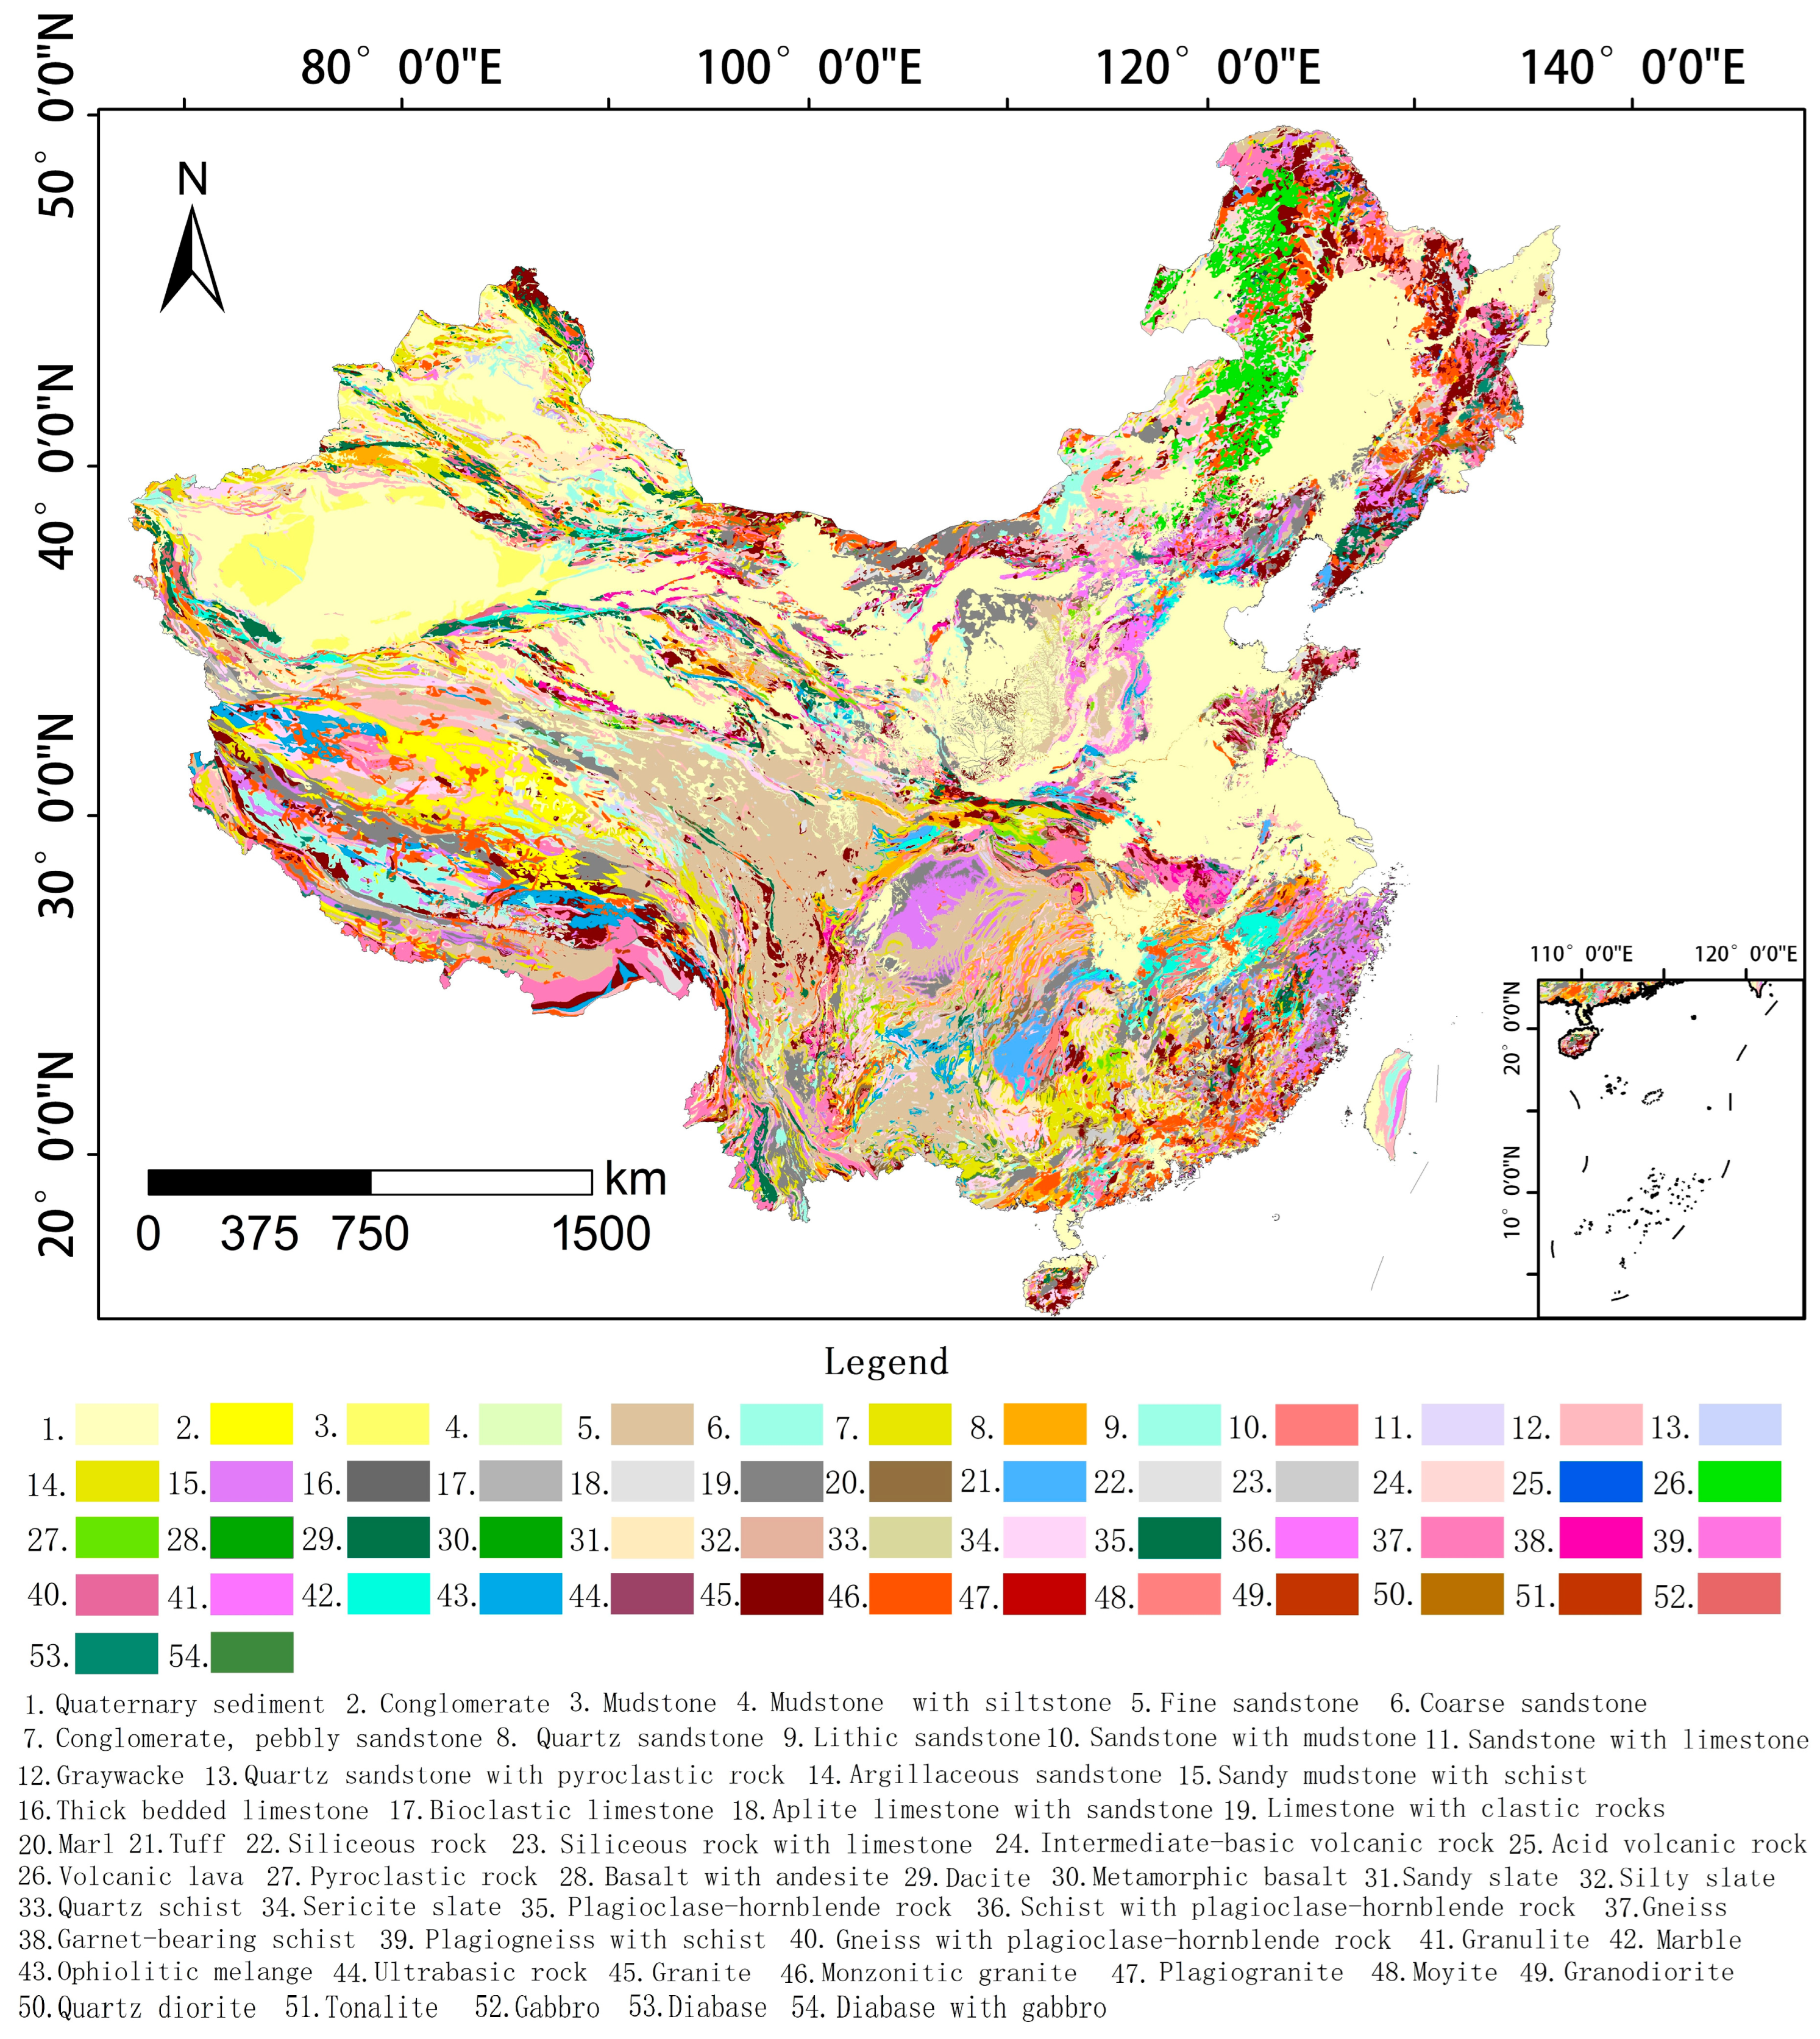
Figure 8.
Lithological map of China.
Figure 8.
Lithological map of China.
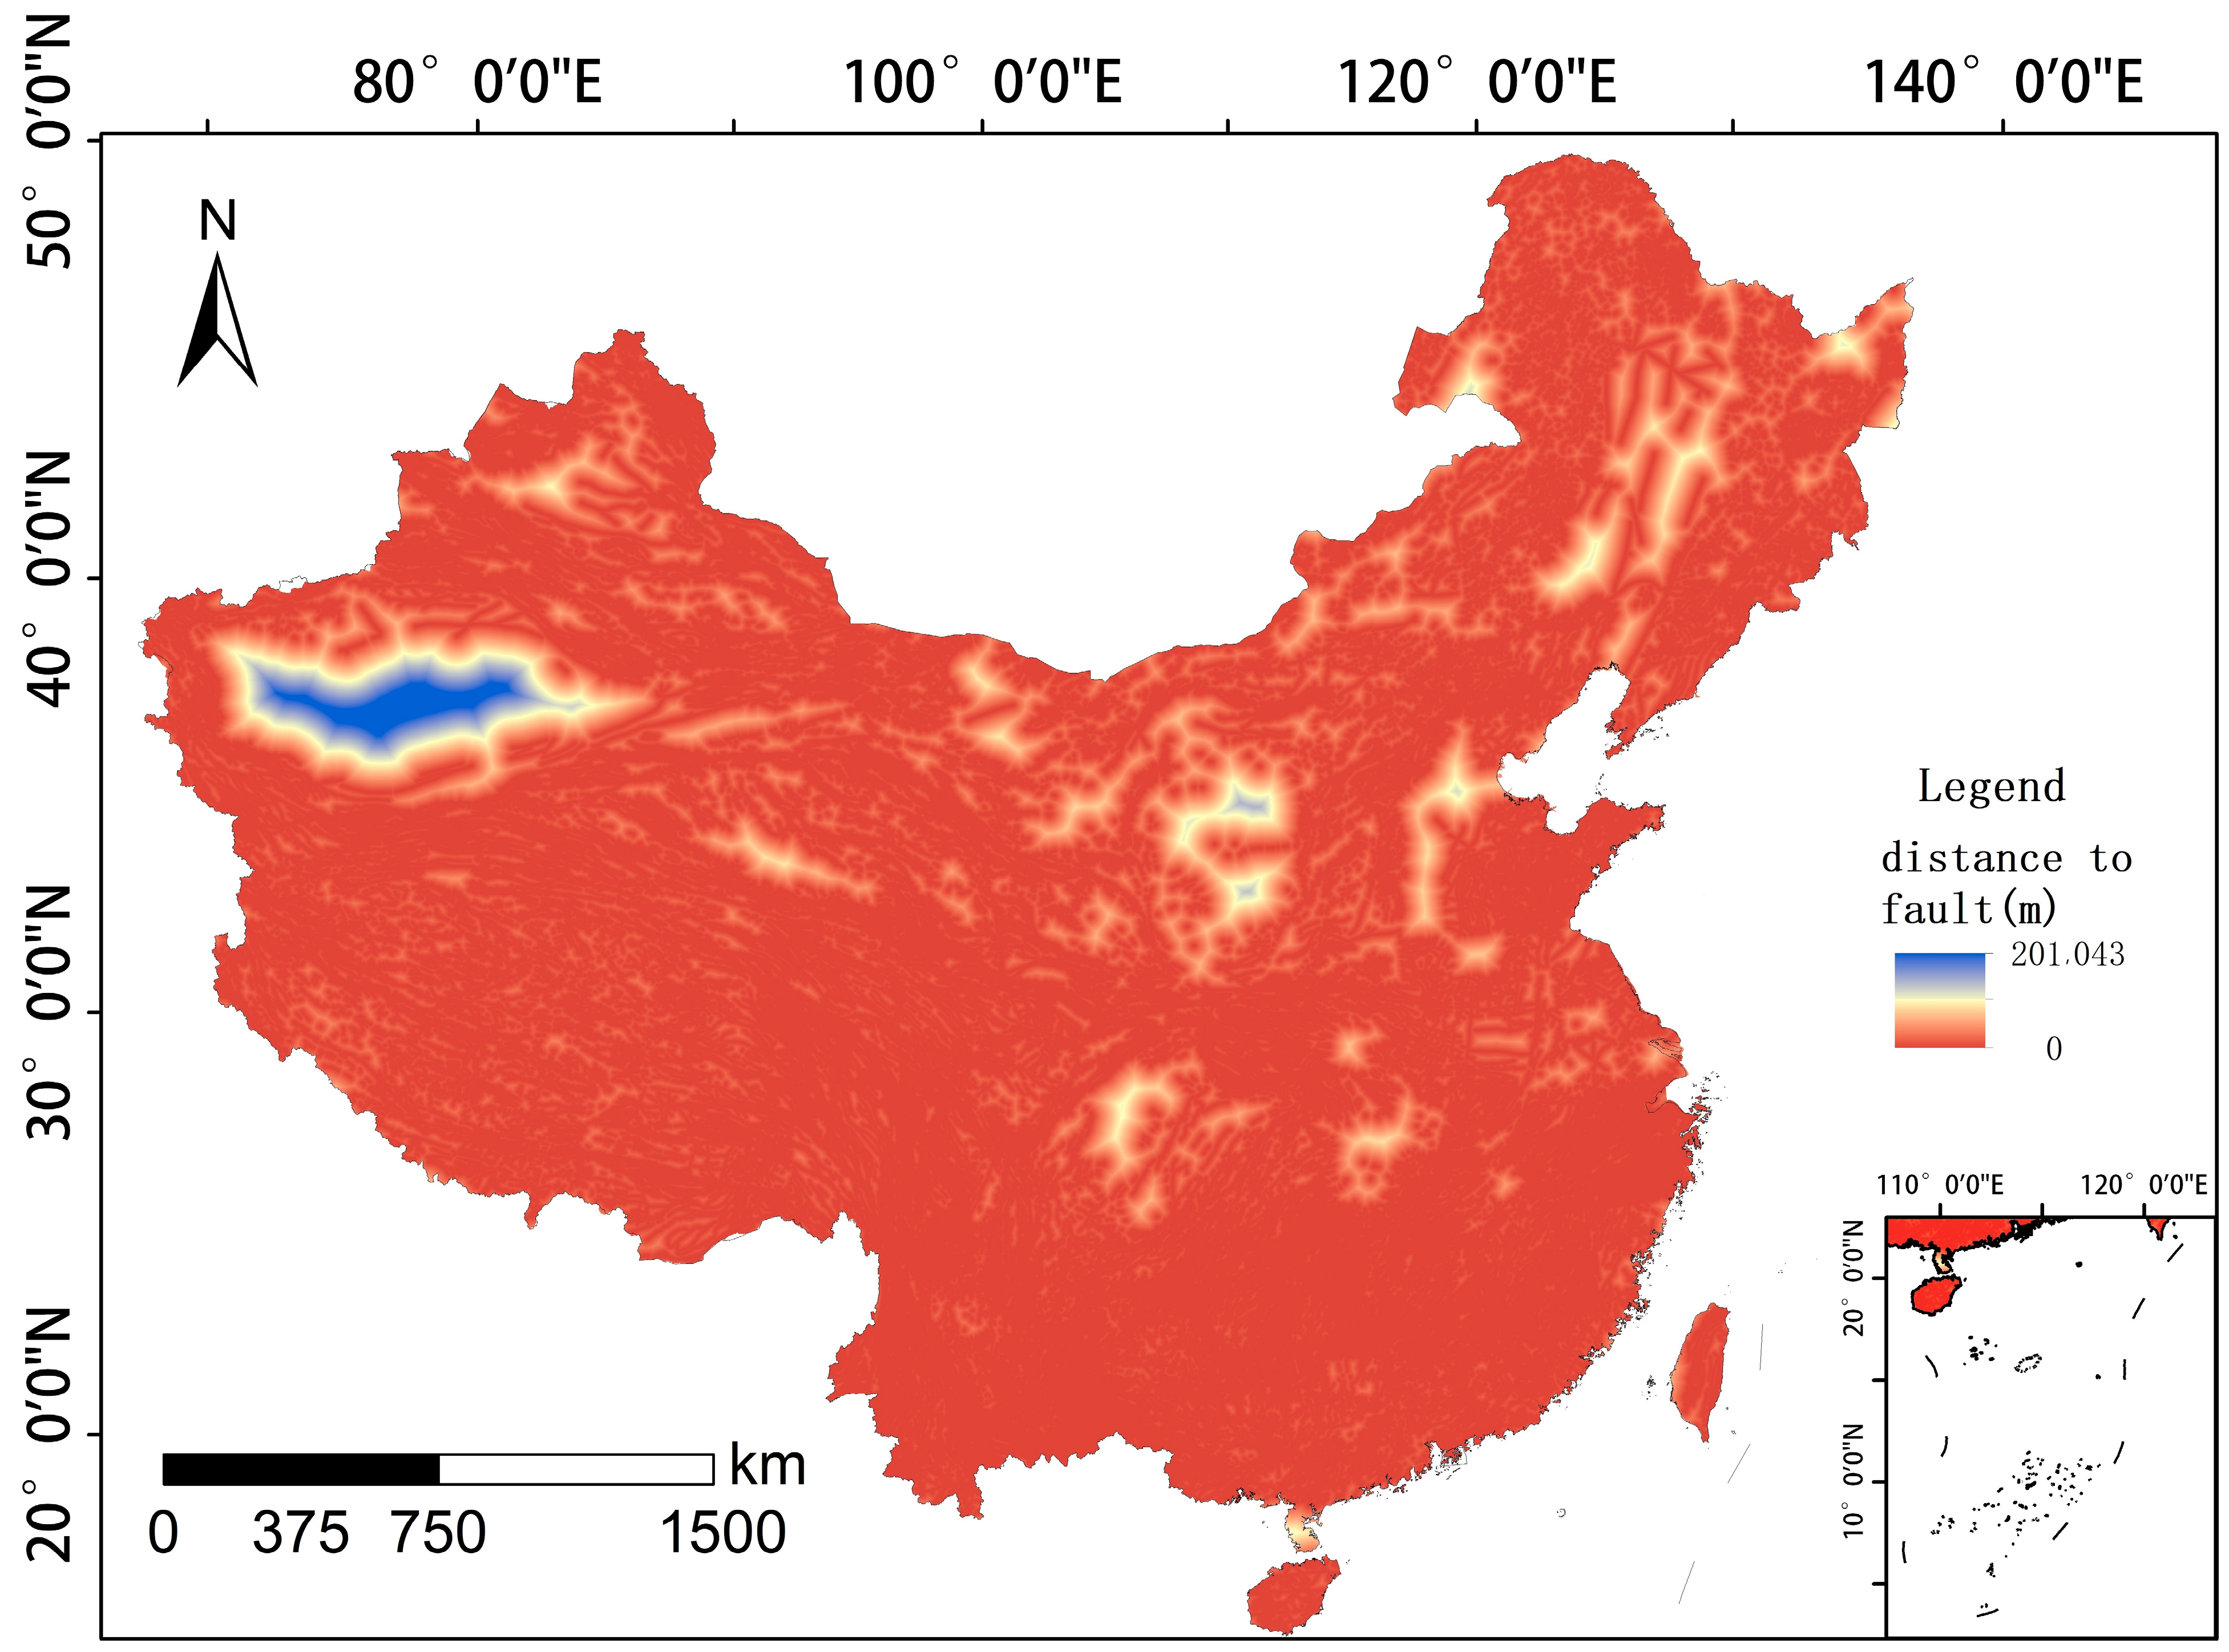
Figure 9.
Distance to faults map of China.
Figure 9.
Distance to faults map of China.
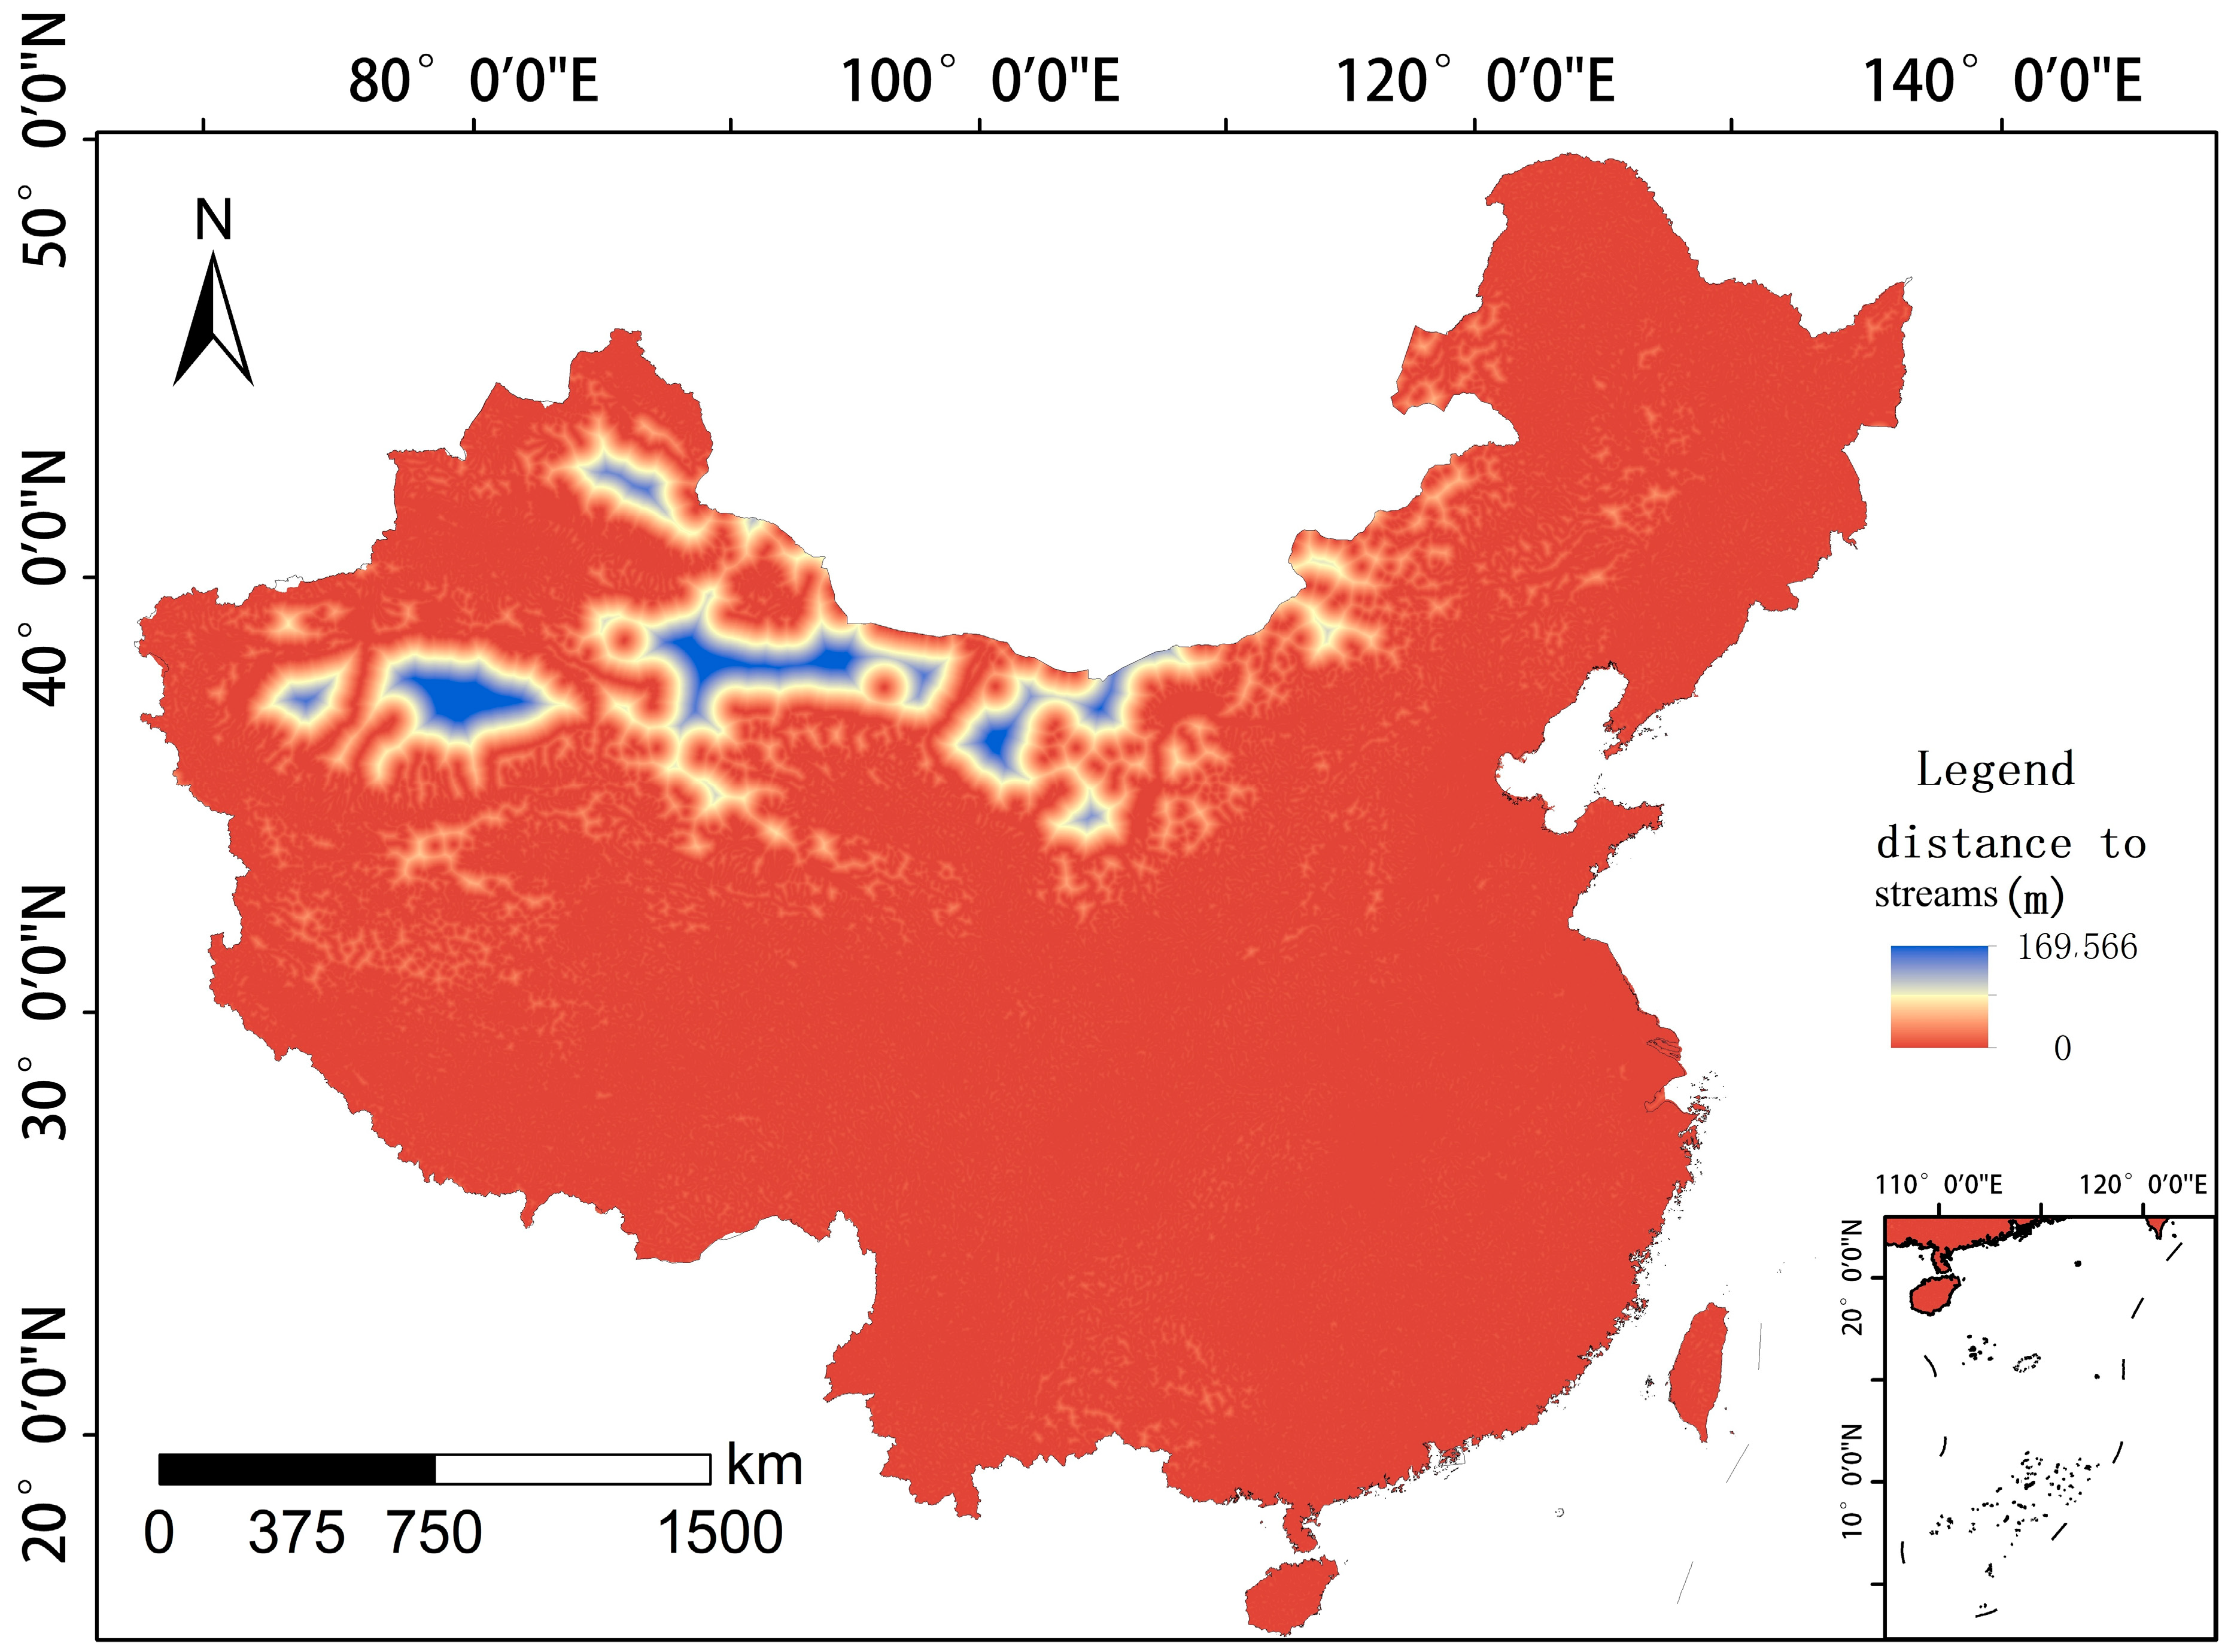
Figure 10.
Distance to streams map of China.
Figure 10.
Distance to streams map of China.
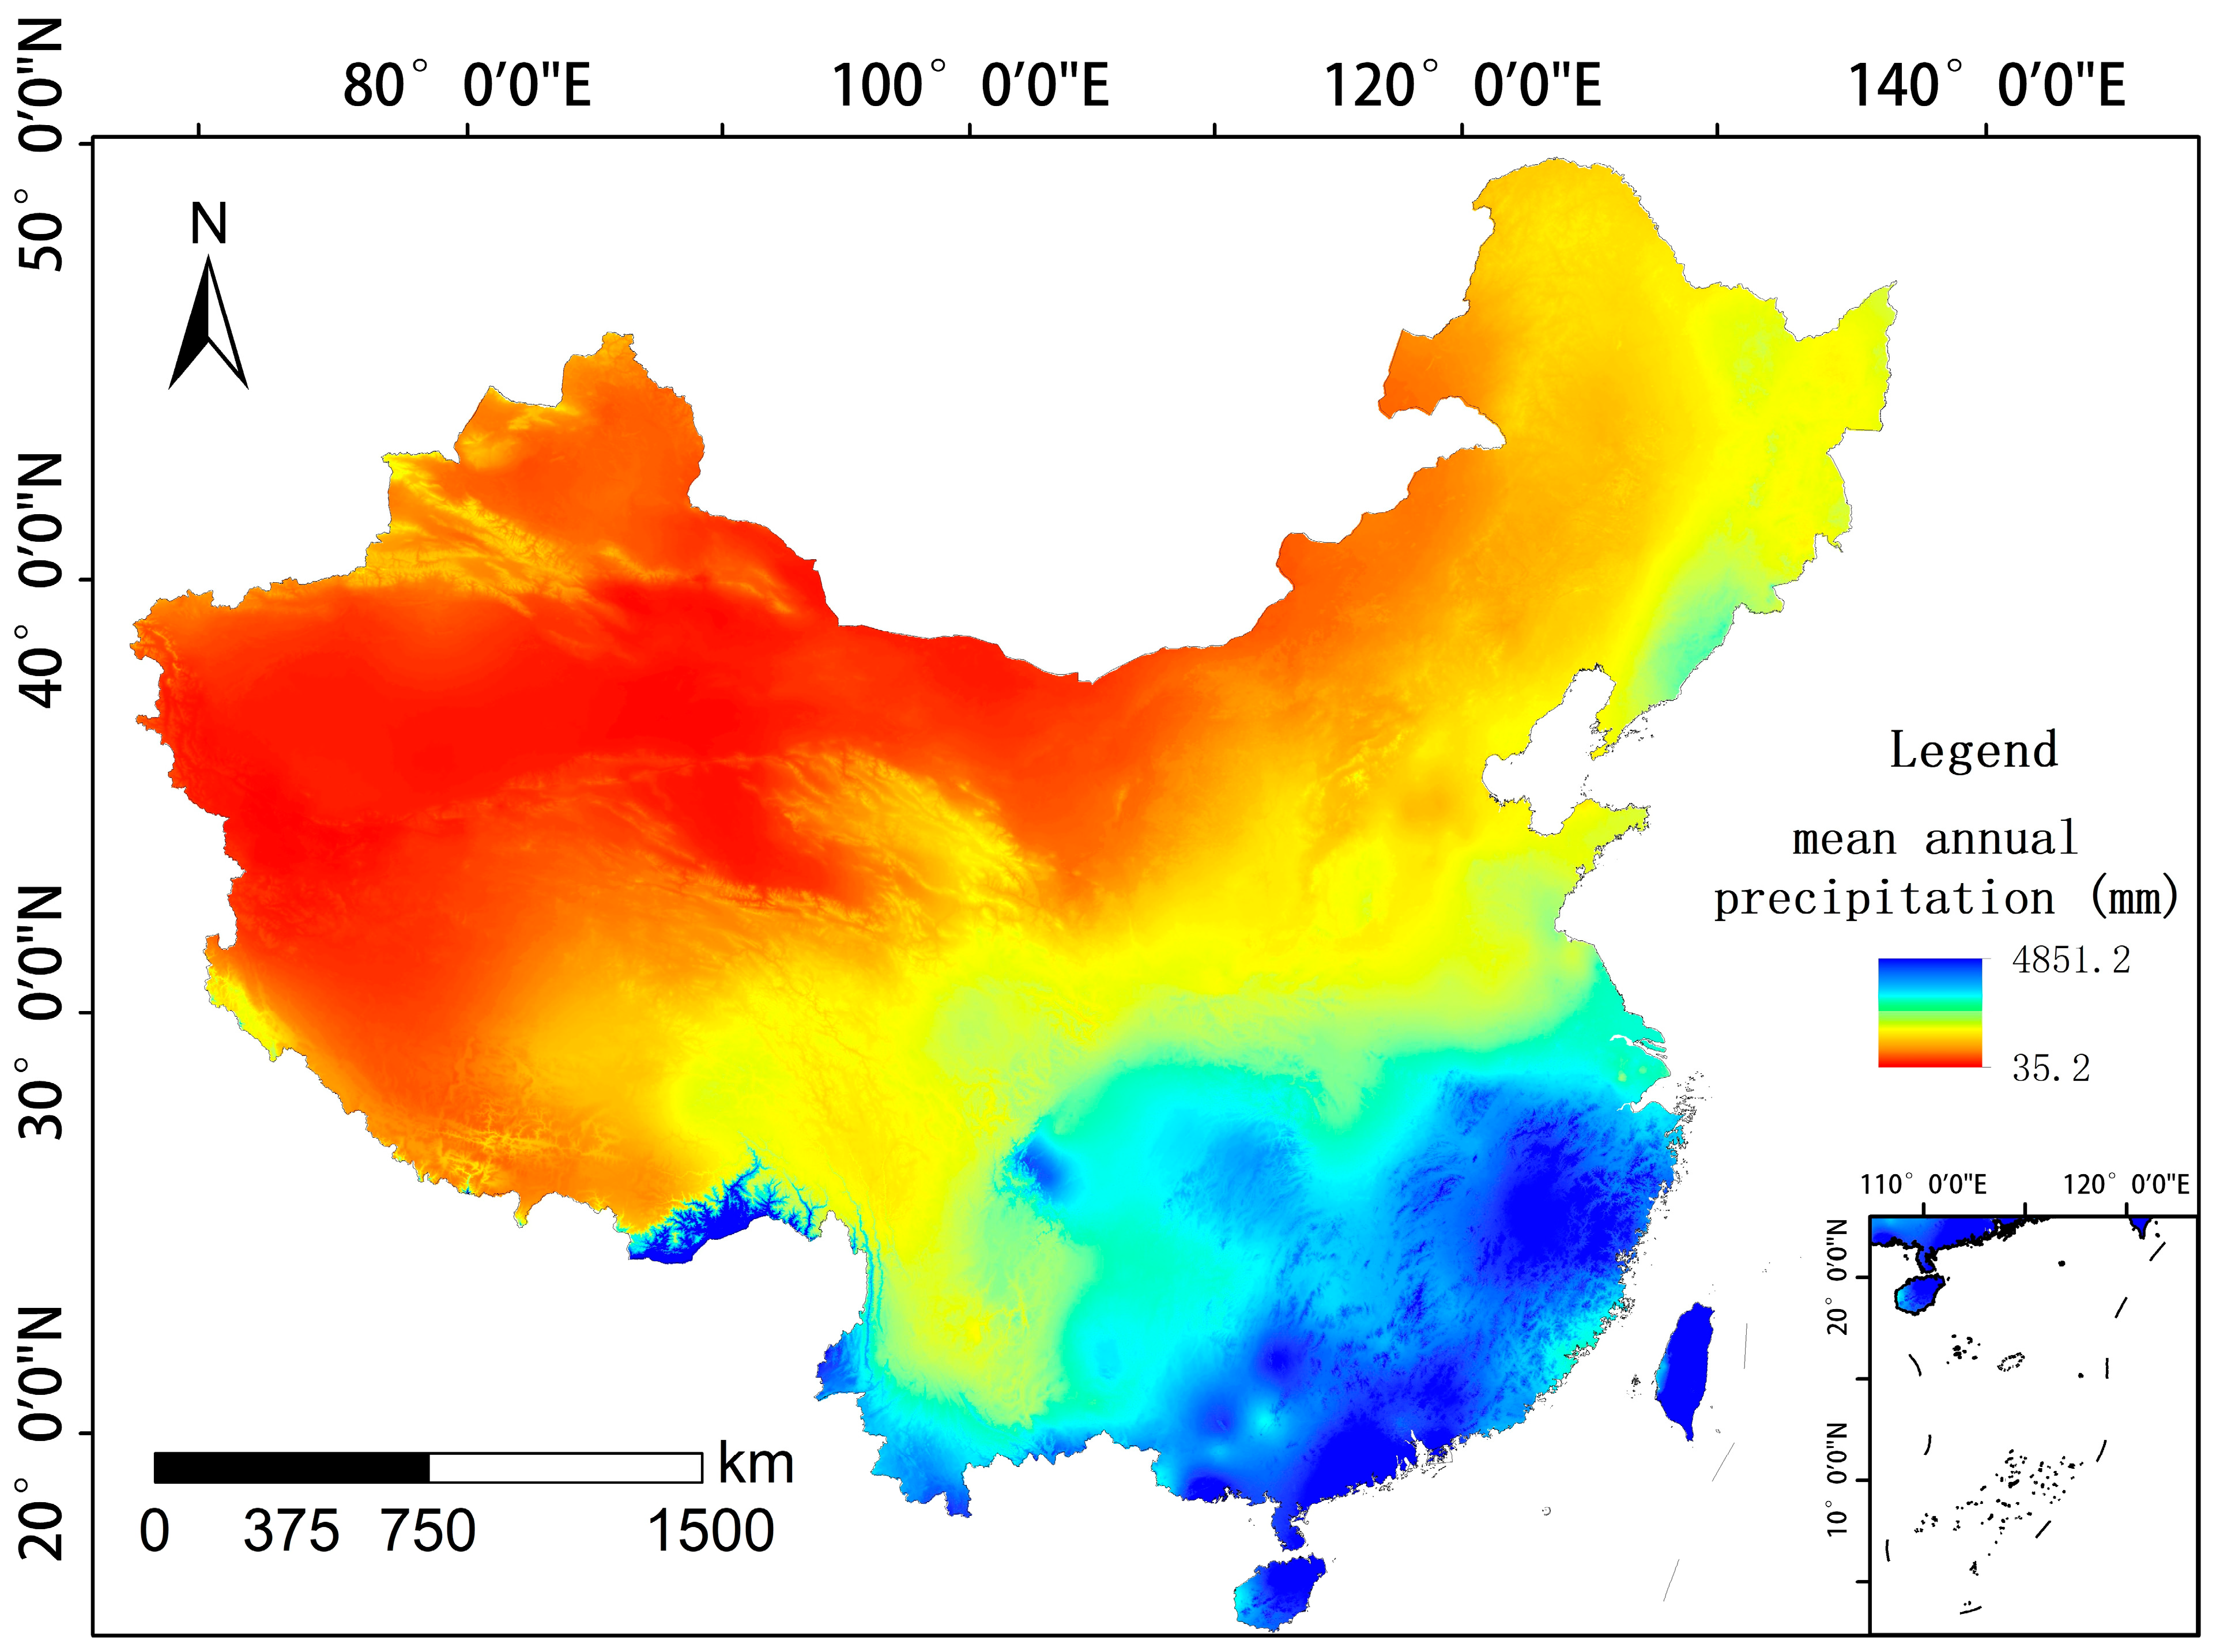
Figure 11.
Average annual precipitation map of China.
Figure 11.
Average annual precipitation map of China.
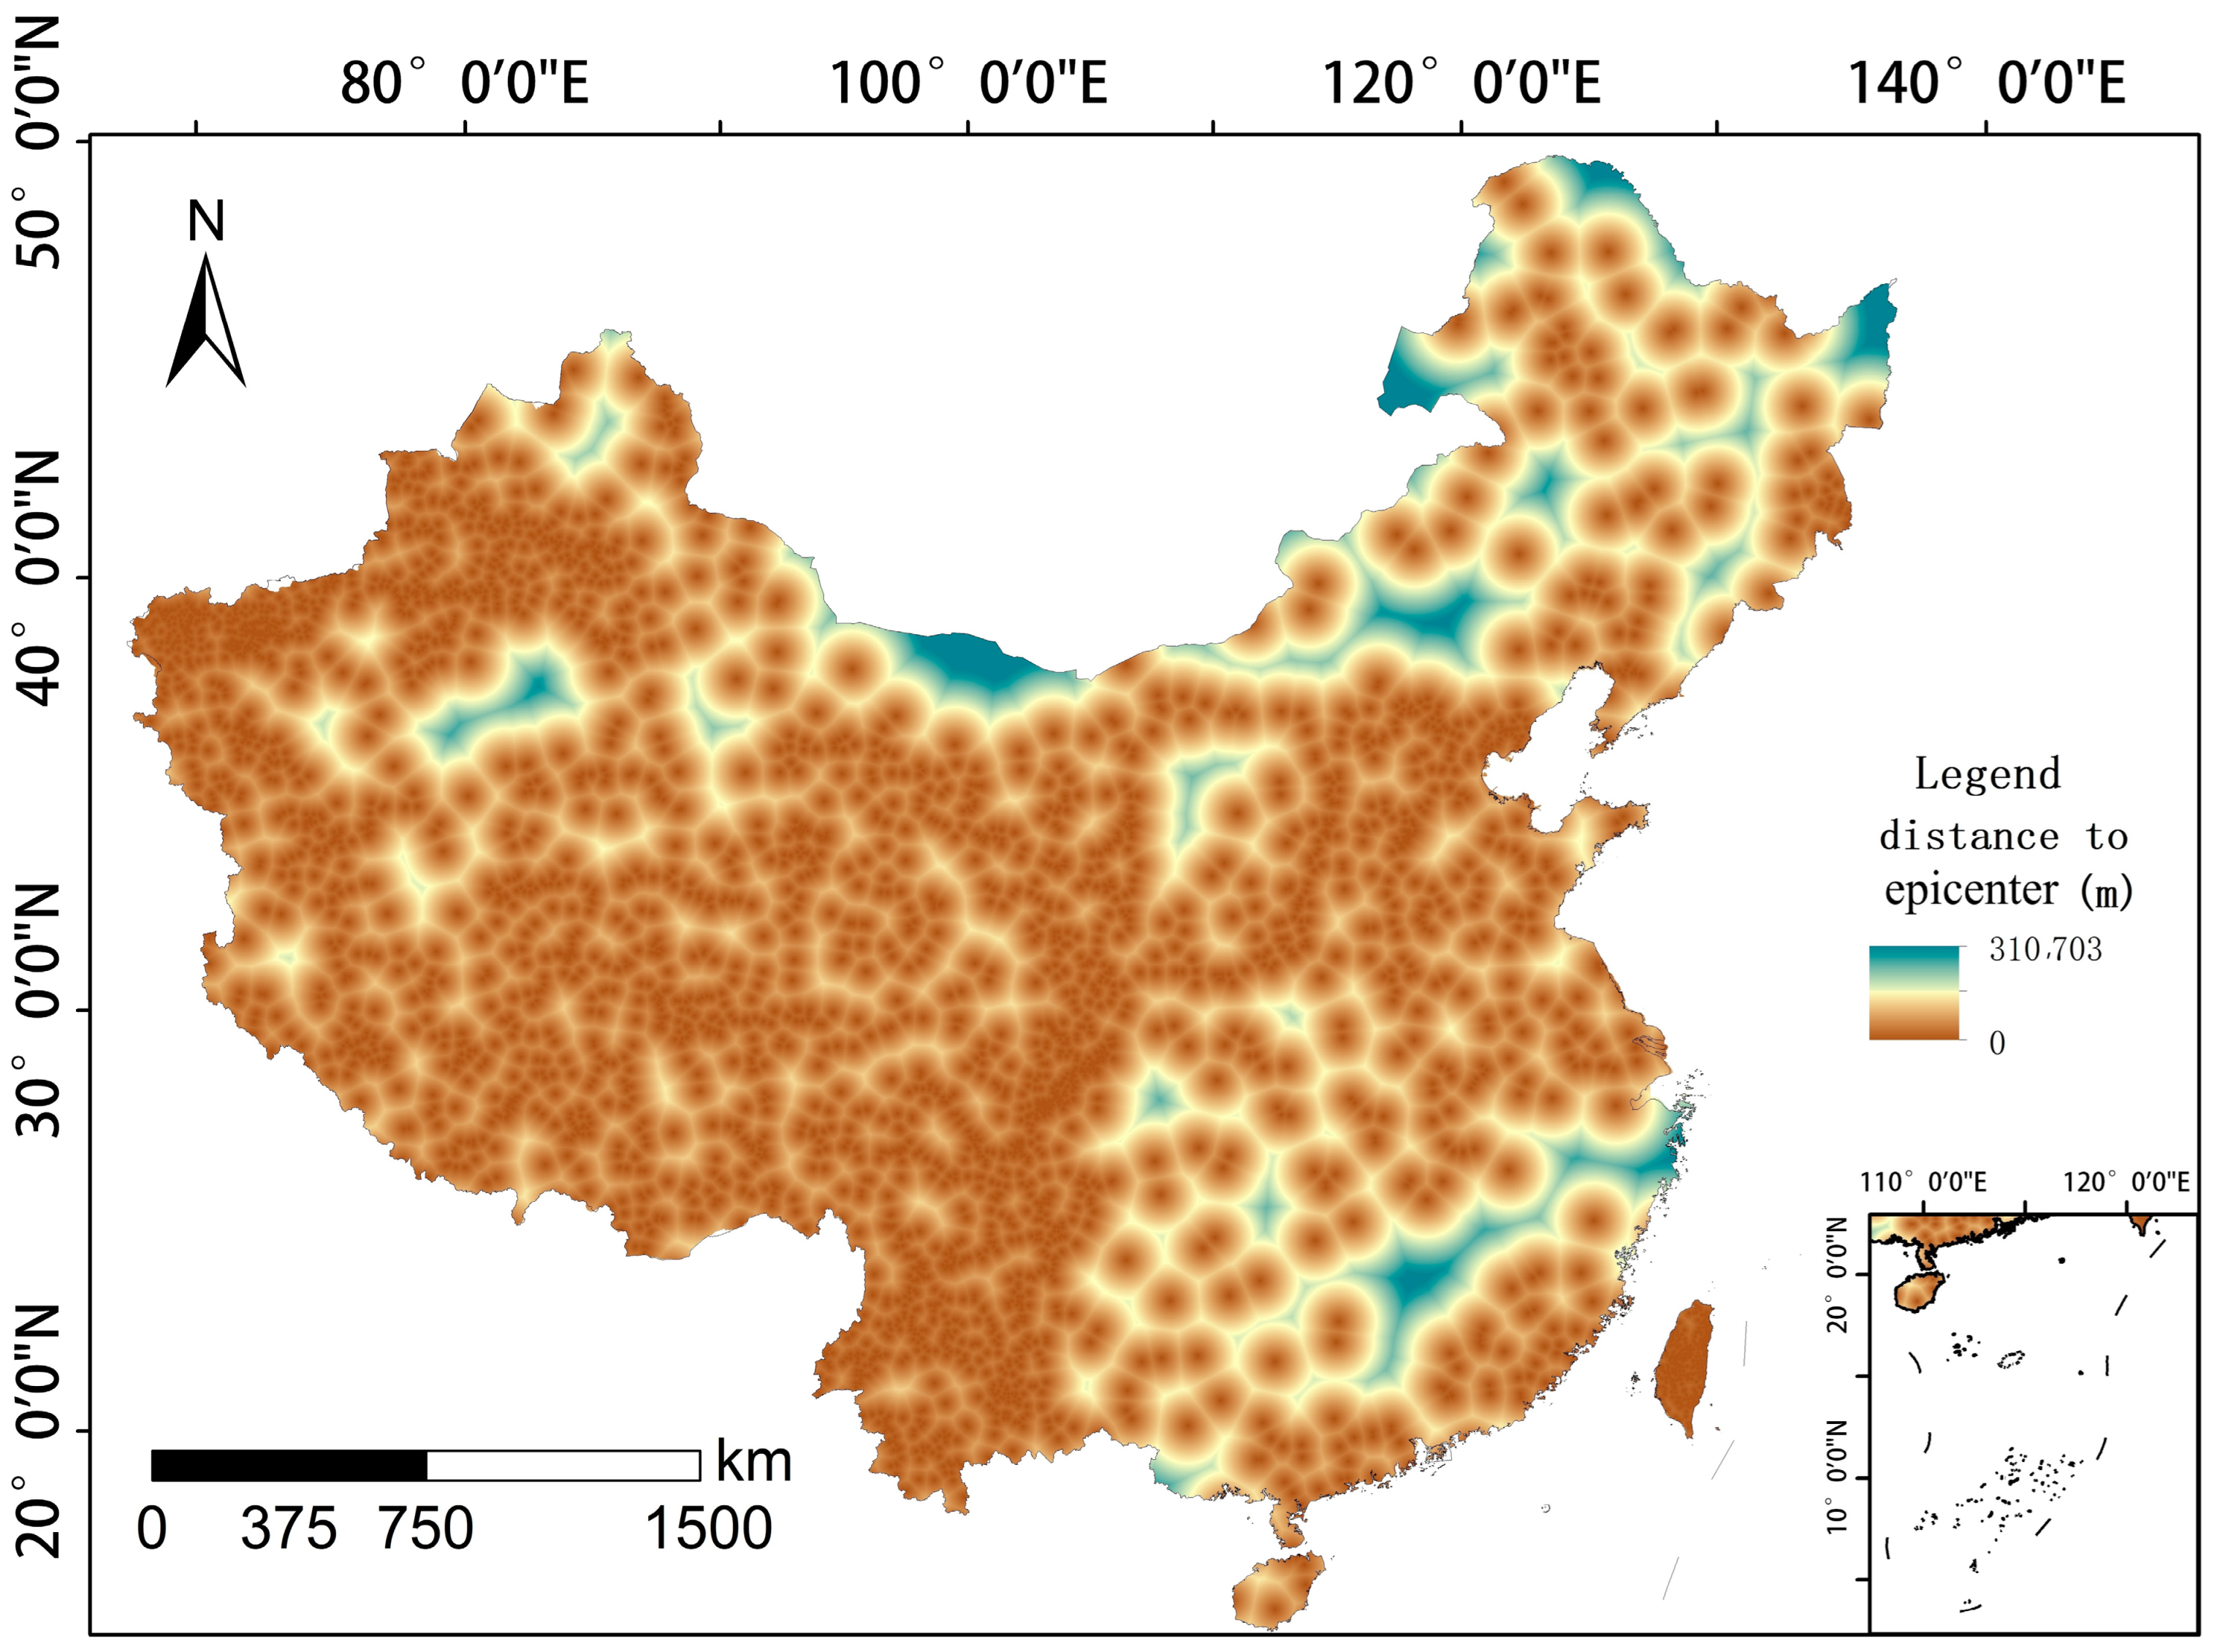
Figure 12.
Distance to epicenter map of China.
Figure 12.
Distance to epicenter map of China.
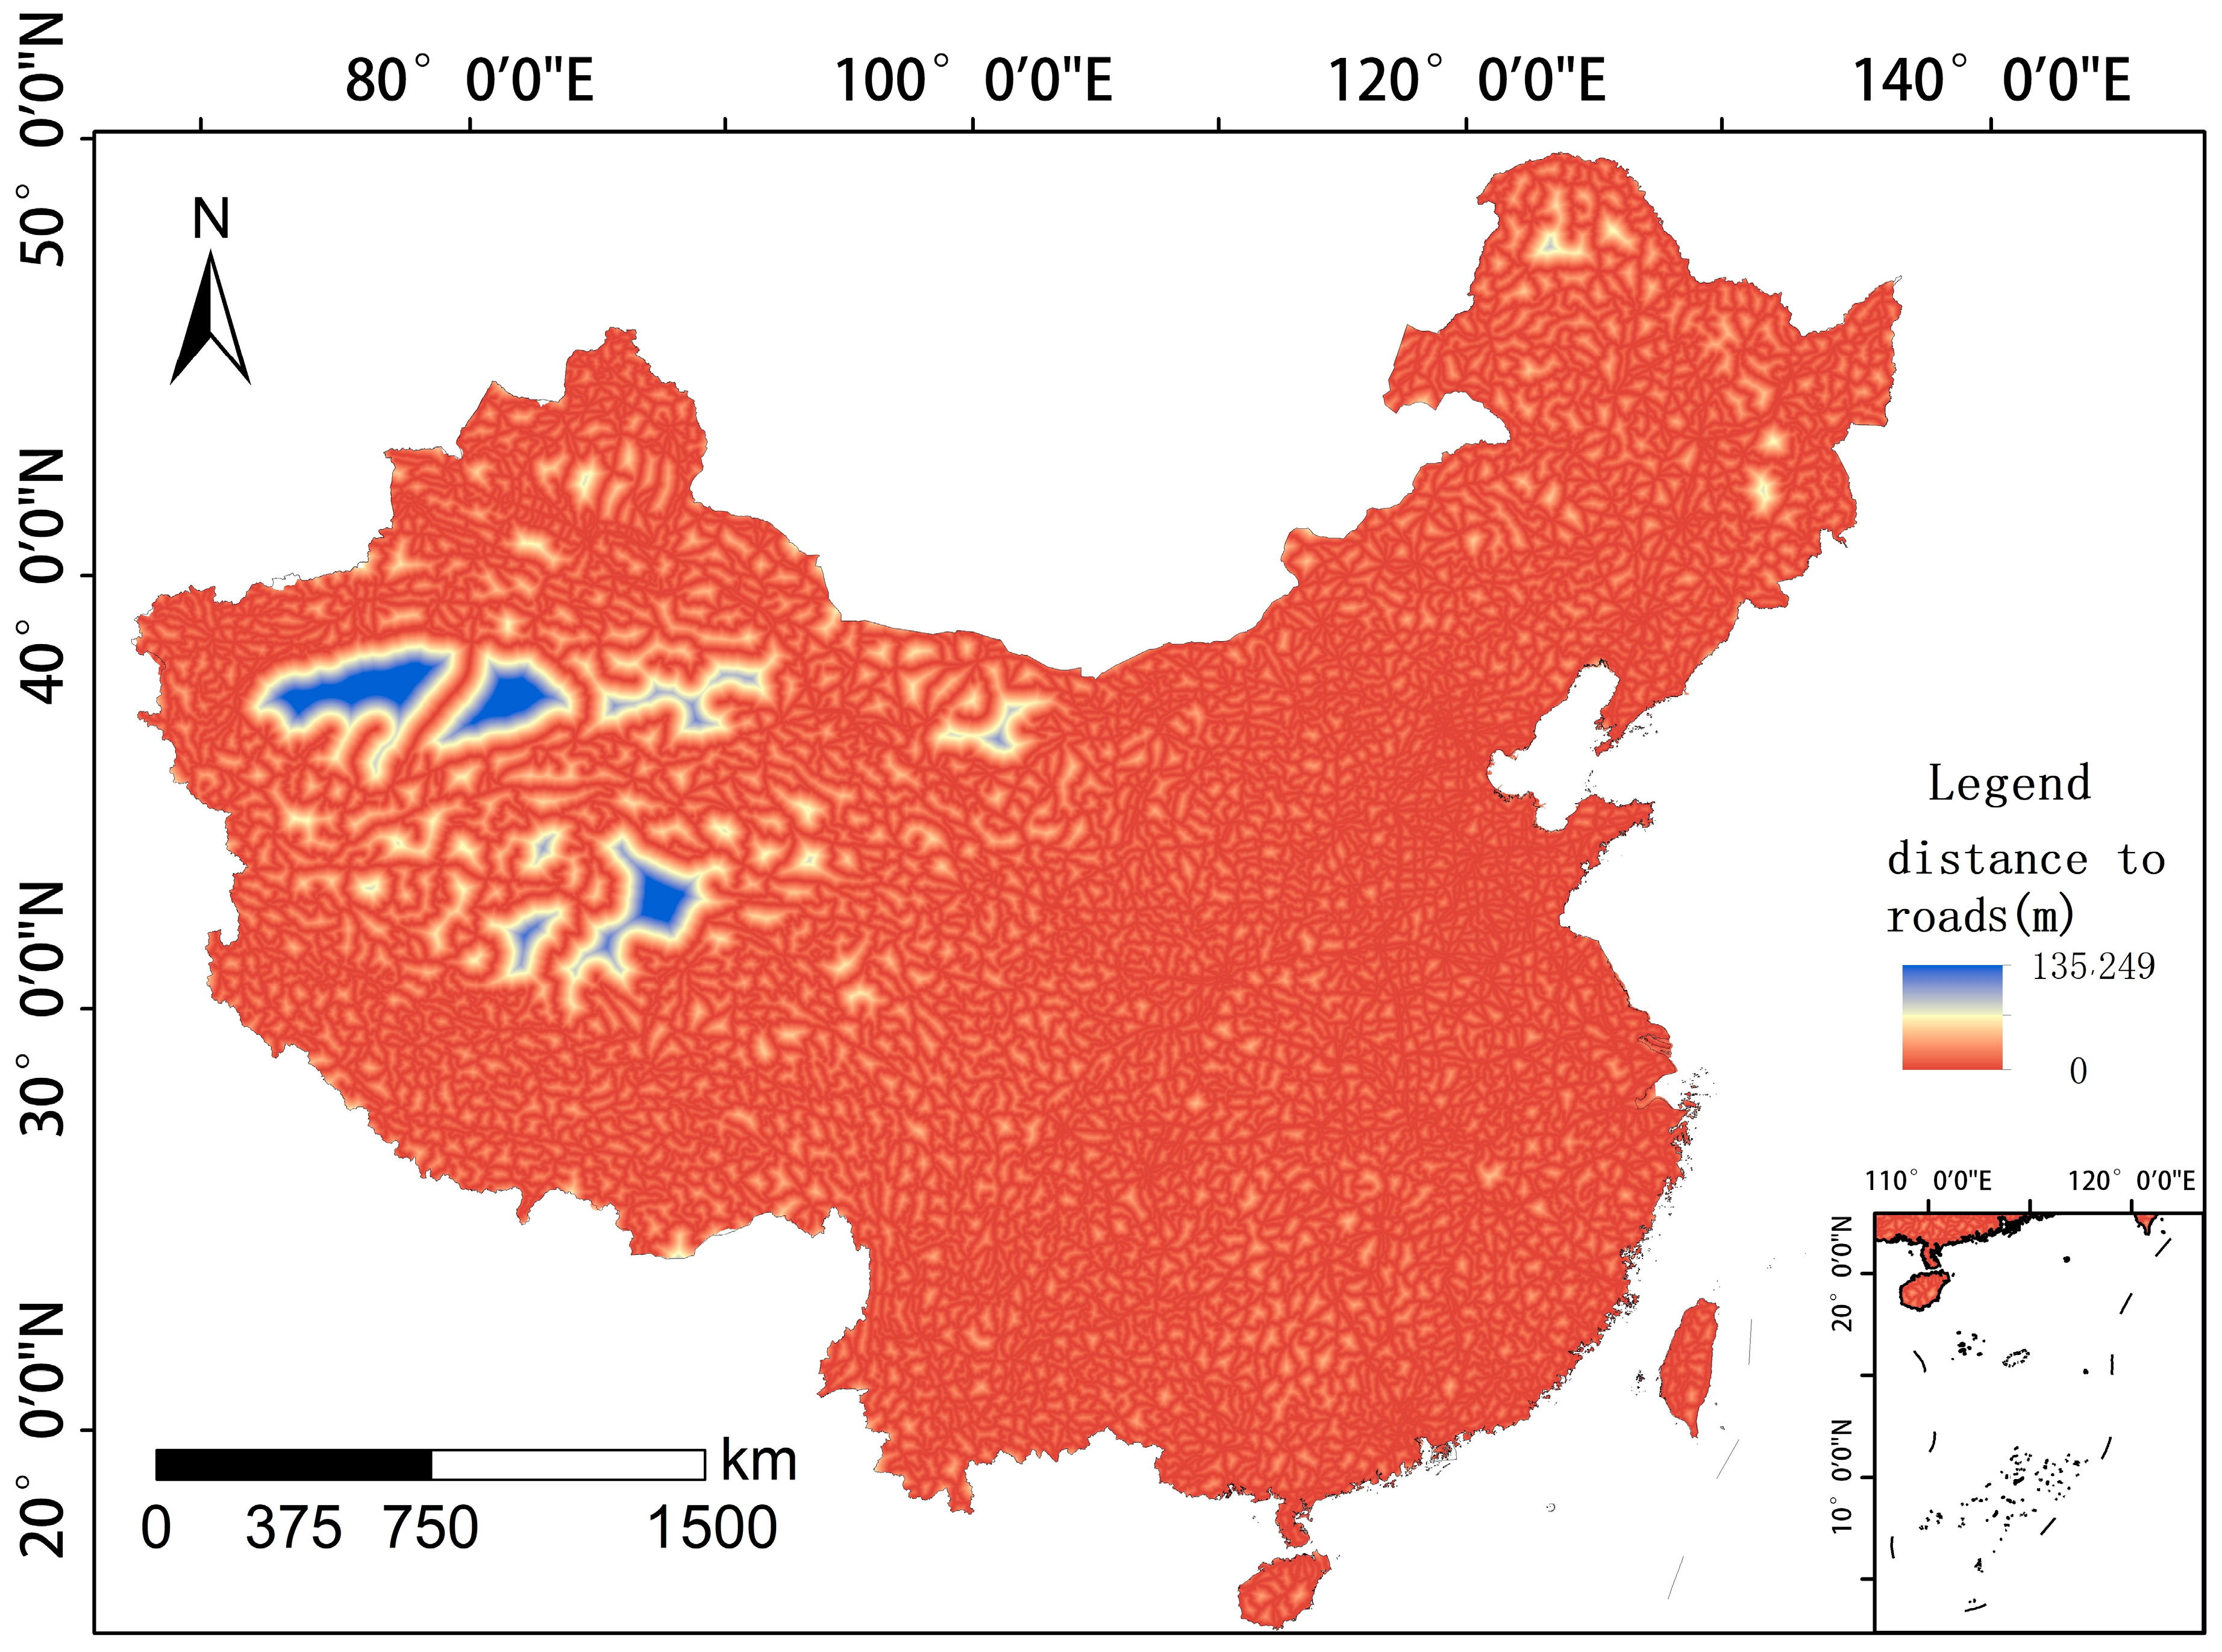
Figure 13.
Distance to road map of China.
Figure 13.
Distance to road map of China.
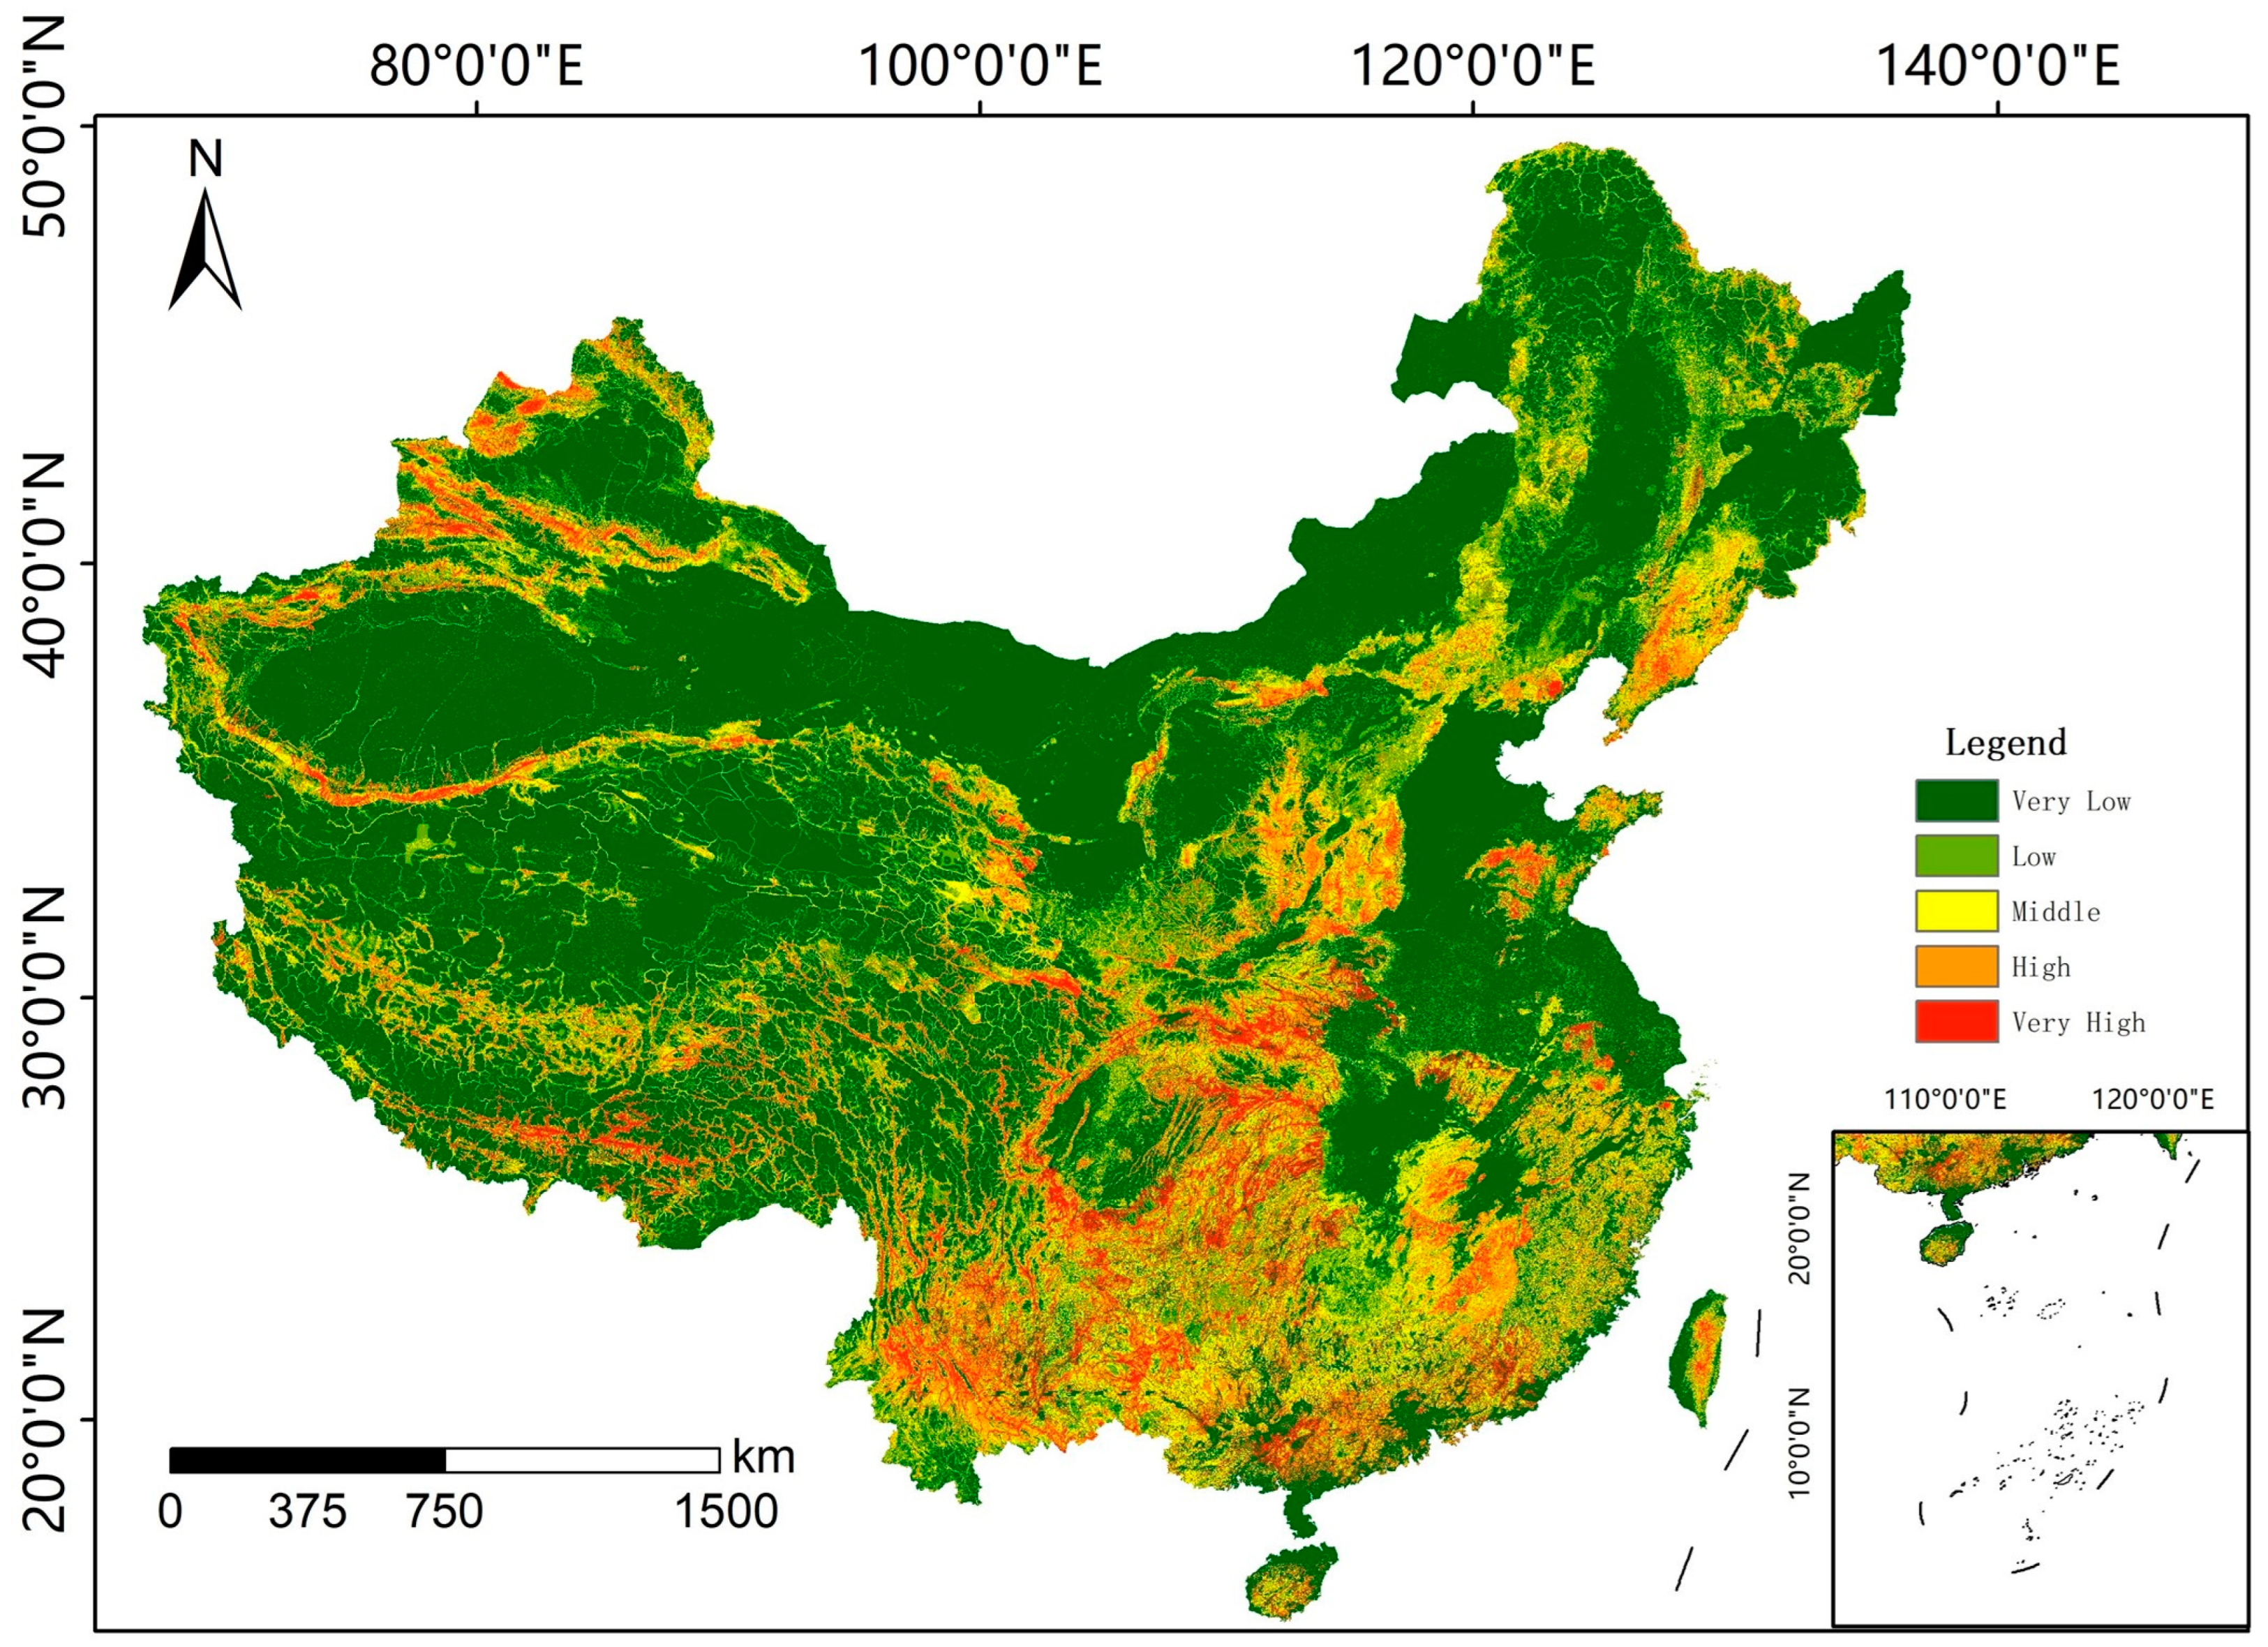
Figure 14.
Landslide susceptibility map of China.
Figure 14.
Landslide susceptibility map of China.
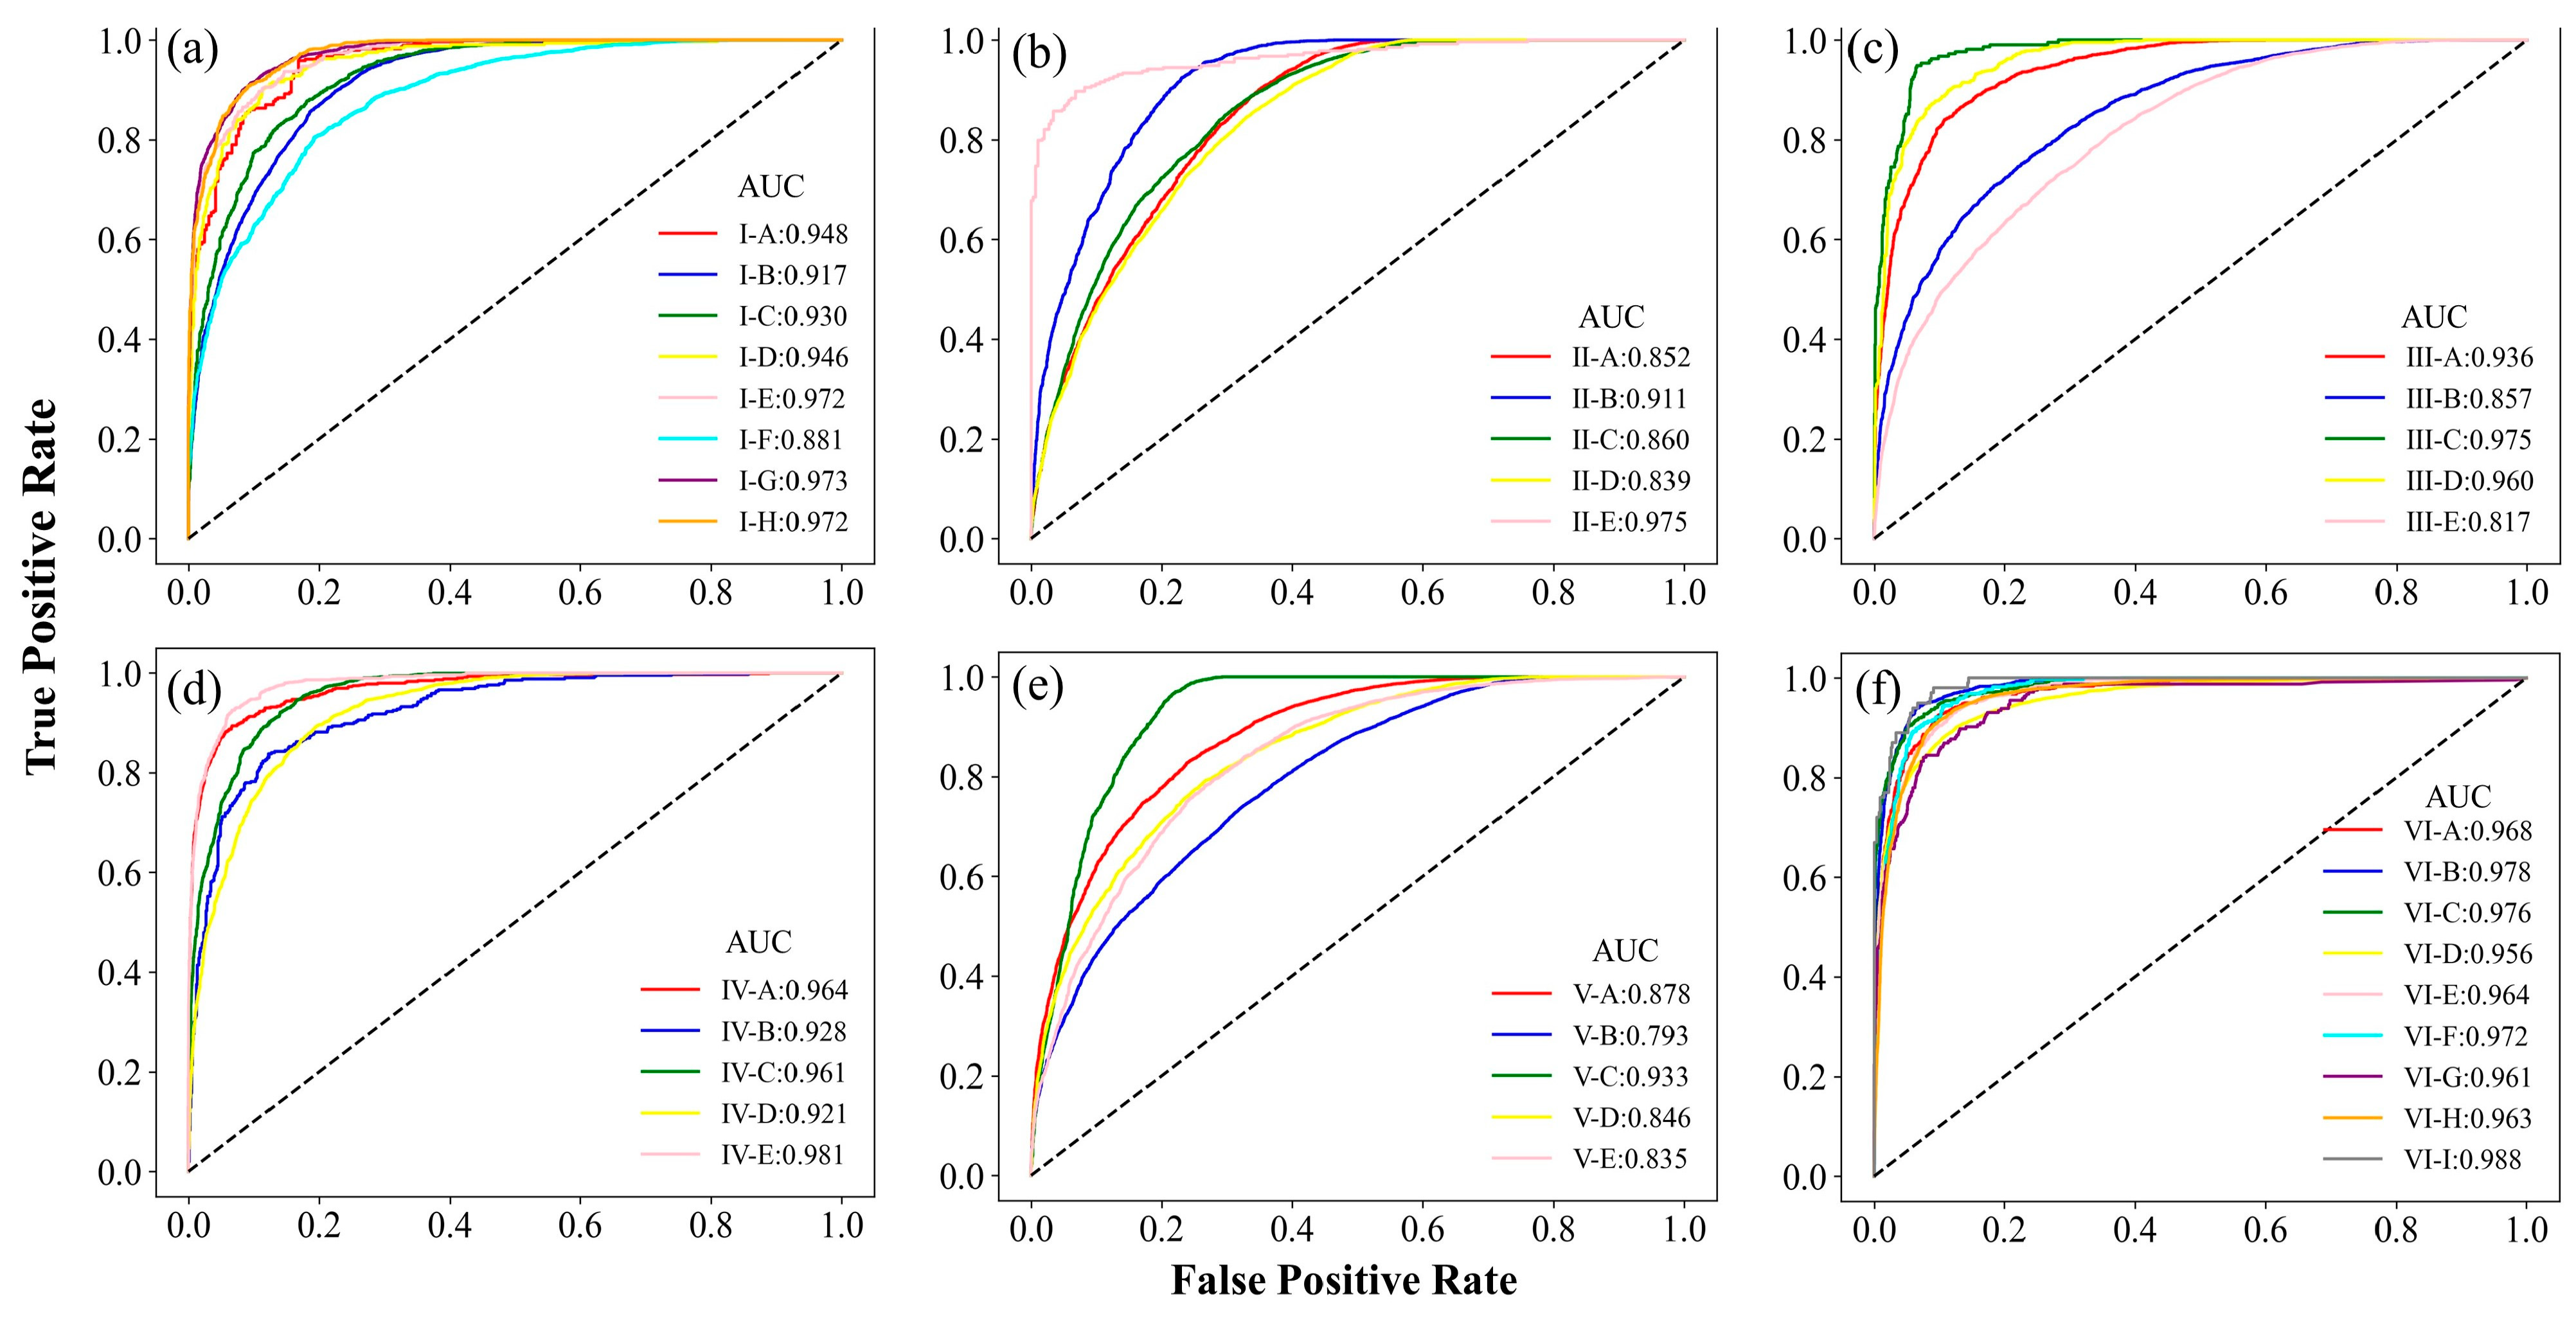
Figure 15.
ROC curves for different geomorphologic districts. (a) ROC curves for region I. (b) ROC curves for region II. (c) ROC curves for region III. (d) ROC curves for region IV. (e) ROC curves for region V. (f) ROC curves for region VI.
Figure 15.
ROC curves for different geomorphologic districts. (a) ROC curves for region I. (b) ROC curves for region II. (c) ROC curves for region III. (d) ROC curves for region IV. (e) ROC curves for region V. (f) ROC curves for region VI.
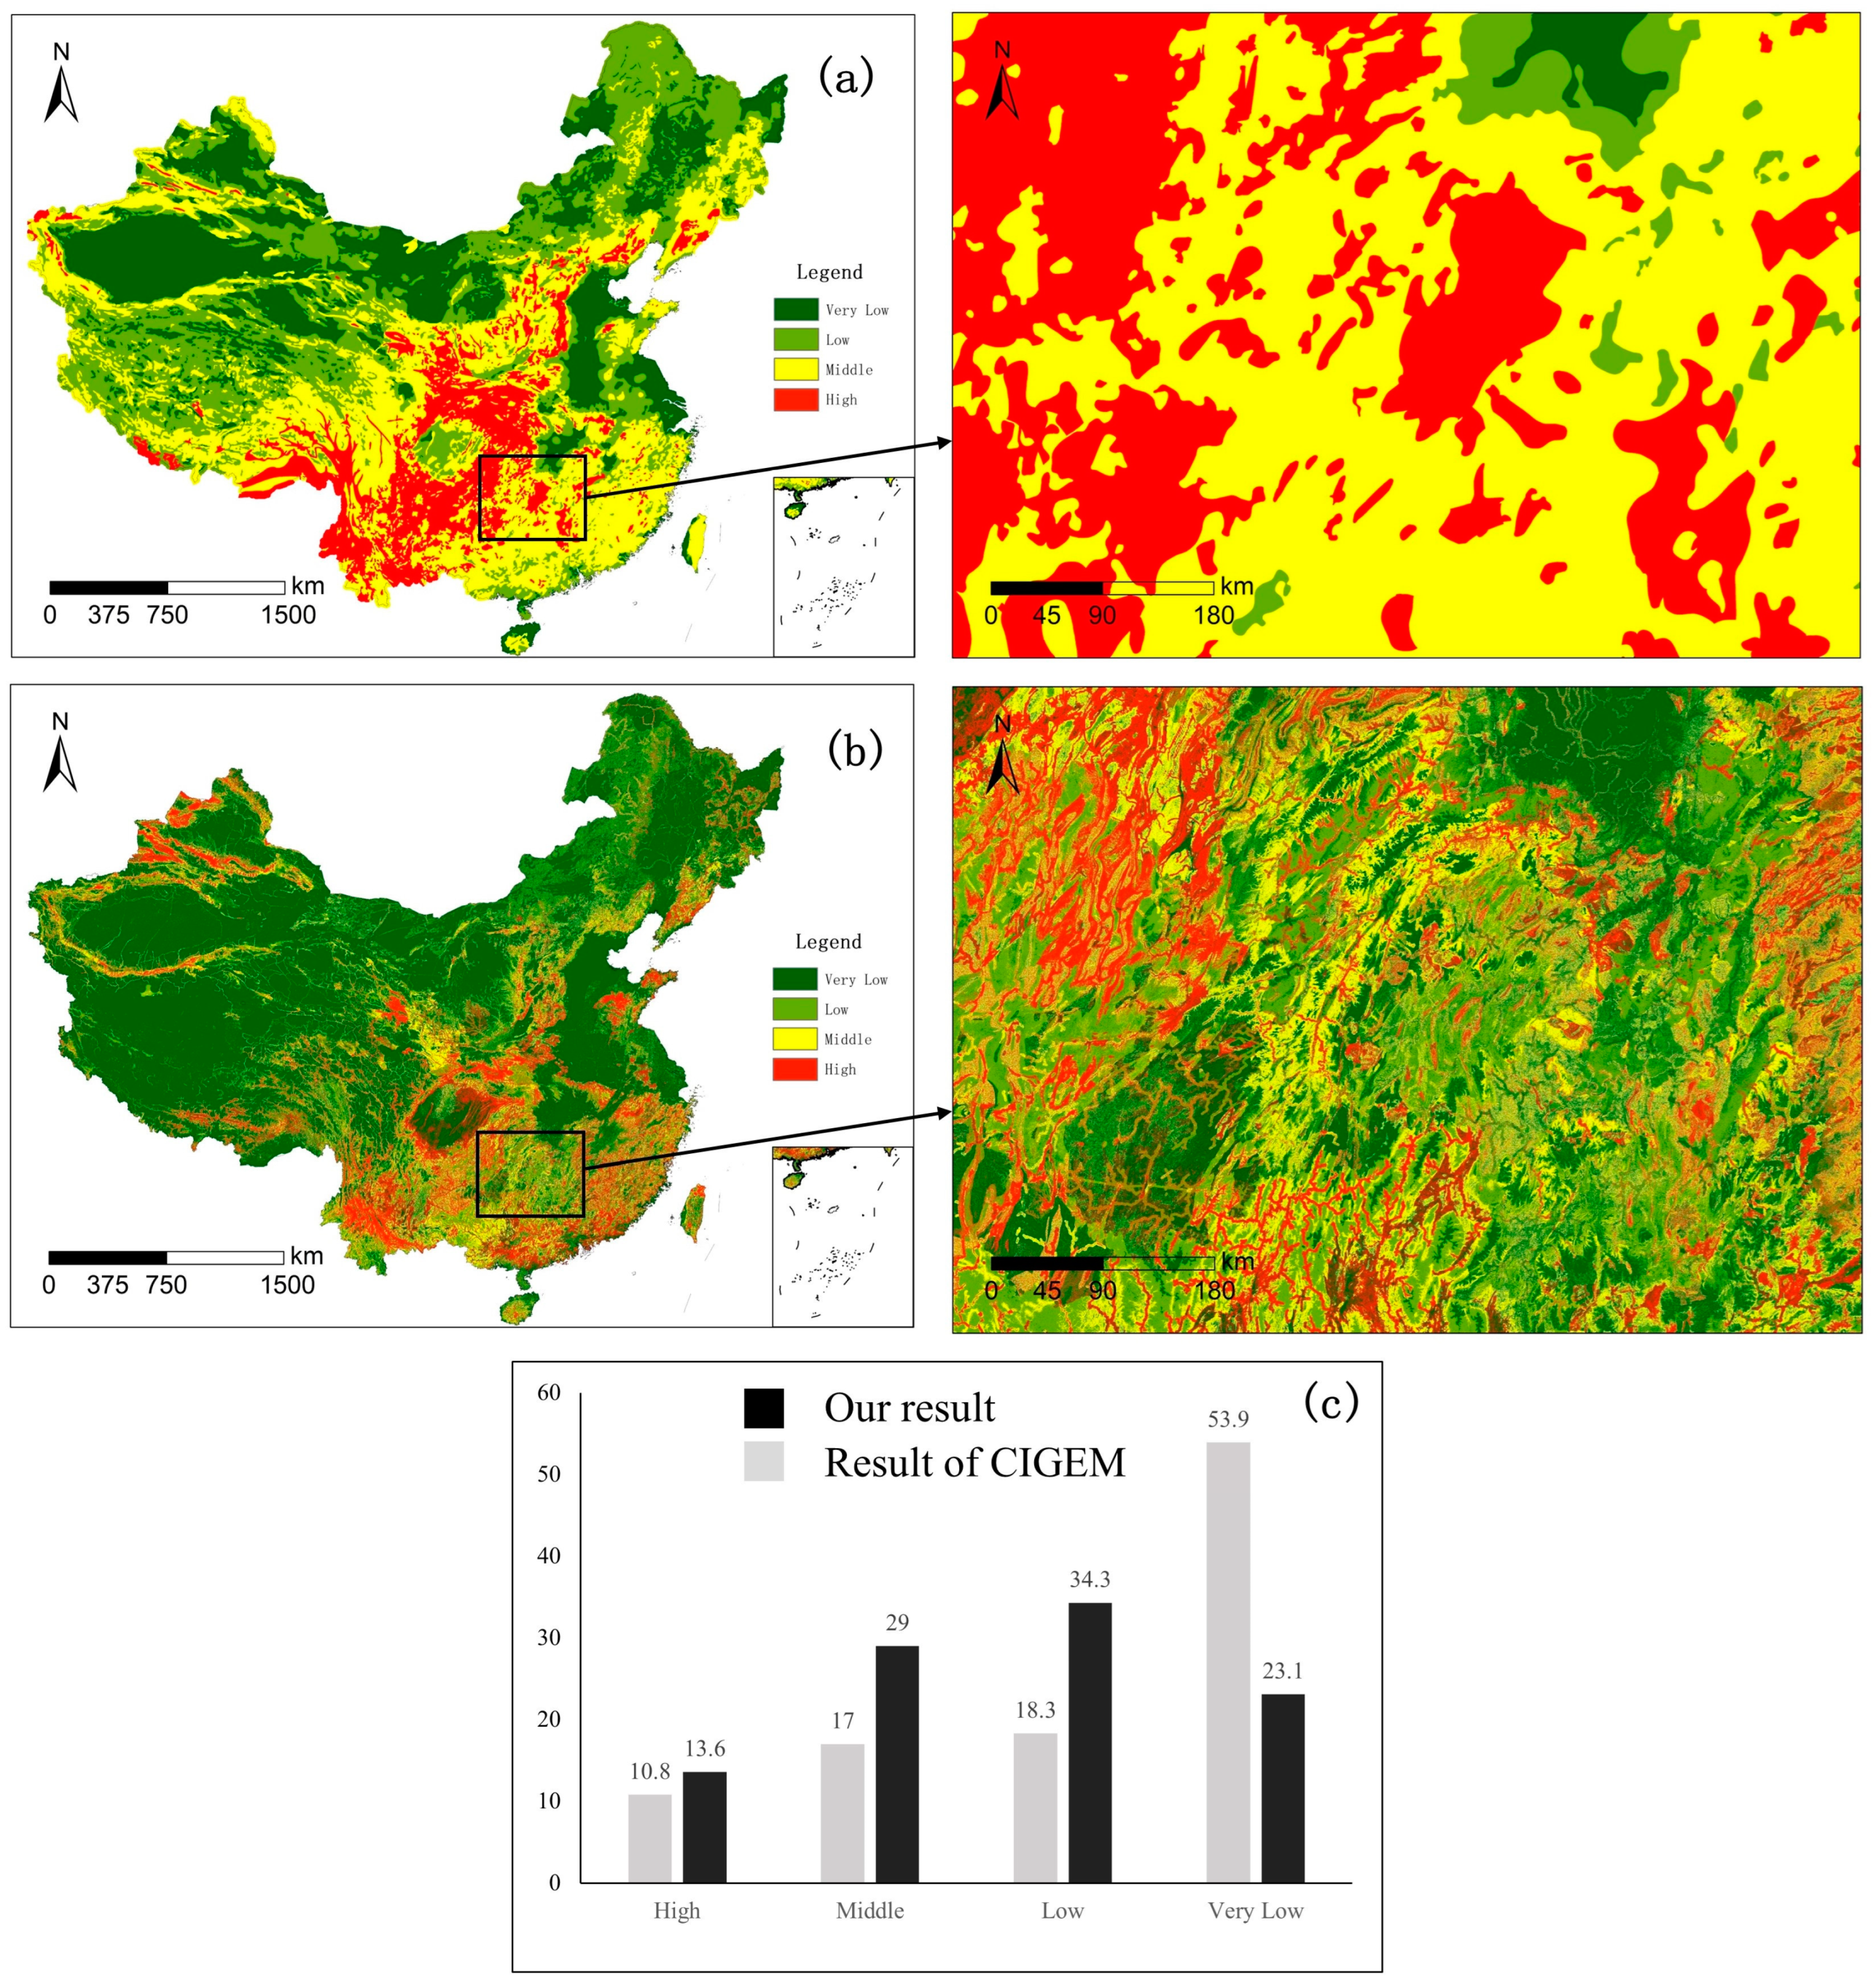
Figure 16.
Comparison with the LSM of CIGEM. (a) LSM of CIGEM (b) LSM in this study (c) Statistical comparison of area share of the LSM of CIGEM and this study.
Figure 16.
Comparison with the LSM of CIGEM. (a) LSM of CIGEM (b) LSM in this study (c) Statistical comparison of area share of the LSM of CIGEM and this study.
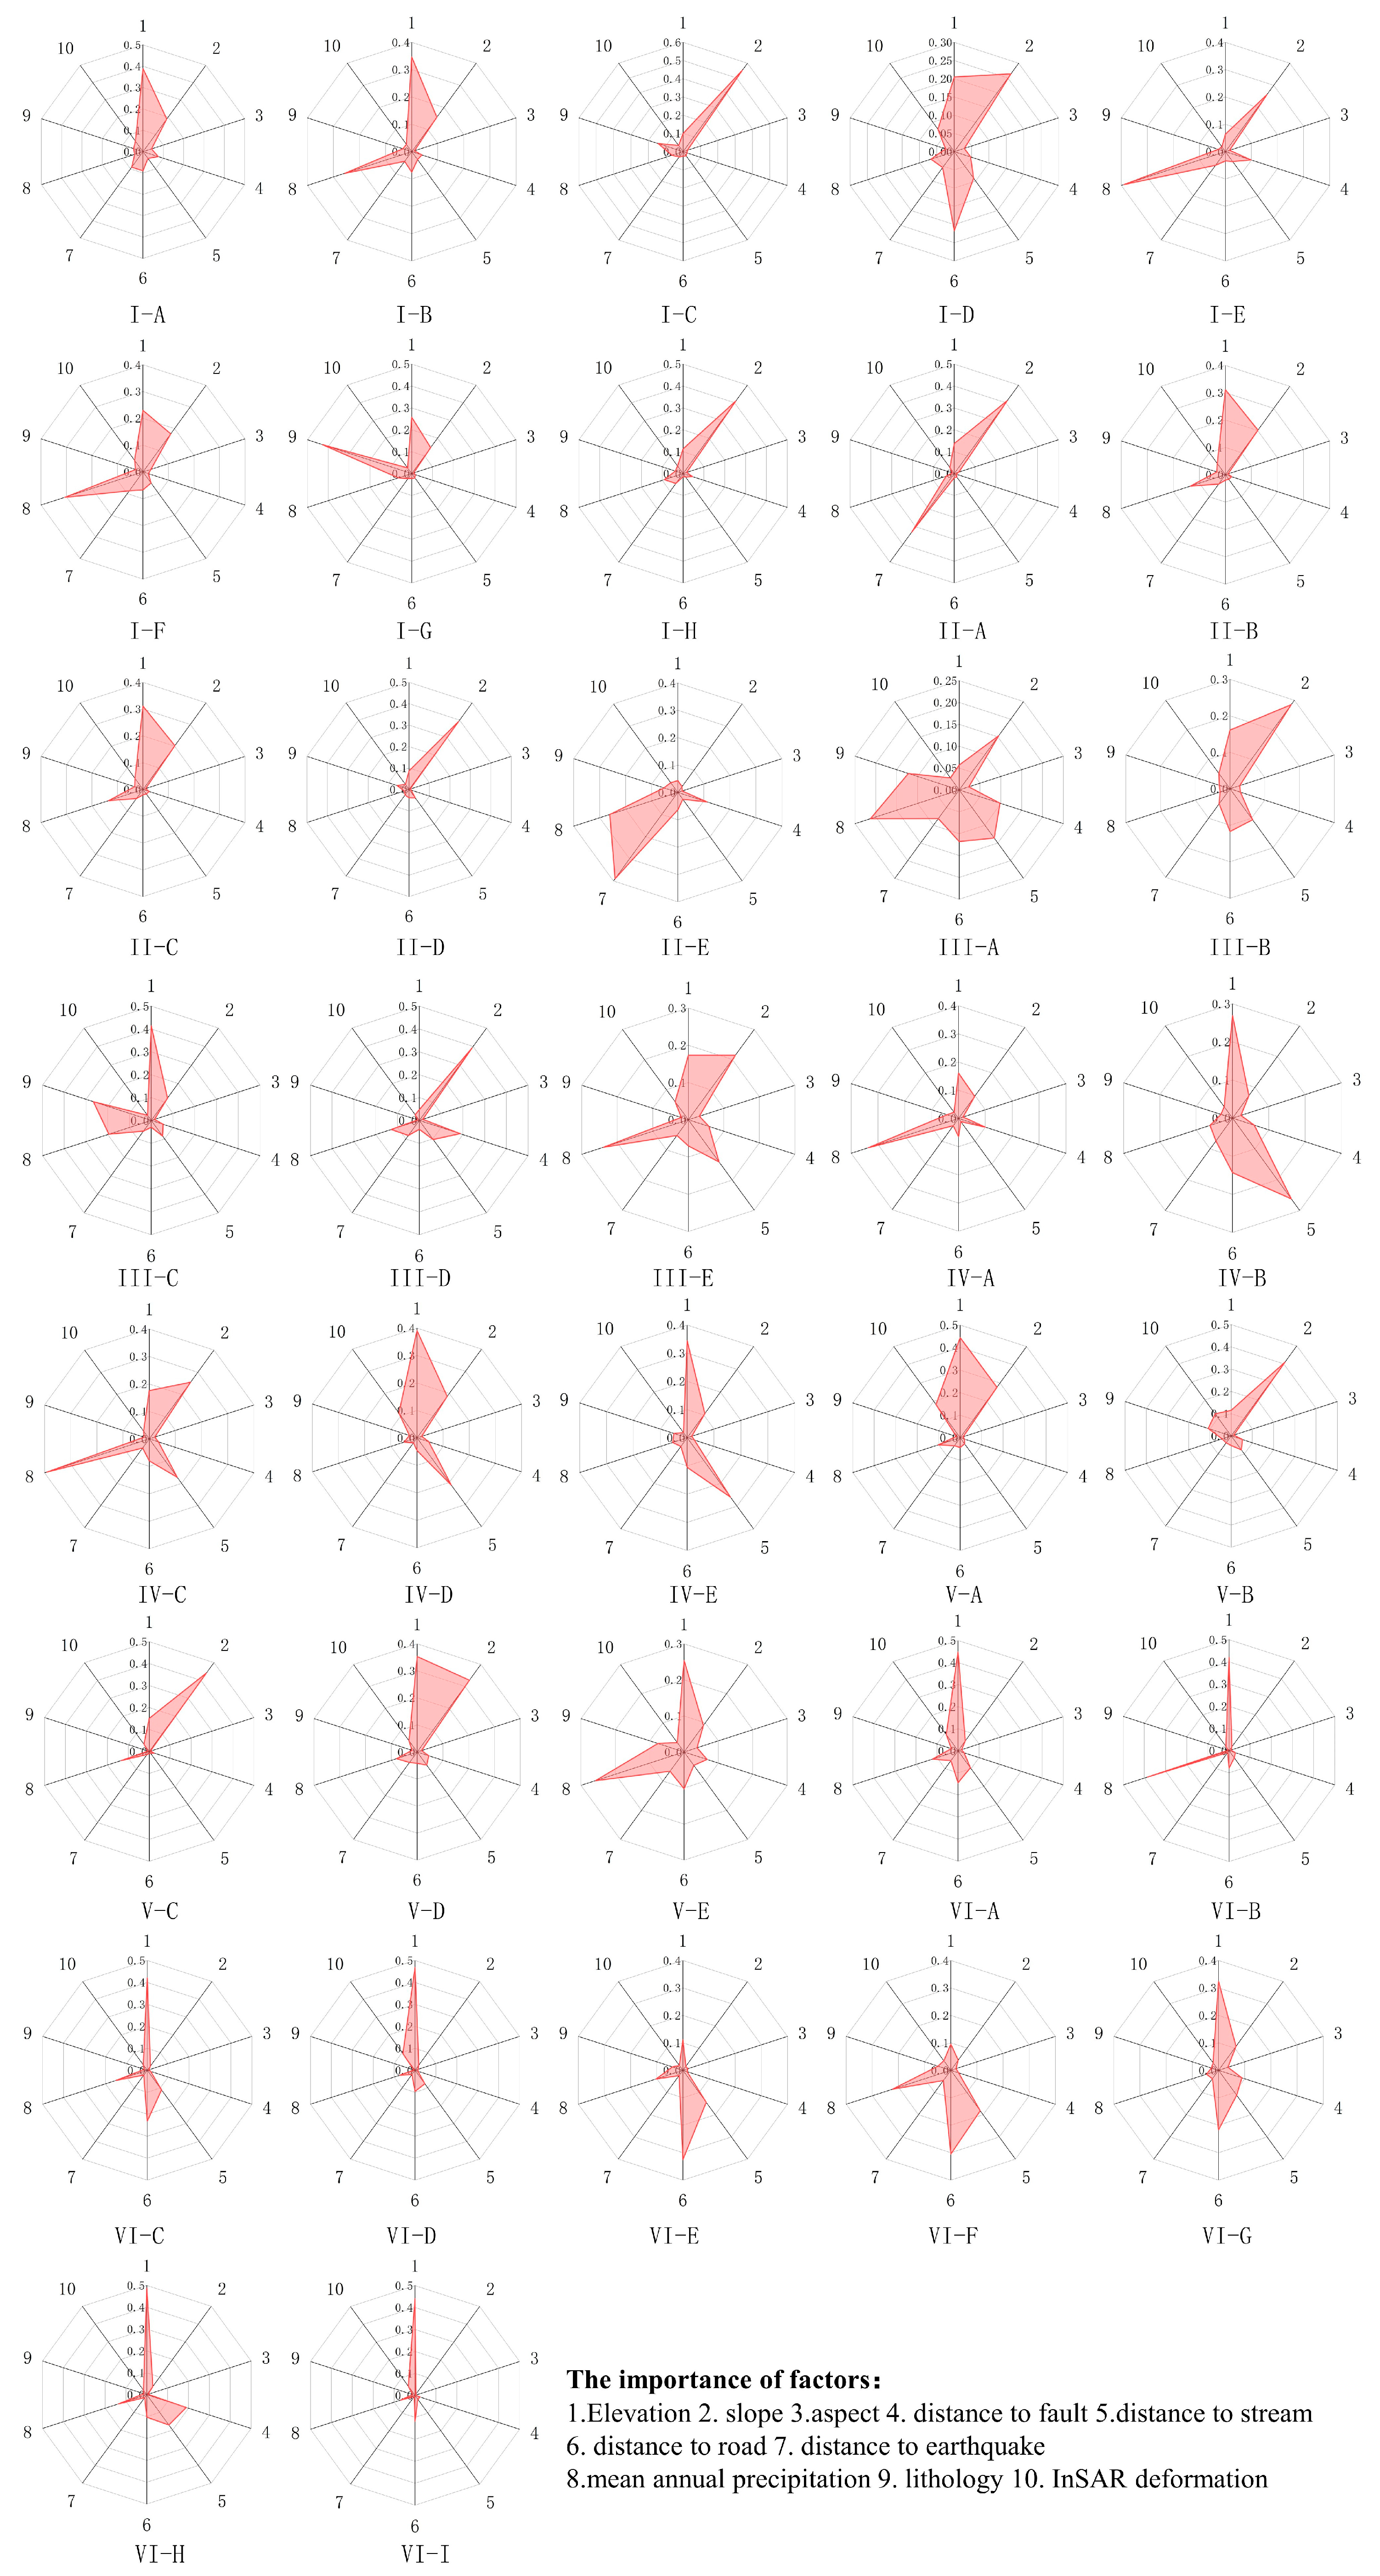
Figure 17.
Importance map of assessment factors.
Figure 17.
Importance map of assessment factors.
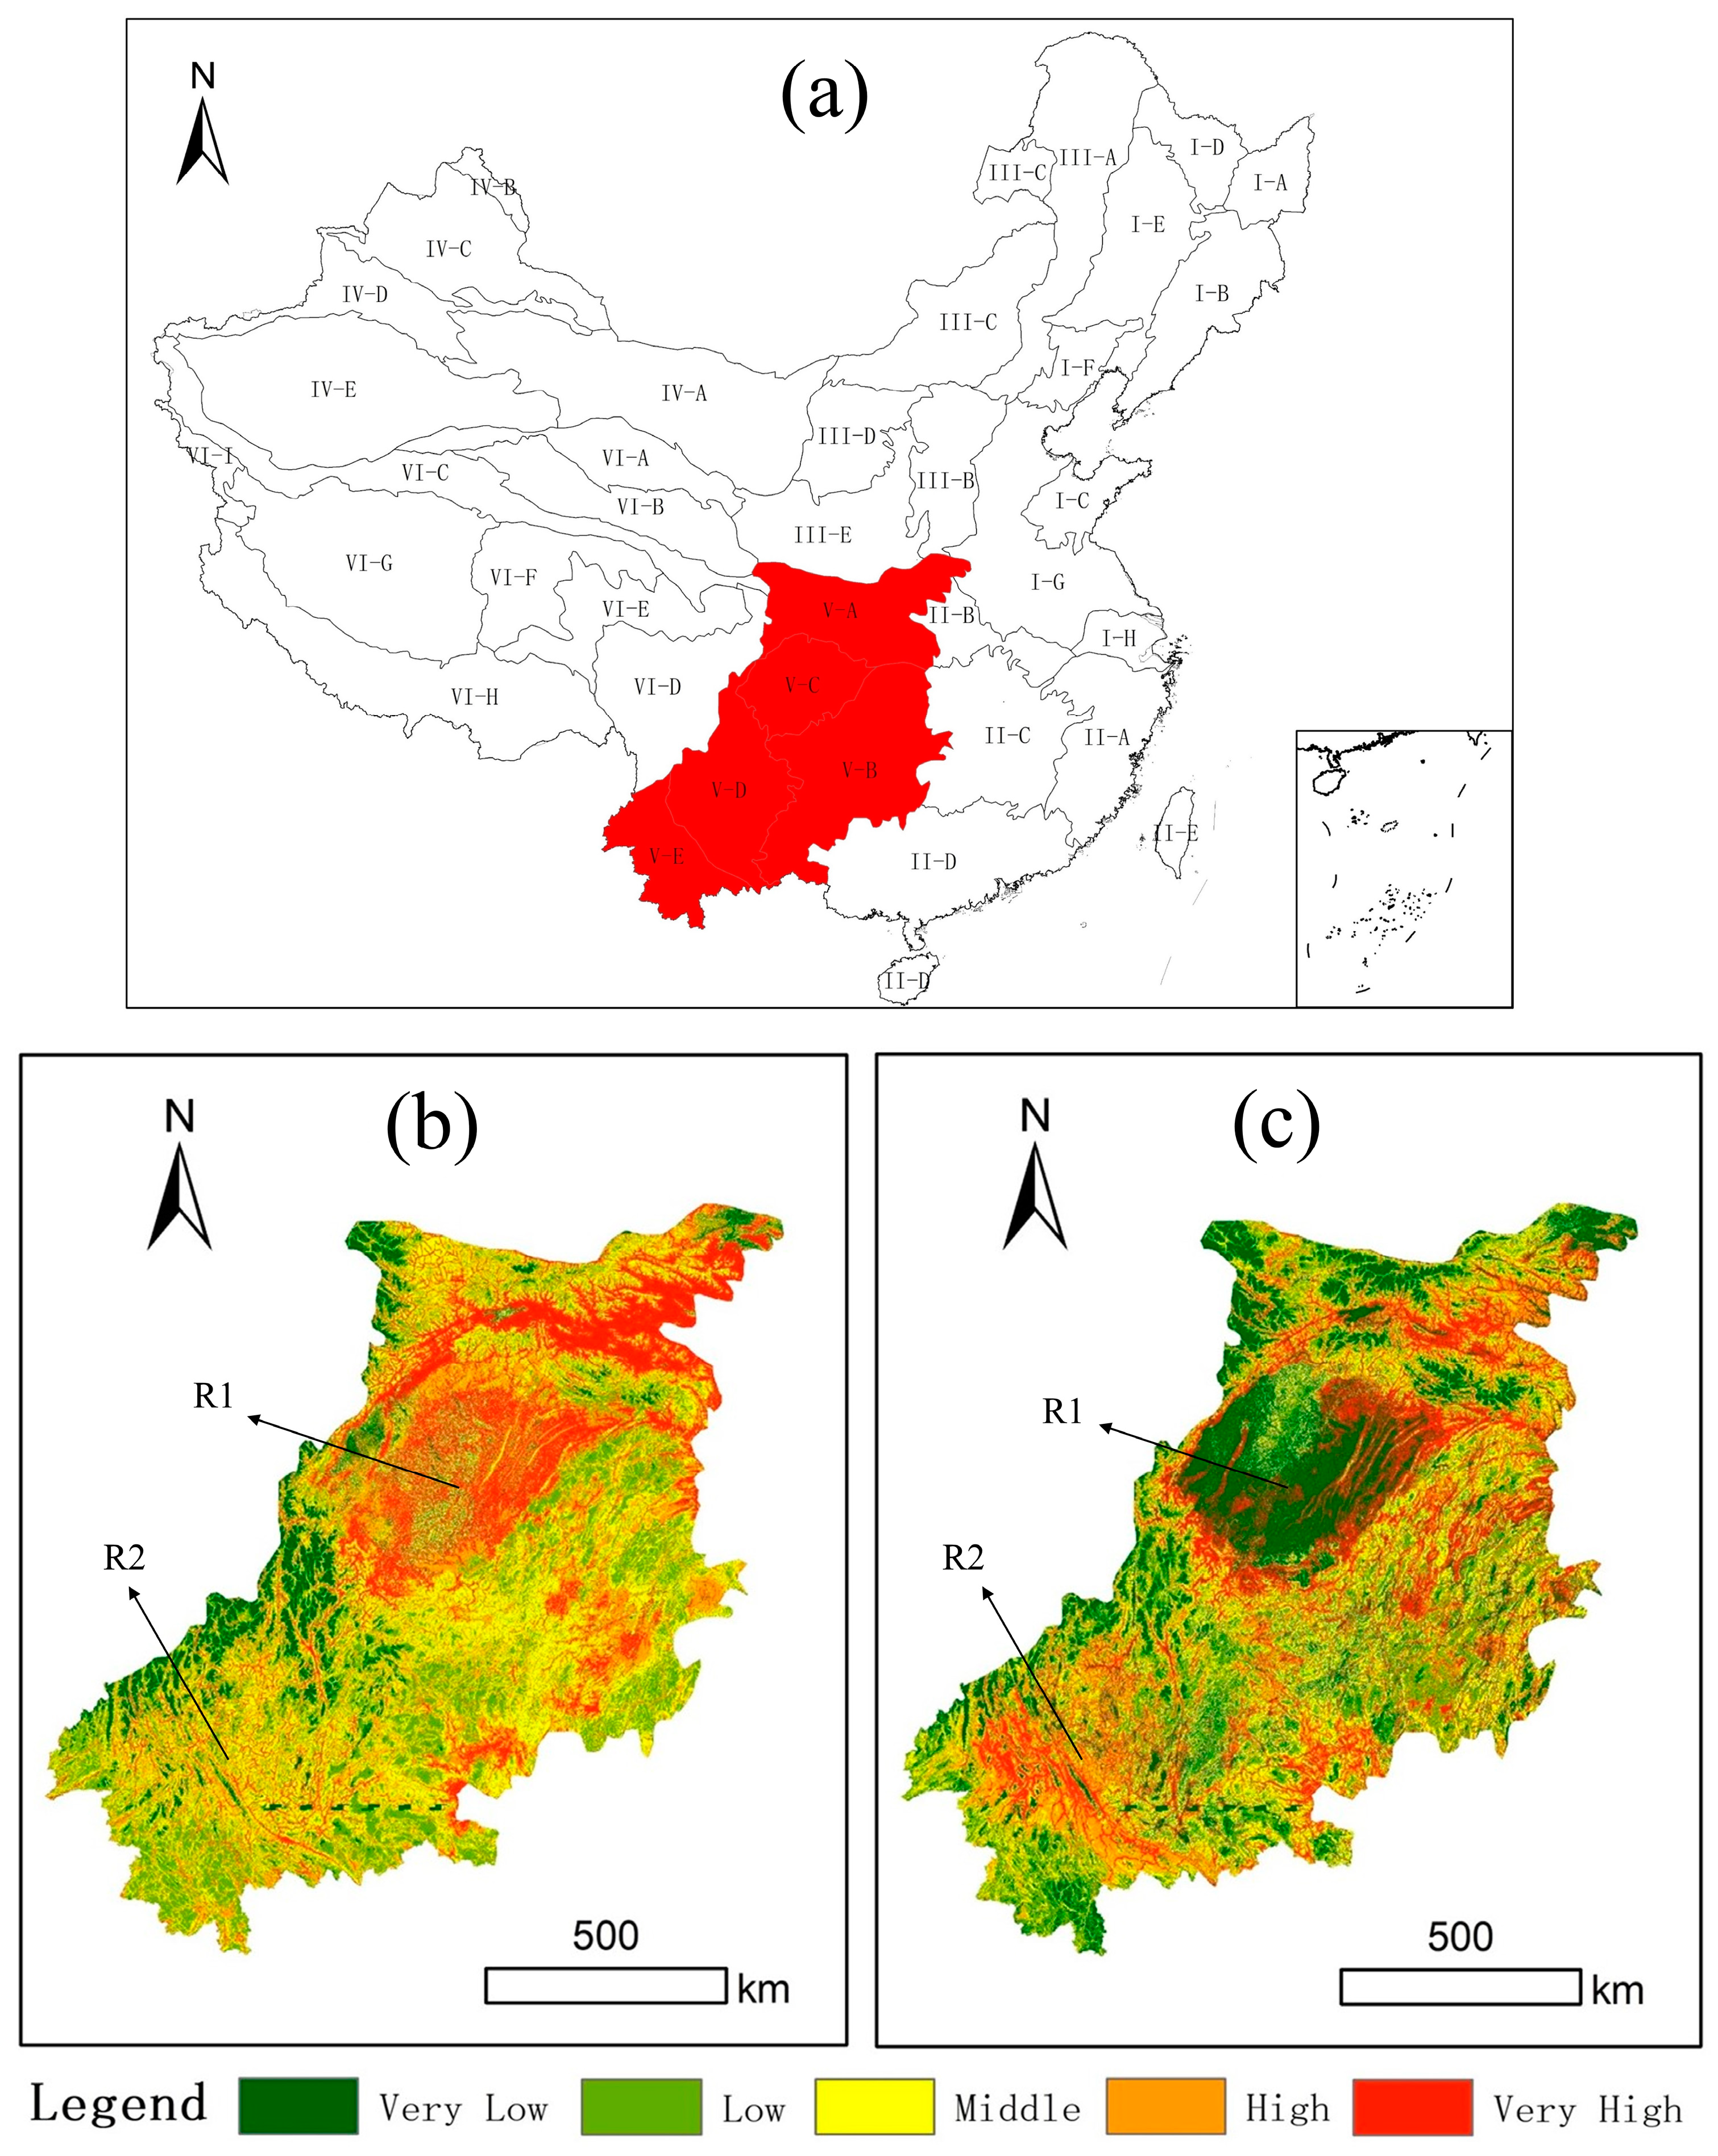
Figure 18.
LSMs based on geomorphological regionalization. (a) Location of geomorphological region V (b) LSM for region V without geomorphological regionalization. (c) LSM for region V based on geomorphological regionalization.
Figure 18.
LSMs based on geomorphological regionalization. (a) Location of geomorphological region V (b) LSM for region V without geomorphological regionalization. (c) LSM for region V based on geomorphological regionalization.
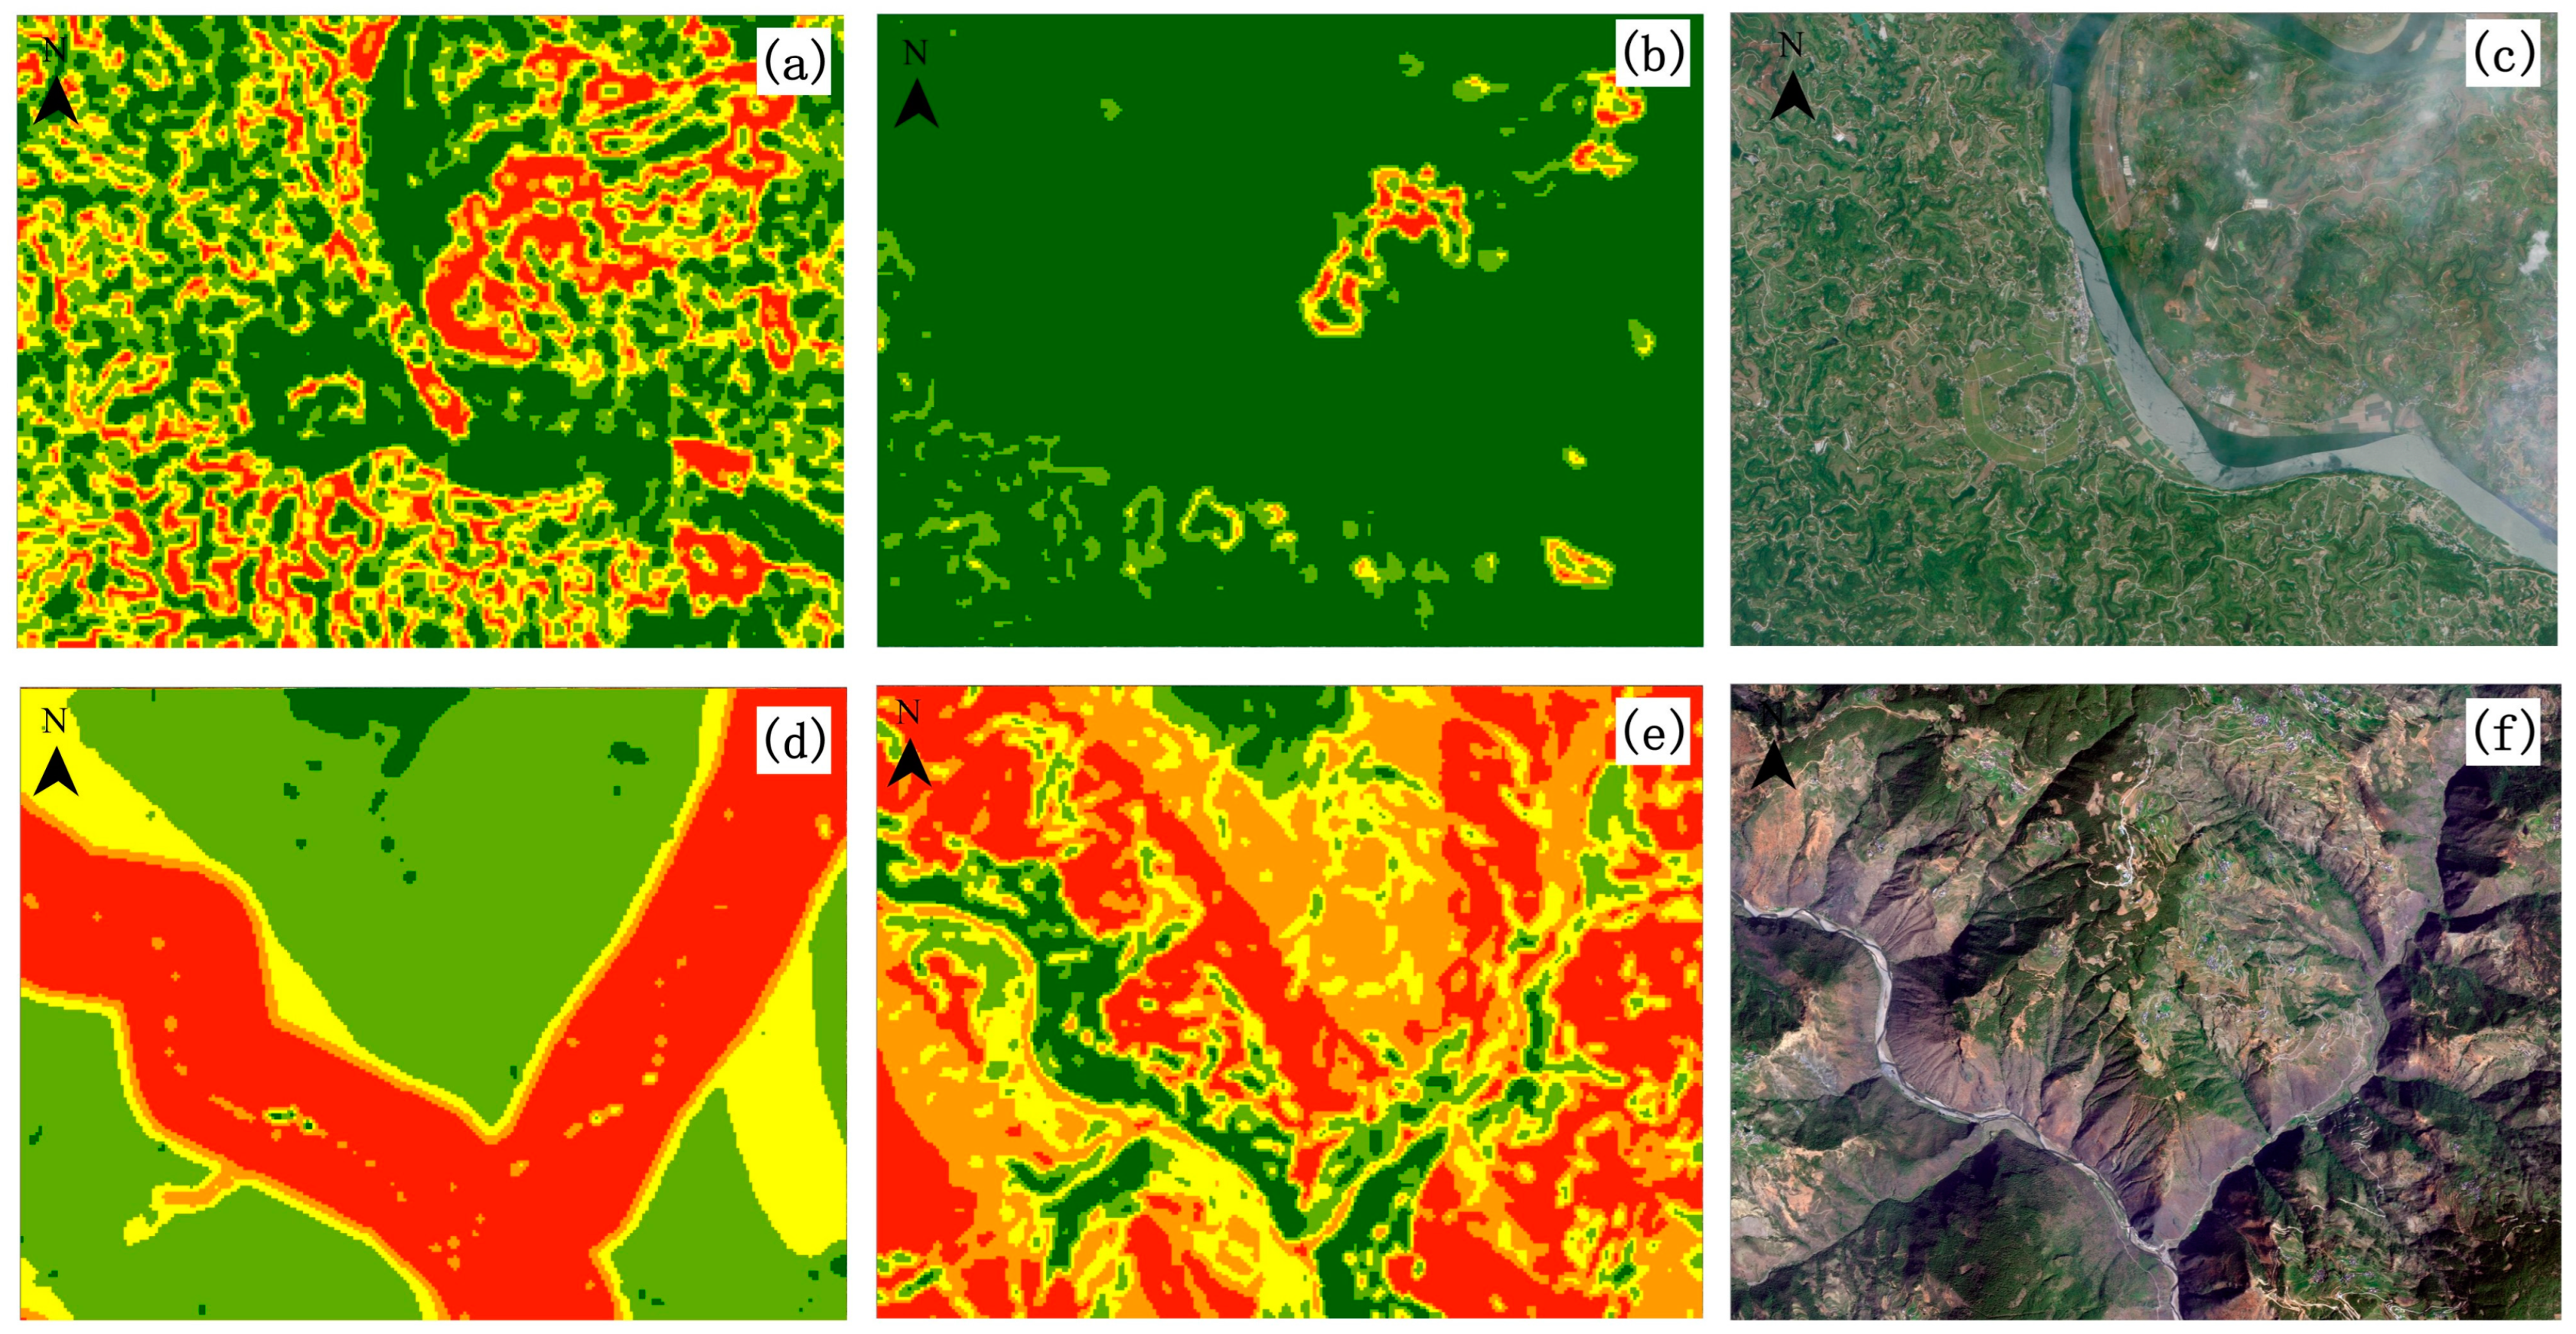
Figure 19.
Optical remote sensing imagery and LSM of R1 and R2. (a) LSM for R1 without geomorphological regionalization. (b) LSM for R1 based on geomorphological regionalization. (c) Optical remote sensing image at L1. (d) LSM for R2 without geomorphological regionalization. (e) LSM for R2 based on geomorphological regionalization. (f) Optical remote sensing image at L2.
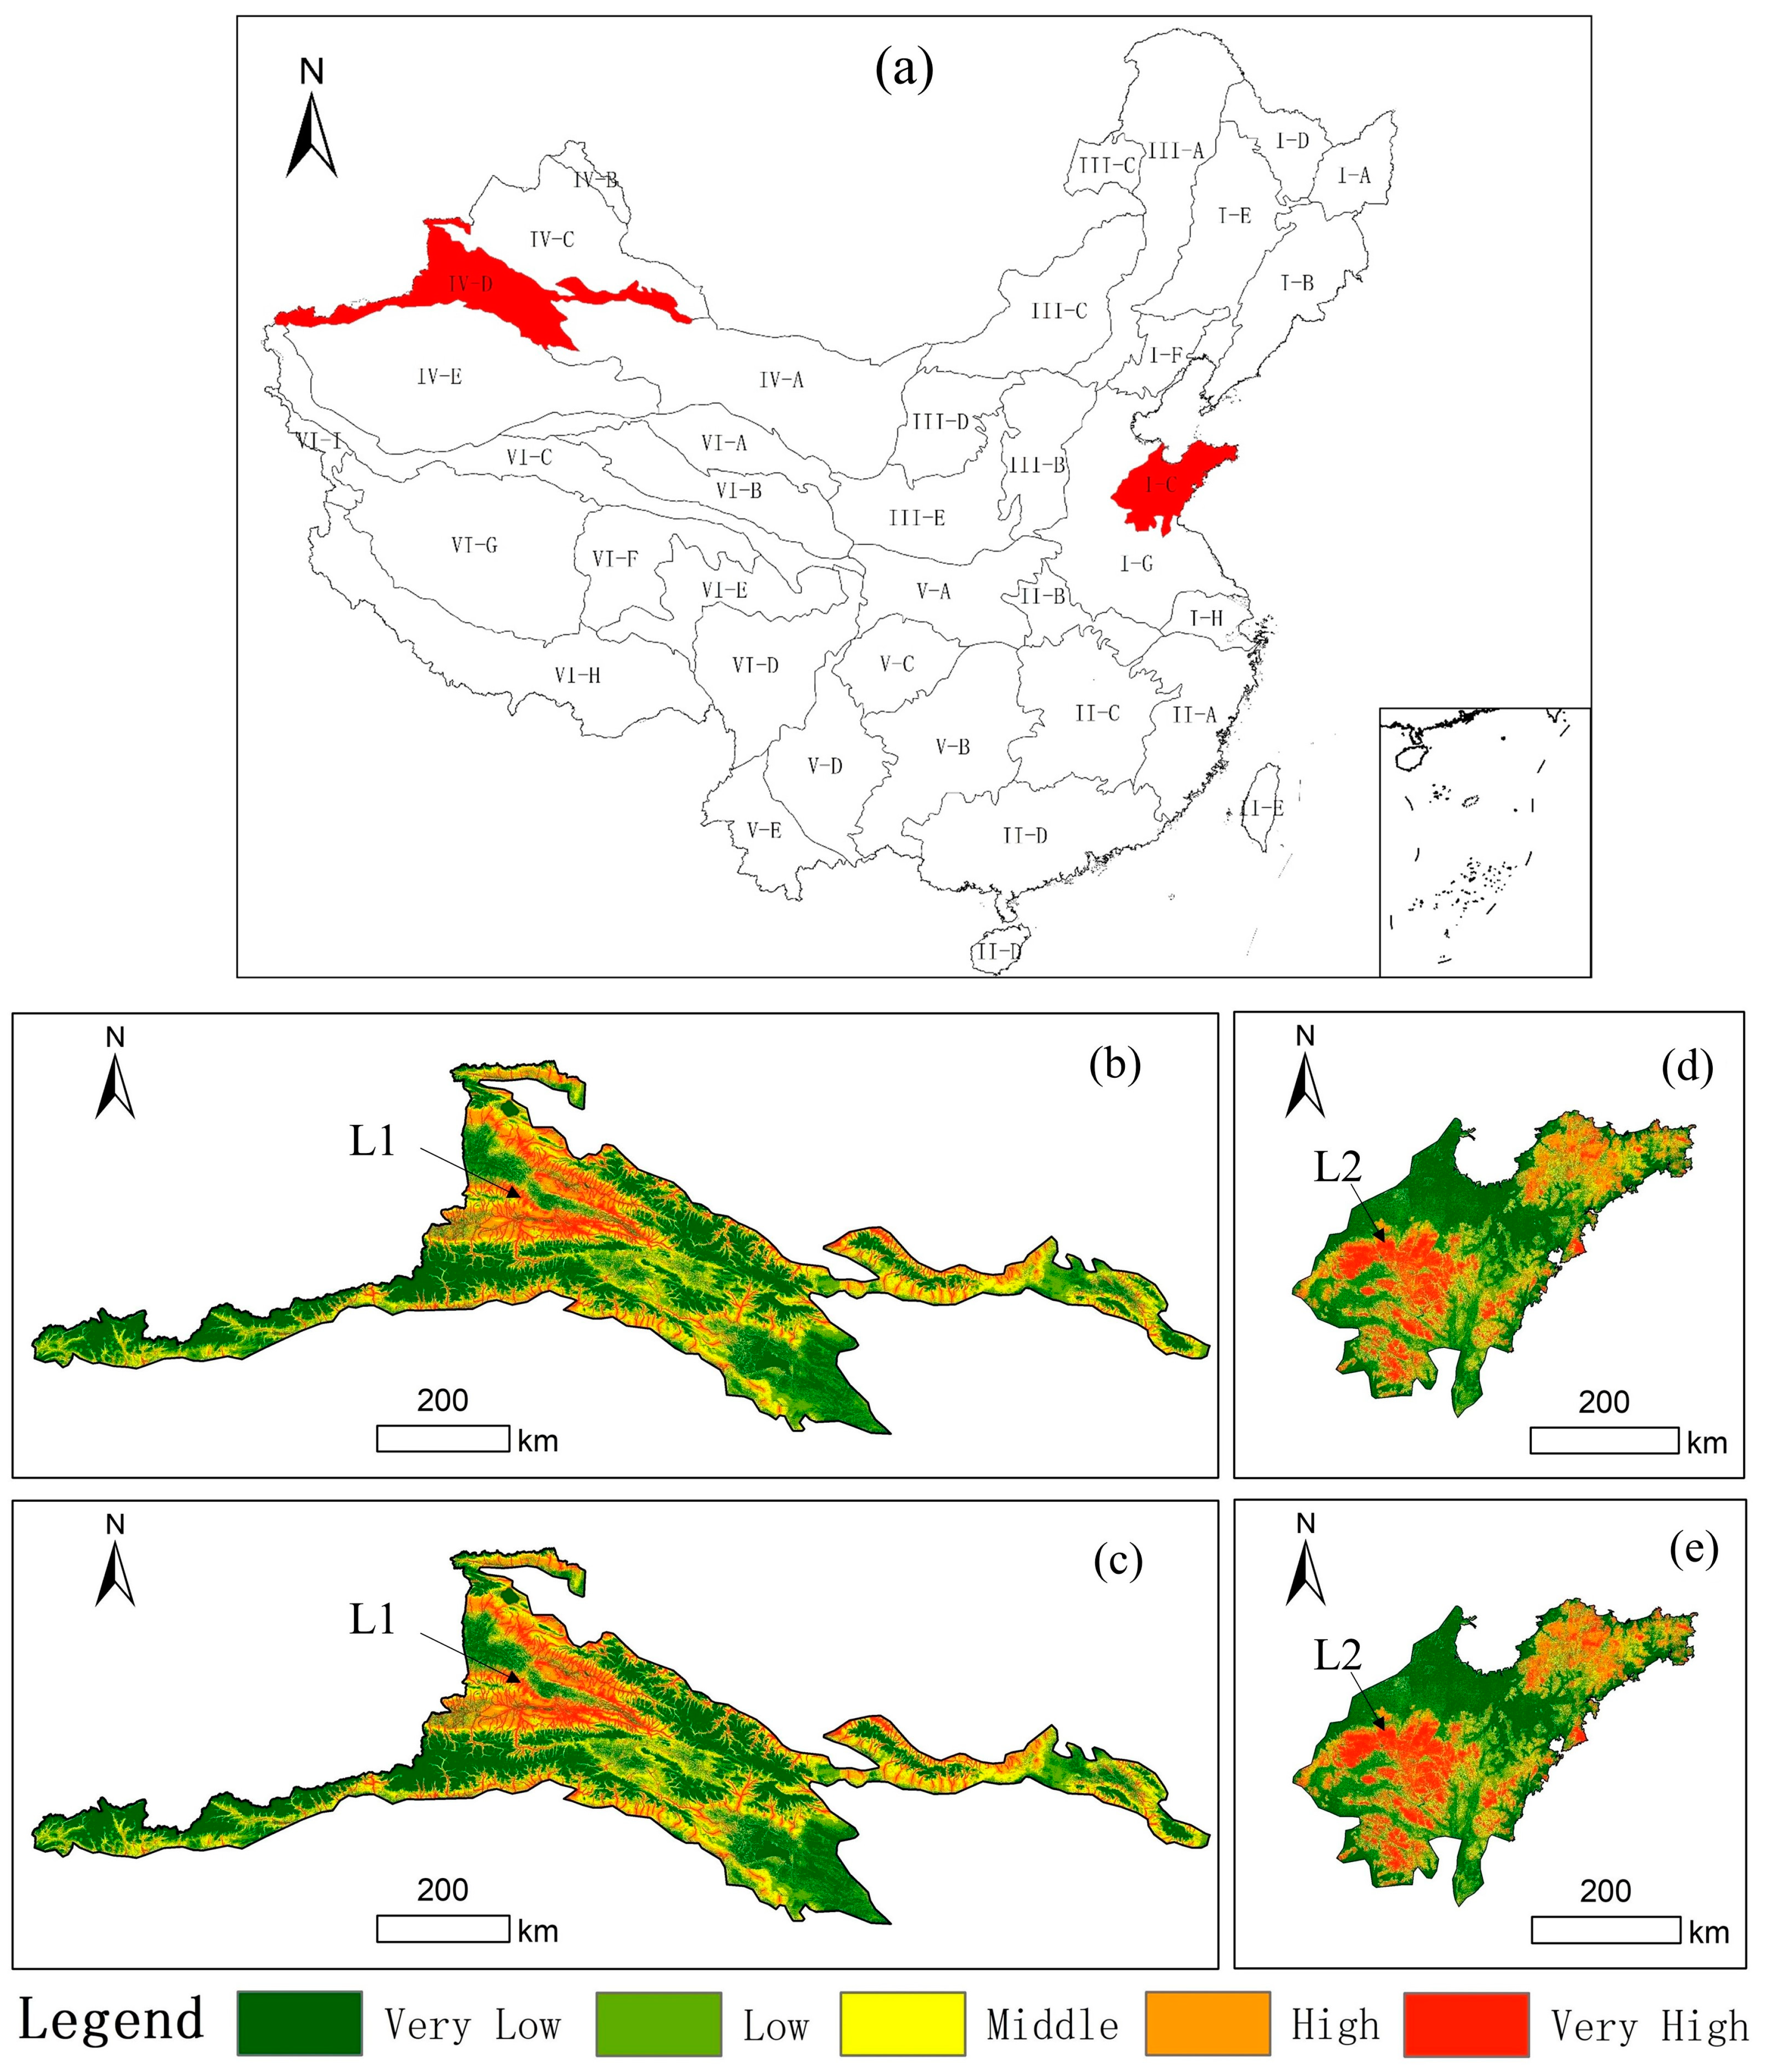
Figure 20.
LSMs generated using different methods. (a) Location of districts IV-D and I-C. (b) LSM for IV-D using environmental factors. (c) LSM for IV-D with dynamic features. (d) LSM for I-C using environmental factors. (e) LSM for I-C with dynamic features.
Figure 20.
LSMs generated using different methods. (a) Location of districts IV-D and I-C. (b) LSM for IV-D using environmental factors. (c) LSM for IV-D with dynamic features. (d) LSM for I-C using environmental factors. (e) LSM for I-C with dynamic features.
Figure 21.
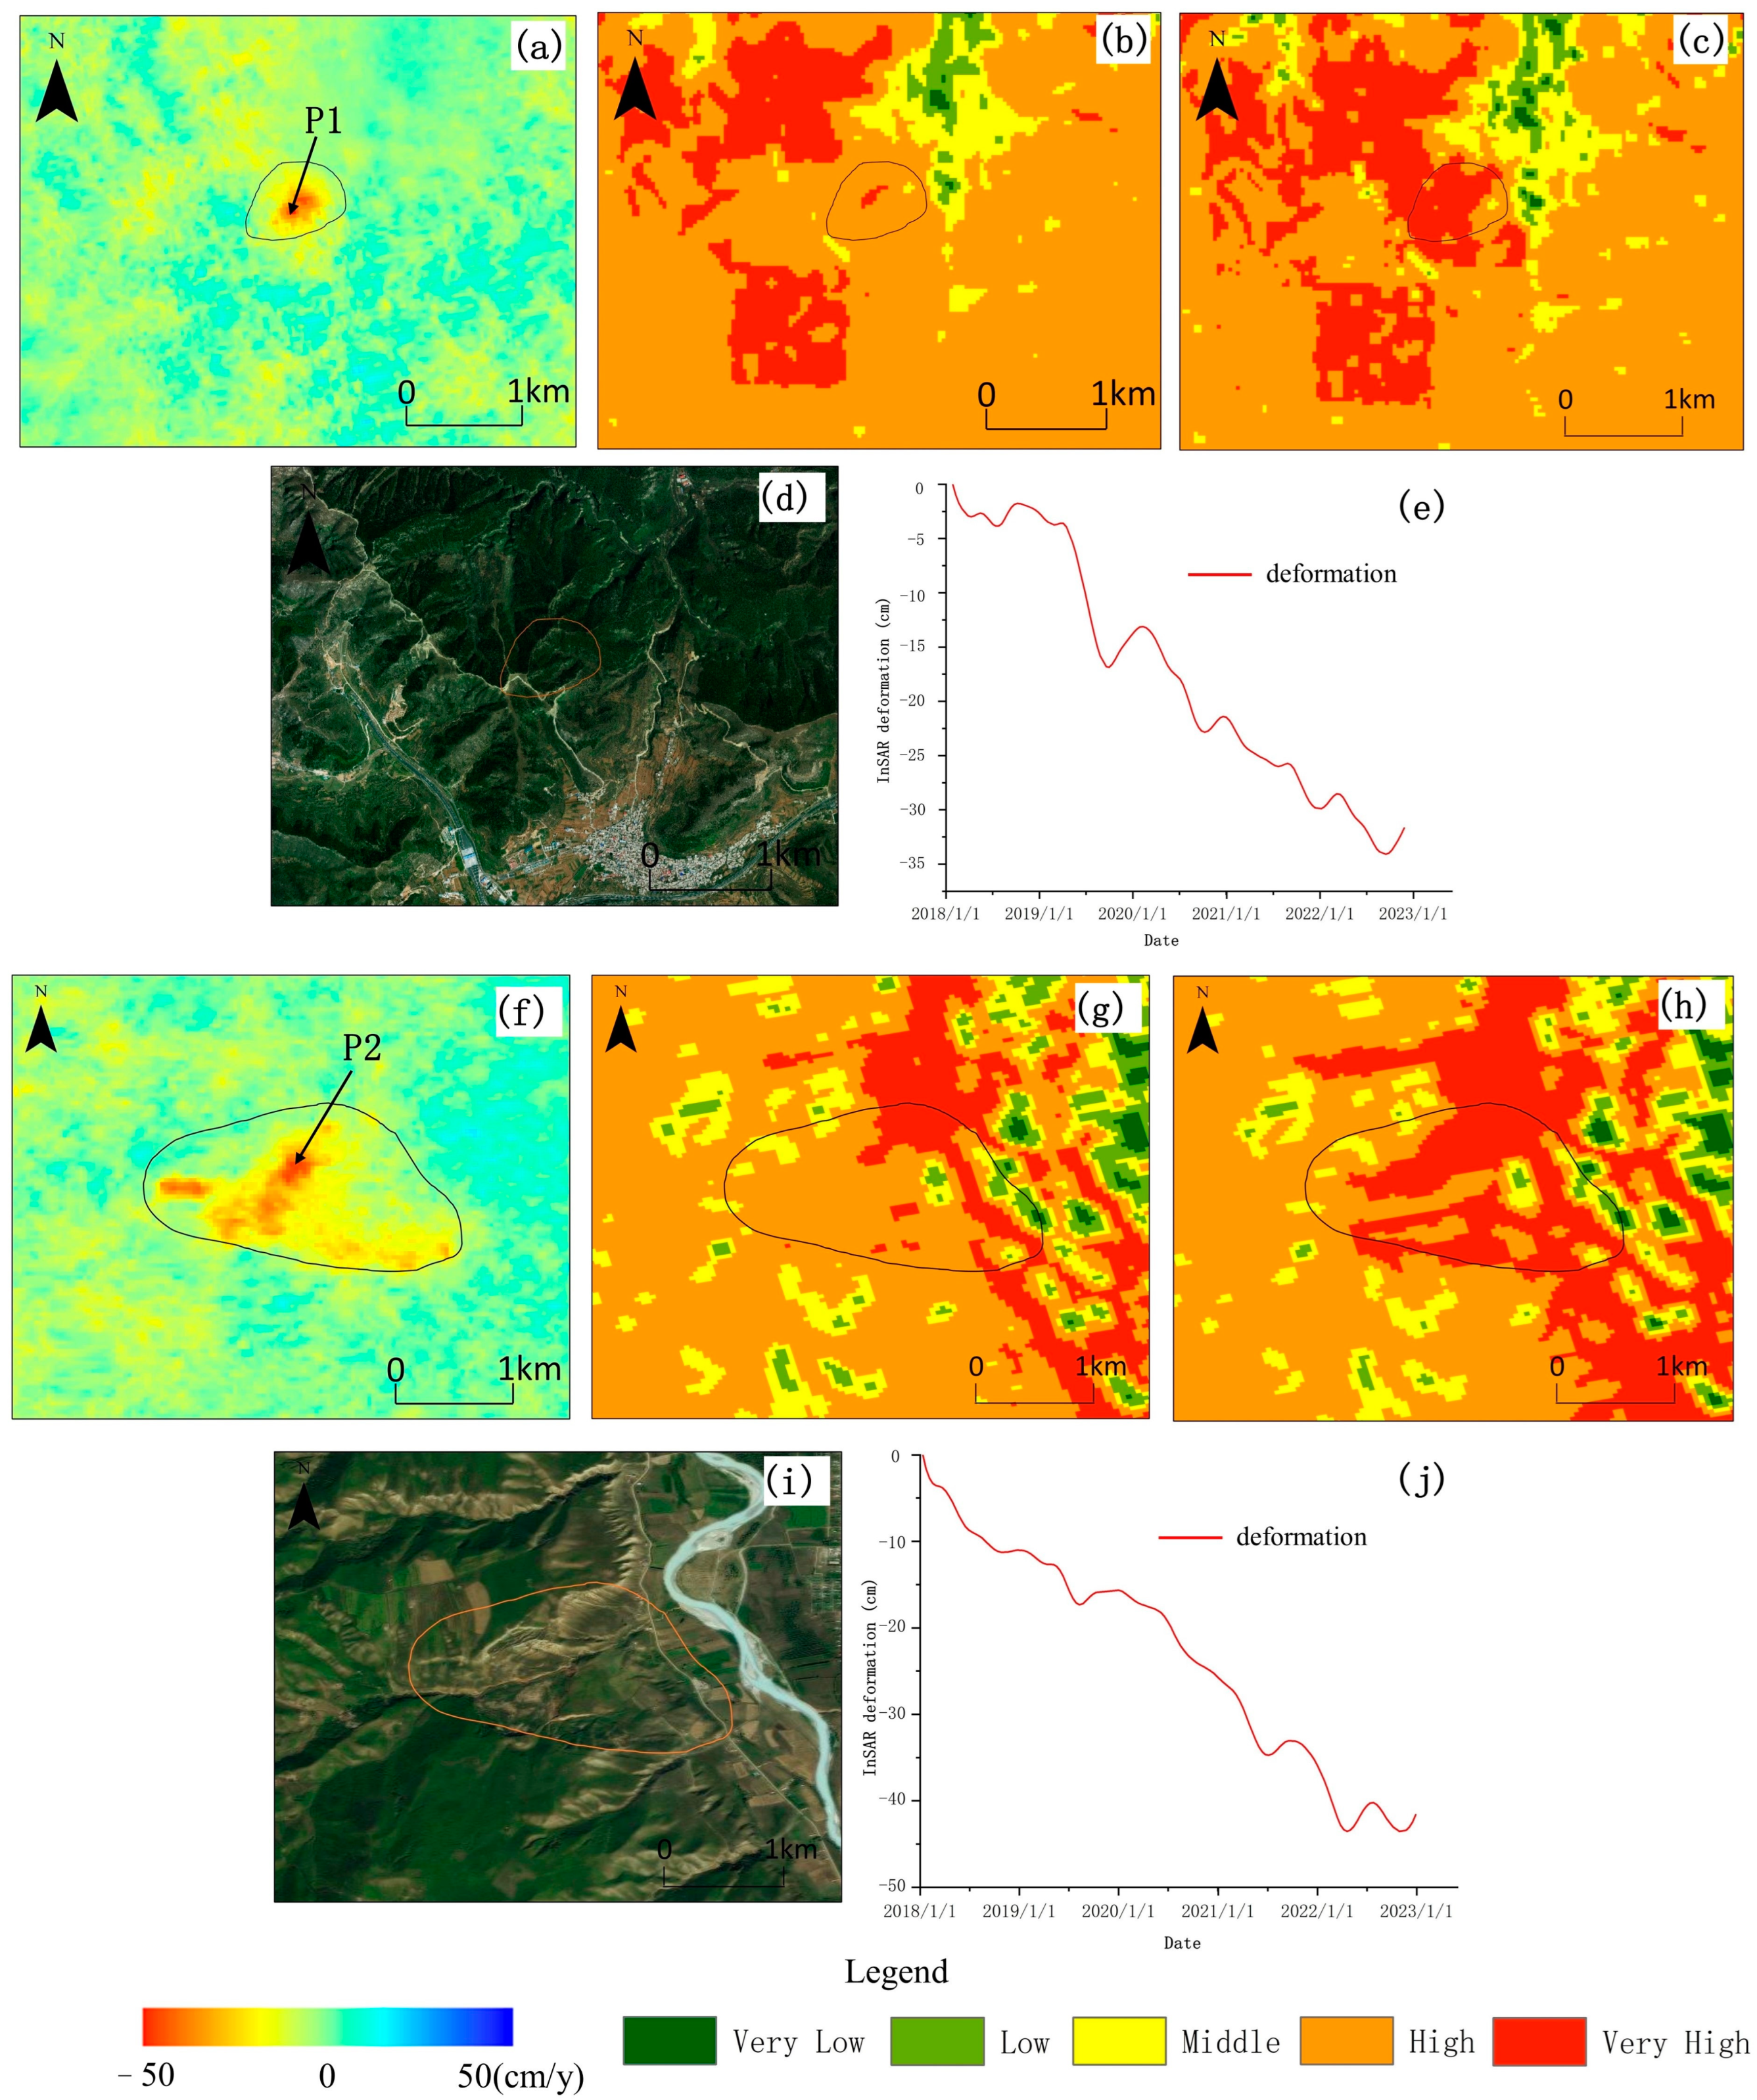
Typical regional susceptibility comparison results. (a) Surface deformation rate map for L1. (b) LSM for L1 using environmental factors. (c) LSM for L1 with dynamic features. (d) Optical remote sensing image at L1. (e) InSAR time-series deformation curve at point P1 in L1. (f) Surface deformation rate map for L2. (g) LSM for L2 using environmental factors. (h) LSM for L2 with dynamic features. (i) Optical remote sensing image at L2. (j) InSAR time-series deformation curve at point P2 in L2.
Figure 21.
Typical regional susceptibility comparison results. (a) Surface deformation rate map for L1. (b) LSM for L1 using environmental factors. (c) LSM for L1 with dynamic features. (d) Optical remote sensing image at L1. (e) InSAR time-series deformation curve at point P1 in L1. (f) Surface deformation rate map for L2. (g) LSM for L2 using environmental factors. (h) LSM for L2 with dynamic features. (i) Optical remote sensing image at L2. (j) InSAR time-series deformation curve at point P2 in L2.
Figure 22.
Very high landslide susceptibility zones in the Tianshan Mountains (a) Location of the Tianshan Mountains (b) LSM of the Tianshan Mountains (c) Optical remote sensing image at point A (d) InSAR time-series deformation curve at point A (e) LSM at A.
Figure 22.
Very high landslide susceptibility zones in the Tianshan Mountains (a) Location of the Tianshan Mountains (b) LSM of the Tianshan Mountains (c) Optical remote sensing image at point A (d) InSAR time-series deformation curve at point A (e) LSM at A.
Figure 23.
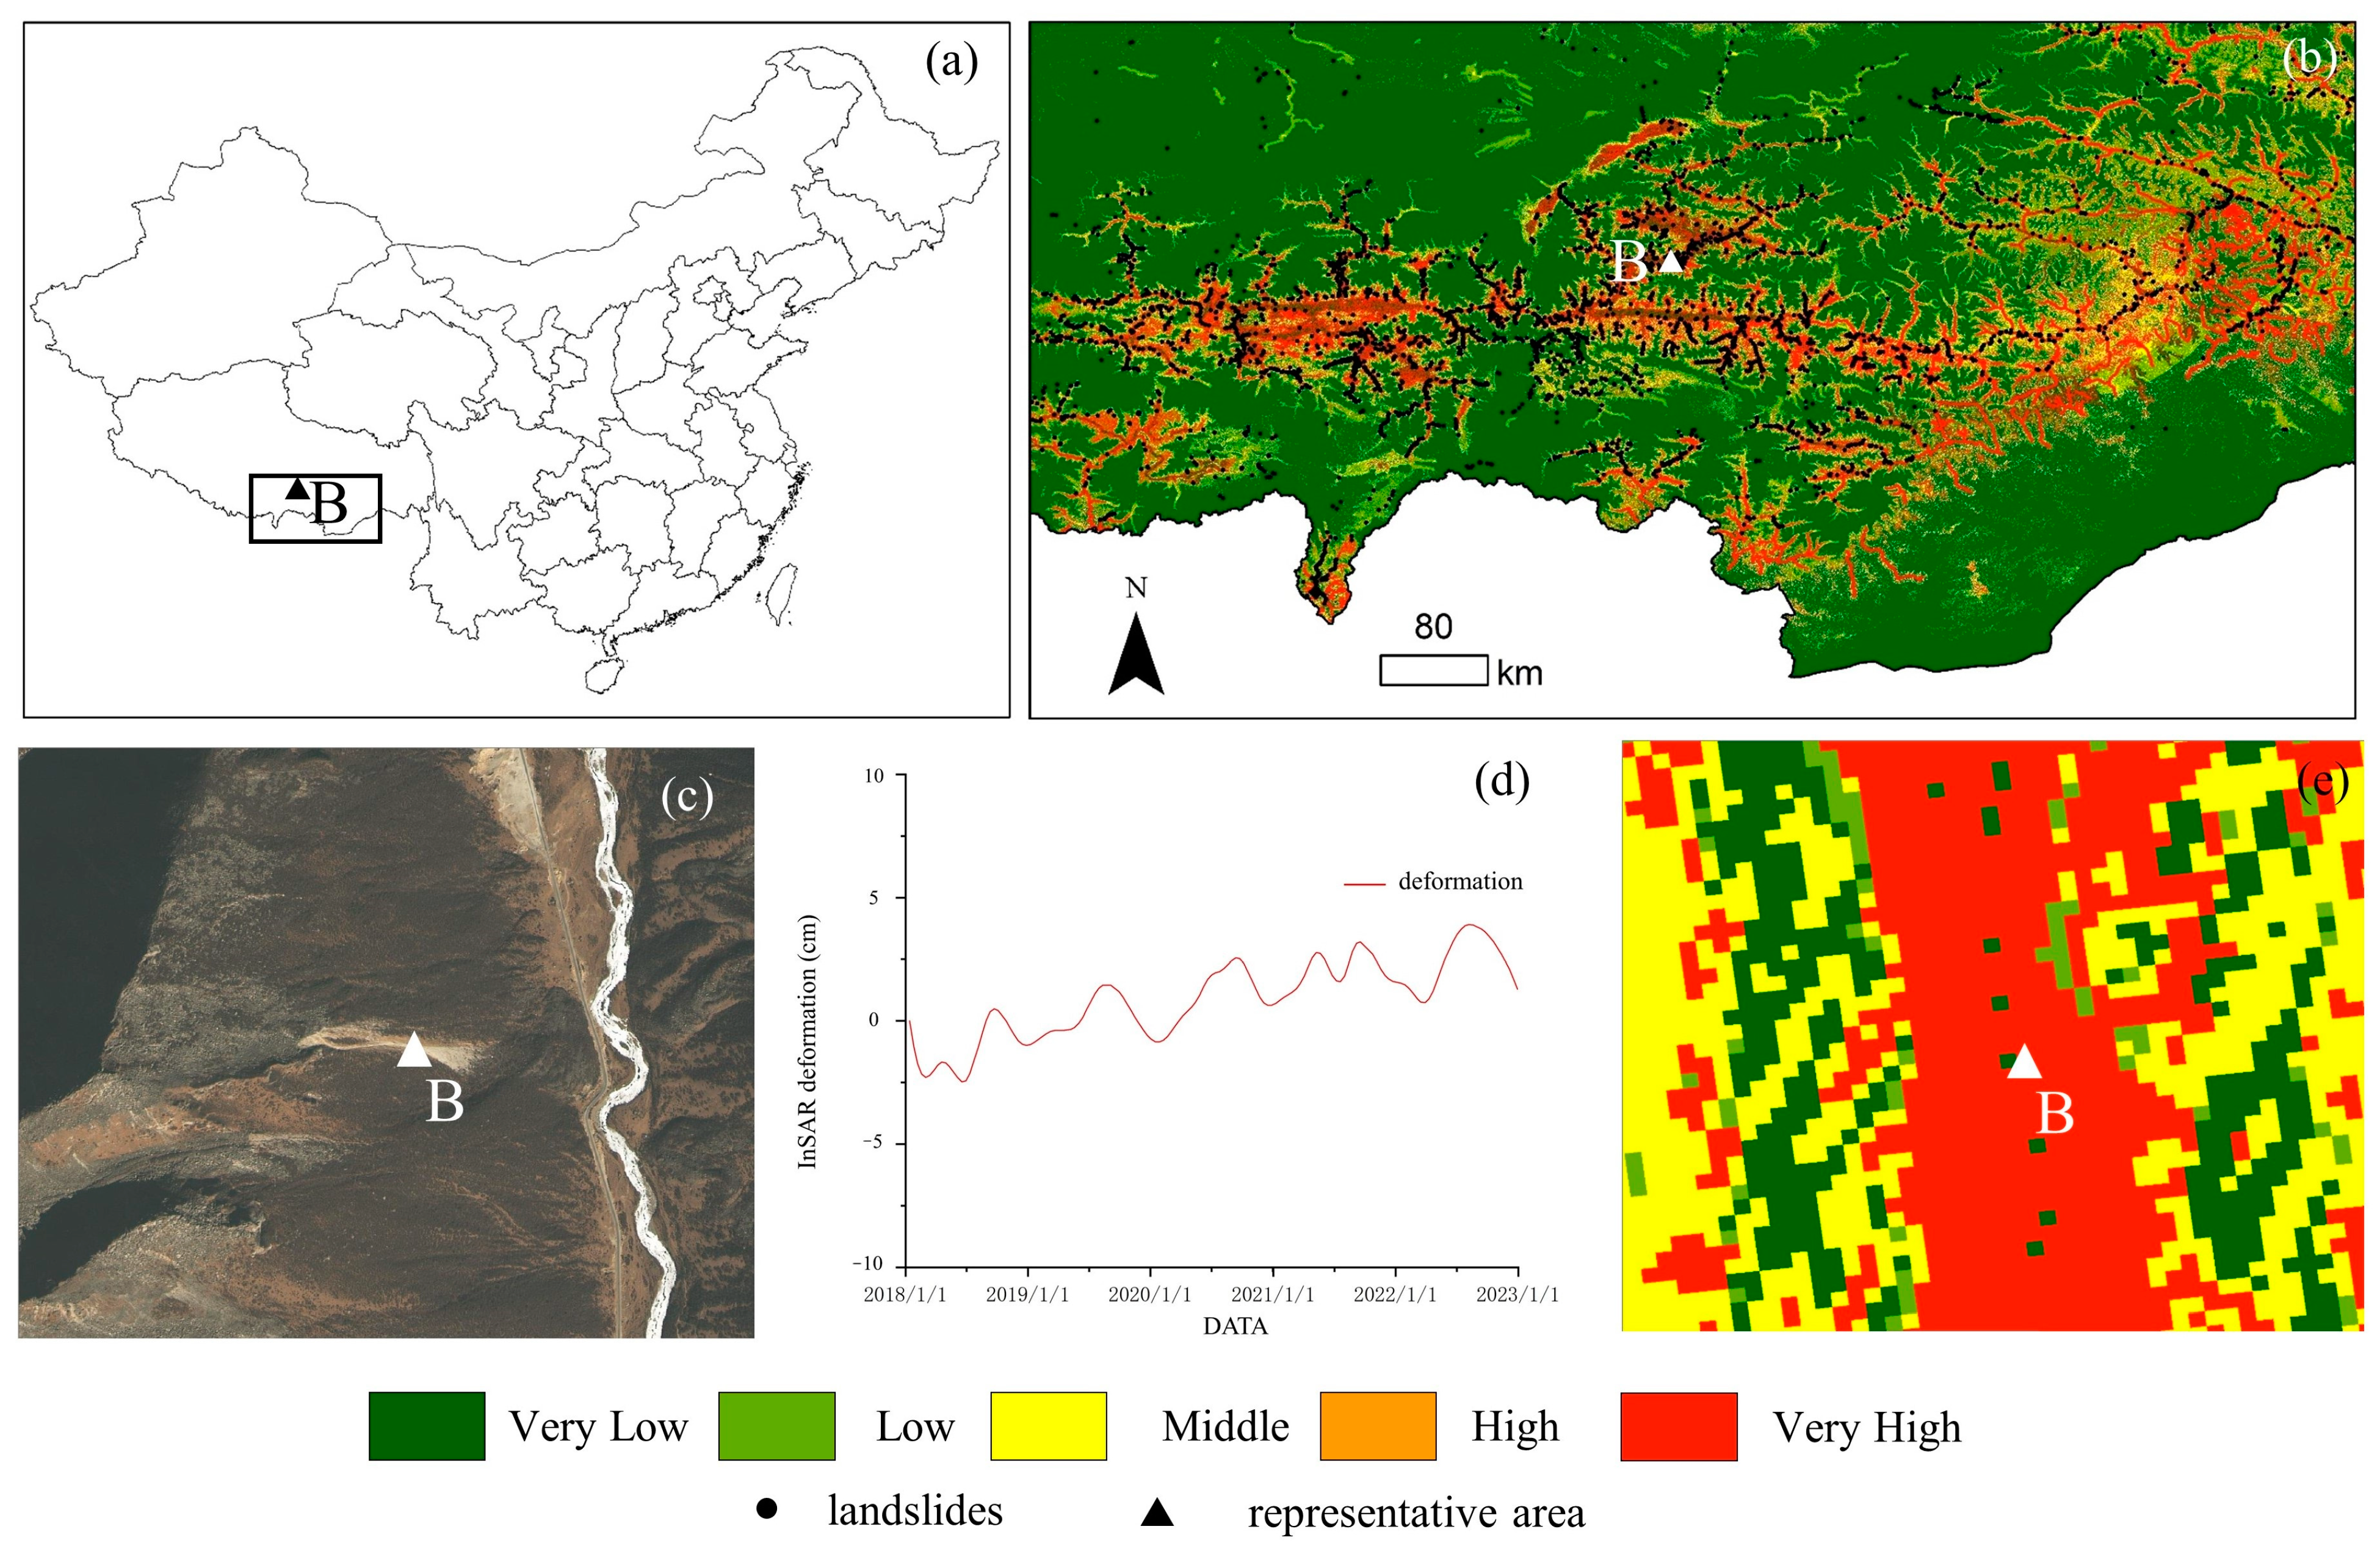
Very high landslide susceptibility zones in the Southern Tibetan Valley. (a) Location of the Southern Tibetan Valley. (b) LSM of the Southern Tibetan Valley. (c) Optical remote sensing image at point B. (d) InSAR time-series deformation curve at point A. (e) LSM at point B.
Figure 23.
Very high landslide susceptibility zones in the Southern Tibetan Valley. (a) Location of the Southern Tibetan Valley. (b) LSM of the Southern Tibetan Valley. (c) Optical remote sensing image at point B. (d) InSAR time-series deformation curve at point A. (e) LSM at point B.
Figure 24.
Very high landslide susceptibility zones in the Western Sichuan Basin. (a) Location of the Western Sichuan Basin. (b) LSM of the Western Sichuan Basin. (c) Optical remote sensing image at point C. (d) LSM at point C.
Figure 24.
Very high landslide susceptibility zones in the Western Sichuan Basin. (a) Location of the Western Sichuan Basin. (b) LSM of the Western Sichuan Basin. (c) Optical remote sensing image at point C. (d) LSM at point C.
Figure 25.
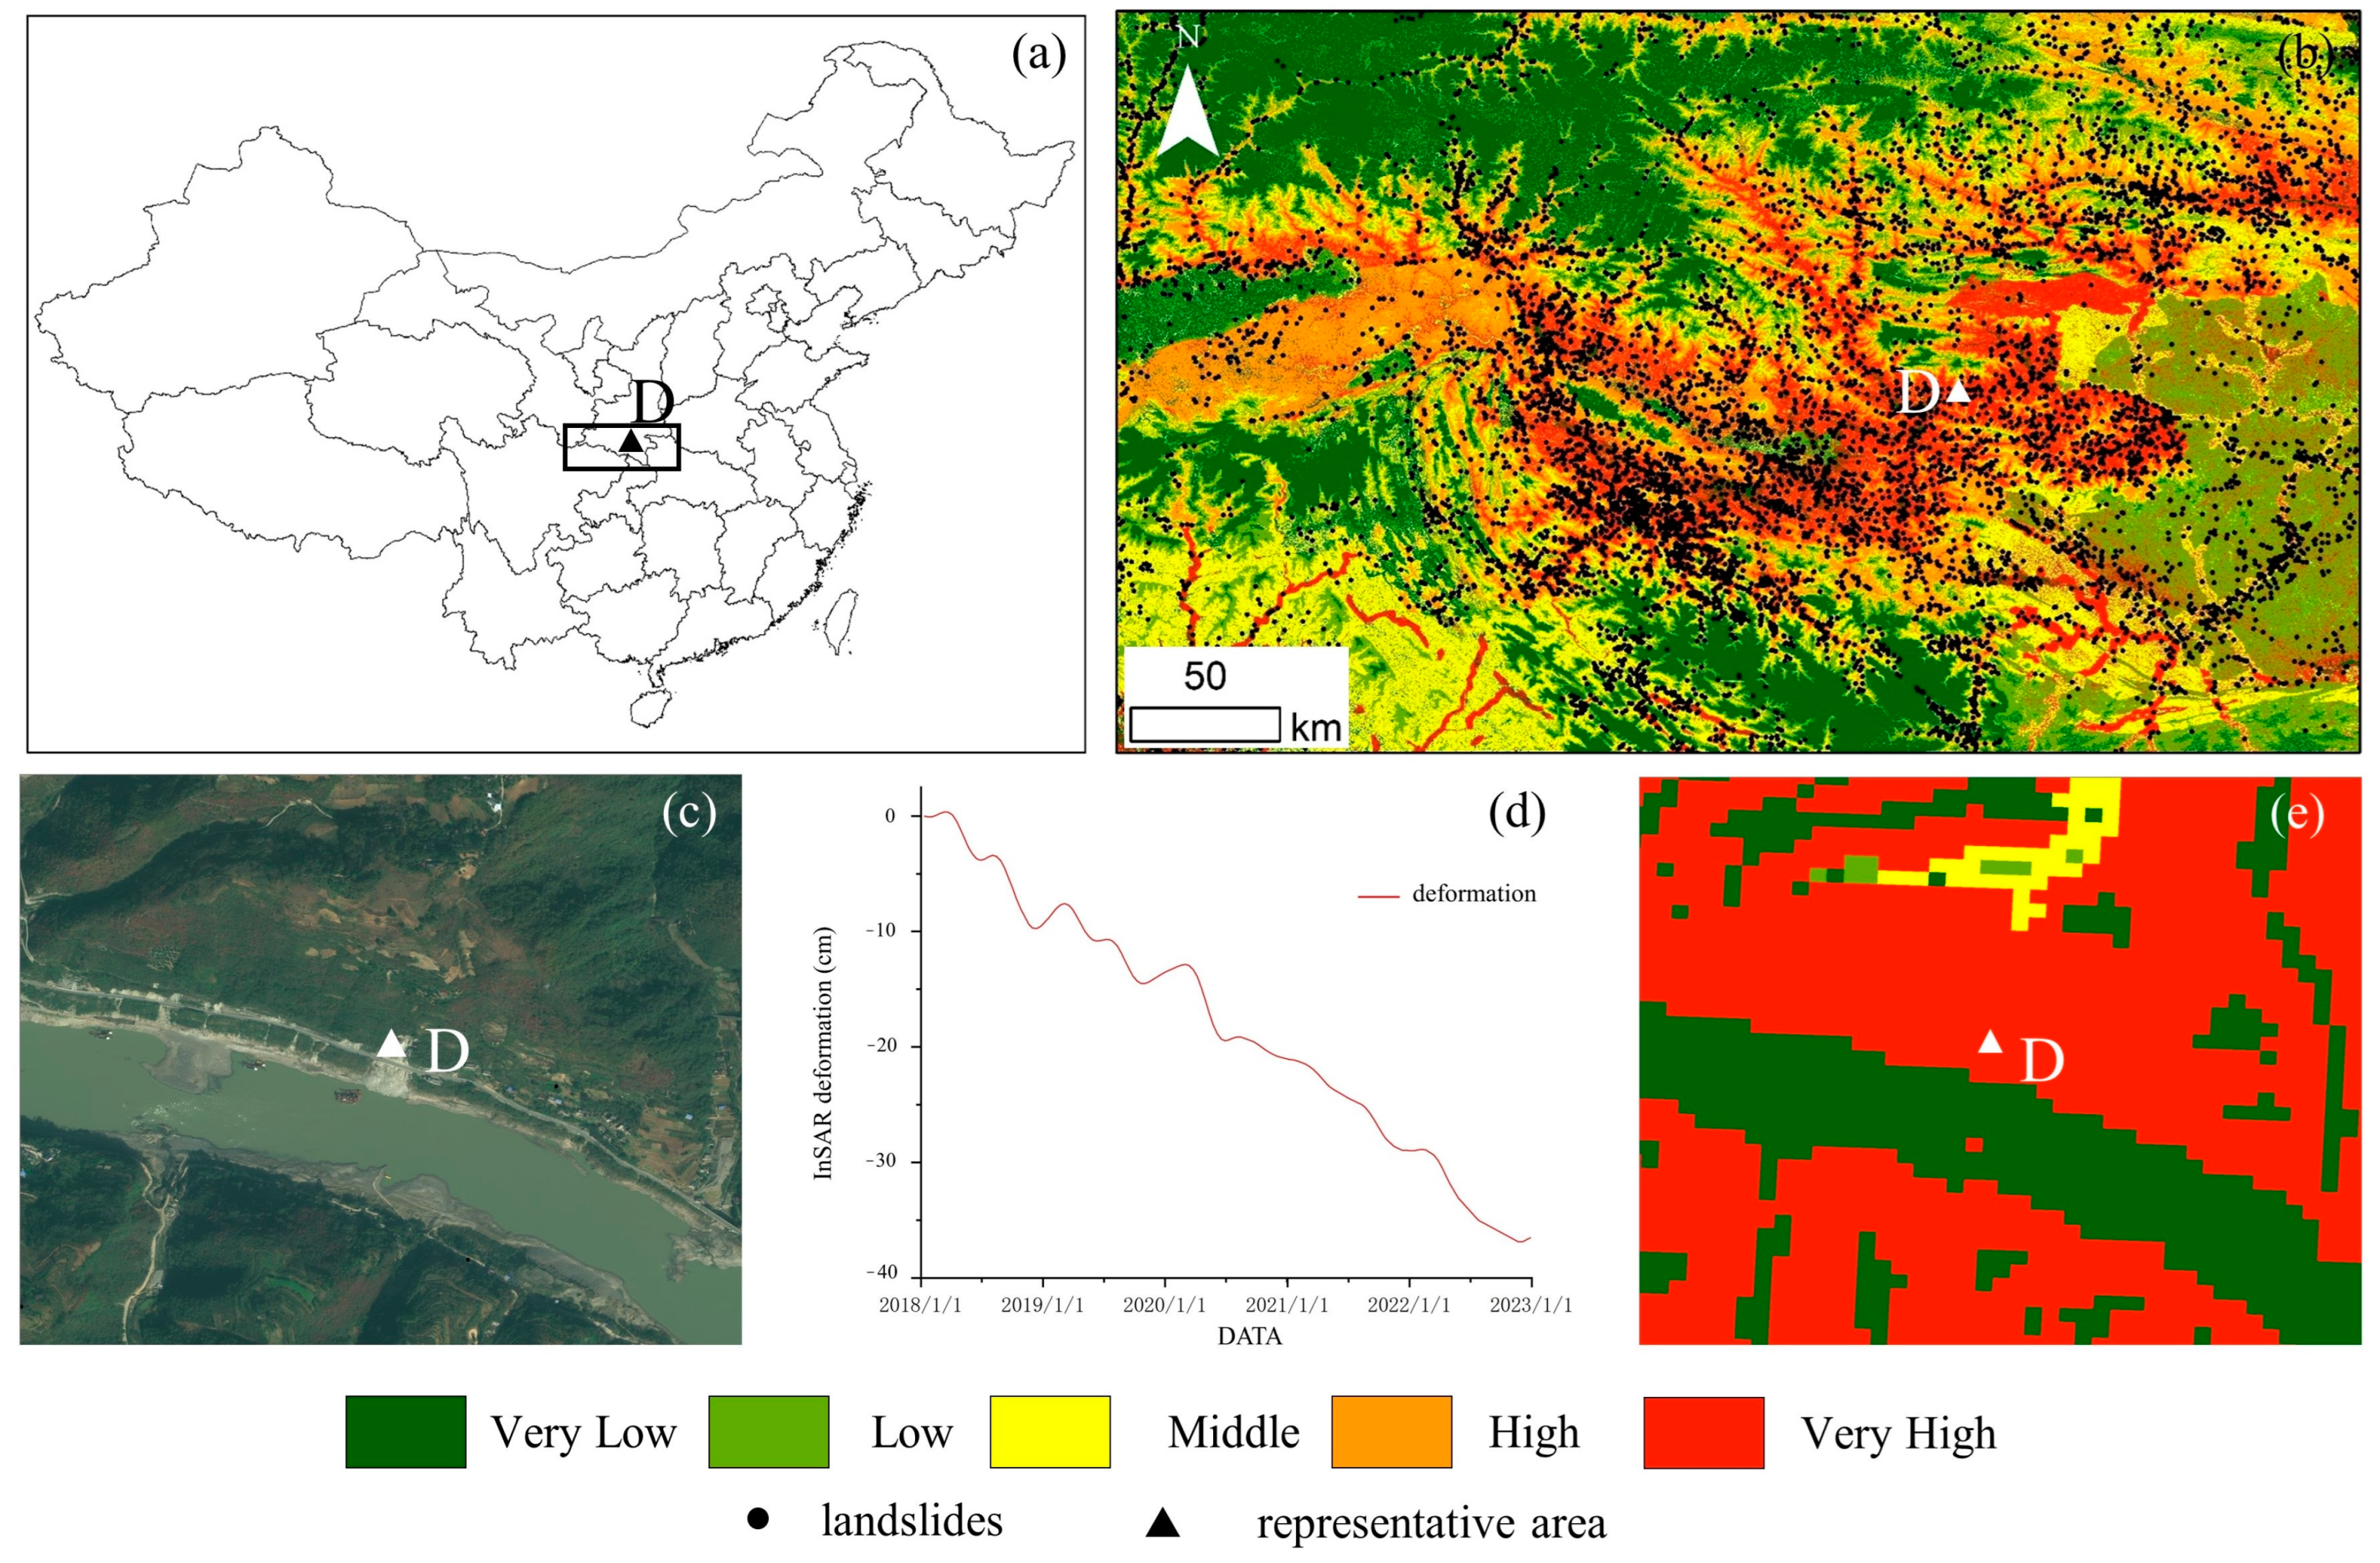
Very high landslide susceptibility zones in the Qinling–Dabashan Mountains. (a) Location of the Qinling–Dabashan Mountains. (b) LSM of the Qinling–Dabashan Mountains. (c) Optical remote sensing image at point D. (d) InSAR time-series deformation curve at point D. (e) LSM at point D.
Figure 25.
Very high landslide susceptibility zones in the Qinling–Dabashan Mountains. (a) Location of the Qinling–Dabashan Mountains. (b) LSM of the Qinling–Dabashan Mountains. (c) Optical remote sensing image at point D. (d) InSAR time-series deformation curve at point D. (e) LSM at point D.
Figure 26.
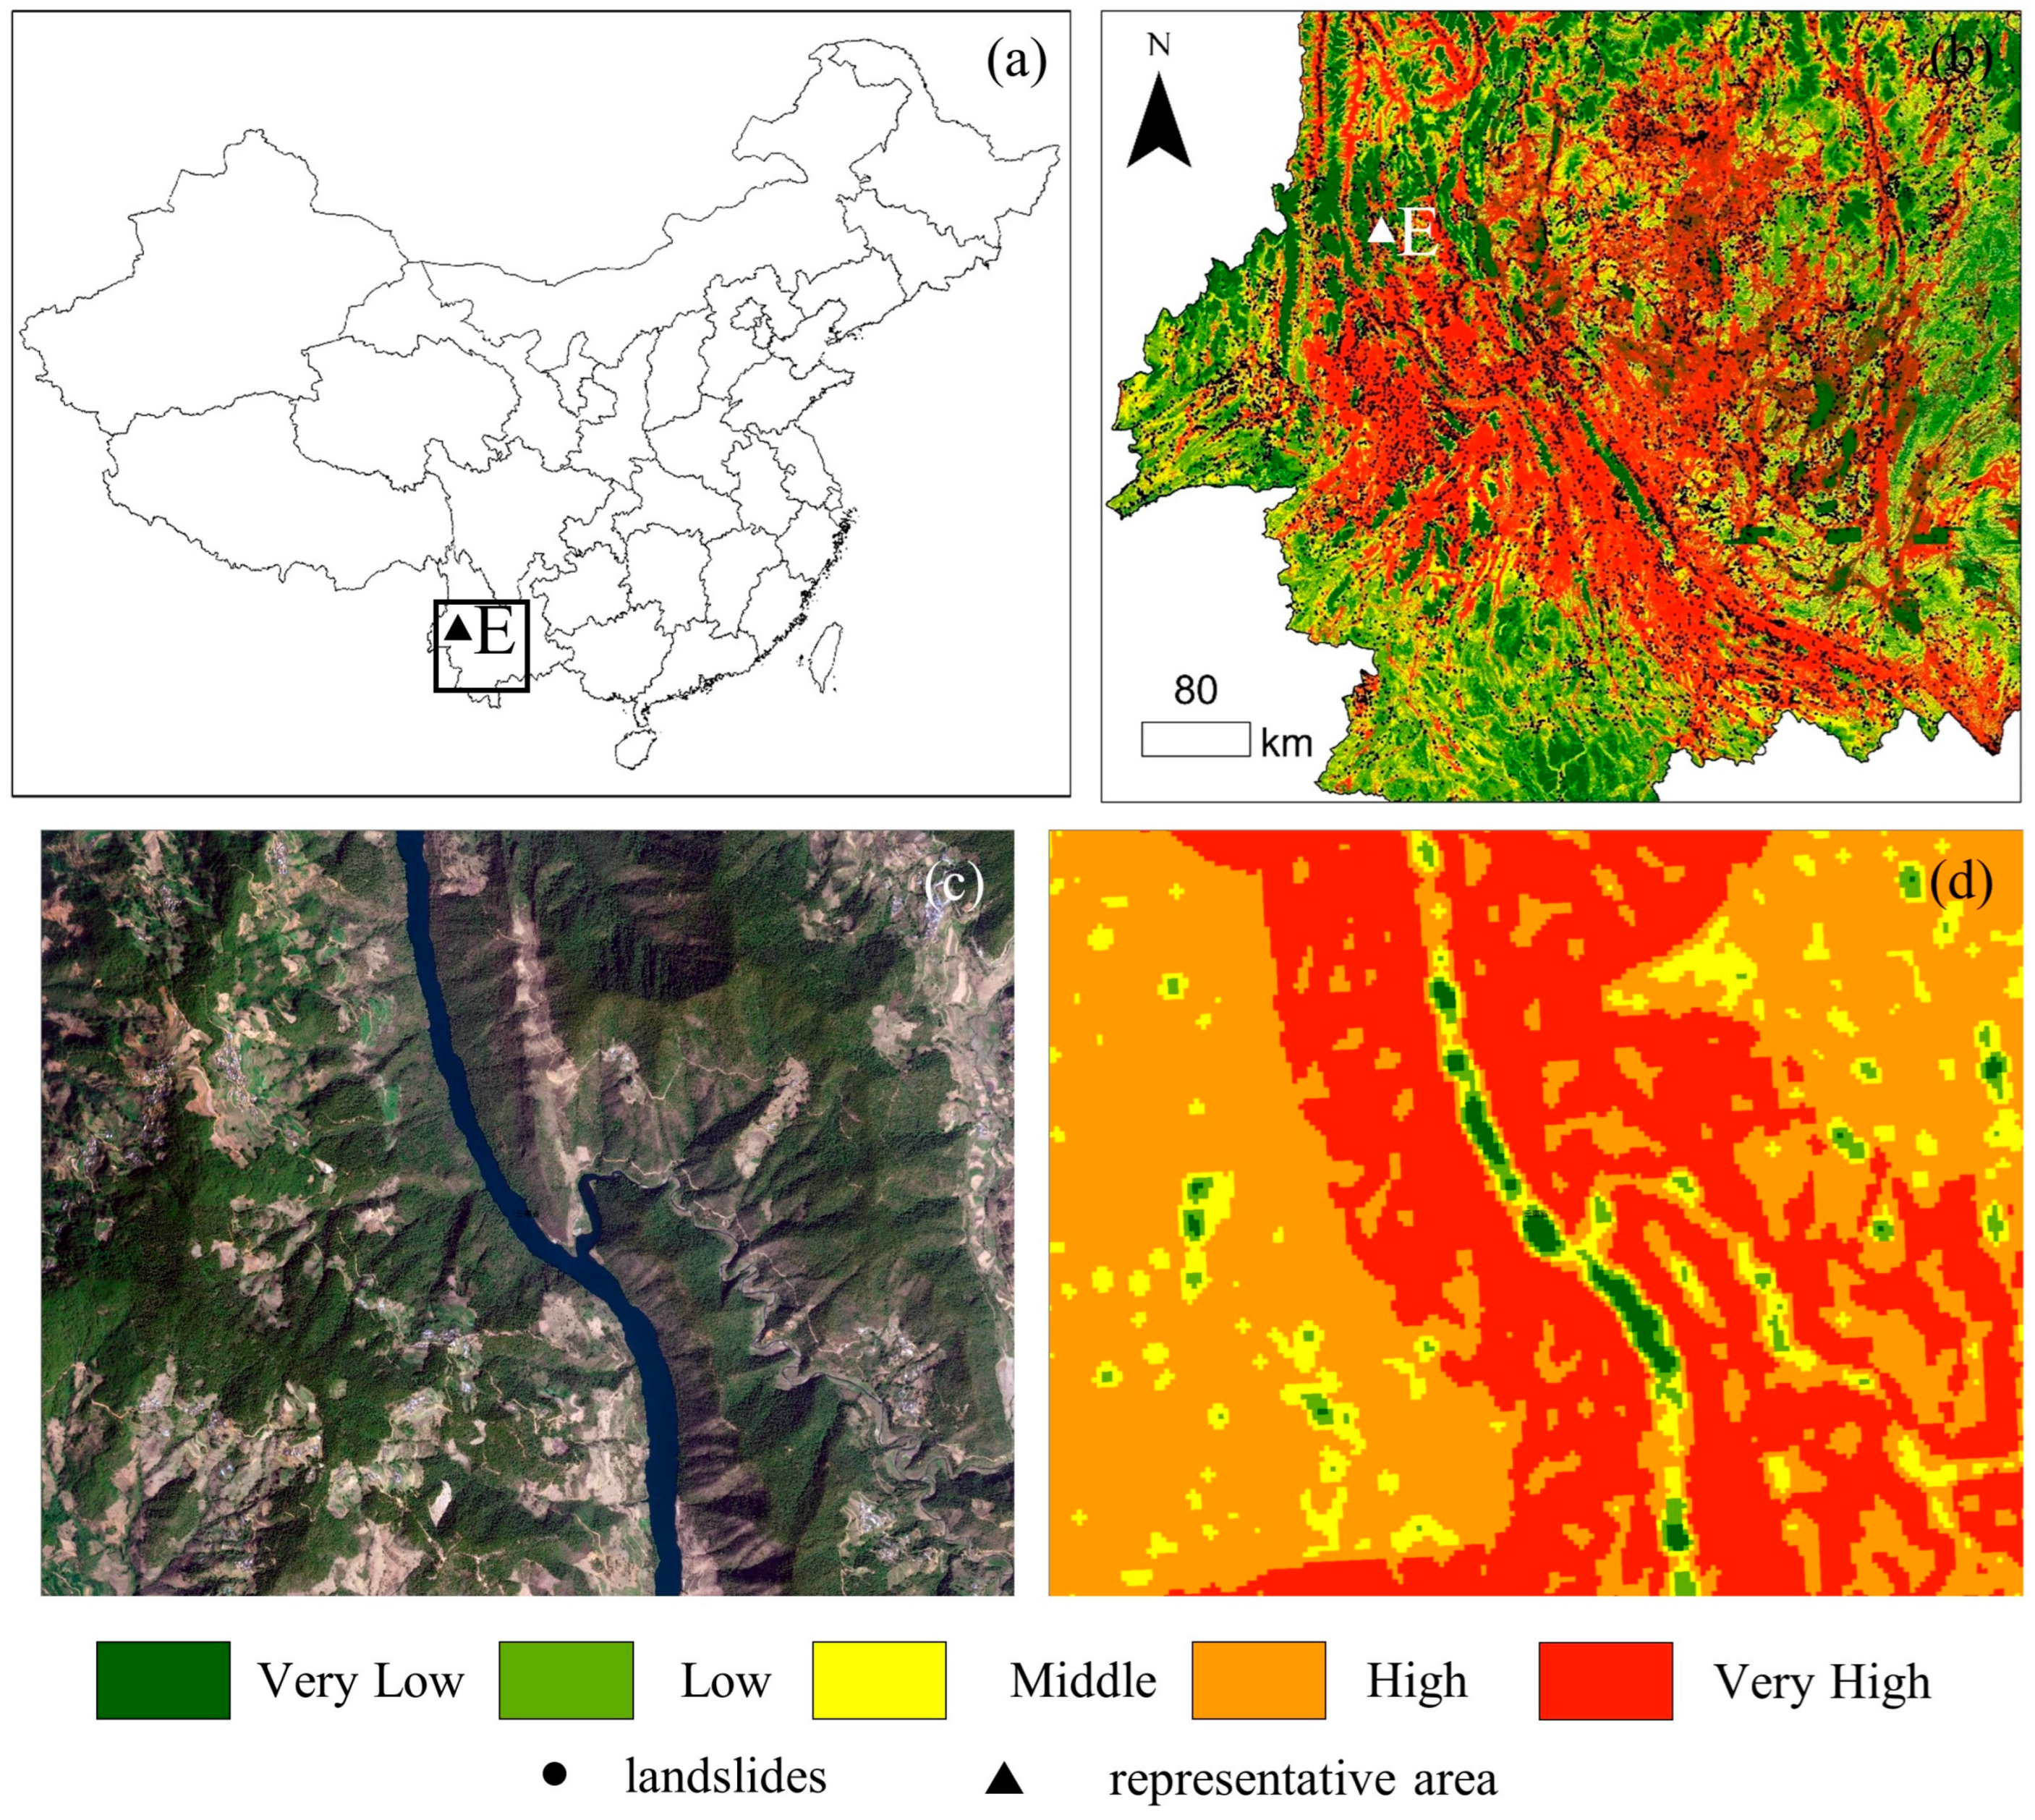
Very high landslide susceptibility zones in the mountainous areas of west-central Yunnan. (a) Location of the mountainous areas of west-central Yunnan. (b) LSM of the mountainous areas of west-central Yunnan. (c) Optical remote sensing image at point E. (d) LSM at point E.
Figure 26.
Very high landslide susceptibility zones in the mountainous areas of west-central Yunnan. (a) Location of the mountainous areas of west-central Yunnan. (b) LSM of the mountainous areas of west-central Yunnan. (c) Optical remote sensing image at point E. (d) LSM at point E.
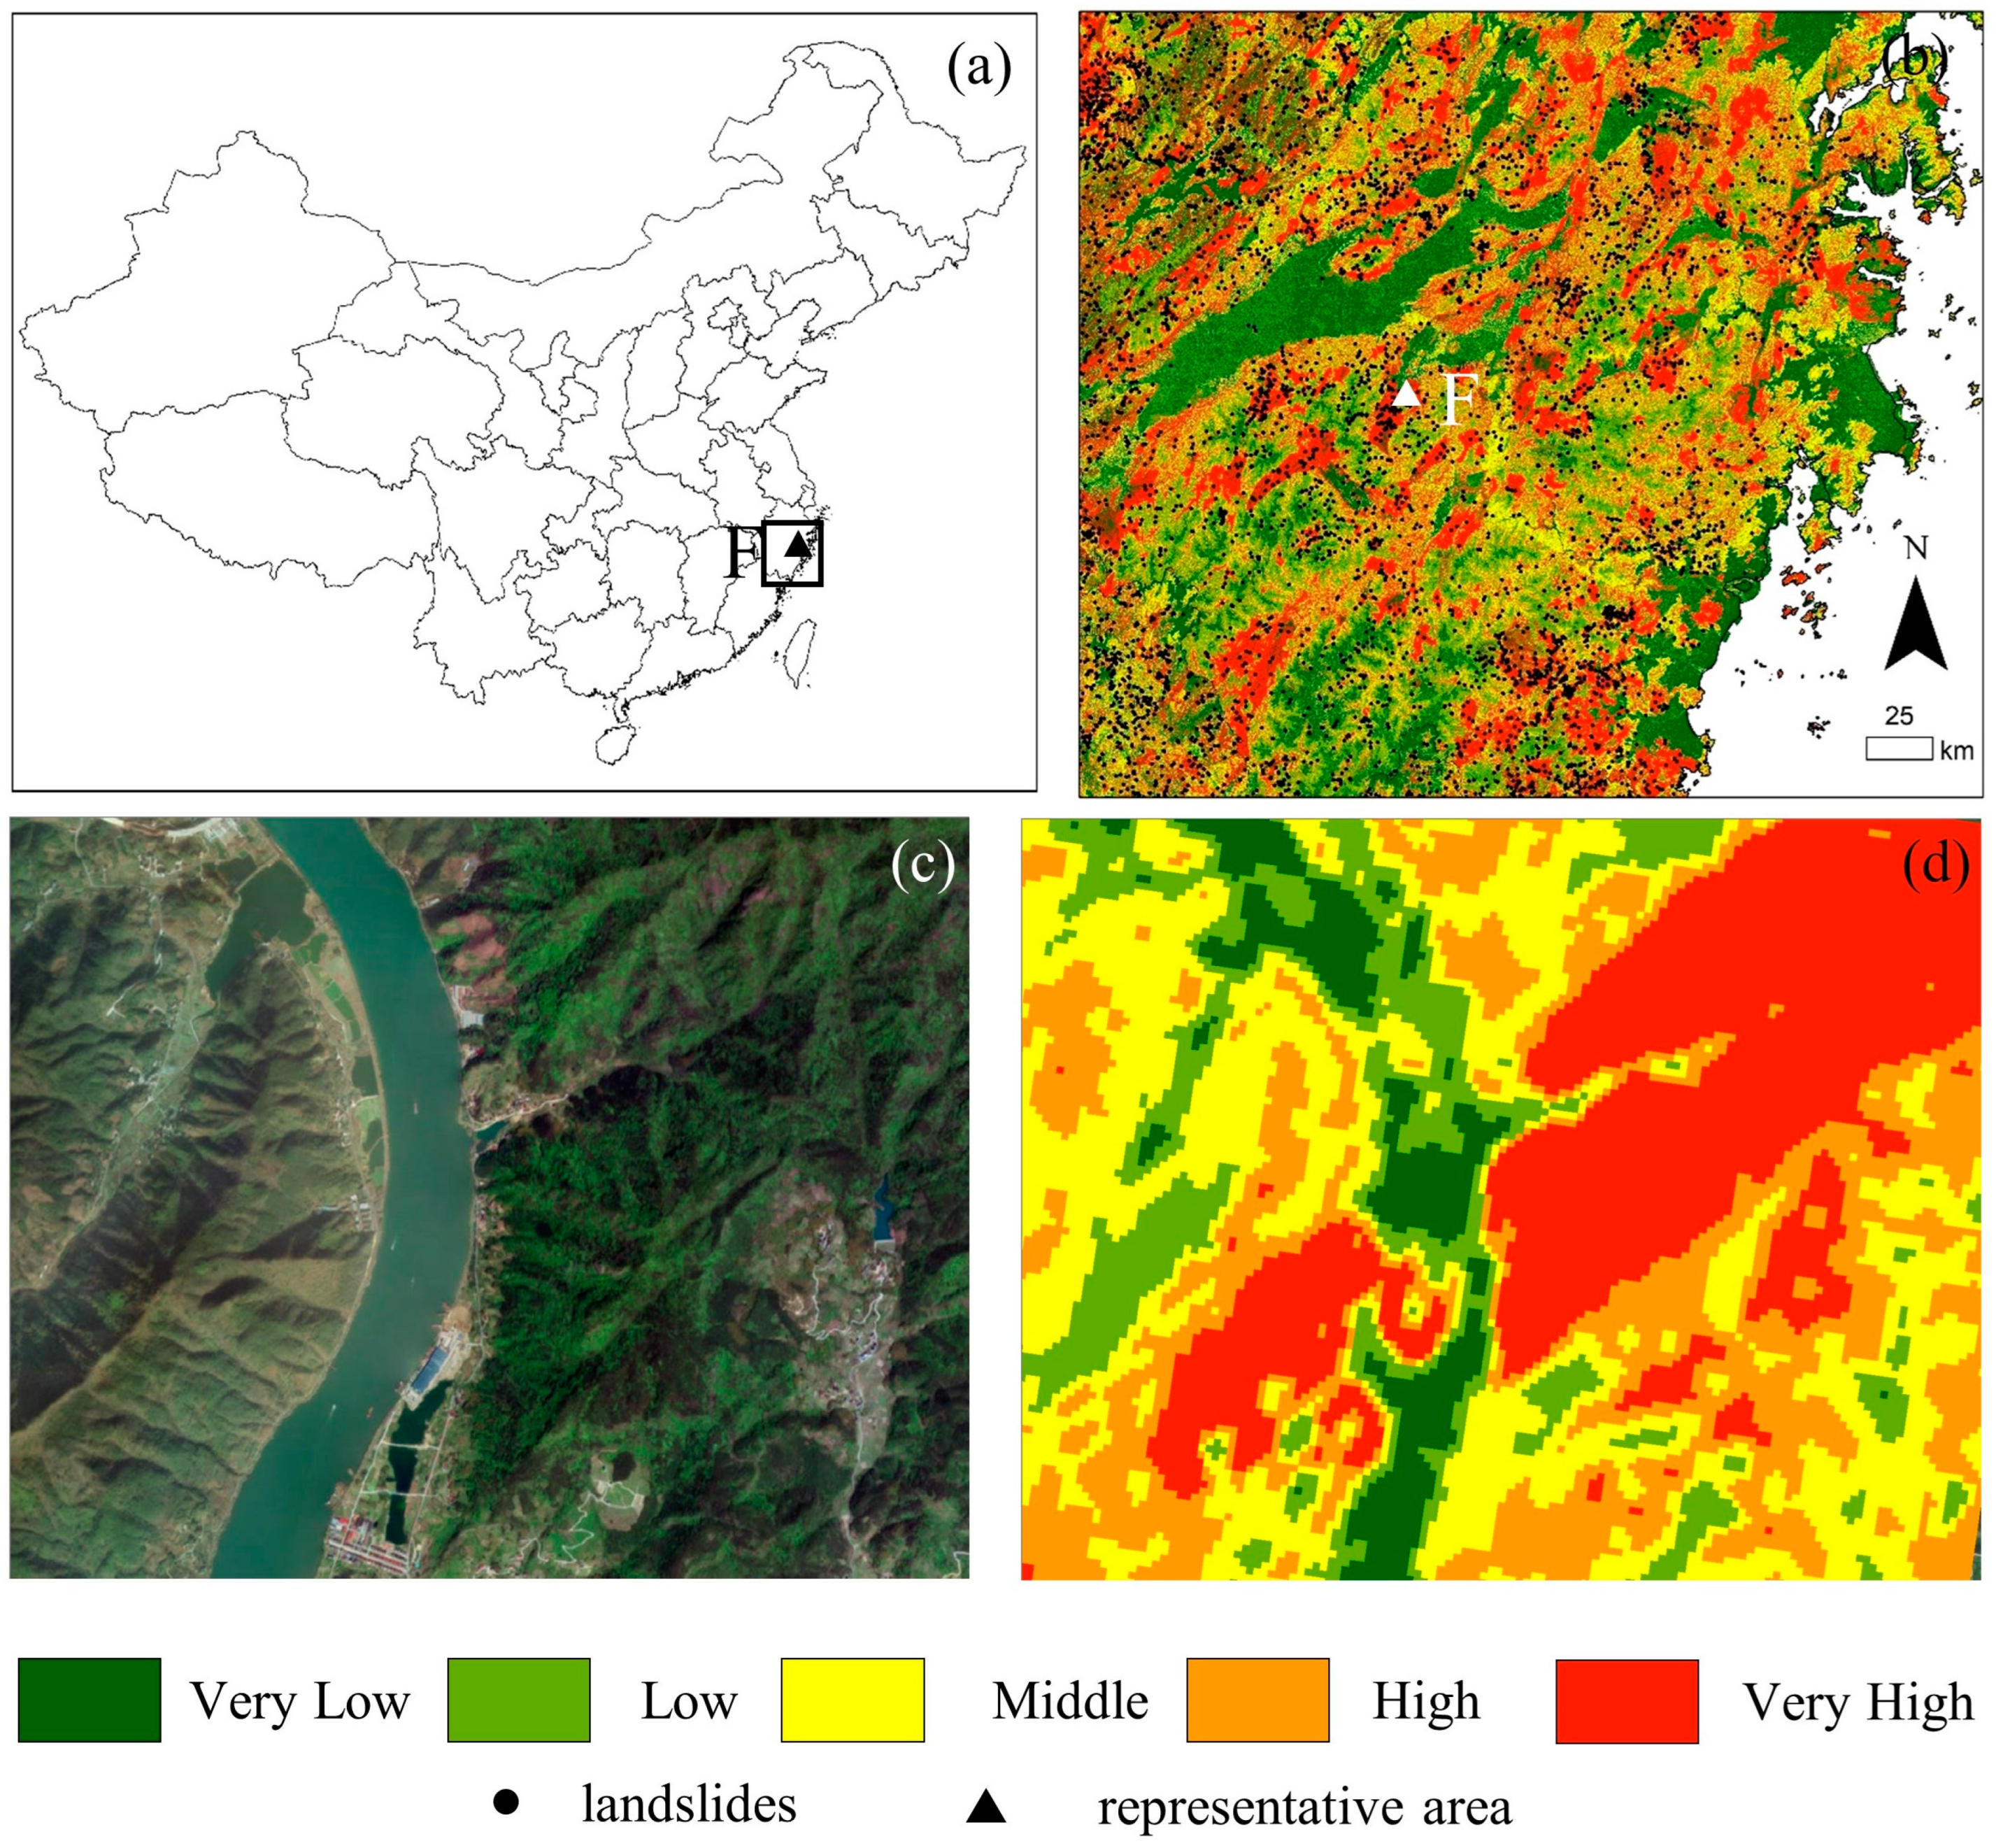
Figure 27.
Very high landslide susceptibility zones in the Southern mountains of Zhejiang. (a) Location of the Southern mountains of Zhejiang. (b) LSM of the Southern mountains of Zhejiang. (c) Optical remote sensing image at point F. (d) LSM at point F.
Figure 27.
Very high landslide susceptibility zones in the Southern mountains of Zhejiang. (a) Location of the Southern mountains of Zhejiang. (b) LSM of the Southern mountains of Zhejiang. (c) Optical remote sensing image at point F. (d) LSM at point F.
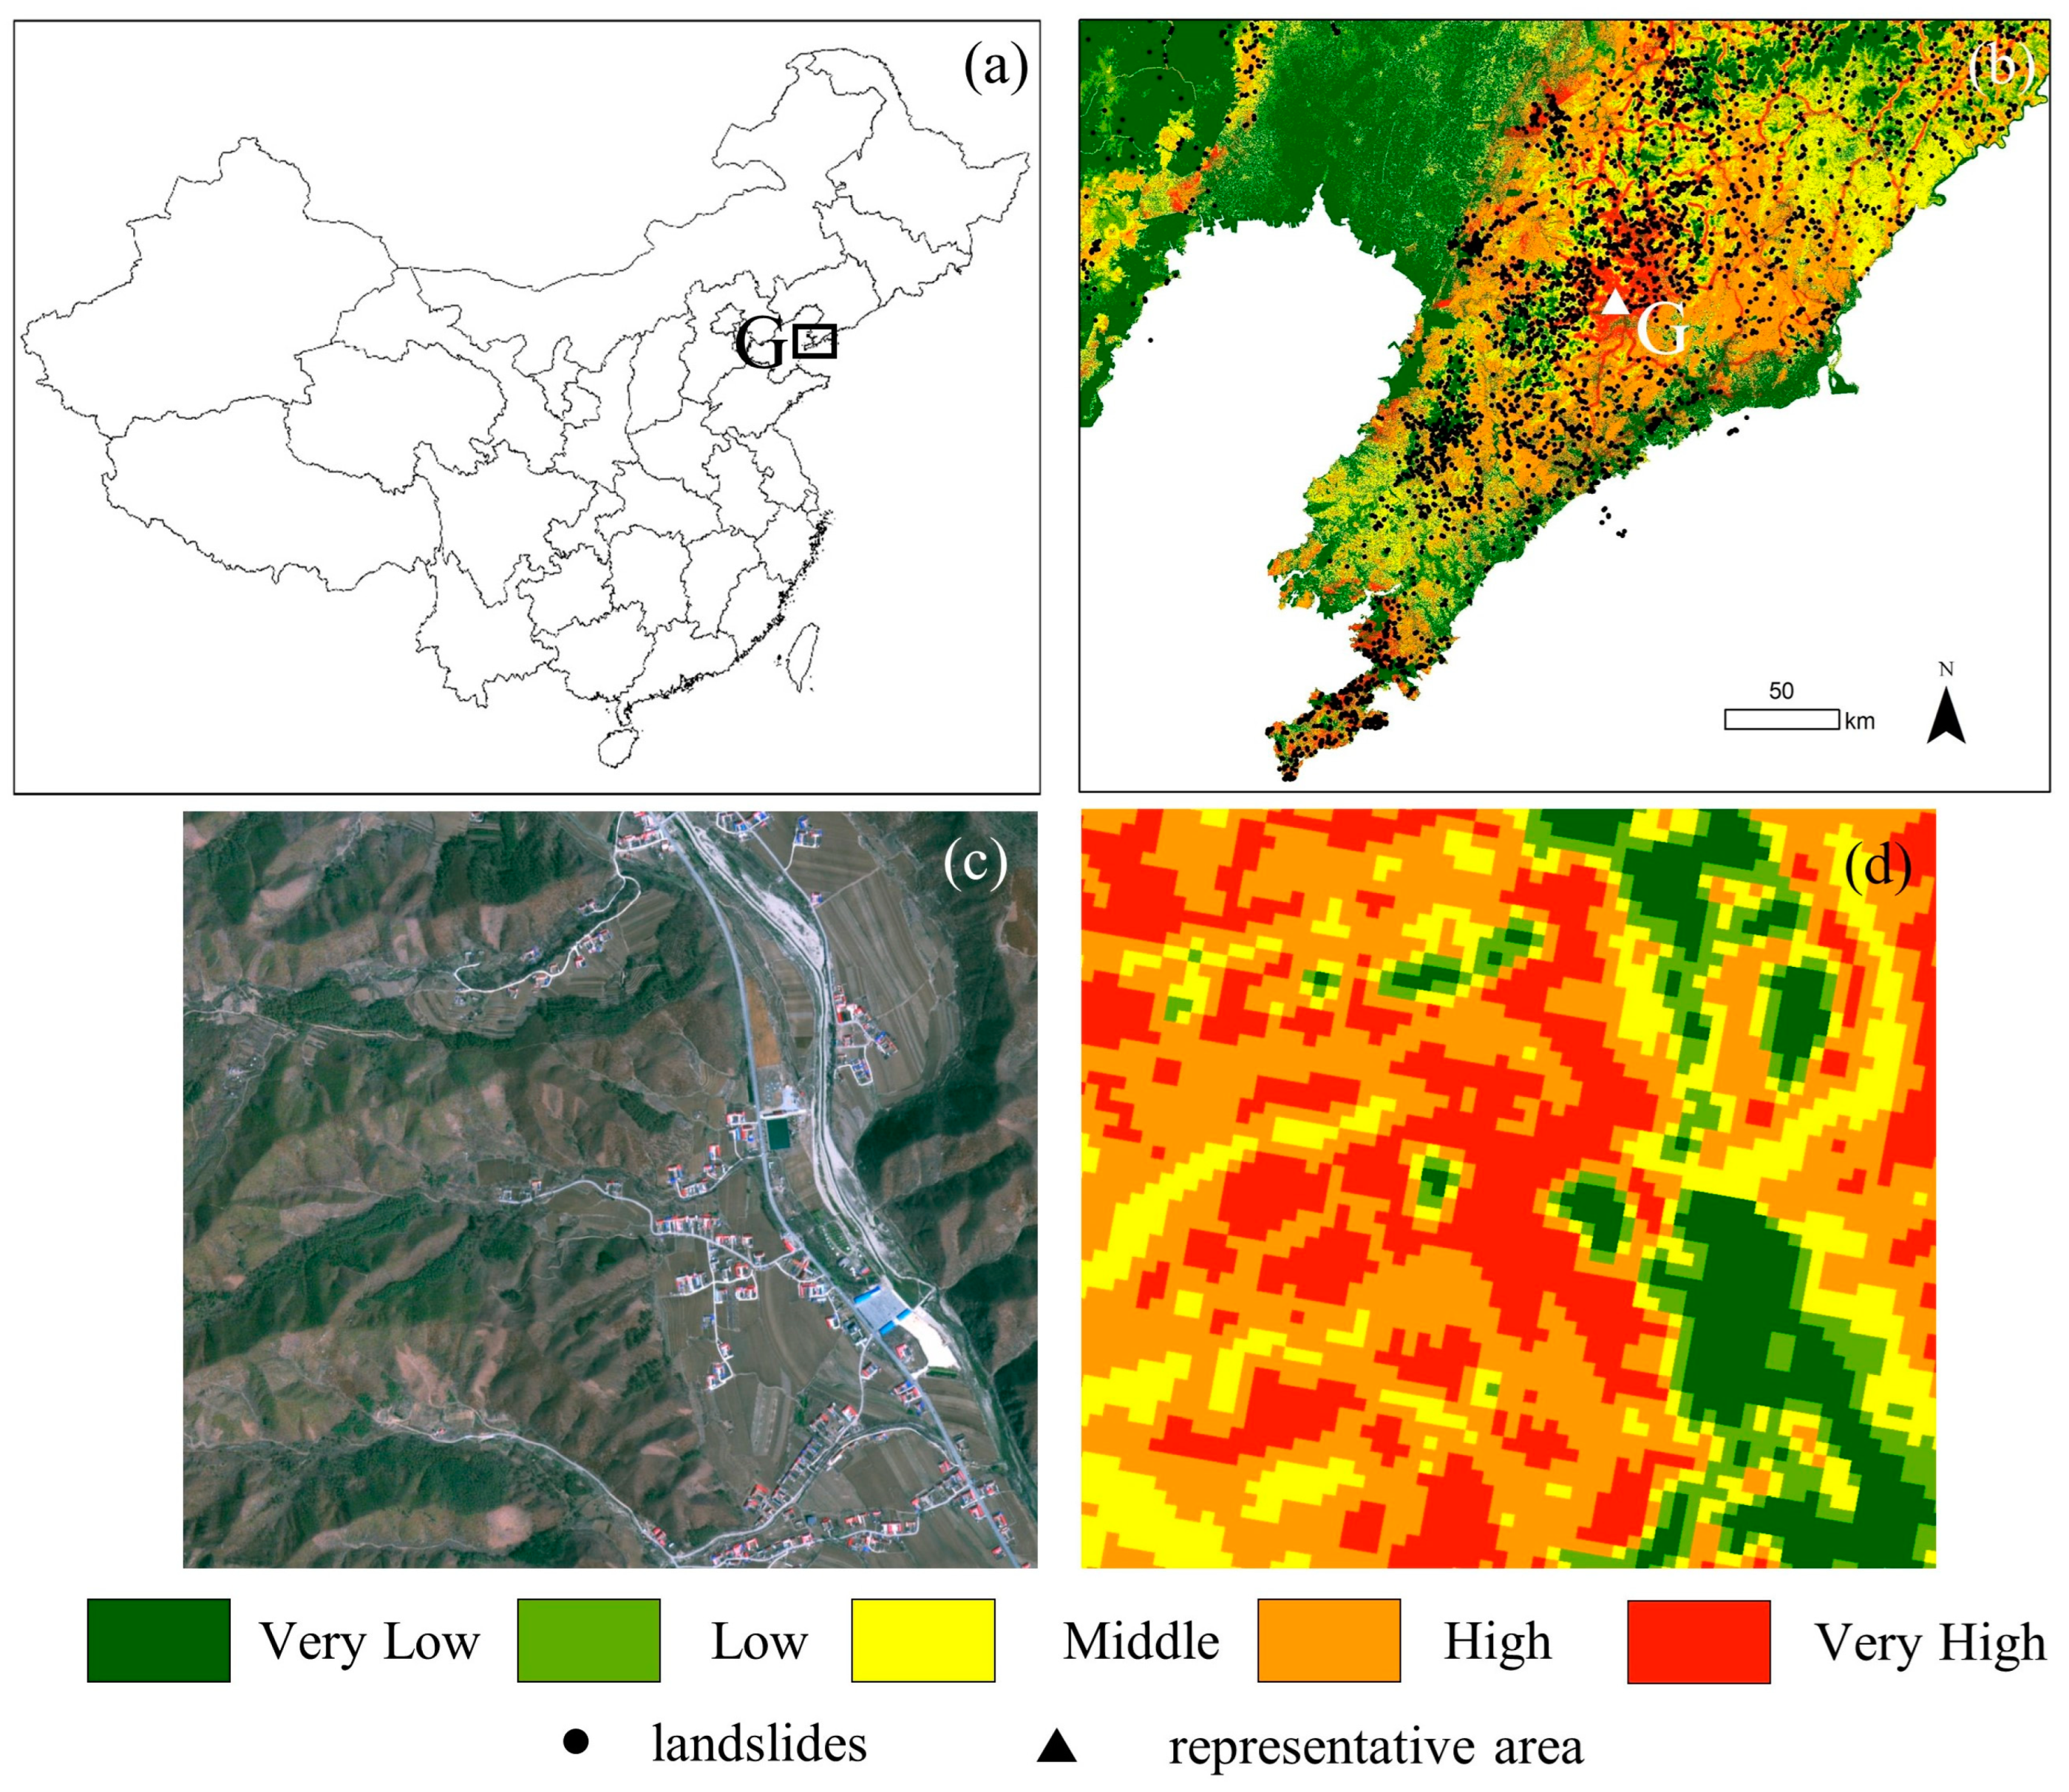
Figure 28.
Very high landslide susceptibility zones in the Central Liaodong Peninsula. (a) Location of the Central Liaodong Peninsula. (b) LSM of the Central Liaodong Peninsula. (c) Optical remote sensing image at point G. (d) LSM at point G.
Figure 28.
Very high landslide susceptibility zones in the Central Liaodong Peninsula. (a) Location of the Central Liaodong Peninsula. (b) LSM of the Central Liaodong Peninsula. (c) Optical remote sensing image at point G. (d) LSM at point G.
Table 1.
Geomorphological regionalization of China.
Table 1.
Geomorphological regionalization of China.
| Geomorphologic Region | Geomorphologic District | Serial Number | Geomorphologic Region | Geomorphologic District | Serial Number |
|---|
| I. Eastern hilly plains | A. Wandashan Sanjiang Plain | I-A | IV. Northwestern middle and high mountains and Basins | A. Xinjiang Gansu Inner Mongolia Hilly Plains | IV-A |
| B. Changbaishan low-middle Mountains | I-B | B. Altai Alpine | IV-B |
| C. Ludong low mountains and hills | I-C | C. Junggar Basin | IV-C |
| D. Xiaoxing’anling Mountains low-middle Mountains | I-D | D. Tianshan Alpine Basin | IV-D |
| E. Songliao plain | I-E | E. Tarim Basin | IV-E |
| F. Western Liaoning low-middle Mountains | I-F | V. Southwestern subalpine mountains | A. Qinling–Dabashan subalpine | V-A |
| G. North and East China Plains | I-G | B. Hubei Guizhou Yunnan middle Mountain | V-B |
| H. Ningzhen Plain Hills | I-H | C. Sichuan basin | V-C |
| II. Southwestern low-middle mountains | A. Zhejiang and Fujian Low-middle Mountains | II-A | D. Southwest Sichuan and Central Yunnan Alpine basin | V-D |
| B. Huaiyang Low Mountain | II-B | E. Southwestern Yunnan Subalpine | V-E |
| C. Middle Yangtze River Low mountain Plain | II-C | VI. Tibetan Plateau | A. The Aljinshan and Qilian Mountains | VI-A |
| D. South China low mountain Plain | II-D | B. Qaidam Basin | VI-B |
| E. Taiwan Plain and Mountain | II-E | C. Kunlun Extremely Alpine | VI-C |
| III. Central and northern middle mountains and plateau | A. Daxing’anling Mountains low-middle Mountain | III-A | D. Hengduan Mountains high mountain valleys | VI-D |
| B. Shanxi middle mountain Basin | III-B | E. Sanjiangyuan high mountain valley | VI-E |
| C. Inner Mongolian Plateau | III-C | F. Sanjiangyuan hilly plateau | VI-F |
| D. Ordos Plateau and Hetao Plain | III-D | G. Qiangtang Plateau lake basin | VI-G |
| E. Loess Plateau | III-E | H. Himalayan Extreme Alpine | VI-H |
| | | I. Lama Kunlun Extremely Alpine | VI-I |
Table 2.
Data information.
Table 2.
Data information.
Table 3.
Confusion matrix.
Table 3.
Confusion matrix.
| Ground Truth | Predicted as Positive Sample | Predicted as Negative Sample |
|---|
| Positive sample | Ture Positive (TP) | False Negative (FN) |
| Negative sample | False Positive (FP) | True Negative (TN) |
Table 4.
Evaluation indicators of geomorphologic districts.
Table 4.
Evaluation indicators of geomorphologic districts.
| Geomorphologic Districts | AUC | Precision | Recall | F1-Score | MCC | Geomorphologic Districts | AUC | Precision | Recall | F1-Score | MCC |
|---|
| I-A | 0.948 | 0.868 | 0.865 | 0.865 | 0.796 | IV-A | 0.964 | 0.940 | 0.780 | 0.838 | 0.816 |
| I-B | 0.917 | 0.830 | 0.830 | 0.830 | 0.692 | IV-B | 0.928 | 0.845 | 0.787 | 0.805 | 0.805 |
| I-C | 0.930 | 0.847 | 0.847 | 0.847 | 0.747 | IV-C | 0.961 | 0.879 | 0.843 | 0.857 | 0.847 |
| I-D | 0.946 | 0.908 | 0.771 | 0.812 | 0.704 | IV-D | 0.921 | 0.832 | 0.826 | 0.825 | 0.792 |
| I-E | 0.972 | 0.916 | 0.832 | 0.863 | 0.837 | IV-E | 0.981 | 0.938 | 0.800 | 0.851 | 0.862 |
| I-F | 0.881 | 0.783 | 0.752 | 0.753 | 0.652 | V-A | 0.878 | 0.792 | 0.792 | 0.792 | 0.683 |
| I-G | 0.973 | 0.899 | 0.883 | 0.890 | 0.843 | V-B | 0.793 | 0.702 | 0.708 | 0.707 | 0.631 |
| I-H | 0.972 | 0.912 | 0.912 | 0.912 | 0.826 | V-C | 0.933 | 0.891 | 0.876 | 0.878 | 0.811 |
| II-A | 0.852 | 0.803 | 0.774 | 0.778 | 0.678 | V-D | 0.846 | 0.751 | 0.747 | 0.744 | 0.648 |
| II-B | 0.911 | 0.847 | 0.837 | 0.834 | 0.713 | V-E | 0.835 | 0.741 | 0.683 | 0.684 | 0.632 |
| II-C | 0.860 | 0.783 | 0.774 | 0.777 | 0.658 | VI-A | 0.968 | 0.907 | 0.848 | 0.871 | 0.844 |
| II-D | 0.839 | 0.757 | 0.751 | 0.753 | 0.663 | VI-B | 0.978 | 0.926 | 0.919 | 0.922 | 0.853 |
| II-E | 0.975 | 0.910 | 0.884 | 0.886 | 0.875 | VI-C | 0.976 | 0.932 | 0.874 | 0.897 | 0.848 |
| III-A | 0.936 | 0.860 | 0.788 | 0.806 | 0.802 | VI-D | 0.956 | 0.889 | 0.881 | 0.883 | 0.817 |
| III-B | 0.857 | 0.765 | 0.768 | 0.764 | 0.704 | VI-E | 0.964 | 0.898 | 0.867 | 0.880 | 0.820 |
| III-C | 0.975 | 0.932 | 0.718 | 0.782 | 0.864 | VI-F | 0.972 | 0.915 | 0.829 | 0.861 | 0.841 |
| III-D | 0.960 | 0.895 | 0.883 | 0.888 | 0.831 | VI-G | 0.961 | 0.930 | 0.730 | 0.788 | 0.823 |
| III-E | 0.817 | 0.724 | 0.712 | 0.703 | 0.622 | VI-H | 0.963 | 0.900 | 0.893 | 0.896 | 0.850 |
| | | | | | | VI-I | 0.988 | 0.952 | 0.914 | 0.932 | 0.881 |
Table 5.
Statistics of LSM.
Table 5.
Statistics of LSM.
| Susceptibility | Area (million km2) | Percentage | Recorded Landslide | Landslide Density (nos./km2) |
|---|
| Very low | 5.17 | 53.9% | 11626 | 0.002 |
| Low | 1.76 | 18.3% | 17767 | 0.01 |
| Moderate | 1.63 | 17% | 22154 | 0.013 |
| High | 0.73 | 7.6% | 35315 | 0.048 |
| Very high | 0.31 | 3.2% | 132489 | 0.427 |
Table 6.
Statistics of LSMs generated based on geomorphological regionalization.
Table 6.
Statistics of LSMs generated based on geomorphological regionalization.
| LSM | AUC | Susceptibility | Area (thousand km2) | Percentage | Recorded Landslide | Landslide Density |
|---|
| LSM without geomorphological regionalization | 0.806 | Very low | 105.8 | 8.8% | 410 | 3.9 |
| Low | 274.6 | 23.0% | 1889 | 6.9 |
| Moderate | 358.9 | 30.0% | 3813 | 10.2 |
| High | 241.0 | 20.1% | 4247 | 17.6 |
| Very high | 216.1 | 18.1% | 9084 | 42.0 |
| LSM based on geomorphological regionalization | 0.857 | Very low | 348.1 | 29.1% | 1588 | 4.6 |
| Low | 182.1 | 15.2% | 1714 | 9.4 |
| Moderate | 253.2 | 21.2% | 3269 | 12.9 |
| High | 232.3 | 19.4% | 4470 | 19.2 |
| Very high | 180.7 | 15.1% | 8402 | 46.5 |
Table 7.
Statistics of LSMs generated using different methods.
Table 7.
Statistics of LSMs generated using different methods.
| Geomorphologic District | LSM | AUC | Susceptibility | Area (thousand km2) | Area (%) | Number of Recorded Landslides | Landslide Density |
|---|
| IV-D | LSM using environmental factors | 0.902 | Very low | 86.5 | 37.8 | 30 | 0.3 |
| Low | 51.8 | 22.6 | 48 | 0.9 |
| Moderate | 42.8 | 18.7 | 123 | 2.9 |
| High | 29.8 | 13.0 | 224 | 7.5 |
| Very high | 18.2 | 7.9 | 466 | 25.6 |
| LSM with dynamic features | 0.921 | Very low | 91.2 | 39.8 | 26 | 0.3 |
| Low | 44 | 19.2 | 33 | 0.8 |
| Moderate | 43.8 | 19.1 | 104 | 2.4 |
| High | 30.8 | 13.4 | 209 | 6.8 |
| Very high | 19.4 | 8.5 | 519 | 26.8 |
| I-C | LSM using environmental factors | 0.924 | Very low | 43.6 | 43.8 | 33 | 0.8 |
| Low | 15.4 | 15.5 | 14 | 0.9 |
| Moderate | 15 | 15.1 | 63 | 4.2 |
| High | 12.8 | 12.9 | 109 | 8.5 |
| Very high | 12.6 | 12.7 | 281 | 22.3 |
| LSM with dynamic features | 0.930 | Very low | 44.1 | 44.4 | 33 | 0.7 |
| Low | 14 | 14.1 | 13 | 0.9 |
| Moderate | 13.3 | 13.4 | 41 | 3.1 |
| High | 14.1 | 14.2 | 99 | 7.0 |
| Very high | 13.8 | 13.9 | 314 | 22.8 |


 ,
, 


