Article

Investigating the Influence of the Weed Layer on Crop Canopy Reflectance and LAI Inversion Using Simulations and Measurements in a Sugarcane Field

1
College of JunCao Science and Ecology, Fujian Agriculture and Forestry University, Fuzhou 350002, China
2
School of Public Administration & Law, Fujian Agriculture and Forestry University, Fuzhou 350002, China
3
College of Resources and Environment, Fujian Agriculture and Forestry University, Fuzhou 350002, China
4
University Key Lab of Soil Ecosystem Health and Regulation in Fujian, College of Resources and Environment, Fujian Agriculture and Forestry University, Fuzhou 350002, China
*
Author to whom correspondence should be addressed.
These authors contributed equally to this work.
Remote Sens. 2025, 17(12), 2014; https://doi.org/10.3390/rs17122014
Submission received: 7 April 2025 / Revised: 31 May 2025 / Accepted: 10 June 2025 / Published: 11 June 2025

Abstract

:
Recent research in agricultural remote sensing mainly focuses on how soil background affects canopy reflectance and the inversion of LAI, while often overlooking the influence of the weed layer. The coexistence of crop and weed layers forms two-layered vegetation canopies in tall crops such as sugarcane and maize. Although radiative transfer models can simulate the weed layer’s influence on canopy reflectance and LAI inversion, few experimental investigations use in situ measurement data to verify these effects. Here, we propose a practical background modification scheme in which black material with near-zero reflectance covers the weed layer and alters the background spectrum of crop canopies. We conduct an experimental investigation in a sugarcane field with different background properties (i.e., bare soil and a weed layer). Tower-based and UAV-based hyperspectral measurements examine the spectral differences in sugarcane canopies with and without the black covering. We then use LAI measurements to evaluate the weed layer’s impact on LAI inversion from UAV-based hyperspectral data through a hybrid inversion method. We find that the weed layer significantly affects the canopy reflectance spectrum, changing it by 13.58% and 42.53% in the near-infrared region for tower-based and UAV-based measurements, respectively. Furthermore, the weed layer substantially interferes with LAI inversion of sugarcane canopies, causing significant overestimation. Estimated LAIs of sugarcane canopies with a soil background generally align well with measured values (root mean square error (RMSE) = 0.69 m2/m2), whereas those with a weed background are considerably overestimated (RMSE = 2.07 m2/m2). We suggest that this practical background modification scheme quantifies the weed layer’s influence on crop canopy reflectance from a measurement perspective and that the weed layer should be considered during the inversion of crop LAI.

1. Introduction

Leaf area index (LAI) directly affects key agricultural production indicators [1], such as crop biomass [2], photosynthesis [3], chlorophyll content [4], and ultimately yield [5]. The development of drone remote sensing technology, especially the use of hyperspectral sensors, has greatly advanced rapid and precise LAI estimation due to its high spatial resolution, flexibility, and cost-effectiveness [6]. Currently, LAI estimation with drone-based hyperspectral sensors primarily employs hybrid inversion methods [7], in which physical models (such as the PROSAIL model) simulate the spectral responses of vegetation canopies, while machine learning algorithms (e.g., random forests, support vector machines, and neural networks) optimize inversion results through regression analysis [8].
The background of crop canopies is generally assumed to be soil during canopy reflectance simulations and LAI inversions [9]. Based on this assumption, a soil brightness parameter is used in the PROSAIL model to account for variations in soil moisture that influence the soil spectrum [10]. Although the soil background is widely used for crop canopy reflectance simulations and LAI inversion, this assumption applies only to canopies without weeds. However, a thin weed layer can grow in crop fields at a relatively low height during the growth process. In this situation, a two-layered structure is developed for crops, with the overstory and understory referring to the crop layer and the weed layer, respectively. Furthermore, the optical and structural parameters of these two layers can differ significantly [11]. Hence, a homogeneous canopy assumption that excludes the weed layer affects total organic carbon (TOC) reflectance simulations and the corresponding inversion of crop LAI [12]. It should be noted that there are many studies on weed remote sensing in crop fields. However, most of these studies focused on classifying weeds in crop fields under the assumption that weeds are distributed away from the crop plants [13,14]. Research on the two-layered structure and its impacts on crop canopy reflectance is scarce.
To investigate the influence of understory vegetation on TOC reflectance, an analytical two-layer canopy reflectance model, ACRM, was developed, in which a horizontally homogeneous vegetation layer is simulated on the ground surface under the main vegetation layer [15]. Moreover, understory vegetation has been considered in 3D radiative transfer models (e.g., DART, Flight, FLiES, and LESS), where its 3D canopy structure is characterized. These models can be used to explore how a weed layer influences the TOC reflectance of a crop canopy and to indirectly dissociate understory LAI from overstory LAI [16]. However, an experimental investigation of how understory vegetation influences TOC reflectance and LAI inversion has yet to be conducted.
From an experimental perspective, several methods exist to evaluate the influence of understory on TOC reflectance. First, two types of sample plots can be established—one with a ground surface covered by bare soil and one with a thin vegetation layer—while keeping other vegetation and environmental factors as similar as possible [17]. Using proximal remote sensing measurements, the spectral difference between these plot types can indicate the extent to which understory influences TOC reflectance [18]. Nevertheless, it is challenging to ensure that both plot types share the same biochemical (e.g., chlorophyll content) and biophysical (e.g., LAI) characteristics, as well as the same 3D leaf distribution in the canopy. This constraint hinders a clear investigation of the understory’s impact on TOC reflectance.
Alternatively, one can measure the effect of understory on TOC reflectance by modifying the background spectrum of the crop canopy. For example, the background may consist of a weed layer, bare soil, or other materials, and the spectral differences among these components provide opportunities for direct evaluation of understory influence on TOC reflectance [19]. One possible solution is to remove the weed layer and expose the soil layer. However, because the soil spectrum is affected by numerous factors (e.g., soil moisture and surface roughness), the results may lack broader applicability in different planting regions [20].
Here, we proposed a background modification scheme in which a black material with near-zero reflectance was used to cover the weed layer and alter the background spectrum of crop canopies. We then used tower-based and UAV-based hyperspectral measurements to assess the influence of understory on TOC reflectance under these conditions. A sugarcane field with different background components (i.e., bare soil and weeds) was used for our experiment, and we collected tower- and drone-based spectral measurements. Furthermore, we applied a widely used hybrid inversion method to evaluate the effect of understory on LAI inversion.

2. Materials and Methods

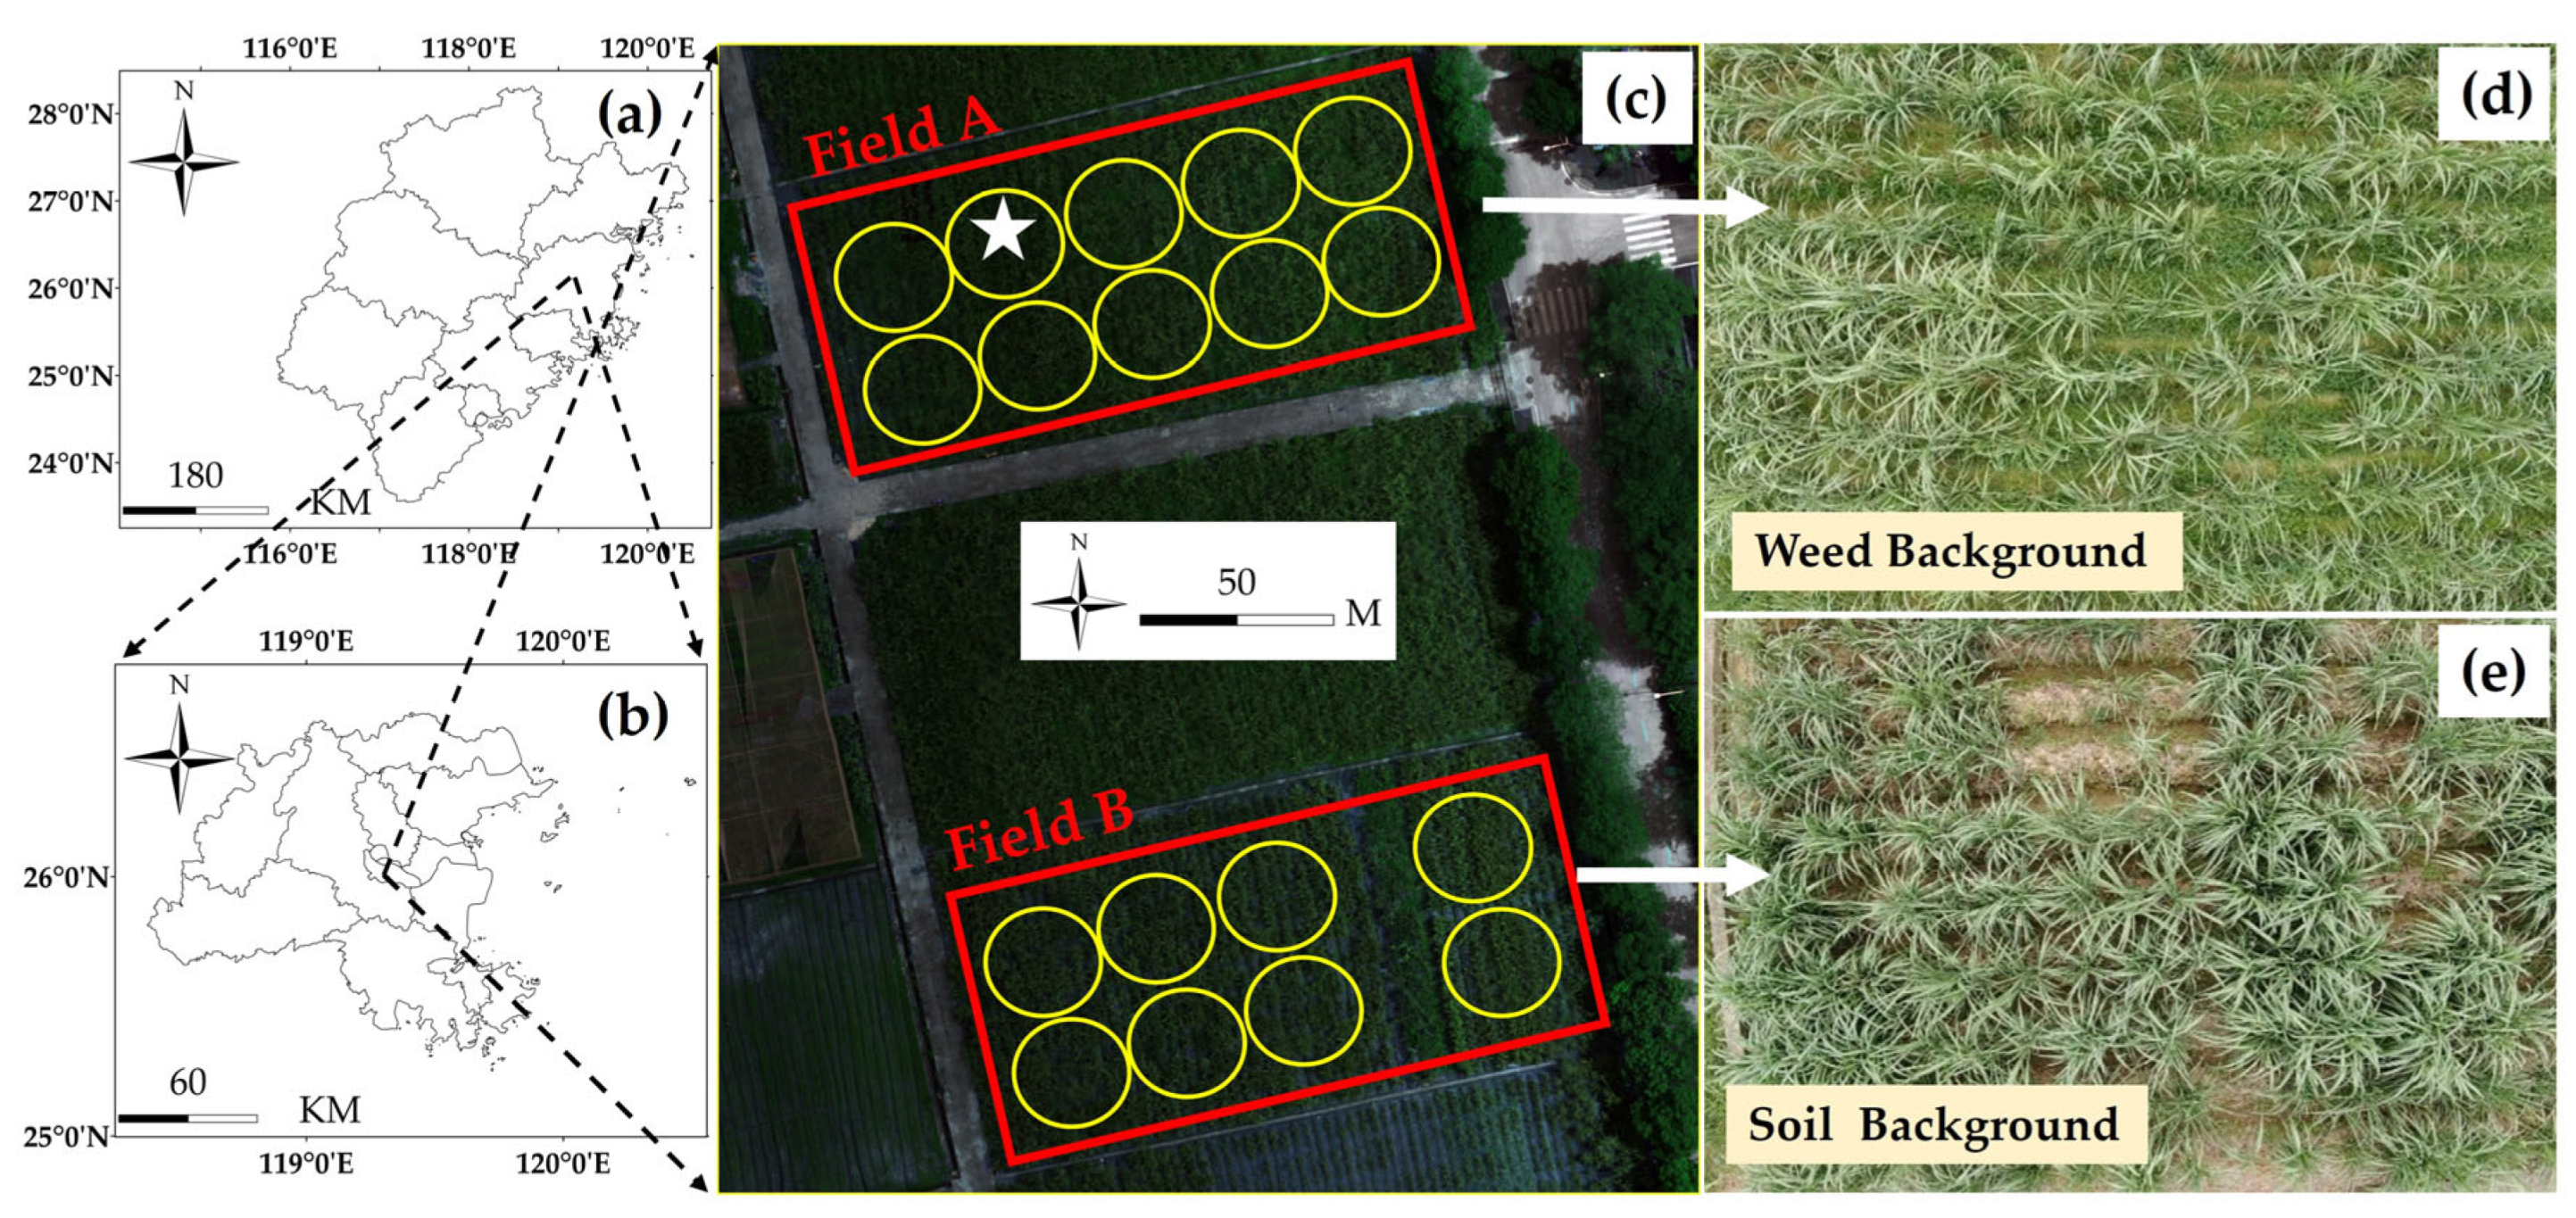
2.1. Study Site and Experimental Design

We conducted our experiment in July 2024 at the Experimental Station of the National Engineering Research Center for Sugarcane of Fujian Agriculture and Forestry University (FAFU) in Fuzhou City, Fujian Province (26°04′–26°05′N, 119°12′–119°13′E) (Figure 1). The site has a subtropical monsoon climate with high temperatures and humidity throughout the year, an average annual temperature of 20 °C, and an average annual rainfall of 1700 mm. Sugarcane at this site reached an average height of 2.16 m, with a row spacing of 1.00 m and in-row spacing of about 0.50 m.
We selected two equally sized fields (30 m × 70 m), referred to as field A and field B, for our investigation. Although these fields had similar sugarcane growth and soil properties, they differed in their ground background: field A had a weed layer with an average height of 0.3 m above the soil surface, whereas field B had bare soil. The soil type is typical yellow soil in South China. We then chose 10 and 8 sample circle plots in fields A and B, respectively, each with a diameter of 15 m, for LAI measurements (Section 2.3).

2.2. Canopy Reflectance Measurements

2.2.1. Background Modification Scheme

We employed a background modification scheme to investigate how different backgrounds influenced canopy reflectance (Figure 2). We used a piece of black material to cover and modify the reflectance of the ground surface (soil or weeds). Because of its black color and uneven surface, this material readily absorbed light in the 400–900 nm spectral region. By applying this modification, we could measure and quantify the weed or soil influence on canopy reflectance both with and without the cover. For tower-based observations, we measured canopy reflectance before and after modification, as multiple measurements were convenient. For UAV-based observations, we measured reflectance inside and outside the modification area, facilitating spatial measurements.

2.2.2. Tower-Based Canopy Spectrum

We used an HR-2000+ spectrometer (Ocean Optics Inc., Dunedin, FL, USA) for tower-based canopy spectral measurements (Figure 2c) in field A, which had a weed layer above the soil surface. The spectrometer had a spectral range of 190–1100 nm and a spectral sampling resolution of 0.5 nm. We selected a range of 400–900 nm for spectral analysis because of the high signal-to-noise ratio in this region. We positioned the downward facing optical fiber, which was connected to the HR-2000+ spectrometer, at a height of 5 m above the ground, resulting in a measurement footprint of about 2.22 m in diameter—larger than the two-row spacing. We performed at least ten measurements both before and after applying the background modification scheme. All measurements took place between 12:00 and 13:00 under clear sky conditions. We also measured the reflectance spectra of three background types, bare soil, weeds, and black material, using the same spectrometer (Figure 3). The reflectance spectra of bare soil and weeds were measured at the edge of the sugarcane field where there was no vegetation and where the ground was covered with sugarcane, respectively.

2.2.3. UAV-Based Canopy Spectrum

We used a Headwall Nano-Hyperspec hyperspectral camera (Headwall, Photonics Inc., Bolton, MA, USA) mounted on a DJI MATRICE 300 RTK quadcopter (DJI Innovations Co., Ltd., Shenzhen, China) to collect hyperspectral data from the entire experimental site, which included fields A and B. The Nano-Hyperspec camera had a spectral range of 385–1000 nm, a spectral sampling resolution of 0.5 nm with 270 spectral bands, and a spatial resolution of 5 cm at a flight altitude of 70 m in the nadir direction. We conducted the UAV flight experiment between 12:00 and 13:00 under clear sky conditions. We covered a 5 m × 5 m area in field A with black material during the UAV flights. We used a handheld GPS to record the location of the background modification area.

2.3. LAI Measurements of Sugarcane Canopies

We used a Nikon D7500 camera equipped with a 4.5 mm F2.8 EX DC circular fisheye lens to capture upward-looking digital hemispherical photography (DHP) of sugarcane canopies. We mounted the fisheye camera at a fixed height of 0.4 m, slightly above the weed layer, to ensure that only sugarcane canopies were measured for LAI. We took all DHP images at a fixed azimuth angle, capturing at least ten upward-looking photos at each sample plot in fields A and B. We conducted these measurements near sunset, between 18:30 and 19:30, when diffuse light was dominant according to the measurement procedure for DHP images and LAI calculation [21]. We then used CAN EYE software (version 6.4.91) to retrieve sugarcane LAI from the DHP images [22].

2.4. Leaf Chlorophyll Content Measurements

We randomly collected 30 sugarcane leaves from the field. We immediately sealed them in sample bags and transported them to the laboratory under refrigeration at 3–8 °C. We cut a 0.2 g portion from each leaf using a sampler and determined its area by counting statistics. We measured total chlorophyll a and b content (Cab in mg/g) with UV-VIS spectroscopy using the anthrone reagent method, then converted Cab to µg/cm2 using the determined leaf area. The average Cab content in the fields was 42 µg/cm2. We used these Cab values only to assess background influence on canopy reflectance in Section 2.5.1.

2.5. Model Simulations

We performed model simulations for two purposes: (a) to assess the influence of the weed layer on canopy spectra via forward simulations (Section 2.5.1), and (b) to invert LAI using machine learning models (Section 2.5.2). We selected the PROSAIL radiative transfer model to simulate canopy spectral reflectance because of its high accuracy and computing efficiency. The PROSAIL model consists of a one-dimensional canopy reflectance model (SAIL) and a leaf reflectance model (PROSPECT-D) [10]. It can simulate canopy reflectance using four types of input variables: leaf chemical properties, canopy structure, background soil properties, and sun-sensor geometry [23].

2.5.1. Forward Simulations

We conducted a forward PROSAIL simulation experiment to assess the background influence on canopy reflectance. In the PROSAIL model, we replaced the soil reflectance spectrum with three measured reflectance spectra: soil background, weed background, and material background. We then calculated the spectral ratio (Rweed/Rsoil), defined as the ratio between canopy reflectance with a weed-layer background (Rweed) and canopy reflectance with a soil background (Rsoil), to quantify the weed layer’s influence on canopy reflectance. The fixed and variable parameters of the PROSAIL simulations are shown in Table 1. We varied LAI from 1 to 6 in increments of 1 and selected six typical leaf angle distribution functions: planophile, erectophile, plagiophile, extremophile, spherical, and uniform. We set sun-sensor geometry similarly to that of the tower- and UAV-based measurements.

2.5.2. LAI Inversion Using Machine Learning

We simulated 170,000 canopy reflectance spectra using the PROSAIL model for LAI inversion (Figure 4), with input variables listed in Table 2. We chose a spherical leaf inclination angle distribution because it is widely used for crop simulations. The simulated reflectance spectra ranged from 400 to 2500 nm at 1 nm intervals.
We used a Random Forest Regression (RFR) model to retrieve the LAI. RFR is an ensemble learning algorithm based on decision trees and is widely used for classification and regression tasks [24]. RFR can handle high-dimensional data and is not easily subject to over-fitting, making it suitable for LAI inversion [25]. The RFR-based LAI inversions consisted of three main steps. First, we used bootstrap sampling to select data from the original dataset to build a single decision tree. Second, we repeated this process to generate multiple decision trees, with each tree randomly selecting a subset of features for prediction. Finally, we aggregated the prediction results of all decision trees to obtain the final prediction. Because each tree was trained on different data subsets, the error patterns differed among trees [26], thereby reducing overall estimation bias when we combined multiple independently trained decision trees [27]. The performance of machine learning algorithms also depends on the selection of their parameters. In our study, we used grid search optimization to identify the optimal parameters [28]. The characteristic variable was set to the square root of the total number of features and all other parameters were set to their default values [29].
Table 2. PROSAIL input variables for LAI inversions.
ModelVariable NameSymbolUnitTypical RangeReferences
PROSPECT-D
(leaf model)
Leaf structure indexNUnitless1.2–2[30]
Chlorophyll a + b contentCabμg/cm20.1–60[31]
Total carotenoid contentCarμg/cm2Cab/7[32]
Dry matter contentCmg/cm20.01–0.07[33]
Leaf water depthCwcm0.01–0.03[34]
SAIL
(Canopy model)
Leaf area indexLAIm2/m20.1–7[35]
Leaf angle distribution functionLADFUnitlessSpherical[36]
Hotspot parameterHotUnitless0[37]
Soil reflectanceρsoil(%)Measured (Figure 3)-
Soil brightness factorαsoilUnitless1[38]
Solar zenith angleSZA(◦)10–90[39]
Solar azimuth angleSAA(◦)30–270[39]
View zenith angleVZA(◦)10–90[40]

3. Results

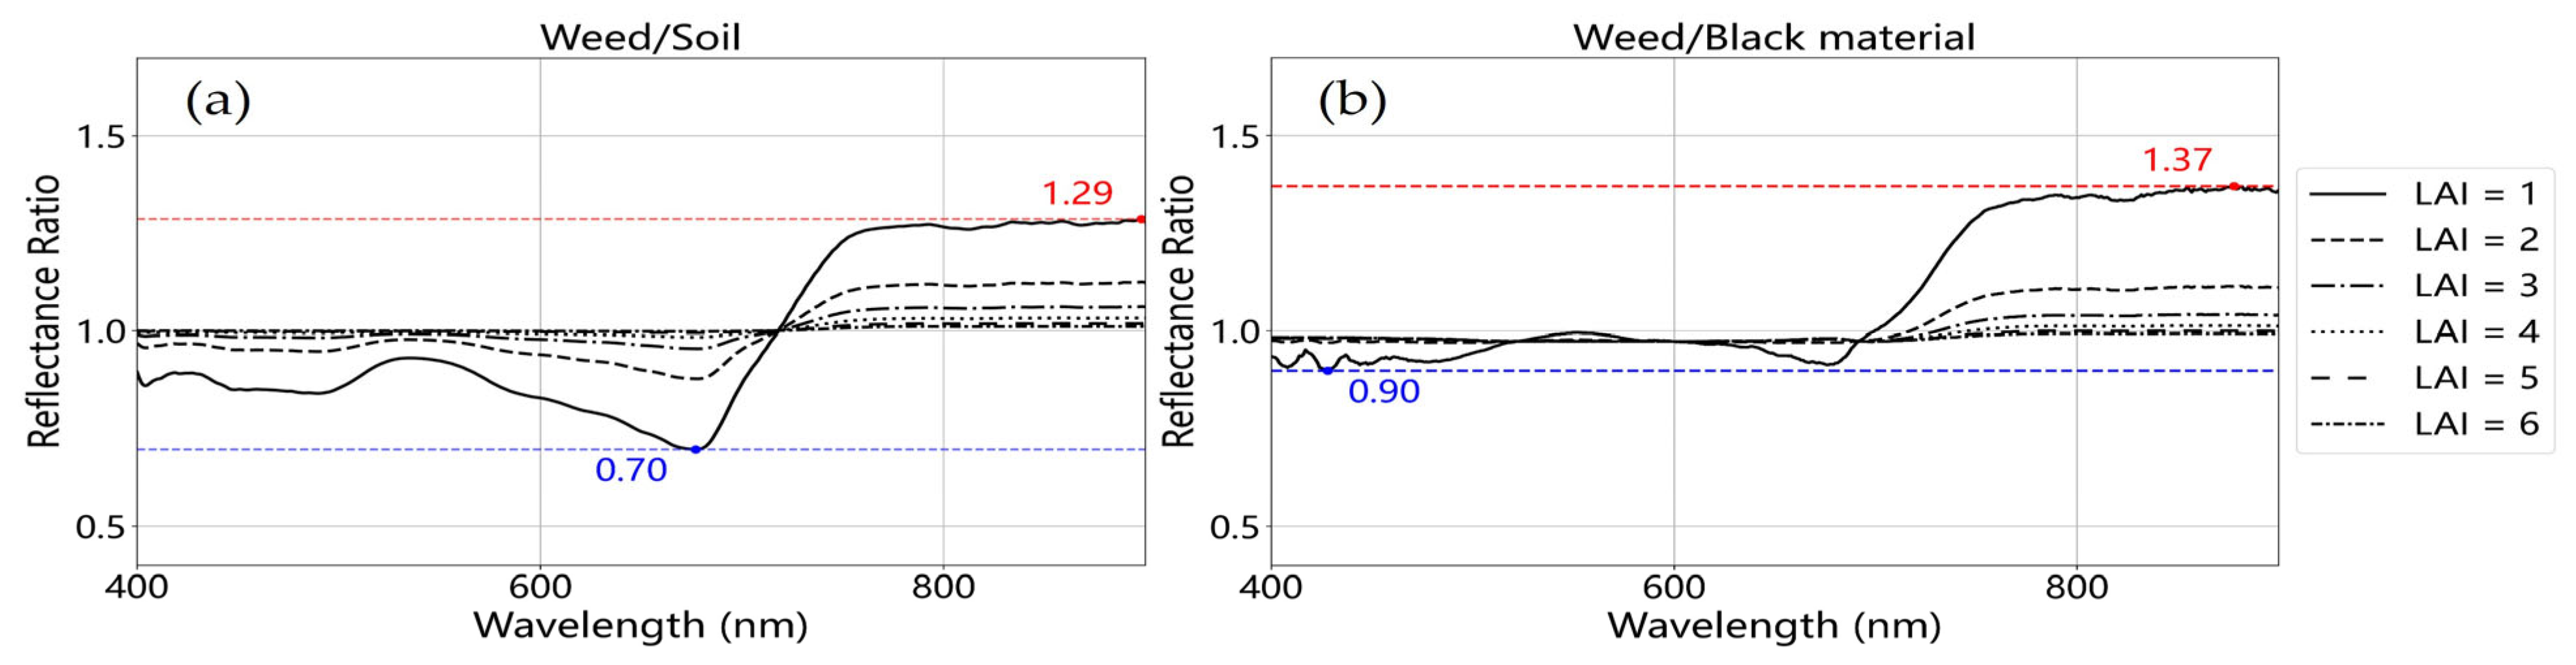
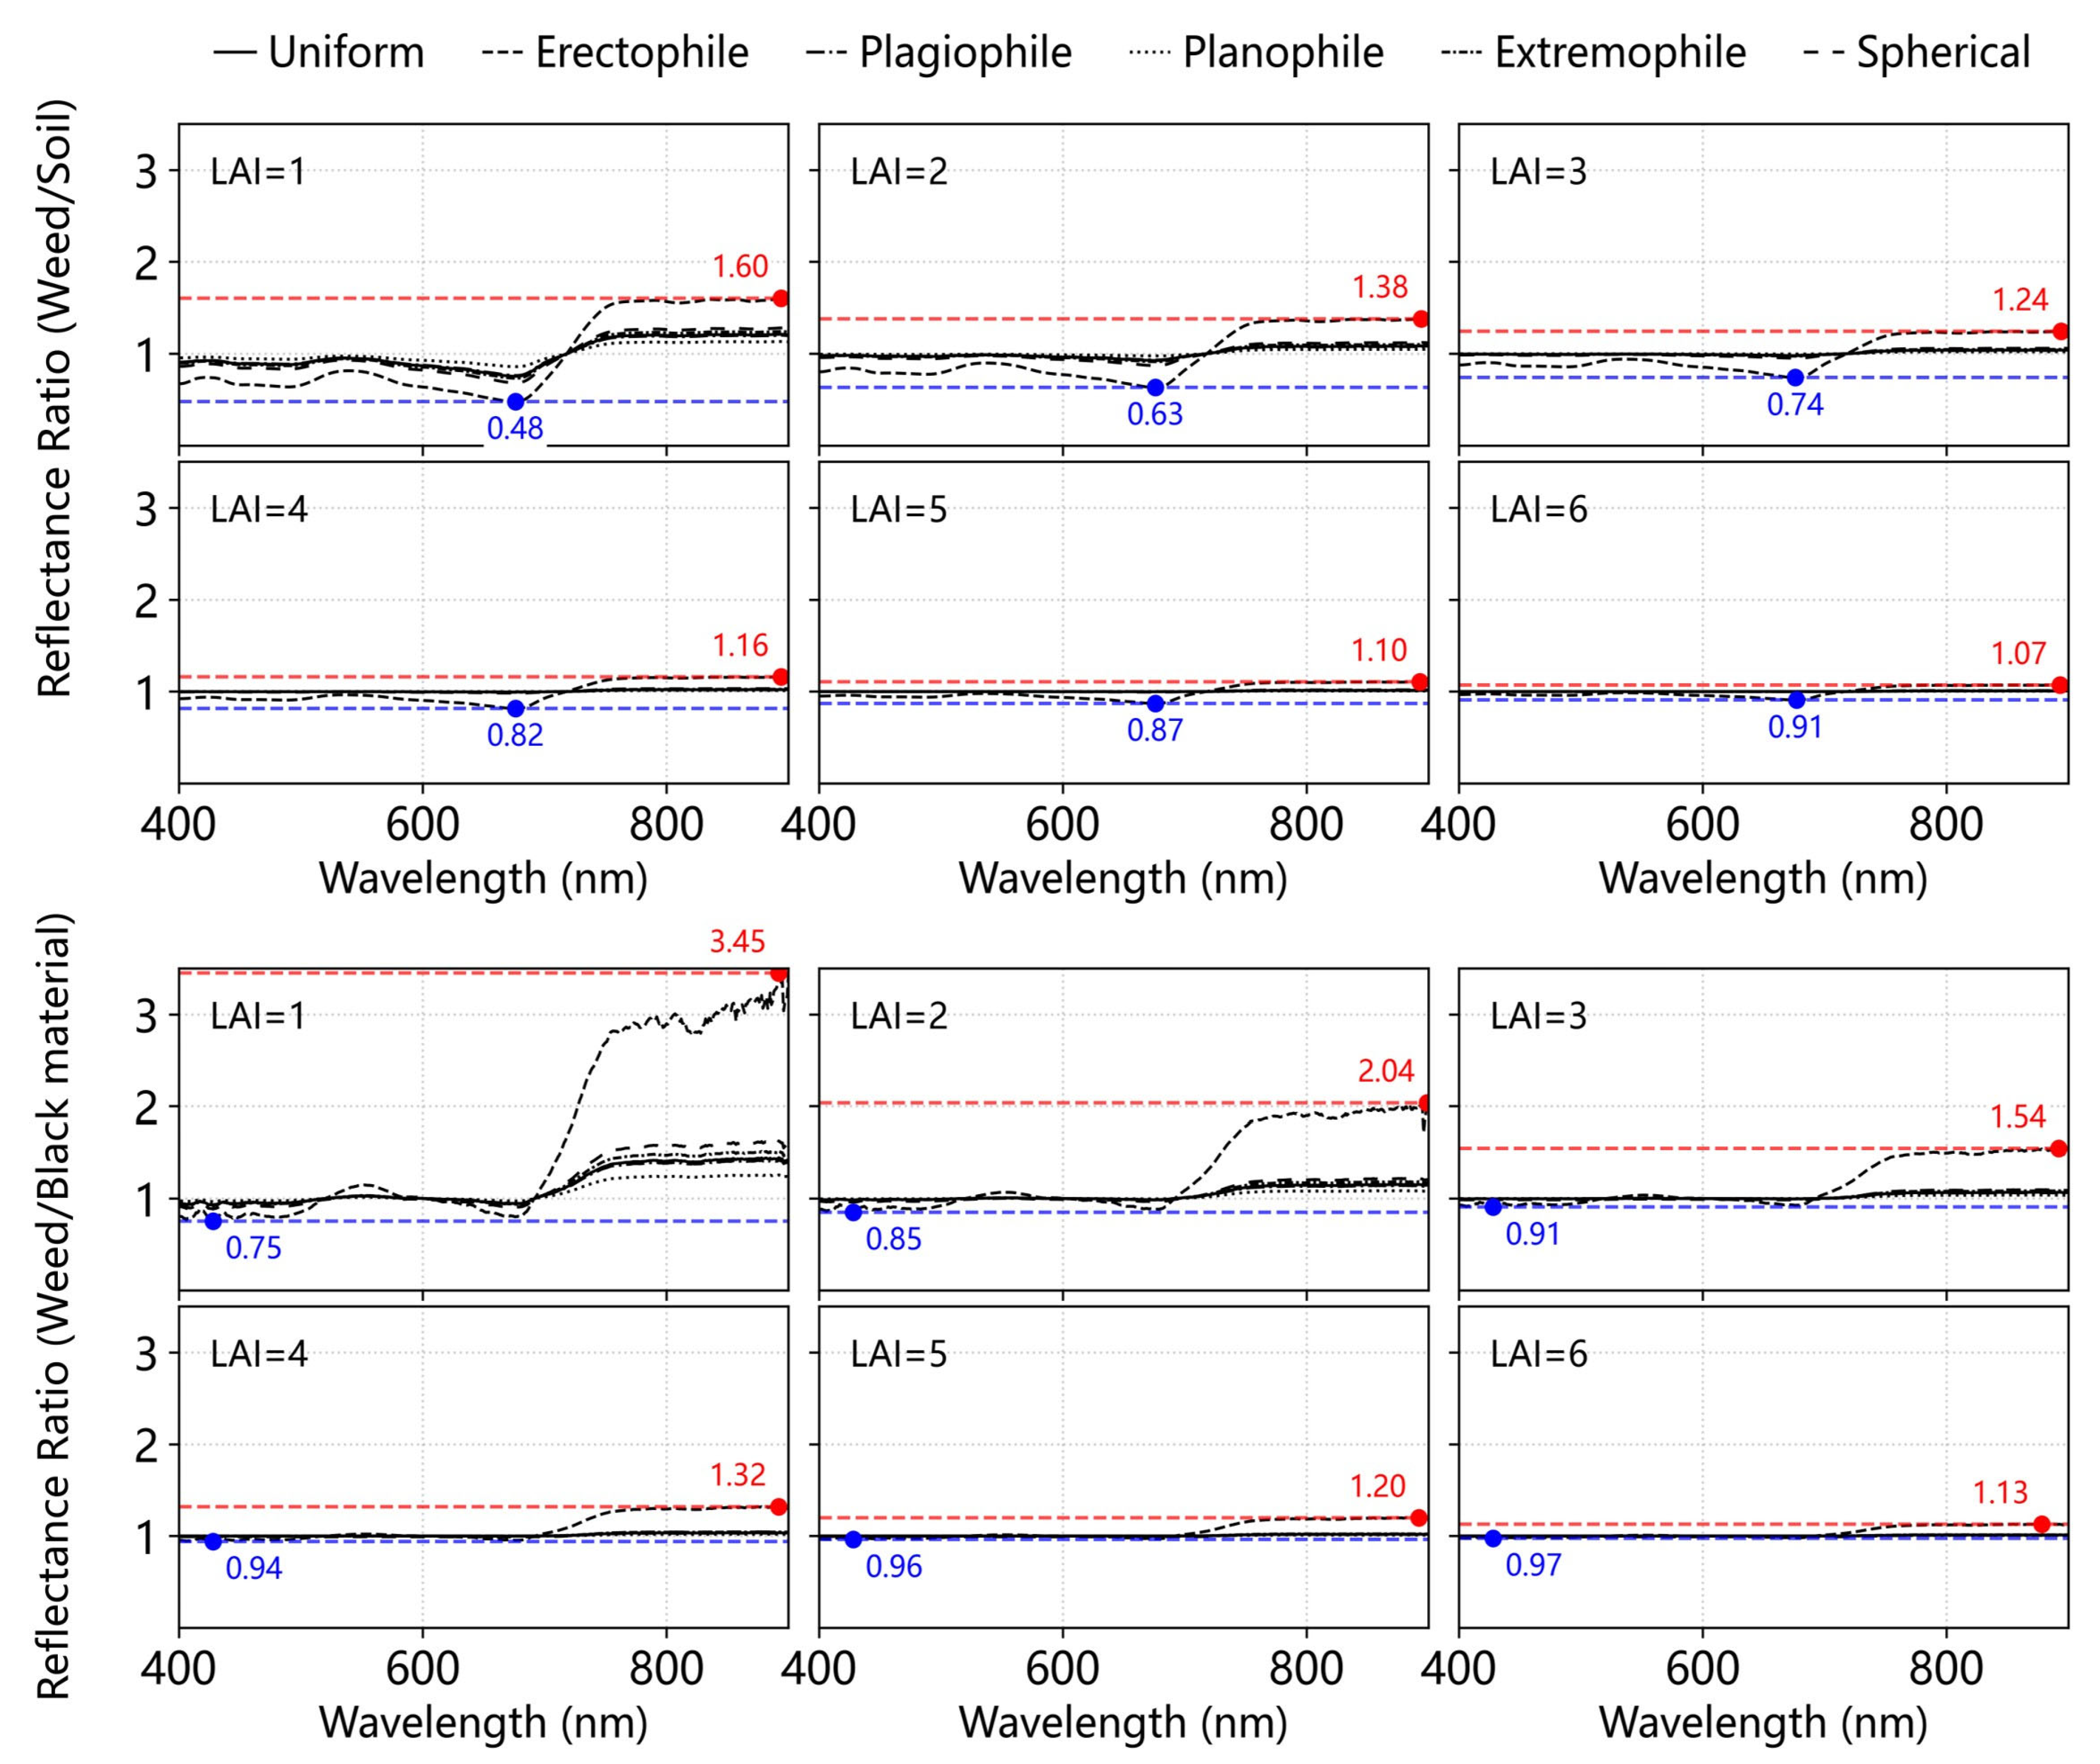
3.1. Simulation-Based Evaluation of the Influence of Weed Layer on Crop Canopy Reflectance

Figure 5 shows the PROSAIL-simulated spectral ratios (Rweed/Rsoil and Rweed/Rblack) under varying LAI and a constant spherical leaf inclination angle distribution. We observed that the canopy reflectance with a weed-layer background was lower in the visible region and higher in the far-red region than that with a soil background (Figure 5a), and was higher mainly in the far-red region when compared with a soil background (Figure 5b). Furthermore, we found that the spectral ratios (Rweed/Rsoil) reached their smallest value in the red region (around 670 nm). This difference was remarkable when LAI was less than 4, and the two spectral ratios were close to zero from 400 to 900 nm when LAI was greater than 4.
Figure 6 shows the PROSAIL-simulated spectral ratios (Rweed/Rsoil and Rweed/Rblack) under varying LADFs for a specific LAI from 1 to 6. We observed that erectophile canopies exhibited a much larger difference in these two spectral ratios than did canopies with uniform, plagiophile, planophile, extremophile, or spherical LADFs. In addition, the difference between canopy reflectance with weed-layer and soil backgrounds remained noteworthy for erectophile canopies even when LAI exceeded 4.

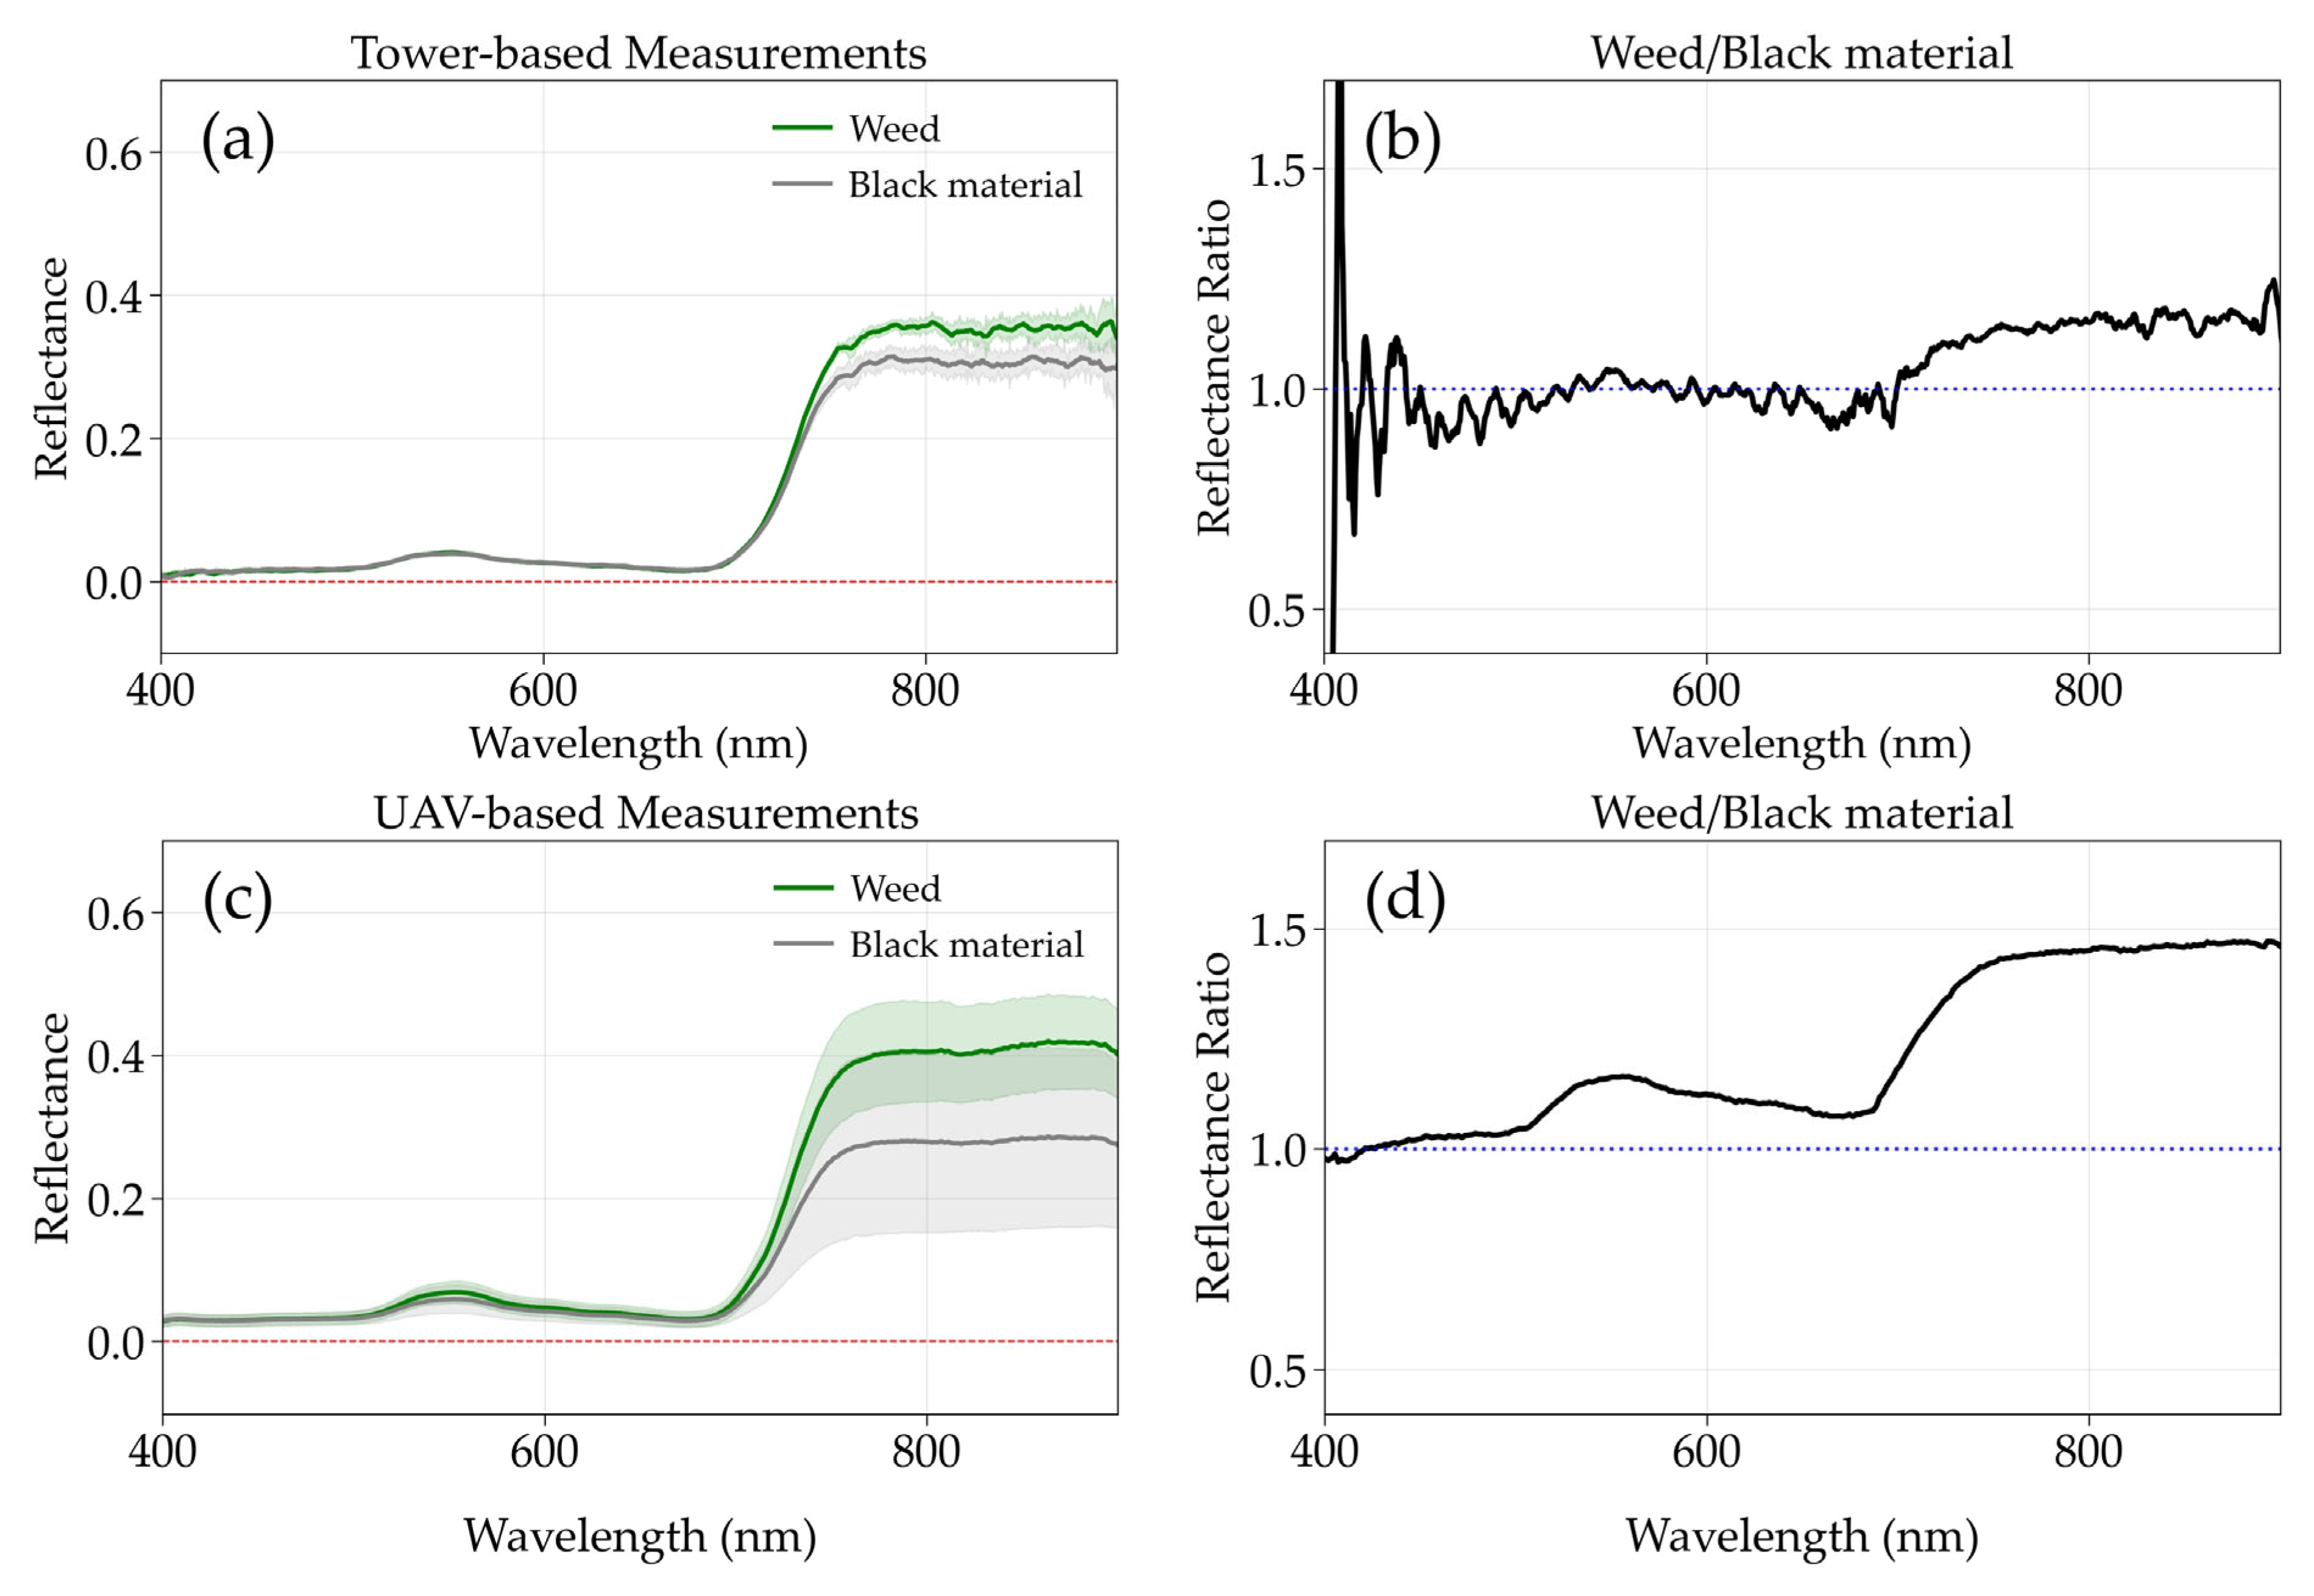
3.2. Measurement-Based Evaluation of the Influence of the Weed Layer on Crop Canopy Reflectance

Figure 7 shows the canopy reflectance of sugarcane canopies with weed-layer and black material backgrounds from tower-based (Figure 7a) and UAV-based (Figure 7c) measurements obtained via the background modification scheme. We found that the canopy reflectance with a weed-layer background was notably higher in the far-red region than with a black material background for both tower- (13.58%) and UAV-based (42.53%) measurements. We also observed that the spectral ratios of Rweed/Rblack from UAV-based (Figure 7d) measurements were higher than those from tower-based (Figure 7b) measurements. The largest value of Rweed/Rblack reached about 1.5 in the far-red region for UAV-based measurements and about 1.2 for tower-based measurements.

3.3. LAI Inversion with Different Background

Figure 8 shows comparisons of inversed and measured LAIs for field A (Figure 8a) and field B (Figure 8b). We found that the inversed LAI matched the measured values well for the eight sample plots in field B (soil background) with a root mean square error (RMSE) of 0.69 m2/m2, but it exhibited a systematic overestimation for the ten sample plots in field A (weed-layer background) with an RMSE of 2.07 m2/m2.
Figure 9a shows the inversed LAI images of sugarcane canopies. We observed that the canopy reflectance image inside the background modification area clearly showed row direction (Figure 9d). However, we could not identify row direction in the canopy reflectance image outside the background modification area (Figure 9e). The canopy reflectance image outside this area had a larger number of low-LAI pixels that were distributed homogeneously in the inversed LAI image (Figure 9f). In addition, we observed that sugarcane canopies with a weed-layer background had a relatively higher LAI than those with a black material background (Figure 9f). We then generated a corrected LAI image (Figure 9b) by subtracting 1.54, which was calculated as the difference in LAI between Figure 9d and Figure 9e, from each pixel in the original LAI image (Figure 9a). The histogram distribution of the weed-corrected LAI image is shifted left when compared to the original LAI image (Figure 9c). The corrected LAI image more clearly showed row direction when compared with the original LAI image (Figure 9a). It should be noted that this is a preliminary correction under the assumption that the weed layer is homogeneously distributed in the sugarcane field.

4. Discussion

4.1. Influence of Weed Layer on Crop Canopy Reflectance

A thin weed layer can grow within crop fields during the crop growth process, producing two-layered canopies because this weed layer generally has a relatively lower height than the crop canopies. Our simulation-based results show that the weed layer affects both the red and far-red regions of canopy reflectance when compared with soil background and mainly affects the far-red region of canopy reflectance when compared with the black material background (Figure 5). This finding is consistent with simulated results for forest canopies using the 3D FLIGHT RT model, where grass background has a significant influence on canopy reflectance in both the red and far-red regions compared with soil background [41]. The reason for this phenomenon is that the weed-layer background has reflectance characteristics different from those of soil in both the red and far-red regions but has similarly low reflectance in the red region when compared with the black material background (Figure 3).
It should be noted that Iqbal et al. (2006) found that cotton canopy reflectance with a weed background was lower than that with a soil background in the far-red region, whereas an opposite result was observed in this study [42]. This is because the leaf and canopy spectral characteristics of cotton were significantly changed under the influence of the weed layer, which then reduced the spectral reflectance of the cotton canopy. In our study, the leaf and canopy spectral characteristics of sugarcane remain similar regardless of the background.
Our PROSAIL-simulated results indicate that the influence of the weed layer on canopy reflectance is remarkable only when crop canopies have a low LAI and is nearly negligible when the LAI is larger than 3 (Figure 5). This phenomenon is also found in forest simulation [16], where the understory influence on canopy reflectance is more pronounced when the tree LAI is 3.5 than when the tree LAI is 0.5. This is largely because the contribution of understory to canopy reflectance is determined by the gap fraction of the overstory canopy [43], and the gap fraction of the overstory canopy is affected by the LAI [8].
Our PROSAIL-simulated results also indicate that the contribution of the understory layer to canopy reflectance is determined by leaf angle distribution functions (Figure 6). The reflectance of crop canopies with an erectophile leaf angle distribution is more affected by weed background than that of canopies with other leaf angle distribution functions. This can be explained by the fact that the gap fraction of the overstory canopy is also affected by leaf angle distribution functions [44]. The contribution of understory to canopy reflectance is likewise determined by the spectral and structural properties of understory canopies [43]. In this study, a weed layer was found aboveground with an LAI of about 1.5. The influence of the weed background on canopy reflectance will increase with weed LAI, and vice versa.

4.2. Influence of Weed Layer on LAI Inversion

The PROSAIL model has been widely used to retrieve crop LAI via inversion methods such as lookup tables and machine learning [37,45]. In the PROSAIL model, a soil brightness parameter is adopted to account for the influence of soil background on canopy reflectance [10]. Our LAI inversion results and in situ measurements confirm that the PROSAIL-based inversion method performs well for field B, where the sugarcane canopy has a bare soil background (Figure 8b).
In contrast, the PROSAIL-based inversion method overestimates the LAI of sugarcane canopies (Figure 8a). This is because the soil brightness parameter can only account for the influence of the soil spectrum on canopy reflectance. When a weed layer is found above the soil surface, the PROSAIL-simulated soil reflectance spectrum differs substantially from the weed background reflectance spectrum (Figure 3). The spectral reflectance information of the weed background is therefore interpreted as crop canopy reflectance, leading to an overestimation of crop LAI.
Our inverted LAI images further confirm the overestimation of sugarcane canopy LAI when the soil surface is covered by a weed layer (Figure 9). The inverted LAI images with weed background exhibit relatively higher LAI values than those inside the background modification area, where the weed layer was covered by black material (Figure 9d,e). The unclear row directions in the LAI images (Figure 9e) occur because the weed layer is interpreted as part of the sugarcane canopy, which is further confirmed by the histogram distribution of LAI images (Figure 9f).
Similar to a forest canopy, the overstory and understory LAIs should be considered separately, and the understory LAI can be calculated by subtracting the overstory LAI from the total scene LAI [8,46]. The difference in value between the two LAI images—i.e., inside (Figure 9d) and outside (Figure 9e) the background modification area—can be regarded simply as the LAI of the weed layer (approximately 1.54). When the LAI values of each pixel in Figure 9a are reduced (corrected) by 1.54, a clear row direction emerges (Figure 9b). In addition, although not shown in this study, the corrected LAI of ten sample areas in field A matches well with the DHP measurements. Overall, it is important to consider the influence of the weed layer during the estimation of crop canopy LAI, and more LAI separation methods for crop and weed layers should be developed in the future for precision agriculture applications.

4.3. Background Modification Scheme for Experimental Investigation

In previous studies, model simulations were generally used to investigate the influence of background on canopy reflectance [16,41,42,47], as illustrated by the simulation-based evaluations in Section 3.1. However, measurements are still required to validate the background influence on canopy reflectance. Wang et al. (2023) conducted a seasonal experimental study to clarify the influence of snow background on tree canopy reflectance by performing comparable canopy reflectance measurements with and without snow cover [48]. However, those two (or more) comparable measurements were taken on different days, during which the spectral and structural properties of the tree canopies could have changed.
To address this issue, a simple but practical background modification scheme was proposed in this study, enabling researchers to investigate the background influence on canopy reflectance based on in situ measurements on the same day (Figure 2a,b). Using this background modification scheme, the background influence on canopy reflectance (Figure 7) and LAI inversions (Figure 9) was quantified. The scheme can be applied to tower- and UAV-based measurement investigations (Figure 2c,d), and even to satellite-based measurement investigations—provided that the satellite images have sufficiently high spatial resolution.
Also, the spectral-invariant theory has recently attracted much attention because it has numerous applications in canopy reflectance modeling and vegetation parameter inversion [49]. Several canopy reflectance models and LAI inversion methods were developed under black-soil conditions [50,51]. With the background modification scheme proposed in this study, these canopy reflectance models and LAI inversion methods can be directly validated and evaluated using in situ measurements taken with and without black material background.

4.4. Implications, Limitations, and Future Improvements

Given the influence of a weed layer on crop canopy reflectance and LAI inversions, it is necessary to develop approaches to retrieve weed reflectance from remote sensing data. The first potential approach is using the measured reflectance spectra of the weed layer as input in crop canopy models (e.g., PROSAIL) to replace soil reflectance spectra, similar to that of forest background reflectance studies [52]. However, the spatial and temporal variation in the spectral reflectance of the weed layer cannot be perfectly represented by the limited reflectance spectra measurements, which then will introduce uncertainty to the inversion of crop LAI. Another potential approach is using multi-angle reflectance to retrieve weed reflectance. This approach is based on that the contributions of background on total canopy reflectance will differ along with different viewing angles [53,54,55]. Future studies will be conducted to separately retrieve the reflectance spectra of weeds and crops using multi-angle reflectance data from UAV and satellite platforms.
Apart from weed-induced two-layered vegetation canopies, moss can also form an understory layer and its spectral properties are similar to that of vegetation [56]. Hence, two-layered vegetation canopies can also be found for aquatic crops, especially for rice. Although moss was generally found growing at the bottom of the standing water of rice, its influence on crop reflectance was generally ignored. More in situ measurements of moss spectra are required to investigate its influence on rice canopy reflectance [57].
Due to the limited field region and the large footprint of DHP measurement, only ten and eight sample plots were selected to conduct DHP-based LAI measurements for fields A and B, respectively. Thus, statistical uncertainty may have been introduced into the statistical results (e.g., Figure 8). Future LAI measurements should be conducted in fields with a larger area to ensure enough sample plots for DHP-based LAI measurements.
A commercial black material was used in this study to modify the background reflectance. Although the reflectance of this material is close to zero between 400 and 900 nm, it shows a reflectance of approximately 0.3% in the far-red region (Figure 3), which introduces error in subsequent analyses of background influence on canopy reflectance. Furthermore, we did not measure or analyze multi-angular reflectance characteristics. A specific material whose reflectance remains near zero in the visible and far-red regions under varying solar-view geometry is recommended for future experiments.

5. Conclusions

We investigated the influence of the weed layer on sugarcane canopy reflectance and LAI inversion using model simulations and in situ measurements. We used a simple but practical background modification scheme that enabled direct comparison of crop canopy reflectance with and without a weed layer, from which we drew the following conclusions.
First, the sugarcane canopy with a weed-layer background had varied canopy reflectance in both the visible and far-red regions compared with the canopy with a soil background, whereas it showed notable variation only in the far-red region compared with the canopy with a black material background. Second, crop canopy LAI and leaf angle distribution functions both determined the influence of the weed-layer background on canopy reflectance, and canopies with low LAI (LAI < 3) and an erectophile leaf angle distribution were more susceptible to this influence. Third, the PROSAIL-based LAI inversion performed well in the sugarcane field with soil background but overestimated sugarcane LAI in the sugarcane field with weed background.
Our findings suggest that the influence of the weed layer should not be ignored during simulations of crop canopy reflectance using RT models, and we recommend the development of LAI inversion algorithms capable of separating crop and weed LAI, like those used for forest LAI estimations. The background modification scheme we used could be applied to investigate background influence on canopy reflectance using measured spectral data from tower, UAV, or satellite platforms.

Author Contributions

Conceptualization, W.L., L.Q. and X.K.; methodology, W.L., L.Q. and X.K.; software, L.Q. and X.K.; writing—original draft preparation, L.Q. and X.K.; writing—review and editing, W.L., L.Q. and X.K.; investigation, X.K., X.S., Y.L. and S.S.; visualization, L.Q. and X.K.; funding acquisition, W.L. All authors have read and agreed to the published version of the manuscript.

Funding

This research has been co-financed by the Chinese Natural Science Foundation (Grant No. 42101325) and the Natural Science Foundation of Fujian Province, China (Grant No. 2021J01210949).

Data Availability Statement

The dataset that supports the findings of this study is available on request from the corresponding author.

Conflicts of Interest

The authors declare no conflicts of interest.

References

  1. Ke, L.; Zhou, Q.; Wu, W.; Tian, X.; Tang, H. Estimating the crop leaf area index using hyperspectral remote sensing. J. Integr. Agric. 2016, 15, 475–491. [Google Scholar] [CrossRef]
  2. Dong, T.; Liu, J.; Qian, B.; He, L.; Liu, J.; Wang, R.; Jing, Q.; Champagne, C.; McNairn, H.; Powers, J.; et al. Estimating crop biomass using leaf area index derived from Landsat 8 and Sentinel-2 data. ISPRS J. Photogramm. Remote Sens. 2020, 168, 236–250. [Google Scholar] [CrossRef]
  3. Duchemin, B.; Hadria, R.; Erraki, S.; Boulet, G.; Maisongrande, P.; Chehbouni, A.; Escadafal, R.; Ezzahar, J.; Hoedjes, J.C.B.; Kharrou, M.H.; et al. Monitoring wheat phenology and irrigation in Central Morocco: On the use of relationships between evapotranspiration, crops coefficients, leaf area index and remotely-sensed vegetation indices. Agric. Water Manag. 2006, 79, 1–27. [Google Scholar] [CrossRef]
  4. Simic Milas, A.; Romanko, M.; Reil, P.; Abeysinghe, T.; Marambe, A. The importance of leaf area index in mapping chlorophyll content of corn under different agricultural treatments using UAV images. Int. J. Remote Sens. 2018, 39, 5415–5431. [Google Scholar] [CrossRef]
  5. Baez-Gonzalez, A.D.; Kiniry, J.R.; Maas, S.J.; Tiscareno, M.; Macias, J.; Mendoza, J.L.; Richardson, C.W.; Salinas, J.; Manjarrez, J.R. Large-area maize yield forecasting using leaf area index based yield model. Agron. J. 2005, 97, 418–425. [Google Scholar] [CrossRef]
  6. Zhang, H.; Wang, L.; Tian, T.; Yin, J. A Review of Unmanned Aerial Vehicle Low-Altitude Remote Sensing (UAV-LARS) Use in Agricultural Monitoring in China. Remote Sens. 2021, 13, 1221. [Google Scholar] [CrossRef]
  7. Verrelst, J.; Malenovsky, Z.; Van der Tol, C.; Camps-Valls, G.; Gastellu-Etchegorry, J.P.; Lewis, P.; North, P.; Moreno, J. Quantifying Vegetation Biophysical Variables from Imaging Spectroscopy Data: A Review on Retrieval Methods. Surv. Geophys. 2019, 40, 589–629. [Google Scholar] [CrossRef]
  8. Fang, H.; Baret, F.; Plummer, S.; Schaepman-Strub, G. An Overview of Global Leaf Area Index (LAI): Methods, Products, Validation, and Applications. Rev. Geophys. 2019, 57, 739–799. [Google Scholar] [CrossRef]
  9. Sahoo, R.N.; Rejith, R.G.; Gakhar, S.; Verrelst, J.; Ranjan, R.; Kondraju, T.; Meena, M.C.; Mukherjee, J.; Dass, A.; Kumar, S.; et al. Estimation of wheat biophysical variables through UAV hyperspectral remote sensing using machine learning and radiative transfer models. Comput. Electron. Agric. 2024, 221, 108942. [Google Scholar] [CrossRef]
  10. Berger, K.; Atzberger, C.; Danner, M.; D’Urso, G.; Mauser, W.; Vuolo, F.; Hank, T. Evaluation of the PROSAIL Model Capabilities for Future Hyperspectral Model Environments: A Review Study. Remote Sens. 2018, 10, 85. [Google Scholar] [CrossRef]
  11. Han, D.; Liu, J.; Zhang, R.; Liu, Z.; Guo, T.; Jiang, H.; Wang, J.; Zhao, H.; Ren, S.; Yang, P. Evaluation of the SAIL Radiative Transfer Model for Simulating Canopy Reflectance of Row Crop Canopies. Remote Sens. 2023, 15, 5433. [Google Scholar] [CrossRef]
  12. Spanner, M.A.; Pierce, L.L.; Peterson, D.L.; Running, S.W. Remote sensing of temperate coniferous forest leaf area index The influence of canopy closure, understory vegetation and background reflectance. Int. J. Remote Sens. 2007, 11, 95–111. [Google Scholar] [CrossRef]
  13. Pathak, H.; Igathinathane, C.; Howatt, K.; Zhang, Z. Machine learning and handcrafted image processing methods for classifying common weeds in corn field. Smart Agric. Technol. 2023, 5, 100249. [Google Scholar] [CrossRef]
  14. Nong, C.; Fan, X.; Wang, J. Semi-supervised Learning for Weed and Crop Segmentation Using UAV Imagery. Front. Plant Sci. 2022, 13, 927368. [Google Scholar] [CrossRef]
  15. Kuusk, A. A two-layer canopy reflectance model. J. Quant. Spectrosc. Radiat. Transf. 2001, 71, 1–9. [Google Scholar] [CrossRef]
  16. Caetano, M.; Pereira, J. Effect of the Understory on the Estimation of Coniferous Forest Leaf Area Index (LAI) Based on Remotely Sensed Data; SPIE: Bellingham, WA, USA, 1996; Volume 2955. [Google Scholar]
  17. Mu, X.; Yang, Y.; Xu, H.; Guo, Y.; Lai, Y.; McVicar, T.R.; Xie, D.; Yan, G. Improvement of NDVI mixture model for fractional vegetation cover estimation with consideration of shaded vegetation and soil components. Remote Sens. Environ. 2024, 314, 114409. [Google Scholar] [CrossRef]
  18. Darvishzadeh, R.; Skidmore, A.; Atzberger, C.; van Wieren, S. Estimation of vegetation LAI from hyperspectral reflectance data: Effects of soil type and plant architecture. Int. J. Appl. Earth Obs. Geoinf. 2008, 10, 358–373. [Google Scholar] [CrossRef]
  19. Eriksson, H.M.; Eklundh, L.; Kuusk, A.; Nilson, T. Impact of understory vegetation on forest canopy reflectance and remotely sensed LAI estimates. Remote Sens. Environ. 2006, 103, 408–418. [Google Scholar] [CrossRef]
  20. Liu, S.; Jin, X.; Bai, Y.; Wu, W.; Cui, N.; Cheng, M.; Liu, Y.; Meng, L.; Jia, X.; Nie, C.; et al. UAV multispectral images for accurate estimation of the maize LAI considering the effect of soil background. Int. J. Appl. Earth Obs. Geoinf. 2023, 121, 103383. [Google Scholar] [CrossRef]
  21. Fang, H.; Li, W.; Wei, S.; Jiang, C. Seasonal variation of leaf area index (LAI) over paddy rice fields in NE China: Intercomparison of destructive sampling, LAI-2200, digital hemispherical photography (DHP), and AccuPAR methods. Agric. For. Meteorol. 2014, 198–199, 126–141. [Google Scholar] [CrossRef]
  22. Weiss, M.; Baret, F. CAN_EYE V6. 4.91 User Manual. 2017. Available online: https://can-eye.paca.hub.inrae.fr/documentation/documentation (accessed on 10 July 2024).
  23. Jacquemoud, S.; Verhoef, W.; Baret, F.; Bacour, C.; Zarco-Tejada, P.J.; Asner, G.P.; François, C.; Ustin, S.L. PROSPECT+SAIL models: A review of use for vegetation characterization. Remote Sens. Environ. 2009, 113, S56–S66. [Google Scholar] [CrossRef]
  24. Breiman, L. Random forests. Mach. Learn. 2001, 45, 5–32. [Google Scholar] [CrossRef]
  25. Yuan, H.; Yang, G.; Li, C.; Wang, Y.; Liu, J.; Yu, H.; Feng, H.; Xu, B.; Zhao, X.; Yang, X. Retrieving Soybean Leaf Area Index from Unmanned Aerial Vehicle Hyperspectral Remote Sensing: Analysis of RF, ANN, and SVM Regression Models. Remote Sens. 2017, 9, 309. [Google Scholar] [CrossRef]
  26. Geurts, P.; Wehenkel, L. Comments on: A random forest guided tour. Test 2016, 25, 247–253. [Google Scholar] [CrossRef]
  27. Parmar, A.; Katariya, R.; Patel, V. A Review on Random Forest: An Ensemble Classifier. In International Conference on Intelligent Data Communication Technologies and Internet of Things (ICICI) 2018; Lecture Notes on Data Engineering and Communications Technologies; Springer: Berlin/Heidelberg, Germany, 2019; pp. 758–763. [Google Scholar]
  28. Zhou, L.; Lai, K.K.; Yu, L. Credit scoring using support vector machines with direct search for parameters selection. Soft Comput. 2008, 13, 149–155. [Google Scholar] [CrossRef]
  29. Mao, H.; Meng, J.; Ji, F.; Zhang, Q.; Fang, H. Comparison of Machine Learning Regression Algorithms for Cotton Leaf Area Index Retrieval Using Sentinel-2 Spectral Bands. Appl. Sci. 2019, 9, 1459. [Google Scholar] [CrossRef]
  30. Baret, F.; Weiss, M.; Lacaze, R.; Camacho, F.; Makhmara, H.; Pacholcyzk, P.; Smets, B. GEOV1: LAI and FAPAR essential climate variables and FCOVER global time series capitalizing over existing products. Part1: Principles of development and production. Remote Sens. Environ. 2013, 137, 299–309. [Google Scholar] [CrossRef]
  31. Morcillo-Pallares, P.; Rivera-Caicedo, J.P.; Belda, S.; De Grave, C.; Burriel, H.; Moreno, J.; Verrelst, J. Quantifying the Robustness of Vegetation Indices through Global Sensitivity Analysis of Homogeneous and Forest Leaf-Canopy Radiative Transfer Models. Remote Sens. 2019, 11, 2418. [Google Scholar] [CrossRef]
  32. Wang, S.; Gao, W.; Ming, J.; Li, L.; Xu, D.; Liu, S.; Lu, J. A TPE based inversion of PROSAIL for estimating canopy biophysical and biochemical variables of oilseed rape. Comput. Electron. Agric. 2018, 152, 350–362. [Google Scholar] [CrossRef]
  33. Lunagaria, M.M.; Patel, H.R. Evaluation of PROSAIL inversion for retrieval of chlorophyll, leaf dry matter, leaf angle, and leaf area index of wheat using spectrodirectional measurements. Int. J. Remote Sens. 2018, 40, 8125–8145. [Google Scholar] [CrossRef]
  34. Li, M.; Chu, R.; Sha, X.; Ni, F.; Xie, P.; Shen, S.; Islam, A.R.M.T. Hyperspectral Characteristics and Scale Effects of Leaf and Canopy of Summer Maize under Continuous Water Stresses. Agriculture 2021, 11, 1180. [Google Scholar] [CrossRef]
  35. Jin, Z.; Liu, H.; Cao, H.; Li, S.; Yu, F.; Xu, T. Hyperspectral Remote Sensing Estimation of Rice Canopy LAI and LCC by UAV Coupled RTM and Machine Learning. Agriculture 2024, 15, 11. [Google Scholar] [CrossRef]
  36. Chakhvashvili, E.; Siegmann, B.; Muller, O.; Verrelst, J.; Bendig, J.; Kraska, T.; Rascher, U. Retrieval of Crop Variables from Proximal Multispectral UAV Image Data Using PROSAIL in Maize Canopy. Remote Sens. 2022, 14, 1247. [Google Scholar] [CrossRef]
  37. Darvishzadeh, R.; Skidmore, A.; Schlerf, M.; Atzberger, C. Inversion of a radiative transfer model for estimating vegetation LAI and chlorophyll in a heterogeneous grassland. Remote Sens. Environ. 2008, 112, 2592–2604. [Google Scholar] [CrossRef]
  38. Bhadra, S.; Sagan, V.; Sarkar, S.; Braud, M.; Mockler, T.C.; Eveland, A.L. PROSAIL-Net: A transfer learning-based dual stream neural network to estimate leaf chlorophyll and leaf angle of crops from UAV hyperspectral images. ISPRS J. Photogramm. Remote Sens. 2024, 210, 1–24. [Google Scholar] [CrossRef]
  39. Breunig, F.M.; Galvão, L.S.; dos Santos, J.R.; Gitelson, A.A.; de Moura, Y.M.; Teles, T.S.; Gaida, W. Spectral anisotropy of subtropical deciduous forest using MISR and MODIS data acquired under large seasonal variation in solar zenith angle. Int. J. Appl. Earth Obs. Geoinf. 2015, 35, 294–304. [Google Scholar] [CrossRef]
  40. Shi, H.; Xiao, Z. The 4SAILT Model: An Improved 4SAIL Canopy Radiative Transfer Model for Sloping Terrain. IEEE Trans. Geosci. Remote Sens. 2021, 59, 5515–5525. [Google Scholar] [CrossRef]
  41. Hornero, A.; North, P.R.J.; Zarco-Tejada, P.J.; Rascher, U.; Martín, M.P.; Migliavacca, M.; Hernandez-Clemente, R. Assessing the contribution of understory sun-induced chlorophyll fluorescence through 3-D radiative transfer modelling and field data. Remote Sens. Environ. 2021, 253, 112195. [Google Scholar] [CrossRef]
  42. Iqbal, J.; Phillip, R.; Ali, I. Application of remote sensing data to assess weed infestation in cotton. Agric. J. 2006, 1, 186–191. [Google Scholar]
  43. Rautiainen, M.; Heiskanen, J. Seasonal Contribution of Understory Vegetation to the Reflectance of a Boreal Landscape at Different Spatial Scales. IEEE Geosci. Remote Sens. Lett. 2013, 10, 923–927. [Google Scholar] [CrossRef]
  44. Fang, H. Canopy clumping index (CI): A review of methods, characteristics, and applications. Agric. For. Meteorol. 2021, 303, 108374. [Google Scholar] [CrossRef]
  45. Verrelst, J.; Muñoz, J.; Alonso, L.; Delegido, J.; Rivera, J.P.; Camps-Valls, G.; Moreno, J. Machine learning regression algorithms for biophysical parameter retrieval: Opportunities for Sentinel-2 and -3. Remote Sens. Environ. 2012, 118, 127–139. [Google Scholar] [CrossRef]
  46. Liu, Y.; Liu, R.; Pisek, J.; Chen, J.M. Separating overstory and understory leaf area indices for global needleleaf and deciduous broadleaf forests by fusion of MODIS and MISR data. Biogeosciences 2017, 14, 1093–1110. [Google Scholar] [CrossRef]
  47. Li, D.; Chen, J.M.; Yu, W.; Zheng, H.; Yao, X.; Cao, W.; Wei, D.; Xiao, C.; Zhu, Y.; Cheng, T. Assessing a soil-removed semi-empirical model for estimating leaf chlorophyll content. Remote Sens. Environ. 2022, 282, 113284. [Google Scholar] [CrossRef]
  48. Wang, R.; Springer, K.R.; Gamon, J.A. Confounding effects of snow cover on remotely sensed vegetation indices of evergreen and deciduous trees: An experimental study. Glob. Change Biol. 2023, 29, 6120–6138. [Google Scholar] [CrossRef]
  49. Fang, H. Photon recollision probability and the spectral invariant theory: Principles, methods, and applications. Remote Sens. Environ. 2023, 299, 113859. [Google Scholar] [CrossRef]
  50. Rautiainen, M.; Stenberg, P. Application of photon recollision probability in coniferous canopy reflectance simulations. Remote Sens. Environ. 2005, 96, 98–107. [Google Scholar] [CrossRef]
  51. Zeng, Y.; Xu, B.; Yin, G.; Wu, S.; Hu, G.; Yan, K.; Yang, B.; Song, W.; Li, J. Spectral Invariant Provides a Practical Modeling Approach for Future Biophysical Variable Estimations. Remote Sens. 2018, 10, 1508. [Google Scholar] [CrossRef]
  52. Rautiainen, M.; Suomalainen, J.; Mõttus, M.; Stenberg, P.; Voipio, P.; Peltoniemi, J.; Manninen, T. Coupling forest canopy and understory reflectance in the Arctic latitudes of Finland. Remote Sens. Environ. 2007, 110, 332–343. [Google Scholar] [CrossRef]
  53. Pisek, J.; Chen, J.M. Mapping forest background reflectivity over North America with Multi-angle Imaging SpectroRadiometer (MISR) data. Remote Sens. Environ. 2009, 113, 2412–2423. [Google Scholar] [CrossRef]
  54. Jiao, T.; Liu, R.; Liu, Y.; Pisek, J.; Chen, J.M. Mapping global seasonal forest background reflectivity with Multi-angle Imaging Spectroradiometer data. J. Geophys. Res. Biogeosciences 2014, 119, 1063–1077. [Google Scholar] [CrossRef]
  55. Pisek, J.; Chen, J.M.; Kobayashi, H.; Rautiainen, M.; Schaepman, M.E.; Karnieli, A.; Sprinstin, M.; Ryu, Y.; Nikopensius, M.; Raabe, K. Retrieval of seasonal dynamics of forest understory reflectance from semiarid to boreal forests using MODIS BRDF data. J. Geophys. Res. Biogeosciences 2016, 121, 855–863. [Google Scholar] [CrossRef]
  56. Liu, W.; Mõttus, M.; Malenovský, Z.; Shi, S.; Alonso, L.; Atherton, J.; Porcar-Castell, A. An in situ approach for validation of canopy chlorophyll fluorescence radiative transfer models using the full emission spectrum. Remote Sens. Environ. 2025, 316, 114490. [Google Scholar] [CrossRef]
  57. Peltoniemi, J.I.; Kaasalainen, S.; Näränen, J.; Rautiainen, M.; Stenberg, P.; Smolander, H.; Smolander, S.; Voipio, P. BRDF measurement of understory vegetation in pine forests: Dwarf shrubs, lichen, and moss. Remote Sens. Environ. 2005, 94, 343–354. [Google Scholar] [CrossRef]
Figure 1. Location (a,b) and overview (ce) of the study site. The two red rectangles refer to fields A and B. Yellow circles within the red rectangles refer to the sample plots for DHP-based LAI measurements. White star refer to the sample plot for tower-based canopy measurements.
Remotesensing 17 02014 g001
Figure 2. Background modification scheme (a,b) and tower- and UAV-based canopy measurements (c,d).
Remotesensing 17 02014 g002
Figure 3. Reflectance spectra of three background types: bare soil, weeds, and black material.
Remotesensing 17 02014 g003
Figure 4. A schematic of LAI inversion. The PROSAIL model (a) consists of the leaf PROSPECT-D model and the canopy SAIL model. A large simulated spectra dataset (c) was generated using the PROSAIL model. The hyperspectral canopy reflectance images of sugarcane canopies (d) were collected by a UAV with a hyperspectral camera (b). Finally, LAI inversion was performed using the Random Forest Regression model.
Remotesensing 17 02014 g004
Figure 5. PROSAIL simulated reflectance ratios between canopy reflectance with weed background and with soil (a) or black (b) background under varying LAIs. The red and blue lines, and the corresponding numerical value, indicate the maximum and minimum reflectance ratios, respectively.
Remotesensing 17 02014 g005
Figure 6. PROSAIL-simulated reflectance ratios between canopy reflectance with weed layer and soil background (Rweed/Rsoil), and reflectance ratios between canopy reflectance with weed layer and black background (Rweed/Rblack) under varying LAI and LADF. The red and blue lines, and the corresponding numerical value, indicate the maximum and minimum reflectance ratio, respectively.
Remotesensing 17 02014 g006
Figure 7. Tower-based (a) and UAV-based (c) measurements of reflectance of two canopies with weed and black material backgrounds. The reflectance ratios between the two canopies’ reflectance are shown in (b,d).
Remotesensing 17 02014 g007
Figure 8. Comparisons between measured and inversed LAI of different plots in field A (a) and field B (b).
Remotesensing 17 02014 g008
Figure 9. The original inversed LAI image (a), the weed-corrected LAI image (b), and their corresponding histogram distribution (c). (d,e) are the inversed LAI images inside and outside the background modification area, respectively, and their corresponding histogram distribution is shown in (f).
Remotesensing 17 02014 g009
Table 1. PROSAIL input variables for assessing background influence.
ModelVariable NameSymbolUnitValue and Range
PROSPECT-D
(leaf model)
Leaf structure indexNUnitless1.5
Chlorophyll a + b contentCabμg/cm242 (measurement)
Total carotenoid contentCarμg/cm2Cab/7
Dry matter contentCmg/cm20.01
Leaf water depthCwcm0.01
SAIL
(Canopy model)
Leaf area indexLAIm2/m21–6
Leaf angle distribution functionLADFUnitlessPlanophile, Erectophile,
Plagiophile, Extremophile,
Spherical, Uniform
Hotspot parameterHotUnitless0
Soil reflectanceρsoil(%)-
Soil brightness factorαsoilUnitless1
Solar zenith angleSZA(◦)26
Solar azimuth angleSAA(◦)140
View zenith angleVZA(◦)0
Disclaimer/Publisher’s Note: The statements, opinions and data contained in all publications are solely those of the individual author(s) and contributor(s) and not of MDPI and/or the editor(s). MDPI and/or the editor(s) disclaim responsibility for any injury to people or property resulting from any ideas, methods, instructions or products referred to in the content.

