Article

Identifying the Peak Flowering Dates of Winter Rapeseed with a NBYVI Index Using Sentinel-1/2

1
College of Geo-Exploration Science and Technology, Jilin University, Changchun 130026, China
2
College of Geographic Sciences, Changchun Normal University, Changchun 130032, China
*
Author to whom correspondence should be addressed.
Remote Sens. 2025, 17(6), 1051; https://doi.org/10.3390/rs17061051
Submission received: 18 December 2024 / Revised: 24 February 2025 / Accepted: 14 March 2025 / Published: 17 March 2025

Abstract

:
Determining the peak flowering dates of winter rapeseed is crucial for both increasing yields and developing tourism resources. Currently, the Normalized Difference Yellow Index (NDYI), widely used for monitoring these dates, faces stability and accuracy issues due to atmospheric interference and limited optical data during the flowering period. This research examines changes in remote-sensing parameters caused by canopy variations during winter rapeseed’s flowering period from crop canopy morphological characteristics and canopy optical properties. By integrating Sentinel-1 and Sentinel-2 data, a new spectral index, the Normalized Backscatter Yellow Vegetation Index (NBYVI), is introduced. The study uses phenological characteristics and the random forest classification algorithm to create a map of winter rapeseed in parts of the middle and lower reaches of the Yangtze River Basin, achieving a Kappa coefficient of 90.57%. It evaluates the effectiveness of crop morphological indices in monitoring growth stages and explores the impacts of elevation and latitude on the peak flowering dates of winter rapeseed. The error ranges for predicting the peak flowering dates with the NDYI (traditional optical index) and the VV (crop morphological index) are generally 2–7 days and 2–6 days, respectively, while the error range for the NBYVI index is generally 0–4 days, demonstrating superior stability and accuracy compared to the NDYI and VV indices.

1. Introduction

In China, rapeseed is primarily winter rapeseed, scattered mainly in the middle and lower reaches of the Yangtze River, where it constitutes over 90% of the country’s rapeseed production (National Bureau of Statistics of China: http://www.stats.gov.cn/, (accessed on 1 March 2024)). Every spring, the southern regions of China burst into a vibrant sea of golden rapeseed flowers, attracting a multitude of tourists who stop to admire the spectacle [1]. Rapeseed not only provides tourism value but also serves as a crucial raw material for producing edible vegetable oil, biodiesel, and animal feed [2,3]. Since 2000, rapid population growth worldwide has led to a significant increase in demand for oilseeds. Rapeseed has garnered attention due to its importance in oilseed production, resulting in a rapid increase in global rapeseed production (Foreign Agricultural Service: https://fas.usda.gov/, (accessed on 10 March 2024)). Although China is one of the major producing regions of rapeseed globally, the country still heavily relies on imports. China’s annual rapeseed imports have consistently exceeded 1 million tons since 2008, highlighting the urgent need to increase domestic rapeseed production [4].
Non-biological factors during specific phenological periods have a significant impact on crop yield [5,6]. Among these, rapeseed yield is most significantly affected by the flowering period [7]. Both water deficiency and insufficient solar radiation during this period can result in fewer or empty pods in rapeseed, leading to reduced seed density and consequently affecting yield [6,7,8]. Furthermore, sclerotinia stem rot, a fungal disease that occurs during the flowering period, poses a risk of infection spread and has a significant impact on rapeseed yield. Targeted prevention and treatment measures based on phenological periods are necessary to mitigate its effects [9]. The sclerotinia stem rot in 2010 caused a loss of 600 million Canadian dollars (CDN) to Canada’s rapeseed industry [10]. Determining the peak flowering dates of winter rapeseed is of crucial significance to ensuring rapeseed yield.
Currently, optical remote-sensing data has achieved success in monitoring the peak flowering dates of rapeseed [11,12,13]. The Normalized Difference Vegetation Index (NDVI) has been effectively employed to determine the flowering dates of rapeseed [14]. During the growth stages of winter rapeseed, the canopy phases are characterized by green leaves, yellow flowers, and brown pods. The distinct canopy morphologies directly influence the remote-sensing spectral characteristics [15]. The yellow flowers of rapeseed increase the radiation intensity of green and red light. Since yellow light is composed of green and red light combined, this increase leads to a decrease in the NDVI value, which affects the ability of the NDVI to extract the flowering period of winter rapeseed [16,17,18]. It was found that the ratio of green light and blue light bands correlates directly with the density of rapeseed flowers per unit area, and this relationship was used to develop the Normalized Difference Yellow Index (NDYI) [19,20]. The NDYI index calculated using Sentinel-2 data successfully monitored the flowering dates of rapeseed in Germany [12]. Improved versions of the NDYI index have been developed to suppress the cloud edge rainbow artifact [21]. Currently, the NDYI index is widely used in the monitoring of rapeseed peak flowering dates. However, under the combined effect of Mie scattering caused by aerosol particles such as PM2.5, PM10, and dust, and Rayleigh scattering caused by gas molecules like nitrogen and oxygen, atmospheric conditions can affect the accuracy of the information in the blue band, thereby impacting the accuracy of the NDYI index in monitoring the peak flowering dates of rapeseed [22,23,24].
Unlike optical data, synthetic aperture radar (SAR) data are less affected by cloud cover. Additionally, SAR data are closely related to information about crop canopy structure, allowing for the monitoring of dynamic changes in crop phenological stages using SAR data [25,26,27,28,29,30]. The VV (vertical–vertical) polarization index shows a synchronous trend with crop phenology periods [31]. It was discovered that the temporal characteristics of VV polarization for both rapeseed and wheat crops synchronize with the phenological stages of the crops, and the concept of using radar signals as a supplement to optical signals for monitoring crop parameters was proposed [28]. During the growth of rapeseed, the scales of leaves, pods, and stems are similar to the scale of SAR data in the C-band (the Sentinel-1 satellite carries a SAR sensor in the C-band), making them sensitive to SAR data [29]. As rapeseed grows, the intertwining of leaves and pods forms a strong backscatter layer, leading to an increase in VV. However, during rapeseed flowering, the smaller size of the rapeseed buds and flowers forms a temporary weak backscatter layer, gradually covering the original canopy, resulting in a decrease in VV [30,31]. Building upon this, although SAR is subject to fluctuations due to coherent noise, soil properties, and the angle of electromagnetic wave incidence, subsequent research has proven that VV holds considerable potential in the study of rapeseed peak flowering dates [12,22,32].
The launch of Sentinel series satellites has provided high-resolution data support for large-scale crop mapping and the monitoring of growth parameters. Moreover, they bring about significant prospects for integrating SAR and traditional optical data [33,34,35,36]. The complementarity of optical and SAR data enables the simultaneous utilization of crop canopy structure and physiological information, making it possible to gather comprehensive insights into crop conditions [19]. However, currently, the fusion methods of these two types of data mainly focus on crop classification and land use mapping or simply substitute SAR data for missing optical data in a particular time or space [37,38,39,40,41,42]. Therefore, there is a critical need for a simple and acceptable method to expand the effective information content of rapeseed flowering period monitoring time series through the concept of data fusion, exploring the potential of SAR data, and complementing the shortcomings of optical NDYI indices. This inspires us to integrate optical and radar data to construct the Normalized Backscatter Yellow Vegetation Index (NBYVI) for monitoring and studying the peak flowering dates of rapeseed.

2. Materials and Methods
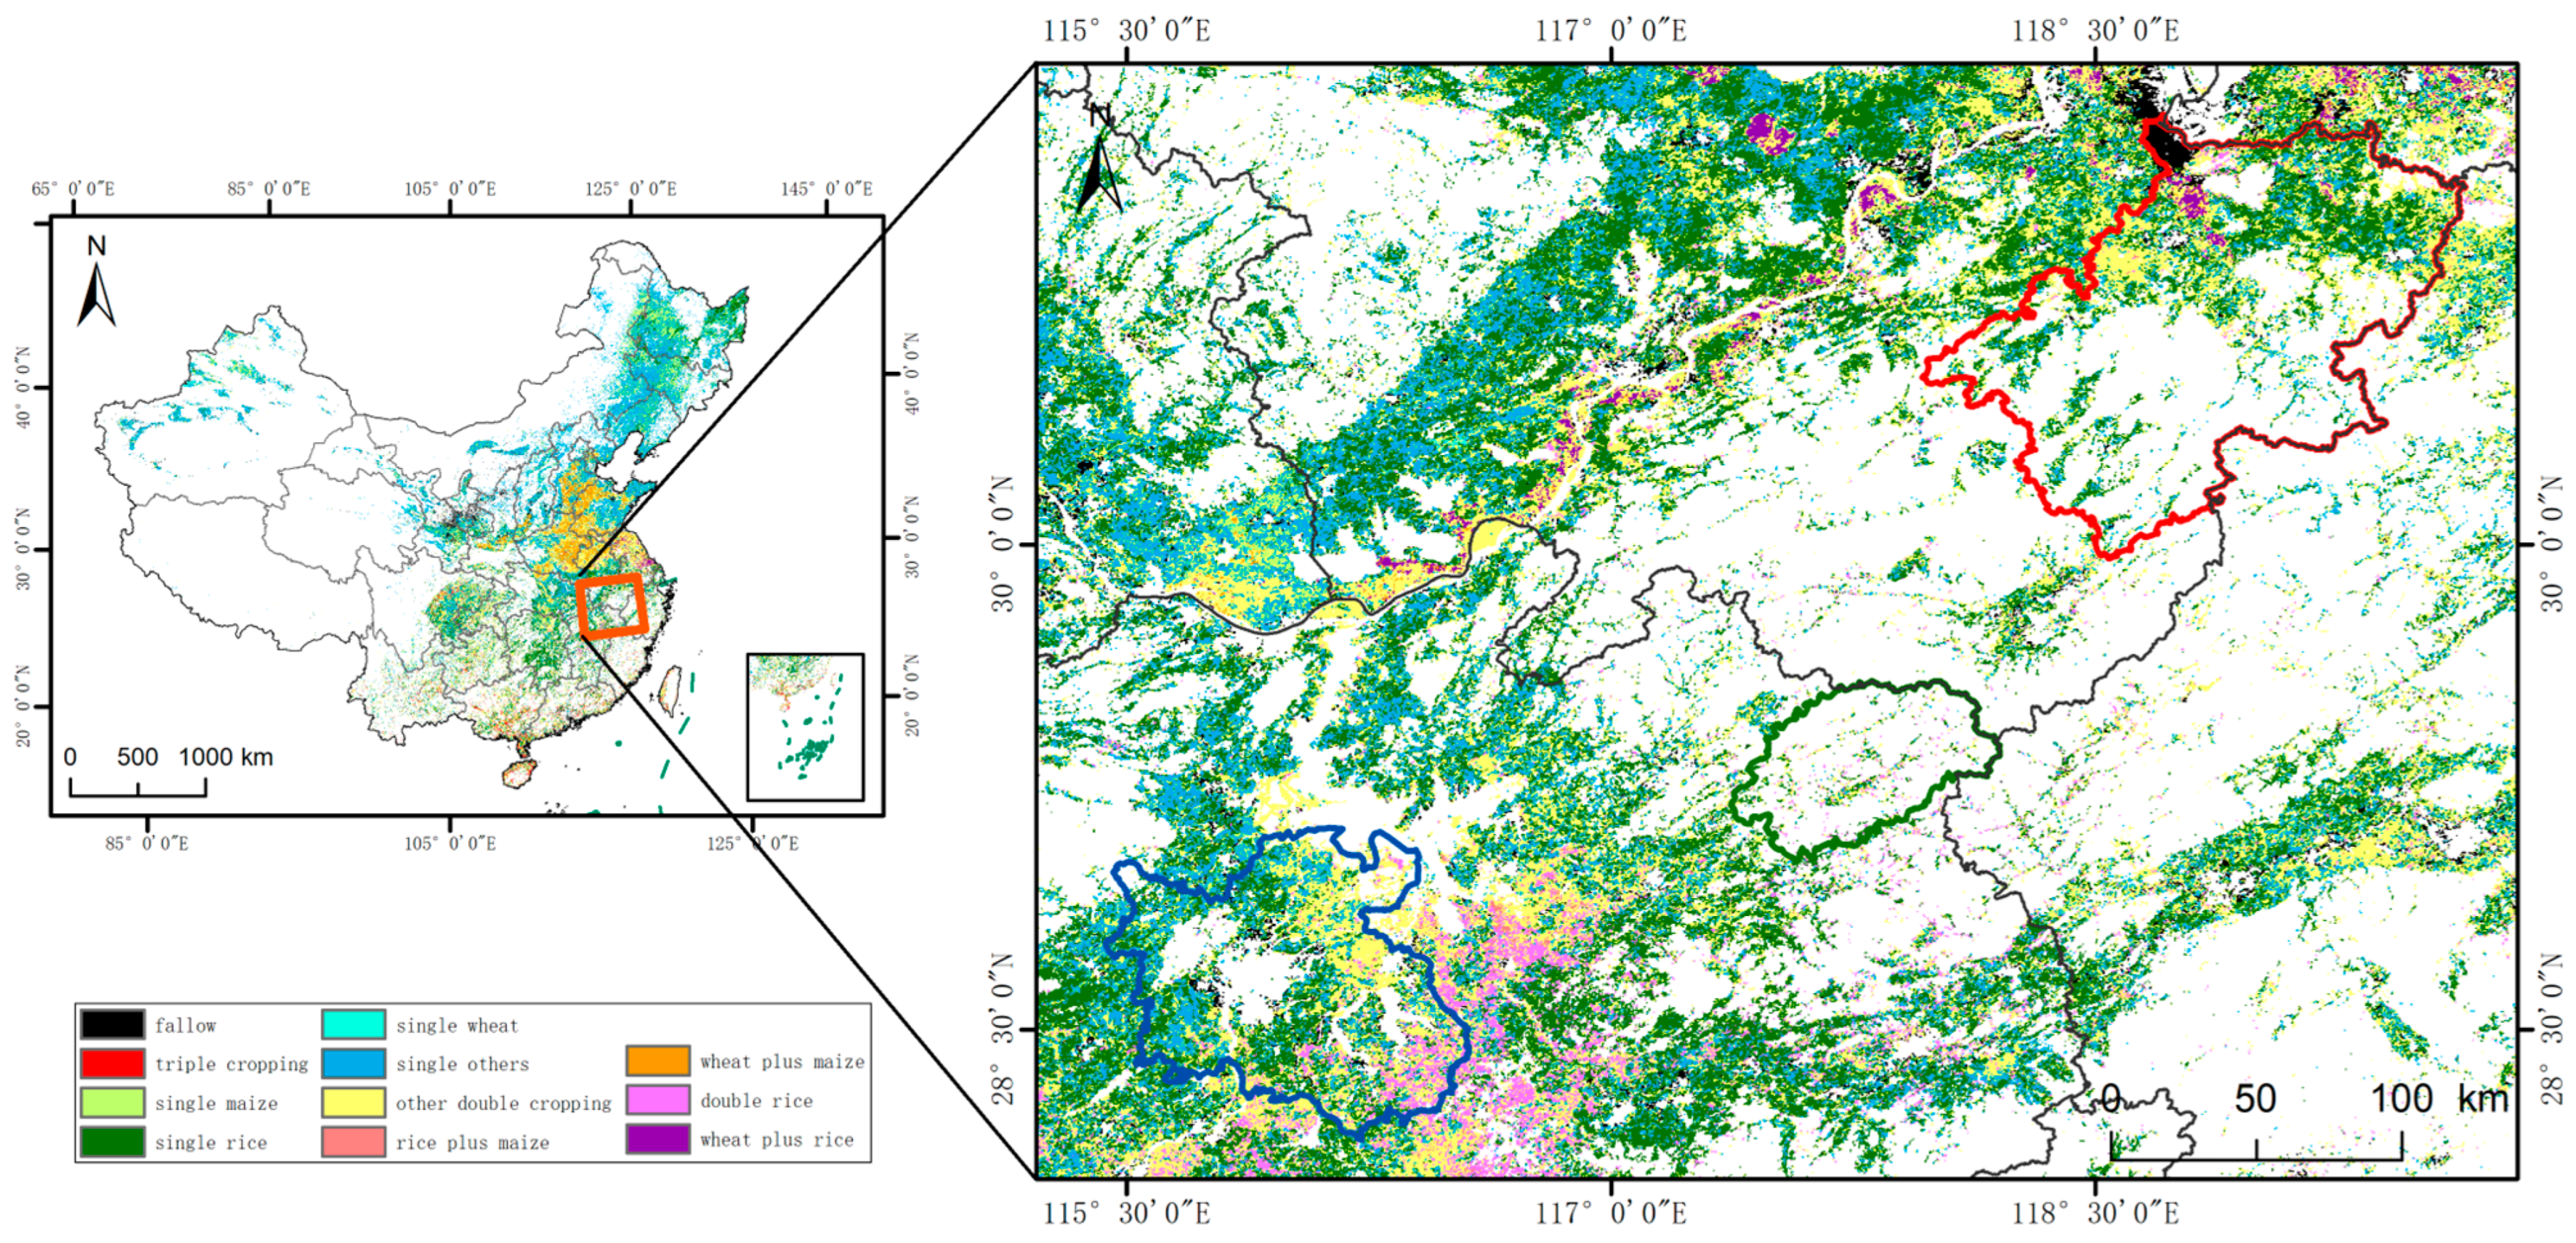
2.1. Study Areas

The study area is situated in the middle and lower parts of the Yangtze River Basin, including parts of six provinces: Hubei, Henan, Anhui, Jiangxi, Jiangsu, and Zhejiang. It is the main cultivation area for winter rapeseed in China [43]. Figure 1 shows that the study area belongs to a subtropical monsoon climate, characterized by warm and humid conditions. The main winter crops include winter rapeseed and winter wheat. However, due to its location in mountainous areas, the planting area of winter rapeseed exhibits a sparse distribution pattern [1].

2.2. Data

2.2.1. Satellite Data

This study accessed all radar data from Sentinel-1 and optical data from Sentinel-2 for the study area covering the first half of 2019 using the Google Earth Engine (GEE) platform (https://earthengine.google.org/ (accessed on 21 March 2024)).
The spatial resolution of the Sentinel-1 data is 10 m. Due to orbit variations, the temporal resolution ranges from 2 days to 12 days. The Sentinel-1 data collected in the Chinese region are acquired in interferometric wide swath (IW) mode, providing data in two polarization modes: VV and VH (vertical–horizontal). The Sentinel-1 data provided on the GEE platform are in the C-band of SAR and have already undergone preprocessing steps, including thermal noise removal and radiometric calibration. Additionally, we further utilize the built-in multi-temporal speckle filter on the platform to remove noise from the Sentinel-1 data [44].
Sentinel-2 data have a spatial resolution of 10 m and a temporal resolution of 5 days, and the Level-2A data provided on the GEE platform have already undergone preprocessing steps, including atmospheric correction and geometric correction. Building upon this, we selected images with cloud coverage below 20% and further utilized the Sentinel-2 QA60 cloud-masking algorithm provided by the GEE platform to remove the effects of cloud shadows and clouds from the data [45].
GF1 is the Chinese High-Resolution Earth Observation System (CHEOS) linear array push-broom optical remote-sensing satellite. The GF1 satellite is equipped with two panchromatic sensors and four multispectral sensors, capable of acquiring 2 m panchromatic, 8 m, and 16 m multispectral data, with a temporal resolution of 4 days. GF1 imagery with cloud coverage below 20% was downloaded from the Land Observation Satellite Data Service Platform (the Land Observation Satellite Data Service Platform: https://data.cresda.cn/#/home (accessed on 3 May 2024)) and preprocessed (atmospheric correction and geometric correction).

2.2.2. Auxiliary Data

As shown in Table 1, the auxiliary data used in this study can be primarily categorized into four types: land cover classification data, crop-planting pattern type, temperature data, and crop phenological data. Although the 2019 China 30 m Annual Land Cover Classification Data (CLCD) dataset is limited to the Chinese region, it has a higher temporal resolution compared to the commonly used Global30 cropland dataset [46].

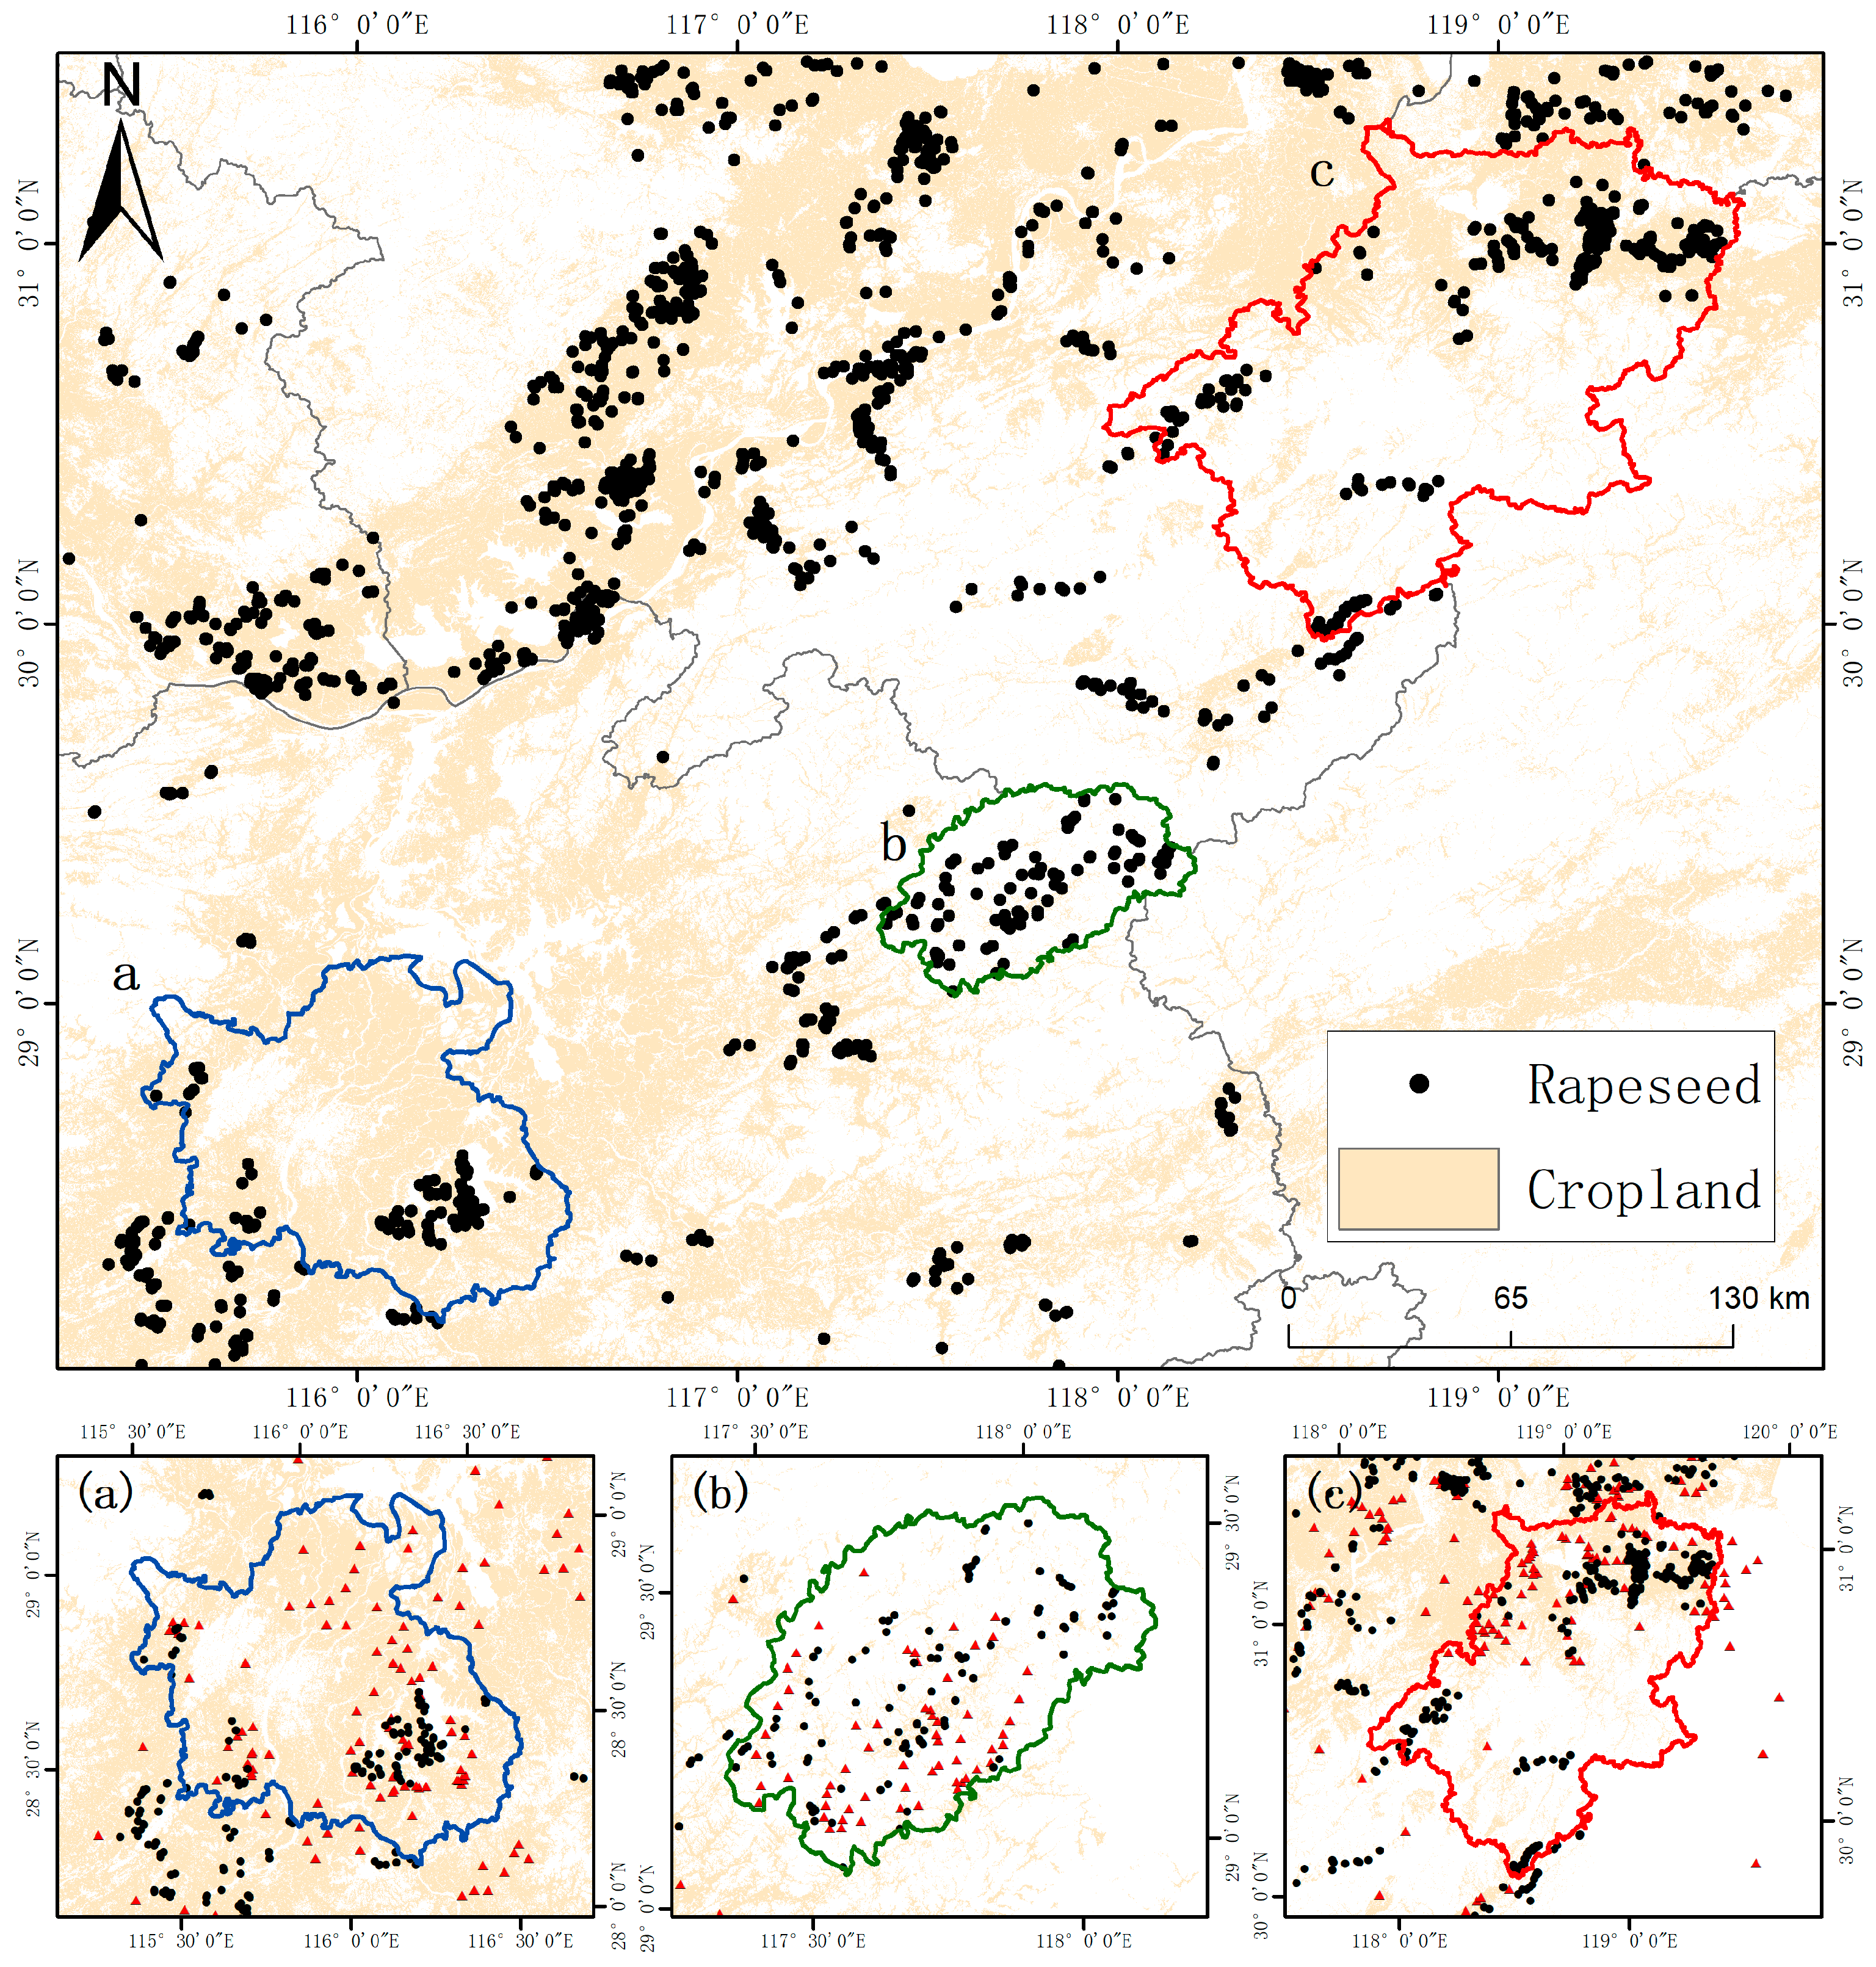
2.2.3. Crop Sample Points
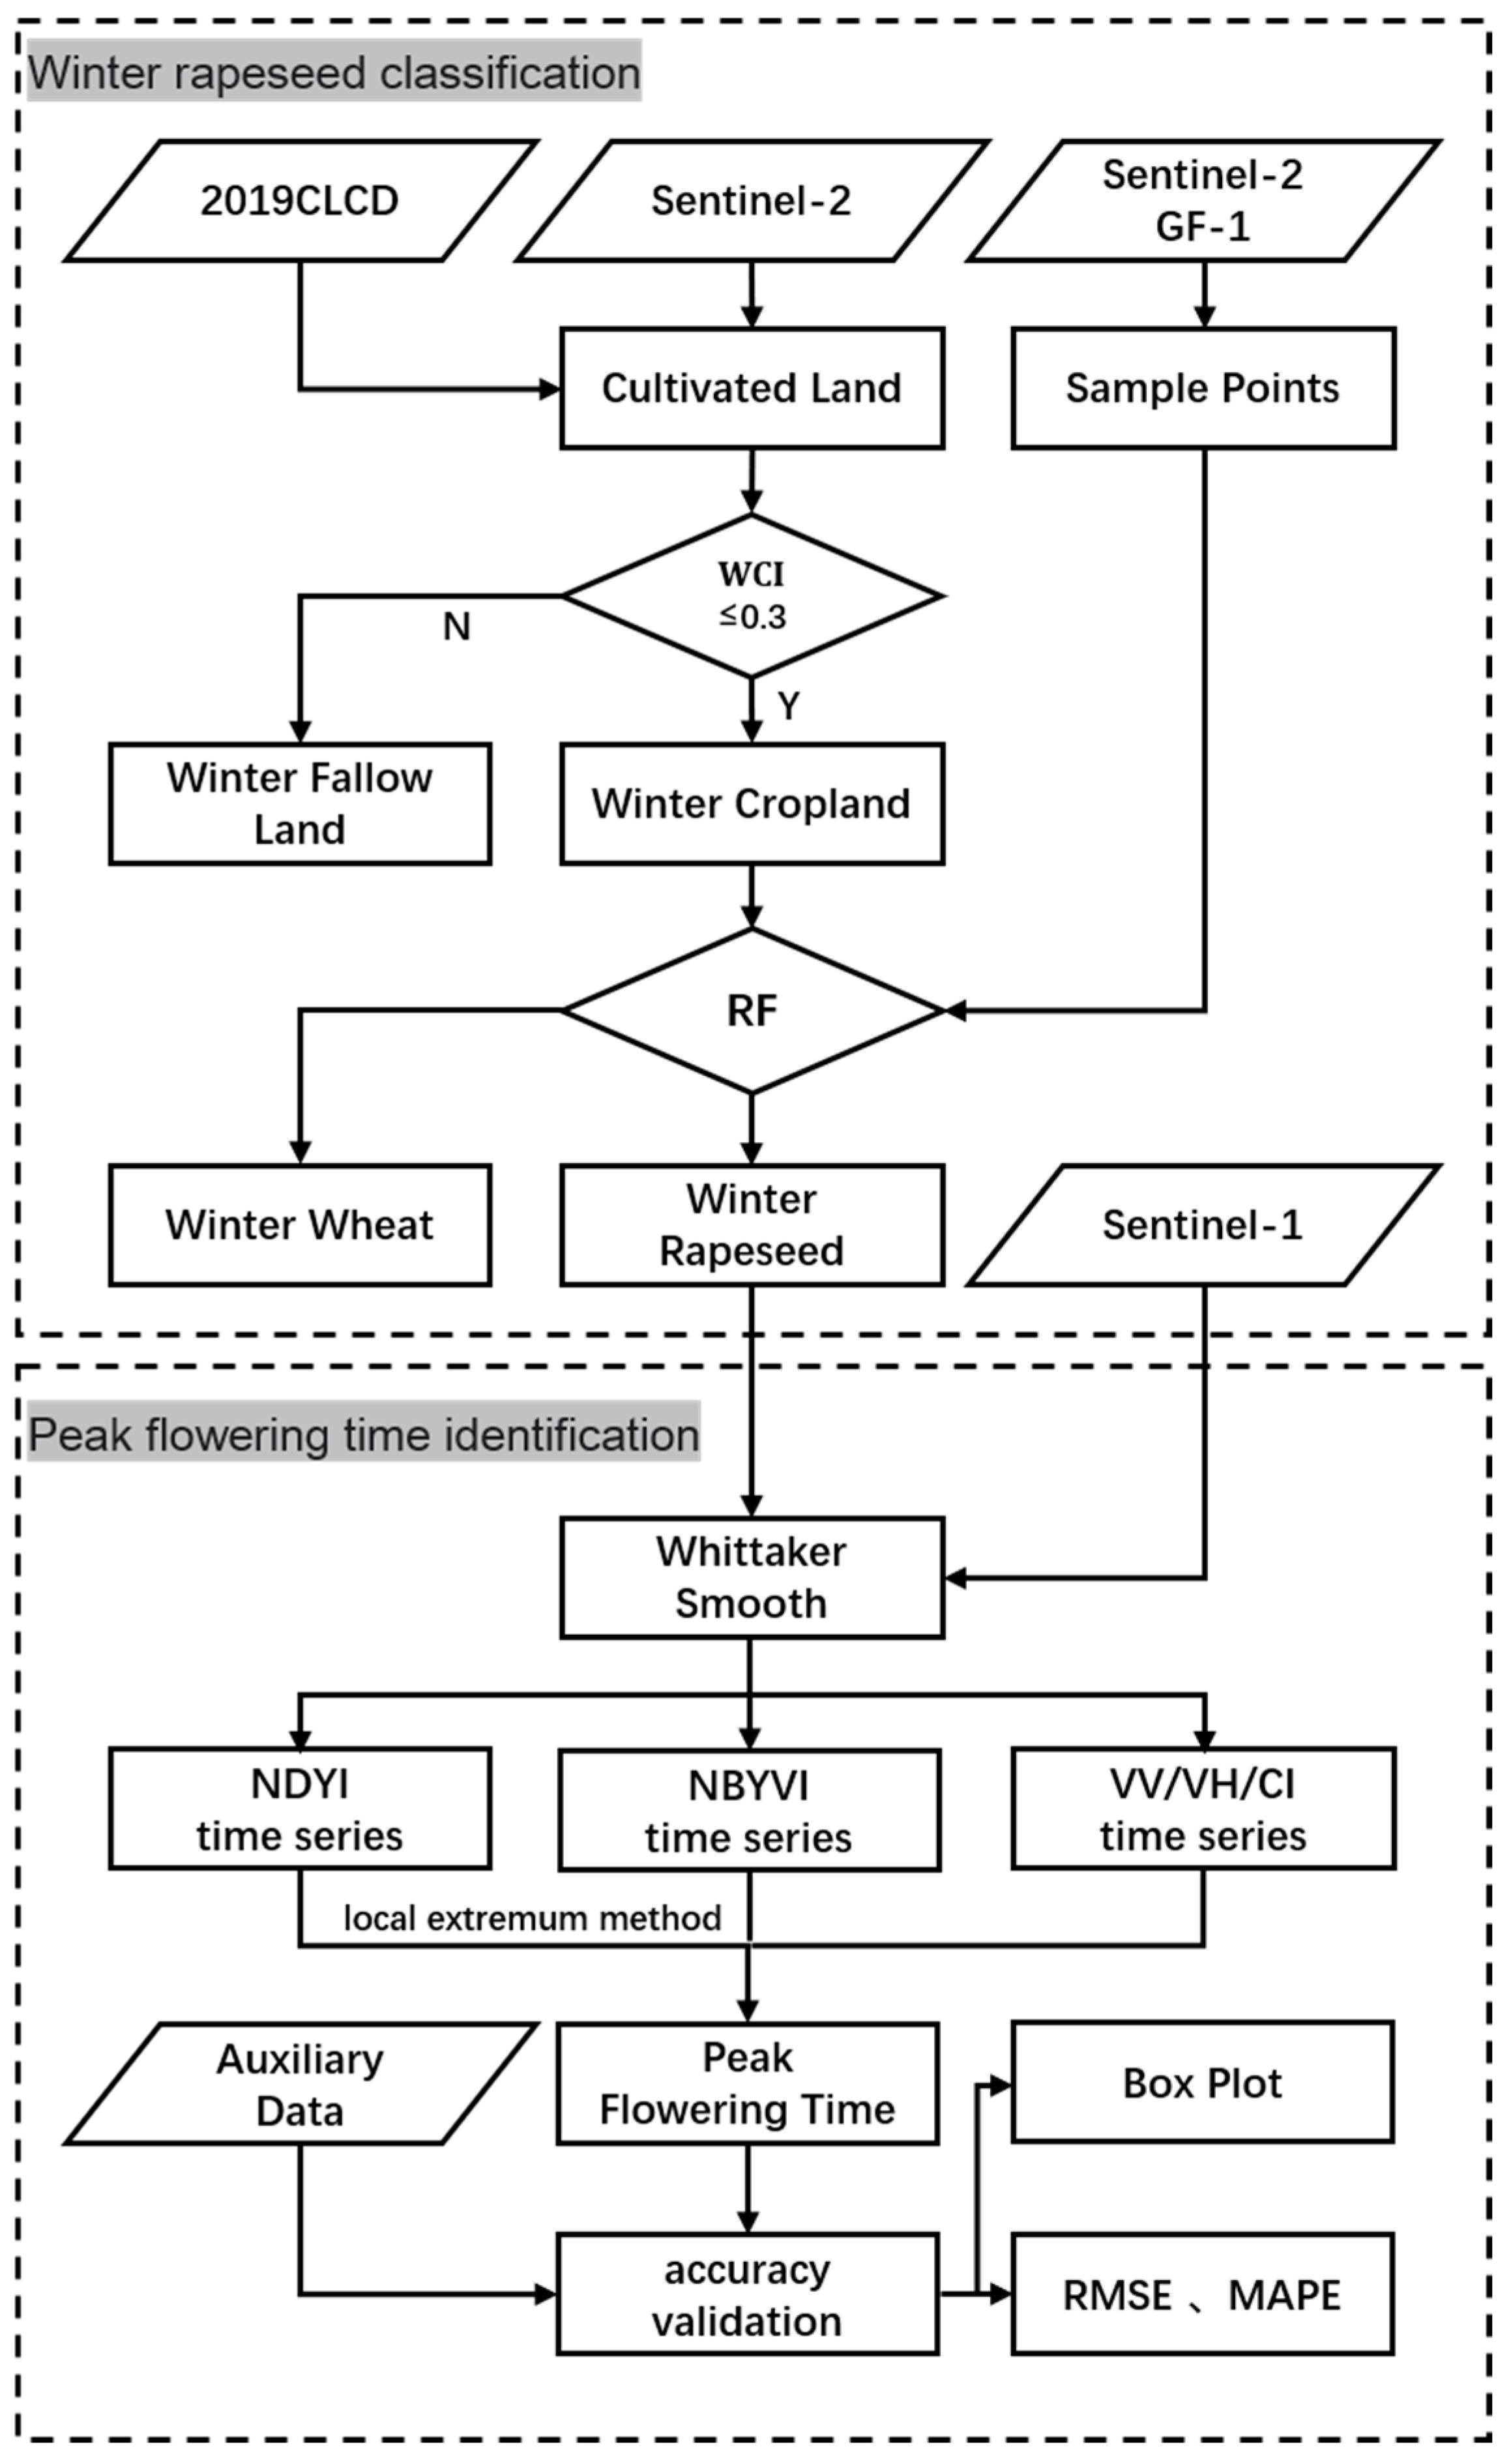
The growth periods of winter rapeseed and winter wheat overlap to a considerable extent. Outside of the flowering period, it is difficult to visually distinguish between the two crops during other phenological stages. During the flowering period of winter rapeseed (mid-March to early April), the pixels appear bright yellow, whereas the pixels of winter wheat remain green. Based on this distinct difference in optical characteristics, visual interpretation of GF-1 and Sentinel-2 imagery was conducted within this time window. A total of 1694 winter rapeseed points and 1204 winter wheat points were selected in the study area.
Figure 2 shows that the distribution of winter rapeseed sample points in the study area reflects an overall trend of sparse distribution across large regions but concentrated distribution within smaller regions. On a fine scale, the winter rapeseed fields exhibit a highly distinctive, regular fragmented pattern. In Nanchang City, winter rapeseed is concentrated in the southeastern area, with 112 sample points selected. In Wuyuan County, winter rapeseed is sparsely distributed, scattered within mountainous forested areas, where 108 sample points were selected. In Xuancheng City, winter rapeseed is concentrated in the northern and western areas, with 308 sample points selected.

2.3. Methodology

The methodology workflow of this study is shown in Figure 3. First, the distribution of winter rapeseed in the study area is extracted using a stepwise classification method of cropland, winter cropland, and winter rapeseed. Then, starting from the canopy’s optical and structural characteristics during the crop growth process, the construction process of the NBYVI index is discussed. The peak flowering dates of winter rapeseed were monitored using the local extremum method with the NBYVI, NDYI, and VV indices, each providing its own individual prediction results. Accuracy validation was performed using auxiliary data, confirming the superiority of the NBYVI index. Finally, the trend of the peak flowering dates of winter rapeseed in the middle and lower reaches of the Yangtze River Basin was inverted based on the NBYVI index.

2.3.1. Method for Obtaining Winter Rapeseed Distribution

To explore the characteristics of SAR and optical data for the phenological period of winter rapeseed, it is necessary to extract the planting areas of winter rapeseed in the study area. This extraction process utilizes the random forest classification algorithm and is entirely implemented on the GEE platform. Considering that only a very small amount of winter rapeseed is planted outside of cultivated land, with the majority being planted on arable land, the sporadic planting outside of the cultivated land is ignored. This exclusion helps to conserve computational resources and avoids adverse interference from non-arable land data in the extraction of rapeseed planting areas [47]. After manually downloading the 2019 CLCD cultivated land data, it is then uploaded to the GEE platform. Based on this mask, to further mitigate the adverse effects of idle cultivated land data on the extraction of rapeseed planting areas, the Winter Crop Index (WCI) threshold method (with the WCI threshold set to 0.3) is employed to further distinguish between winter cultivated land and winter fallow land [48].
N D V I = N I R R N I R + R
where NDVI is the Normalized Difference Vegetation Index, NIR is the near-infrared band, and R is the red band.
W C I = N D V I T 1 N D V I T 2 N D V I T 1 + N D V I T 2
where WCI is the Winter Crop Index, NDVIT1 is the mean NDVI values for February, and NDVIT2 is the mean NDVI values for May.
On the basis of winter-cultivated land, further differentiation between winter rapeseed and winter wheat is performed with the random forest algorithm. The parameters for the random forest algorithm are set as follows: numberOfTrees is set to 100, bagFraction is set to 0.7, and all other parameters are kept at their default values. Compared to winter wheat, the most typical feature of winter rapeseed is the distinct and easily distinguishable optical characteristics during the flowering period window (mid-March to early April), characterized by blooming yellow–green or bright-yellow flowers. A total of 1694 winter rapeseed points were selected in the study area. With 70% of the sample points, the random forest algorithm was invoked on the GEE platform to train the Sentinel-2 data within the flowering period window, while the remaining 30% of the points were used for validation, resulting in the distribution of winter rapeseed in the study area for 2019.

2.3.2. NBYVI Index Development

According to the obvious optical characteristics during the growth process of winter rapeseed, the flowers of winter rapeseed exhibit a yellow–green or bright-yellow color due to their high content of carotenoids (which absorb blue light and reflect green and red light) [20]. The green and red spectral bands of the Sentinel-2 data will provide important indicative features for monitoring the flowering stage of winter rapeseed.
During its growth, winter rapeseed exhibits significant changes in canopy structure. The dimensions of its stems, leaves, and pods are comparable to the C-band wavelength of the Sentinel-1 data, leading to strong scattering of the SAR data. As winter rapeseed progresses through its growth stages, the canopy’s scattering capability increases. Due to the smaller size of the flowers, they scatter SAR data less effectively than the stems, leaves, and pods. As winter rapeseed gradually flowers, the blooms cover the original canopy. The SAR backscatter VV index can reflect the extent to which flowers obscure the underlying canopy, providing crucial indicators for monitoring the flowering period of winter rapeseed [12,23,30,32,49]. Previous studies on the phenology of winter rapeseed have mostly been limited to single optical data, with the application of SAR data primarily restricted to complementing the lack of optical data or verifying the accuracy correlation of optical data identification results. This study fully considers the significant changes in color and canopy morphology of winter rapeseed during the flowering period. Based on the optical characteristics and backscattering features resulting from these changes, a fusion index of SAR data and optical data (Normalized Backscatter Yellowing Vegetation Index, NBYVI) is constructed.
The NBYVI index is constructed based on a simple averaging ensemble-learning method. In this method, when the errors of multi-source data are independent and the performance is similar, simple averaging can significantly reduce the variance of the data by utilizing the redundancy in the multi-source data, thereby improving the stability of the index. [50,51] Due to the fact that optical data noise is primarily influenced by cloud contamination, while SAR data noise is mainly affected by soil and topography, the error factors of both are independent of each other. Optical data reflect the optical characteristics of the crop canopy, whereas SAR data reflect the structural characteristics of the canopy. Changes in both the optical and structural characteristics of the canopy can independently indicate the peak flowering dates of winter oilseed rape. Therefore, theoretically, the NBYVI index, constructed using a simple averaging ensemble-learning method, will demonstrate stronger data stability in indicating the peak flowering dates of winter oilseed rape compared to individual optical and SAR indices.
N V = V V V V m i n
where NV represents the normalized reverse transformation result of VV, VV represents the backscattering coefficient, and VVmin refers to the minimum value of the backscattering coefficient VV of winter rapeseed in the study area during the post-ridging phenological stages (during the crop growth process, the phenological stages that follow once the crop canopy has fully covered the land surface).
N R = R R m a x
where NR represents the normalized transformation result of R, R represents the red light band, and Rmax refers to the maximum value of the red light band R of winter rapeseed in the study area during the post-ridging phenological stages.
N G = G G m a x
where NG represents the normalized transformation result of G, G represents the green light band, and Gmax refers to the maximum value of the green light band G of winter rapeseed in the study area during the post-ridging phenological stages.
N B Y V I = N R + N G + N V 3
where NBYVI stands for Normalized Backscatter Yellow Vegetation Index.

2.3.3. Peak Flowering Date Identification

For the determination of the peak flowering dates of winter rapeseed using time-series remote-sensing data, considering that the choice of smoothing method directly influences the shape trend of the time-series curve, this study opts for Whittaker filtering to process optical and SAR data, thereby obtaining continuous temporal curves. Compared to the traditional Savitzky–Golay (SG) filter, the Whittaker filter better preserves the detailed signals of the original data and is more suitable for extracting vegetation signals using remote-sensing data [12]. When constructing the time-series curve of the NBYVI index, in order to more accurately preserve the original data information, a linear interpolation method was used to interpolate the smoothed results of the SAR and optical data. After obtaining the interpolation results, the NBYVI index was then calculated [52]. Then, the local maxima of the NBYVI and NDYI time-series curves, as well as the local minima of the VV time-series curve, were identified within the flowering period (20 February to 20 April) of each year. By determining the timing of these index extremas, the peak flowering dates of winter rapeseed were identified for each index.
N D Y I = G B G + B
where NDYI stands for the Normalized Difference Yellow Index, G represents the green light band and B represents the blue light band.

2.3.4. Accuracy Evaluation

In the study area, three main winter rapeseed planting regions, namely Nanchang City, Xuancheng City, and Wuyuan County, were selected as validation areas. Within each validation area, 100 to 200 random winter rapeseed plots were selected for accuracy validation. Using a combination of multi-source remote-sensing data (Sentinel-2, GF-1), auxiliary data, and ground-truth data, accurate winter rapeseed flowering period data are obtained. First, the peak flowering dates of the selected random plots are verified to fall within the flowering period of the respective validation areas. Second, we evaluate the accuracy of the peak flowering dates obtained using three methods (NBYVI, NDYI, and VV indices based on the local extreme method) using two metrics: root mean square error (RMSE) and mean absolute percentage error (MAPE).
R M S E = i = 1 n ( X i X ˙ ) 2 n
M A P E = i = 1 n ( X i X ˙ ) X i n
where n is the sample size, X ˙ is the actual observed value, X is the corresponding predicted value, and smaller RMSE and MAPE values indicate better predictive performance of the model.

2.3.5. Variation Trend of Peak Flowering Dates

To further assess the trend of peak flowering dates of winter rapeseed in the middle and lower reaches of the Yangtze River Basin and validate the applicability of the NBYVI index, the peak flowering dates of winter rapeseed in relevant cities within the study area were identified using the NBYVI index. The growth and development of winter rapeseed are mainly influenced by natural conditions such as accumulated temperature and precipitation. Within the study area, winter rapeseed is mainly cultivated in small plots that are easy to irrigate and drain, so the impact of precipitation on the peak flowering dates is minimal. Therefore, the relationship between the peak flowering dates of winter rapeseed and temperature is primarily considered. Using ground meteorological station data provided by the National Climatic Data Center (NCDC), the mean temperature for each station during the growth period (from January to April) prior to the flowering of winter oilseed rape was calculated. The temperature at each meteorological station was defined as the original temperature. Kriging interpolation was then applied to the temperature data across the Yangtze River’s middle and lower reaches to obtain a final temperature distribution map. The NBYVI index was subsequently used to further extract the peak flowering dates of winter oilseed rape in this region. Finally, the temperature conditions were fitted with the peak flowering dates of winter oilseed rape. Elevation is a major factor affecting temperature distribution within small areas, while latitude is the main factor influencing temperature distribution over large regions. Thus, the study performed fitting of peak flowering dates with elevation for all cities within the study area and fitting of peak flowering dates with latitude at the scale of the middle and lower reaches of the Yangtze River Basin.

3. Results

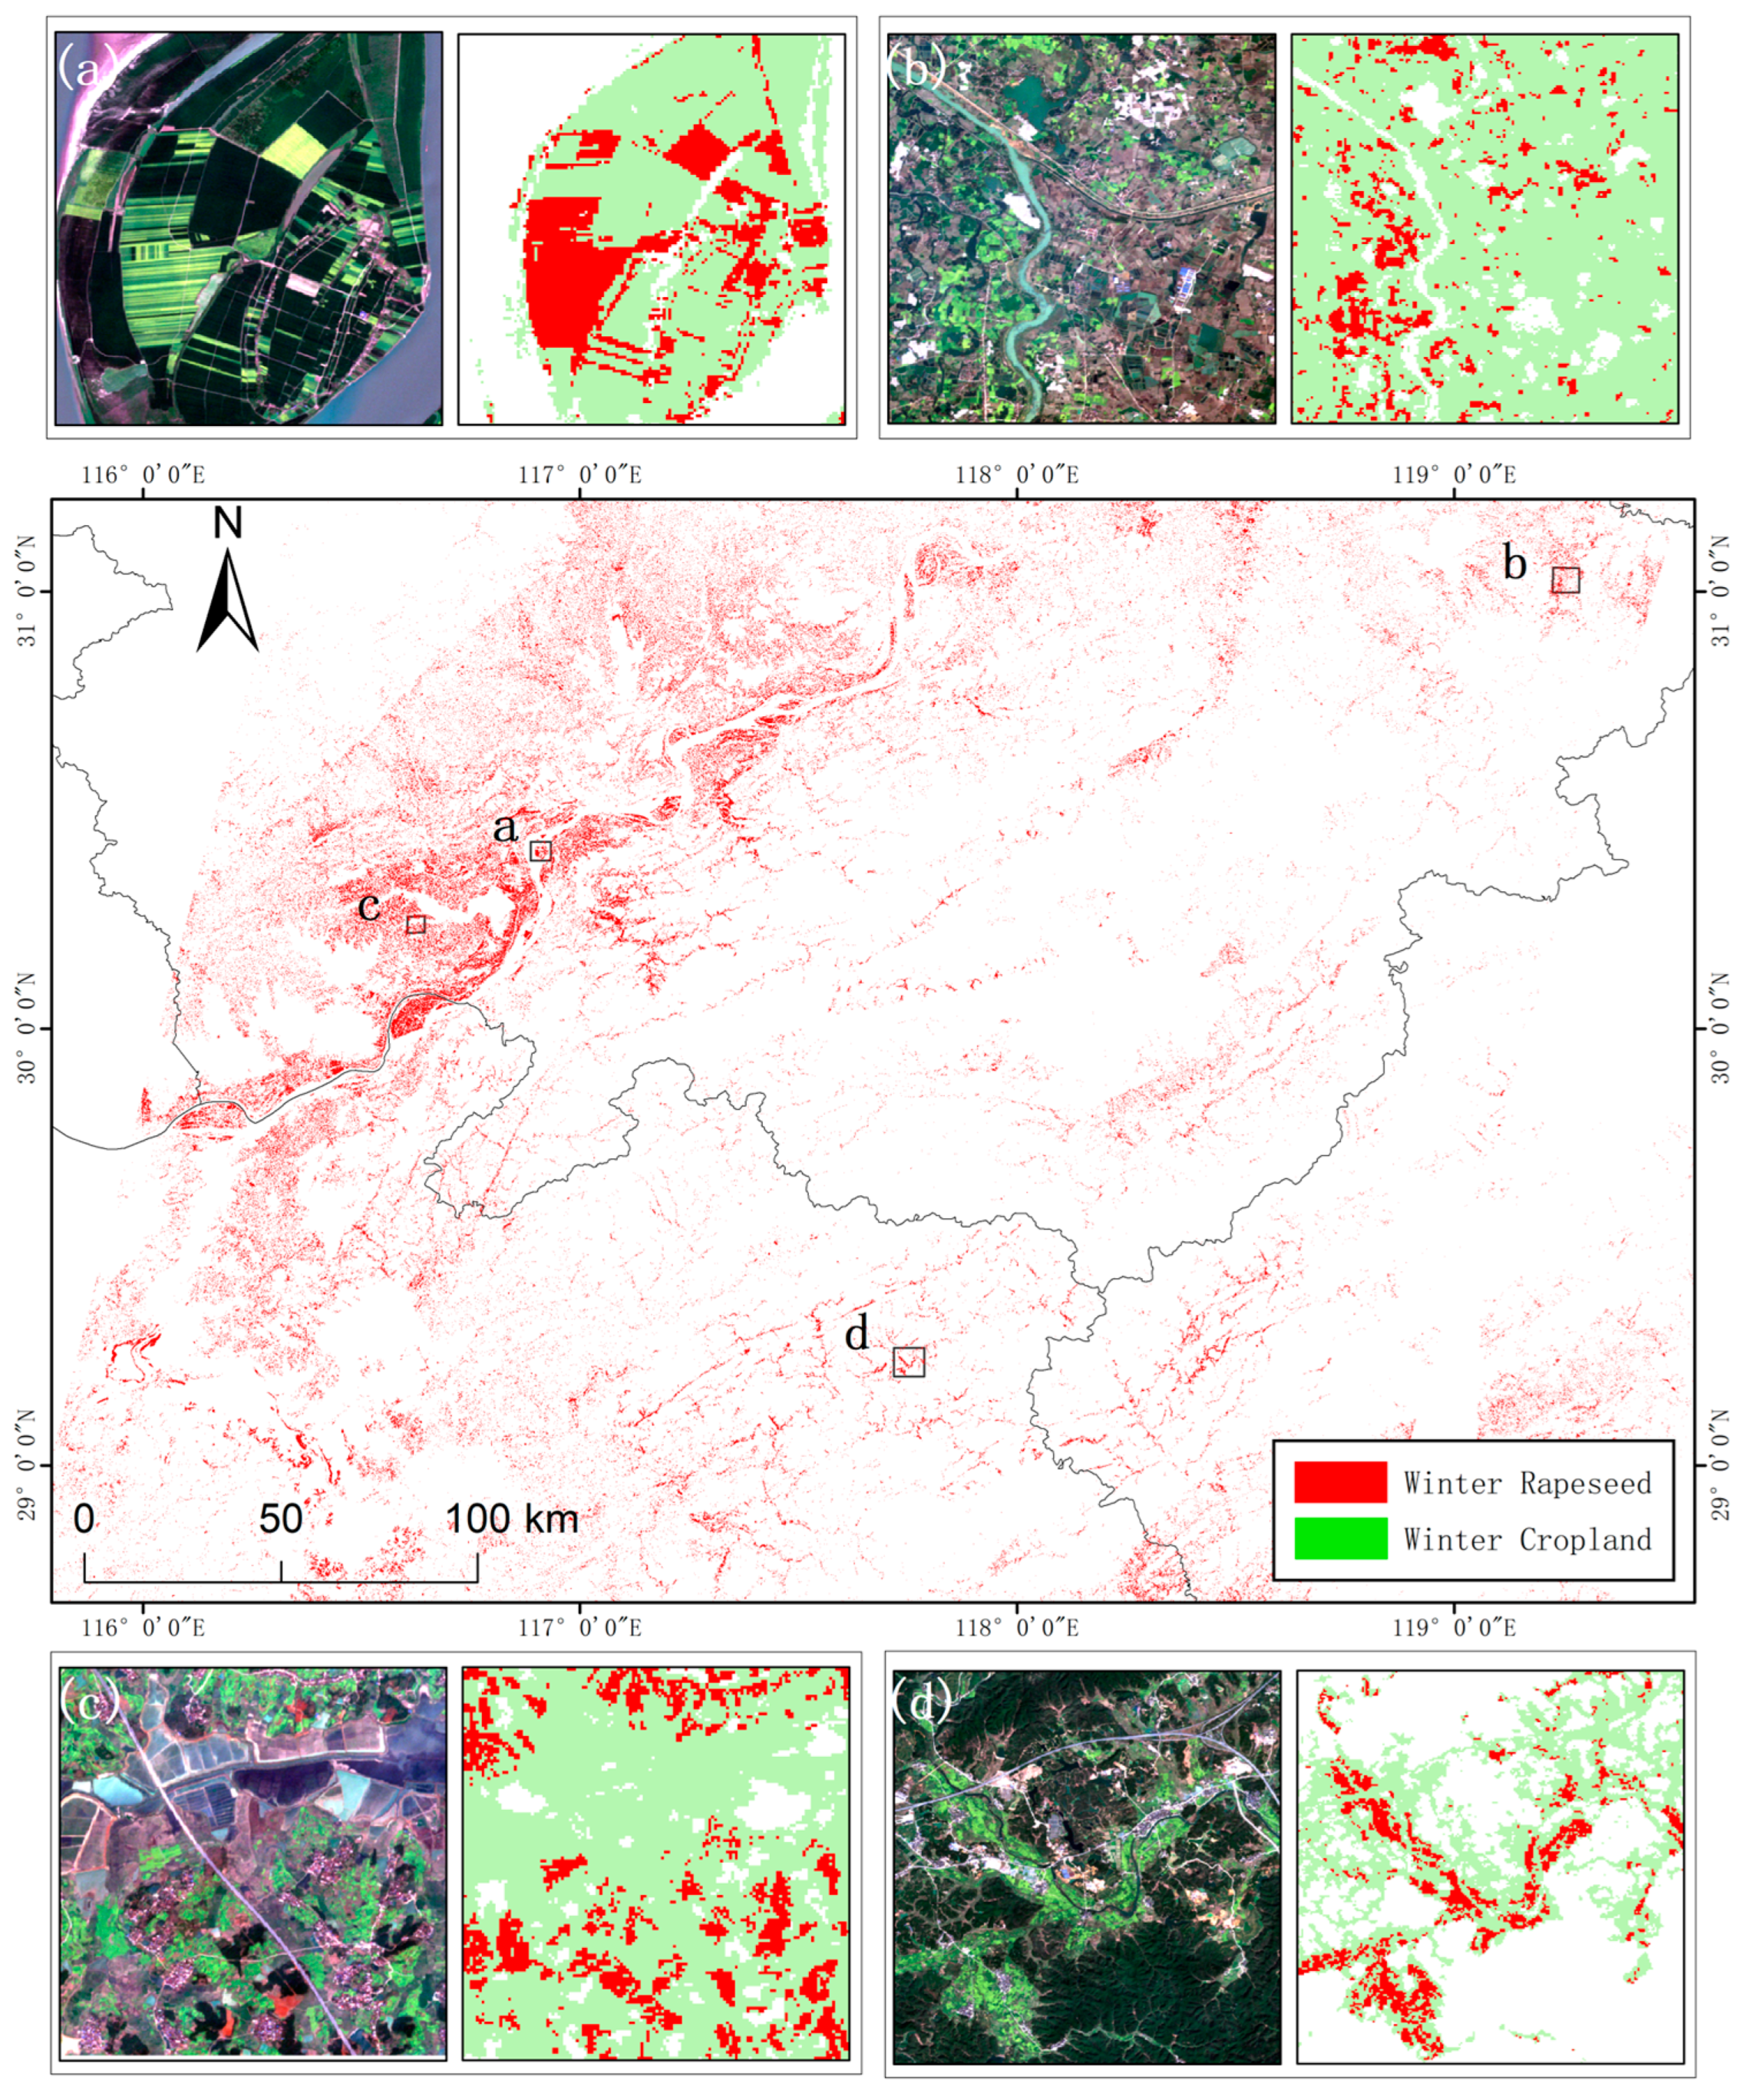
3.1. Winter Rapeseed Distribution

Based on the 2019 CLCD cropland dataset, winter cropland and fallow land were distinguished using the Winter Crop Index (WCI) threshold method. Based on the winter cropland, the random forest algorithm was applied to Sentinel-2 data during the flowering period window using winter rapeseed sample points in the GEE platform to obtain the distribution of winter rapeseed. The Kappa coefficient was validated at 90.57%, demonstrating the reliability of the results. Figure 4 shows the display of the random forest classification results of winter rapeseed in the study area.

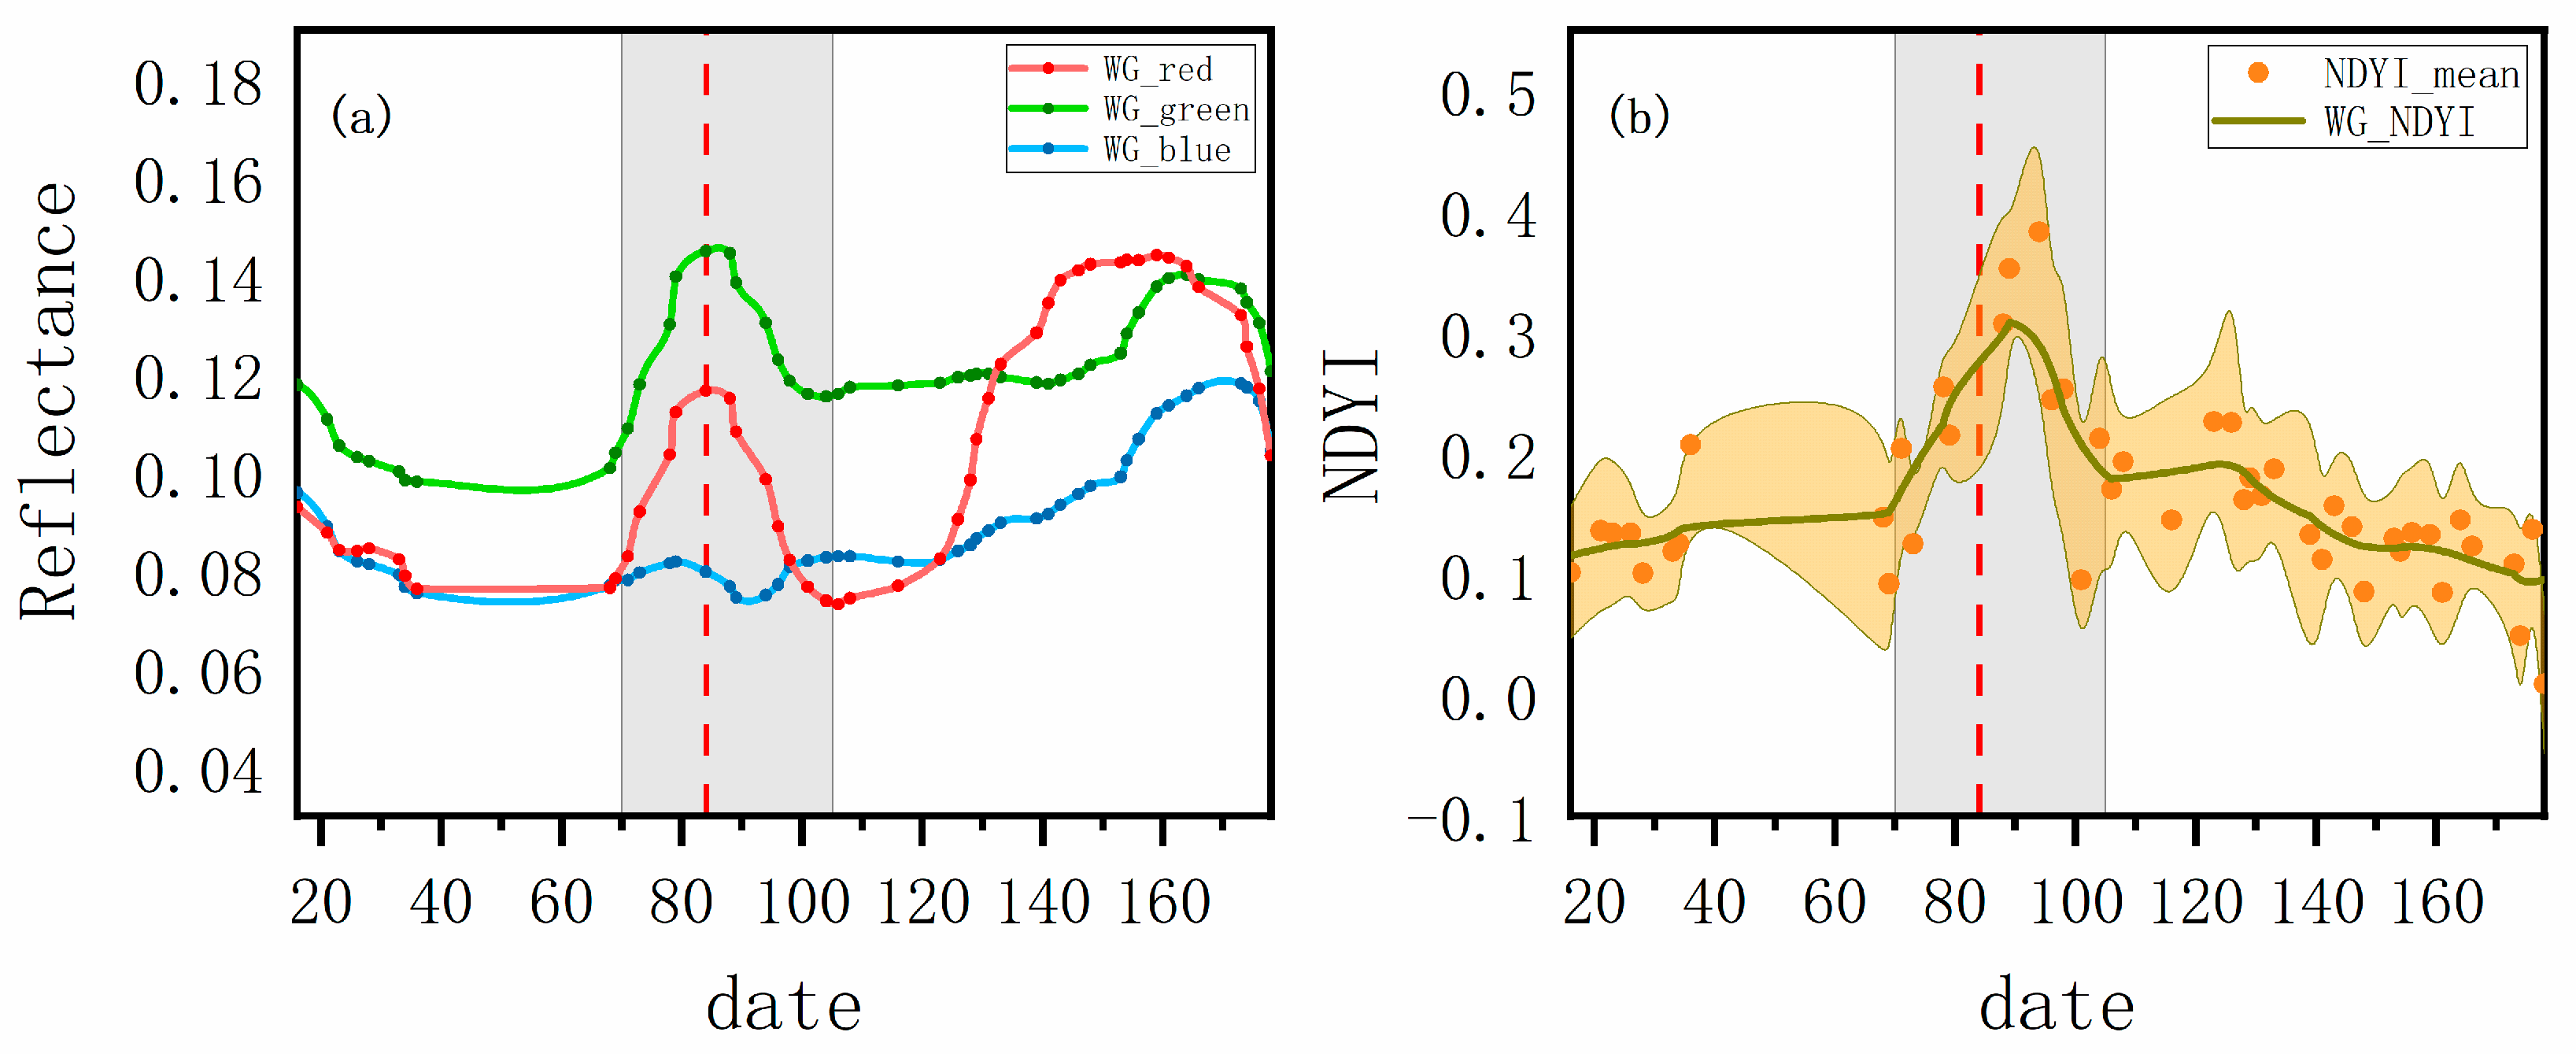
3.2. Spectral Features During the Flowering Period

Figure 5a shows the time-series curves of the average values of the red, green, and blue spectral bands smoothed using the Whittaker filter in the planting areas of winter rapeseed in the study area. During the growth stages of winter rapeseed, there are three distinct canopy stages characterized by green leaves, yellow flowers, and brown pods, each of which directly affects the remote-sensing spectral characteristics [15]. During the flowering process of winter rapeseed, the green light spectrum exhibits the highest reflectance, while the blue light spectrum shows the lowest reflectance. The presence of rapeseed flowers increases the reflectance in the red and green light spectra, while there is no significant impact on the reflectance in the blue light spectrum. During the leaf stage of winter rapeseed, the red, green, and blue spectral curves exhibit relatively stable changes. Upon entering the flowering stage, the red and green spectral curves show significant fluctuations. Based on the spectral variation trends of winter rapeseed, it can be inferred that the flowering period begins within the range of days 40–70 (during this period, the availability of optical data is limited due to cloud cover) and ends on day 105. Determining the range of the flowering period is beneficial for accurately identifying the peak flowering dates. As winter rapeseed reaches its peak flowering dates, the reflectance in the red and green light spectra reaches its peak and then begins to decline, which is consistent with previous studies [12,30]. Therefore, the reflectance in the red and green light spectra of winter rapeseed reaches a local maximum on the peak flowering dates. The reflectance in the red and green light spectra assists us in determining the peak flowering dates of winter rapeseed.
Figure 5b shows the time-series curve of the smoothed average NDYI values using the Whittaker filter in the planting areas of winter rapeseed in the study area. During the leaf stage of winter rapeseed, the NDYI index curve remains relatively stable. Upon entering the flowering stage, the curve exhibits significant fluctuations. During the silique stage, the index curve shows a slight rebound, followed by a continuous decline as it transitions to the maturity stage. Based on the trend of NDYI index changes, it can be inferred that the flowering stage of winter rapeseed ends on Day 105, while the silique stage concludes on Day 126. During the flowering process of winter rapeseed, the time-series curve of the NDYI index exhibits a significant trend; it sharply increases at the beginning of flowering, with the NDYI values (below 0.15) rapidly rising. Then, it reaches a peak (above 0.25) around the peak flowering dates before showing a notable declining trend. However, at the same time, we observed fluctuations in reflectance in the blue spectral band during the flowering period. This is because, during the early stages of winter rapeseed flowering, nutrients are transferred from the leaves to the growing flowers, which inhibits photosynthesis and related optical characteristics. As a result, there is a decrease in the ability of winter rapeseed to absorb blue light, leading to a slight increase in reflectance in the blue light band [53]. In the later stages of the flowering period, the canopy of winter rapeseed enters a senescence phase. During this time, the chlorophyll content in parts of the canopy decreases, while the relative content of carotenoids (which have strong absorption of blue light) increases. This results in a slight decrease in reflectance in the blue spectral band [19,54]. Due to disturbances from fluctuations in the blue light band, the NDYI peak values show a noticeable trend of delay. Throughout the phenological period of winter rapeseed, the NDYI values during the non-flowering period consistently remained lower than those during flowering. The spectral phenological traits during its flowering period of winter rapeseed assist in determining the peak flowering dates.

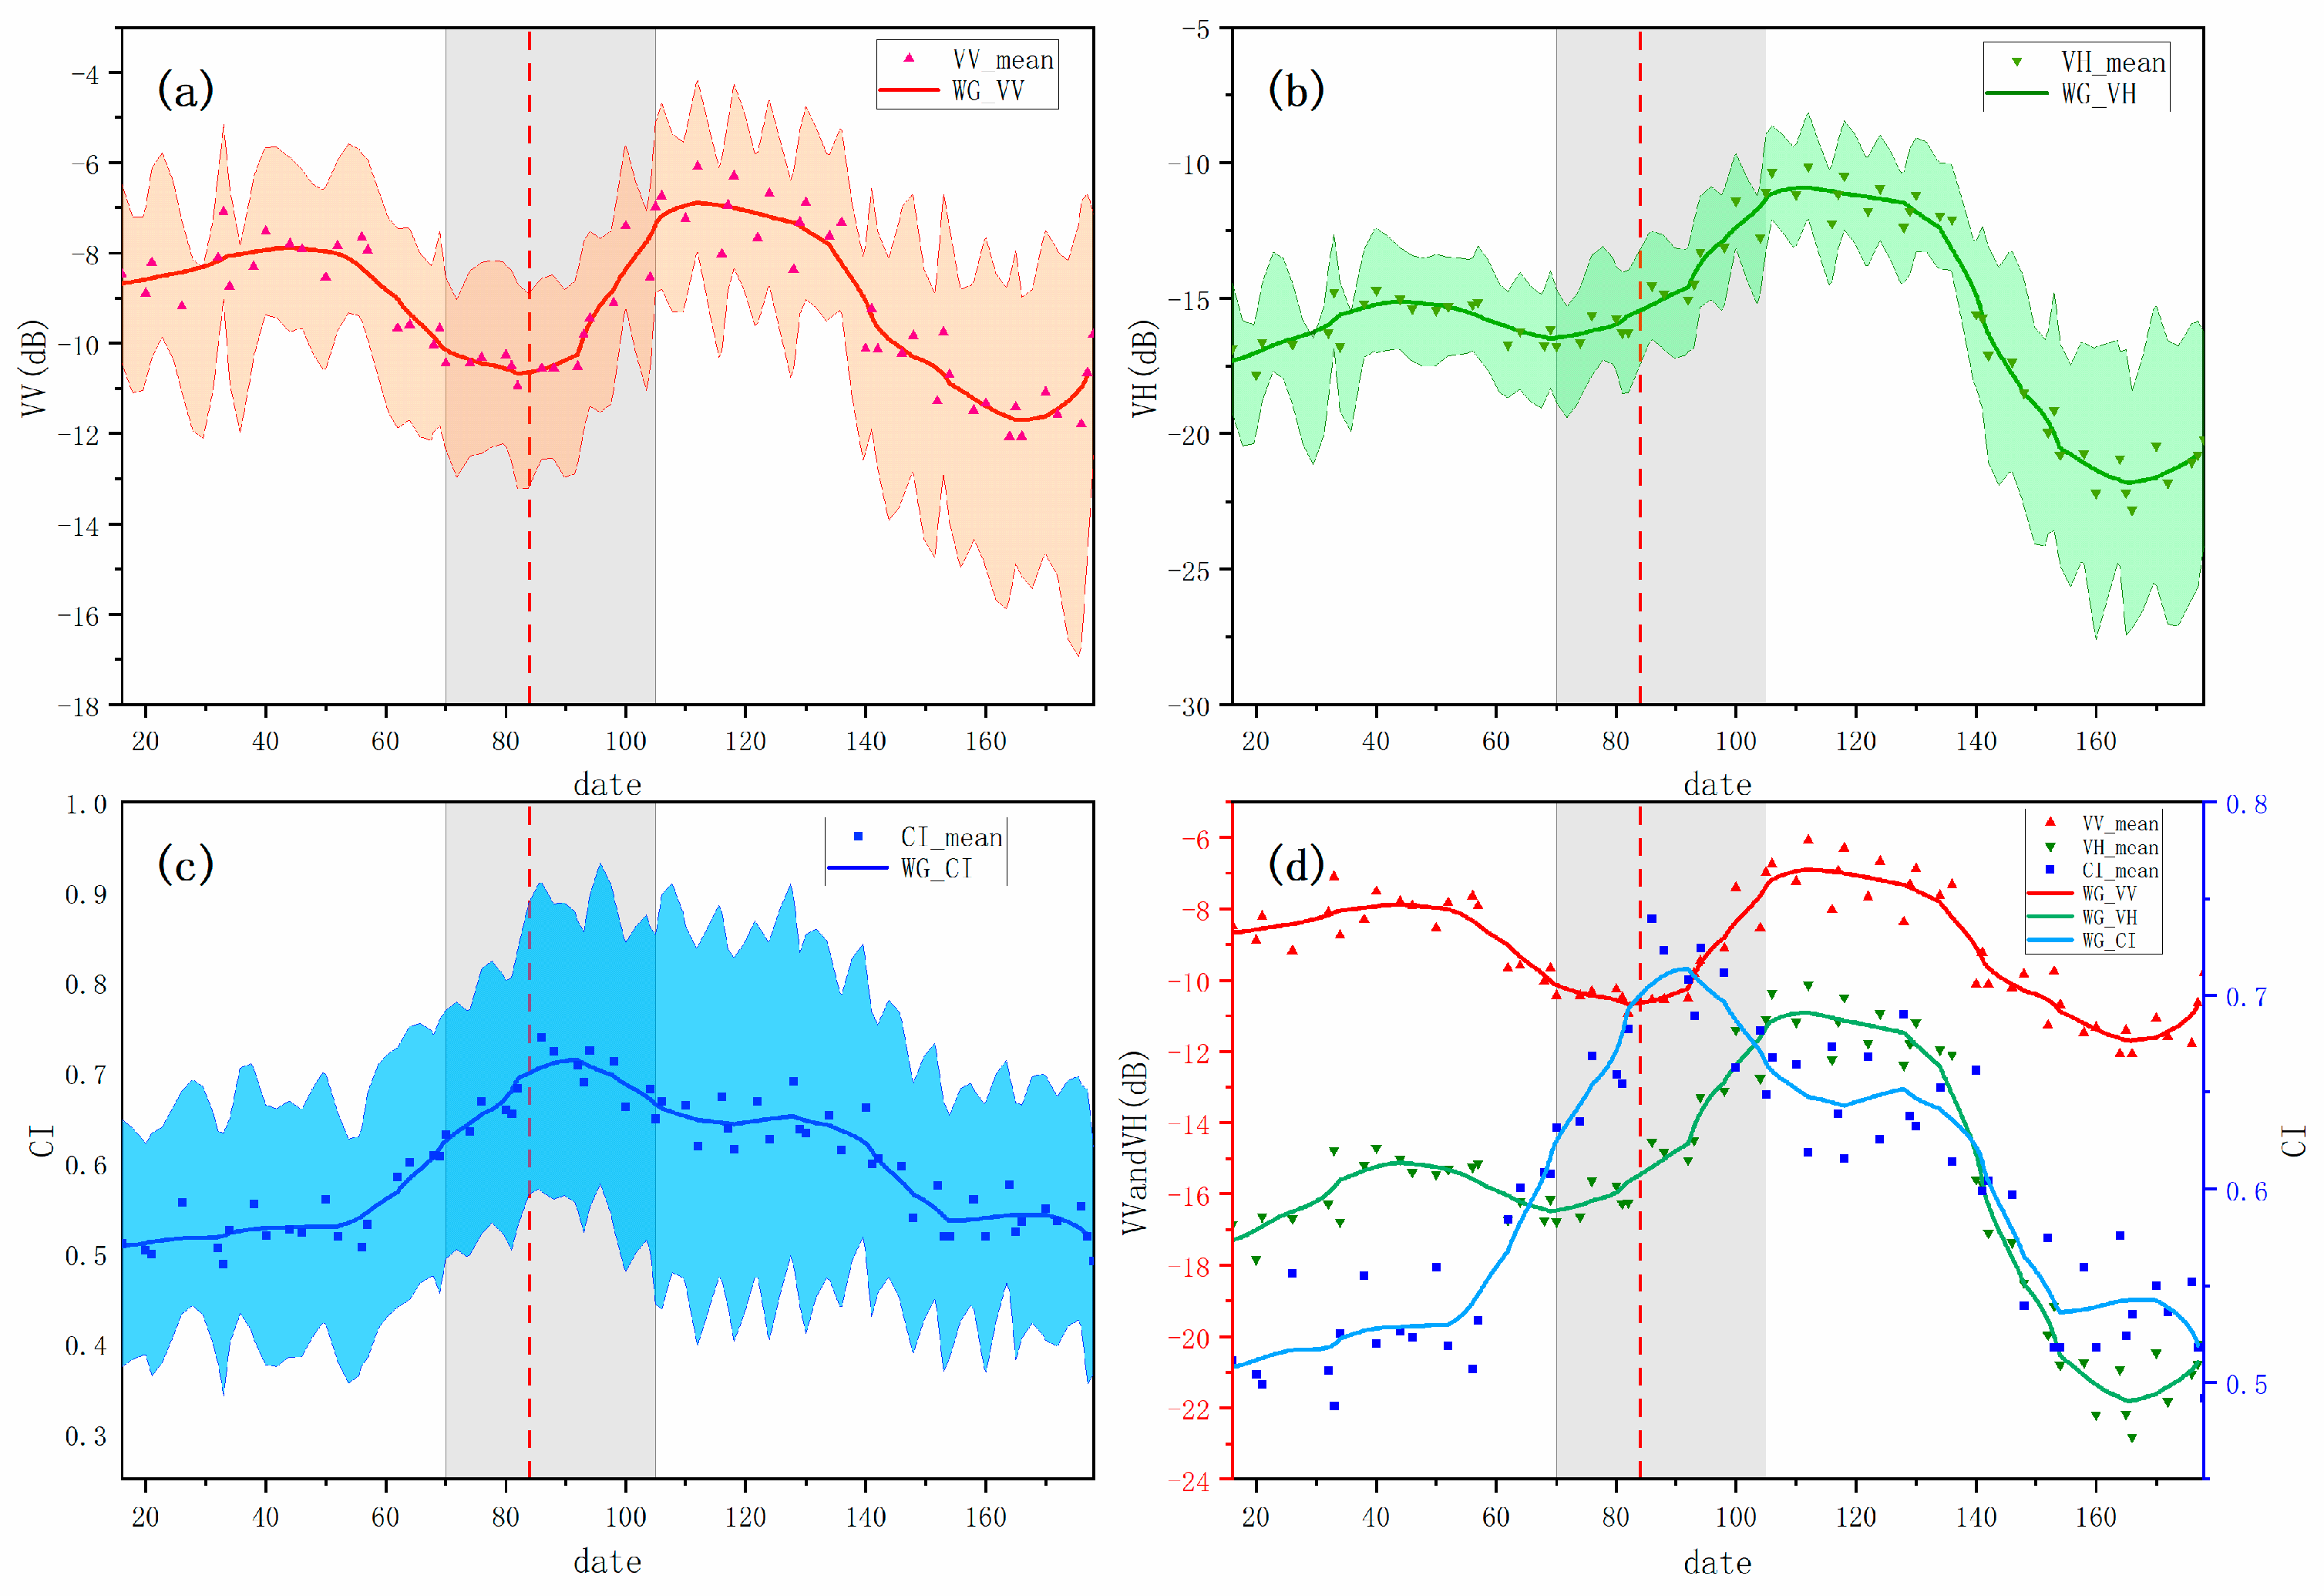
3.3. SAR Features During the Flowering Period

During the growth process of winter rapeseed, significant changes occur in the morphological indicators. The structure and depth of the winter rapeseed canopy directly influence the sensitivity of the backscattering coefficient from Sentinel-1 satellite data from various phenological stages. The time series of the backscatter coefficients provides us with more detailed information. As shown in Figure 6a,b, winter rapeseed’s VV backscatter shows a gradual increase during the flowering period, followed by a rapid decline after the onset of flowering, until reaching a local minimum. Subsequently, it shows a slow, then rapid, increasing trend until the end of the flowering period. This finding is consistent with previous research [12,32]. During the seedling-to-leaf stage of winter rapeseed, the canopy morphology is primarily dominated by rapeseed leaves. In the early stages of this process, the backscatter coefficient VV increases continuously as winter rapeseed grows and the leaves form a dense, random strong backscatter layer. During the flowering stage of winter rapeseed, since the flowers of winter rapeseed are less sensitive to backscatter VV compared to the leaves and pods, the backscatter coefficient VV exhibits synchronous changes with the decrease and increase in flower coverage within the pixel, reaching a local minimum around the peak flowering dates. The slow and rapid trends in the decrease and increase can be explained as follows. When the flower coverage reaches a certain level, the weak backscatter layer formed by the flowers approaches saturation. The backscatter coefficient VH is more sensitive to the depth of the canopy and less sensitive to the structural changes caused by flowering, resulting in a poorer capability of identifying the peak flowering dates of winter rapeseed [12]. Although VV and VH exhibit similar temporal trends, using VH to predict the peak flowering dates shows a tendency for earlier prediction. Moreover, VV performs more dramatically compared to VH and is more helpful in monitoring the peak flowering dates.
C I = V V V H
where VV represents the backscatter coefficient with vertical transmission and vertical reception polarization, and VH represents the backscatter coefficient with vertical transmission and horizontal reception polarization.
Some researchers have explored using the CI index (the ratio of VV to VH) to indicate the flowering period of rapeseed. As shown in Figure 6c, CI can mitigate the double-bounce effect and reduce errors from collection systems and environmental factors [23]. Although promising for overall monitoring, the CI index shows a significant lag in determining peak flowering dates based on our data.

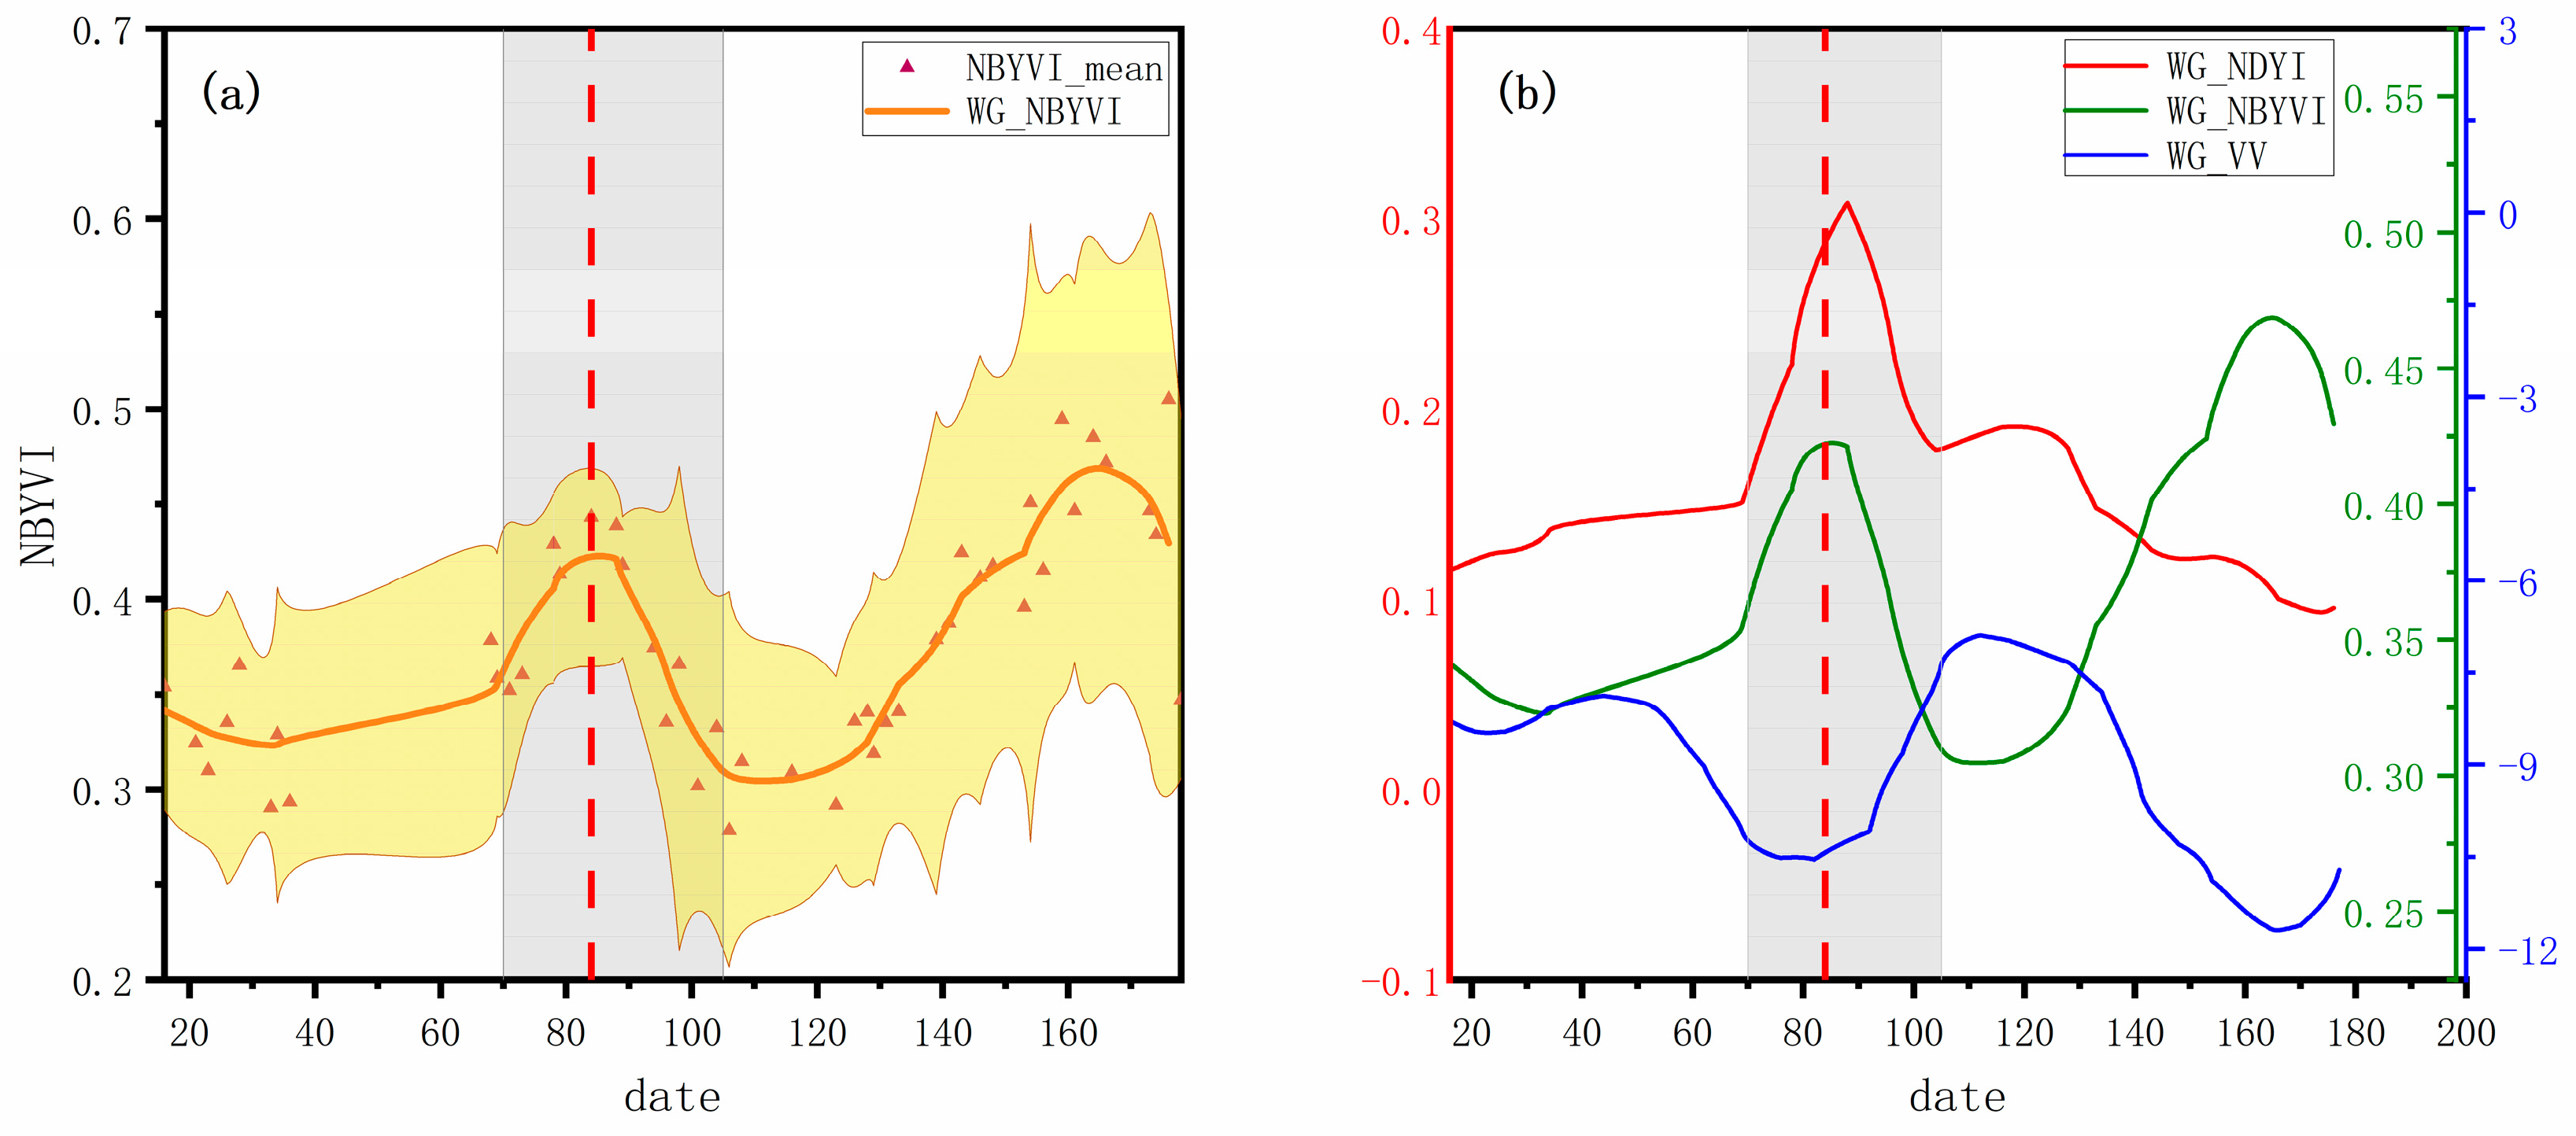
3.4. NBYVI Index Features During the Flowering Period

During the flowering of winter rapeseed, changes in canopy color and structure lead to significant shifts in green and red light bands and backscatter coefficients. Figure 7 shows that the NBYVI index, constructed from these data, effectively identifies the flowering period. It shows a dramatic increase during flowering, peaks, and then declines. Compared to NDYI, NBYVI provides a more accurate peak flowering date and exhibits more pronounced changes near the peak than VV, enhancing the detection of local maxima.

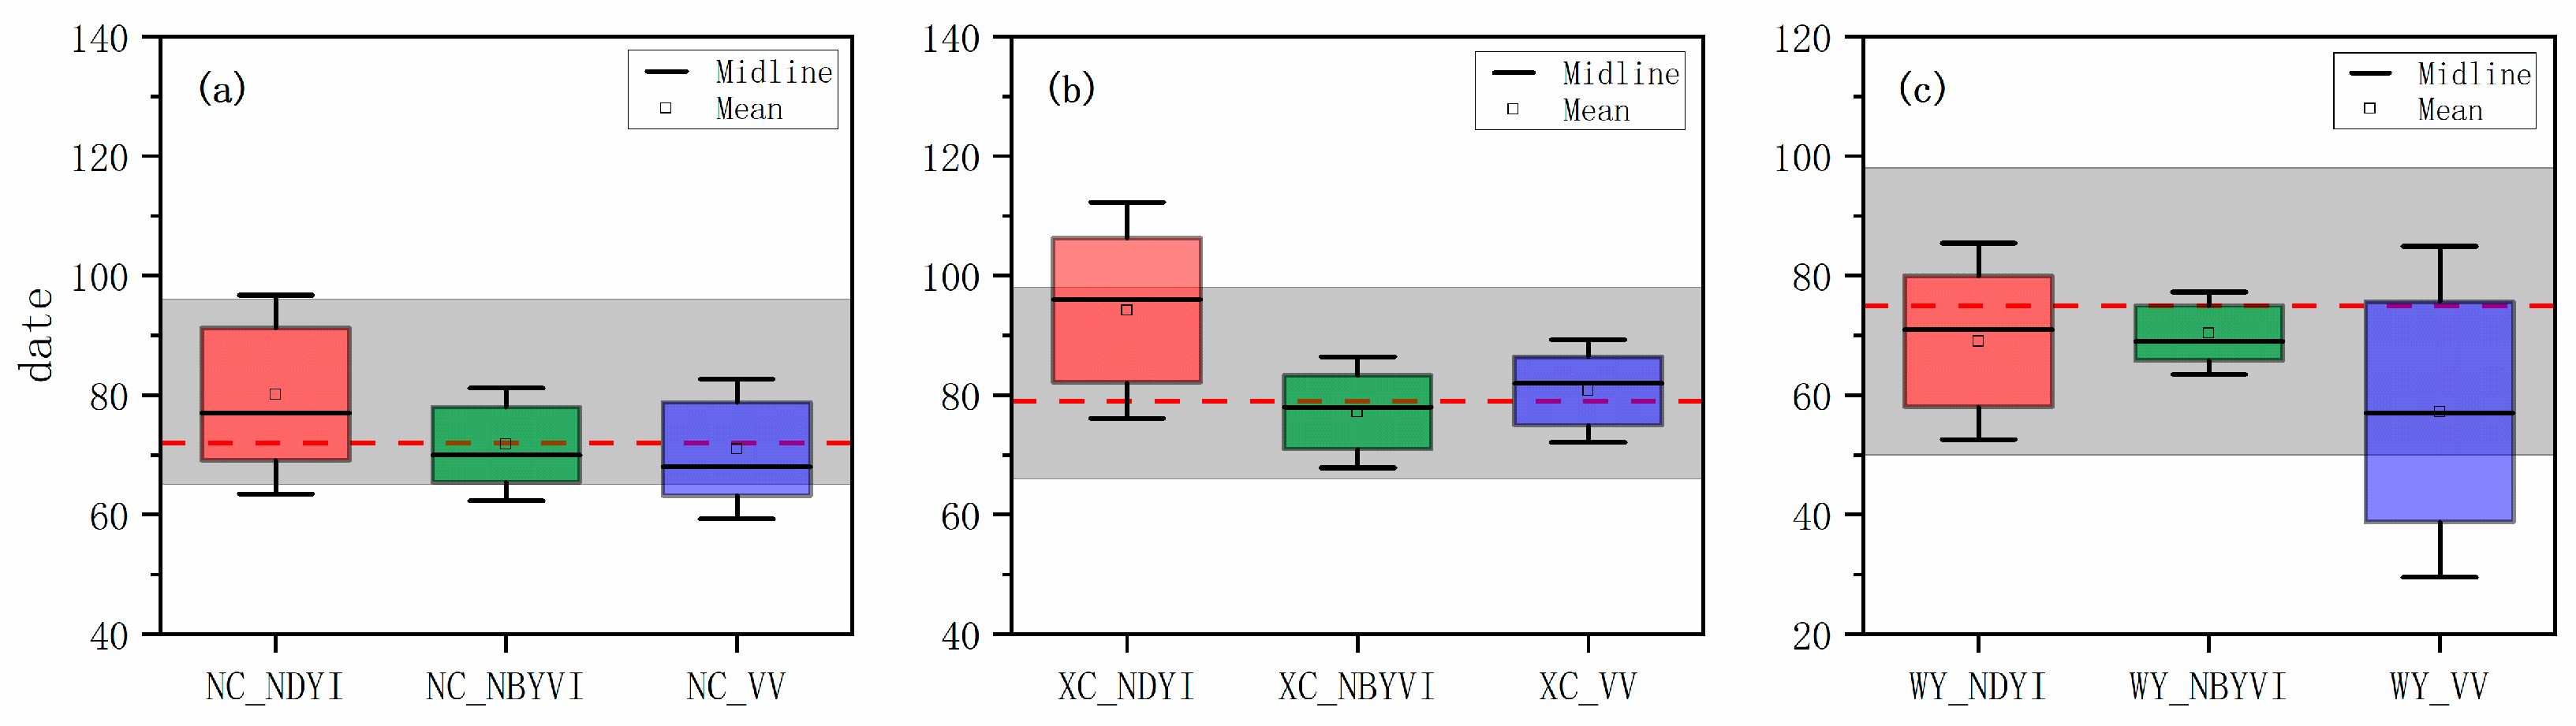
3.5. Peak Flowering Dates Monitoring Accuracy

In the study area, three main winter rapeseed planting areas, namely Nanchang City, Xuancheng City, and Wuyuan County, were selected as validation areas. For each validation area, the peak flowering dates of the winter rapeseed sample points, selected during the random forest classification process, were identified using the VV, NDYI, and NBYVI indices, respectively. First, the identified peak flowering dates from the three indices were verified to ensure they fall within the actual flowering period of the respective validation areas, as determined by the visual interpretation of the flowering images from the Sentinel-2 and GF-1 data. Second, the accuracy of the identified peak flowering dates was evaluated and compared using the root mean square error (RMSE) and mean absolute percentage error (MAPE) based on the accurate peak flowering dates obtained from the auxiliary data provided on the government websites of Nanchang City, Xuancheng City, and Wuyuan County.
To visually demonstrate the precision of the NBYVI, NDYI, and VV indices in determining the peak flowering dates of winter rapeseed, we used box plots for the initial comparison and explanation of the results. Figure 8 shows that the peak flowering dates identified by these indices are mostly distributed within the actual flowering period range in each area. Additionally, in the validation areas of Nanchang City and Xuancheng City, the median and mode of the peak flowering dates identified by the VV index and NBYVI index are very close. In the validation area of Wuyuan County, the median and mode of the peak flowering dates identified by the NDYI index and NBYVI index are also very close. This phenomenon once again validates the ability of both the original and new indices to identify the overall flowering dates of winter rapeseed. But, the original indices also exhibit some errors. For example, in the validation area of Nanchang City, 17.24% of the results identified by the VV index exceed the actual flowering period range. In the validation area of Xuancheng City, 46.45% of the results identified by the NDYI index are delayed compared to the actual flowering period range. In the validation area of Wuyuan County, 26.83% of the results identified by the VV index are earlier than the actual flowering period range. Compared to the NDYI and VV indices, the results identified by the NBYVI index are more densely distributed and numerically closer to the actual peak flowering dates in each area. Therefore, in identifying the flowering period, the NBYVI index outperforms the NDYI and VV indices.

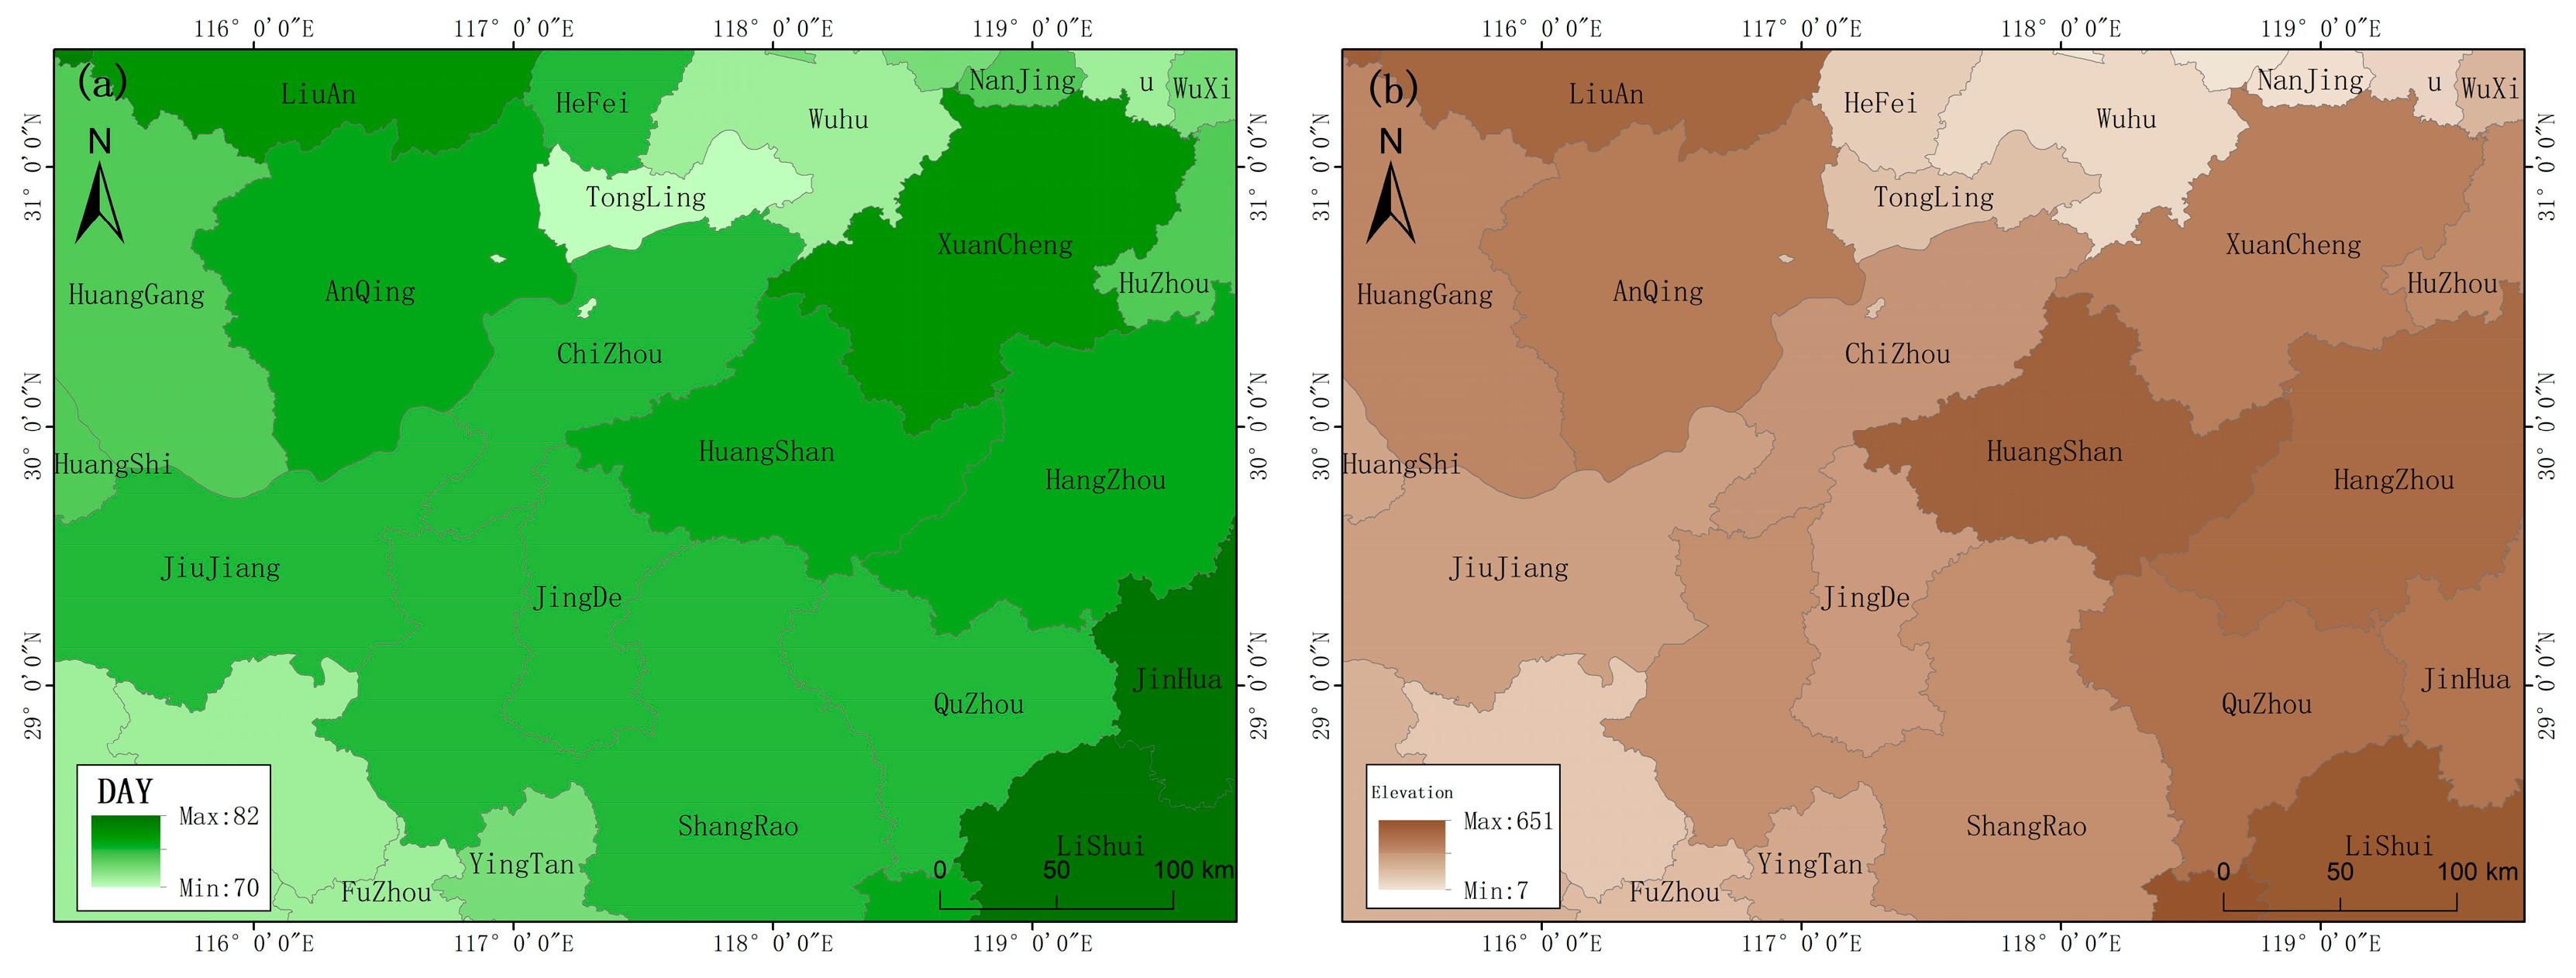
3.6. Peak Flowering Dates

3.6.1. Peak Flowering Dates and Temperature

Based on phenological characteristics and the random forest algorithm, combined with a hierarchical classification approach, the distribution of winter rapeseed in the main planting areas of the middle and lower reaches of the Yangtze River Basin was further extracted. The results cover seven provinces (Sichuan, Hunan, Hubei, Henan, Anhui, Jiangsu, and Jiangxi) and one municipality (Chongqing). Figure 9a shows the grid with 0.5-degree intervals and uses the NBYVI index to identify the average peak flowering dates within each grid in the winter rapeseed planting areas. Using data from the National Ground Meteorological Stations, the mean temperature for each station during the growth period prior to the flowering of winter oilseed rape was calculated. The mean temperature at each station was used as the original temperature, and Kriging interpolation was applied to obtain the final temperature distribution map for the middle and lower reaches of the Yangtze River. As shown in Figure 9b, except for the northwest of Sichuan, where high elevation factors influence the temperature, there is an overall gradient increase in temperature from south to north. To more intuitively reflect the impact of temperature on the peak flowering dates of winter oilseed rape, the grid temperature mean for the same flowering date was used as the fitting target.
As shown in Figure 10, the peak flowering dates decrease with the rise in temperature. A linear fitting method was used to analyze the relationship between temperature and the peak flowering dates of winter oilseed rape in the middle and lower reaches of the Yangtze River, with a precision (R2) of 0.31. Considering the sensitivity of crop growth to temperature, this result may be due to the interpolation of station data only during the temperature acquisition process, neglecting the influence of various factors during the actual interpolation process.

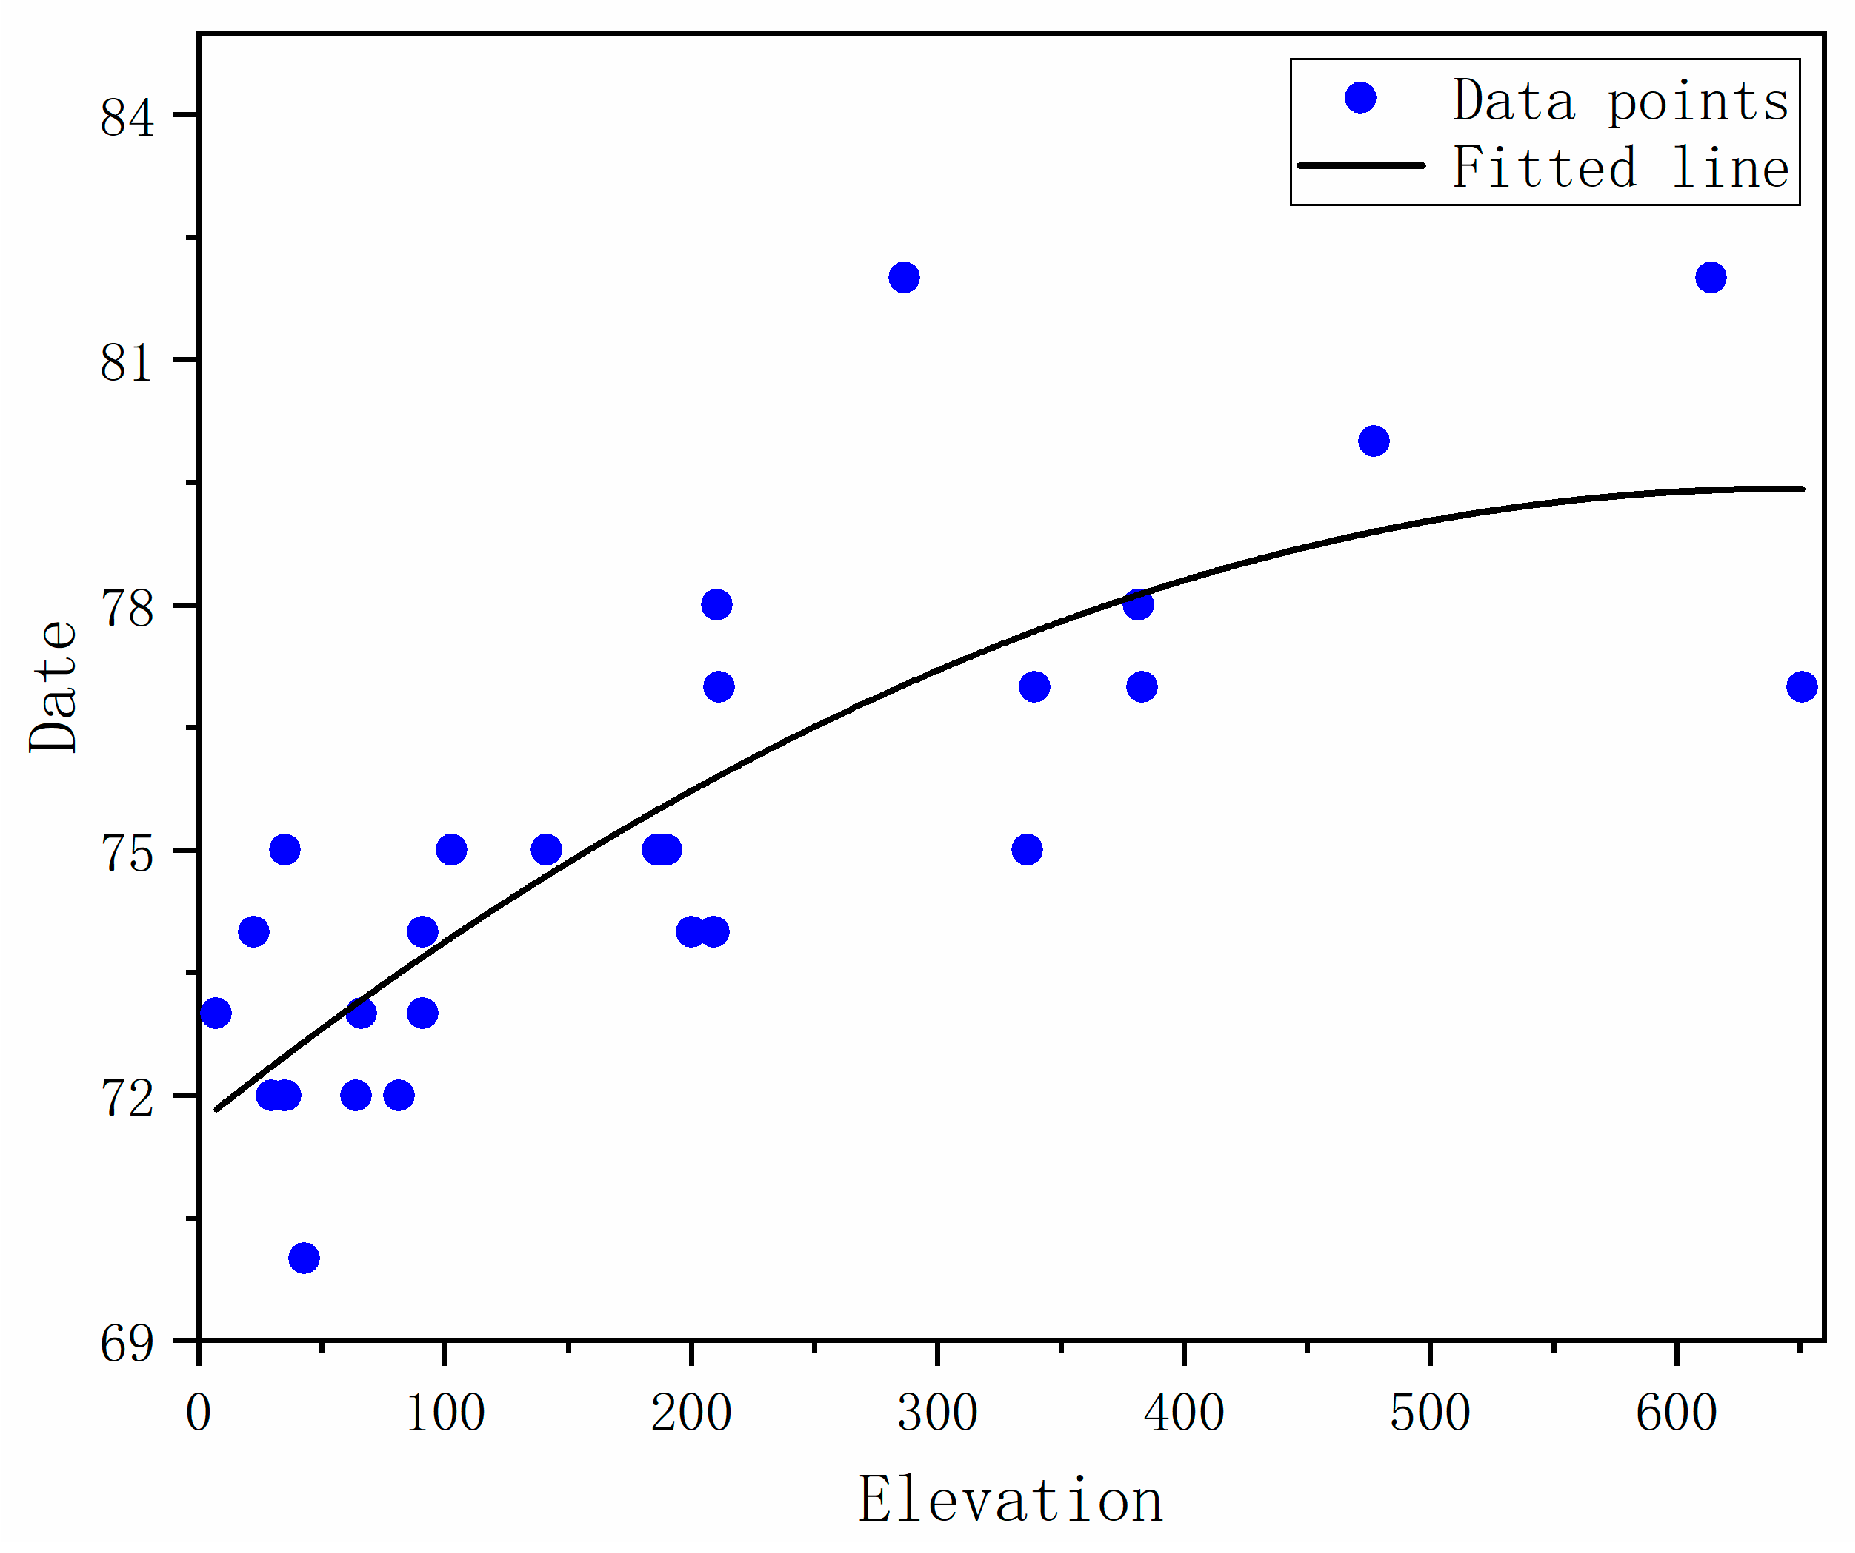
3.6.2. Peak Flowering Dates and Elevation

Using the NBYVI index to identify the peak flowering dates of winter rapeseed in the relevant cities of the study area, it was found that the peak flowering dates of winter rapeseed across the cities in the study area range from 9 March to 21 March, with a concentration around 14 March. As shown in Figure 11, although the original temperature conditions are similar within the study area, the actual temperature is influenced by the elevation increase, causing variations in actual temperatures compared to the original temperatures among different cities, which in turn, affects the peak flowering dates of winter rapeseed.
On the basis of the distribution of the peak flowering dates gradient and the average elevation gradient for cities within the study area, it can be preliminarily concluded that the stepwise distribution of the two exhibits similar characteristics. As the elevation of the planting area increases, the peak flowering dates of winter rapeseed also show a delayed trend, with an average delay of about 2 days for every 100 m increase in elevation. Figure 12 shows that the data fitting using polynomial fitting between the average elevation values and peak flowering dates of winter rapeseed in the study area yielded a coefficient of determination (R2) of 0.65, indicating a certain level of correlation between the two.

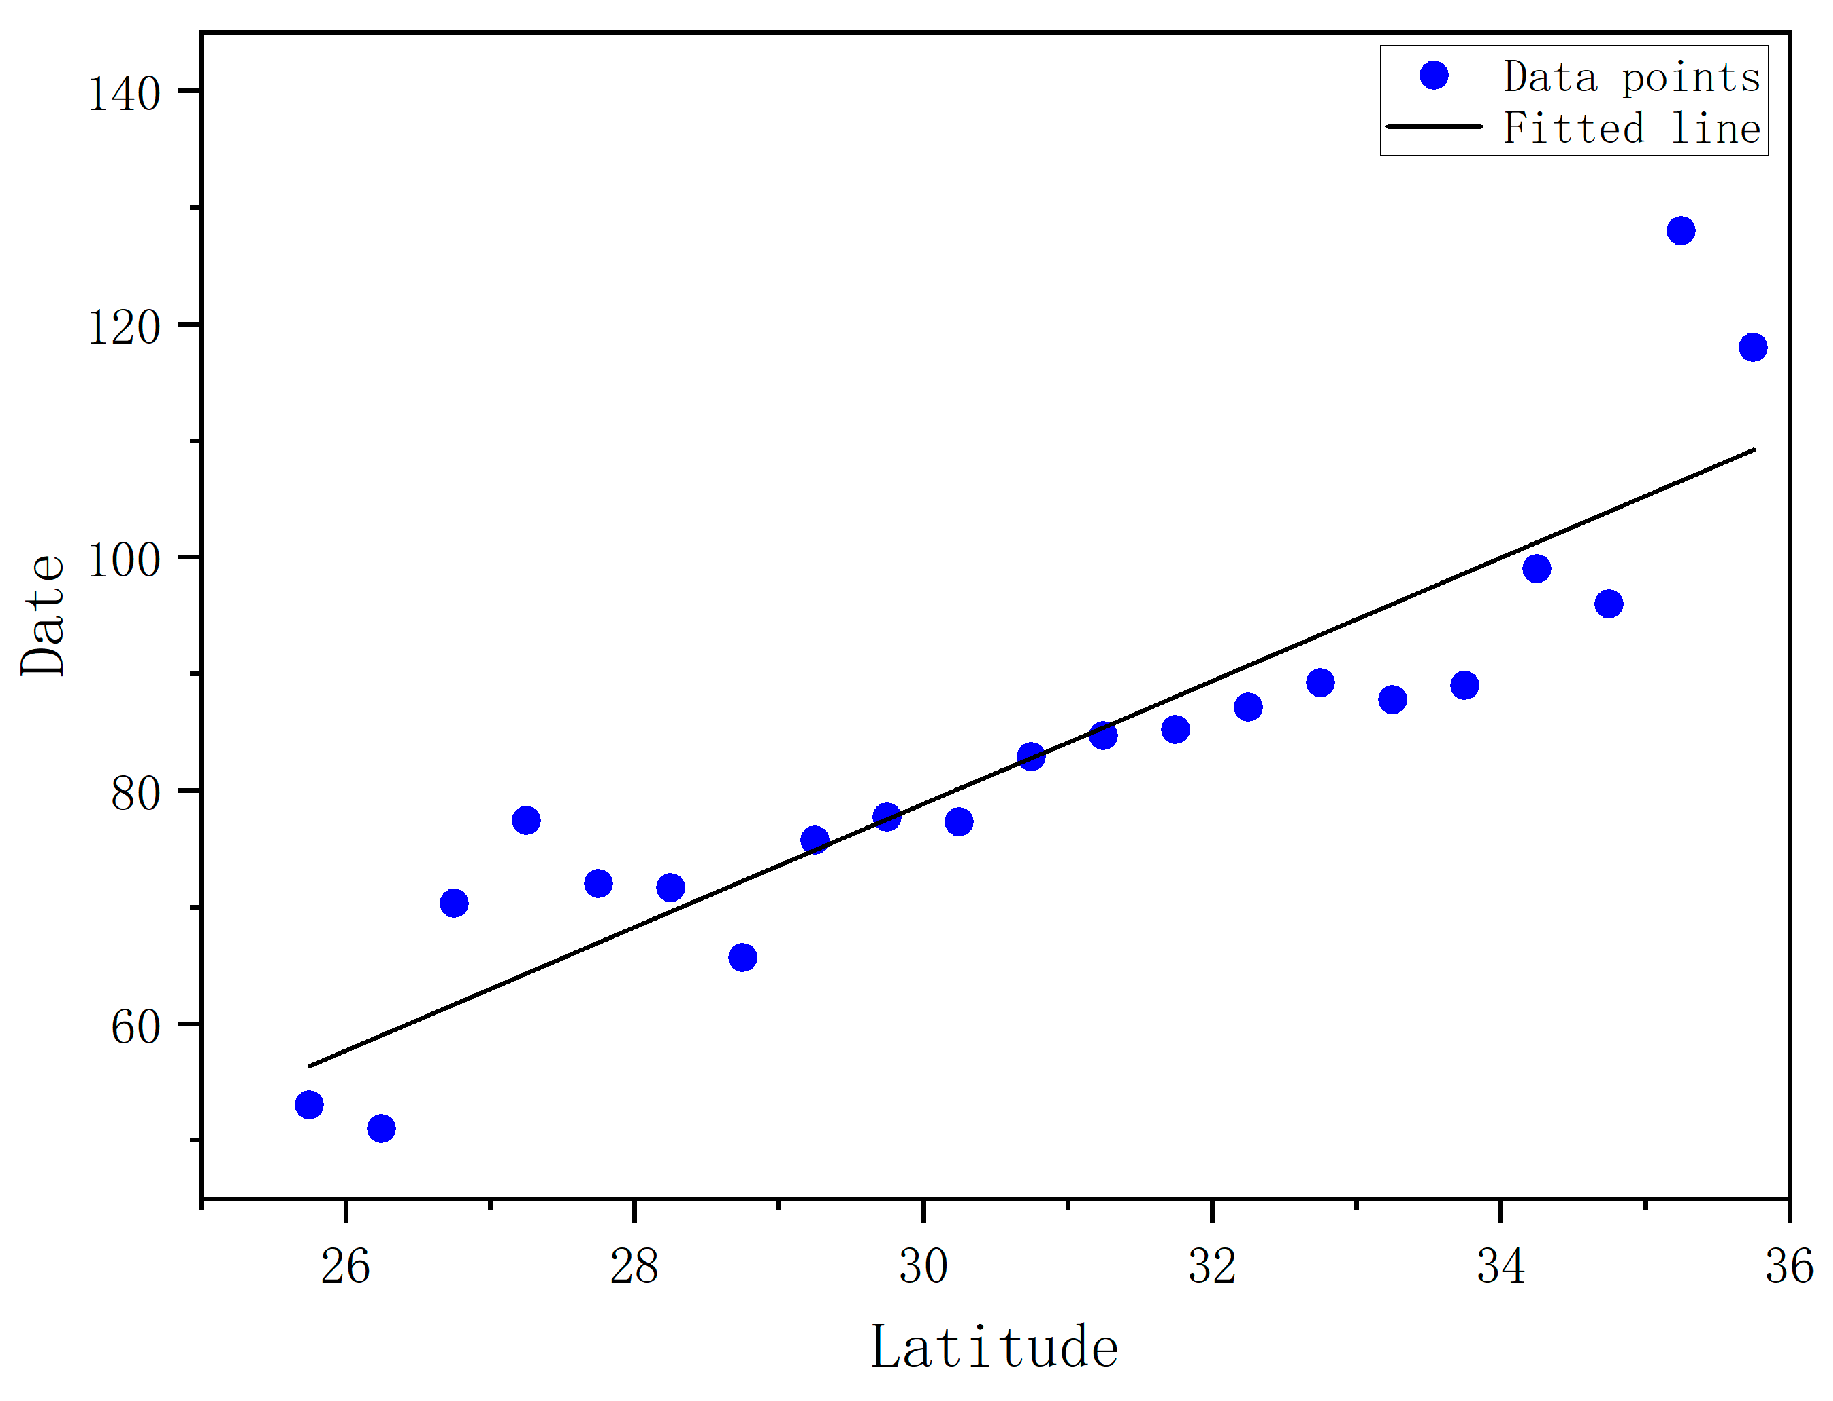
3.6.3. Peak Flowering Dates and Latitude

Figure 13 shows that the peak flowering dates of winter rapeseed ranged from 28 February to 22 April, with a concentration around 15 March. Most areas in the northwestern part of Sichuan and some regions in other provinces are not suitable for winter rapeseed cultivation due to the high-altitude mountainous terrain. The spatial pattern of peak flowering dates for winter rapeseed in the middle and lower reaches of the Yangtze River Basin shows a synchronized gradient increase as latitude increases.
The peak flowering dates of winter rapeseed are primarily influenced by precipitation and temperature. However, due to the scattered and manual planting methods of winter rapeseed in China, irrigation and drainage are relatively easy to manage, so the impact of precipitation is often disregarded. In the extensive regions of the middle and lower reaches of the Yangtze River Basin, the original temperature is mainly influenced by latitude, which in turn, affects the peak flowering dates of winter rapeseed. Since the impact of elevation on actual temperature has already been discussed in cases of similar original temperatures, to further illustrate the influence of different latitudes on peak flowering dates more intuitively, the average peak flowering dates across multiple regions at the same latitude were used for fitting with latitude data to minimize the effects of elevation and other factors on actual temperature.
Figure 14 shows that the linear fit of the relationship between the peak flowering dates of winter rapeseed in the middle and lower reaches of the Yangtze River Basin and latitude has an R2 value of 0.81, indicating a strong correlation between latitude and the peak flowering dates of winter rapeseed. Under the condition of mitigating the impact of elevation, latitude influences the peak flowering dates by affecting the original temperature. In the middle and lower reaches of the Yangtze River Basin, for every one-degree increase in latitude, the peak flowering dates of winter rapeseed are delayed by 5.2 days.

4. Discussion

4.1. Phenological Characteristics of Crop Morphological Indices

The traditional phenological remote-sensing indices are constructed based on optical data, with the principle that the optical characteristics of crop canopies change as the crop grows. During the crop growth process, the morphological structure of the crop also changes. Therefore, remote-sensing indices, closely related to crop morphological structure, can be used to monitor crop development and phenological changes, and these indices are referred to as crop morphological indices. SAR is closely related to crop morphological structure and can serve as a crop morphological index. In recent years, the potential of SAR data, representing crop morphological indices, to indicate crop phenology has garnered widespread attention [12,22,32]. Compared to optical remote-sensing data, SAR is less impacted by cloud cover and offers more frequent observation data.
In the growth process of winter rapeseed, the plant can be divided into four main stages based on significant morphological differences: emergence, flowering, podding, and maturity. The temporal variation characteristics of SAR data also exhibit a synchronized trend with the phenological changes of winter rapeseed, where the VV band of the SAR data is more sensitive to canopy structure, while the VH band is more sensitive to canopy depth. Throughout the development of winter rapeseed, the VV and VH bands of the SAR data exhibit similar variation trends. At the seedling stage, the canopy depth and density increase as the winter rapeseed grows, and the temporal curve of the SAR data also shows a synchronous upward trend. Relative to the optical data, SAR is more responsive to soil conditions, leading to errors in SAR data due to strong soil signal interference during the seedling stage, when winter rapeseed provides less soil coverage. However, this influence gradually diminishes as the winter rapeseed grows and canopy coverage increases. During the flowering stage, stems, leaves, flowers, and pods of different scales alternately become the main canopy structures of winter rapeseed. The SAR data are comparable in scale to the stems, leaves, and pods of winter rapeseed [29,30,31]. The weak backscattering layer formed by flowers masks the strong backscattering layer formed by stems, leaves, and pods, leading to a trend in the SAR data temporal curve that first decreases and then increases. When the SAR data decreases to a local minimum, it indicates that the masking effect of flowers on stems, leaves, and pods has reached its maximum, marking the peak flowering dates of winter rapeseed. During the podding stage, the canopy consists of fully developed stems, leaves, and fruits, with the plant height no longer increasing. The overall canopy structure remains relatively stable, but the increasing number of pods slightly enhances the canopy density, resulting in the appearance of stable high values and maximum values in the SAR data temporal curve during the growth cycle. In the maturity stage, the canopy withers and drops, leading to a rapid decline in canopy depth and density, causing the SAR data’s temporal curve to plummet.
Compared to traditional optical data, SAR data have a more stable ability to indicate the peak flowering dates of winter rapeseed. Upon validation, the VV index of the SAR data shows a slightly better consistency in identifying the peak flowering dates compared to the NDYI index. The common error in days for the identification results of the VV index (2–6 days) is 0–1 days less than that of the NDYI index (2–7 days). The successful identification of the peak flowering dates using the VV index demonstrates that, in addition to the crop’s optical characteristics that indicate the crop growth process, crop morphological indices can also independently provide effective data support for crop monitoring. This approach offers a more convenient and accurate new perspective for crop phenology monitoring.

4.2. NBYVI Index for Identifying Peak Flowering Dates

In the domain of identifying peak flowering dates in winter rapeseed, the NDYI index introduces variability due to its inclusion of the blue light spectrum, affecting result stability. The VV index, on the other hand, is impacted by saturation near the flowering stage, affecting result accuracy. Due to their limitations, we constructed the NBYVI index, which integrates morphological indices and optical characteristics, to achieve a more stable and accurate identification of peak flowering dates in winter rapeseed. Experiments indicate that the VV index is more helpful in identifying the peak flowering dates of winter rapeseed compared to the VH and CI indices. Taking into account both the universality of the remote-sensing data bands and the inherent issues with the blue light spectrum, we have opted to discard the blue light band and instead selected the more stable green light and red light bands during the flowering stage. The successful construction of the NBYVI index allows us to simultaneously utilize optical and radar data for monitoring the peak flowering dates of winter rapeseed. This expands the range of remote-sensing data available during the flowering dates of winter rapeseed, thereby providing more stable data support. The NBYVI index considers both the canopy structure and the optical characteristics during winter rapeseed flowering, and both of these factors are closely related parameters to flowering intensity and timing.
Upon validation, the NBYVI index demonstrates superior performance in both the distribution of identification results within the flowering period range and its consistency with actual peak flowering dates. This study validates the peak flowering dates of winter rapeseed identified by the NBYVI, NDYI, and VV indices using two metrics: RMSE and MAPE. The RMSE mean values for the NBYVI index are approximately 6.31; for the NDYI index, approximately 15.43; and for the VV index, approximately 13.22. The MAPE mean values for the NBYVI index are approximately 0.059; for the NDYI index, approximately 0.150; and for the VV index, approximately 0.145. Both error metrics confirm that the NBYVI index demonstrates a more stable and accurate ability to identify the peak flowering dates of winter rapeseed compared to the NDYI and VV indices. In different validation zones, compared to the monitoring results of the NDYI index (error days generally ranging from 2 to 7 days) and the VV index (error days generally ranging from 2 to 6 days), the monitoring results of the NBYVI index (error days generally ranging from 0 to 4 days) are more stable and accurate. Therefore, compared to the NDYI and VV indices, the NBYVI index can more precisely determine the peak flowering dates of winter rapeseed.
The phenological characteristics of the NBYVI index time-series curve are more pronounced compared to the VV index and more stable compared to the NDYI index. The NBYVI index, constructed from optical and radar data, integrates the advantages of radar’s all-day and all-weather capabilities with the sensitivity of visible light to crop canopy conditions, and this makes it a more powerful and stable monitoring indicator for winter rapeseed phenology. Compared to the NDYI index, the NBYVI index can provide more continuous and accurate crop growth information. Compared to the VV index, the NBYVI index shows more pronounced changes during the flowering dates of winter rapeseed. The construction of the NBYVI index enables a more accurate identification of the peak flowering dates of winter rapeseed, which aids in targeted agricultural management and the development of tourism resources.

4.3. Temperature Fitting Using Elevation

Current crop phenological monitoring studies often heavily rely on the temperature data collected from meteorological stations, but these data may not accurately reflect the temperature conditions at specific crop locations when interpolated using simple methods. Based on the distribution of peak flowering dates and the average elevation gradient for cities within the study area, it can be observed that the stepwise distribution of both exhibits similar characteristics. Since the growth and development of winter rapeseed are primarily influenced by accumulated temperature, the correlation between peak flowering dates and elevation supports the idea that elevation affects crop phenology through its impact on temperature. This finding provides a new approach for obtaining more accurate temperature data in crop monitoring. Specifically, when interpolating temperature data for test points, incorporating elevation data as an auxiliary variable may improve the accuracy of temperature estimates.

4.4. Limitations and Perspectives

Although this study has achieved better results, there are still inevitable issues to consider. First, when conducting random forest classification on winter rapeseed in the study area, the land cover dataset used for masking itself may contain certain errors (for example, the accuracy of the 2019 CLCD data is 79.31%), and there will inevitably be some mixed pixels misclassified as winter rapeseed in the classification results. Second, this study was constrained by the conditions of the measured data and only conducted accuracy evaluations in three validation areas. The feasibility of the NBYVI index in other regions where winter rapeseed is planted was not verified. In the future, we believe that the NBYVI index can be validated for feasibility over a larger temporal and spatial range, and it can provide more effective technical support for the yield estimation of winter rapeseed.

5. Conclusions

This study achieved a hierarchical classification of cropland, winter cropland, and winter rapeseed based on phenological characteristics and the random forest algorithm, successfully extracting the planting areas of winter rapeseed within the study area and the Kappa coefficient was 90.57%. It discussed the phenological characteristics of crop morphological indices and demonstrated that SAR data can more stably monitor the peak flowering dates of winter rapeseed compared to optical data. Based on significant changes in optical characteristics and canopy structure during the winter rapeseed flowering, a novel NBYVI index was proposed by integrating the red and green light bands from Sentinel-2 data, along with the VV polarization band from Sentinel-1 data. Using actual flowering period data to validate the identification of peak flowering dates by each index, the results show that the identification results of the NBYVI index all conform to the actual flowering period range; the results identified by the NBYVI index show higher consistency with the actual peak flowering dates; and compared to the NDYI and VV indices, the NBYVI index reduces the error in identifying the peak flowering dates by 2–3 days. Building on this, the NBYVI index was used to obtain the spatial pattern of the peak flowering dates for winter rapeseed in the middle and lower reaches of the Yangtze River Basin. Additionally, the impacts of elevation and latitude on the peak flowering dates of winter rapeseed were discussed separately. The NBYVI index serves as a more stable and effective phenological monitoring indicator for identifying the peak flowering dates of winter rapeseed. Compared to the NDYI index, it provides more stable data support for yield estimation and also offers more accurate technical support for winter rapeseed agricultural management.

Author Contributions

Conceptualization, F.W.; methodology, S.C., F.W. and Y.X.; software, F.W., Y.X. and Z.W.; validation, F.W. and S.Z.; writing—original draft preparation, F.W.; writing—review and editing, S.C., P.L. and R.D.; funding acquisition, S.C. All authors have read and agreed to the published version of the manuscript.

Funding

This research was funded and supported by the National Key Research and Development Program of China (No. 2020YFA0714103).

Data Availability Statement

The rapeseed production data presented in this study are available from the National Bureau of Statistics of China at http://www.stats.gov.cn/ (accessed on 1 March 2024); the global rapeseed production data are available from the Foreign Agricultural Service at https://fas.usda.gov/ (accessed on 10 March 2024); the winter rapeseed peak flowering dates are available from the Xuancheng Municipal People’s Government, the Wuyuan County People’s Government, and the Nanchang Municipal People’s Government at https://www.xuancheng.gov.cn/ (accessed on 3 July 2024), http://www.jxwy.gov.cn/ (accessed on 3 July 2024), and https://www.nc.gov.cn/ (accessed on 3 July 2024); Satellite data are available on the Google Earth Engine (GEE) platform at https://earthengine.google.org (accessed on 21 March 2024); the 30 m annual land cover classification data (CLCD) dataset for China in 2019 are available at https://zenodo.org/records/4417810 (accessed on 15 May 2024); and administrative boundary data at https://www.ngcc.cn (accessed on 2 March 2024).

Conflicts of Interest

The authors declare no conflicts of interest.

References

  1. Fu, D.-H.; Jiang, L.-Y.; Mason, A.S.; Xiao, M.-L.; Zhu, L.-R.; Li, L.-Z.; Zhou, Q.-H.; Shen, C.-J.; Huang, C.-H. Research progress and strategies for multifunctional rapeseed: A case study of China. J. Integr. Agric. 2016, 15, 1673–1684. [Google Scholar] [CrossRef]
  2. Rutkowski, A. The feed value of rapeseed meal. J. Am. Oil Chem. Soc. 1971, 48, 863–868. [Google Scholar] [CrossRef]
  3. Bell, J. Nutrients and toxicants in rapeseed meal: A review. J. Anim. Sci. 1984, 58, 996–1010. [Google Scholar] [CrossRef] [PubMed]
  4. Zhang, R.; Cao, J.-J.; Pu, C.; Li, Y.; Jin, H.-G. Analysis on production, import, export, supply and demand of rapeseed and rapeseed oil in China. China Oils Fats 2022, 47, 8–14, 52. [Google Scholar]
  5. Iglesias, F.M.; Miralles, D.J. Changes in Seed Weight in Response to Different Sources: Sink Ratio in Oilseed Rape; IJARIT Research Foundation: Srimangal, Bangladesh, 2014. [Google Scholar]
  6. Zhang, H.; Flottmann, S. Source-sink manipulations indicate seed yield in canola is limited by source availability. Eur. J. Agron. 2018, 96, 70–76. [Google Scholar] [CrossRef]
  7. Kirkegaard, J.A.; Lilley, J.M.; Brill, R.D.; Ware, A.H.; Walela, C.K. The critical period for yield and quality determination in canola (Brassica napus L.). Field Crops Res. 2018, 222, 180–188. [Google Scholar] [CrossRef]
  8. Rivelli, G.M.; Calderini, D.F.; Abeledo, L.G.; Miralles, D.J.; Rondanini, D.P. Yield and quality traits of wheat and rapeseed in response to source-sink ratio and heat stress in post-flowering. Eur. J. Agron. 2024, 152, 127028. [Google Scholar] [CrossRef]
  9. Del Río, L.; Bradley, C.; Henson, R.; Endres, G.; Hanson, B.; McKay, K.; Halvorson, M.; Porter, P.; Le Gare, D.; Lamey, H. Impact of Sclerotinia stem rot on yield of canola. Plant Dis. 2007, 91, 191–194. [Google Scholar] [CrossRef] [PubMed]
  10. Hacault, K.; Faust, R.; Butzen, S.; Jeschke, M. (Eds.) Agronomy Sciences Research Summary 2012; Pioneer: Tokyo, Japan, 2012; p. 40. [Google Scholar]
  11. Mercier, A.; Betbeder, J.; Baudry, J.; Le Roux, V.; Spicher, F.; Lacoux, J.; Roger, D.; Hubert-Moy, L. Evaluation of Sentinel-1 & 2 time series for predicting wheat and rapeseed phenological stages. ISPRS J. Photogramm. Remote Sens. 2020, 163, 231–256. [Google Scholar]
  12. d’Andrimont, R.; Taymans, M.; Lemoine, G.; Ceglar, A.; Yordanov, M.; van der Velde, M. Detecting flowering phenology in oil seed rape parcels with Sentinel-1 and-2 time series. Remote Sens. Environ. 2020, 239, 111660. [Google Scholar] [CrossRef]
  13. Bargiel, D. A new method for crop classification combining time series of radar images and crop phenology information. Remote Sens. Environ. 2017, 198, 369–383. [Google Scholar] [CrossRef]
  14. Domínguez, J.A.; Kumhálová, J.; Novák, P. Winter oilseed rape and winter wheat growth prediction using remote sensing methods. Plant Soil Environ. 2015, 61, 410–416. [Google Scholar] [CrossRef]
  15. Leach, J.; Milford, G.; Mullen, L.; Scott, T.; Stevenson, H. Accumulation of dry matter in oilseed rape crops in relation to the reflection and absorption of solar radiation by different canopy structures. Asp. Appl. Biol. 1989, 23, 117–123. [Google Scholar]
  16. Shen, M.; Chen, J.; Zhu, X.; Tang, Y. Yellow flowers can decrease NDVI and EVI values: Evidence from a field experiment in an alpine meadow. Can. J. Remote Sens. 2009, 35, 99–106. [Google Scholar] [CrossRef]
  17. Shen, M.; Chen, J.; Zhu, X.; Tang, Y.; Chen, X. Do flowers affect biomass estimate accuracy from NDVI and EVI? Int. J. Remote Sens. 2010, 31, 2139–2149. [Google Scholar] [CrossRef]
  18. Piekarczyk, J.; Sulewska, H.; Szymańska, G. Winter oilseed-rape yield estimates from hyperspectral radiometer measurements. Quaest. Geogr. 2011, 30, 77–84. [Google Scholar] [CrossRef]
  19. Sulik, J.J.; Long, D.S. Spectral indices for yellow canola flowers. Int. J. Remote Sens. 2015, 36, 2751–2765. [Google Scholar] [CrossRef]
  20. Sulik, J.J.; Long, D.S. Spectral considerations for modeling yield of canola. Remote Sens. Environ. 2016, 184, 161–174. [Google Scholar] [CrossRef]
  21. Pacheco, A.; McNairn, H.; Li, Y.; Lampropoulos, G.; Powers, J. Using RADARSAT-2 and TerraSAR-X satellite data for the identification of canola crop phenology. In Proceedings of the Remote Sensing for Agriculture, Ecosystems, and Hydrology XVIII, Edinburgh, UK, 26–28 September 2016; p. 999802. [Google Scholar]
  22. Wang, S.; Zhao, L.; Sun, W.; Wang, Y.; Zhao, X.; Bai, Y. Flowering Detection of Canola Using Dynamic Time Warping and Sentinel-1 Time Series Images. In Proceedings of the IGARSS 2023—2023 IEEE International Geoscience and Remote Sensing Symposium, Pasadena, CA, USA, 16–21 July 2023; pp. 3482–3485. [Google Scholar]
  23. Veloso, A.; Mermoz, S.; Bouvet, A.; Le Toan, T.; Planells, M.; Dejoux, J.-F.; Ceschia, E. Understanding the temporal behavior of crops using Sentinel-1 and Sentinel-2-like data for agricultural applications. Remote Sens. Environ. 2017, 199, 415–426. [Google Scholar] [CrossRef]
  24. Preidl, S.; Lange, M.; Doktor, D. Introducing APiC for regionalised land cover mapping on the national scale using Sentinel-2A imagery. Remote Sens. Environ. 2020, 240, 111673. [Google Scholar] [CrossRef]
  25. Lopez-Sanchez, J.M.; Cloude, S.R.; Ballester-Berman, J.D. Rice phenology monitoring by means of SAR polarimetry at X-band. IEEE Trans. Geosci. Remote Sens. 2011, 50, 2695–2709. [Google Scholar] [CrossRef]
  26. Lopez-Sanchez, J.M.; Vicente-Guijalba, F.; Ballester-Berman, J.D.; Cloude, S.R. Polarimetric response of rice fields at C-band: Analysis and phenology retrieval. IEEE Trans. Geosci. Remote Sens. 2013, 52, 2977–2993. [Google Scholar] [CrossRef]
  27. Yang, H.; Li, Z.; Chen, E.; Zhao, C.; Yang, G.; Casa, R.; Pignatti, S.; Feng, Q. Temporal polarimetric behavior of oilseed rape (Brassica napus L.) at C-band for early season sowing date monitoring. Remote Sens. 2014, 6, 10375–10394. [Google Scholar] [CrossRef]
  28. Fieuzal, R.; Baup, F.; Marais-Sicre, C. Monitoring wheat and rapeseed by using synchronous optical and radar satellite data—From temporal signatures to crop parameters estimation. Adv. Remote Sens. 2013, 2, 162–180. [Google Scholar] [CrossRef]
  29. McNairn, H.; Jiao, X.; Pacheco, A.; Sinha, A.; Tan, W.; Li, Y. Estimating canola phenology using synthetic aperture radar. Remote Sens. Environ. 2018, 219, 196–205. [Google Scholar] [CrossRef]
  30. Tian, H.; Meng, M.; Wu, M.; Niu, Z. Mapping spring canola and spring wheat using Radarsat-2 and Landsat-8 images with Google Earth Engine. Curr. Sci. 2019, 116, 291–298. [Google Scholar] [CrossRef]
  31. Liu, C.; Shang, J.; Vachon, P.W.; McNairn, H. Multiyear crop monitoring using polarimetric RADARSAT-2 data. IEEE Trans. Geosci. Remote Sens. 2012, 51, 2227–2240. [Google Scholar] [CrossRef]
  32. Han, J.; Zhang, Z.; Cao, J. Developing a new method to identify flowering dynamics of rapeseed using landsat 8 and sentinel-1/2. Remote Sens. 2020, 13, 105. [Google Scholar] [CrossRef]
  33. Braun, A. Retrieval of digital elevation models from Sentinel-1 radar data–open applications, techniques, and limitations. Open Geosci. 2021, 13, 532–569. [Google Scholar] [CrossRef]
  34. Fernandez-Beltran, R.; Haut, J.M.; Paoletti, M.E.; Plaza, J.; Plaza, A.; Pla, F. Multimodal probabilistic latent semantic analysis for sentinel-1 and sentinel-2 image fusion. IEEE Geosci. Remote Sens. Lett. 2018, 15, 1347–1351. [Google Scholar] [CrossRef]
  35. He, W.; Yokoya, N. Multi-temporal sentinel-1 and-2 data fusion for optical image simulation. ISPRS Int. J. Geo-Inf. 2018, 7, 389. [Google Scholar] [CrossRef]
  36. Chen, Y.; Bruzzone, L. Self-supervised SAR-optical data fusion of Sentinel-1/-2 images. IEEE Trans. Geosci. Remote Sens. 2021, 60, 1–11. [Google Scholar] [CrossRef]
  37. Steinhausen, M.J.; Wagner, P.D.; Narasimhan, B.; Waske, B. Combining Sentinel-1 and Sentinel-2 data for improved land use and land cover mapping of monsoon regions. Int. J. Appl. Earth Obs. Geoinf. 2018, 73, 595–604. [Google Scholar] [CrossRef]
  38. Valero, S.; Arnaud, L.; Planells, M.; Ceschia, E. Synergy of Sentinel-1 and Sentinel-2 imagery for early seasonal agricultural crop mapping. Remote Sens. 2021, 13, 4891. [Google Scholar] [CrossRef]
  39. Kaplan, G.; Avdan, U. Sentinel-1 and Sentinel-2 data fusion for wetlands mapping: Balikdami, Turkey. Int. Arch. Photogramm. Remote Sens. Spat. Inf. Sci. 2018, 42, 729–734. [Google Scholar] [CrossRef]
  40. Heckel, K.; Urban, M.; Schratz, P.; Mahecha, M.D.; Schmullius, C. Predicting forest cover in distinct ecosystems: The potential of multi-source Sentinel-1 and-2 data fusion. Remote Sens. 2020, 12, 302. [Google Scholar] [CrossRef]
  41. Li, J.; Li, C.; Xu, W.; Feng, H.; Zhao, F.; Long, H.; Meng, Y.; Chen, W.; Yang, H.; Yang, G. Fusion of optical and SAR images based on deep learning to reconstruct vegetation NDVI time series in cloud-prone regions. Int. J. Appl. Earth Obs. Geoinf. 2022, 112, 102818. [Google Scholar] [CrossRef]
  42. Chen, D.; Hu, H.; Liao, C.; Ye, J.; Bao, W.; Mo, J.; Wu, Y.; Dong, T.; Fan, H.; Pei, J. Crop NDVI time series construction by fusing Sentinel-1, Sentinel-2, and environmental data with an ensemble-based framework. Comput. Electron. Agric. 2023, 215, 108388. [Google Scholar] [CrossRef]
  43. Tian, Z.; Ji, Y.; Xu, H.; Qiu, H.; Sun, L.; Zhong, H.; Liu, J. The potential contribution of growing rapeseed in winter fallow fields across Yangtze River Basin to energy and food security in China. Resour. Conserv. Recycl. 2021, 164, 105159. [Google Scholar] [CrossRef]
  44. Torres, R.; Snoeij, P.; Geudtner, D.; Bibby, D.; Davidson, M.; Attema, E.; Potin, P.; Rommen, B.; Floury, N.; Brown, M. GMES Sentinel-1 mission. Remote Sens. Environ. 2012, 120, 9–24. [Google Scholar] [CrossRef]
  45. You, N.; Dong, J. Examining earliest identifiable timing of crops using all available Sentinel 1/2 imagery and Google Earth Engine. ISPRS J. Photogramm. Remote Sens. 2020, 161, 109–123. [Google Scholar] [CrossRef]
  46. Yang, J.; Huang, X. 30 m annual land cover and its dynamics in China from 1990 to 2019. Earth Syst. Sci. Data Discuss. 2021, 2021, 1–29. [Google Scholar]
  47. Konduri, V.S.; Kumar, J.; Hargrove, W.W.; Hoffman, F.M.; Ganguly, A.R. Mapping crops within the growing season across the United States. Remote Sens. Environ. 2020, 251, 112048. [Google Scholar] [CrossRef]
  48. Tao, J.-B.; Zhang, X.-Y.; Wu, Q.-F.; Yun, W. Mapping winter rapeseed in South China using Sentinel-2 data based on a novel separability index. J. Integr. Agric. 2023, 22, 1645–1657. [Google Scholar] [CrossRef]
  49. Vreugdenhil, M.; Wagner, W.; Bauer-Marschallinger, B.; Pfeil, I.; Teubner, I.; Rüdiger, C.; Strauss, P. Sensitivity of Sentinel-1 backscatter to vegetation dynamics: An Austrian case study. Remote Sens. 2018, 10, 1396. [Google Scholar] [CrossRef]
  50. Dietterich, T.G. Ensemble methods in machine learning. In Proceedings of the International Workshop on Multiple Classifier Systems, Cagliari, Italy, 21–23 June 2000; pp. 1–15. [Google Scholar]
  51. Rougier, J. Ensemble averaging and mean squared error. J. Clim. 2016, 29, 8865–8870. [Google Scholar] [CrossRef]
  52. Liu, W.; Zhang, H. Mapping annual 10 m rapeseed extent using multisource data in the Yangtze River Economic Belt of China (2017–2021) on Google Earth Engine. Int. J. Appl. Earth Obs. Geoinf. 2023, 117, 103198. [Google Scholar] [CrossRef]
  53. Tayo, T.; Morgan, D. Quantitative analysis of the growth, development and distribution of flowers and pods in oil seed rape (Brassica napus L.). J. Agric. Sci. 1975, 85, 103–110. [Google Scholar] [CrossRef]
  54. Tańska, M.; Ambrosewicz-Walacik, M.; Jankowski, K.; Rotkiewicz, D. Possibility use of digital image analysis for the estimation of the rapeseed maturity stage. Int. J. Food Prop. 2017, 20, S2379–S2394. [Google Scholar] [CrossRef]
Figure 1. The map of cropping patterns in the study area. The red, green, and blue represent the validation areas of Xuancheng City, Wuyuan County, and Nanchang City.
Remotesensing 17 01051 g001
Figure 2. The distribution of winter rapeseed points in the study area. (a) Validation area in Nanchang City, (b) Validation area in Xuancheng City, (c) Validation area in Wuyuan County.
Remotesensing 17 01051 g002
Figure 3. The flow diagram of identifying the peak flowering dates of winter rapeseed.
Remotesensing 17 01051 g003
Figure 4. Display of winter rapeseed planting areas in the study area. (ad) represent the specific distribution of winter rapeseed planting areas in the corresponding regions.
Remotesensing 17 01051 g004
Figure 5. Time-series plot of winter rapeseed spectral data (a) and NDYI index (b); the red dashed line indicates the actual peak flowering dates of the region, the shaded area represents the actual flowering period of the region, NDYI_mean refers to the average NDYI value of all sample points across different times, WG refers to the result of applying the Whittaker filter to the mean values of the sample points, and the area surrounding the index curve represents the confidence interval of the index for all sample points within the study area.
Remotesensing 17 01051 g005
Figure 6. Time-series plot of winter rapeseed SAR data. (a) Time-series plot of winter rapeseed VV data. (b) Time-series plot of winter rapeseed VH data. (c) Time-series plot of winter rapeseed CI data. (d) Time-series plot of winter rapeseed data. The red dashed line indicates the actual peak flowering dates of the region. The shaded area represents the actual flowering period of the region. The mean refers to the average value of all sample points across different times. WG refers to the result of applying the Whittaker filter to the mean values of the sample points, and the area surrounding the index curve represents the confidence interval of the index for all sample points within the study area.
Remotesensing 17 01051 g006
Figure 7. Time-series plot of winter rapeseed indices. (a) Time-series plot of winter rapeseed NBYVI data. (b) Time-series plot of winter rapeseed data with the red y-axis scale corresponding to the NDYI index, the green y-axis scale corresponding to the NBYVI index, and the blue y-axis scale corresponding to the VV index. The red dashed line indicates the actual peak flowering dates of the region. The shaded area represents the actual flowering period of the region. NBYVI_mean refers to the average NBYVI value of all sample points across different times. WG refers to the result of applying the Whittaker filter to the mean values of the sample points, and the area surrounding the index curve represents the confidence interval of the index for all sample points within the study area.
Remotesensing 17 01051 g007
Figure 8. The validation results using box plots for Nanchang City (a), Xuancheng City (b), and Wuyuan County (c). the box represents the set of monitoring results; The red dashed line indicates the mode of the peak flowering dates, and the shaded area represents the flowering period.Based on the actual peak flowering dates in each area, the identification results of the NDYI, NBYVI, and VV indices are evaluated for accuracy using RMSE and MAPE. As shown in Table 2, compared to the NDYI and VV indices, the VV index exhibits higher accuracy in the validation areas of Nanchang City and Xuancheng City, while the NDYI index shows higher accuracy in the validation area of Wuyuan County. In contrast to the aforementioned indices, the new index NBYVI demonstrates more accurate and stable identification of the peak flowering dates for winter rapeseed in all of the validation areas.
Remotesensing 17 01051 g008
Figure 9. The map of peak flowering dates in the winter rapeseed planting areas of the middle and lower reaches of the Yangtze River Basin (a) and the trend map of temperature (b).
Remotesensing 17 01051 g009
Figure 10. Fitting plot of peak flowering dates and average temperature in the middle and lower reaches of the Yangtze River Basin.
Remotesensing 17 01051 g010
Figure 11. Peak flowering date gradient map (a) and average elevation gradient map (b) for cities in the study area.
Remotesensing 17 01051 g011
Figure 12. Fitting plot of peak flowering dates and average elevation for cities in the study area.
Remotesensing 17 01051 g012
Figure 13. The map of peak flowering dates in the winter rapeseed planting areas of the middle and lower reaches of the Yangtze River Basin (a) and the trend map of peak flowering dates for winter rapeseed (b).
Remotesensing 17 01051 g013
Figure 14. The relationship between the peak flowering dates of winter rapeseed in the middle and lower reaches of the Yangtze River Basin and latitude.
Remotesensing 17 01051 g014
Table 1. Auxiliary data types.
Auxiliary Data TypesData ContentData Source
Land Cover Classification Data30 m Annual Land Cover Classification Data (CLCD) for China in 2019https://zenodo.org/records/4417810 (accessed on 15 May 2024)
Crop Planting Pattern TypeMaps of Cropping Patterns in China for 2015–2021https://figshare.com/articles/dataset/Maps_of_cropping_patterns_in_China_during_2015-2020/14936052 (accessed on 26 May 2024)
Temperature dataNational Climatic Data Centerhttps://www.ncei.noaa.gov/data/global-summary-of-the-day/archive/? C = M; O = A (accessed on 26 May 2024)
Crop Phenological Data2019 Xuancheng City Winter Rapeseed Peak Flowering Datesthe Xuan Cheng Municipal People’s Government (https://www.xuancheng.gov.cn/ (accessed on 3 July 2024))
2019 Wuyuan County Winter Rapeseed Peak Flowering Datesthe Wuyuan County People’s Government (http://www.jxwy.gov.cn/ (accessed on 3 July 2024))
2019 Nanchang City Winter Rapeseed Peak Flowering Datesthe Nan Chang Municipal People’s Government (https://www.nc.gov.cn/ (accessed on 3 July 2024))
Table 2. Accuracy evaluation of peak flowering dates.
Verification AreaRMSEMAPE
NDYINBYVIVVNDYINBYVIVV
Nanchang13.66726.23677.80360.13410.06700.0876
Xuancheng20.17586.21556.30460.21530.03420.0666
Wuyuan12.44756.501625.56340.09980.07510.2807
Disclaimer/Publisher’s Note: The statements, opinions and data contained in all publications are solely those of the individual author(s) and contributor(s) and not of MDPI and/or the editor(s). MDPI and/or the editor(s) disclaim responsibility for any injury to people or property resulting from any ideas, methods, instructions or products referred to in the content.

