Article

High-Resolution Sea Surface Target Detection Using Bi-Frequency High-Frequency Surface Wave Radar

1
Vlatacom Institute, 11070 Belgrade, Serbia
2
University of Belgrade, School of Electrical Engineering, 11120 Belgrade, Serbia
3
University of Belgrade, Innovation Center of the School of Electrical Engineering, 11120 Belgrade, Serbia
*
Author to whom correspondence should be addressed.
Remote Sens. 2024, 16(18), 3476; https://doi.org/10.3390/rs16183476
Submission received: 31 July 2024 / Revised: 8 September 2024 / Accepted: 16 September 2024 / Published: 19 September 2024

Abstract

:
The monitoring of the sea surface, whether it is the state of the sea or the position of targets (ships), is an up-to-date research topic. In order to determine localization parameters of ships, we propose a high-resolution algorithm for primary signal processing in high-frequency surface wave radar (HFSWR) which operates at two frequencies. The proposed algorithm is based on a high-resolution estimate of the range–Doppler (RD-HR) map formed at every antenna in the receive antenna array, which is an essential task, because the performance of the entire radar system depends on its estimation. We also propose a new focusing method allowing us to have only one RD-HR map in the detection process, which collects the information from both these carrier frequencies. The goal of the bi-frequency mode of operation is to improve the detectability of targets, because their signals are affected by different Bragg-line interference patterns at different frequencies, as seen on the RD-HR maps during the primary signal processing. Also, the effect of the sea (sea clutter) manifests itself in different ways at different frequencies. Some targets are masked (undetectable) at one frequency, but they become visible at another frequency. By exploiting this, we increase the probability of detection. The bi-frequency architecture (system model) for the localization of sea targets and the novel signal model are presented in this paper. The advantage of bi-frequency mode served as a motivation for testing the detectability of small boats, which is otherwise a very challenging task, primarily because such targets have a small radar reflective surface, they move quickly, and often change their direction. Based on experimentally obtained results, it can be observed that the probability of detection of small boats can also be significantly improved by using a bi-frequency architecture.

Graphical Abstract

1. Introduction

The localization of ships and sea traffic monitoring has always been a focus of coastal countries. This has been particularly pronounced in recent years, primarily due to security reasons. In this regard, a country needs to monitor its zone of interest that can practically be divided into two zones: territorial waters (up to 12 nautical miles from the sea coast) and the exclusive economic zone (EEZ), which extends up to 200 nautical miles from the sea coast. To monitor activities on a sea surface, radars operating in the microwave frequency band have been primarily used. However, they generally cover only the territorial waters, as they are based on direct propagation of waves. Unfortunately, many illegal activities can be carried out beyond the horizon, which is well beyond the detection range of these radars. In order to monitor the entire EEZ, over-the-horizon radars (OTHR) are used, especially those which operate in the high-frequency (HF) band. For this purpose, high-frequency surface wave radars (HFSWRs) are used, and they are based on the propagation of electromagnetic surface waves.
Although it is possible to generate and send various signals from the transmitter side of the maritime surveillance system, chirp signals are commonly used. One of the reasons is the better spectral efficiency achievable with this signal type. Therefore, it is of particular interest to review the literature dealing with frequency-modulated continuous wave (FMCW) systems, characteristics of the chirp signal and the way it is generated, sent and received, because continuous wave (CW) signal transmission mostly dominates the existing HFSWRs. Recognizing the importance of this field, it has also been the research subject of many researchers [1,2,3,4].
HFSWR systems have been the subject of intensive research for several decades, both for civil and military applications. The result of the research is the realization of several generations of these sea surveillance radars, which have been used very successfully for many years. Some of them are WERA and SECAR radars, as well as the radars belonging to national research organizations NIDAR and ONERA, and the company CODAR. However, this type of radar is still the subject of intensive research, especially from the aspect of algorithms for primary signal processing, as evidenced by a large number of published papers which are based on experimentally obtained results. It can be seen that the authors deal with different problems, such as optimal setting of system parameters, signal modeling at the receiving antenna array, detection and tracking of ships, analysis of various geometries of antenna arrays at the transmission and reception side of HFSWRs (monostatic, bistatic architecture), etc. Therefore, the importance of such systems is great, especially since there are a large number of practical applications [5,6,7].
The analysis of HFSWRs which operate at two frequencies (bi-frequency mode of operation) is of particular theoretical and practical interest [8,9,10,11,12,13]. This represents the motivation for the research and development described in this paper. The idea is to improve the detectability of targets of interest, especially for targets located in a Bragg-line on the range–Doppler (RD) map, which is formed within the primary signal processing. The position of the Bragg-lines depends on the frequency, so targets that were in a Bragg-line at one frequency will be visible and detectable at another frequency. Also, one of the tasks of this paper is to propose an architecture (system model) that will be used to localize sea targets (operation at a single frequency, as well as bi-frequency operation mode). In this case, it is possible to compare the results with an HFSWR operating at a single frequency in order to emphasize the performance improvements resulting from the use of the new system architecture. Many authors deal with bi-frequency system design, as presented in [14,15,16,17].
The papers related to HFSWRs with different geometries and other systems operating at multiple frequencies, such as synthetic aperture radar (SAR), microwave and millimeter-wave radars, are also of particular importance in order to see the broadest context of the topic we are talking about [18,19,20,21,22,23,24].
Multi-frequency HF is also used for ocean current and tsunami detection, as well as for the Bragg-scattering-based wave height estimation, as presented in [25,26,27,28,29].
Multi-frequency architectures for the localization of sea targets and corresponding primary signal processing explained in [30,31,32,33,34] served as a motivation for testing the detectability of small boats, which is otherwise a very challenging task, primarily because such targets have a small radar cross-section, they move quickly, and often change their direction. In this paper, one of the main goals is also to show the advantage of bi-frequency small boats detection.
In order to improve the performance of the HFSWRs, the key part is the primary signal processing in the time–frequency–spatial domain, including the impact of sea clutter and various types of interference, with the aim of determining the localization parameters (geographic coordinates, radial velocity) of the targets of interest. Therefore, it belongs to the category of multidimensional signal processing. The theoretical framework is represented by a 3D spectral analysis of time samples of the received signal resulting in the formation of a 3D cube in the range–Doppler–azimuth domain. Detection of targets is possible in a 3D cube or RDA map (range–Doppler–azimuth), but from the numerical complexity point of view, in order to work in real time, in most of the existing radars of this type, detection is usually realized in two steps. In most of the previously mentioned HFSWR systems, in the first step, using the Fourier transformation, a range–Doppler (RD) map is formed. Also, in most of HFSWRs, target detection is performed in the RD map (2D detection), using one or more variants of the CFAR (constant false alarm rate) detector. In the second step, the direction is estimated for the targets detected in the RD map using the classic single-snapshot beamformer. It should be noted that, in the first step, it is possible to create RA (range–azimuth) or DA (Doppler–azimuth) maps, and then, in the second step, evaluate the remaining third localization parameter; but from the point of view of the most effective suppression of sea clutter, the method with the formation of the RD map, in the first step, proved to be the most effective. The reason for this is that the effect of the sea (sea clutter) in the RD map manifests itself in the form of the so-called Bragg-lines, which are located at specific places in the RD map, depending on the operating frequency. Furthermore, it is necessary to investigate the potential of such algorithms in systems that work at multiple frequencies. Some papers are related to the dual-frequency HFSWRs and target detection based on the fusion of RD maps [35,36], whereas some of them are related to deep learning methods and convolutional neural networks (CNNs) [37,38]. These papers represent a motivation for the research activities and the formulation of the methods presented in this paper.
Additionally, algorithms for primary signal processing are the subject of intensive research in FMCW radars for the automotive industry, so the results and achievements in this area certainly contribute to the development of algorithms for primary signal processing in HFSWR systems. The authors of scientific papers, some of which are listed in [39,40,41,42,43,44,45], deal with high-resolution methods, which can be used in HFSWR systems. These papers also represent the motivation for research in the field of ship localization, using a high-resolution approach. Although they have been the subject of intensive research in previous years, such methods are seen in the future as the key methods to detect targets with a small radar crosssection, such as small-sized boats (up to 10 m long), drones, and unmanned aerial vehicles (UAVs), as well as for the protection of strategically important facilities, oil platforms, for the detection of illegal criminal activities at sea, land, air, etc.
In recent years, we also published several papers related to the high-resolution primary signal processing in HFSWRs [46,47,48,49,50,51]. The methods presented in this paper represent a logical continuation of our research activities, where we present high-resolution primary signal processing in a bi-frequency HFSWR. This paper contains a description of the algorithm, which is based on the high-resolution evaluation of the RD map (RD-HR) at every antenna in the receive antenna array using a multiple signal classification (MUSIC) algorithm, and a given number of frames in the selected integration period. Target detection is performed on the RD-HR map, and then azimuth estimation is also performed by a MUSIC-type algorithm, which is executed only for targets detected in the RD-HR map. The signal processing at two different frequencies represents a challenge. Experimental results obtained by processing signals from the HFSWR show the performance improvement of the bi-frequency mode compared to the single-frequency mode in order to reconstruct the ship’s trajectory, especially for small ships.
The main contributions of this paper can be classified as follows:
  • Bi-frequency HFSWR with integration of the RD maps from two frequencies into a single RD map on which target detection is performed. The idea of combining RD maps from two synchronous waveforms at different frequencies in HF skywave radars designed in the 1970s served as a basis for our solution. In the existing bi-frequency radars, the signal is separately processed for each subsystem that operates at one frequency. In this way, one RD-HR map is formed for each subsystem. Next, target detection from RD-HR maps is carried out separately in order to perform the fusion of the obtained results and to find a unique set of detections. However, the detection process is performed twice, so the next goal is to form a unique RD-HR map so that the detection of targets is performed only once. In this regard, the proposed method for RD map focusing and the improvement of the detection of ships moving in the Bragg-line zone represent a contribution.
  • The derivation of the signal model at the receiving antenna array, without some approximations that are common in the literature, such that there is an influence of the coupling between the range, Doppler, and azimuth domains that was presented in [46] and is adapted here. It is an originally derived signal model that cannot be found in such a form in the existing literature.
  • The detectability of small boats is a very challenging task. We provide experimentally obtained results that show the superiority of small-boat detection and trajectory reconstruction ability of the bi-frequency mode compared to the single-frequency mode. There were demonstrations of small-boat detection in the past. However, not much about these demonstrations can be found in the published literature, so these experimental results we provide are hopefully valuable to the research community.
The rest of this paper is organized as follows. Section 2 introduces the proposed bi-frequency system and signal model, used to generate results and to test the proposed method. In Section 3, we present a detailed algorithm description. We also explain a novel method for RD map focusing in order to obtain a unique RD map that can be used in the process of target detection. We discuss some of the experimental results in Section 4. Additionally, we discuss the results in Section 5 in the broadest context possible and show future research directions. Some concluding remarks are given in Section 6.

2. Bi-Frequency System and Signal Model

The prerequisite for talking about the primary signal processing in HFSWR systems, which is the focus of this paper, is that the complete radar system is properly designed. The whole process is based on the vertically polarized electromagnetic, waves which are sent from the transmitter side towards the sea and then reflected from the targets (ships).
Monostatic systems are the research focus, where the transmitter (Tx) and receiver (Rx) sides are approximately at the same geographical location (up to 1 km). The primary goal of using multiple frequencies is to improve the detectability of ships, if possible. Therefore, this section represents a kind of an introduction to the central part—primary signal processing, which is based on the signal and system model presented in this section.

2.1. Bi-Frequency System Model

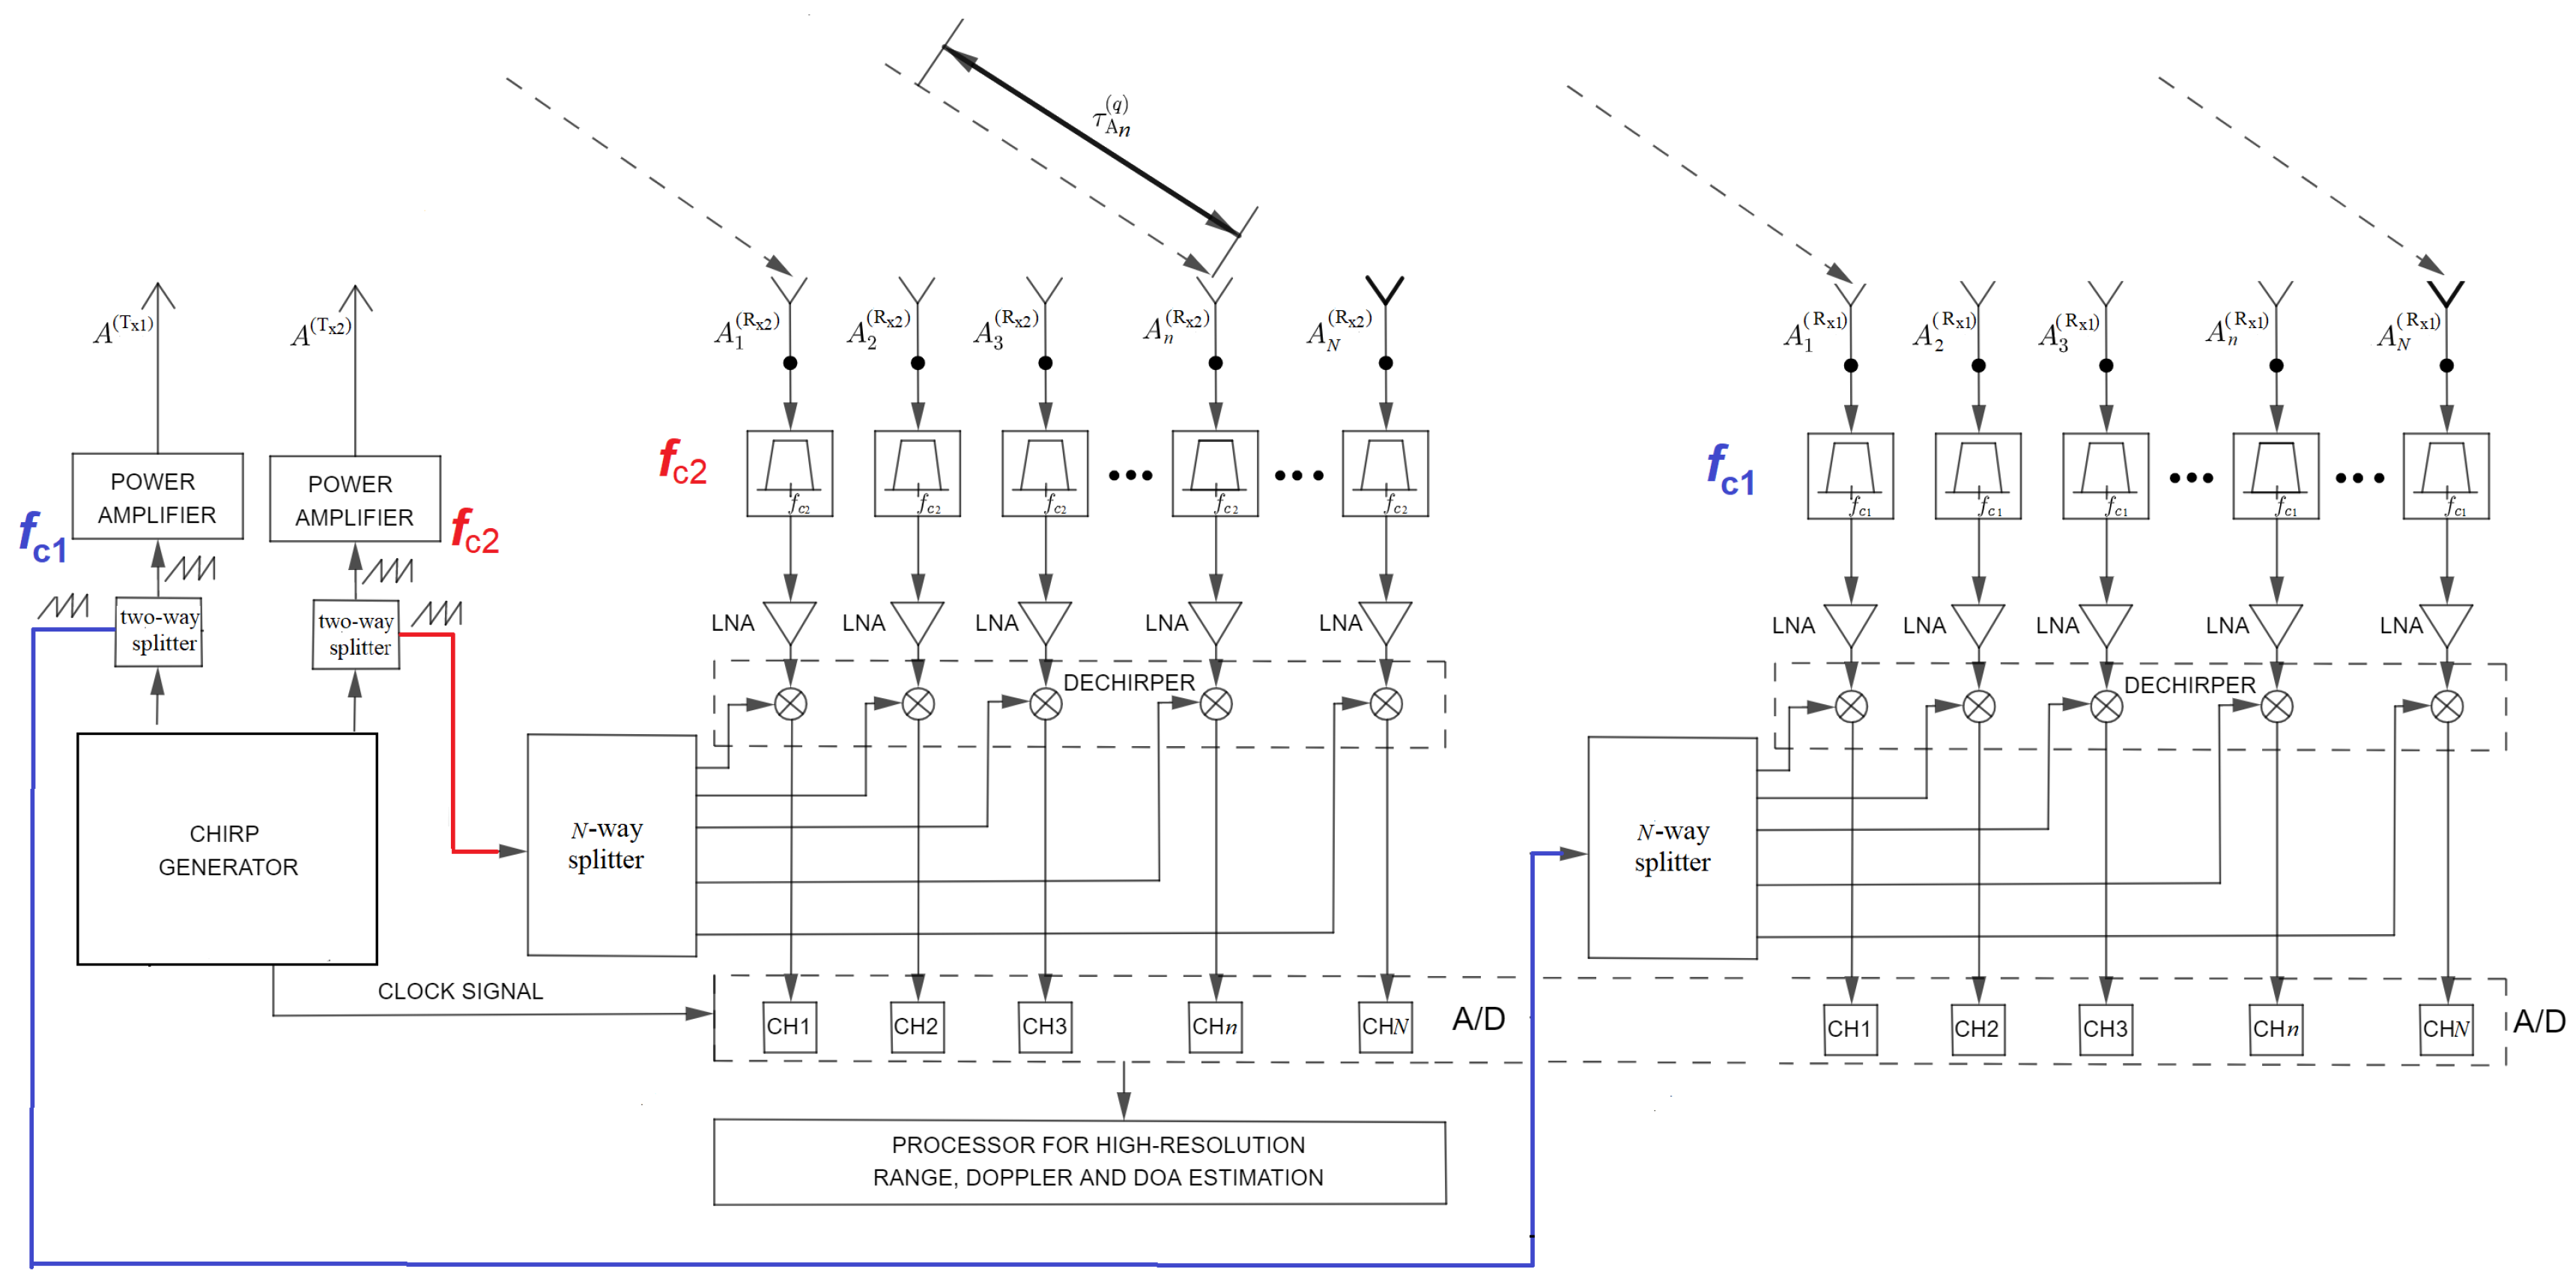
Figure 1 shows the block diagram of two monostatic HFSWRs operating at two different frequencies, f c 1 and f c 2 . The bi-frequency system model that is presented here also represents the basis for the formation of the model for the systems that work at more than two frequencies (multi-frequency systems). The system architecture is similar to the architecture of the system operating at one frequency, with certain modifications in each of the three main components (Tx antenna array, Rx antenna array, and transceiver equipment).
On the Tx side, a waveform generator is used to generate chirp signals at carrier frequencies f c 1 and f c 2 . The choice of the operating frequencies depends on the specific requirements and the required maximum distance of the targets that should be detected. As the operating frequency increases, the maximum detection distance decreases. On this specific test site, the bandwidth of the transmitted signal is 100 kHz and the chirp duration is 0.256 s. As can be seen from Figure 1, these chirp signals are fed to different amplifiers, where one amplifier is used for one pair of antennas. At this specific test site, a total of four antennas are in the Tx antenna array (two active and two passive antennas) and they are placed at the vertices of a rectangle. For this purpose, Yagi antennas, logperiodic antennas, or dipole antennas are commonly used. Tx antennas are marked in the figure as A T x 1 and A T x 2 , depending on the frequency. This is equivalent to a case in which there are two systems, where each of them operates at its own frequency. The usual transmission power is in the range of 500–1000 W. The waveform generator is also used to generate a chirp signal at a certain frequency that is used for the dechirper (one signal for one frequency), then to generate a test signal that is used to calibrate the receiving channels, and it can also be used to generate an external clock signal for the A/D converter, which is located at the output of the receiver. At the same time, it should be emphasized that combinations of different types of waveforms can be generated independently at the channels of the waveform generator.
The receiving antenna array on this specific test site consists of two linear subarrays with 16 antennas each, which are placed parallel to the sea shore, one behind the other. The field of view of the radar on this specific test site is ± 60 with respect to the MRA (main response axis) axis, which is perpendicular to the axis of the linear Rx antenna array. The reflected signal comes to the Rx site and it is then passed through a bandpass filter, which filters out noise and all other signals that do not belong to the frequency band of interest. First of all, for bandpass filters, it is necessary to define in which frequency band they work (two types of filters for two antenna subarrays). Dechirping is performed separately for each subarray in an identical manner to in the case of single-frequency systems. The signal acquisition is synchronized for all channels. In this case, the clock signal from the waveform generator is also used. In this way, signal samples from all antennas (I and Q branches) arrive at the input of the block for the primary signal processing, so they can be processed either separately (separately for each frequency) or together. This means that this system is practically equivalent to two separate (but mutually synchronized) systems with 16 receiving antennas each, operating at different frequencies, but it can also be viewed as a single system with 32 receiving antennas (planar antenna array). Rx antennas are marked in the figure as A n R x 1 and A n R x 2 , 1 n N , depending on the frequency.
The algorithm knows Rx antennas locations. They are placed at required locations as accurately as possible. The positioning errors are compensation by a calibration procedure. It is also preferable to place the transmitting antenna array on the same line that the receiving array is on. Additionally, it is necessary to place as much distance between the transmitting and receiving antenna array as the site permits, and it is preferable to have some obstacles in between (rocks, trees, etc.). The reason for all this is that the receiver does not go into saturation due to the existence of a very strong direct component. At the output of the dechirper, the direct wave appears as a sinusoidal signal close to the DC component, which is a problem. A direct component at the output of the dechirper increases the dynamic range of the input signal to the A/D converter. As one of the solutions to that problem, a notch filter is used at the output of the dechirper, which attenuates the direct wave, but also the reflected components from targets that are close to the radar (at distances up to about 20 km). This, in turn, reduces the dynamic range of the signal at the input to the A/D converter, helping the radar detect targets which are farther away. For the above reasons, the notch filter at the dechirper output degrades the detectability of close targets at distances of up to 20 km from the radar. Also, target detection and the estimation of localization parameters of targets is a very complex technical problem due to the presence of strong external interferences in the received signal, including unwanted echoes from the environment (sea clutter and ionospheric clutter). For the aforementioned reasons, the architectures of HFSWRs are designed to have the best possible sensitivity, the greatest dynamic range of the receiver, and the greatest possible system gain. Another way to mitigate the direct component influence is to form a zero in the radiation pattern of the transmitting antenna array in the direction of the receiving antenna array.
There is one receiver for each of the antennas. Each receiver contains both a dechirper and a low-pass filter. Amplitude and phase variations between individual receiving channels are measured and compensated by software, most often during system installation, and this procedure is called system calibration. In practice, differences in the physical lengths of the antenna cables contribute the most to these differences. Phase differences are used in the primary signal processing to equalize the receiving channels. This is not only about the calibration of the antenna cables, but about the calibration of the complete receiving channels (antenna cables, analog front end, including filters at the output of the dechirper, and A/D converter).
Each dechirper generates two analog quadrature signals (IQ branches), which pass through notch and low-pass filters and finally arrive to the A/D converter. The low-pass filter filters out the high-frequency components of the signal created in the dechirping process. The proposed system uses 24-bit A/D converters.
Figure 2 shows Tx and Rx antenna arrays, which are used for testing purposes in this paper.
The antenna positions are given in the Cartesian coordinate system, while algorithms for primary signal processing use the spherical coordinate system. The origin position is usually chosen to match the position of the first antenna in the receiving antenna array, but this is also not a mandatory condition. The position of each antenna is determined separately by using GPS, and, based on it, a matrix of antenna positions for the bi-frequency radar is formed. This principle is practically applicable for an arbitrarily chosen geometry of an antenna array.
Figure 3 shows the Rx antenna array in the xy plane, where the spatial arrangement of the antennas and their orientation in relation to north can be seen.
Of course, in the general case, when it comes to the localization and tracking of ships, a geographic coordinate system is used, where the localization parameters are determined: latitude and longitude, as well as the radial speed of the targets of interest. Since algorithms for primary signal processing are based on the Cartesian coordinate system, it is clear that the conversion from one coordinate system to another has to be performed.

2.2. Bi-Frequency Signal Model

In this section, the bi-frequency signal model is presented and described step-by-step. In the existing literature, simplified models are mostly used, where certain approximations are introduced. In [46], we derived a signal model, which is adapted here, where the coupling between all three domains of interest can be observed, which correspond to distance, Doppler frequency, and azimuth. The model includes factors that degrade the performance of such systems, such as interference, sea clutter, and additive noise, since the MUSIC algorithm, as the main representative of HR methods, requires a strict formulation of the signal model at the Rx antenna array in order to be applicable at all.
The concept of a bi-frequency system, as well as the modeling of the signal, reduces to single-frequency systems which are synchronized in time and phase, so they behave as a single system, with a greater number of antennas and receiving channels.
The basic idea is that the Tx sends towards the sea surface a periodic series of chirp signals at two different frequencies, f c 1 and f c 2 (both from the HF frequency band). Then, such signals are reflected from the targets (ships), and they are returned to the Rx site, with all the degrading effects that occur during transmission. The goal is to exploit the fact that degrading effects are frequency-dependent to further improve the detectability of targets.
The mathematical model of chirp signals, c i ( t ) , which are sent at the frequencies f c i , can be shown in the following form [46]:
c i ( t ) = e j 2 π ( ( f c i B 2 ) t + B 2 T t 2 ) ,   i = 1 , 2 .
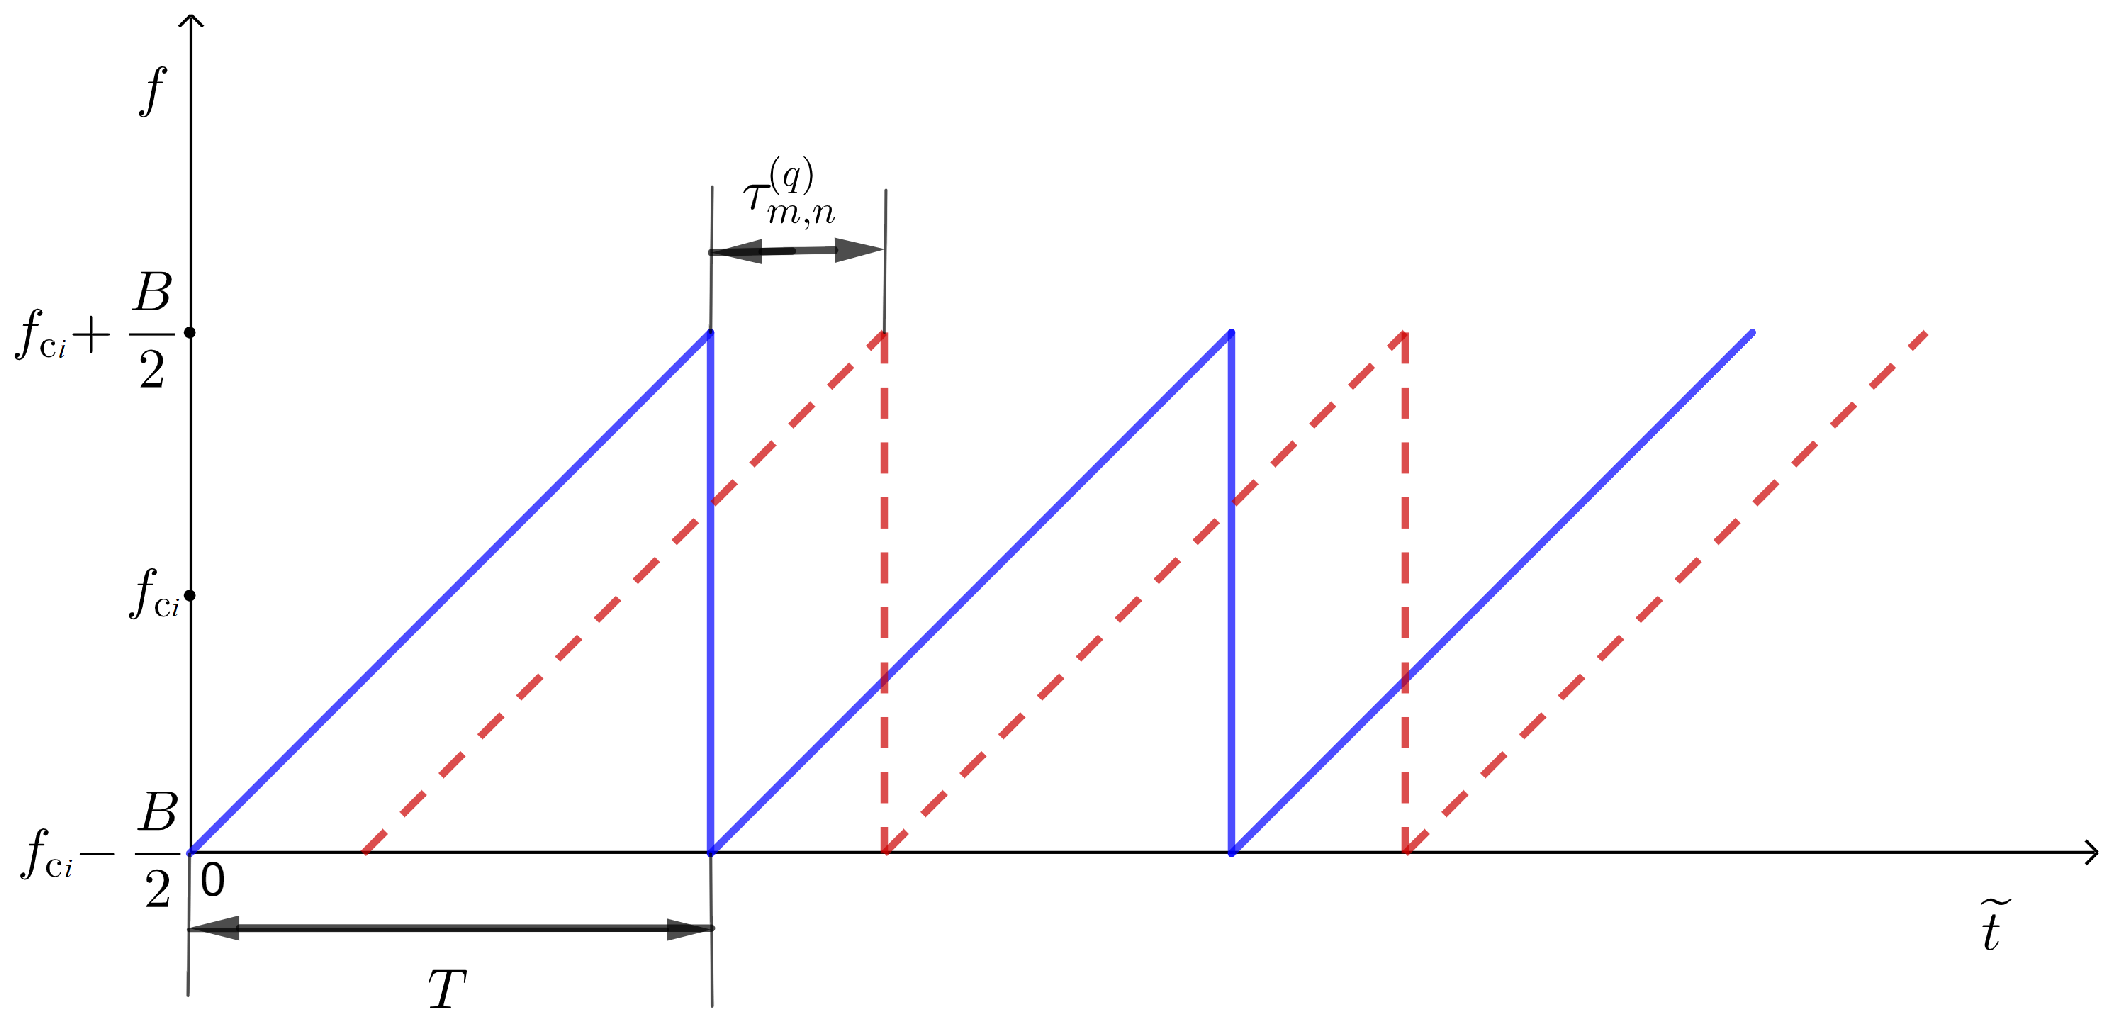
In the previous equation, the bandwidth of the transmitted signal is the same for both frequencies and it is denoted by B. Figure 4 shows the periodic sequence of chirps, with period T, which are sent from the Tx, where t is the time elapsed from the beginning of a chirp and t ˜ is a continuous time variable that spans the entire time axis.
For practical reasons, in addition to variables t and t ˜ , one more parameter can be formed:
m = t ˜ T ,
t ˜ = t + m T , m Z .
In these relations, m is actually the index (sequence number) of the chirp (known in the literature as slow time), while t refers to the time within the chirp (known as fast time). It is also necessary to note that t ˜ , t, and m are mutually dependent variables. Figure 5 shows the concept of chirp signal generation at the Tx side for a bi-frequency system.
Signals that are reflected from the targets arrive at the Rx antenna array, where the delays are different at individual antenna elements. It should be noted that the number of antennas is increased, compared to the case when the system works at one frequency. Therefore, a series of chirp signals arrives, not only at the first linear antenna array (as was the case with systems operating at one frequency), but on both linear antenna arrays. Let the number of antennas in these subarrays be N 1 and N 2 , respectively. In the special case, which is used within this paper, N 1 = N 2 = N . The time delay of the chirp signal from the Tx, which is reflected from the q-th target (located at a distance R q from the radar) and reaches the n-th antenna in the receiving antenna array, is defined as follows:
τ n ( q ) ( t ˜ ) = 2 R m ( q ) c + 2 v m ( q ) c t + τ A n ( q ) .
where c is the wave propagation velocity, R m ( q ) is the range to the target at the beginning of the mth chirp, and v m ( q ) denotes the radial speed of the target during the chirp (it is considered constant during a chirp). Also, attention should be paid to the variable τ A n q , which represents the relative delay of the signal at the n-th antenna in relation to the reference point of the receiving antenna array (usually, this is the first antenna position in the antenna array). This means that there is no second reference point (for the second linear array, for example), but all delays are calculated relative to the reference point of the first antenna array. Of course, the reference point can be chosen arbitrarily (the position of the first antenna in the first or second antenna array).
Figure 6 shows the model of Rx antenna array used in the bi-frequency HFSWR.
In relation to the reference point, the delay of the signal at the n-th Rx antenna of the first linear antenna array can be determined as τ A n ( q ) = ( n 1 ) d sin θ ( q ) / c , 1 n N , where the parameter d represents the distance between antenna elements in an equidistant Rx antenna array, and θ = θ ( q ) is the azimuth of the selected ship relative to the MRA axis of the linear antenna array.
For the second linear antenna array, which is placed parallel to the first one, the delay at individual antenna elements can be determined in a similar way, with the difference that the corresponding additional delay must be entered, for the reason that, now, the first antenna in the second antenna array is not a reference point. In Figure 6, it can be seen that this additional delay is actually a consequence of the longer travel path (marked by A A N + 1 ¯ ) such that the wave has to travel to arrive to the first antenna of the second antenna array, relative to the wave arriving at the reference antenna.
If the azimuth of the signal arriving to the Rx antenna array ( θ ) is known, all signal delays at individual antenna elements for the second array can be determined. The distance between the reference antenna (the first antenna of the first linear antenna array) and the first antenna of the second linear antenna array is determined as follows:
A 1 A N + 1 ¯ = x N + 1 2 + y N + 1 2 .
In the next step, it is necessary to determine the angle α in the following way:
α = 90 ( 90 θ ) arctan y N + 1 x N + 1 = θ arctan y N + 1 x N + 1 .
Additional delay τ d ( q ) can be determined based on the following relation:
τ d ( q ) = A A N + 1 ¯ c = A 1 A N + 1 ¯ sin ( α ) c .
The delays at individual elements of the second linear antenna array are calculated in the same way, except that they have an additional delay τ d ( q ) , producing
τ A n ( q ) = τ d ( q ) + ( n 1 N ) d 2 sin θ ( q ) / c .
where d 2 represents the distance between antenna elements of the second antenna array, and N + 1 n 2 N . The complete mathematical model of the signal, which was derived for a system operating at one frequency, will be used in this case as well. We explained such a signal model in [46]. In the next part, without any need to again derive all the expressions for the subsystem operating at the frequency f c 2 , only the necessary expressions will be listed in order to be able to form the signal model for the whole system in the appropriate way.
The following relations show the steps in the formation of a signal model at the dechirper output in the case of bi-frequency mode of operation. Therefore, we start with the signal model at the output of the dechirper for the system which operates at one frequency ( f c 1 or f c 2 ), where variable n represents the index of a selected antenna. In [46] it was already said that there are two cases.
In the first case, when τ m , n ( q ) < t < T , the signal at the dechirper output can be modeled in the following way [46]:
y n ( q ) ( t ˜ ) = a ( q ) e j 2 π R 0 ( q ) 2 t B c T 2 f c i B c × e j 2 π v ( q ) 2 f c i B c m T 2 m t B c × e j 2 π τ A n ( q ) B t T f c i + B 2 × e j 2 π τ A n ( q ) R 0 ( q ) 2 B c T × e j 2 π τ A n ( q ) v ( q ) 2 B m c × e j 2 π τ A n ( q ) 2 B 2 T .
In the second case, when 0 < t < τ m , n ( q ) , the signal at the dechirper output can be modeled as follows [46]:
y n ( q ) ( t ˜ ) = a ( q ) e j 2 π R 0 ( q ) 2 t B c T 2 f c i + B c × e j 2 π v ( q ) 2 f c i + B c m T 2 m t B c × e j 2 π τ A n ( q ) B t T f c i B 2 × e j 2 π τ A n ( q ) R 0 ( q ) 2 B c T × e j 2 π τ A n ( q ) v ( q ) 2 B m c × e j 2 π τ A n ( q ) 2 B 2 T × e j 2 π B t + f c i T .
In order to formulate a bi-frequency signal model, two frequency-dependent functions will be defined, as follows:
a ( q ) ( t ˜ , f c ) = a 2 ( q ) ( f c ) e j 2 π R 0 ( q ) 2 t B c T 2 f c B c × e j 2 π v ( q ) 2 f c B c m T 2 m t B c × e j 2 π τ A n ( q ) B t T f c + B 2 × e j 2 π τ A n ( q ) R 0 ( q ) 2 B c T × e j 2 π τ A n ( q ) v ( q ) 2 B m c × e j 2 π τ A n ( q ) 2 B 2 T ,
b ( q ) ( t ˜ , f c ) = 1 , τ m , n ( q ) < t < T e j 2 π B t + f c T , 0 < t < τ m , n ( q )
where either f c = f c 1 or f c = f c 2 will be used, depending on the selected antenna subarray. a 2 ( q ) ( f c ) R denotes the attenuation factor, which is now frequency-dependent. It differs by f c = f c 1 and f c = f c 2 . Now, it is possible to formulate an expression for the signal component, which originates from a certain frequency at the corresponding antenna subarray, as follows:
y n ( q ) ( t ˜ ) = a ( q ) ( t ˜ , f c ) b ( q ) ( t ˜ , f c ) .
It can be noted that when τ m , n ( q ) < t < T and when 0 < t < τ m , n ( q ) , the signal y n ( q ) ( t ˜ ) differs by the factor e j 2 π B t + f c T . Reflected signals from targets (ships) arrive at the Rx antenna array, which originate from chirp signals at different frequencies, but also different signals that are a consequence of one of the characteristic types of interference. Each subsystem is frequency-selective (thanks to resonant antennas, input RF filters, and filters at the output of the dechirpers), so the components originating from the carrier frequency intended for the other system are suppressed as well as other out-of-band interference.
Therefore, when 1 n N , the summed signal in the receiver can be expressed in the following form:
y n t ˜ = η n t ˜ + q a ( q ) ( t ˜ , f c 1 ) b ( q ) ( t ˜ , f c 1 ) .
In the second case, when N + 1 n 2 N , the summed signal in the receiver can be expressed in a similar way:
y n t ˜ = η n t ˜ + q a ( q ) ( t ˜ , f c 2 ) b ( q ) ( t ˜ , f c 2 ) .
All types of interference are modeled using the term η n t ˜ . The sum in the previous two relations refers to signals originating from real targets (useful signals). These components originate from the carrier that is intended for that receiver.
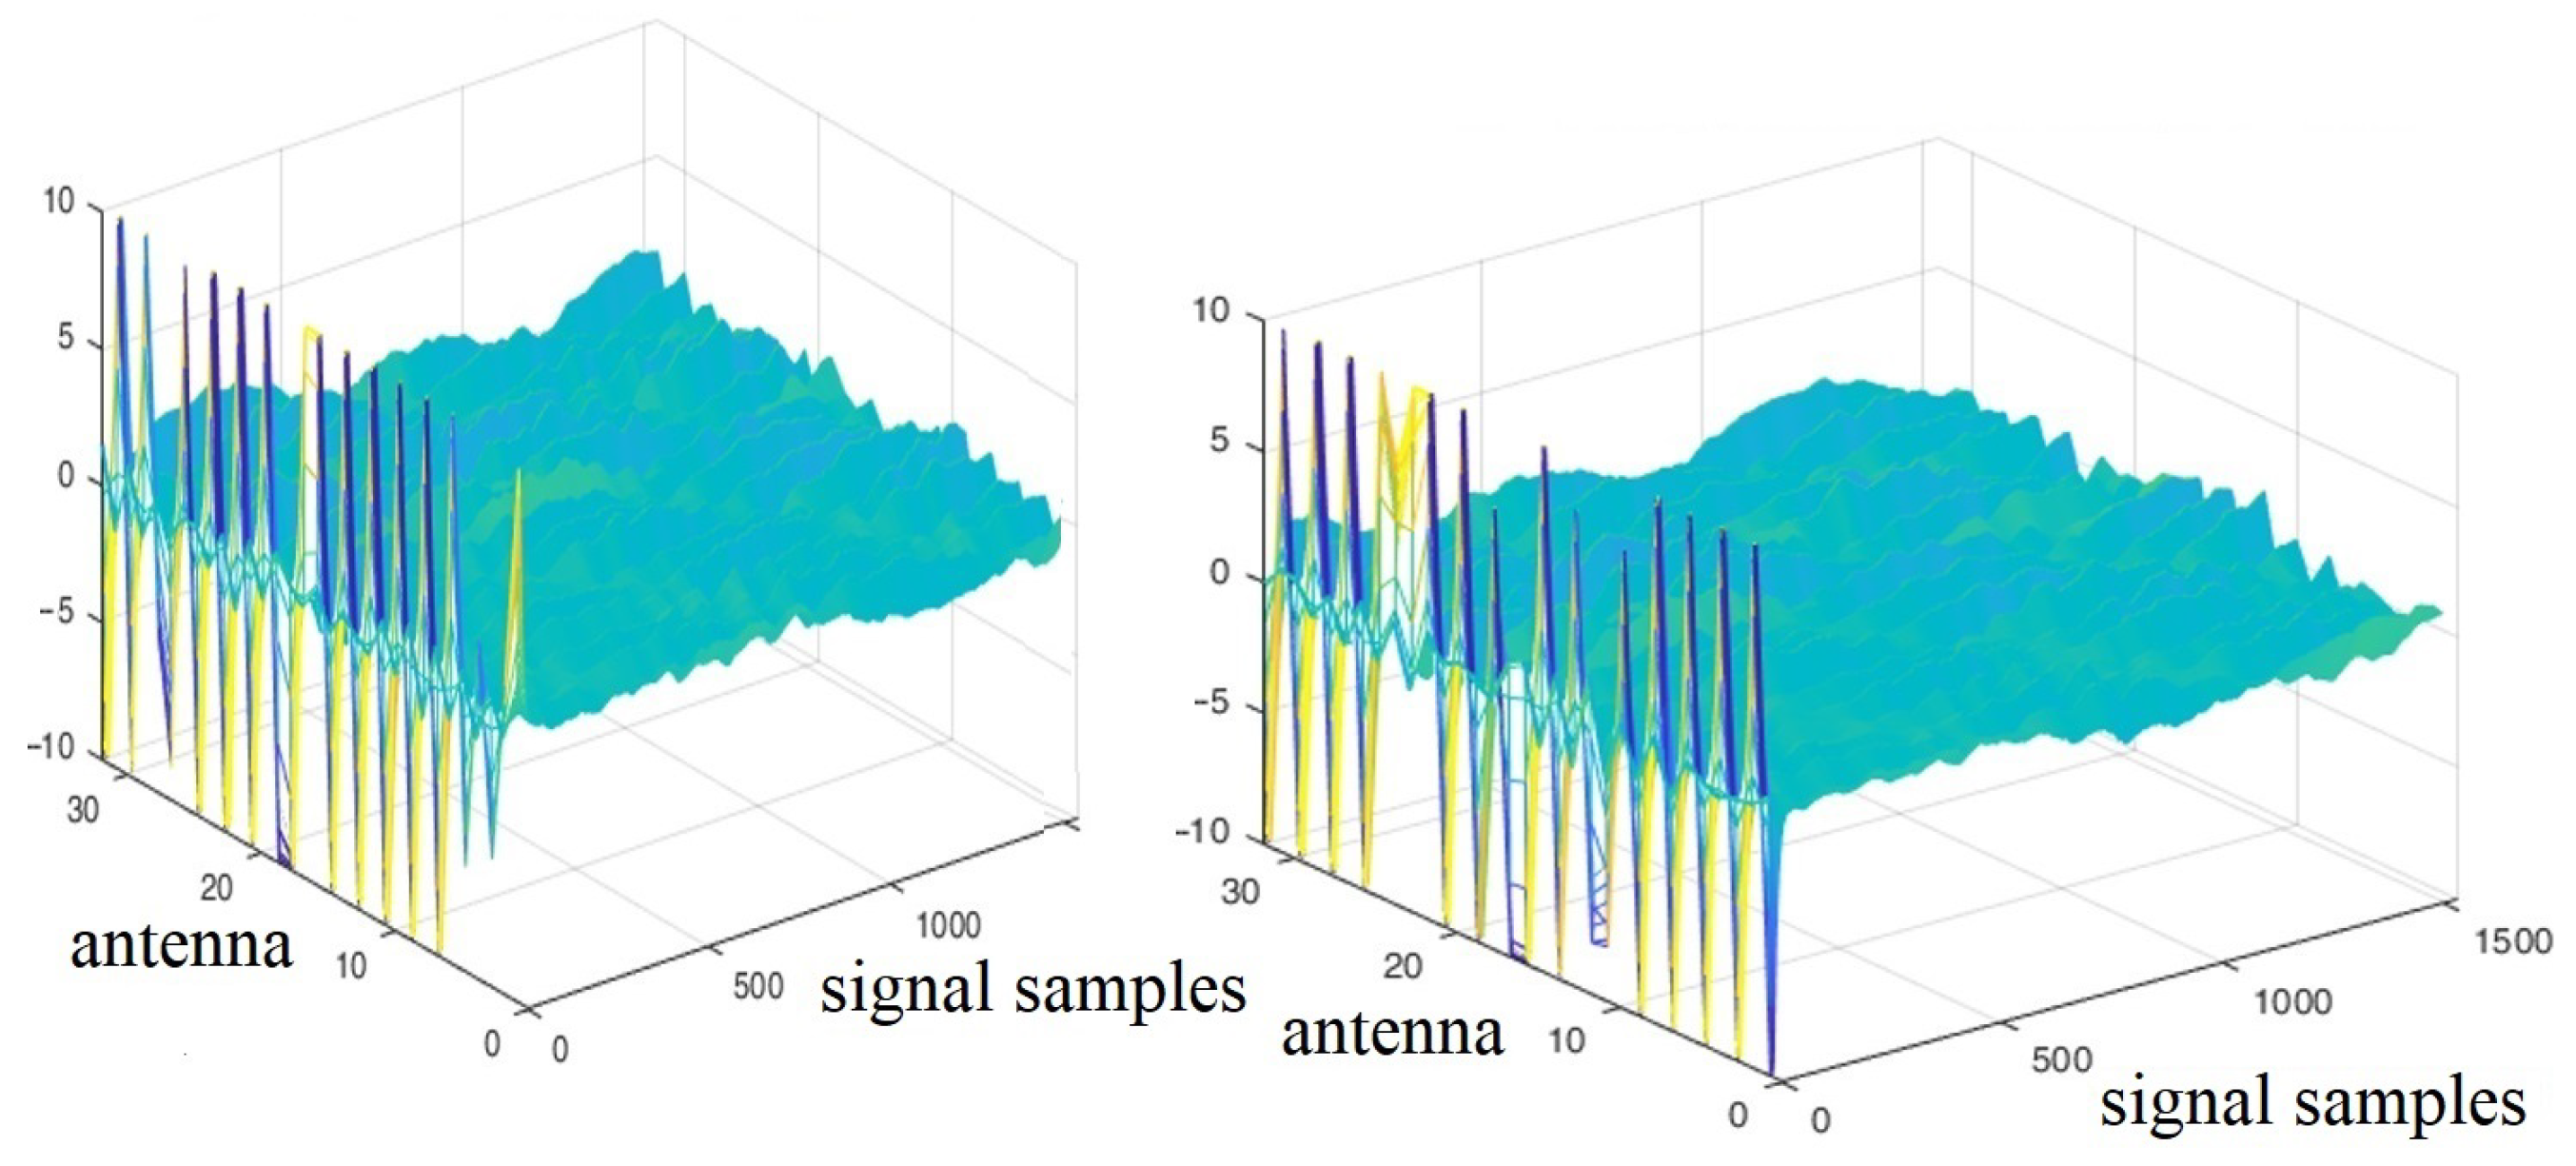
In the final step, the signal is digitized as in the case of a system operating at one frequency. In this way, it is possible to form a matrix model of the signal in order to see the effects of using the bi-frequency system architecture. Figure 7 shows an example of the appearance of the real and imaginary component of the signal at all antennas for a successfully synchronized bi-frequency system.

3. High-Resolution Bi-Frequency Primary Signal Processing in HFSWR

In this section, HR algorithms for primary signal processing in HFSWRs, that operate in bi-frequency mode, are defined. At the beginning, a short introduction to HR approach is presented, where the basic concepts related to the resolution by range, Doppler frequency, and azimuth are introduced. Concrete numerical data are also given, which show how many times the resolution has been increased for each of the domains, in relation to the resolution that is mainly used by some existing radars, such as WERA. The method of forming an RD-HR map is described, followed by the focusing of the RD-HR map in the case of bi-frequency mode of operation, target detection on the RD map, and HR azimuth detection.
Note that this bi-frequency radar architecture allows the signal processing to be performed either separately for each of the antenna subarrays or jointly for all of the antennas. This is exactly the reason why the RD map focusing procedure shown in this section is very important.

3.1. Introduction to High-Resolution Methods

Because we are talking about high-resolution primary signal processing and its advantages, it is necessary to define resolutions in all three domains. Range resolution is defined as the smallest distance between two resolvable targets along the range dimension which are at the same azimuth and Doppler frequency. If this distance is less, the radar will see only one target. After applying the fast Fourier transform (FFT) to the time samples of the signal at the output of the A/D converter, a chirp signal is obtained in the frequency domain. The distance between the two spectral components corresponds to the distance resolution, given by
Δ r = c 2 B .
Although increasing the chirp bandwidth can improve the range resolution, this is not always possible because of the occupancy of the RF spectrum. The idea of HR methods is to provide better range resolution for the same B. High-resolution properties within this paper will be achieved in the other two domains (Doppler frequency and azimuth domain), which means that the algorithms will be of high resolution in these two domains, and will only be computationally high resolution in the third domain (range domain). This will be achieved by calculating the FFT at a larger number of points. However, that does not mean that the targets in this domain will be resolvable within the so-called Rayleigh resolution cell by range within two spectral components. It just means that the spectrum of the signal will be calculated over a finer grid, which will certainly be used later when target detection is performed on the RD map. We will present the results using the algorithms where the range resolution will be four times higher than the resolution used by some of the existing radars, such as WERA.
In the second domain, Doppler frequency resolution is determined in the following way:
Δ f d = 1 T N d ,
where the parameters N d and T represent the number of points for which the Doppler frequency is calculated (in one coherent period of integration) and the chirp duration, respectively. The Doppler frequency can have both a positive and a negative value, depending on whether the targets are moving away from or approaching the radar, and their range is within the following limits:
| f d | < 1 2 T .
In this paper, the resolution according to the Doppler frequency with which the criterion function was calculated is four times higher than the resolution used by the WERA radar. Here, the high-resolution MUSIC method will be used, instead of the FFT transformation, in order to create a high-resolution RD map, which will be discussed more in the next subsections.
Azimuth resolution refers to the possibility of separating two targets, which are located at different angles in relation to the radar. It is actually the minimum value of the angle between two targets of interest, so that they are resolvable and detectable. If the targets are at a smaller angular resolution, the radar will detect only one target. Azimuth resolution can be improved by increasing the Rx antenna array aperture. For systems that work at one frequency, a total of 16 antennas will be used in the Rx antenna array, while up to 32 antennas will be used in the bi-frequency system. Within this paper, the azimuth resolution will be five times higher than the resolution used by the WERA radar.
The importance of increasing the resolution in HFSWRs is great, because it enables the maximization of the detectability of targets in all three domains as well as better separation of targets in case they are located close to each other. Table 1 shows the resolution improvement of the proposed high-resolution algorithm for primary signal processing in HFSWRs, compared to WERA. These improvements were obtained based on the experimental results.

3.2. High-Resolution Bi-Frequency Methodology Approach

In existing HFSWR systems, the primary signal processing belongs to the category of multidimensional signal processing in the time–frequency–space domain, where 3D spectral analysis of the time samples of the received signal is performed. Figure 8 shows the complete block diagram of high-resolution primary signal processing in the bi-frequency HFSWR.
With most existing radars, a 3D cube is obtained in the range–Doppler–azimuth domain, using a 3D Fourier transform. The key limitations of the application of the Fourier transform for the formation of a 3D cube are related to the resolution properties of the Fourier transform, which are determined by the duration of the observation intervals in the fast domain (the duration of the chirp signal), the duration of the observation intervals in the slow domain (the integration period), and the number of samples in the spatial domain (the number of antennas in the array). In other words, the key problem of applying the Fourier transform is related to the resolvability of spectral components of the signal within the Rayleigh resolution limit. By developing HR methods, we can achieve better separation of peaks in the 3D cube for the same duration of observation intervals in the fast, slow, and spatial domain.
The limited application of high-resolution algorithms in HFSWR systems is mainly related to numerical complexity. Since real-time operation is required, and such algorithms are very numerically demanding, their execution in practice can be several times longer than the required real time. This represents a problem, but also a challenge, on the other hand, to propose a suitable methodology and optimize the algorithms so that they are applicable in real time [51]. The answer to why high-resolution algorithms are so numerically complex lies in the calculation of eigenvectors and the calculation of criterion functions with good computational resolution. Also, the formation of the covariance matrix, which is the basis of the high-resolution MUSIC algorithm, requires several vectors with signal samples (multiple snapshots), unlike the FFT transform, which is applied to a single vector with signal samples (one snapshot).
The formation of numerically efficient high-resolution algorithms is actually a key challenge. The idea is that the high-resolution algorithm in the 3D domain is executed in two steps. The adopted methodology refers to the determination of the RD map in the first step (2D domain), and then the azimuth determination (1D domain). The reason why this particular choice was made, by different domains, lies in the fact that the effect of the sea (sea clutter) is best grouped on the RD map. In that case, the effect of the sea is expressed in the form of the so-called Bragg-lines. Therefore, it is easier to localize and suppress them using appropriate methods.
At the beginning of the signal processing, it is necessary to form a 3D matrix with complex signal samples from the output of the Rx channels. Then, a high-resolution RD map is formed, which we will call RD-HR. It is actually a 2D matrix that contains all the information about the ships, but without their azimuth dimension (only their distance from the radar and Doppler frequency). This is one of the key steps in the primary signal processing, for the reason that, from the point of view of detectability of targets, it greatly affects the performance of the radar, and, on the other hand, it is the most computationally demanding, which is also important, but from the aspect of practical implementation. RD-HR maps are formed separately for each antenna in the Rx antenna array. Because we are talking about the bi-frequency HFSWR, we also propose a new focusing method allowing us to have only one RD-HR map in the detection process, which collects the information from both these carrier frequencies. In other words, we average RD maps across only antenna subarrays, and then the focusing method is performed to obtain a unique RD-HR map. Target detection is performed on that unique map, and then the high-resolution azimuth estimation is performed only for these targets detected on the RD-HR map.

3.3. The Formation of the High-Resolution RD Map at Two Frequencies

The three-dimensional matrix with the acquired complex time samples of the signal from the I / Q branches of the receiving channels, after the dechirper, in the signal segment used for analysis, will be denoted by Y C M × P × N . Here, M denotes the total number of acquired frames in one integration period, which is used for signal processing, N is the number of antennas in the Rx antenna array, and P denotes the number of time samples within one frame. In practice, P and N are predefined values, and M corresponds to the integration period and can be chosen arbitrarily at the beginning of the primary signal processing. This value, in the following text, will be called the segment length.
The complete process for RD map formation is described in more detail in [46,49]. Here, a short overview will be presented in order to highlight the RD map formation for the system operating at two frequencies:
  • First, the FTT transform is performed for vectors with P complex signal samples at the n-th antenna in the m-th frame for all frames m = 1 , 2 , , M , and all antennas n = 1 , 2 , , N , resulting in the formation of a three-dimensional matrix S C M × P × N with complex signal spectrum samples. In this step, the Blackman–Harris window must be applied.
  • Next, while forming the RD map, the Blackman–Harris window is applied because of the disadvantage of the Fourier transform related to the existence of side lobes of the spectrum, which complicates the detectability of lower-level signals in the presence of higher-level signals. This windowing function is used because it suppresses sidelobes better than other windowing functions.
  • By adding zeros to the vectors with signal samples, we can achieve better computational, but not actual, resolution when applying the FFT transform. Therefore, the proposed algorithm for the formation of the RD-HR map is computationally of high resolution in the range domain.
  • The matrix with the FFT samples of the signal is expanded by the next L frames, so that the covariance matrices can be formed later. These additional frames are practically a part of one segment used for signal processing. The segment length is denoted by M.
  • The same FFT sample is located along all frames and it is used for covariance matrix formulation.
  • Finally, it is necessary to decompose the covariance matrix and form the criterion function, i.e., the RD-HR map.
  • New results are generated after 128 frames (approximately 32 s).
The high-resolution MUSIC algorithm is used in order to form the criterion function of the RD map:
P MUS RD ( μ , p , n ) = 1 a μ ( μ ) H E p , n .
where the parameter μ denotes the normalized Doppler frequency in radians per frame. The parameter p represents the range index of the RD map, p { 1 , 2 , , M P } . Here, M P is the dimension of the RD-HR map by range (number of rows of the RD-HR map). In the previous relation, E p , n C M × ( M K ) is the noise subspace matrix of the covariance matrix C p , n . The parameter K is a parameter of the MUSIC-based algorithm, which represents the boundary between the signal subspace and the noise subspace. This parameter is a critical factor, because it affects the performance of high-resolution algorithms. It can be determined by using some of the existing methods (AIC, MDL), as explained in [52,53,54], or it can be determined empirically, based on the testing of covariance matrices of real conditions and the comparison with automatic identification system (AIS) data. In [48], we proposed a new method for the determination of the parameter K, which is a graphically-based method using sorted eigenvalues of the covariance matrices to find inflection points in the curve consisting of these eigenvalues.
The vector a μ ( μ ) C M × 1 represents the equivalent steering vector formulated in the normalized domain of Doppler frequencies, as follows:
a μ ( μ ) = 1 , e j μ , , e j μ ( M 1 ) .
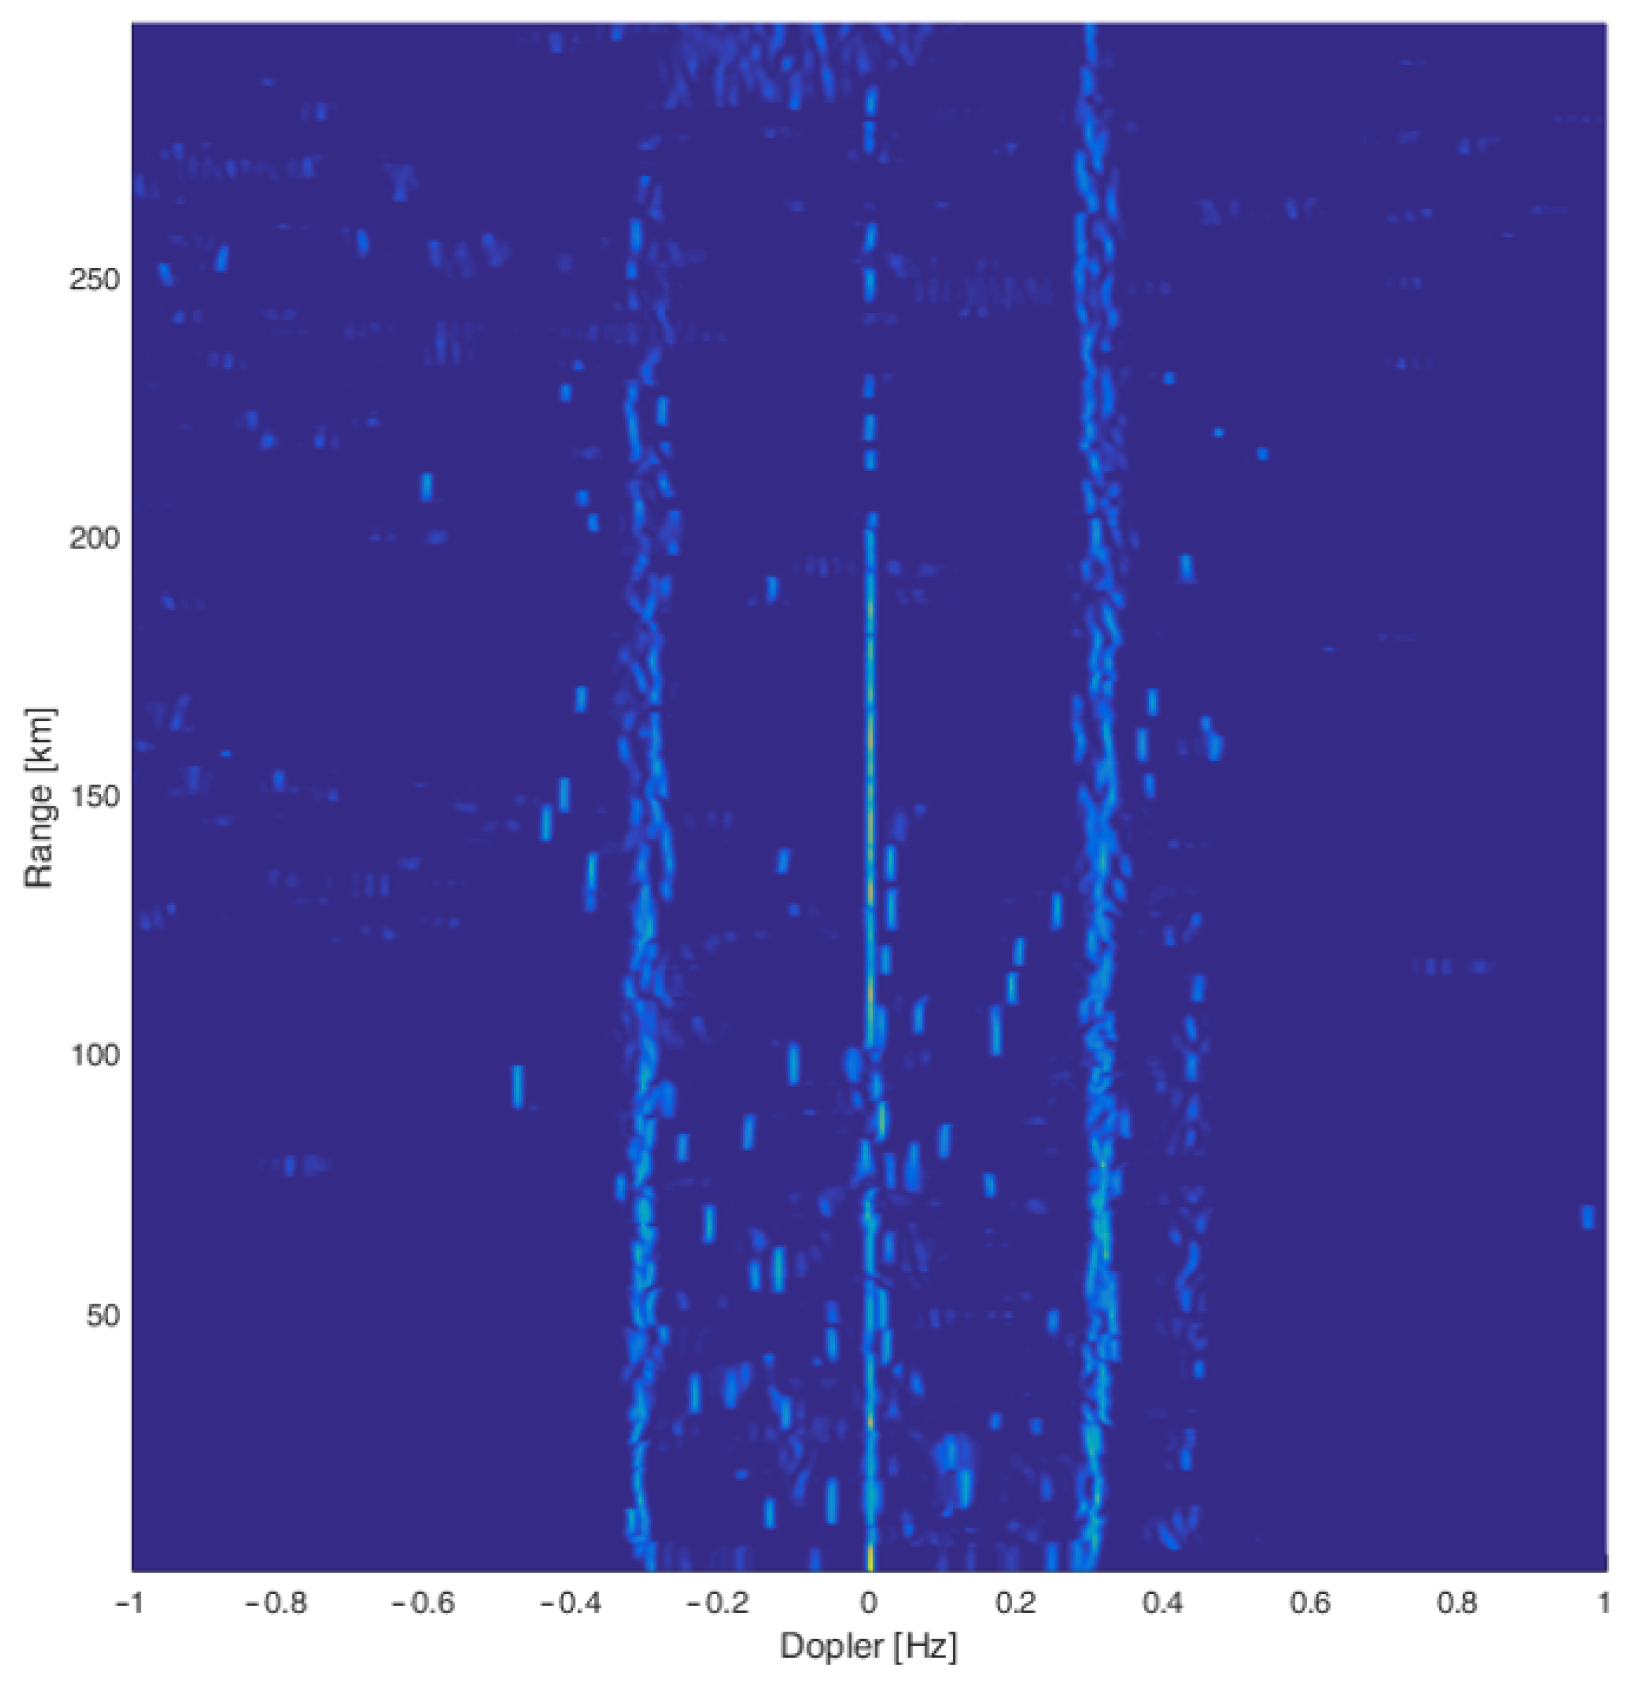
Note that parameter μ is different for different frequencies f c , so the RD map appearance will also be different for the two subsystems. Figure 9 shows an example of the appearance of a high-resolution RD map at 9.2 MHz.
On the RD map, moving and stationary targets, sea clutter, various types of interference, etc., can be detected. All narrow peaks, which can be seen from the image and which are not located at zero Doppler frequency on the RD-HR map, represent potential moving targets (potential, because some of them are false alarms). They can be on either side of the zero Doppler frequency, depending on whether the ships are approaching the radar or moving away from the radar. Targets at zero Doppler frequency are either stationary or have zero radial velocity. The vertical lines, which are observed around the frequencies ± 0.3 Hz , represent the Bragg-lines, i.e., the influence of sea clutter. It has already been emphasized that this method of primary signal processing is suitable, from this point of view, because the effect of the sea is localized in precisely determined places on the RD-HR map, but there may be a problem if the ship is located exactly on the Bragg-line, which makes it difficult or completely impossible to detect targets. This represents a motivation for research activities in the formulation of a focused RD-HR map, which leads to the radar performance improvement.

3.4. A Method for the Focusing Bi-Frequency RD Maps in HFSWR

In high-resolution primary signal processing presented in this paper, the formation of the RD-HR map plays a key role, because the performance of the entire radar system depends on its estimation. From the RD-HR map, in the target detection process, the distance of the targets (ships) from the radar is determined, as well as their Doppler frequencies, based on their radial speeds. It is well known that the Doppler frequency of a target increases with the operating frequency as f d ( q ) f c , whereas Bragg-line frequency increases with the operating frequency as f B f c . This means that the Doppler frequency for one target, which is detectable on the RD-HR map at one frequency, will differ from the Doppler frequency for the same target in the case of operation at another frequency.
Based on the Doppler frequency of the q-th target, f d ( q ) , the radial velocity of the target can be determined in the following way:
f d ( q ) = 2 v ( q ) f c / c
However, the normalized Doppler frequency is often used and we will use it in subsequent analyses, namely, μ q = ( 2 π T ) 2 v ( q ) f c / c .
Figure 10 shows the methodology that is mainly used in the existing HFSWRs in the case where two operating frequency are used, as well as the proposed methodology, in order to have better detectability of targets and less complex signal processing, which is important in real-time systems. The differences between dual-frequency systems and bi-frequency systems are explained, too.
In the existing HFSWRs that operate at two frequencies, the signal processing is performed separately for each subsystem that works at one frequency. In this way, one RD-HR map is formed for one subsystem. By averaging RD-HR maps across first N antennas, a unique RD-HR map for the first subsystem is obtained. An identical procedure is performed for the second linear antenna array, for the subsystem operating at a different frequency. As a result of such signal processing, two RD-HR maps are obtained, one for each frequency. Furthermore, the process of target detection from RD-HR maps is carried out separately, in order to perform the fusion of the obtained results and to find a unique set of detections. It should be emphasized that averaging the RD-HR maps across all antennas is impossible, because in that way, wrong detections would be obtained because Doppler frequencies differ for both cases, but, at the same time, the detected distances remain the same (for the same detected target). Although this method of signal processing is very efficient, primarily from the point of view of detectability of targets, the detection process is performed twice, which is not a good solution.
The next goal is the formation of a unique RD-HR map, so that target detection is performed only once. Also, the complexity of this procedure should not be greater than the one of the dual-frequency system. In this way, the performance of the algorithm would not be impaired in terms of the required time for their execution on the same hardware platform.
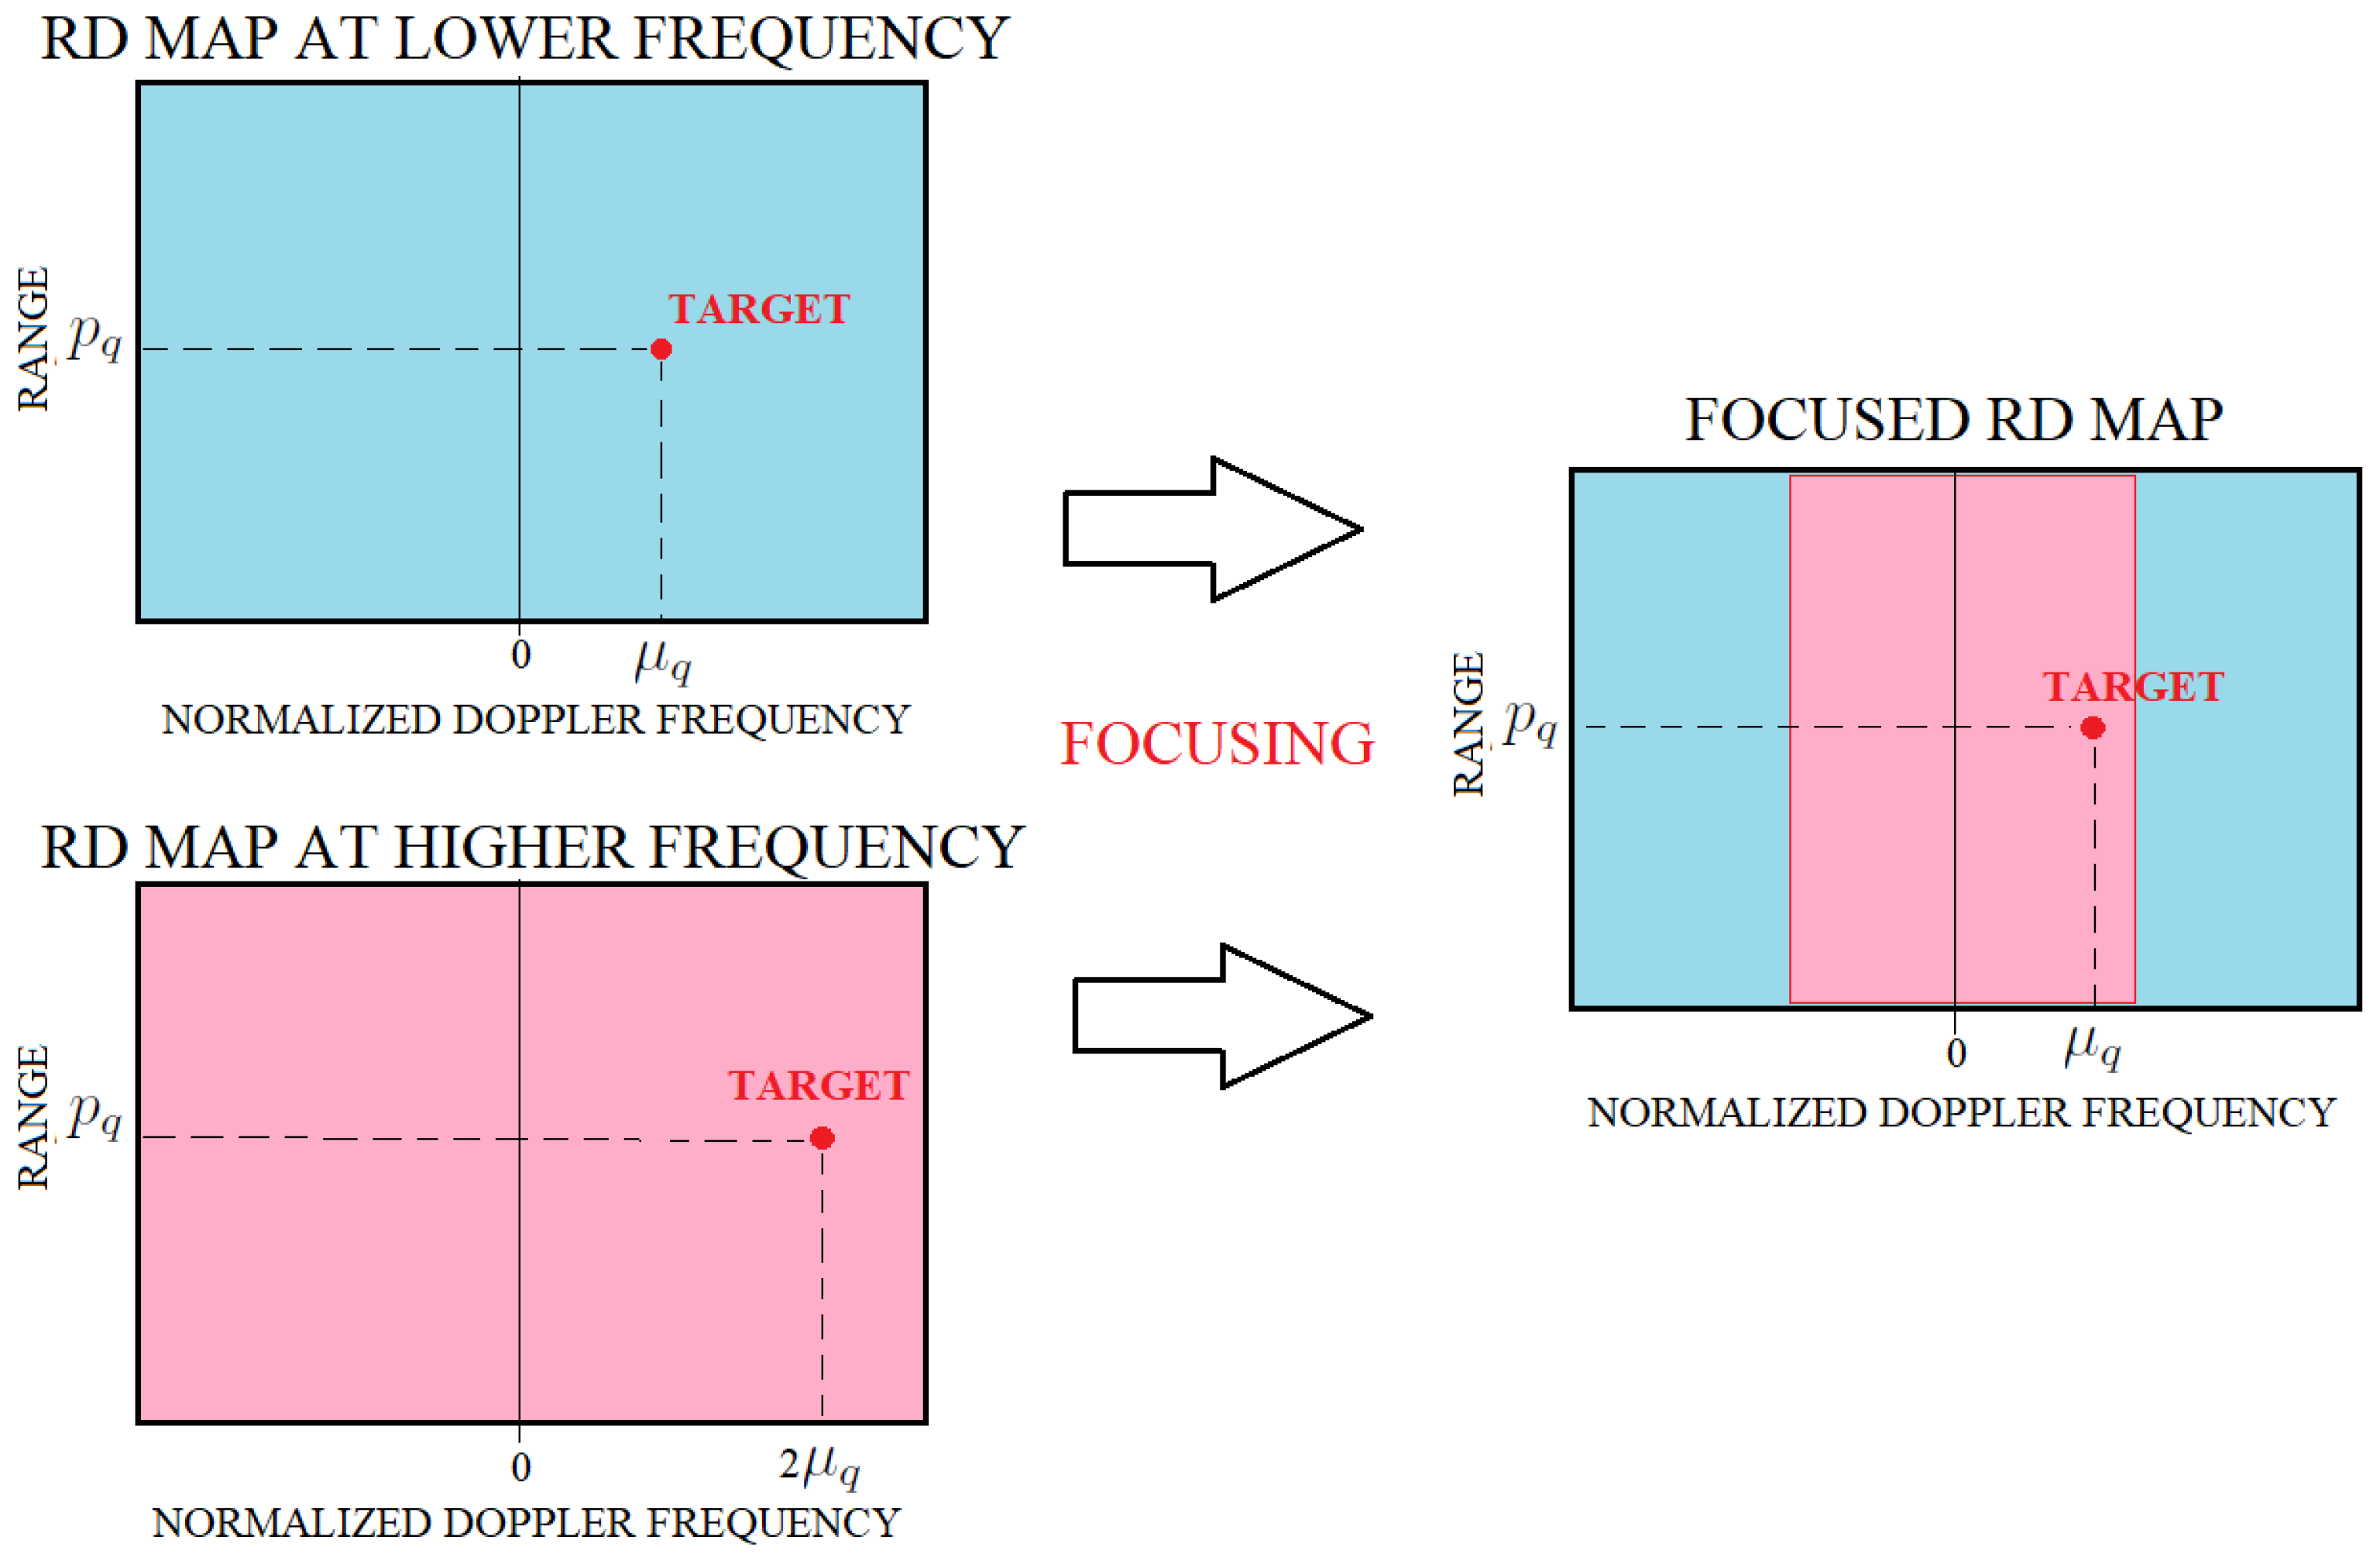
In the following part, the method for focusing RD maps will be presented in order to obtain a unique RD map. Figure 11 shows how the same target appears on RD maps for different operating frequencies, as well as how that target appears on a focused RD map.
Since Doppler frequencies of targets are lower at the lower operating frequency, an averaged RD-HR map from the first N antennas (low frequency, f c 1 ) will be selected as a base for another RD-HR map overlapping (higher frequency, f c 2 ), but adjusted to the frequency f c 1 . This procedure is called the focusing of RD-HR maps.
Let the matrix P ( 1 ) represent the criterion function matrix of the averaged RD-HR map ( P MUS RD ), for the first frequency f c 1 . Similarly, let the matrix P ( 2 ) be the criterion function matrix of the RD-HR map for the second frequency f c 2 . Parameters M P and N d are the dimensions of the RD-HR map by distance and Doppler frequency (number of rows and number of columns of the matrix) and they are the same for both averaged RD-HR maps. The indices of the rows and columns of the matrices P ( 1 ) and P ( 2 ) are denoted by i and j, i { 1 , 2 , , M P } , j { 1 , 2 , , N d } . The elements of the matrix P ( 1 ) will be denoted by p i , j ( 1 ) , and the elements of the matrix P ( 2 ) by p i , j ( 2 ) . Since the Doppler frequency can have both positive and negative values, depending on whether the targets are moving away from the radar or approaching the radar, their range is within the following limits: | f d | < 1 2 T . Next, it would be convenient to define appropriate indices for the Doppler frequency k = j N d + 1 2 , for each j, which indicate whether any frequency is positive or negative, in the following way:
k N d + 1 2 , N d + 1 2 + 1 , , 0 , , N d + 1 2
In actuality, it is a normalized frequency with a resolution Δ f d and it has always an integer value. The complete axis according to the Doppler frequency can be expressed as f k = k Δ f d , ( k ) .
The corresponding values for the normalized frequencies k will be the same for both RD-HR maps. In the next step, it is necessary to define the ratio of frequencies, which are used in the bi-frequency mode of operation, in the following way:
G = f c 2 f c 1 , f c 2 > f c 1 .
In order to perform the focusing of the RD-HR map from higher frequency to lower frequency, the corresponding value of the normalized Doppler frequency ( m R ) for the RD-HR map at higher frequency has to be scaled with the factor G, that is,
m N d + 1 2 G , N d + 1 2 G + 1 , , 0 , , N d + 1 2 G .
From this relation, it is clearly observed that the range of newly formed normalized Doppler frequencies is smaller, but the number of points at which Doppler frequencies are determined remains the same. This means that it is necessary to focus N d columns of the matrix P ( 2 ) on at most the N d G column of the matrix P ( 1 ) , where · denotes the ceil operator.
The focusing process can be divided into two parts. The first part refers to the case when m > 0 (positive Doppler frequencies) and when m < 0 (negative Doppler frequencies), and the second case when m = 0 (Doppler frequencies related to stationary targets and targets with zero radial velocity).
If the j 2 -th column of the matrix P ( 2 ) is focused on the j 1 -th column of the matrix P ( 1 ) , in order to obtain a combined matrix P ( Z ) of the same dimensions, where j 1 and j 2 represent a specific index from the set of indices j, the focusing is performed in the following way:
[ P ( Z ) ] i , j 1 = max [ P ( 1 ) ] i , j 1 , [ P ( 2 ) ] i , j 2 , 1 i M P
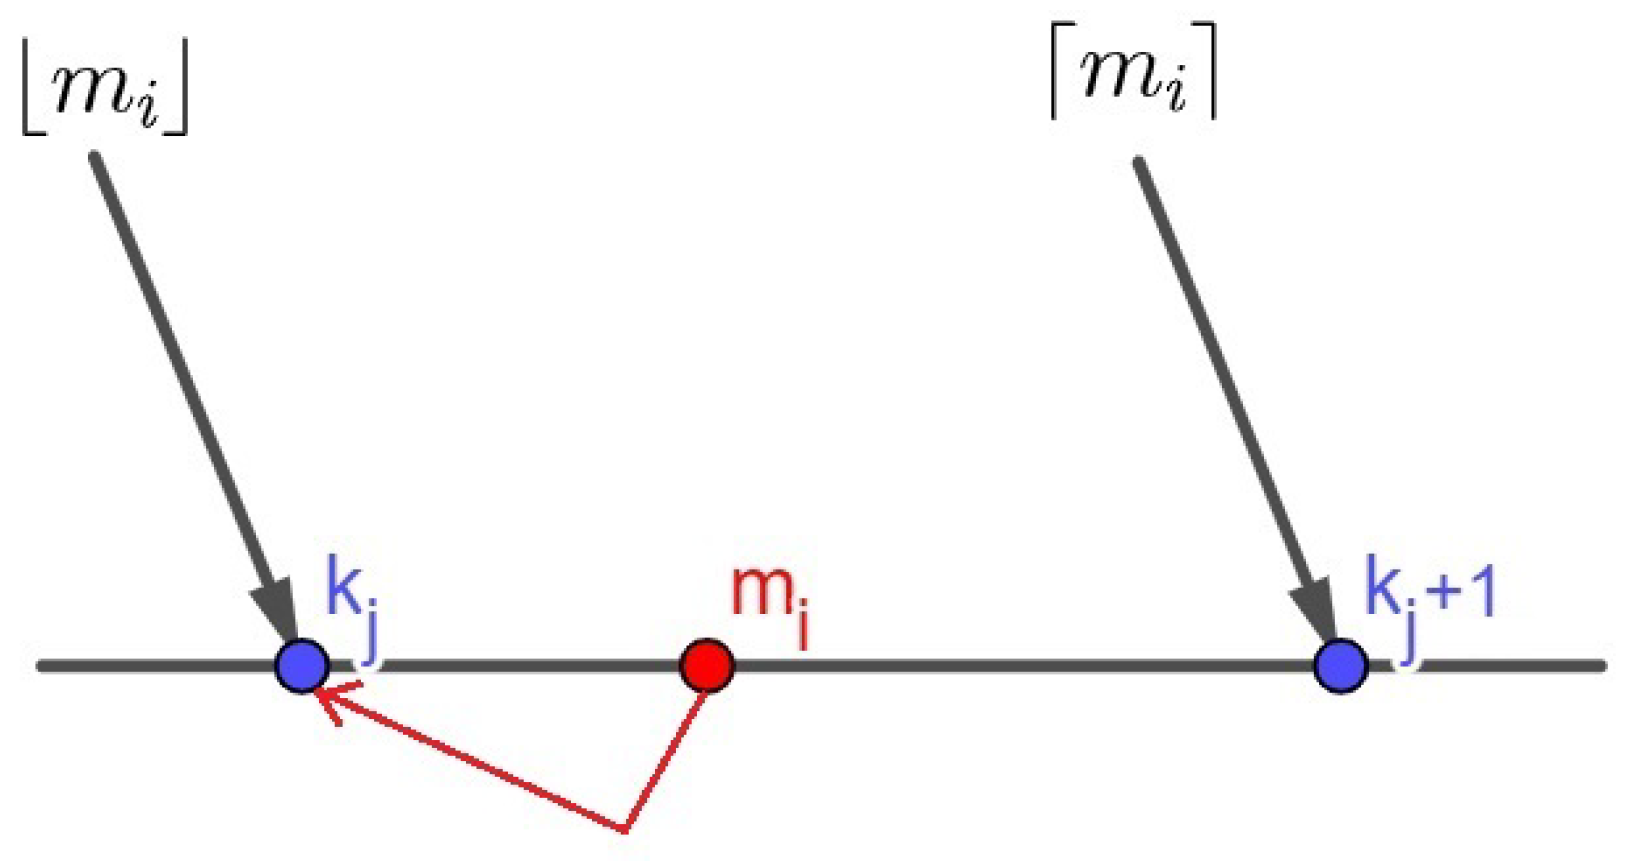
Of course, for the different cases, which were mentioned previously, the indices j 1 will be determined in a different way. In the first case, we have to focus each column of the matrix P ( 2 ) when its normalized frequency is m > 0 , and its index is j 2 = m G + N d + 1 2 . Then, it is possible to distinguish three different subcases.
  • If the condition m m > m m is fulfilled, then the corresponding normalized frequency k will be m , and the corresponding index j 1 = k + N d + 1 2 = m + N d + 1 2 . In this case, · denotes the largest integer not greater than the argument.
  • If the condition m m < m m is fulfilled, then the corresponding normalized frequency k will be m , and the corresponding index is j 1 = k + N d + 1 2 = m + N d + 1 2 .
  • If the condition m m = m m is fulfilled, then the focusing procedure will be performed two times, on each of the adjacent columns on the left and right side, in relation to the position of the normalized frequencies m, i.e., to columns with indexes j 1 = m + N d + 1 2 and j 1 1 (index m + N d + 1 2 ) .
In the second case, when m = 0 , for Doppler frequencies indicating the positions of stationary targets and targets with zero radial velocity, it is necessary to focus the column of the matrix P ( 2 ) , with the index j 2 = N d + 1 2 , to the matrix column P ( 1 ) with the same index, i.e., j 1 = j 2 .
Figure 12 shows a graphic representation of the focusing of one normalized Doppler frequency of the matrix P ( 2 ) , on the axis with normalized Doppler frequencies of the matrix P ( 1 ) .
In order to notice the effectiveness of the proposed method for the focusing of RD-HR maps in the bi-frequency operation mode, an analysis will be made with the data acquired from the HFSWR on 25 October 2021. It is an HFSWR that operates at frequencies 9.2 MHz and 4.6 MHz.
Figure 13 shows the axes with normalized frequencies when G = 2 . For simplicity, only the first four normalized frequencies (in the positive direction of the axis) are shown. It can be seen that it is necessary to focus the normalized frequencies, m, on a twice-smaller range of normalized frequencies, k.
A very important fact, which can significantly affect the detectability of targets, when it comes to the bi-frequency mode of operation, is that the effect of sea clutter, which is visible on both averaged RD-HR maps, must be eliminated before starting the focusing procedure. When focusing is conducted, in the places where the Bragg-lines were, in both cases, there is a possibility to detect targets in that zone. If the suppression of the sea clutter were not realized, some targets would be masked by Bragg-lines. Therefore, there would be a total of four Bragg-lines (two for each frequency), which would decrease the detectability of the targets, which in the bi-frequency operation mode would be even lower than in the case of the system that operates at one frequency.
The appearance of the RD-HR maps for the frequencies 4.6 MHz and 9.2 MHz, as well as the appearance of the focused RD-HR map, which is further used for target detection, will be shown and explained in detail in Section 4.
3.5. Detection of Targets from the Focused RD Map

Since the algorithms for primary signal processing in bi-frequency HFSWRs, which are presented in this paper, are realized as two step algorithms, it is clear that the formation of the RD-HR map is a key part, in order to achieve the best possible radar performance. This is because if the targets are not detectable in this first step, then they are generally invisible, and there is no need for the estimation of the azimuth at all. The RD-HR map shows the complete activity of ships at sea. The procedure for target detection on the RD-HR map is described in detail in [46,49], but only for the systems that operate at one frequency. Here, we have a similar situation, where we have to perform the same detection procedure for the focused RD map. Therefore, we will briefly explain this detection procedure.
The distance of targets and their Doppler frequencies are estimated by detecting peaks in the RD-HR map. The arguments of the maximum of these peaks are denoted by ( μ q , p q ) , where 1 q N d , and N d is the total number of detected peaks. It should be emphasized that μ q and p q correspond to the Doppler frequency domain and the range domain, respectively.
The detection procedure is performed as follows:
  • First, median filtering is performed using a window (matrix) of size 3 × 3 points in order to suppress point noise. The peaks of true targets have to span multiple pixels and, because of that, single-pixel peaks are false alarms and should be removed. Setting up a larger window would not be practical, because there is a possibility that the criterion function of the range–Doppler map at a true target would be very narrow. In this case, the detection would be unreasonably rejected.
  • In the next step, we perform 2D convolution with a 7 × 7 kernel matrix (Gaussian shape). The main goal of this step is to obtain a smooth image (RD map). The number of operations required for the 2D convolution increases quickly with the size of the kernel, and larger kernels can smear the criterion function. On the other hand, smaller kernels do not smooth small lobes of the criterion function enough, leaving the problem of local maxima.
  • Finally, a detection threshold ( γ ) is used to estimate the locations of criterion function peaks. It is not a trivial task to choose a value for the threshold, since a lower value would improve the detection probability, but also increase the probability of false alarm. In this case, the threshold value is chosen experimentally, based on testing a large amount of data. The results obtained are highly dependent on this value, as will be explained in Section 4.
A more detailed description of the detection procedure can be found in [46]. Figure 14 displays the results of the target detection procedure, where the detections are marked in red on the RD map.
It should be emphasized that the RD map is normalized in the range [ 0 , 1 ] , which is also a requirement of the detection method. Also, indexes are used on the axes instead of the actual values. Additionally, the range of Doppler frequencies is zoomed in (only a part is shown) so that the displayed results can be seen more clearly.

3.6. High-Resolution Azimuth Detection of Targets in Bi-Frequency HFSWR

For each of the detected N d peaks, in the next step, the azimuth of the detected targets is estimated. For high-resolution estimation of azimuth, the same type of criterion function is used as in the estimation of the RD-HR map (MUSIC type), with the difference that steering vectors and covariance matrices are formed in the spatial domain (the antenna dimension). The procedure for high-resolution azimuth detection of targets is also described in detail in [46,49], so we will not elaborate on it in this paper. This method has a much lower numerical complexity than the joint 3D search method in the range–Doppler–azimuth domain, which is often used in the existing HFSWRs. Another advantage of this method is that Doppler frequency compensation is performed before the detection process.
Figure 15 shows azimuth estimation of an arbitrarily chosen target from the RD-HR map at the frequency 9.2 MHz. For real targets (not false alarms), this criterion function is narrow and has a high level (can be more then 25 dB), as can be seen from the figure.

4. Results

The main goal of this section is a quantitative and qualitative analysis of experimental results that are obtained by primary signal processing in a bi-frequency HFSWR [55,56]. This analysis has an advantage over analyses based on simulated signals, for the reason that, here, we are dealing with real signals, which were acquired from a radar in operational work, in a highly multi-user scenario with a large number of ships and with all degrading effects, which are also an integral part of the signal model. The analysis will show how the algorithms actually work in real conditions, and the improvements of the bi-frequency mode of operation compared to the single-frequency mode.
Raw data acquired on 25 October 2021 from the HFSWR operating in bi-frequency mode were used for testing. The length of the signal sample, which is used for testing purposes, is approximately 40 min, so we have 78 timestamps whose duration is 32 s each. The first 16 antennas are part of the subsystem operating at the frequency f c 1 = 4.6 MHz (the first linear antenna array), while the following 16 antennas belong to the subsystem which operates at the frequency f c 2 = 9.2 MHz (the second linear antenna subarray). Because we want to ensure fair comparison between the bi-frequency radar, with a total of 32 antennas, and individual single frequency radars, with 16 elements, we form a non-uniform antenna geometry with 8 + 8 antennas. The non-uniform pattern for antenna selection is the same for both linear subarrays: 1, 3, 6, 8, 9, 11, 14, and 16. The antenna array aperture is the same as in the case of the 32-antenna array. The steering vector for azimuth estimation has to be formulated according to the same pattern. This antenna array geometry can be chosen using any other pattern, but in this case, we obtained satisfactory results. Based on this realized system architecture, it is possible to analyze the results of primary signal processing in HFSWRs for one operating frequency, then for the other, and finally for the bi-frequency system with 8 + 8 antennas.
In Table 2, the basic parameters of high-resolution algorithms (signal and system parameters) are shown.
The way to evaluate the performance of algorithms for primary signal processing in bi-frequency HFSWRs was demonstrated, and the influence of algorithm parameters on the detectability of targets, as well as the accuracy of the assessment, was analyzed. A set of algorithm parameters for which input data were processed was adopted. These parameters are the parameter K of the MUSIC-based algorithm which is used in the formation of RD-HR map, and the detection threshold γ . These parameters greatly influence the obtained results.
A special part of the section concerns the ability to detect small boats (which are made of composite materials) at short distances from the radar (up to 25 km), in order to see the advantage of the bi-frequency mode of operation, even in these situations. It is important to note that this is not the primary goal of any HFSWR, so it is very difficult to find data of this type in the available literature. Therefore, these results are of particular importance and represent an important contribution of this paper.

4.1. Qualitative Analysis of the Results Obtained by Bi-Frequency HFSWR

In this part, the analysis will be carried out without AIS data, which were not available for the purposes of this experimental testing. Therefore, only a qualitative analysis of the results obtained from the operational radar is possible.
As part of the qualitative analysis, a focused RD map will be presented, as well as its comparison with the RD maps obtained by one of the subsystems which operates at only one frequency.
In the second part of this analysis, we will show a cumulative view of all the detections obtained by the proposed bi-frequency high-resolution algorithm, where the performance improvements will be clearly seen.
Figure 16 shows the appearance of the averaged RD-HR map for the frequency 4.6 MHz and then for 9.2 MHz (adjusted to the frequency 4.6 MHz), as well as the appearance of the focused HR-HR map, which is used for target detection. The timestamp of the obtained RD maps is 8:31 a.m.
The places where there were Bragg-lines (upper left figure), which were eliminated before the start of focusing (the part between the red lines in the upper left figure), are marked on the above two figures. The upper right figure shows the adjusted RD map to the frequency 4.6 MHz. As an example of the detectability improvement in the bi-frequency mode of operation, the red arrows in the bottom figure mark some of the detections that are visible at only one of the two frequencies. They are also visible on the focused RD-HR map, as well as some of the detections located in places where there were Bragg-lines at certain Doppler frequencies. In this case, they are not masked.
First, the average number of detections generated by the high-resolution algorithm for the entire duration of the test will be determined. All combinations of input parameters of the high-resolution algorithm (K and γ ) were taken here to see their impact on system performance. The total number of detections can give us an initial indication of the success of the bi-frequency mode of operation.
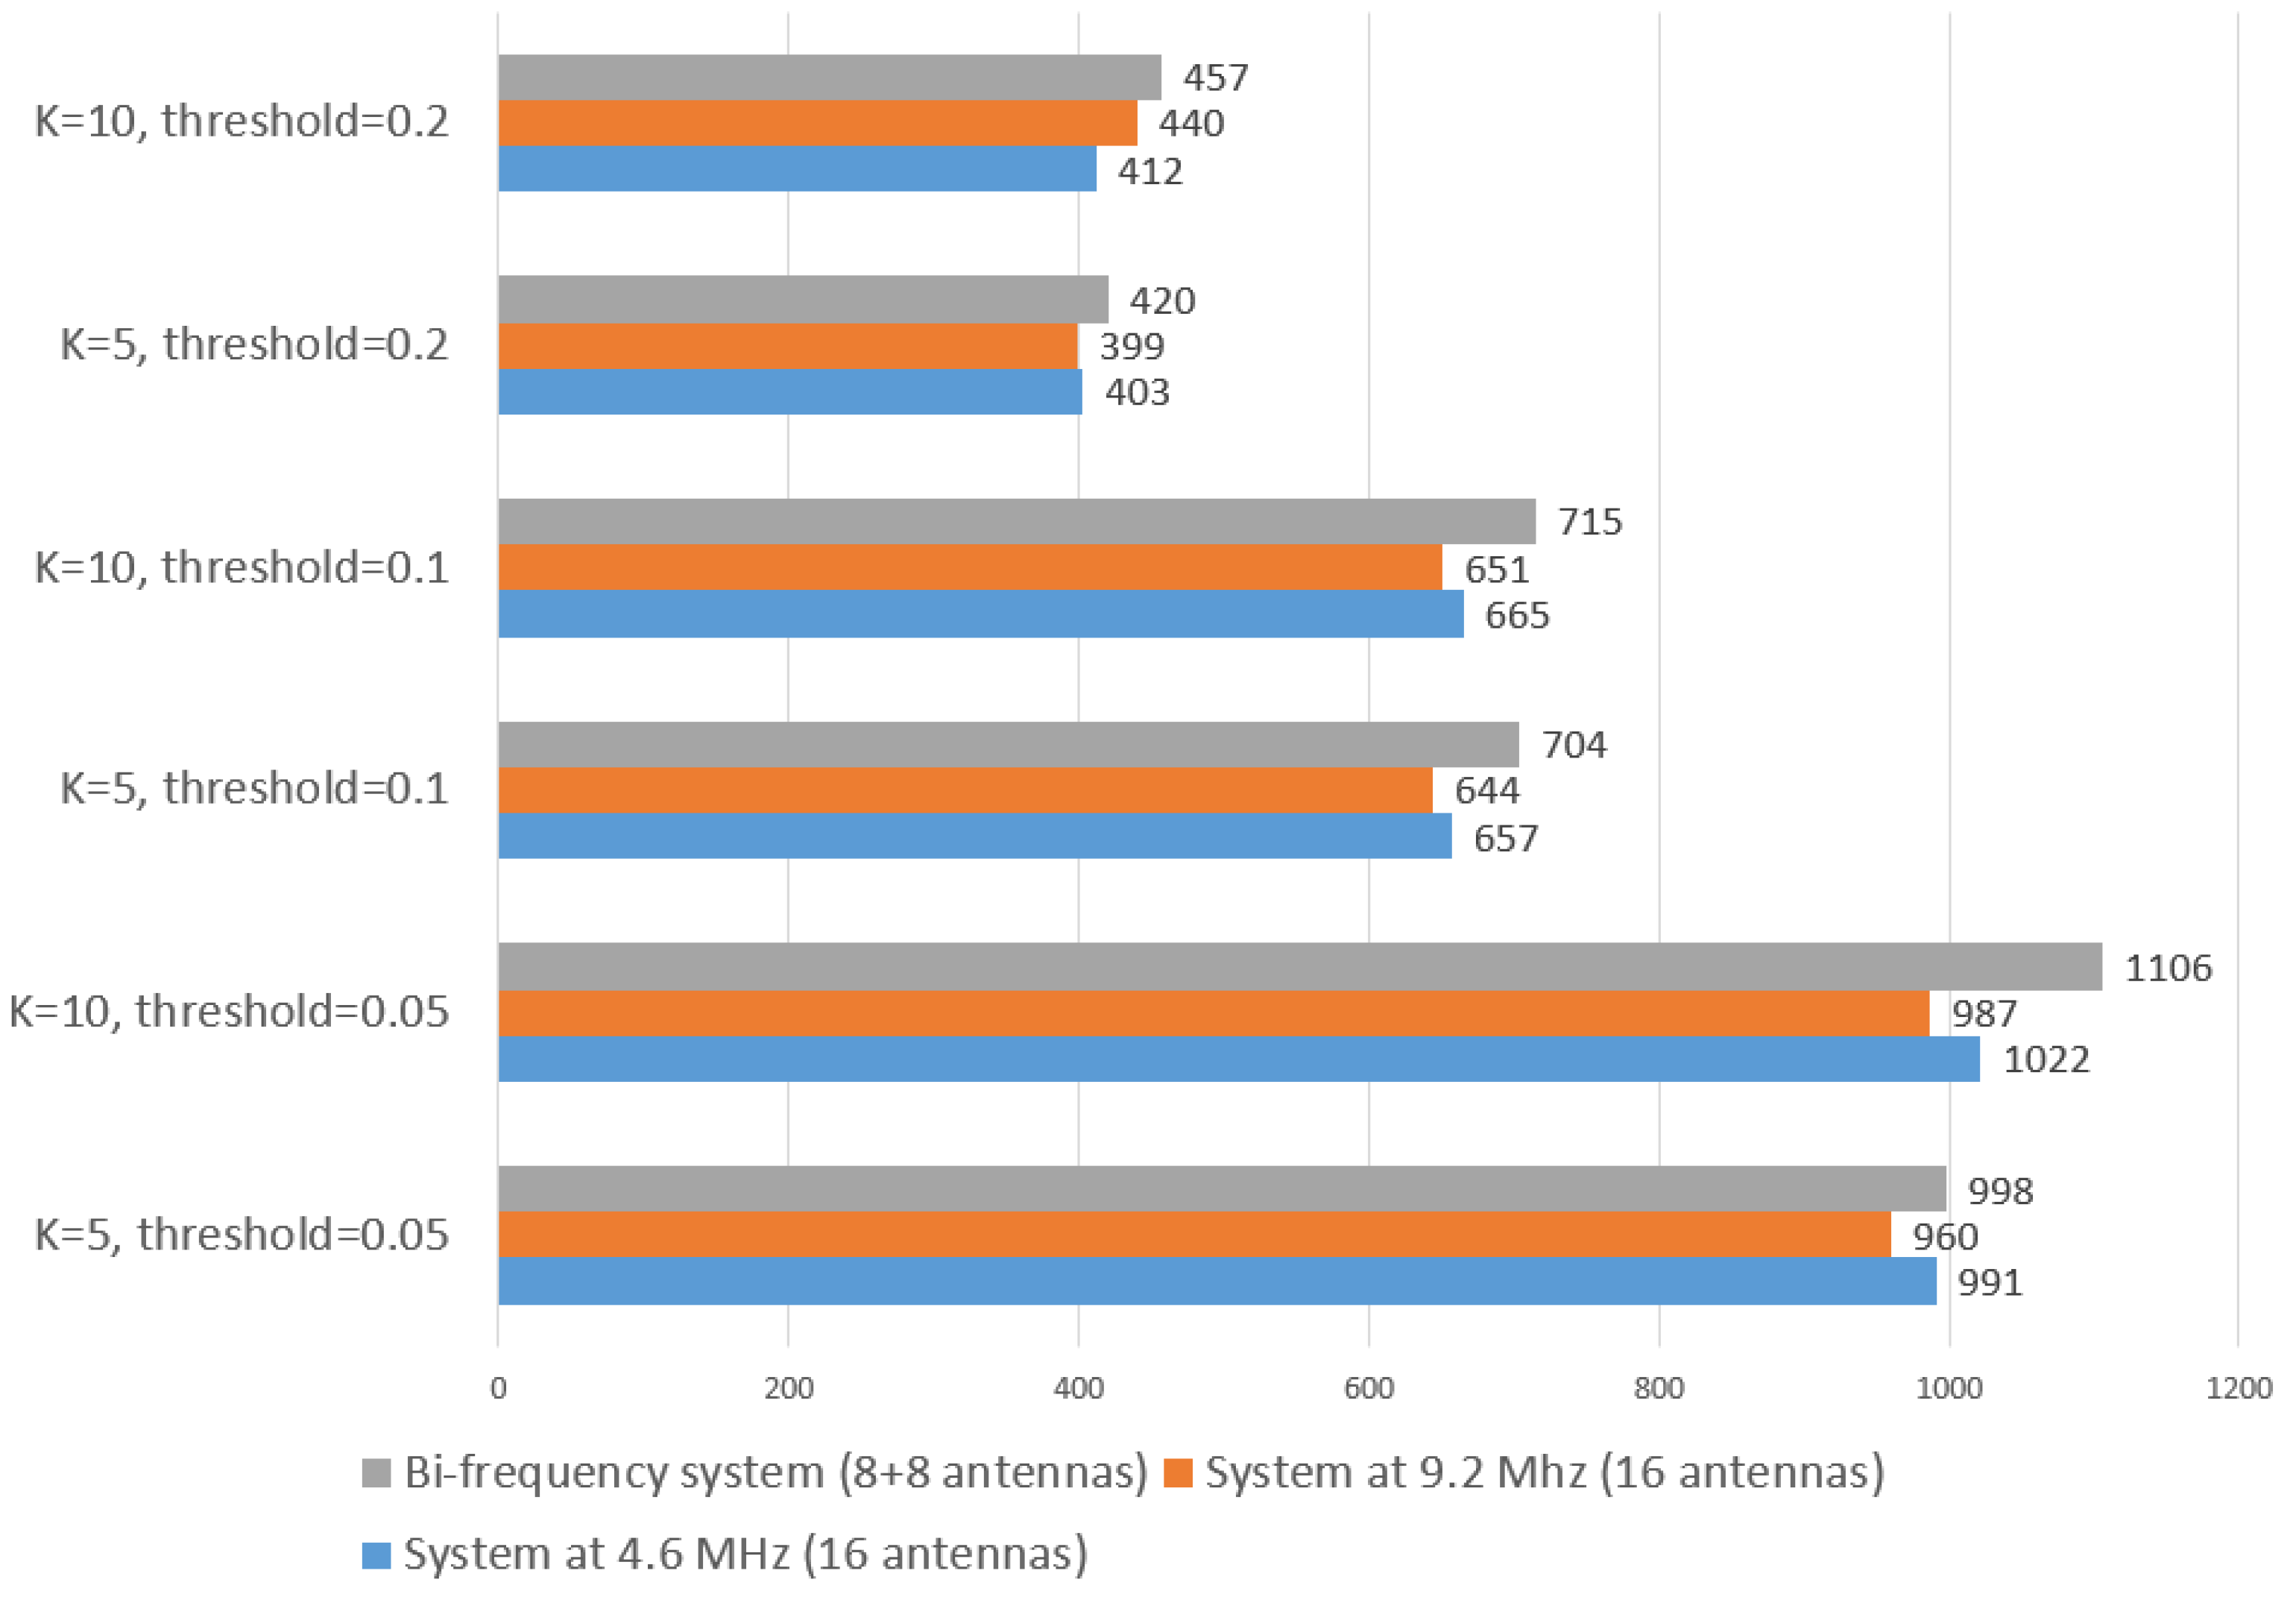
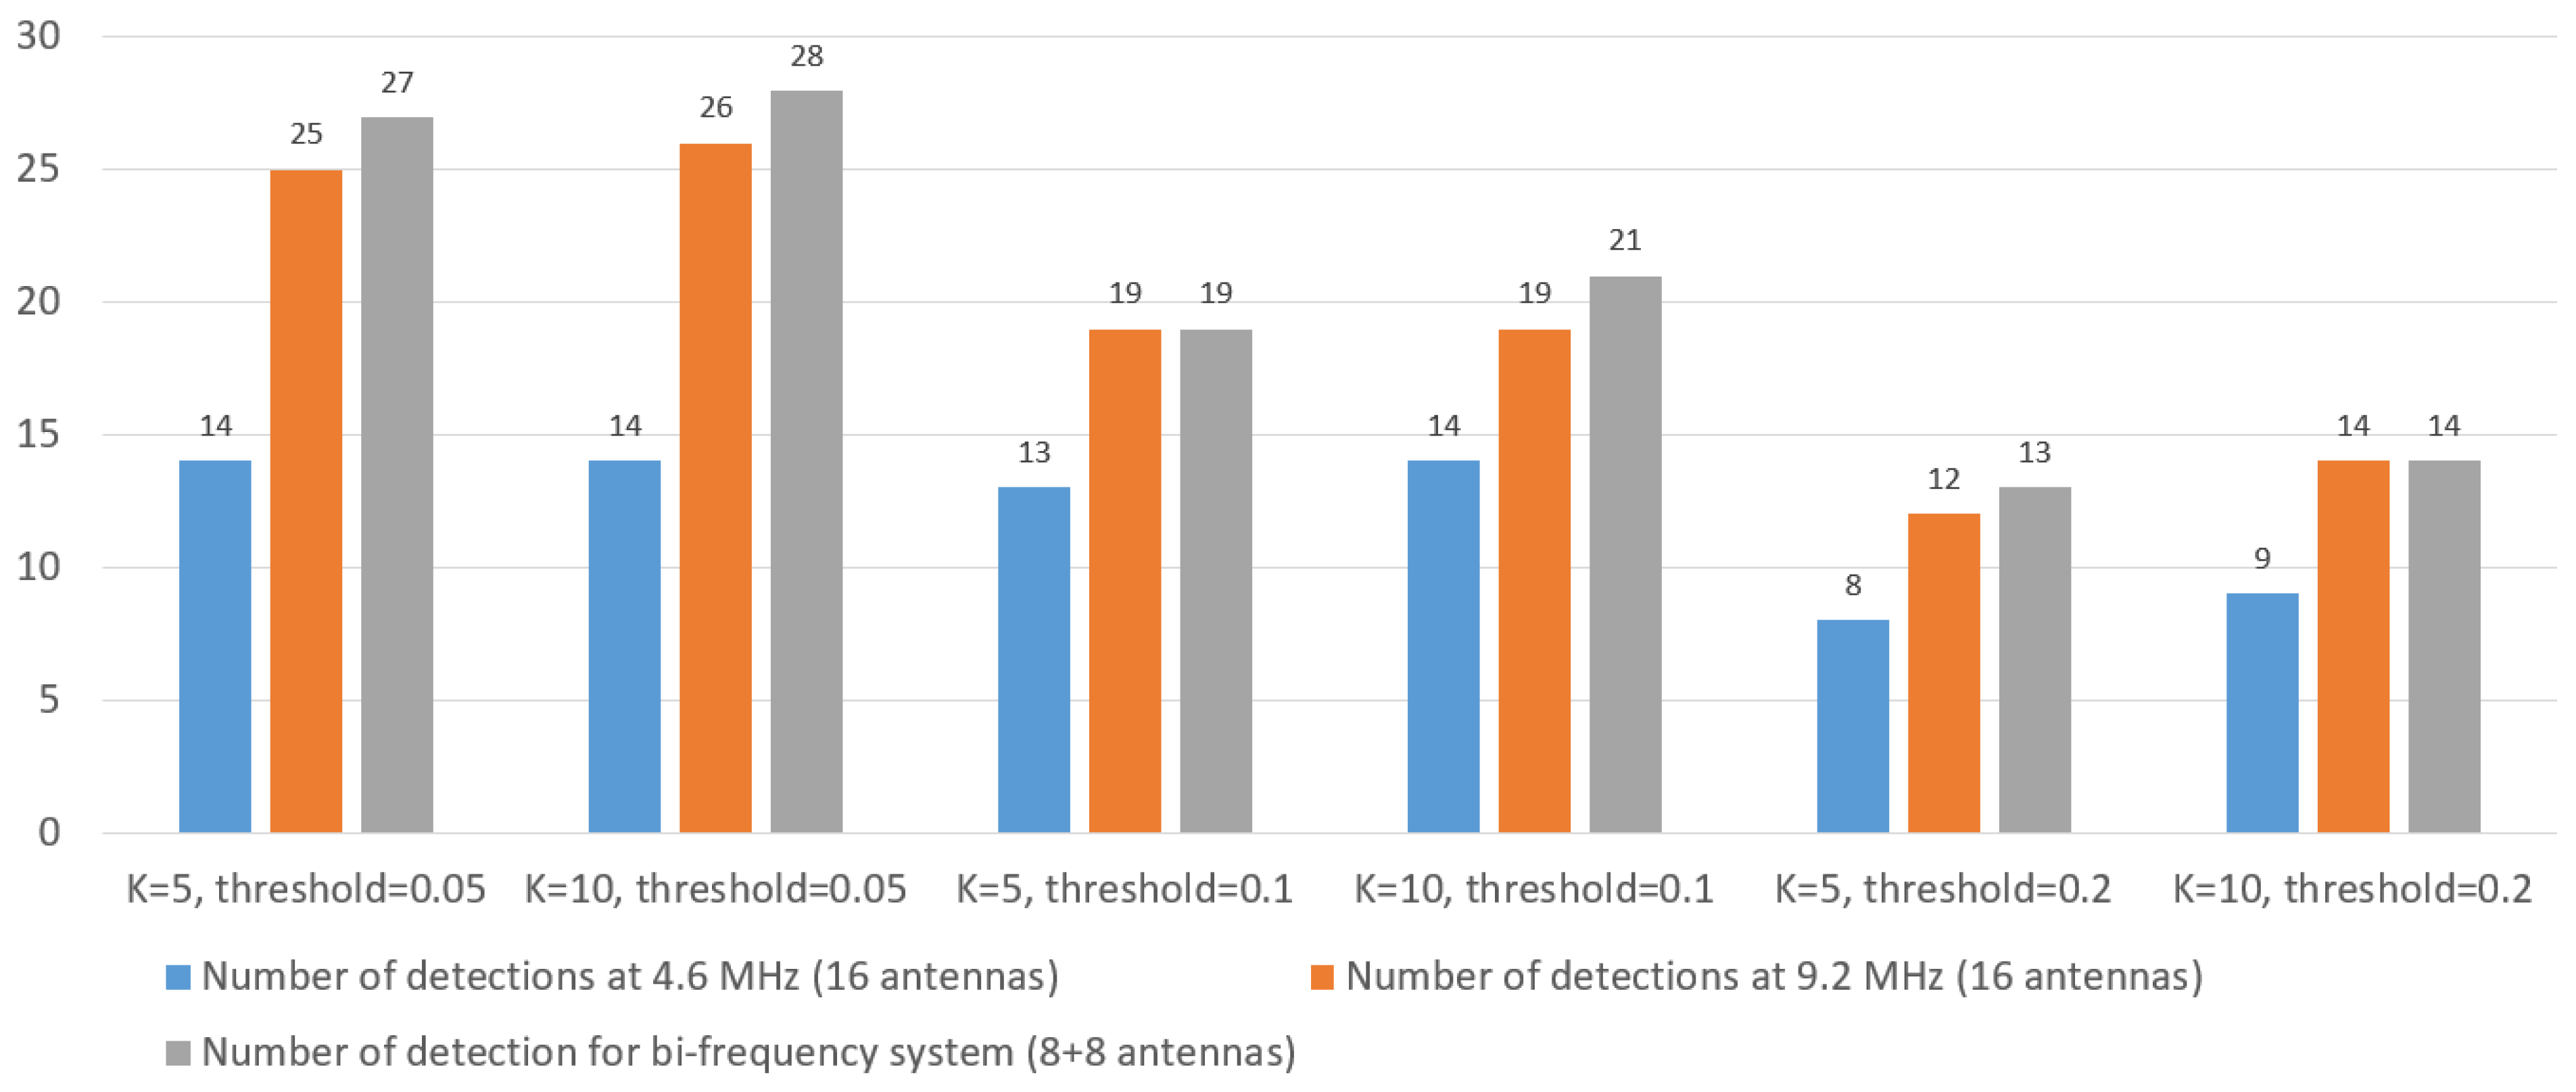
Figure 17 shows numerical results, which refer to the detectability of targets from the RD-HR map based on a signal sample of 78 timestamps, where the adjacent timestamps were spaced 32 s apart, and for each of them, an RD-HR map is formed and target detection is performed. The results are rounded to the nearest integer value. Target detection was performed for the normalized value of the detection threshold γ 0.05 , 0.1 , 0.2 . Also, the parameter K of the MUSIC algorithm was 5 or 10, which are satisfactory values based on the experimental testing results and comparison with the AIS.
The results show that at the frequency 4.6 MHz, there are slightly more detections compared to the case when the frequency 9.2 MHz is used. It is known that at lower frequencies, better results can be achieved in terms of the detectability of targets at greater distances; therefore, this result is expected. Based on the numerical results, it can be seen that the number of detections in the bi-frequency mode of operation, where the focusing of HR-HR maps was performed, is already greater, compared to the cases when the system operates at the frequencies 4.6 and 9.2 MHz, respectively. This is the first indicator of improved target detectability. However, the true success can only be seen when the trajectories of the ships, within a given time period and based on experimentally obtained results, are tracked to show how the bi-frequency radar actually works in real conditions.
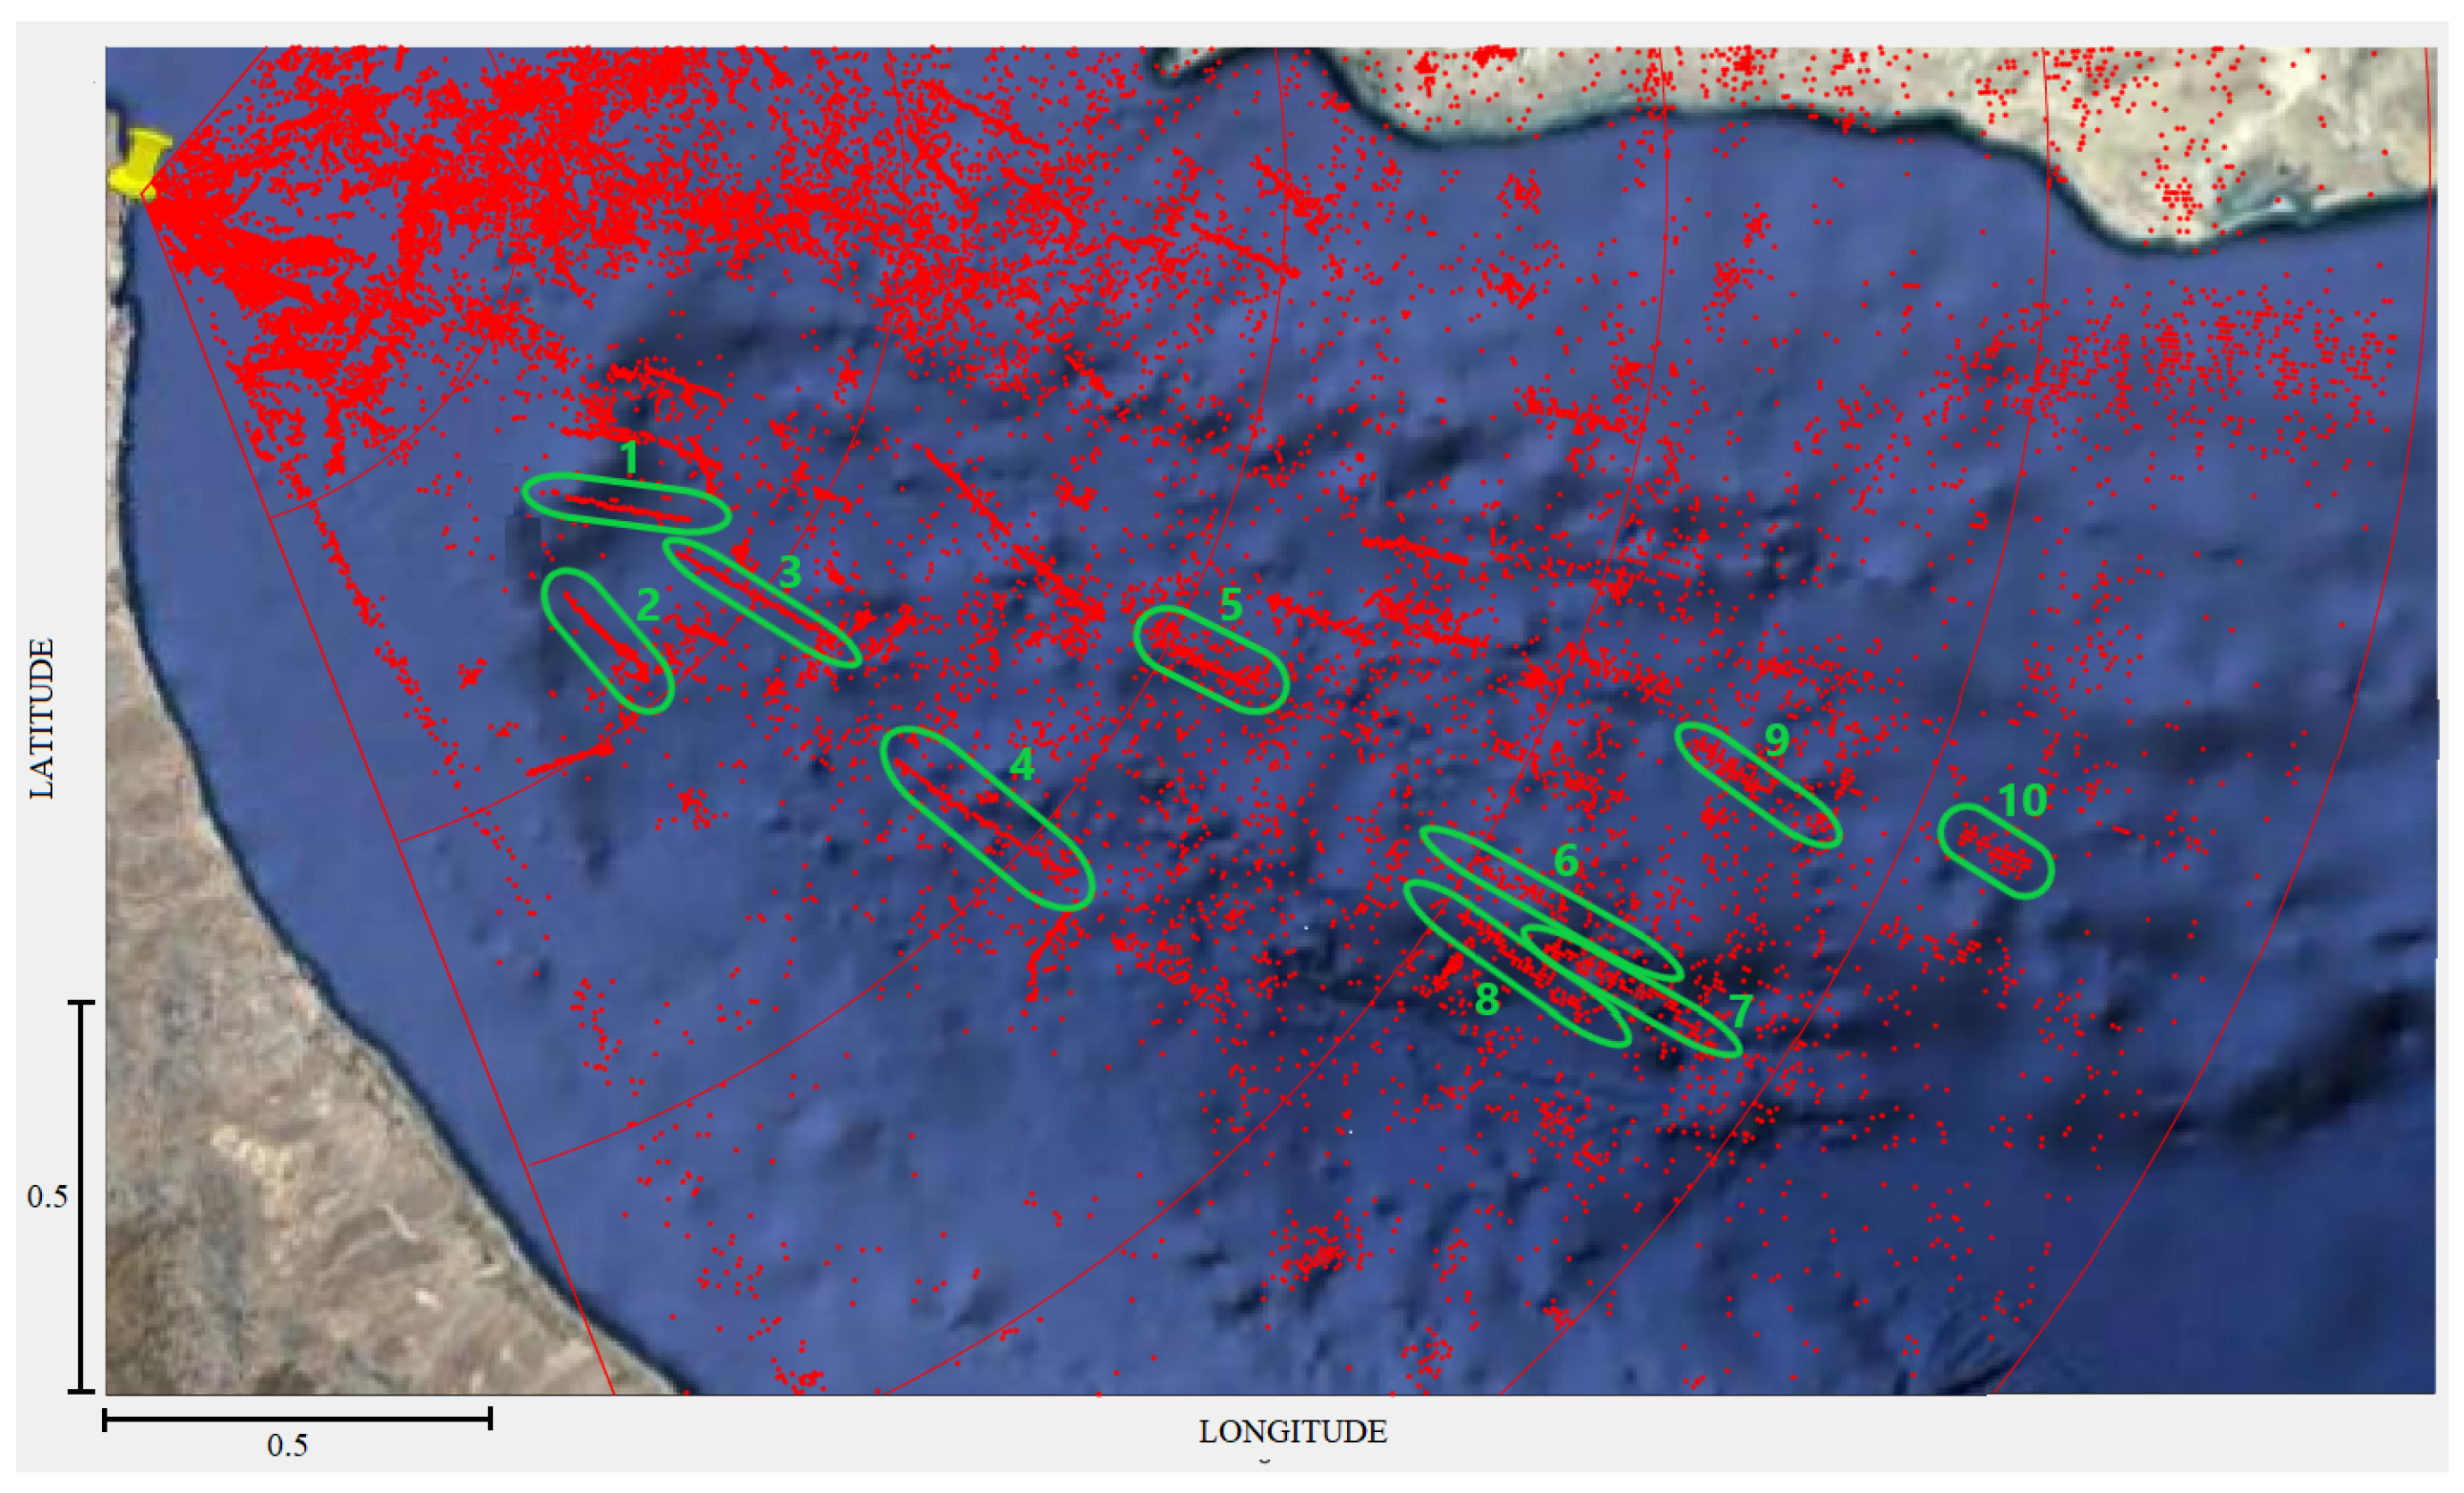
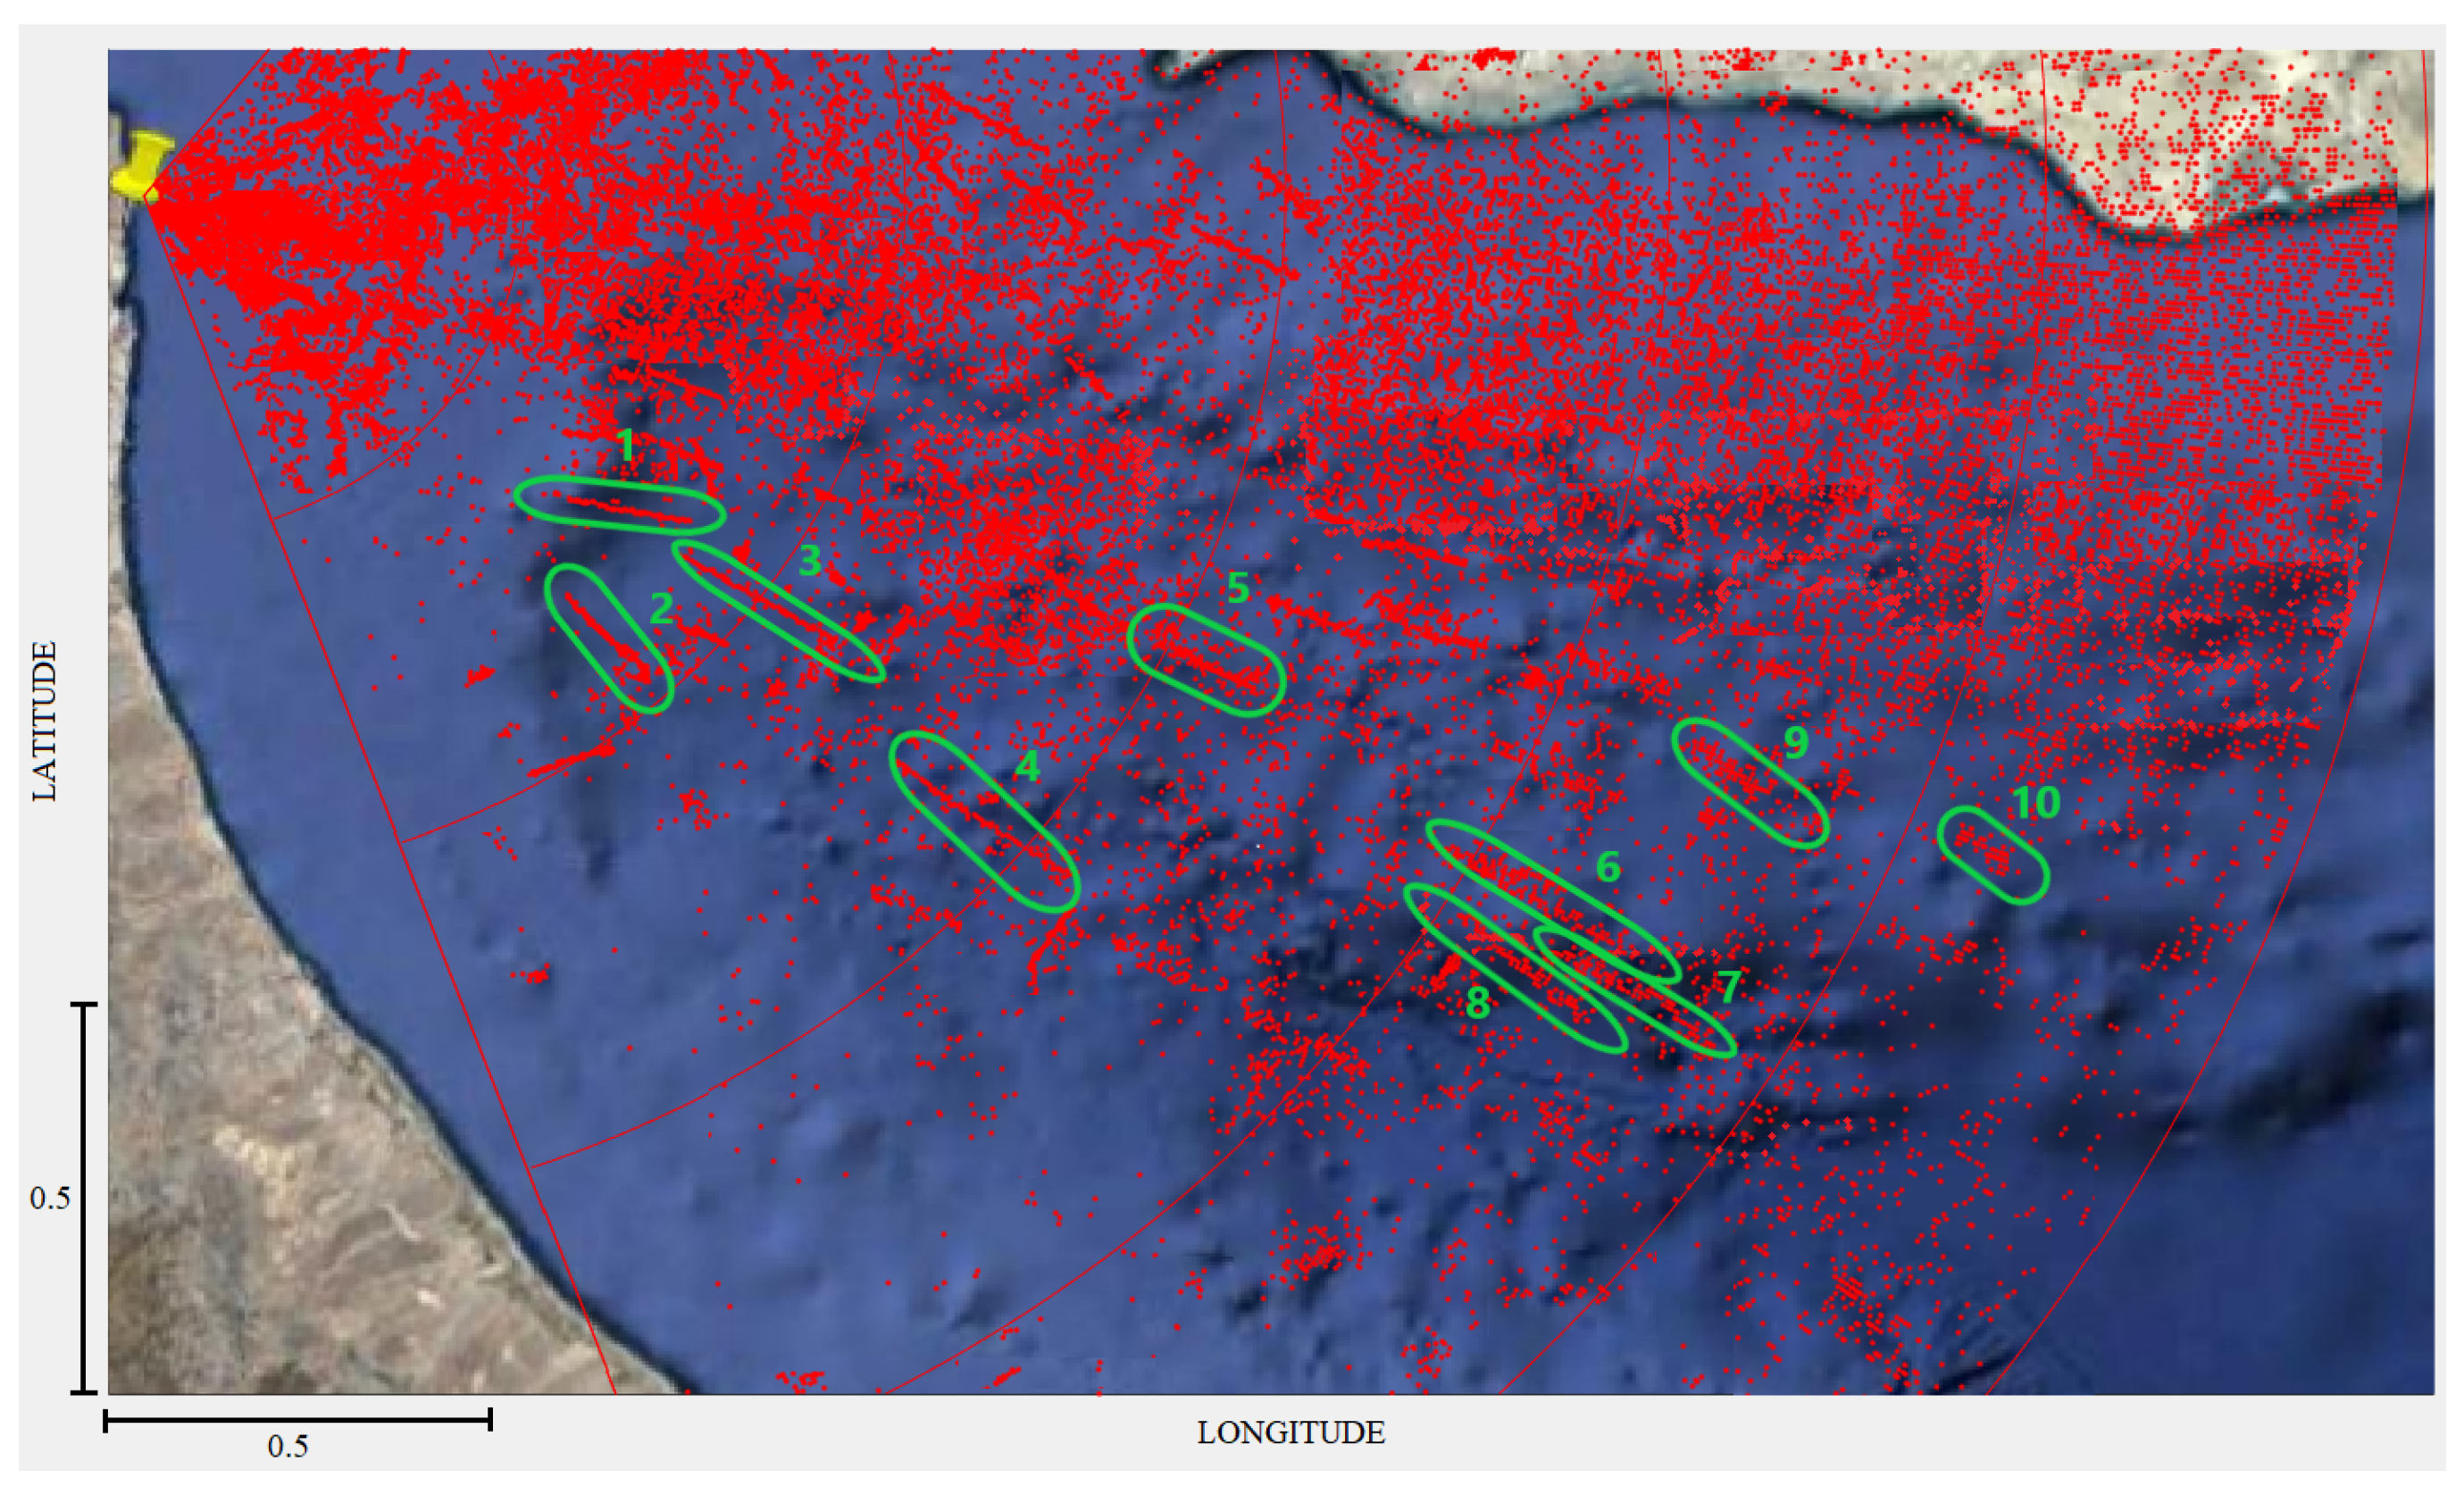
In order to perform a qualitative analysis of experimentally obtained results, we conducted an experiment. First, we arbitrarily selected 10 ships, on the geographical map, based on the results for both frequencies. We selected a part of the space around the ships to roughly evaluate the performance of the high-resolution algorithm. Since we did not have AIS, we decided whether a track is related to the ship or not based on the chaining of criteria functions of the RD map for individual detections in adjacent timestamps. We presented and described this method in detail in [50].
The presented results were obtained for K = 10 and γ = 0.1 . Other combinations of HR algorithm parameters will be shown in tabular form. Figure 18, Figure 19, and Figure 20 show the cumulative display of detections for frequencies 4.6 MHz, 9.2 MHz, and bi-frequency system, respectively. Red arcs indicate a distance of 50 km. Also, it can be observed that there is more clutter at the frequency of 9.2 MHz.
From these figures, we can see the advantage of the bi-frequency mode of operation in terms of better detectability of targets. Thus, a bi-frequency mode of operation is justified in terms of performance improvement.
Shown in Table 3 is a comparison of the detectability of ships for subsystems that operate at one frequency and for different values of proposed algorithm parameters. In individual cells in the table, we enter the frequency of the system that is better in that case.
Even though it can be clearly seen that the performance is better for the system operating at the frequency of 4.6 MHz, there are many cases when the results are better at the frequency of 9.2 MHz. Specifically, when it comes to detectability of targets, the 4.6 MHz system dominates, because out of 60 different combinations, it is better in 45 situations.
Finally, the number of detections for each of the ships in the bi-frequency mode of operation is shown in Figure 21. Results are also shown for different parameters of the high-resolution algorithm. It should be emphasized that since we have 78 timestamps, it is possible to have a total of 78 detections (maximum value) in the selected time interval for any selected ship during the test. It can be seen that good target detectability was achieved.

4.2. Quantitative Analysis of the Results Obtained by Bi-Frequency HFSWR

After completing the primary signal processing in the HFSWR systems and obtaining the results, in the next step it is necessary to verify the obtained results. The main goal is to determine the performance of the bi-frequency HFSWR. In this regard, it is necessary to have reference (i.e., benchmark) data, which represent the real localization parameters of the targets, and which will be used for the performance evaluation. For this purpose, the previously mentioned AIS data should be used. Every ship, as a participant of maritime traffic, should periodically send data about its localization parameters, namely, geographic coordinates and speed of movement. Unfortunately, no AIS data were available during this test. Therefore, the test was conducted in a different (custom-made) way.
The previous experimental results served as a motivation for testing the detectability of small boats, which is otherwise a very challenging task, primarily because such targets have a small radar reflective surface, they move quickly, and often change their direction. This test is related to small boats detectability. In order to understand the nature of small boat detections, a fully controllable test was carried out. We chose a patrol boat, MRTP 16, for testing purposes. The reference data, instead of AIS, were obtained by a GPS in a mobile phone, which was placed on a moving small boat. These data are related to the trajectory and speed of the boat.
Table 4 contains technical specifications of the small boat is used for testing.
The testing is monitored online, but raw data obtained by bi-frequency HFSWR are also saved for further offline analysis, processing, and further testing. The aim of the examination is to determine whether the boats, used in the test, are detectable, and if they are detectable, to determine the nature of the detections. It is necessary to determine whether chaining happens or not and whether tracking across adjacent timestamps is possible or not.
Table 5 shows basic information about the conducted testing during daytime.
Figure 22 shows the appearance of the boat used for testing and its trajectory. The length of the boat is 17.75 m, while the maximum distance of the boat from the radar was about 17 km.
We input signal data from 78 timestamps into the high-resolution algorithm in order to evaluate its performance. Data from the GPS receiver were generated every second, so the complete path is practically known.
Figure 23 shows the filtered boat detections according to the spatial criterion. The results were obtained for high-resolution algorithm parameters: K = 5 and γ = 0.05 . Permitted deviation corresponds to one resolution cell per range along the entire trajectory. Also, by using Doppler frequency criterion, the maximum deviation was two resolution cells per Doppler frequency.
Red and green dots indicate detections for a system operating at 4.6 MHz and 9.2 MHz, respectively. Also, a way to roughly estimate the trajectory of the boat from the obtained results is shown, which is by fitting the curve between the obtained detections. This means that this boat, from the point of view of the algorithm for primary signal processing, can be considered detectable. Note that this is only a rough qualitative track evaluation.
In this case, it can be seen that, even though the boats are detectable, the detections are not chained, as was the case with slow ships with a large radar crosssection. Detections are irregularly or sparsely distributed, but they are located in a small contour (performance contour), which moves along the ship’s trajectory, and which represents a criterion for one timestamp. Due to this spatial arrangement of the received detections, tracking of such a boat is difficult. In a way, this is expected because HFSWRs are primarily intended for the detection of large ships (vessels) at long distances.
A performance contour is formed for each timestamp separately, and based on the number of detections in them, along the entire time period, which is analyzed, the probability of detection is determined. Ideally, in each performance contour there should be a detection, originating from a target for which the reference GPS data are also known. In other words, the probability of detection is defined as the ratio of the total number of timestamps in which there is at least one detection within the performance contour of the boat, and the total number of timestamps in which the movement of the ship is tracked.
However, the probability of a false alarm can be determined by counting the total number of detections in the selected geographical zone, but which are outside the performance contour for the selected timestamp.
Figure 24 and Figure 25 show the number of small boat detections and small boat probability of detection for different high-resolution algorithm parameters in the bi-frequency mode of operation, respectively.
Table 6 shows small boat false alarm probability for different high-resolution algorithm parameters in the bi-frequency mode of operation.
It should be noted that the HFSWR performance depends on various factors, primarily the operating frequency, but also on other factors: the reflective surface of the target, the level of interference in the system, sea state, wind direction, time, season, etc. Propagation losses depend on the radar’s operating frequency and the electrical characteristics of the sea surface. Higher conductivity practically means lower losses. When it comes to the surface of the sea, sea water has a better conductivity compared to land. Also, the angle between the ship’s heading and the line, on which both the radar and the ship are located, affects the level of the reflected signal.
All in all, we have shown that the detectability of such targets is improved by using a bi-frequency architecture and appropriate primary signal processing. As can be seen from the previous analyses, at one frequency the probability of detection is very small, while this value can be improved by using a bi-frequency architecture.
After determining the probability of detection and the probability of a false alarm for the selected small boat, in order to evaluate the performance, it is also necessary to estimate the accuracy of the detection. Therefore, we have to determine the deviation in relation to GPS reference data. For this purpose, the root mean squared error (RMSE) is defined for the distance ( RMSE r ), Doppler frequency ( RMSE μ ), and azimuth ( RMSE θ ) based on a signal sample (obtained by testing). If N u denotes the total number of detections that participate in the evaluation, then RMSE for all three domains of interest are defined in the following way:
RMSE r = 1 N u i = 1 N u ( r i r ^ i ) 2 ,
RMSE θ = 1 N u i = 1 N u ( θ i θ ^ i ) 2 ,
RMSE μ = 1 N u i = 1 N u ( μ i μ ^ i ) 2 .
Reference GPS data are denoted in the previous relations by r i , θ i and μ i , in relation to which the comparison is made, namely, the distance of the GPS point from the radar, the angle between the direction from the radar to the GPS point relative to the direction of the north, and the radial projection of the velocity obtained by the GPS. The values r ^ i , θ ^ i and μ ^ i denote the corresponding detections obtained by primary signal processing in bi-frequency HFSWR.
Although this is a small sample, certain conclusions can be drawn regarding the accuracy of high-resolution algorithms. The accuracy is significantly lower compared to the detections obtained for larger ships (vessels), which is expected, considering the nature of the detections, which are not chained properly.
For different high-resolution parameters, the RMSEs of distance, azimuth, and Doppler frequency, related to the bi-frequency mode of operation, are shown in Table 7.

5. Discussion

One of the main goals of this paper was to conduct an experimental study on the success of the newly developed algorithms in real conditions, because in a multi-user scenario, such as in this case, with hundreds of ships, the experimental study shows a realistic view of how the radar actually works in real conditions, i.e., what the actual effect of primary signal processing is.
In all cases, for large vessels and small boats, it can be seen that by using a bi-frequency mode of operation it is possible to achieve better performance compared to the single-frequency mode (even if the boats are only occasionally detectable). We have shown, in the case of testing small-boats detection performance, that detections are scattered (sparse) and there is no chaining of them in the same way as with slow ships with large RCS, but we obtain better results using bi-frequency architecture and corresponding signal processing.
The detectability of small boats that are made of weakly reflective materials is a very challenging task; thus, experimentally obtained results show the superiority of the bi-frequency mode compared to the single-frequency mode in order to reconstruct a ship’s trajectory. These results also represent a special value because they are rare in the existing literature. The obtained results show that the small boat is more detectable when moving tangentially to the radar, and in case it is stationary. Additionally, based on the obtained results, we can conclude that the probability of detection of such a small boat is approximately 20–30% in most cases.
The key algorithm in bi-frequency high-resolution algorithms is the RD map focusing, which is presented in this paper. The contrast of the RD-HR map, as well as the detectability of targets on it, especially in the bi-frequency mode of operation, are significantly better compared to single-frequency RD maps. The goal of the bi-frequency mode of operation is also to improve the detectability of targets, by exploiting the fact that some targets are masked (undetectable) at one frequency, but they become visible at another frequency.
The HF frequency band corresponds to wavelengths from 10 to 100 m, so the physical dimensions of ships, for which localization parameters need to be determined, can be smaller than the wavelength, but also several times larger than the wavelength.
Regarding the direction of future development, it is clear that the algorithms for primary signal processing in HFSWR systems, which are presented in this paper, have great potential for numerous future applications, so their further development, from a scientific point of view, is justified and expected. In the specific case, when applied to monitoring activities on the sea surface and localizing targets of interest, possible future development directions could be classified into several groups:
  • Ship tracking based on sparse detections should be implemented to further improve performance when it comes to complete sea surveillance.
  • In the future, perhaps, the possibility of forming a coherent algorithm should be considered, where, in addition to amplitudes, phase data also have to be stored in the criterion function of the RD map, which can also represent a step forward when it comes to the possibility of detecting targets with a small radar reflective surface (boats of small dimensions made of poorly reflective materials). It would be extremely important to compare the performance of algorithms designed in this way with the algorithms presented in this paper.
  • The challenge would also be to implement the concept proposed here on some other state-of-the-art system architectures, such as a bistatic radar, where the Tx and Rx antenna arrays are located at a greater distance, multistatic radars (with several Rx antenna arrays also at a greater distance), and radars that work at multiple frequencies (only the bi-frequency radar is shown here). The primary signal processing presented in this paper, with slight modifications, would be applicable in all these cases.
  • One possible direction of future work is to make the system adaptively choose the parameter values for RD-HR map forming and detection, such as the size of the convolution kernel (which is currently fixed at 7 × 7 ) and the detection threshold.
  • Another direction is to implement a diagnostic procedure, which detects when a receive channel is out of order (due to a short circuit by sea water or damage from a hurricane, for example) and reduces the weight/priority of that channel in joint processing.
  • Finding improved ways to focus the RD-HR map from one frequency onto the map for the other for non-integer carrier frequency ratios would also be worth investigating.
  • Yet another future research direction is to make the system multi-mission-capable. Namely, the system could reconfigure itself to perform detection at either only one of the carrier frequencies or both, depending on the adversity of propagation conditions, the priority of the targets, and the need to save power. This would help in countering jammers, as well as ships trying to evade detection by “hiding” in Bragg-lines. When a radar subsystem is turned off, its frequency band can be used for communication (with, e.g., ships).

6. Conclusions

In this paper, we proposed the system architecture, the signal model, and the method for high-resolution primary signal processing in bi-frequency HFSWRs, which includes detection of the target on an RD-HR map obtained by focusing of the RD-HR maps from two different frequencies.
We provided the results of testing on experimentally obtained data for large ships as well as small boats. A comparison was made between the bi-frequency mode of work for the system with 8 + 8 antennas and two single-frequency systems with 16 antennas each. We used a non-uniform antenna array geometry. The results show better detectability/resolvability of the proposed method and architecture.
The increase in performance comes at the cost of increased numerical complexity of the proposed algorithms and more complex hardware (frequency-dependent bandpass filters, etc.). We optimized the program code so that it now runs in real time on a PC. The algorithm performance can be further improved by using adaptive adjustment of parameter values: detection thresholds, kernel dimensions and shapes, MUSIC model order, etc.
This bi-frequency architecture can be formed by the reconfiguration of two architectures operating at two different frequencies by using non-uniform antenna array geometries, according to multi-mission requirements.

Author Contributions

Conceptualization, D.G.; methodology, D.G., M.E., N.V. and V.O.; software, D.G. and M.E.; validation, D.G., M.E., N.V. and V.O.; formal analysis, D.G., M.E., N.V. and V.O.; investigation, D.G. and M.E.; resources, D.G.; data curation, D.G.; writing—original draft preparation, D.G.; writing—review and editing, D.G., M.E., N.V. and V.O.; visualization, D.G.; supervision, M.E., N.V. and V.O.; project administration, D.G. All authors have read and agreed to the published version of the manuscript.

Funding

We thank Vlatacom Institute for supporting this research overall. The APC was funded by Vlatacom Institute. This research was also supported by the Ministry of Science, Technological Development and Innovation of the Republic of Serbia, grant no. 451-03-66/2024-03/200223.

Institutional Review Board Statement

Not applicable.

Data Availability Statement

The original contributions presented in the study are included in the article, further inquiries can be directed to the corresponding author.

Acknowledgments

We thank Vlatacom Institute for overall supporting this research. We also thank the anonymous reviewers for their useful comments, remarks, and suggestions.

Conflicts of Interest

The authors declare no conflicts of interest.

Abbreviations

The following abbreviations are used in this manuscript:
HFSWRHigh-frequency surface wave radar
EEZExclusive economic zone
OTHROver the horizon radar
FMCWFrequency-modulated continuous wave
HFHigh Frequency
FFTFast Fourier transform
DoADirection of arrival
CNNConvolutional neural network
DLDeap learning
MUSIC  Multiple signal classification
A/DAnalog to digital
MRAMain response axis
AISAutomatic identification system
HRHigh resolution
RFRadio frequency
RMSERoot mean square error
RDRange–Doppler

References

  1. Jankiraman, M. FMCW Radar Design, Kindle ed.; Artech House: London, UK, 2018. [Google Scholar]
  2. Hinz, J.O.; Zodielzer, U.A. MIMO FMCW Radar Approach to HFSWR. Adv. Radio Sci. 2011, 9, 159–163. [Google Scholar] [CrossRef]
  3. Oh, D.; Ju, Y.; Nam, H.; Lee, J.-H. Dual Smoothing DOA Estimation of Two-channel FMCW Radar. IEEE Trans. Aerosp. Electron. Syst. 2016, 52, 904–917. [Google Scholar] [CrossRef]
  4. Gurgel, K.; Schlick, T. Remarks on Signal Processing in HF Radars Using FMCW Modulation. In Proceedings of the International Radar Symposium IRS 2009, Hamburg, Germany, 9–11 September 2009. [Google Scholar]
  5. Ponsford, A.M. Surveillance of the 200 nautical mile Exclusive Economic Zone (EEZ) using high frequency surface wave radar. Can. J. Remote Sens. 2001, 27, 354–360. [Google Scholar]
  6. Sevgi, L.; Ponsford, A.; Chan, H.C. Integrated Maritime surveillance system based on high–frequency surface–wave radars. 1. Theoretical background and numerical simulations. IEEE Antennas Propag. Mag. 2001, 43, 20–43. [Google Scholar] [CrossRef]
  7. Ponsford, A.; Sevgi, L.; Chan, H.C. An integrated Maritime surveillance system based on high–frequency surface–wave radars. 2. Operational status and system performance. IEEE Antennas Propag. Mag. 2001, 43, 52–63. [Google Scholar] [CrossRef] [PubMed]
  8. Jankiraman, M. Design of Multi-Frequency CW Radars, 2nd ed.; SciTech Publishing: Raleigh, NC, USA, 2007. [Google Scholar]
  9. Hwang, J.; Kim, S.; Kang, K.; Kim, D.-J. Design and Manufacture of FMCW Radar with Multi-frequency Bandwidths. J. Korea Inst. Electromagn. Eng. Sci. 2016, 27, 377–387. [Google Scholar] [CrossRef]
  10. Leong, H.; Ponsford, A.M. The Advantage of Dual-frequency Operation in Ship Tracking by HF Surface Wave Radar. In Proceedings of the SEE RADAR 2004, Toulouse, France, 9 May 2004. [Google Scholar]
  11. Huang, X.; Wen, B.; Ding, F. Ship Detection and Tracking Using Multi-frequency HFSWR. IEICE Electron. Express 2010, 7, 410–415. [Google Scholar] [CrossRef]
  12. Emery, D.J.; Dickel, G. The Operation and Performance of a Multi-frequency HF Surfacewave Radar. In Proceedings of the 2008 IEEE Radar Conference, Rome, Italy, 26–30 May 2008; pp. 1–6. [Google Scholar]
  13. Fernandez, D.M.; Vesecky, J.F.; Barrick, D.E.; Teague, C.C.; Plume, M.M.; Whelan, C. Detection of Ships with Multi-frequency and CODAR Seasonde HF Radar Systems. Can. J. Remote Sens. 2001, 27, 277–290. [Google Scholar] [CrossRef]
  14. Vesecky, J.F.; Laws, K.; Paduan, J.D. Monitoring of Coastal Vessels Using Surface Wave HF Radars: Multiple Frequency, Multiple Site and Multiple Antenna Considerations. In Proceedings of the IGARSS 2008—2008 IEEE International Geoscience and Remote Sensing Symposium, Boston, MA, USA, 7–11 July 2008. [Google Scholar]
  15. Wang, F.; Gao, H.; Zhou, L. A Design of Multi-frequency High-frequency Radar Receiver System. In Proceedings of the 2011 7th International Conference on Wireless Communications, Networking and Mobile Computing, Wuhan, China, 23–25 September 2011. [Google Scholar]
  16. El-Shennawy, M.; Al-Qudsi, B.; Joram, N.; Ellinger, F. A Dual Band FMCW Radar Receiver with Integrated Active Balun and Baseband AGC Loop. In Proceedings of the 2017 IEEE International Symposium on Circuits and Systems (ISCAS), Baltimore, MD, USA, 28–31 May 2017. [Google Scholar]
  17. Jin, Y.; Kim, B.; Kim, S.; Lee, J. Design and Implementation of FMCW Surveillance Radar Based on Dual Chirps. Elektron. Ir Elektrotechnika 2018, 24, 60–66. [Google Scholar] [CrossRef]
  18. Menelle, M.; Jangal, F.; Bazin, V.; Lecoz, D.; Auffray, G. Bi-static and Multi-frequency Experiments of HFSWR. In Proceedings of the OCEANS 2009, Biloxi, MS, USA, 9 May 2009. [Google Scholar]
  19. Tian, Y.; Wen, B.; Li, Z.; Hou, Y.; Tian, Z.; Huang, W. Fully Digital Multi-frequency Compact High-frequency Radar System for Sea Surface Remote Sensing. IET Radar Sonar Navig. 2019, 13, 1359–1365. [Google Scholar] [CrossRef]
  20. Qiao, C.; Shen, F.; Wang, X.; Wang, R.; Cao, F.; Zhao, S.; Li, C. A Novel Multi-frequency Coordinated Module for SAR Ship Detection. In Proceedings of the 2022 IEEE 34th International Conference on Tools with Artificial Intelligence (ICTAI), Macao, China, 31 October–2 November 2022. [Google Scholar]
  21. Cardillo, E.; Ferro, L. Multi-frequency Analysis of Microwave and Millimeter-wave Radars for Ship Collision Avoidance. In Proceedings of the 2022 Microwave Mediterranean Symposium (MMS), Pizzo Calabro, Italy, 9–13 May 2022. [Google Scholar]
  22. Del Prete, R.; Graziano, M.D.; Grasso, M.; Renga, A.; Cricielli, L.; Centobelli, P.; Moccia, A.; Piscane, V.; Aurigemma, R.; Virelli, M. Maritime Monitoring by Multi-frequency SAR Data. In Proceedings of the IGARSS 2022—2022 IEEE International Geoscience and Remote Sensing Symposium, Kuala Lumpur, Malaysia, 17–22 July 2022. [Google Scholar]
  23. Del Prete, R.; Graziano, M.D.; Crispino, G.; Ostrogovich, L.; Renga, A. Multi-frequency and Multi-mission SAR Imagery for Maritime Surveillance by Deep Learning. In Proceedings of the 2023 IEEE International Workshop on Metrology for the Sea; Learning to Measure Sea Health Parameters (MetroSea), La Valletta, Malta, 4–6 October 2023; pp. 390–394. [Google Scholar]
  24. Lee, K.Y.; Bretschneider, T.R. Improved Ship Detection Using Dual-frequency Polarimetric Synthetic Aperture Radar Data. In Proceedings of the 2011 IEEE International Geoscience and Remote Sensing Symposium, Vancouver, BC, Canada, 24–29 July 2011; pp. 2274–2277. [Google Scholar]
  25. Trizna, D.; Xu, L. Target Classification and Remote Sensing of Ocean Current Shear Using a Dual-use Multifrequency HF Radar. IEEE J. Ocean. Eng. 2006, 31, 904–918. [Google Scholar] [CrossRef]
  26. Trizna, D.B. Tsunami Detection Using Multi-frequency Beam-forming HF Radar. In Proceedings of the OCEANS 2006—Asia Pacific, Singapore, 16–19 May 2006. [Google Scholar]
  27. Tian, Y.; Wen, B.; Zhou, H.; Wang, C.; Yang, J.; Huang, W. Wave Height Estimation from First-Order Backscatter of a Dual-Frequency High Frequency Radar. Remote Sens. 2017, 9, 1186. [Google Scholar] [CrossRef]
  28. Ma, Y.; Huang, W.; Gill, E.W. High-Frequency Radar Ocean Surface Cross Section Incorporating a Dual-Frequency Platform Motion Model. IEEE J. Ocean. Eng. 2018, 43, 195–204. [Google Scholar] [CrossRef]
  29. Tian, Y.; Wen, B.; Zhou, H. Measurement of High and Low Waves Using Dual-frequency Broad-beam HF Radar. IEEE Geosci. Remote Sens. Lett. 2014, 11, 1599–1603. [Google Scholar] [CrossRef]
  30. Watts, S.; Herselman, P.L.; Baker, C.J.; de Wind, H.J. An Analysis of X-band Calibrated Sea Clutter and Small Boat Reflectivity at Medium-to-low Grazing Angles. Int. J. Navig. Obs. 2008, 2008, 1–14. [Google Scholar]
  31. Panagopoulos, S.; Soraghan, J.J. Small-target detection in sea clutter. IEEE Trans. Geosci. Remote Sens. 2004, 42, 1355–1361. [Google Scholar] [CrossRef]
  32. Ivanov, D.V.; Ivanov, V.A.; Katkov, E.V.; Ovchinnikov, V.V.; Ryabova, M.I. Positioning of Dynamic Objects by Means of Systems of Multi-frequency Sounding of HF Radio Paths with the Use of FMCW Signals. In Proceedings of the 2018 2nd URSI Atlantic Radio Science Meeting (AT-RASC), Gran Canaria, Spain, 28 May–1 June 2018. [Google Scholar]
  33. Anderson, S.J.; Mei, F.J.; Peinan, J. Enhanced OTHR ship detection via dual frequency operation. In Proceedings of the 2001 CIE International Conference on Radar Proceedings, Beijing, China, 15–18 October 2001; pp. 85–89. [Google Scholar]
  34. Li, L.; Wu, X.; Yan, S. Drifter Trajectory Tracking Experiment and Analysis with Multi-frequency HFSWR in the East China Sea. Wuhan Univ. J. Nat. Sci. 2011, 16, 541–547. [Google Scholar] [CrossRef]
  35. Ji, Y.; Zhang, J.; Wang, Y.; Chu, X. Vessel Target Detection Based on Fusion Range-doppler Image for Dual-frequency High-frequency Surface Wave Radar. IET Radar Sonar Navig. 2016, 10, 333–340. [Google Scholar] [CrossRef]
  36. Ji, Y.G.; Zhang, J.; Wang, Y.M. Ship Detection Point Association and Fusion with Dual-frequency HF Surface Wave Radar. Syst. Eng. Electron. 2016, 36, 266–271. [Google Scholar]
  37. Ji, Y.; Liu, A.; Chen, X.; Wang, J.; Yu, C. Target Detection Method for High-Frequency Surface Wave Radar RD Spectrum Based on (VI)CFAR-CNN and Dual-Detection Maps Fusion Compensation. Remote Sens. 2024, 16, 332. [Google Scholar] [CrossRef]
  38. Rahman, M.M.; Gurbuz, S.Z. Multi-frequency RF Sensor Data Adaptation for Motion Recognition with Multi-modal Deep Learning. In Proceedings of the 2021 IEEE Radar Conference (RadarConf21), Atlanta, GA, USA, 7–14 May 2021. [Google Scholar]
  39. Patole, S.; Torlak, M.; Wang, D.; Ali, M. Automotive radars: A review of signal processing techniques. IEEE Signal Process. Mag. 2017, 34, 22–35. [Google Scholar] [CrossRef]
  40. Engels, F.; Heidenreich, P.; Zoubir, A.M.; Jondral, F.K.; Wintermantel, M. Advances in Automotive Radar: A Framework on Computationally Efficient High-resolution Frequency Estimation. IEEE Signal Process. Mag. 2017, 34, 36–46. [Google Scholar] [CrossRef]
  41. Bialer, O.; Jonas, A.; Tirer, T. Super Resolution Wide Aperture Automotive Radar. IEEE Sens. J. 2021, 21, 17846–17858. [Google Scholar] [CrossRef]
  42. Sun, Y.; Fei, T.; Pohl, N. A High-resolution Framework for Range-doppler Frequency Estimation in Automotive Radar Systems. IEEE Sens. J. 2019, 19, 11346–11358. [Google Scholar] [CrossRef]
  43. Kim, B.; Jin, Y.; Lee, J.; Kim, S. High-Efficiency Super-Resolution FMCW Radar Algorithm Based on FFT Estimation. Sensors 2021, 21, 4018. [Google Scholar] [CrossRef]
  44. Wang, G.; Lu, Y. High Resolution MIMO-HFSWR Using Sparse Frequency Waveform. In Proceedings of the 2008 9th International Conference on Signal Processing, Beijing, China, 26–29 October 2008; pp. 2238–2241. [Google Scholar]
  45. Xie, J.; Yuan, Y.; Liu, Y. Super-Resolution Processing for HF Surface Wave Radar Based on Pre-Whitened MUSIC. IEEE J. Ocean. Eng. 1998, 23, 313–321. [Google Scholar]
  46. Golubović, D.; Erić, M.; Vukmirović, N. High-Resolution Doppler and Azimuth Estimation and Target Detection in HFSWR: Experimental Study. Sensors 2022, 22, 3558. [Google Scholar] [CrossRef]
  47. Golubović, D.; Erić, M.; Vukmirović, N.; Vukmirović, N. Improved Detection of Targets on the High-resolution Range-Doppler Map in HFSWRs. In Proceedings of the 23rd International Symposium INFOTEH-JAHORINA (INFOTEH), East Sarajevo, Bosnia and Herzegovina, 20–22 March 2024. [Google Scholar]
  48. Golubović, D.; Vukmirović, N.; Erić, M.; Simić-Pejović, M. Method for Noise Subspace Determination in HFSWR’s High-resolution Range-Doppler Map Estimation. In Proceedings of the 10th International Conference on Electrical, Electronic and Computing Engineering (IcETRAN), East Sarajevo, Bosnia and Herzegovina, 5–8 June 2023. [Google Scholar]
  49. Golubović, D.; Erić, M.; Vukmirović, N. High-resolution Method for Primary Signal Processing in HFSWR. In Proceedings of the 30th European Signal Processing Conference (EUSIPCO), Belgrade, Serbia, 29 August–2 September 2022. [Google Scholar]
  50. Golubović, D.; Vukmirović, N.; Erić, M. An Introduction to Vessel Tracking in HFSWRs Based on a High-Resolution Range-Doppler Map: Some Preliminary Results and Challenges. In Proceedings of the 13th Mediterranean Conference on Embedded Computing (MECO), Budva, Montenegro, 11–14 June 2024. [Google Scholar]
  51. Golubović, D.; Vukmirović, N.; Lončarević, Z.; Marković, M.; Erić, M. Execution Time Improvement using CPU Parallelization and Non-Uniform High-Resolution Range-Doppler Map Estimation in HFSWR. In Proceedings of the 9th International Conference on Electrical, Electronic and Computing Engineering (IcETRAN 2022), Novi Pazar, Serbia, 6–9 June 2022; pp. 717–722. [Google Scholar]
  52. Rissanen, J. Modeling by shortest data description. Automatica 1978, 14, 465–471. [Google Scholar] [CrossRef]
  53. Wax, M.; Ziskind, I. Detection of the Number of Coherent Signals by the MDL Principle. IEEE Trans. Acoust. Speech. Signal Process. 1989, 37, 1190–1196. [Google Scholar] [CrossRef]
  54. Akaike, H. A New Look at the Statistical Model Identification. IEEE Trans. Automat. Contr. 1974, 19, 716–723. [Google Scholar] [CrossRef]
  55. Erić, M.; Dzolić, B.; Golubović, D.; Marjaniović, D. Testing Report of the Detectability of Small Boats Using OTHR for Tests Performed on October 25, 2021; Vlatacom Institute Technical Report; Vlatacom Institute: Belgrade, Serbia, 2021. [Google Scholar]
  56. Erić, M.; Dzolić, B.; Marković, L.; Golubović, D.; Marjaniović, D.; Petrović, N.; Dučić, S. Elaborate on Upgrade of Hardware, Software, Calibration and Commissioning of Exe Program for Real-Time Detection in 32-Antenna Monostatic Architecture of OTHR2 Radar for Work at the Nominal Frequency 9.6 MHz; Vlatacom Institute Technical Report; Vlatacom Institute: Belgrade, Serbia, 2021. [Google Scholar]
Figure 1. A monostatic system model of the HFSWR which operates at two frequencies.
Remotesensing 16 03476 g001
Figure 2. Practical implementation of used antenna arrays: (a) The layout of the linear Rx antenna subarray in the planar array (b) and the appearance of the Tx antenna array.
Remotesensing 16 03476 g002
Figure 3. The planar Rx antenna array geometry in the xy plane consisting of two linear subarrays.
Remotesensing 16 03476 g003
Figure 4. Chirp signals (solid blue line) at the Tx side and chirp signal at the Rx side (dashed red line).
Remotesensing 16 03476 g004
Figure 5. The concept of chirp signal generation at the Tx side for a bi-frequency system.
Remotesensing 16 03476 g005
Figure 6. The model of Rx antenna array used in the bi-frequency system.
Remotesensing 16 03476 g006
Figure 7. The appearance of the real and imaginary components of the received signal on all antennas for a successfully synchronized bi-frequency system.
Remotesensing 16 03476 g007
Figure 8. Block diagram of high-resolution primary signal processing in bi-frequency HFSWR.
Remotesensing 16 03476 g008
Figure 9. An example of the appearance of a high-resolution RD map at 9.2 MHz.
Remotesensing 16 03476 g009
Figure 10. The comparison of existing signal processing methods and the proposed method for systems that operate at two frequencies.
Remotesensing 16 03476 g010
Figure 11. The method for the focusing of RD maps in bi-frequency HFSWRs.
Remotesensing 16 03476 g011
Figure 12. An example of focusing one normalized frequency on the corresponding axis.
Remotesensing 16 03476 g012
Figure 13. Comparative display of axes with normalized frequencies in the case when G = 2 .
Remotesensing 16 03476 g013
Figure 14. The result of target detection procedure in bi-frequency HFSWR (detections are denoted by “+” markers, and blue peaks represent the criterion function of the MUSIC-based algorithm).
Remotesensing 16 03476 g014
Figure 15. Azimuth estimation of an arbitrarily chosen target from the RD-HR map.
Remotesensing 16 03476 g015
Figure 16. (a) The appearance of the averaged RD-HR map for frequencies 4.6 MHz (b) and then for 9.2 MHz adjusted to the frequency 4.6 MHz, (c) as well as the appearance of the focused HR-HR map.
Remotesensing 16 03476 g016
Figure 17. Averaged number of detections per one integration period obtained by high-resolution bi-frequency algorithm using different values of algorithm parameters.
Remotesensing 16 03476 g017
Figure 18. Cumulative display of detections for the frequency 4.6 MHz and selected 10 ships (green contours).
Remotesensing 16 03476 g018
Figure 19. Cumulative display of detections for the frequency 9.2 MHz and selected 10 ships (green contours).
Remotesensing 16 03476 g019
Figure 20. Cumulative display of detections for the bi-frequency mode of operation and selected 10 ships (green contours).
Remotesensing 16 03476 g020
Figure 21. The number of detections for each of the ships in the bi-frequency mode of operation (8 + 8 antennas).
Remotesensing 16 03476 g021
Figure 22. (a) The boat used for testing (b) and its trajectory.
Remotesensing 16 03476 g022
Figure 23. (a) Filtered boat detections according to the spatial criterion (b) and the fitted curve between the obtained detections.
Remotesensing 16 03476 g023
Figure 24. The number of small boat detections for different high-resolution algorithm parameters in the bi-frequency mode of operation.
Remotesensing 16 03476 g024
Figure 25. Small boat probability of detection for different high-resolution algorithm parameters in the bi-frequency mode of operation.
Remotesensing 16 03476 g025
Table 1. Computational resolution improvement with the proposed primary signal processing in HFSWRs in relation to the existing radars, such as WERA.
ParameterWERAProposed HR MethodResolution Improvement
Range resolution1.5 km375 m 4 ×
Doppler frequency resolution0.015 Hz0.0038 Hz 4 ×
Azimuth resolution 1 0.2 5 ×
Table 2. Parameters of high-resolution algorithms which are used in bi-frequency mode of operation.
ParameterValue
System typebi-frequency
Antenna arrayplanar
Number of Rx antennas32
Frequency4.6 MHz and 9.2 MHz
Doppler grid points513
Range grid points797
Range resolution375 m
Doppler resolution0.0038 Hz
Azimuth resolution 0.2
Chirp duration (T)0.256 s
Segment length (M)256
Integration period65.536 s
Number of additional frames (L)64
Time after which new results are generated32 s
Number of samples within the frame (P)1536
Table 3. The comparison of the detectability of ships for subsystems that operate at one frequency and for different values of proposed algorithm parameters.
Ship Number K = 5 K = 10 K = 5 K = 10 K = 5 K = 10
γ = 0.05 γ = 0.05 γ = 0.1 γ = 0.1 γ = 0.2 γ = 0.2
SHIP 19.2 MHz4.6 MHz9.2 MHz9.2 MHz9.2 MHz9.2 MHz
SHIP 24.6 MHz4.6 MHz4.6 MHz4.6 MHz4.6 MHz4.6 MHz
SHIP 34.6 MHz4.6 MHz4.6 MHz4.6 MHz4.6 MHz4.6 MHz
SHIP 44.6 MHz4.6 MHz4.6 MHz4.6 MHz4.6 MHz4.6 MHz
SHIP 54.6 MHz4.6 MHz4.6 MHz4.6 MHz4.6 MHz4.6 MHz
SHIP 69.2 MHz9.2 MHz9.2 MHz9.2 MHz9.2 MHz9.2 MHz
SHIP 74.6 MHz4.6 MHz4.6 MHz4.6 MHz4.6 MHz4.6 MHz
SHIP 89.2 MHz4.6 MHz9.2 MHz9.2 MHz4.6 MHz9.2 MHz
SHIP 94.6 MHz4.6 MHz4.6 MHz4.6 MHz4.6 MHz4.6 MHz
SHIP 104.6 MHz4.6 MHz4.6 MHz4.6 MHz4.6 MHz4.6 MHz
Table 4. Technical specifications of the small boat used for testing.
ParameterValue
TypeMRTP 16
Length17.75 m
Beam Max4.19 m
Draught1.3 m
Max Speed65+ knots (Fully Loaded)
Main Propulsion SystemDiesels, 2 × 800 kW–2 × 1450 kW
Range300+ Nautical Miles
Full Capacity2800 L
Bot Crew5
Mission Crew6
Table 5. Basic information about the conducted testing.
ParameterValue
Ship typeMRTP 16
Test duration42 min
Start time08:31:53
End time09:13:57
Number of trackpoints2556
Max speed64.7 km/h
Averaged speed29.3 km/h
Averaged speed in movement31.4 km/h
Time in movement38 min
Track Stats based onTotal time|Time in movement
Table 6. False alarm probability for different high-resolution algorithm parameters.
ParametersSystem at 4.6 MHzSystem at 9.2 MHzBi-Frequency System
K = 5 , γ = 0.05 3.1252 × 10 4 5.1004 × 10 4 5.3272 × 10 4
K = 10 , γ = 0.05 4.5278 × 10 4 8.6553 × 10 4 9.1144 × 10 4
K = 5 , γ = 0.1 2.9934 × 10 4 4.7098 × 10 4 5.0903 × 10 4
K = 10 , γ = 0.1 3.7230 × 10 4 4.8252 × 10 4 5.5266 × 10 4
K = 5 , γ = 0.2 8.6667 × 10 5 9.5278 × 10 5 1.6333 × 10 4
K = 10 , γ = 0.2 1.5232 × 10 4 1.5887 × 10 4 1.5990 × 10 4
Table 7. RMSE of distance, azimuth and Doppler frequency, related to the bi-frequency mode of operation.
Parameters RMSE r [m] RMSE θ [°] RMSE μ [Hz]
K = 5 , γ = 0.05 711 15.97 × 10 2 274
K = 10 , γ = 0.05 620 14.20 × 10 2 338
K = 5 , γ = 0.1 871 15.11 × 10 2 287
K = 10 , γ = 0.1 745 15.32 × 10 2 321
K = 5 , γ = 0.2 832 14.99 × 10 2 373
K = 10 , γ = 0.2 899 15.85 × 10 2 289
Disclaimer/Publisher’s Note: The statements, opinions and data contained in all publications are solely those of the individual author(s) and contributor(s) and not of MDPI and/or the editor(s). MDPI and/or the editor(s) disclaim responsibility for any injury to people or property resulting from any ideas, methods, instructions or products referred to in the content.