Article

Assessing the Impact of Agricultural Practices and Urban Expansion on Drought Dynamics Using a Multi-Drought Index Application Implemented in Google Earth Engine: A Case Study of the Oum Er-Rbia Watershed, Morocco

by
Imane Serbouti
1,
Jérôme Chenal
1,2,
Biswajeet Pradhan
3,*,
El Bachir Diop
1,
Rida Azmi
1,
Seyid Abdellahi Ebnou Abdem
1,
Meriem Adraoui
1,
Mohammed Hlal
1 and
Mariem Bounabi
1
1
Center of Urban Systems (CUS), Mohammed VI Polytechnic University (UM6P), Ben Guerir 43150, Morocco
2
Urban and Regional Planning Community (CEAT), Ecole Polytechnique Fédérale de Lausanne (EPFL), 1015 Lausanne, Switzerland
3
Centre for Advanced Modelling and Geospatial Information Systems (CAMGIS), School of Civil and Environmental Engineering, Faculty of Engineering and Information Technology, University of Technology Sydney, Ultimo, NSW 2007, Australia
*
Author to whom correspondence should be addressed.
Remote Sens. 2024, 16(18), 3398; https://doi.org/10.3390/rs16183398
Submission received: 10 July 2024 / Revised: 8 September 2024 / Accepted: 9 September 2024 / Published: 12 September 2024

Abstract

:
Drought monitoring is a critical environmental challenge, particularly in regions where irrigated agricultural intensification and urban expansion pressure water resources. This study assesses the impact of these activities on drought dynamics in Morocco’s Oum Er-Rbia (OER) watershed from 2002 to 2022, using the newly developed Watershed Integrated Multi-Drought Index (WIMDI), through Google Earth Engine (GEE). WIMDI integrates several drought indices, including SMCI, ESI, VCI, TVDI, SWI, PCI, and SVI, via a localized weighted averaging model (LOWA). Statistical validation against various drought-type indices including SPI, SDI, SEDI, and SMCI showed WIMDI’s strong correlations (r-values up to 0.805) and lower RMSE, indicating superior accuracy. Spatiotemporal validation against aggregated drought indices such as VHI, VDSI, and SDCI, along with time-series analysis, confirmed WIMDI’s robustness in capturing drought variability across the OER watershed. These results highlight WIMDI’s potential as a reliable tool for effective drought monitoring and management across diverse ecosystems and climates.

1. Introduction

Droughts are intricate and multifaceted climatic hazards that have profound repercussions on society, ecosystems, and the economy [1]. These slow-onset events, influenced by natural climatic variations, can persist for weeks to years [2]. While they cause substantial economic, environmental, and human distress, droughts often go unnoticed compared to more visible disasters like floods or storms [3,4]. The immediate, quantifiable damage caused by floods and storms contrasts with the underestimated impacts of droughts due to their gradual development and indirect effects [5].
Drought severity is influenced by factors such as insufficient rainfall [6], groundwater depletion [7], inadequate soil moisture [8], and socio-economic impacts [9]. These factors categorize droughts into four types: meteorological (related to reduced precipitation), agricultural (due to decreased soil moisture), hydrological (from diminished surface and groundwater), and socio-economic (stemming from a supply–demand imbalance) [10].
Droughts can be characterized by their spatial and temporal extent, duration, and intensity [11]. In Morocco, numerous researchers have investigated various parameters to comprehensively understand drought phenomena [12,13,14,15,16,17,18,19,20]; particularly, the OER watershed, which has experienced significant land-use changes over the past two decades that were primarily driven by irrigated agricultural intensification and urban expansion [21,22,23]. Recent studies have shown that these activities have led to increased water demand, soil degradation, and altered hydrological cycles, thereby exacerbating the region’s vulnerability to droughts [24,25,26]. Urban expansion has further stressed the watershed’s water resources, with growing urban areas encroaching on agricultural lands and natural water infiltration zones, leading to reduced groundwater recharge and increased surface runoff [21,22,25]. This watershed is vital for multiple uses across the regions it encompasses. It supports agriculture by providing necessary irrigation water, supplies drinking water to urban and rural populations, and is a source of hydroelectric power [27]. This multipurpose utility makes it critically important to the socio-economic structure of Morocco.
However, based on the time-series analysis conducted in this research, the OER watershed faced significant drought events during the study period from 2002 to 2022, specifically in the years 2005, 2010, and 2022, which were classified as severe, moderate, and extreme droughts, respectively. These droughts had profound impacts on the region, including increased competition for water resources, which collectively strained agricultural productivity, disrupted hydrological balances, and threatened socio-economic stability, leading to water shortages and reduced agricultural income.
The OER watershed is critically at risk of drought, where water scarcity is compounded by agricultural activities and urban expansion. This watershed, serving a critical economic role both locally and nationally, faces significant threats from recurrent drought conditions intensified by climatic changes and anthropogenic pressures [18,19]. The research concentrated on drought within the OER watershed has offered an extensive analysis of climate change’s effects on water resources [17], analyzed trends and future projections related to water availability and drought scenarios [14], and assessed historical drought patterns and trends using observational data [28].
Monitoring drought is crucial, especially in arid and semi-arid areas where water scarcity presents substantial threats to agriculture, ecosystems, and local economies [23,24]. The challenge is exacerbated by the increasing variability in climate patterns, which demands more precise measures of drought indices and adaptable monitoring tools [24,25,26]. The importance of a drought monitoring system is multifaceted. It allows for early drought detection and is a critical mitigation action for several compelling reasons [27,28,29,30,31]: it enables proactive mitigation strategies [32,33,34,35,36], provides accurate and timely data for informed decision making [37], and minimizes economic impacts on agriculture-dependent economies [9,38,39].
The OER Basin exhibits a high level of complexity due to its diverse hydrological and ecological characteristics [21,22]. It includes varied climates and landscapes, from the snow-capped Middle Atlas Mountains to fertile plains and eventually the Atlantic coast [23]. Managing such a diverse and dynamic water system, with multiple needs from agricultural, urban, and ecological users, involves significant challenges [21,22,23]. This makes the OER watershed a pertinent case study for understanding the multifaceted impacts of drought exacerbated by human activities.
In recent years, there has been a marked increase in the frequency and intensity of droughts worldwide, leading to a significant rise in interest in drought monitoring through big data analytics [33,34]. Implementing a drought monitoring application using Google Earth Engine (GEE), particularly in vulnerable countries, is a strategic approach to harnessing cutting-edge technology for environmental resilience [40]. By integrating multi-source, multi-product satellite imagery, and comprehensive environmental data, a GEE application can provide actionable insights for timely response and preparedness. This will help mitigate the adverse effects of droughts on agriculture and ecosystems and enhance socio-economic stability by supporting informed decision making at all levels of governance [23,24,25,26,27,28,29,30,31,32,33,34,35,36].
However, research that utilizes advanced computational tools to analyze large-scale remote sensing datasets and integrate multiple drought indices for monitoring in Morocco is limited, particularly for the OER basin. Previous research has investigated agricultural expansion over a forty-year period in Morocco’s OER valley, comparing the effectiveness of the GEE with the Sentinel Application Platform in monitoring these changes [41,42]. Another study highlighted the use of GEE for assessing environmental change impacts on natural resources in the Middle Atlas region, utilizing Landsat imagery and the Random Forest algorithm to analyze land-use changes over three decades [43].
It is well known that the effects of drought vary significantly due to factors such as local climate, local environment, the nature of the drought, affected communities, economic conditions, and societal responses [44]. The OER basin, with its varied climate, environment, and nature of drought (meteorological, agricultural, hydrological, and socio-economic), requires new indices that consider the multifaceted nature of drought.
In this context, the primary objective of this study is to assess the impact of intensive irrigated agricultural practices and urban expansion on drought dynamics within Morocco’s OER watershed over a 20-year period (2002–2022). This assessment is conducted using a novel Google Earth Engine (GEE) application that integrates multiple drought indices through a localized ordered weighted averaging (LOWA) model.
To achieve this, several secondary objectives are addressed. First, the development of a new Watershed Integrated Multi-Drought Index (WIMDI) is undertaken by integrating various traditional remote sensing indices such as the Soil Moisture Condition Index (SMCI), Evaporative Stress Index (ESI), Vegetation Condition Index (VCI), Temperature– Vegetation Dryness Index (TVDI), Standardized Water Index (SWI), Precipitation Condition Index (PCI), and Standardized Vegetation Index (SVI). To enhance the findings of our research, VCI and TVDI were calculated using the Universal Pattern Decomposition method applied to the Vegetation Index (VIUPD) derived from MODIS data, and SMCI was extracted utilizing the GLDAS-2.1 product. Second, the study aims to validate the effectiveness of the WIMDI in multi-drought monitoring by conducting both statistical and spatiotemporal validations. The statistical validation was performed using a variety of drought-type indices, including the Standardized Precipitation Evapotranspiration Index (SPEI) and Standardized Precipitation Index (SPI) for meteorological drought [45,46], Streamflow Drought Index (SDI) for hydrological drought [47], Socio-Economic Drought Index (SEDI) for socio-economic drought [48], and SMCI for agricultural drought [49]. WIMDI demonstrated strong correlations with these indices, with r-values reaching up to 0.805, in addition to lower RMSE values, indicating its superior accuracy. Additionally, a comprehensive spatiotemporal validation was conducted by comparing WIMDI against widely used aggregated drought indices, such as the Vegetation Health Index (VHI), Scaled Drought Condition Index (SDCI) and Vegetation Drought Synthesized Index (VDSI). This validation confirmed WIMDI’s effectiveness in capturing the spatial and temporal variability of drought conditions across diverse climate zones within the OER watershed, focusing on the effects of rapid urbanization and irrigated agricultural intensification. Finally, given the increasing issues posed by intensive irrigated agricultural practices, urban expansion, and recurrent drought events in the OER watershed, this study addresses the urgent need for a comprehensive drought monitoring system by developing the WIMDI. This index is designed for real-world application, providing actionable tools for effective drought monitoring, early warning systems, and sustainable watershed management.

2. Materials and Methods

2.1. Study Area

The OER watershed is located in central-western Morocco, spanning latitudes between 31°15′N and 33°22′N and longitudes between 5°00′W and 9°20′W (Figure 1). This region ranks among the largest watersheds in Morocco, encompassing approximately 35,000 km2, which constitutes about 7% of Morocco’s total area [17]. To the east, the OER watershed is bounded by the Atlas Mountains, comprising two main sections: the Middle Atlas (oriented NNE-SSW) and the High Atlas (oriented NE-SW). These mountains serve as the principal source of water supply for the downstream areas [50,51].
The highest peak in the basin reaches 3890 m above sea level (a.s.l) [39]. The hydrographic network of the basin is primarily composed of the OER River, the second-largest river in Morocco with a length of 550 km. This river originates in the Middle Atlas at an elevation of 1800 m a.s.l. The basin is also fed by several tributaries, including the Tassaout, El Abid, Lakhdar, Derna, Melloul, Ouamana, Srou, Chbouka, Ouirine, Gzef, El Touim, and Faragh rivers [39,40]. The river spans 550 km until it reaches its outflow into the Atlantic Ocean [41]. Within the OER basin, there are numerous hydraulic infrastructures, including fifteen reservoirs. Among these, the main dams from the headwaters to the mouth are Bin El Ouidane, Ahmed El Hansali, and Al Massira. These dams are crucial for generating hydroelectric power, providing water for urban consumption, safeguarding potable water, and supporting economic activities. They also supply water for irrigated agriculture, which is the primary user of water within the river basin, particularly for irrigating agricultural plains [41,42]. Agriculture consumes most of the water in the OER River Basin, using around 2856 m3 per year to irrigate 450,000 hectares of agricultural land [41,42]. The climate of the OER basin ranges from the coastal climate on the Atlantic coast to an orographic climate in the Middle Atlas Mountains, through an arid climate in the Rehamna plain and semi-arid in the Tadla plain. In January, the average lowest temperature is 3.5 °C, whereas the average maximum temperature in August reaches 38 °C. The temperature in the region can vary widely, ranging from 10 °C to 50 °C. Evaporation rates are substantial, ranging between 1600 and 1800 mm per year.
According to ISKANE Ingeniérie (2009) [43], the average annual rainfall in the basin varies from 200 mm in the downstream plains to 1100 mm in the Middle Atlas Mountains. Most of this rainfall, approximately 70–80%, occurs between October and May, which constitutes the rainy season [52].
The OER basin is recognized as one of the most polluted basins in Morocco, primarily due to high urban density and human activities such as agriculture, industrialization, mining, and wastewater discharge from both urban and rural areas [53,54].

2.2. Remotely Sensed Data

This study utilizes seven remotely sensed derived indices (SWI, ESI, SVI, VCI, TDVI, PCI, and SMCI) to monitor the environmental impact of drought in the OER watershed from 2002 to 2022. These indicators are calculated using the Google Earth Engine platform.

2.2.1. MODIS Data

The Moderate Resolution Imaging Spectroradiometer (MODIS) is a medium-resolution imaging spectrometer mounted on the Terra and Aqua satellites [45,46]. It is a vital component of the U.S. Earth Observing System (EOS) and is used to monitor global biological and physical phenomena [46]. MODIS captures electromagnetic energy across a wide spectrum, enabling analysis of ecological, meteorological, and hydrological conditions on Earth [55]. For the research spanning from 2002 to 2022, MODIS data were sourced from the GEE platform. This included several products (Table 1), namely, the MOD11A2 land surface temperature and emissivity at an 8-day temporal resolution, using a 1 km spatial resolution [56] with all data adjusted to a 500 m spatial resolution for consistency in analysis; MOD13Q1 vegetation index compiles data updates every 16 days throughout the year with a 250 m spatial resolution, incorporating NDVI and EVI indices [57,58,59]; the MOD16A2 product provides estimates of evapotranspiration (ET) and potential evapotranspiration (PET) [51,52]; and the MOD09GA product provides daily surface reflectance data, which can be used to calculate the Normalized Difference Water Index (NDWI) [60,61].

2.2.2. CHIRPS Data

The CHIRPS (Climate Hazards Group InfraRed Precipitation with Station data) is a precipitation dataset developed by the Climate Hazards Group at the University of California, Santa Barbara. It offers high-resolution rainfall estimates globally by integrating satellite imagery with in situ station data. This integration enables the creation of gridded rainfall time series, which are utilized for trend analysis and seasonal drought monitoring purposes [63]. CHIRPS is especially valued for its ability to combine high temporal resolution with a fine spatial resolution of approximately 0.05 degrees, which is roughly 5 km. It offers both daily and monthly aggregated precipitation estimates, making it a crucial tool for environmental scientists, agronomists, and meteorologists [64]. This dataset is particularly useful in regions where ground-based monitoring systems are sparse but where rainfall monitoring and accurate historical precipitation data are critical for agricultural planning, drought assessment, and water resource management [65]. CHIRPS data used in this study are available at https://www.chc.ucsb.edu/data/chirps (accessed on 14 May 2024).

2.2.3. GLDAS-2.1 Soil Moisture Data

GLDAS-2.1 (Global Land Data Assimilation System Version 2.1) is an advanced system used to simulate various land surface states and fluxes. Developed by NASA in collaboration with other research institutions, GLDAS integrates satellite and ground-based observational data with advanced land surface modeling techniques to generate high-quality data products [66]. This integration enhances the reliability and accuracy of the soil moisture estimates [67,68]. These products are essential for agricultural, environmental, and climate studies, offering a comprehensive view of global land surface conditions and consistent view of soil moisture conditions globally, generated through advanced data assimilation and modeling techniques [58,59]. GLDAS-2.1 offers global coverage of soil moisture data at a spatial resolution of 0.25 degrees. These high-resolution data are available at multiple depths, typically including surface (0–10 cm), root zone (10–40 cm), and deeper layers [69].

2.2.4. VIUPD Vegetation Data

The Vegetation Index based on the Universal Pattern Decomposition Method (VIUPD), developed by Zhang et al. [61], offers distinct advantages over conventional vegetation indices. As with NDVI, VIUPD utilizes satellite data to provide real-time global coverage at high spatial resolutions. It assesses vegetation density and health more comprehensively across terrestrial landscapes. Unlike traditional indices, which rely on near-infrared and red bands, VIUPD integrates data from all spectral bands. Research highlights VIUPD’s superior sensitivity to spectral variations and reduced sensor dependency compared to 11 other indices, including NDVI and EVI [62]. VIUPD has proven effective in monitoring urban Land Surface Temperature (LST) changes, especially in urban heat-island studies [63]. It also outperforms NDVI, TVI, and the Ratio of Modified Transformed Chlorophyll Absorption Ratio Index in accurately measuring chlorophyll content in winter wheat [64]. The VIUPD-derived Vegetation Condition Index (VCI) is recognized as an advanced alternative for long-term drought monitoring, particularly across diverse climatic regions [65]. It enhances the capability to monitor and mitigate drought impacts efficiently.

2.3. Reference Data and Remote Sensing Drought Indices

2.3.1. Standardized Precipitation Index (SPI)

The Standardized Precipitation Index (SPI), introduced by McKee et al. [10], serves as a method to evaluate wet or dry conditions by analyzing precipitation data. It measures how precipitation deviates from the long-term average across different time spans, usually on a monthly or multi-month basis. This index is valuable for assessing the likelihood and intensity of deviations in precipitation patterns over time. The SPI is calculated by taking the precipitation of the pixel i during timeframe j of year k minus the historical mean of pixel i during timeframe j over n years, divided by the historical standard deviation of pixel i during timeframe j over n years given by Equation (1) as follows:
S P I i j k = C H I R P S i j k C H I R P S i , m e a n C H I R P S i , σ
In this study, the monthly SPI will be computed using daily precipitation data from the Climate Hazards Group InfraRed Precipitation with Station data (CHIRPS). These daily values will be aggregated to form monthly (or multi-month) precipitation totals. Given that precipitation data typically do not conform to a normal distribution, a gamma probability function is commonly applied for SPI calculations.
We selected the Standardized Precipitation Index (SPI) as the benchmark for evaluating our proposed index. SPI values were computed for one-, three-, and six-month accumulation periods.

2.3.2. Single Condition Indices

a.
Precipitation Concentration Index (PCI)
Given that insufficient rainfall is a primary contributor to aridity in any area, it is essential to explicitly consider rainfall amounts in addition to the established indicators. In this study, the Precipitation Concentration Index (PCI) is determined using data from CHIRPS data. The PCI serves as an effective statistical tool that measures the distribution and concentration of rainfall over a designated period, often annually. This index is instrumental in analyzing the variability and concentration of precipitation [70], essential for examining seasonal fluctuations and their implications for agriculture [71], water resource management, and disaster readiness. The data were then resampled to a 1 km resolution to calculate the monthly Precipitation Concentration Index (PCI), using Equation (2) as follows:
P C I i j k = 100 × ( i = 1 12 ( P i j k ) P i , m e a n ) 12 P i , m e a n 2
where PCIijk is the PCI value for the given pixel (i) during month (j) for year (k), Pijk is the precipitation CHIRPS value for the given pixel (i) during month (j) for year (k), and Pi,mean is the mean monthly precipitation deviation for pixel (i).
b.
Standardized Water Index (SWI)
Water availability is assessed and monitored using the Standardized Water Index (SWI), an analytical tool that facilitates this process across various landscapes and over time. SWI specifically focuses on quantifying deviations in water content relative to historical averages, which makes it particularly useful in the fields of hydrology, agriculture, and climate study [72]. To calculate this index, we must first extract NDWI by the Equation (3) as follows:
N D W I = ρ b a n d 2 ρ b a n d 5 ρ b a n d 2 + ρ b a n d 5
where ρband2 and ρband5 represent the reflectance values at 857 nm and 2130 nm, respectively. To standardize NDWI across different scales and to identify outliers in a dataset. The SWI is derived by calculating the Z-score of NDWI, which represents the deviation from the mean in units of standard deviation. Consequently, the SWI is represented in Equation (4) as follows:
S W I i j k = N D W I i j k N D W I i , m e a n N D W I i , σ
where SWIijk represents the SWI value for a specific pixel (i) in month (j) of year (k), NDWIijk denotes the NDWI value for the same pixel (i) during the same month (j) of the same year (k), and NDWIi,mean and NDWIi,σ are the multi-year mean and standard deviation of NDWI for pixel (i), respectively.
c.
Standardized Vegetation Index (SVI)
The Standardized Vegetation Index (SVI) is a normalized measurement that evaluates the health, vigor, and robustness of vegetation [73]. Building on the concept of NDVI anomalies, the SVI, developed by Peters et al. [73], quantifies the likelihood of deviations from the typical NDVI values over an extended dataset, such as a 20-year span, analyzed monthly. The SVI measures these deviations as a z-score, representing the number of standard deviations an observed value differs from the mean. This calculation uses either NDVI or EVI values for each pixel within a specific composite period annually throughout a designated reference period. The formula provided below outlines the standard method for calculating the SVI.
We chose the EVI index instead of the NDVI because of its less sensitivity to soil background and uses the blue wavelength to correct for soil and atmospheric disturbances, making it more reliable than NDVI under these conditions. EVI is demonstrated in Equation (5) as follows:
E V I = G × ρ b a n d 2 ρ b a n d 1 ρ b a n d 2 + C 1 ρ b a n d 1 C 2 ρ b a n d 3 + L
where ρband1, ρband2, and ρband3 represent the reflectance values at 645 nm, 857 nm, and 469 nm, respectively. G is the gain factor (usually 2.5), C1 and C2 are the coefficients of aerosol resistance that use the blue band to correct for aerosol influences in the red band (C1 = 6, C2 = 7.5), L is the canopy background adjustment that addresses nonlinear, differential NIR and red radiant transfer through a canopy (L = 1).
The Standardized Vegetation Index (SVI) was calculated using Z scores, which represent the deviation of the EVI mean in terms of standard deviations across a time series. The Equation (6) of SVI is determined as follows:
S V I i j k = E V I i j k E V I i , m e a n E V I i , σ
where SVIijk is the SVI value for the given pixel (i) during month (j) for year (k), EVIijk is the EVI value for the given pixel (i) during month (j) for year (k), and EVIi,mean and EVIi,σ are mean and standard deviation multiyear EVI for pixel (i), respectively.
SVI plays a vital role in tracking vegetation conditions over various periods and geographical areas [69,70], particularly useful in evaluating the effects of drought and other environmental changes on plant growth.
d.
Evaporative Stress Index (ESI)
The Evaporative Stress Index (ESI) is a remote sensing tool used to monitor drought by measuring the Z-score of the ratio of evapotranspiration (ET) to potential evapotranspiration (PET) [74]. It quickly detects changes in water use by vegetation, potentially indicating drought conditions before visible signs like wilting appear. ESI evaluates the water consumption by plants compared to what would be expected under ideal moisture conditions, with low values indicating possible drought [75]. This index is crucial for providing early drought warnings, aiding in response planning, and supporting water management, especially in agricultural settings to assess crop health and manage irrigation effectively. The ESI Equation (7) is demonstrated as follows:
E S I i j k = r i j k r i , m e a n r i , σ w i t h r = E T P E T
where ESIijk represents the ESI value for a specific pixel (i) in month (j) of year (k), rijk is the ratio r value for the same pixel (i) in the same month (j) of the same year (k), and ri,σ are the multi-year mean and standard deviation of the ratio r for pixel (i), respectively.
e.
Soil Moisture Condition Index (SMCI).
The Soil Moisture Condition Index (SMCI) is a specialized measure designed to evaluate and track soil moisture levels in specific regions [76,77]. This index is invaluable for agricultural management [72,73], drought tracking [78], and environmental studies [79], as it helps gauge the availability of water in the soil, which has direct implications on plant growth and drought severity.
Soil moisture data from the period of March to September, spanning the years 2002 to 2022, were resampled to a 1 km resolution and utilized to compute the monthly Soil Moisture Condition Index (SMCI). The SMCI Equation (8) is defined as follows:
S M C I i j k = S M i j k S M i , m e a n S M i , σ
where SMCIijk represents the monthly SMCI value for a specific pixel (i) in month (j) of year (k), SMijk denotes the soil moisture value for the same pixel (i) during the same month (j) of the same year (k), and SMi,mean and SMi,σ are the multi-year mean and standard deviation of soil moisture for pixel (i), respectively.
f.
Vegetation Condition Index (VCI) derived from VIUPD data
The National Oceanic and Atmospheric Administration (NOAA) has developed a vegetation condition index (VCI) based on AVHRR data that is particularly effective for monitoring agricultural droughts [80]. The VCI assesses the current NDVI relative to the historical NDVI values recorded during the same period in prior years. This index effectively detects fluctuations in vegetation growth within designated time frames [81]. However, in this study, we calculate the drought index using VIUPD to create an alternative type of VCI. VIUPD is advantageous as it integrates all observed bands and is less dependent on specific sensors, making it sensitive to subtle vegetation changes. The performance of the VIUPD-derived VCI was evaluated across multiple climatic divisions by comparing it to conventional drought indicators based on weather stations and other indices derived from remote sensing, examining its pros and cons [82]. The VIUPD-derived VCI is defined in Equation (9) as follows:
V C I i j k = V I U P D i j k V I U P D i , m i n V I U P D i , m a x + V I U P D i , m i n
where VCIijk is the VCI monthly value for the given pixel (i) during month (j) for year (k), VIUPDijk is the VIUPD value for the given pixel (i) during month (j) for year (k), and VIUPDi,min and VIUPDi,max are multi-year VIUPD minimum and maximum values for pixel (i), respectively.
Where VCIijk represents the monthly VCI value for a specific pixel (i) in month (j) of year (k), VIUPDijk is VIUPD denotes the VIUPD value for the same pixel (i) during the same month (j) of the same year (k), and VIUPDi,min and VIUPDi,max are the multi-year minimum and maximum VIUPD values for pixel (i), respectively.
g.
Temperature–Vegetation Dryness Index (TVDI) from VIUPD data
The Temperature–Vegetation Dryness Index (TVDI) is a well-known tool for drought monitoring, valued for its use of empirical parameterization within the feature space of Land Surface Temperature (LST) and the Normalized Difference Vegetation Index (NDVI) [83]. This index has been successfully applied in diverse ecosystems worldwide and does not require ancillary data, making it particularly advantageous for large-scale applications [84]. To calculate a drought index using the VIUPD and create an alternative type of Temperature–Vegetation Dryness Index (TVDI), we need to follow a methodology that involves several steps, including data processing, and analysis. Both VIUPD and LST data need to be normalized to ensure they are on comparable scales. Determine the minimum, maximum, and average values for VIUPD and LST over a historical period to establish a baseline for normal conditions. Plot LST against VIUPD for the period of interest. This plot will typically show a trapezoidal scatter, where the upper and lower bounds represent the wettest and driest conditions, respectively [85]. To identify the lines that represent the maximum and minimum LST for a given VIUPD, a regression analysis to define the edges of the scatter plot is performed in Figure 2.
The TVDI from VIUPD is defined by the Equation (10) as follows:
T V D I i j k = L S T i j k L S T i , m i n ( V I U P D ) L S T i , m a x ( V I U P D ) + L S T i , m i n ( V I U P D )
where TVDIijk is the TVDI monthly value for the given pixel (i) during month (j) for year (k), LSTijk is LST value for the given pixel (i) during month (j) for year (k), and LSTi,min(VIUPD) and LSTi,max(VIUPD) are the multi-year minimum and maximum LST values for a given pixel (i) and VIUPD.
Where TVDIijk represents the monthly TVDI value for a specific pixel (i) in month (j) of year (k), LSTijk denotes the LST value for the same pixel (i) during the same month (j) of the same year (k), and LSTi,min(VIUPD)LST_{i,min(VIUPD)}LSTi,min(VIUPD) and LSTi,min(VIUPD) and LSTi,max(VIUPD) are the multi-year minimum and maximum LST values for pixel (i) with respect to VIUPD.

2.3.3. Aggregate Conditions Indices (ACIs)

Table 2 presents two Aggregated Conditions Indices (ACIs), which are created from weighted linear combinations of Single Condition Indices (SCIs). These ACIs consist of the Vegetation Health Index (VHI), Scaled Drought Condition Index (SDCI), and Vegetation Drought Synthesized Index (VDSI). The methods for computing these indices, as well as their corresponding references, are included in Table 2.

WIMDI Implementation via LOWA Model

The Ordered Weighted Averaging (OWA) operator, introduced by Yager in 1993 [87,88], is a decision-making tool used in fields such as artificial intelligence, data mining, and decision-support systems. The OWA operator allows for a degree of flexibility and subjectivity in aggregating multiple inputs, differing from classical aggregation operators like the mean, min, or max by incorporating the attitudes toward risk and importance of each criterion. It enables the aggregation with a predetermined degree of optimism or pessimism in decision-making processes. The OWA operator is especially valuable in situations where it is necessary to merge decision criteria to account for varying levels of importance or relevance [87,88,89]. It represents a broad category of parameterized aggregation operators that span from the minimum to the maximum. In OWA, two types of weights are used: criteria weights and order weights. The criteria weights (w1, w2, …, wn, 0 ≤ wi ≤ 1 and i = 1 n w i = 1 ) evaluate the relative significance of each assessment criterion, while the order weights (γ1, γ2, …, γn, 0 ≤ γi ≤ 1 and i = 1 n γ i = 1 ) manage the balance between the situation where all criteria are satisfied and the situation where at least one criterion is satisfied [91]. A significant limitation of the OWA model is its consistent application of weights, which does not account for the spatial variability of the phenomena under study [92,93]. To overcome this limitation, Malczewski and Liu [94] introduced the Local OWA (LOWA) model. The LOWA model employs a moving window technique to segment the study area into various neighborhoods. Within each window, weights are assigned to each individual drought index according to the ranking of index values from minimum to maximum. To determine the local weight of the kth individual drought index in the qth neighborhood using LOWA, we adjust the traditional OWA to better align with local data and conditions. Denote xkq as the value of the kth drought index within the qth neighborhood. These values are sorted in the neighborhood in descending order based on their impact or severity. With x1q, x2q, …, xnq, the reordered values, and wq = [w1q, w2q, …, wnq], a vector of local weights specifically tailored for the qth neighborhood.
The new drought index is computed using the LOWA model according to the Equation (11) as follows:
L O W A i q = k = 1 n λ k q x i k q
where LOWAiq represents the LOWA value for the ith pixel estimated within the qth neighborhood; λk,q is the order weight corresponding to the kth individual drought index (k = 1 to 7); and xi1q ≥ xi2q ≥ … ≥ xi7q is derived by reorganizing the normalized values based on the local value function as defined by Equation (12).
δ ( a i k ϑ ) = a i k ϑ m i n i ϑ ( a i k ϑ ) m a x i ϑ a i k ϑ m i n i ϑ ( a i k ϑ ) m a x i ϑ a i k ϑ a i k ϑ m a x i ϑ a i k ϑ m i n i ϑ ( a i k ϑ )
where m a x i ϑ ( a i k q ) and m i n i ϑ ( a i k q ) represent the maximum and minimum values of the kth drought index within the q th neighborhood.
To determine the local weight λkq for the kth index specifically at pixel i, normalize the contribution of each index in the LOWA score relative to others by using the Equation (13) as follows:
λ i k q * = λ k q · x i k q L O W A i q
Here, λ i k q * now indicates the weighted contribution of the kth index to the overall drought condition in the qth neighborhood of pixel i, highlighting its importance in the local context. This helps in understanding the proportionate influence of each index.
To gauge how closely an OWA operator resembles the logical OR operator, the parameter α was introduced, which regulates the distribution of weights within the OWA operator. This parameter α is a measure of risk attitude that influences drought conditions. It enables the adjustment of the OWA’s weighting strategy, ranging from a completely optimistic strategy (OR-like) to an entirely pessimistic strategy (AND-like), or any level in between. Specifically, when α = 0.5, each λk is set to 1/n; for α = 0, λk equals 1 with all other weights being 0; if α = 1, λn is 1 with all other λk weights set to 0 and if α tends to infinity, the first weight λ1 tends to 1 and all others tend to 0, mimicking the OR operation. Table 3 presents the λk values across various α settings in our study. In a broader setup, α can be employed in a parametric function to set the weights among the inputs. This allows for a range of behaviors from OR-like to AND-like. A typical Equation (14) is used as follows:
α i k q = k = 1 n n k n 1 . λ k q * ,   k = 1 n λ k q * = 1 ,   0 λ q k * 1 k = 1 , , n
To examine the impact of the analyst’s risk attitude on drought conditions, nine distinct risk attitudes were evaluated using LOWA configurations with α values of 0.1, 0.2, 0.3, 0.4, 0.5, 0.6, 0.7, 0.8, and 0.9, by analyzing them against reference drought indices. Among the different α profiles examined, the LOWA configured with α = 0.7 demonstrated the strongest correlation with the SPI multiple timescales (e.g., 1, 3, 6 months) (Table 4). Consequently, an α of 0.7 was recommended for the development of WIMDI.

2.4. Methodology

2.4.1. WIMDI Development Process Overview

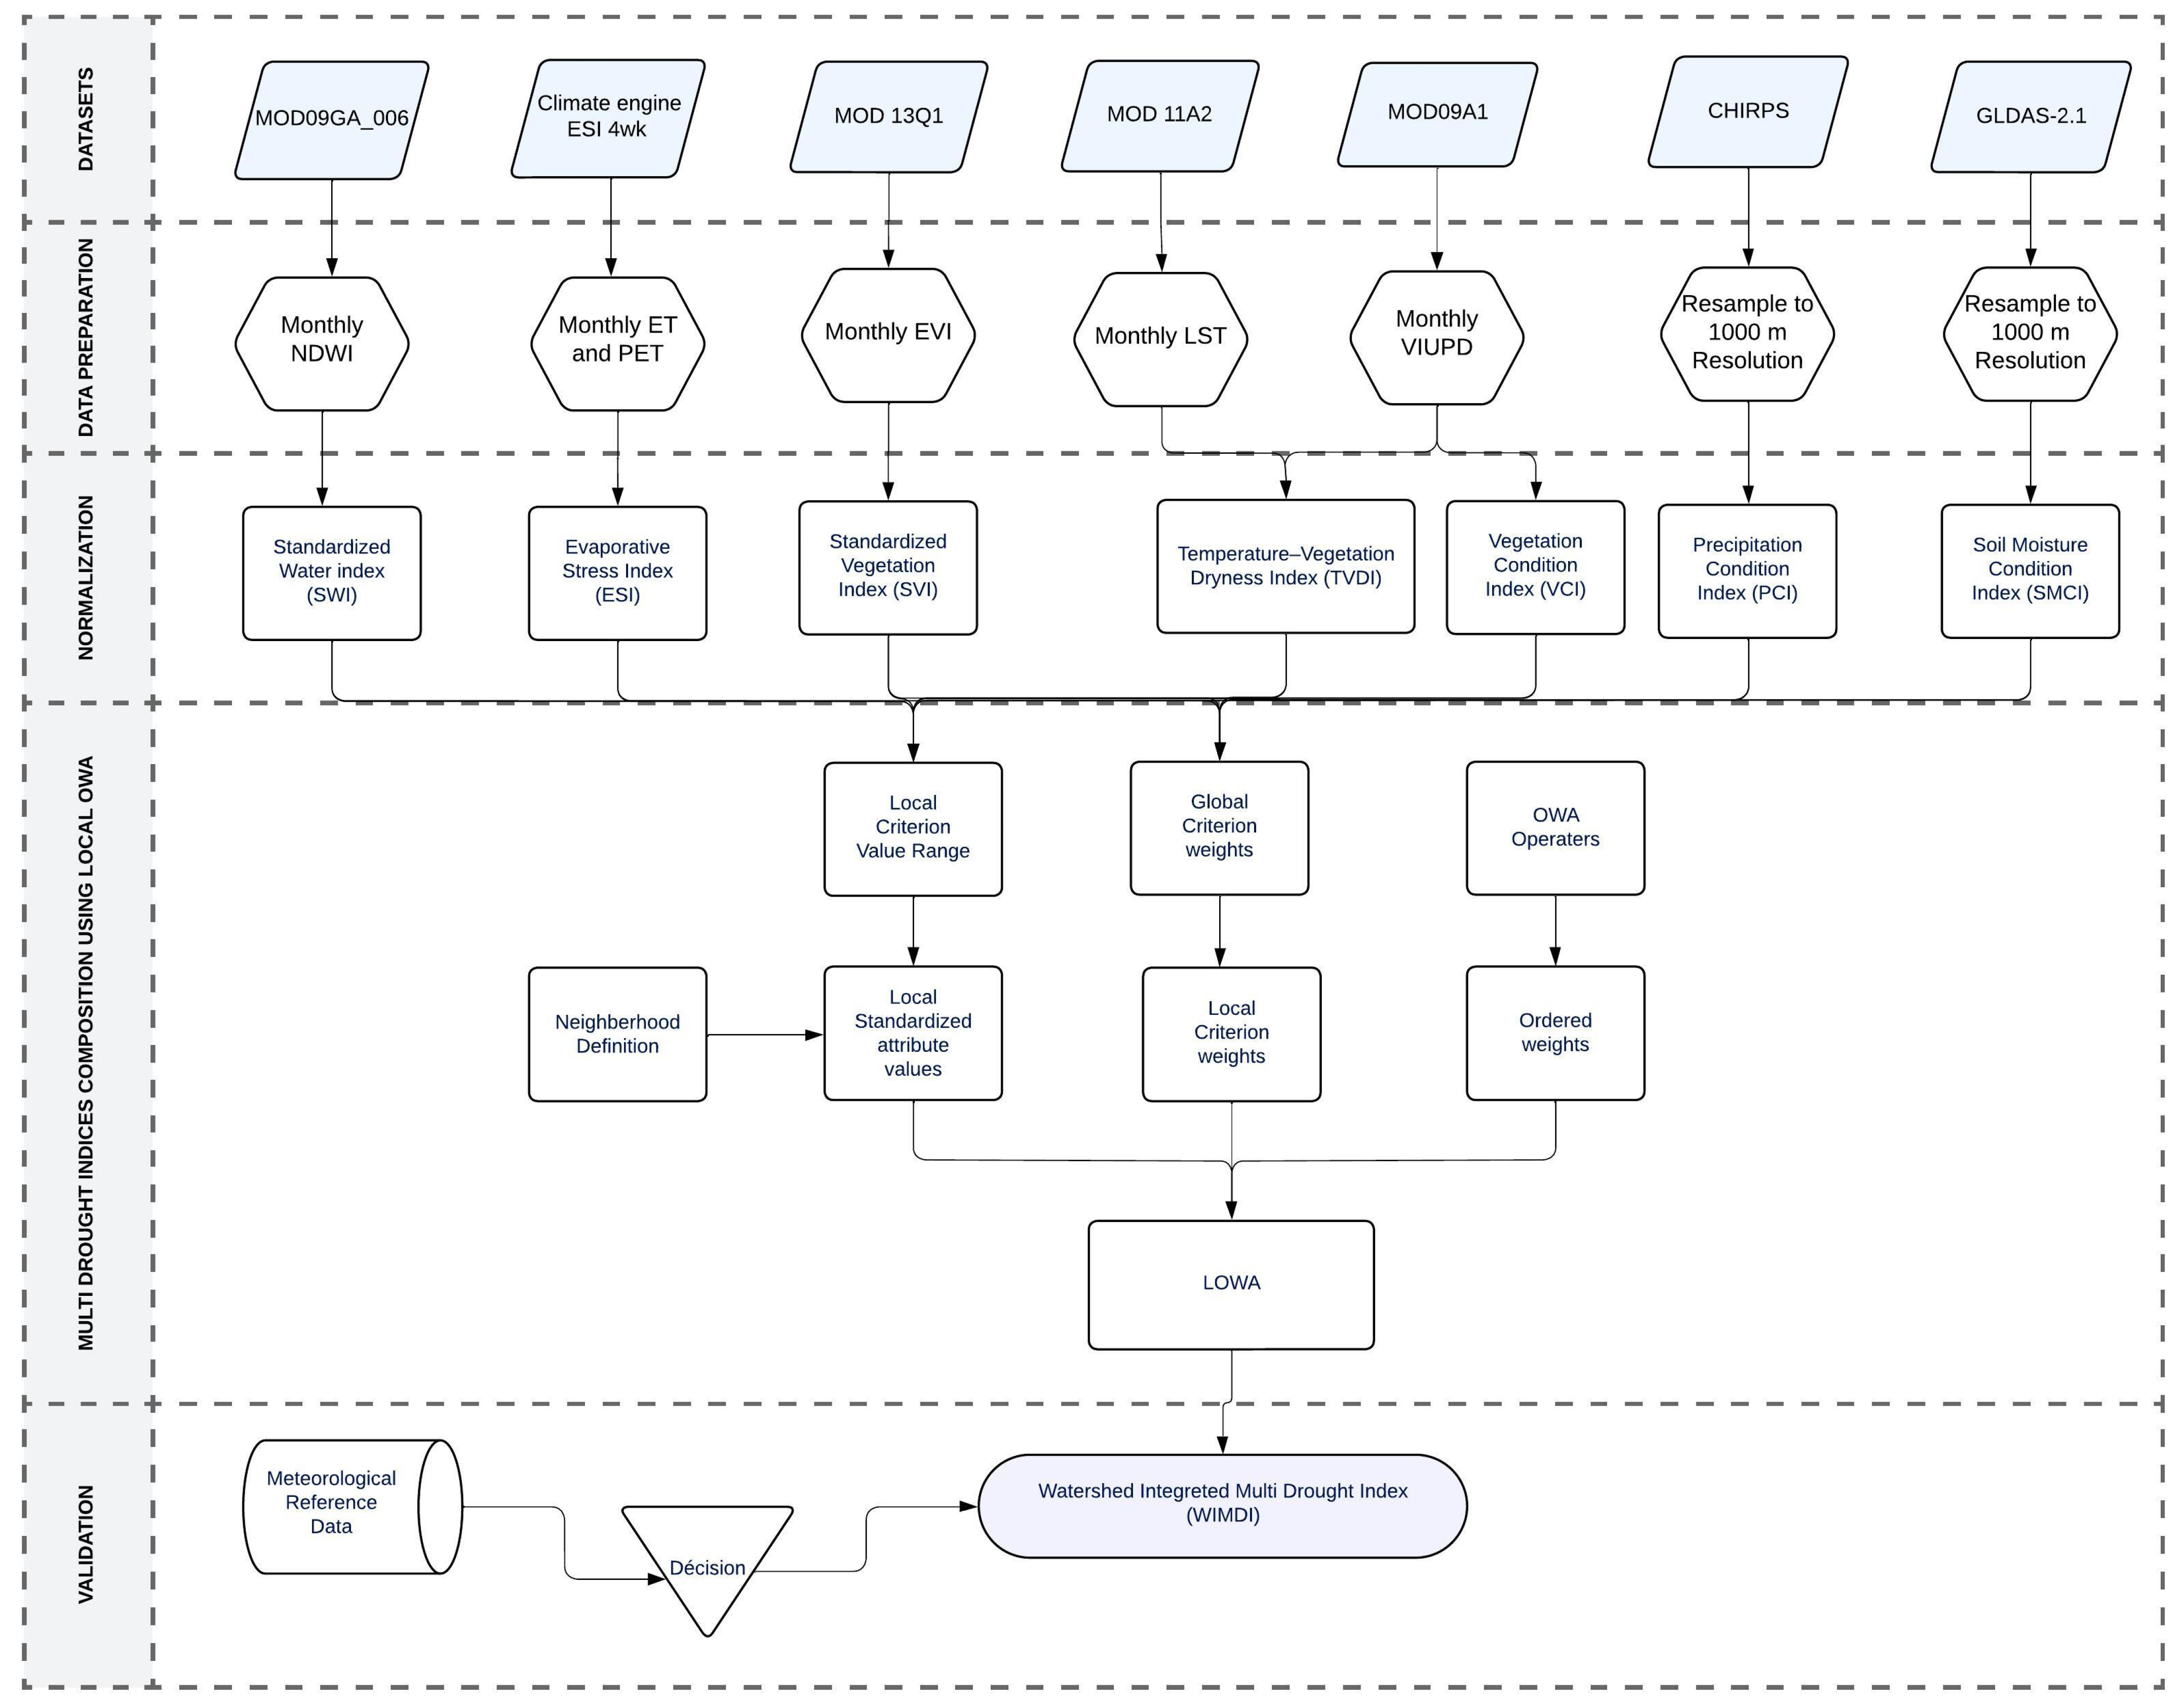
The methodology illustrated in Figure 3 outlines a comprehensive process for developing the WIMDI to provide a reliable multi-drought index for watershed-level management. The procedure begins with the acquisition and preparation of various datasets, covering the period from 2002 to 2022, including MOD09GA_006 for monthly NDWI, Climate Engine ESI for monthly ET and PET, MOD13Q1 for monthly EVI, MOD11A2 for monthly LST, MOD09A1 for monthly VIUPD, CHIRPS for precipitation data resampled to a 1000 m resolution, and GLDAS-2.1 for soil moisture data, also resampled to a 1000 m resolution.
In the data preparation phase, the datasets are processed to produce monthly indices such as NDWI, ESI, EVI, LST, and VIUPD. These are then standardized into SWI, ESI, SVI, TVDI, VCI, PCI, and SMCI, respectively. Notably, VIUPD was used first to compute the VCI, instead of the commonly used NDVI, and then to compute TVDI. This choice was based on previous research indicating that VIUPD-derived indices provide enhanced performance for drought monitoring across various climate regions compared to NDVI-derived indices [95]. The standardized indices are then normalized to calculate both global and local criterion weights.
In the next phase, these condition indices were combined using the LOWA model where global criterion weights and ordered weights from OWA operators are integrated. The final step involves the use of reference drought indices to evaluate the correlation between the reference drought indices and WIMDI.

2.4.2. WIMDI Assessment

We assessed WIMDI using data from the years 2005, 2010, and 2022, which were generally classified as years of severe drought, moderate drought, and extreme drought, respectively. The drought conditions estimated by WIMDI were compared to the results provided by VHI, SDCI, and VDSI. Those drought indices were selected for comparison with WIMDI because of their demonstrated efficacy in previous studies [82,83,84]. Initially, our analysis was primarily based on visual assessment. In the next step, we assessed WIMDI’s performance by utilizing correlation values (r-value) and the Root Mean Square Error (RMSE) between WIMDI and the reference drought indices. Furthermore, an uncertainty analysis using the linear regression prediction interval was calculated according to Equation (15) as follows:
y k = α ^ 0 + α ^ 1 x k ± τ ( 1 β 2 , n 2 ) × S E p r e d i c t i o n
where α0 and α1 are the estimated coefficients from the regression model. x is the value of the predictor variable for which the response is being predicted. τ ( 1 β 2 , n 2 ) is the critical value from the τ-distribution for ( 1 α 2 ) (typically 0.975 for a 95% confidence level) and (n − 2) degrees of freedom (where n is the number of data points). SEprediction is the standard error of the prediction given by the Equation (16) as follows:
S E p r e d i c t i o n = R M S E ( 1 + 1 n + ( x k x ¯ ) 2 k = 1 n ( x k x ¯ ) )

3. Results

3.1. The Reference Drought Map

The reference drought maps utilize various indices to comprehensively assess different types of drought conditions. The SPI is primarily used to monitor meteorological drought, focusing on precipitation anomalies [45,96]. Similarly, SPEI also monitors meteorological drought, but it expands upon SPI by incorporating evapotranspiration, providing a more comprehensive measure of water balance, the calculation approach for the SPEI is thoroughly described in existing research studies [46,97]. The SDI is crucial for monitoring hydrological drought, as it assesses reductions in river flows and water availability in reservoirs. The method for calculating the SDI is available in the literature [47]. The SEDI measures drought conditions by assessing when a regional water supply system cannot satisfy societal water demands, especially when it falls below the minimum in-stream water requirement, The method for calculating the SEDI is extensively covered in existing studies [48]. The SMCI is essential for assessing agricultural drought, focusing on soil moisture levels that are critical for crop production [49,98]. In this work, all these indices were used to serve as a baseline for validating the new WIMDI, ensuring a robust comparison of drought conditions across the OER watershed.

3.2. Time Series Analysis

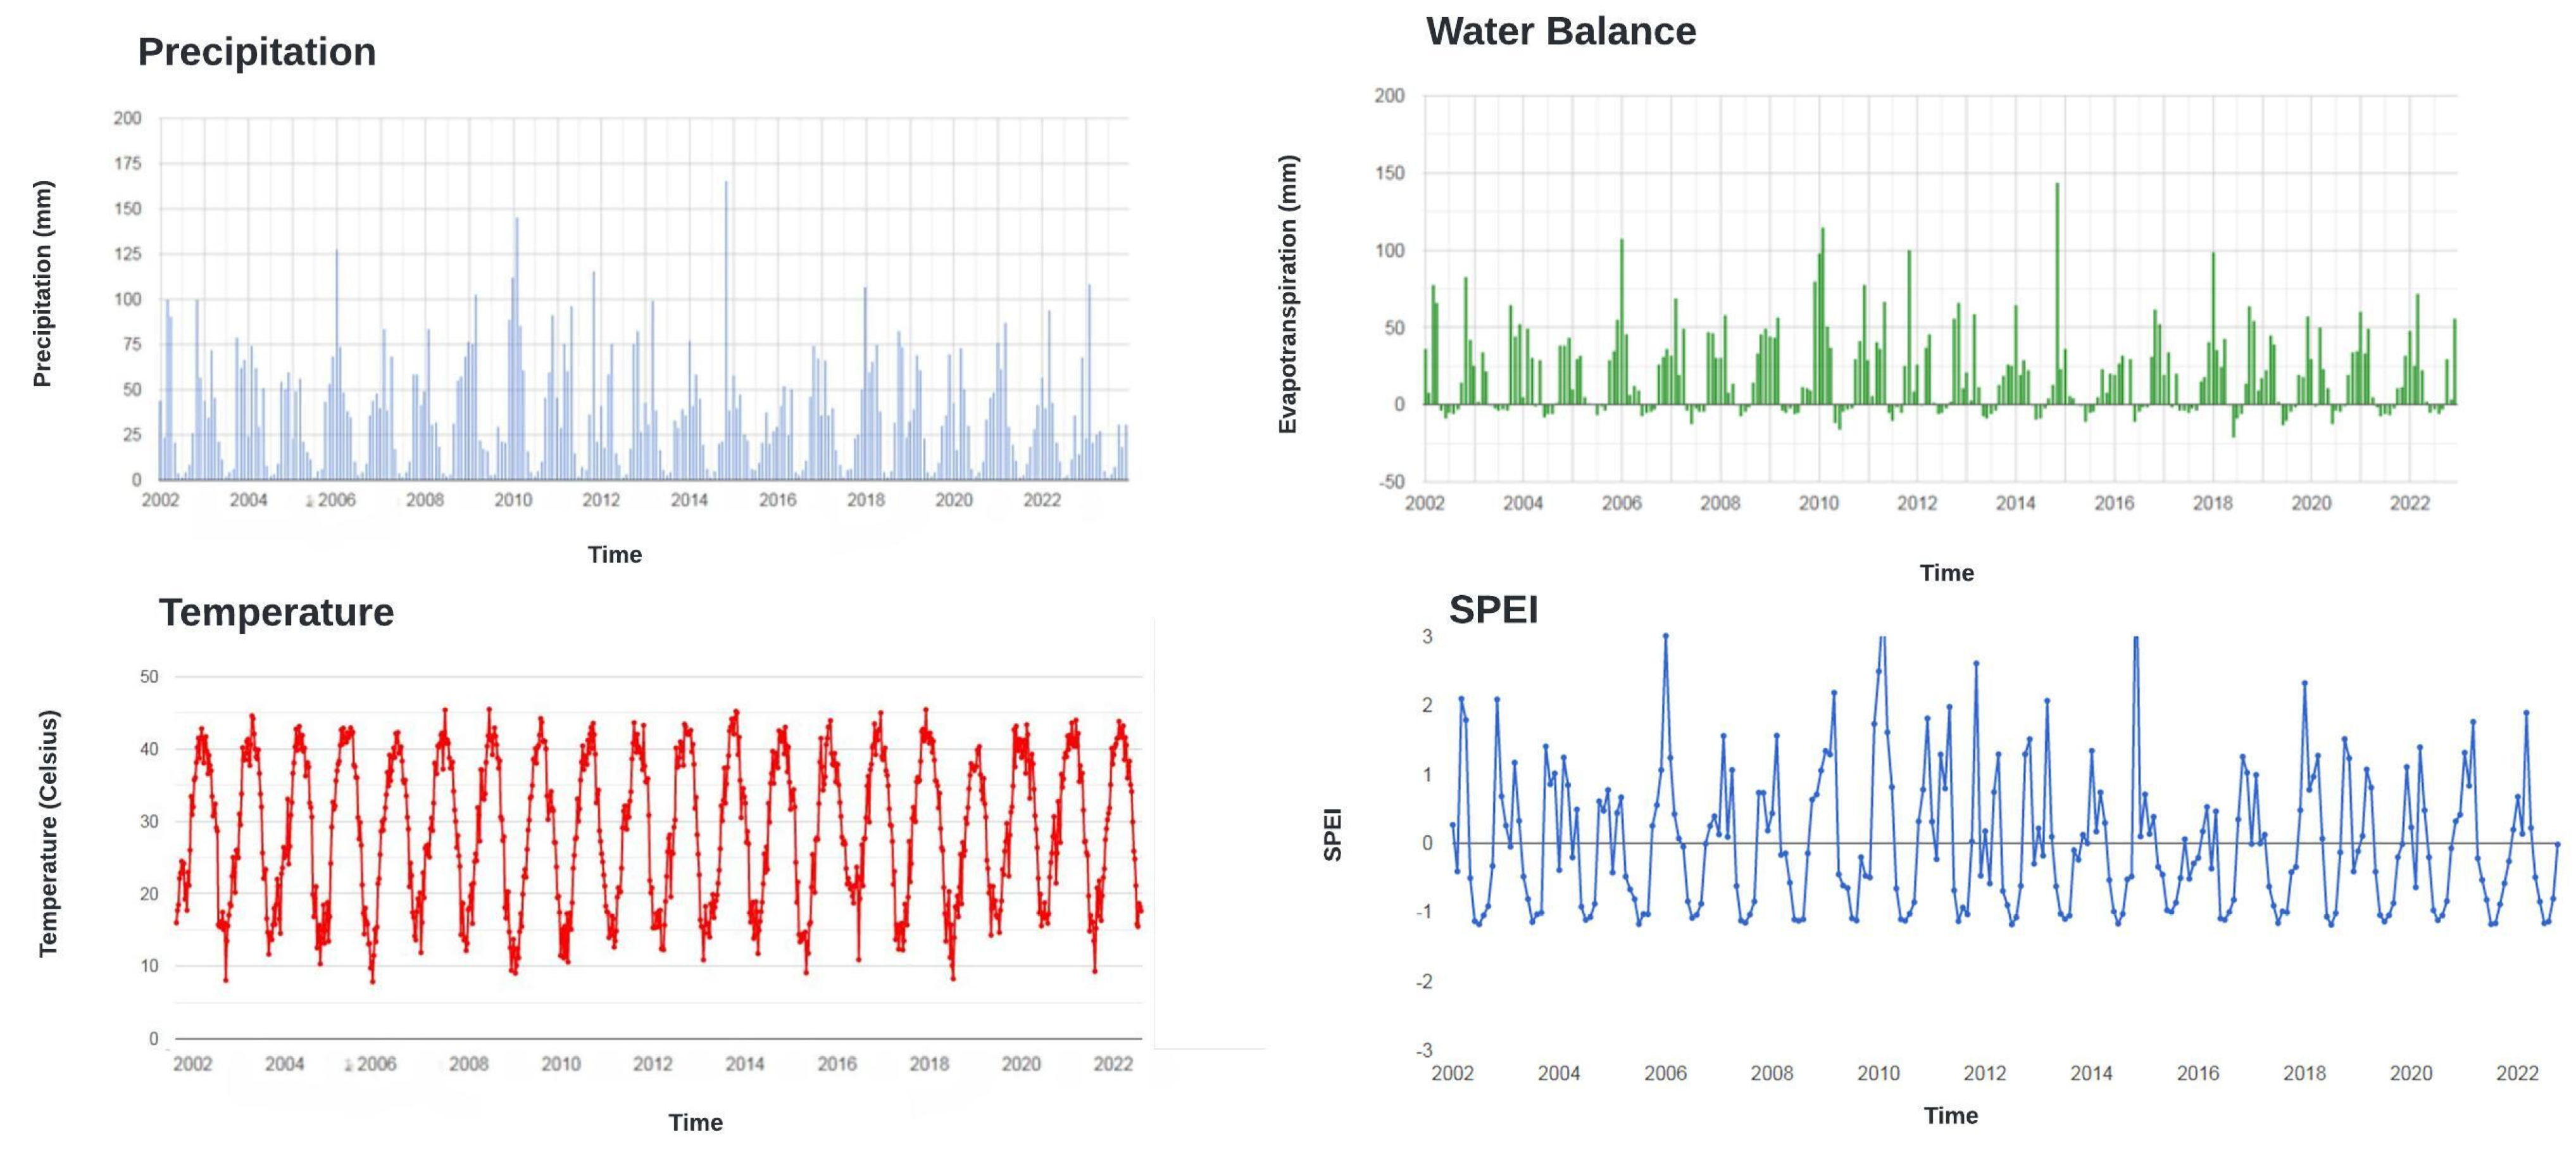
Figure 4 provides a detailed interannual variability of key climatic variables, notably, precipitation, temperature, water balance, and the SPEI, from 2002 to 2022 in the OER watershed. The precipitation chart illustrates significant variability with notable peaks in certain years, indicating periods of above-average rainfall, while other years show lower levels contributing to potential drought conditions. The water balance chart further emphasizes the fluctuations in water availability, with both positive and negative values reflecting periods of surplus and deficit. The temperature chart reveals a clear seasonal pattern with an overall increasing trend, which impacts evapotranspiration rates and thus affects the water balance. The SPEI chart, which combines the effects of precipitation and temperature, shows periods of significant drought, highlighting the temporal variability of drought severity in the region. This integrated analysis underscores the complexity of the climatic dynamics in the watershed, showing how these variables interact to influence drought conditions over time.
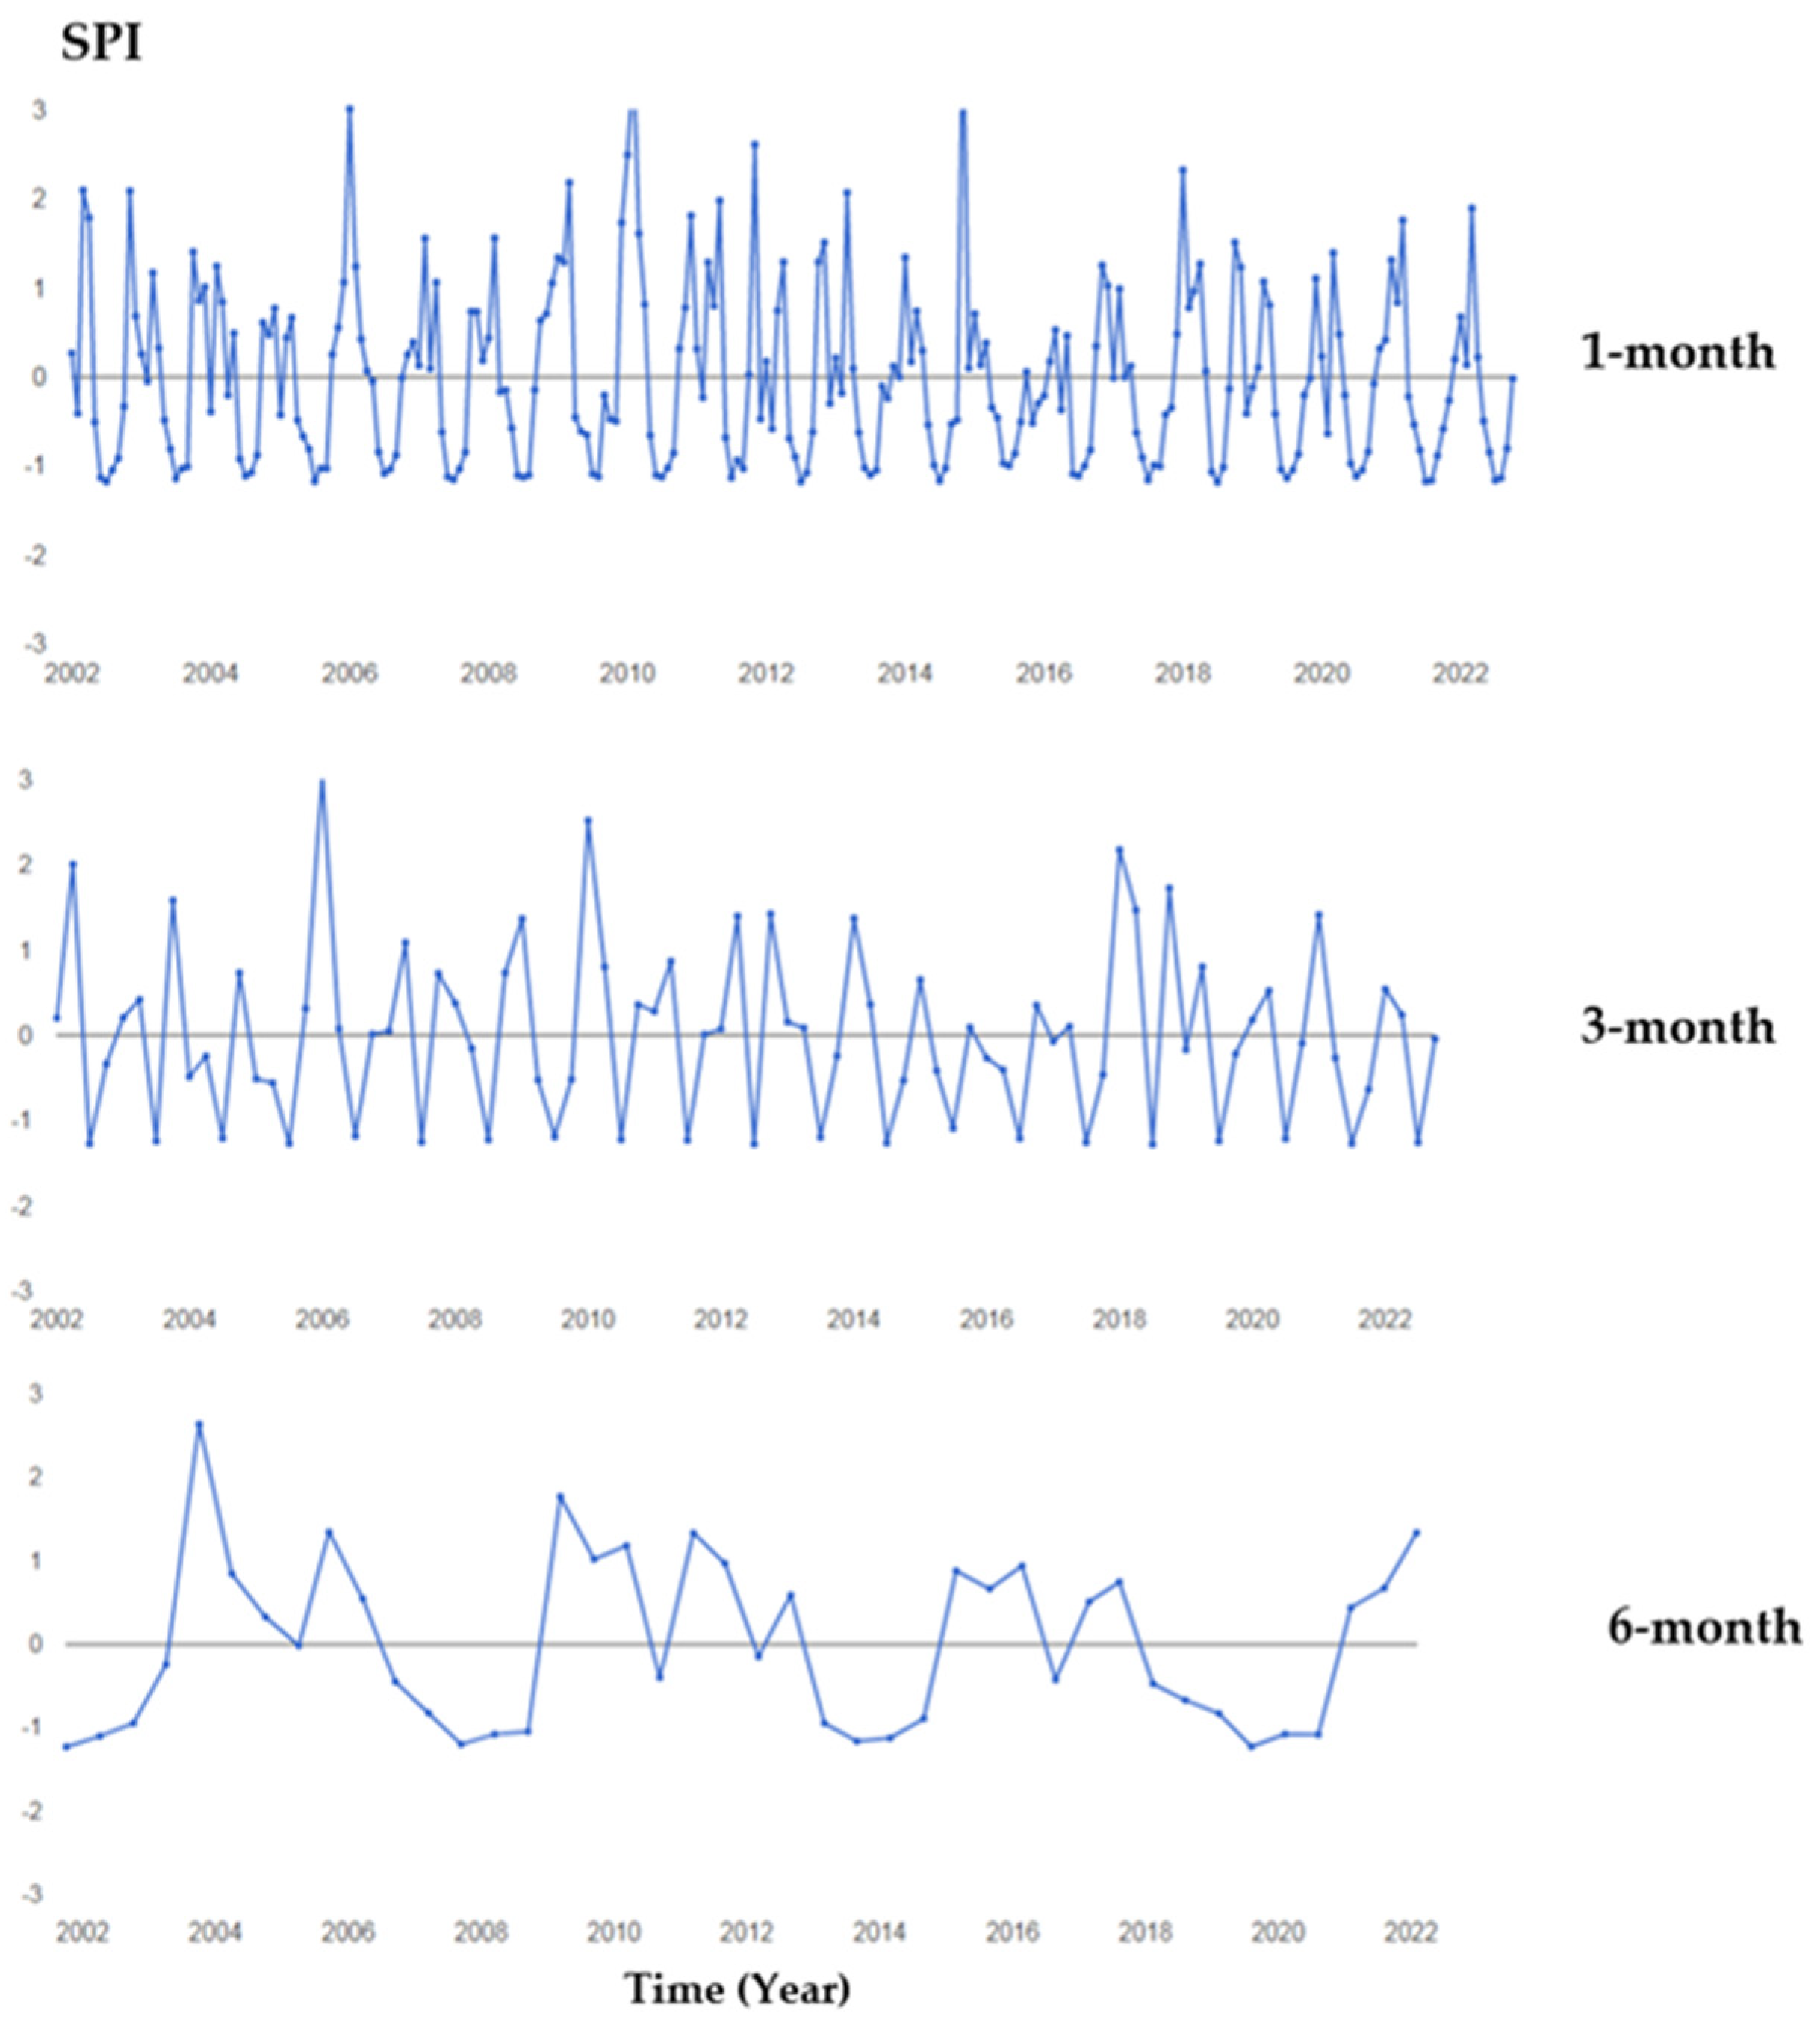
The SPI graphs (Figure 5), calculated at 1-month, 3-month, and 6-month intervals, demonstrate fluctuations in precipitation anomalies over time. While the 1-month SPI captures short-term variations that may reflect seasonal patterns, the 3-month and 6-month SPI provide a more reliable indication of sustained dry and wet periods. This allows for a better distinction between natural variability and actual drought events, with the 6-month SPI.
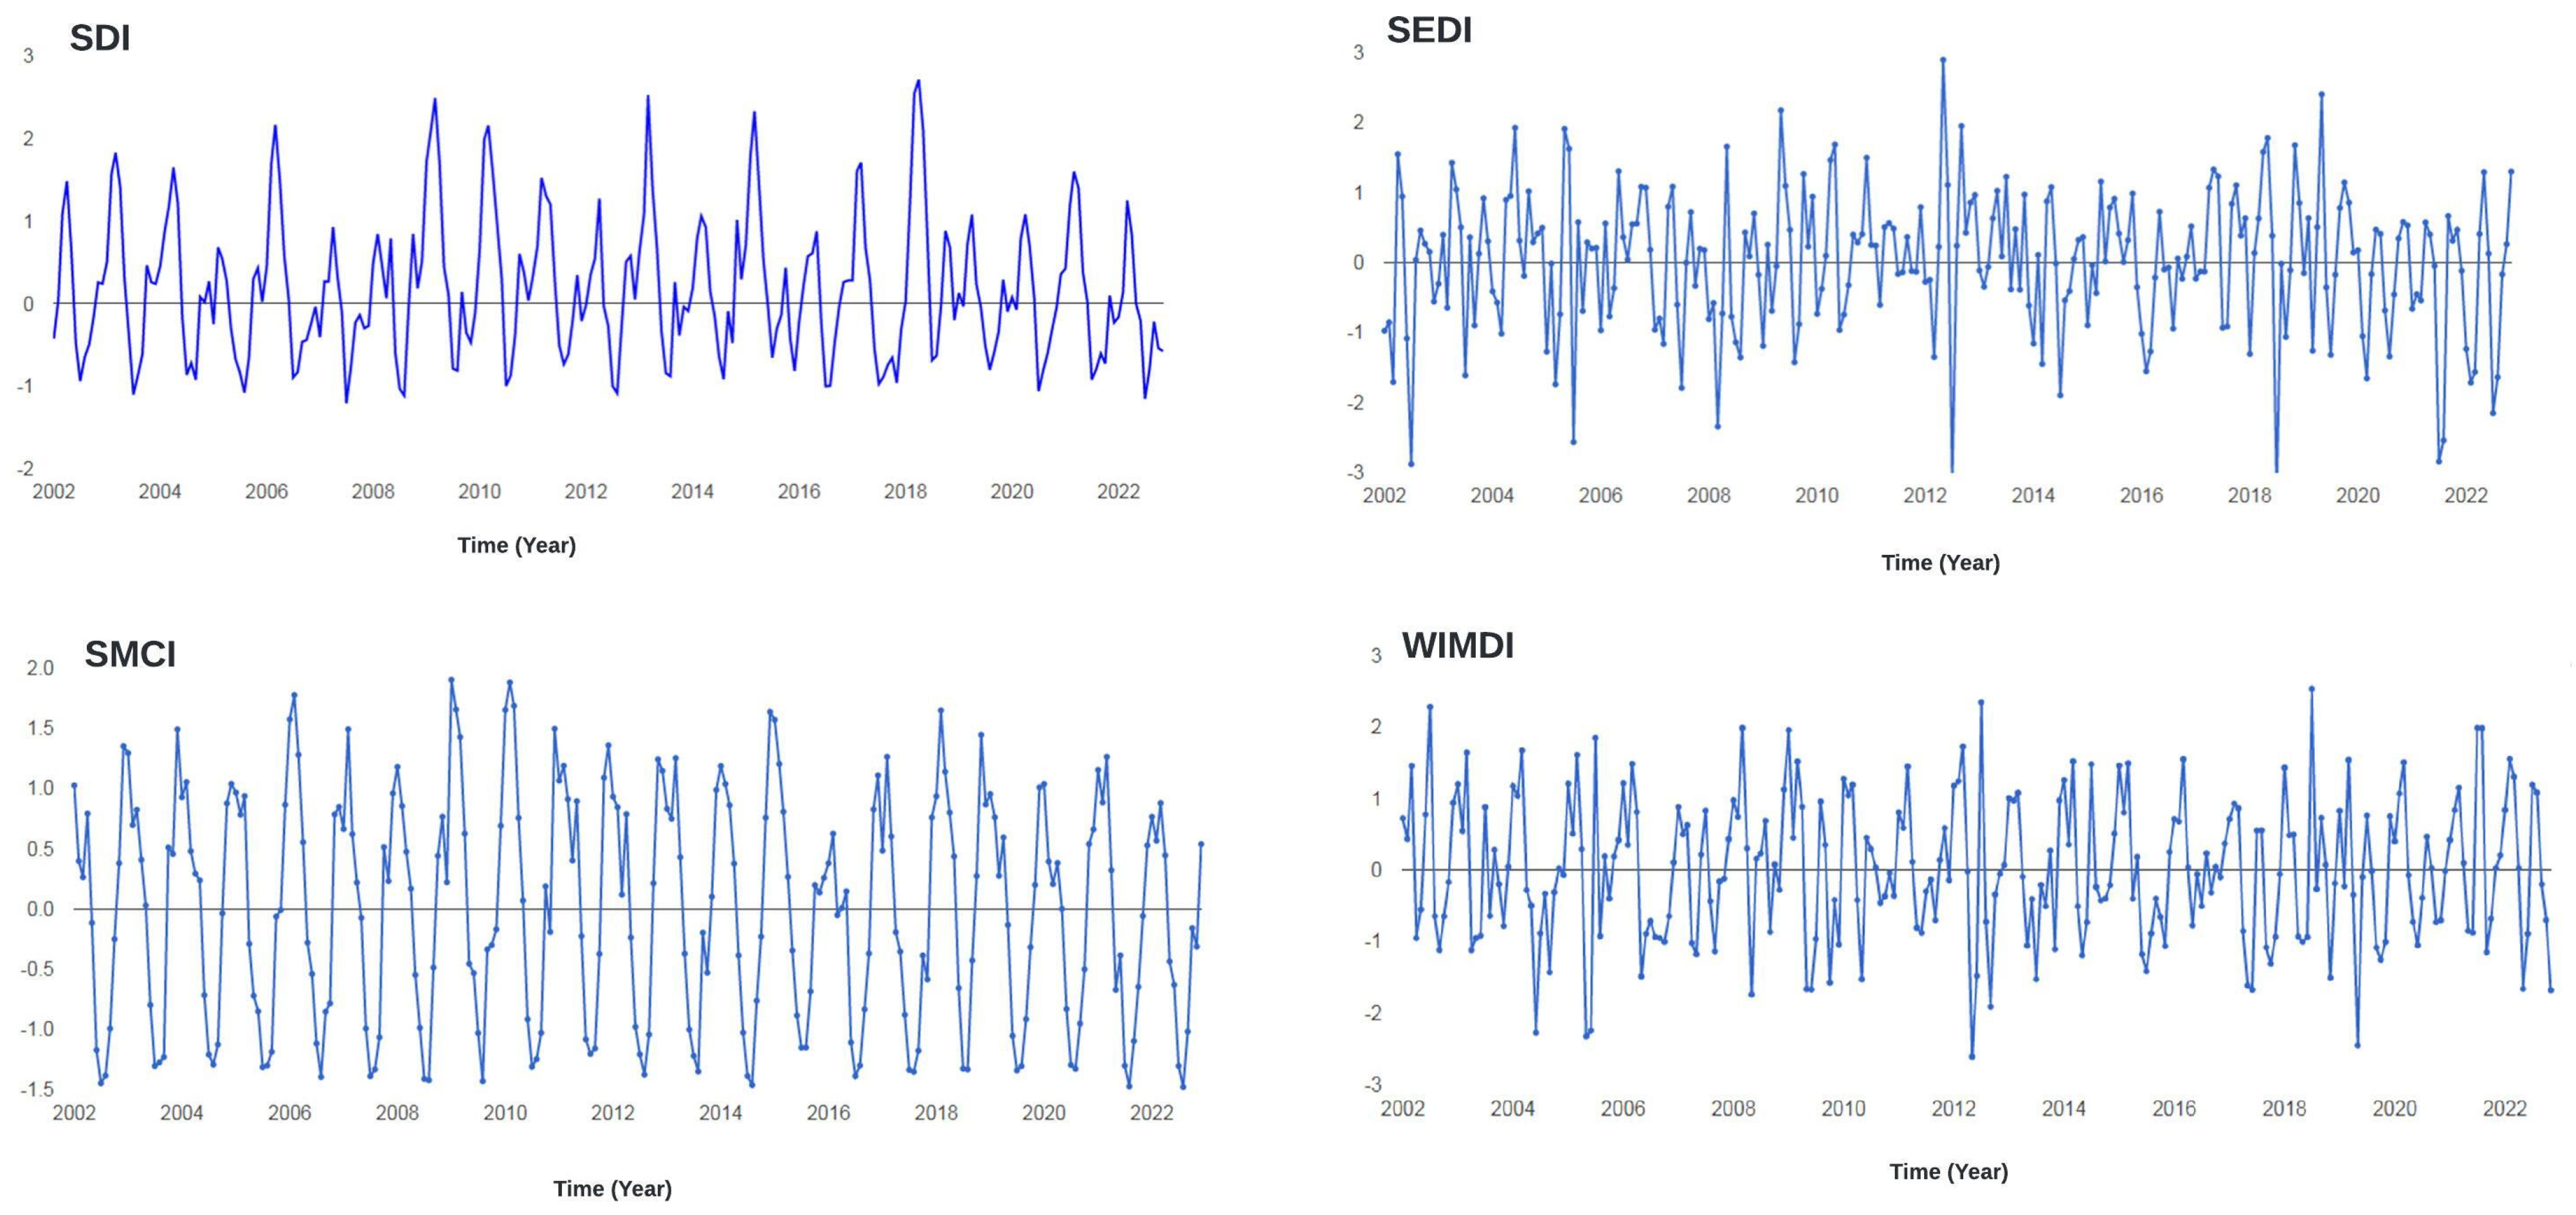
Figure 6 presents the interannual variability of various drought indices, including SDI, SEDI, SMCI, and WIMDI, all computed on a 1-month scale, over the period from 2002 to 2022. The purpose of this analysis is to evaluate the temporal consistency and sensitivity of WIMDI in capturing drought conditions relative to other established drought indices. The SDI graph (Figure 6) captures variations in hydrological drought, reflecting changes in river flow and water availability in the watershed. The SEDI graph (Figure 6), which represents socio-economic drought conditions, shows fluctuations driven by evapotranspiration deficits, indicating potential impacts on agricultural and human activities. The SMCI graph (Figure 6) reflects agricultural drought conditions through soil moisture variability, highlighting the sensitivity of crops to drought stress.
WIMDI, shown in Figure 6, integrates multiple aspects of drought, including meteorological, hydrological, socio-economic, and agricultural factors. The WIMDI time series closely follows the general trends observed in the other indices but offers a more comprehensive view by capturing the multi-dimensional nature of drought. Notably, WIMDI’s response during significant drought years, such as 2010 and 2022, shows strong alignment with the patterns seen in SPI, SDI, and SEDI, underscoring its robustness in reflecting the overall drought conditions across the watershed.

3.3. Data Input for WIMDI

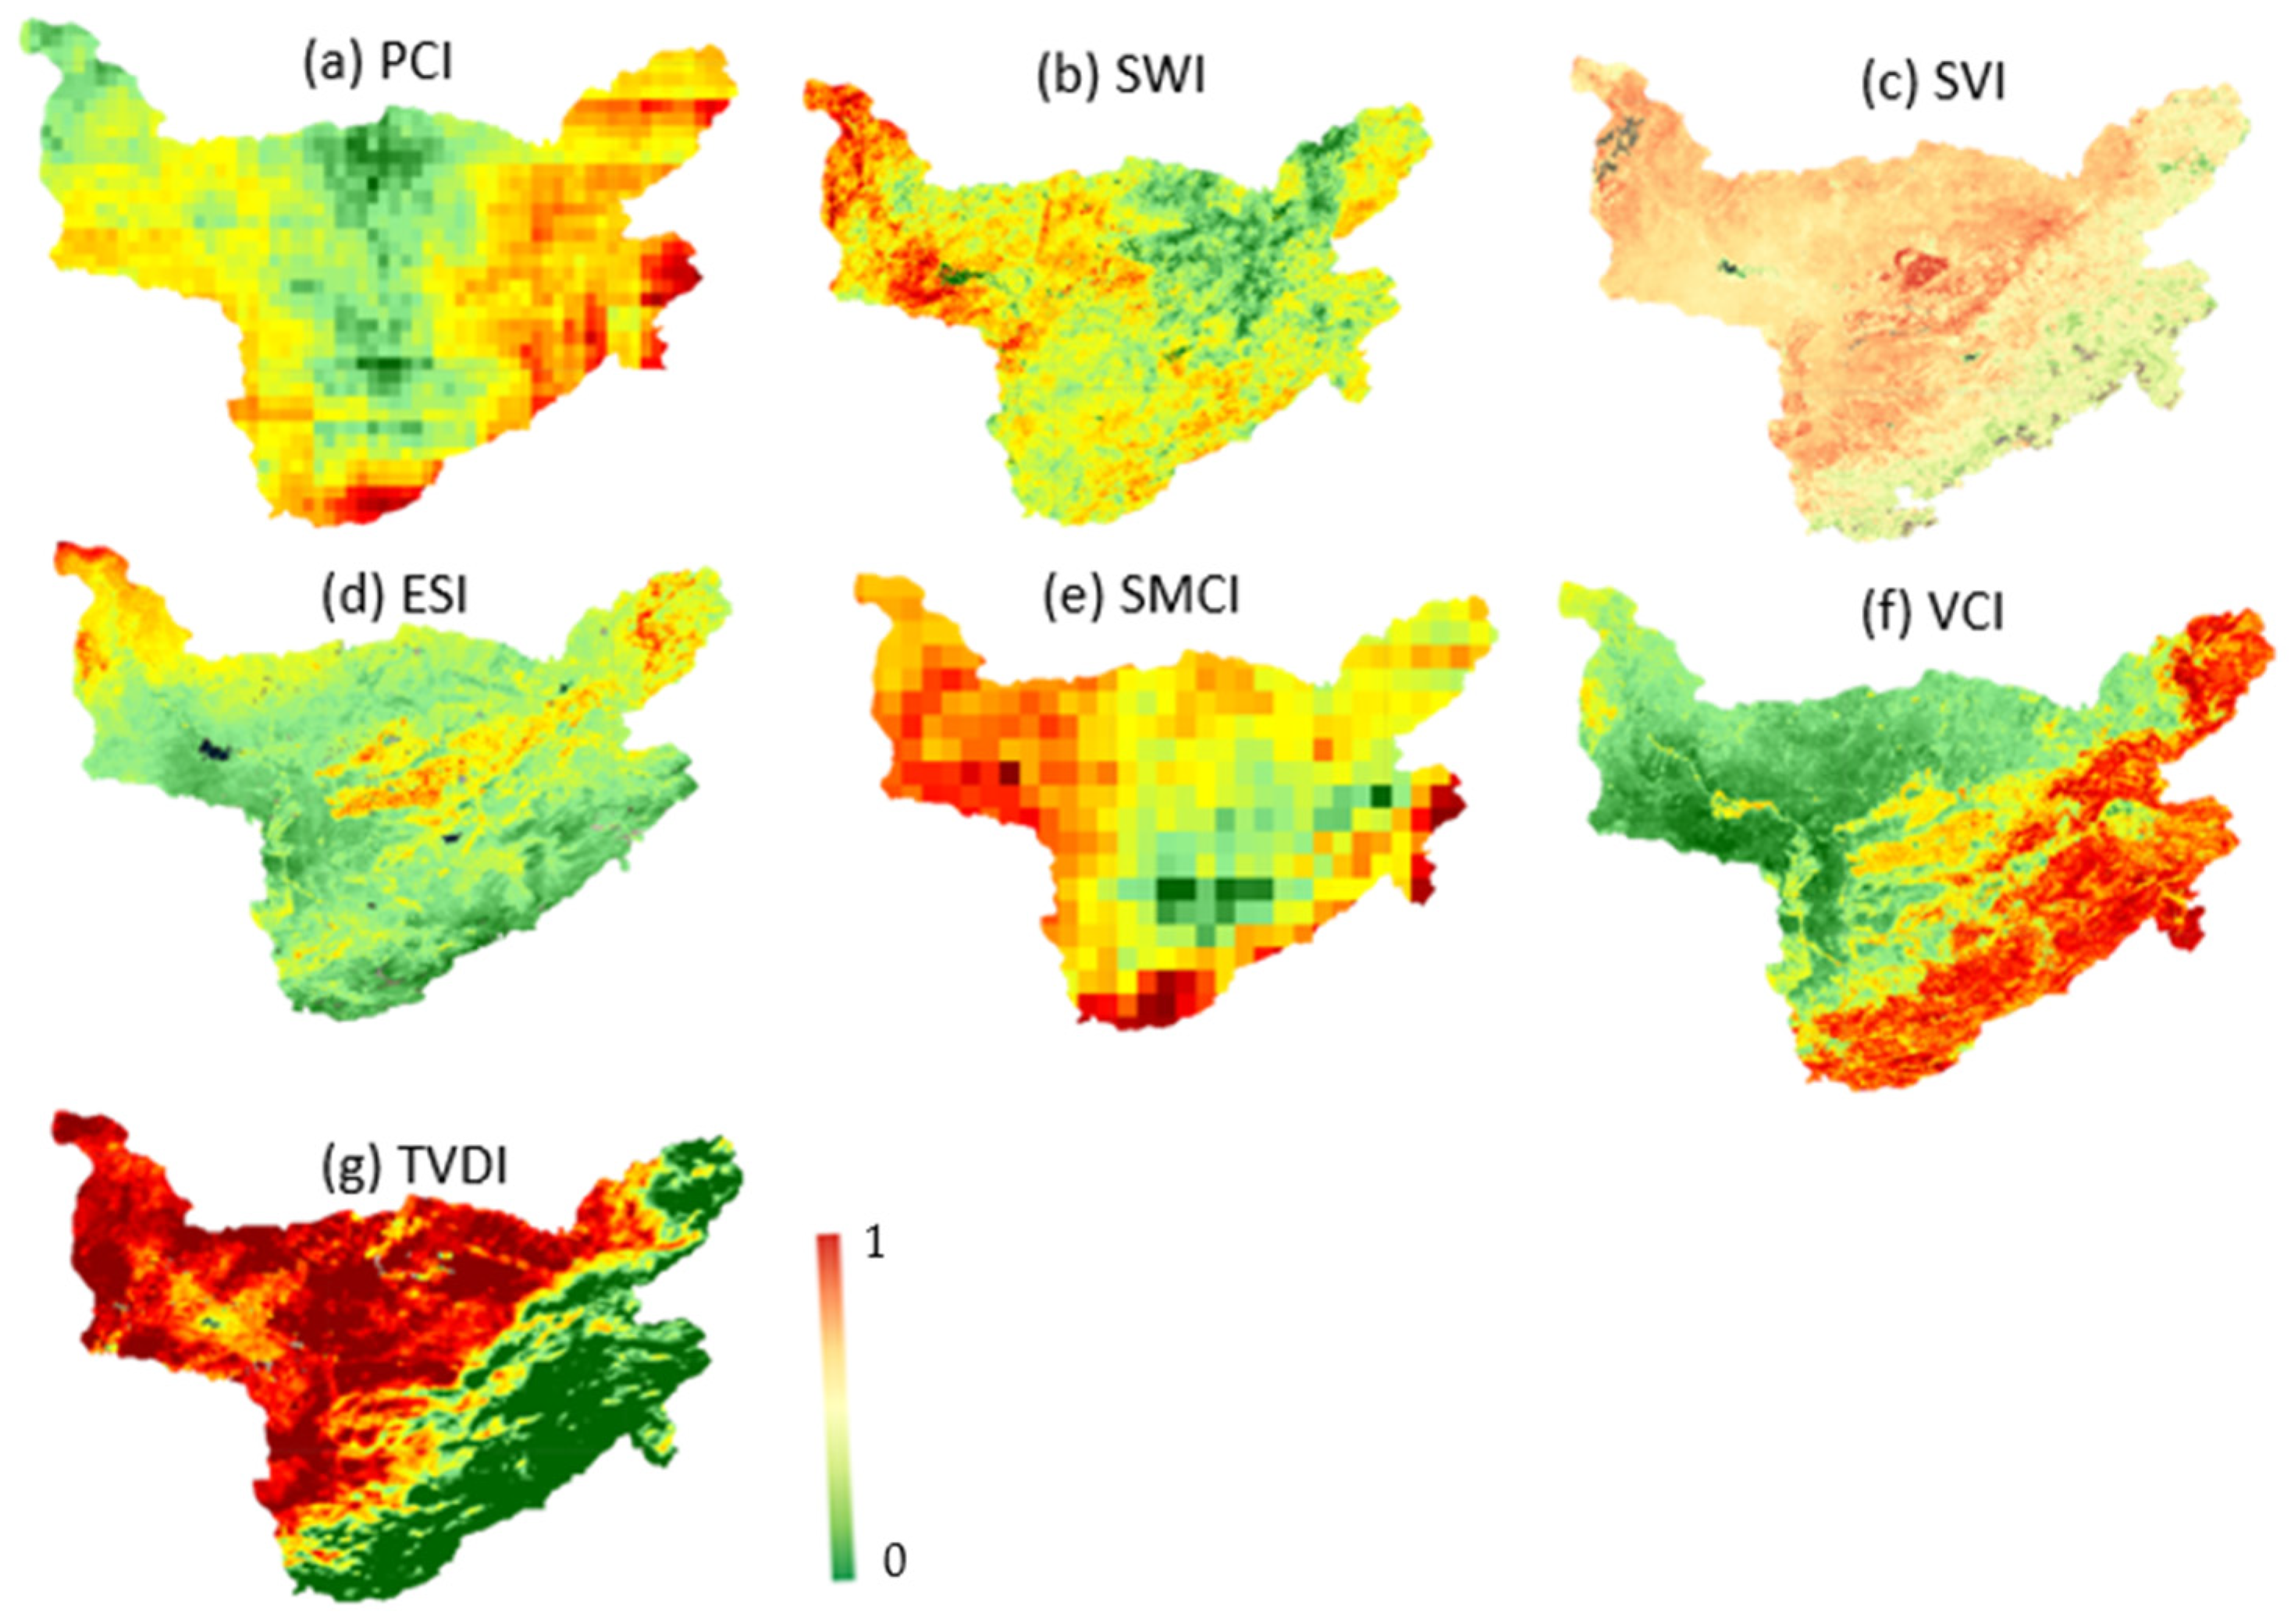
In this section, we present the various datasets that serve as input for our analytical model. These seven data are PCI, SWI, SVI, ESI, SMCI, VCI, and TVDI. Understanding these inputs is essential for interpreting the model’s results and ensuring its applicability to real-world scenarios. PCI (Figure 7a) varies between −3.107 and −0.029 over the entire basin showing a slightly dry conditions area in red color to extremely dry conditions area in green color. SWI (Figure 7b) varies between −0.629 and 0.329 over the entire basin showing that the entire basin lacks water. Western and Southern Areas (Yellow to Red) show varying degrees of above-average water availability. The red areas, particularly in the west, indicate the highest levels of lack of water, and this might require strategies to be considered to manage water resources in these agricultural areas. SVI (Figure 7c) varies between −2.5 (red) and 1.46 (green) over the entire basin area. The red areas indicate extremely poor vegetation conditions. These regions are experiencing significant vegetation stress or degradation, likely due to drought, and poor soil conditions. The presence of dark red patches indicates areas with the most severe stress. In the ESI (Figure 7d), the Western and Northern Areas (Yellow to Red) are experiencing moderate to very high evaporative stress. The red regions, particularly in the northwest, indicate the highest levels of stress, suggesting severe water shortage and potential drought conditions. Farmers in this region might need to implement irrigation strategies to mitigate water stress in crops. SMCI is an essential indicator that evaluates drought conditions based on soil moisture. It is particularly useful for identifying periods of agricultural drought and for monitoring soil moisture levels. From the SMCI (Figure 7e) map, we see that in most of the agricultural land located in the watershed western part, the vegetation is probably stressed, with signs of wilting, discoloration, or drying. Immediate interventions, such as irrigation, are needed to mitigate the effects of drought. While in the western part of the basin, the moderate SMCI values (around 0.5) suggest normal to slightly dry soil conditions. The soil may have sufficient water, but moisture reserves have begun to diminish. For VCI, Figure 7f shows that central and eastern areas (yellow to red) have higher vegetation stress. The red regions, particularly in the east, indicate the highest levels of stress, suggesting severe conditions affecting vegetation health. Finally, TDVI (Figure 7g) varies between 0.34 and 0.88 over the entire basin. The TVDI is an indicator that combines temperature and vegetation indices to assess drought conditions. In this image, we can see that central, western, and northern areas are experiencing higher drought stress. The yellow areas indicate moderate stress, while the orange and red areas indicate severe to extreme drought conditions, with the dark red regions facing the highest stress levels.

3.4. Statistical Validation

The correlations between four aggregated drought indices (WIMDI, VHI, VDSI, SDCI) and various reference drought indices—including SPI (at 1-, 3-, and 6-months), which represent different aspects of short-, medium-, and long-term drought conditions, as well as SDI, SEDI, and SMCI—were evaluated. Among these remotely sensed drought indices, WIMDI consistently demonstrated superior performance across most evaluation metrics. As presented in Table 5, WIMDI showed stronger correlations with the 1-, 3-, and 6-month SPI, SDI, SEDI, and SMCI compared to VHI, VDSI, and SDCI (r = 0.728, 0.805, 0.733, 0.750, 0.730, 0.710, respectively, p < 0.05 for all cases). Furthermore, Table 6 indicates that WIMDI exhibited lower RMSE values than VHI, VDSI, and SDCI (RMSE = 0.698, 1.106, 1.133, 1.100, 1.090, 1.080 respectively). Compared to the reference drought indices (SPI-1, SPI-3, SPI-6, SDI, SEDI, and SMCI), WIMDI has lower prediction uncertainty.

3.5. Spatiotemporal Validation

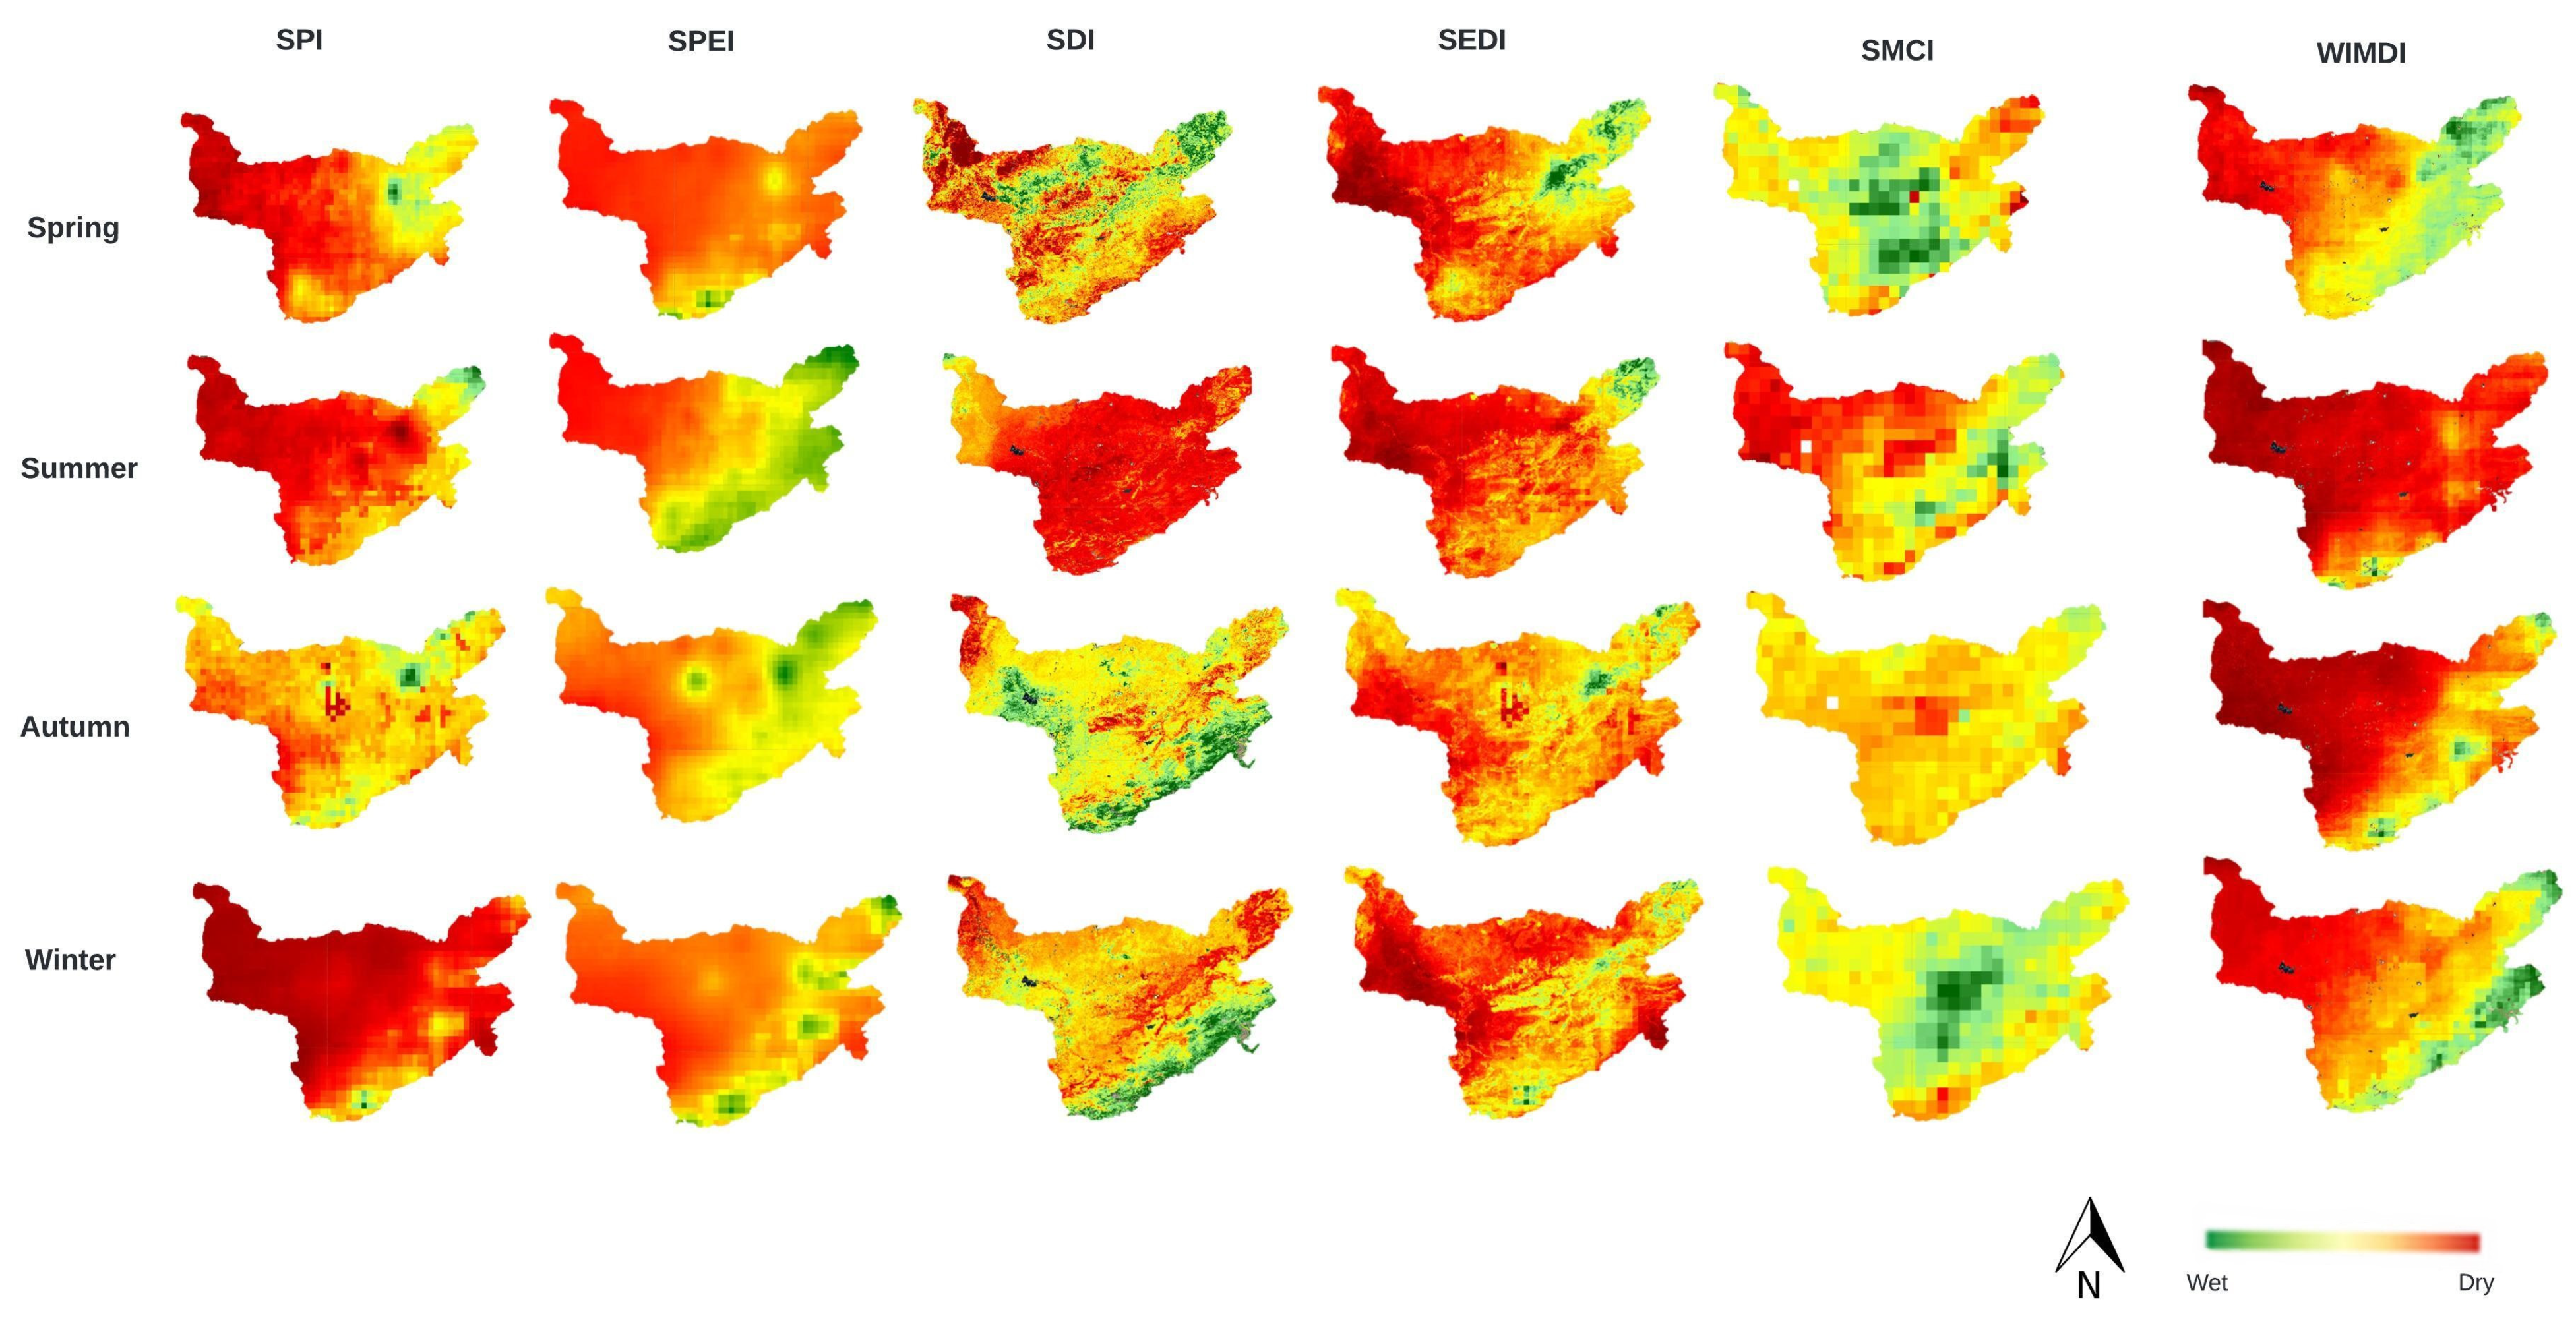
In addition to statistical validation, a seasonal comparison of WIMDI was conducted against other widely used drought indices, each representing different types of droughts: SPI and SPEI for meteorological drought, SDI for hydrological drought, SEDI for socio-economic drought, and SMCI for agricultural drought. Figure 8 provides the spatial distribution of drought intensity across Spring, Summer, Autumn, and Winter, as captured by each index. The comparison shows that WIMDI effectively mirrors the seasonal drought patterns identified by these indices, particularly during the most severe drought periods in Summer and Autumn. This alignment indicates WIMDI’s robustness in integrating various drought-related parameters to provide a comprehensive assessment of meteorological, hydrological agricultural, and socio-economic drought conditions across the OER watershed.
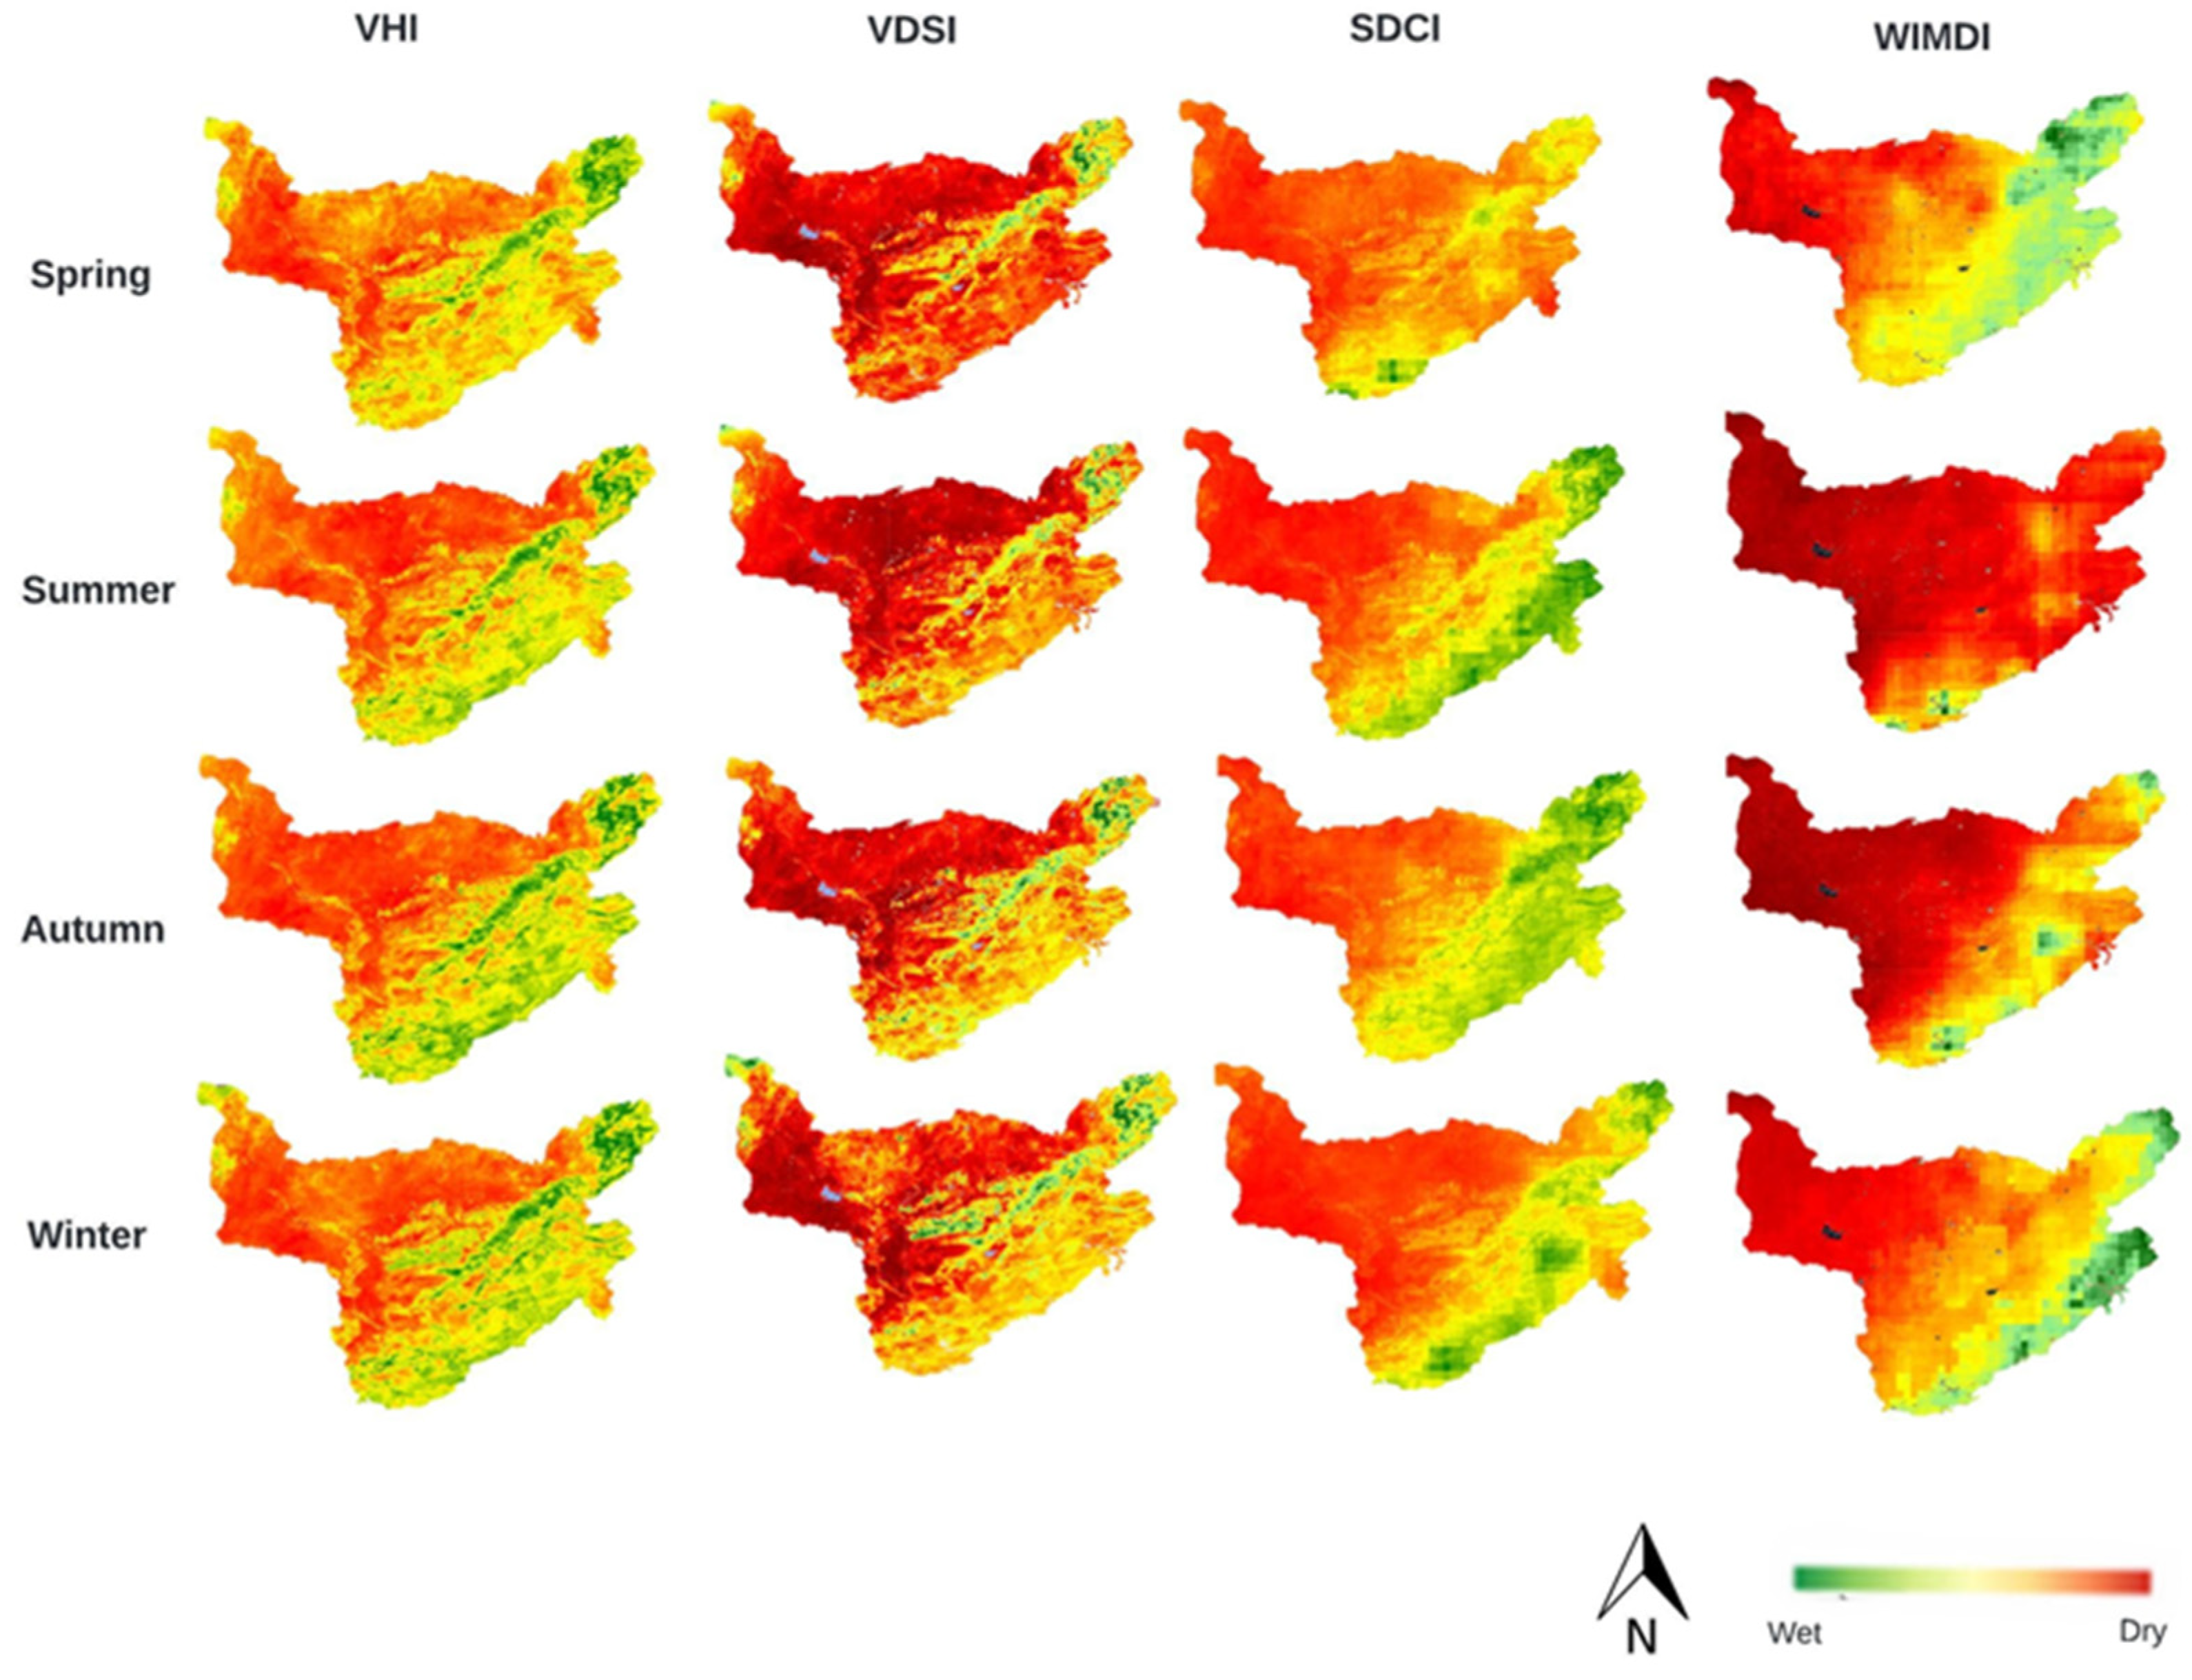
To assess the comparative performance of WIMDI, a comparison with integrated drought indices, including VHI, VDSI, and SDCI was established to evaluate its seasonal and spatial performance. Figure 9 illustrates the spatial distribution of drought intensity across the four seasons of the year, as captured by these indices. The comparison shows that WIMDI closely aligns with the other indices, particularly during severe drought periods, while presenting a more holistic approach that integrates multiple drought-related factors, resulting in a more comprehensive and detailed assessment of drought conditions across the OER watershed. This enhanced capability makes WIMDI a valuable tool for drought monitoring, providing a nuanced understanding of drought impacts that supports informed decision making in watershed management.

3.6. Drought Yearly Mean Comparison

To comprehensively assess the spatial variation in drought conditions across the OER watershed, a comparative analysis was conducted using multiple drought indices for the years 2005, 2010, and 2022. These years were strategically selected as they represent severe, moderate, and extreme drought conditions, respectively. The analysis included indices, particularly SPI, VHI, VDSI, SDCI, and the WIMDI.
Figure 10 presents the spatial distribution of drought intensity as captured by these indices for the years 2005, 2010, and 2022, with the SPI used as the reference map. A visual comparison reveals that WIMDI aligns closely with the SPI map in these years, particularly in capturing the spatial extent of severe drought in 2005, moderate drought in 2010, and extreme drought in 2022. Other indices tend to underestimate drought conditions, especially in the eastern and southeastern regions. WIMDI’s ability to more accurately represent the spatial extent of drought highlights its robustness as a comprehensive tool for drought monitoring. This comparison underscores the effectiveness of using the WIMDI index to assess drought conditions over time.

3.7. OER Watershed Drought Monitoring Cloud Interface

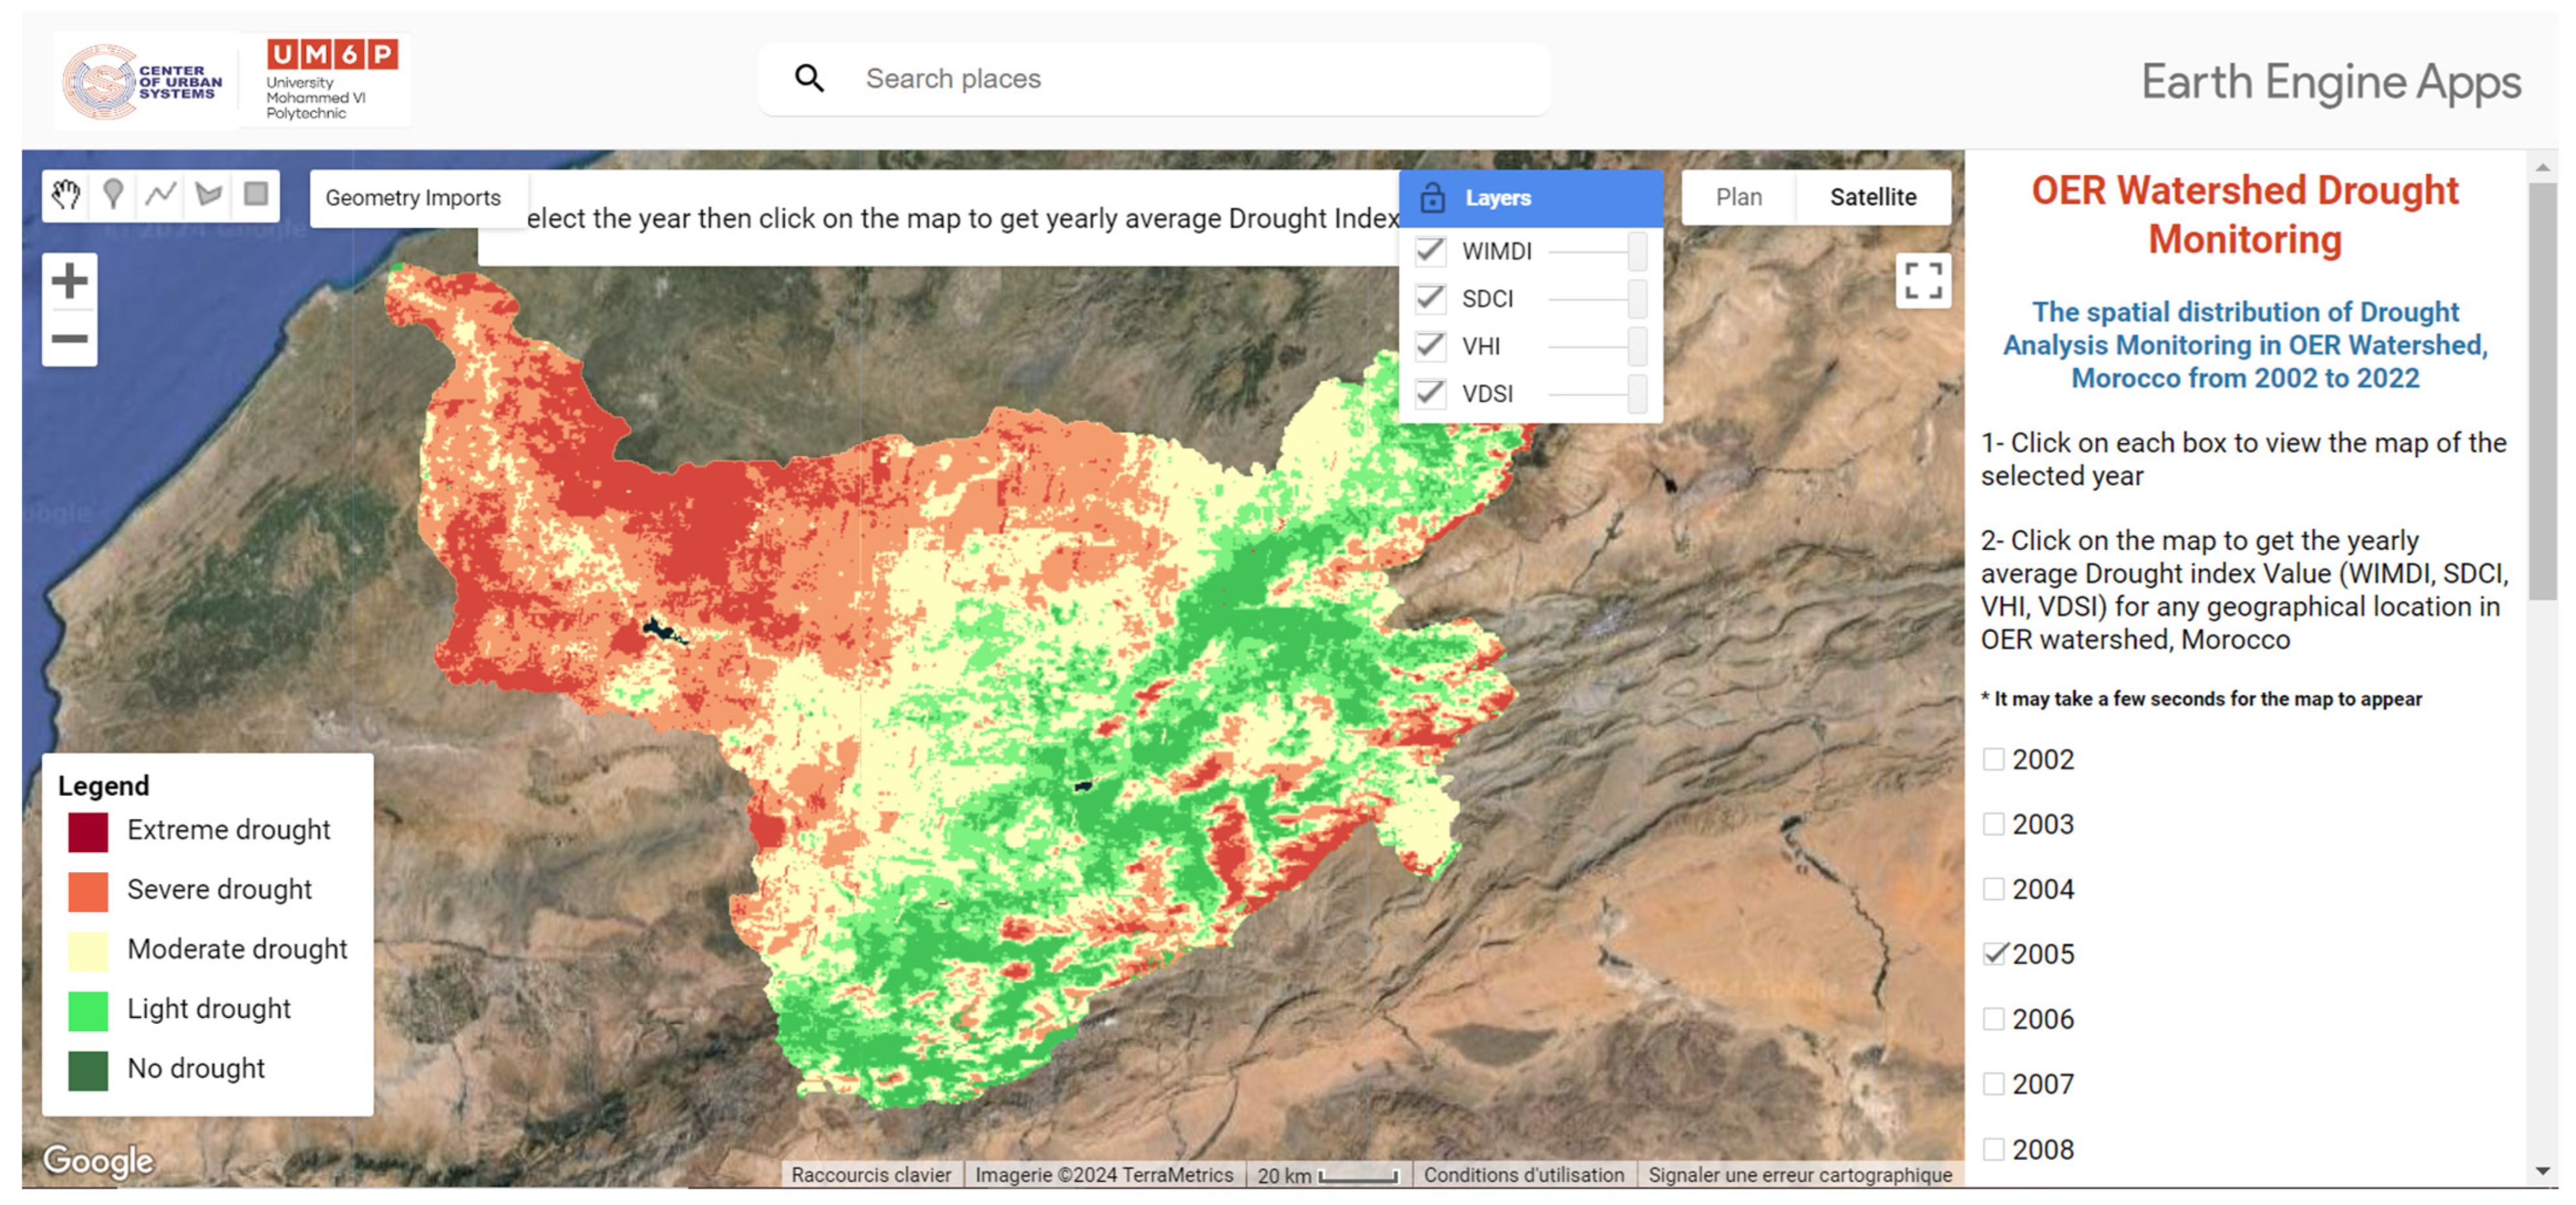
As shown in Figure 11, the application (https://imaneserbouti.users.earthengine.app/view/wimdi-oer-watershed-morocco) (accessed on 3 September 2024) provides the yearly average VHI, VDSI, SDCI, and WIMDI, from 2002 to 2022. This application enables users to display these four indices map for the OER watershed and query these indices values for any point within the area of interest. Users can choose the year they want to investigate from the checkbox panel.

4. Discussion

4.1. Leveraging Cloud Monitoring Interface to Assess Human Impact on Drought Patterns in the OER Watershed

The application of WIMDI has provided a nuanced and comprehensive understanding of drought dynamics within the OER watershed, closely aligning with observed shifts in regional climate patterns influenced by human activities such as intensified irrigated agriculture and urban expansion. The OER Watershed Drought Monitoring cloud interface has played a crucial role in visualizing these dynamics, offering an accessible platform for users to explore and analyze the yearly average drought indices, including WIMDI, VHI, SDCI, and VDSI, from 2002 to 2022.
Our findings reveal significant correlations between WIMDI, and areas subjected to agricultural intensification and urban sprawl, underscoring the index’s effectiveness in capturing the impacts of these human activities on hydrological stability. By incorporating remote sensing data such as VCI and TVDI from VIUPD, SVI from EVI, and SMCI from GLDAS-2.1, the WIMDI enables a detailed spatial analysis that highlights localized drought conditions. These findings demonstrate that WIMDI offers superior consistency compared to other widely used aggregated indices, reinforcing its validity under varied environmental conditions. The integration of these indices through the cloud interface further enhances the ability to monitor and manage drought risks, particularly in regions facing significant anthropogenic pressures.

4.2. Agricultural Practices and Water Resource Sustainability

Our analysis indicates that peaks in evapotranspiration and reduced soil moisture conditions correlate with periods of agricultural expansion, particularly noted in the years 2005 and 2010. This suggests that intensified farming practices, including the increased use of irrigation and high-water-demand crops, contribute significantly to water stress within the watershed. The deterioration in soil moisture conditions, as reflected by the Soil Moisture Condition Index (SMCI), and the Vegetation Condition Index (VCI), points to the vulnerability of agricultural lands to drought conditions, necessitating a shift toward more sustainable agricultural practices.
Figure 11 illustrates the evolution of irrigated areas (highlighted in green) across all basin areas over three distinct years: 2002, 2010, and 2022. The map shows the distribution of irrigated areas in 2002 (Figure 12a). These areas are concentrated primarily in the central part of the region with a surface of 196,000 hectares. By 2010 (Figure 12b), the irrigated areas have expanded significantly compared to 2002. The central region sees a noticeable increase in the extent of irrigated land with a surface of 320,000 hectares. The irrigated areas in 2022 (Figure 12c) have expanded even further, covering a much larger portion of the region (560,000 hectares). The central region has the most significant increase, with continuous green patches indicating extensive irrigation networks. Expanding irrigated areas increases the demand for water, primarily sourced from surface water bodies and groundwater. This heightened demand can exacerbate water scarcity, especially during dry periods. The expansion of irrigated areas in the OER basin significantly impacts drought dynamics by increasing water demand, depleting groundwater resources, reducing surface water availability, and degrading the environment. These changes can exacerbate the effects of drought, making the region more vulnerable to water scarcity.

4.3. Urban Expansion and Drought Vulnerability

The study also highlights the exacerbating effect of urban expansion on drought severity. Urban areas, particularly in the western and southern parts of the watershed, have shown a consistent pattern of reduced water availability and increased drought stress. This is consistent with the literature that describes how urbanization leads to increased impervious surfaces, thereby reducing groundwater recharge and increasing surface runoff. These changes in land use require strategic urban planning that incorporates green infrastructure to mitigate the effects of reduced infiltration and increased runoff, thus enhancing urban resilience to drought. The map shows the distribution of built-up areas in 2002, 2010, and 2022. In 2002 (Figure 13a), built-up areas (3200 hectares) are relatively sparse, indicating limited urban development currently. Built-up regions are concentrated in certain pockets. By 2010 (Figure 13b), there is a noticeable increase in the built-up areas compared to 2002. The urban regions have expanded, covering a larger portion of the map (4500 hectares). The growth is not uniform, with some areas experiencing significant expansion while others remain relatively unchanged. This suggests varying rates of urbanization across the region. The built-up areas in 2022 (Figure 13c) have expanded even further, indicating continuous urban growth over the 20-year period. Over the 20-year period from 2002 to 2022, there is a clear trend of increasing built-up areas. This indicates significant urban development and expansion. The intensity of urban growth appears to accelerate over time, with more substantial increases in built-up areas observed between 2010 and 2022 compared to the previous decade.

4.4. Spatial Correlation between Drought, Urbanization, and Irrigated Areas

Figure 14 clearly illustrates the relationship between urbanization, irrigated areas, and drought conditions in 2022. Areas with significant built-up regions and irrigated areas tend to overlap with zones experiencing severe drought, highlighting the impact of urbanization on local water resources. This correlation underscores the need for sustainable urban planning and integrated water resource management to mitigate the adverse effects of urbanization on drought dynamics. Implementing efficient water-use practices, promoting green infrastructure, and adopting climate-resilient planning are essential steps to ensure the sustainable development of urban areas while protecting water resources.

5. Conclusions

This study successfully demonstrates the application of the WIMDI using GEE to assess the impact of intensified irrigated agricultural activities and urban expansion on drought dynamics within the OER watershed in Morocco. By integrating various drought indicators, including SWI, ESI, SVI, TVDI, VCI, PCI, and SMCI, through the LOWA model over a 20-year period (2002–2022), WIMDI provides a comprehensive and dynamic tool for evaluating multi-drought conditions at the watershed scale.
Key findings of this research include the following:
1. Intensified Irrigated Agricultural Activities: The results indicate that the expansion of irrigated areas significantly correlates with increased drought severity. Intensive agricultural practices, particularly those involving high-water-demand crops, exacerbate water scarcity issues by depleting water resources, reducing groundwater recharge, increasing soil salinity, causing waterlogging and soil degradation, altering local climate patterns, and disrupting natural ecosystems, thereby reducing biodiversity. Consequently, while irrigation is essential for agriculture, its overuse and mismanagement can lead to more severe and frequent droughts.
2. Urban Expansion: Rapid urbanization in the watershed has further aggravated drought conditions by reducing groundwater recharge and increasing surface runoff. Urban areas, especially in the western and southern parts of the watershed, exhibited consistent patterns of reduced water availability and heightened drought stress.
3. Efficacy of the WIMDI: Statistical validation of WIMDI against various drought types of indices, including SPEI, SPI, SDI, SEDI, and SMCI demonstrated strong correlations and lower RMSE values, underscoring WIMDI’s accuracy and reliability in drought assessment.
4. Spatiotemporal Validation: WIMDI’s effectiveness was also validated through spatiotemporal seasonal analyses and interannual variability. These analyses, conducted against various drought-type indices as well as widely used aggregated indices, confirmed WIMDI’s capability to accurately capture the spatial and temporal variability of drought conditions across the diverse climate zones within the OER watershed.
5. Drought Monitoring GEE Application: A detailed exploration, assessment, and comparison of WIMDI with existing indices was conducted using a developed GEE application across the OER watershed. This application, publicly accessible via https://imaneserbouti.users.earthengine.app/view/wimdi-oer-watershed-morocco (accessed on 3 September 2024), allows users to view and interact with the results, create their own monitoring maps, and extract data for their chosen watershed. It enhances the analysis of the spatial and temporal distribution of drought and improves the monitoring of various drought types.
In conclusion, this research highlights the critical interplay between human activities and drought dynamics in the OER watershed. The innovative use of GEE for developing WIMDI offers a replicable model for drought assessment in other vulnerable regions, providing valuable insights for developing more sustainable land management strategies. Ongoing monitoring and adaptation of these strategies will be essential for mitigating the impacts of climate change and ensuring water security in the region.

Author Contributions

Conceptualization, I.S., J.C. and B.P.; methodology, I.S., J.C. and B.P.; software, I.S.; writing—original draft preparation, I.S.; writing—review and editing, B.P., J.C., E.B.D., R.A., S.A.E.A., M.A., M.H. and M.B.; supervision, J.C. and B.P.; project administration, J.C. All authors have read and agreed to the published version of the manuscript.

Funding

This research received no external funding.

Data Availability Statement

The GEE application is available at https://imaneserbouti.users.earthengine.app/view/wimdi-oer-watershed-morocco (accessed on 3 September 2024).

Conflicts of Interest

The authors declare no conflicts of interest.

References

  1. Erian, W.; Pulwarty, R.; Vogt, J.V.; AbuZeid, K.; Bert, F.; Bruntrup, M.; El-Askary, H.; de Estrada, M.; Gaupp, F.; Grundy, M.; et al. GAR Special Report on Drought 2021; United Nations Office for Disaster Risk Reduction (UNDRR): Geneva, Switzerland, 2021; ISBN 9789212320274. [Google Scholar]
  2. Wilhite, D.A.; Sivakumar, M.V.; Wood, D.A. Early Warning Systems for Drought Preparedness and Drought Management. In Proceedings of the Expert Group Meeting, Lisbon, Portugal, 5–7 September 2000; World Meteorological Organization: Geneva, Switzerland, 2000; 208p. [Google Scholar]
  3. Mishra, A.K.; Singh, V.P. A review of drought concepts. J. Hydrol. 2010, 391, 202–216. [Google Scholar] [CrossRef]
  4. Palmer, W.C. Meteorological Drought; Office of Climatology Research Paper No. 45; US Weather Bureau: Washington, DC, USA, 1965. [Google Scholar]
  5. UNISDR. (United Nations International Strategy for Disaster Risk Reduction, Revealing Risk), Redefining Development Global Assessment Report on Disaster Risk Reduction. 2011. Available online: www.preventionweb.net/gar (accessed on 30 July 2024).
  6. Keyantash, J.; Dracup, J.A. The Quantification of Drought: An Evaluation of Drought Indices. Bull. Am. Meteorol. Soc. 2002, 83, 1167–1180. [Google Scholar] [CrossRef]
  7. Famiglietti, J.S. The global groundwater crisis. Nat. Clim. Chang. 2014, 4, 945–948. [Google Scholar] [CrossRef]
  8. Sheffield, J.; Wood, E.F. Global trends and variability in soil moisture and drought characteristics, 1950–2000, from observation-driven simulations of the terrestrial hydrologic cycle. J. Clim. 2008, 21, 432–458. [Google Scholar] [CrossRef]
  9. Wilhite, D.A.; Sivakumar, M.V.; Pulwarty, R. Managing drought risk in a changing climate: The role of national drought policy. Weather. Clim. Extrem. 2014, 3, 4–13. [Google Scholar] [CrossRef]
  10. McKee, T.B.; Doesken, N.J.; Kleist, J. The Relationship of Drought Frequency and Duration to Time Scales. In Proceedings of the 8th Conference on Applied Climatology, Anaheim, CA, USA, 17–22 January 1993; pp. 179–184. [Google Scholar]
  11. Heim, R.R. A Review of Twentieth-Century Drought Indices Used in the United States. Bull. Am. Meteorol. Soc. 2002, 83, 1149–1166. [Google Scholar] [CrossRef]
  12. Bijaber, N.; El Hadani, D.; Saidi, M.; Svoboda, M.D.; Wardlow, B.D.; Hain, C.R.; Poulsen, C.C.; Yessef, M.; Rochdi, A. Developing a Remotely Sensed Drought Monitoring Indicator for Morocco. Geosciences 2018, 8, 55. [Google Scholar] [CrossRef]
  13. Ouatiki, H.; Boudhar, A.; Tramblay, Y.; Jarlan, L.; Benabdelouhab, T.; Hanich, L.; El Meslouhi, M.R.; Chehbouni, A. Evaluation of TRMM 3B42 V7 rainfall product over the Oum Er Rbia watershed in Morocco. Climate 2017, 5, 1. [Google Scholar] [CrossRef]
  14. Bouchaou, L.; Choukr-Allah, R.; Hirich, A.; Seif-Ennasr, M.; Malki, M.; Abahous, H.; Bouaakaz, B.; Nghira, A. Climate change and water valuation in Souss-Massa region: Management and adaptive measures. Eur. Water 2017, 60, 203–209. Available online: https://www.researchgate.net/publication/322050444 (accessed on 30 July 2024).
  15. Ben Salem, S.; Ben Salem, A.; Karmaoui, A.; Khebiza, M.Y. Vulnerability of Water Resources to Drought Risk in Southeastern Morocco: Case Study of Ziz Basin. Water 2023, 15, 4085. [Google Scholar] [CrossRef]
  16. Analy, M.; Laftouhi, N.-E. Groundwater depletion in an urban environment under semiarid climate and persistent drought–city of Marrakesh (Morocco). Water 2021, 13, 3253. [Google Scholar] [CrossRef]
  17. Ouatiki, H.; Boudhar, A.; Ouhinou, A.; Arioua, A.; Hssaisoune, M.; Bouamri, H.; Benabdelouahab, T. Trend analysis of rainfall and drought over the Oum Er-Rbia River Basin in Morocco during 1970–2010. Arab. J. Geosci. 2019, 12, 128. [Google Scholar] [CrossRef]
  18. El Qorchi, F.; Khebiza, M.Y.; Omondi, O.A.; Karmaoui, A.; Pham, Q.B.; Acharki, S. Analyzing Temporal Patterns of Temperature, Precipitation, and Drought Incidents: A Comprehensive Study of Environmental Trends in the Upper Draa Basin, Morocco. Water 2023, 15, 3906. [Google Scholar] [CrossRef]
  19. Larabi, A.; El Asri, H.; Elhamidi, M.J.; Zhim, S. Modeling the impacts of climate change on water resources in Mediterranean and Atlantic hydraulic basins of Morocco. Desalination Water Treat. 2020, 176, 434–435. [Google Scholar] [CrossRef]
  20. Eddoughri, F.; Lkammarte, F.Z.; El Jarroudi, M.; Lahlali, R.; Karmaoui, A.; Khebiza, M.Y.; Messouli, M. Analysis of the Vulnerability of Agriculture to Climate and Anthropogenic Impacts in the Beni Mellal-Khénifra Region, Morocco. Sustainability 2022, 14, 13166. [Google Scholar] [CrossRef]
  21. Hssaisoune, M.; Bouchaou, L.; Sifeddine, A.; Bouimetarhan, I.; Chehbouni, A. Moroccan groundwater resources and evolution with global climate changes. Geosciences 2020, 10, 81. [Google Scholar] [CrossRef]
  22. Jamali, M.Y.; Namous, M.; Amir, S. Impact of overexploitation of groundwater along the irrigated perimeter of Tadla, Oum Errabia Basin, Morocco. Desalination Water Treat. 2020, 195, 201–212. [Google Scholar] [CrossRef]
  23. El Garouani, A.; Msaddek, M. The effect of landuse dynamics on water balance components in the Upper Oum Er Rabia Basin, Morocco. E3S Web Conf. 2024, 489, 04009. [Google Scholar] [CrossRef]
  24. Ouassanouan, Y.; Fakir, Y.; Simonneaux, V.; Kharrou, M.H.; Bouimouass, H.; Najar, I.; Benrhanem, M.; Sguir, F.; Chehbouni, A. Multi-decadal analysis of water resources and agricultural change in a Mediterranean semiarid irrigated piedmont under water scarcity and human interaction. Sci. Total Environ. 2022, 834, 155328. [Google Scholar] [CrossRef]
  25. Molle, F. Conflicting Policies: Agricultural Intensification vs. Water Conservation in Morocco. 2017. Available online: http://www.g-eau.net/ (accessed on 30 July 2024).
  26. Benamar, A.; Mahjoubi, F.Z.; Kzaibe, F. Evaluation of water quality of Oum Er Rbia River (Morocco) using water quality index method. J. Appl. Surf. Interfaces 2019, 5, 1–12. [Google Scholar] [CrossRef]
  27. Strohmeier, S.; López, P.L.; Haddad, M.; Nangia, V.; Karrou, M.; Montanaro, G.; Boudhar, A.; Linés, C.; Veldkamp, T.; Sterk, G. Surface Runoff and Drought Assessment Using Global Water Resources Datasets—From Oum Er Rbia Basin to the Moroccan Country Scale. Water Resour. Manag. 2020, 34, 2117–2133. [Google Scholar] [CrossRef]
  28. Echakraoui, Z.; Boukdir, A.; Aderoju, O.; Saïd, E.H.B.; Zitouni, A.; El Maslouhi, R.; Dias, A.G. The climate changes in the sub-basin of the Oum Er rbia central and the impact on the surface waters. E3S Web Conf. 2018, 37, 03003. [Google Scholar] [CrossRef]
  29. Aksoy, S.; Gorucu, O.; Sertel, E. Drought Monitoring using MODIS derived indices and Google Earth Engine Platform. In Proceedings of the 2019 8th International Conference on Agro-Geoinformatics (Agro-Geoinformatics), Istanbul, Turkey, 16–19 July 2019; IEEE: New York, NY, USA, 2019. [Google Scholar]
  30. Zhao, X.; Xia, H.; Pan, L.; Song, H.; Niu, W.; Wang, R.; Li, R.; Bian, X.; Guo, Y.; Qin, Y. Drought monitoring over yellow river basin from 2003–2019 using reconstructed MODIS land surface temperature in google earth engine. Remote Sens. 2021, 13, 3748. [Google Scholar] [CrossRef]
  31. Hwan, J.L.; Carlson, S.M. Fragmentation of an Intermittent Stream During Seasonal Drought: Intra-annual and Interannual Patterns and Biological Consequences. River Res. Appl. 2016, 32, 856–870. [Google Scholar] [CrossRef]
  32. Li, J.; Wang, Z.; Lai, C. Severe drought events inducing large decrease of net primary productivity in mainland China during 1982–2015. Sci. Total Environ. 2020, 703, 135541. [Google Scholar] [CrossRef]
  33. Van Hoek, M.; Jia, L.; Zhou, J.; Zheng, C.; Menenti, M. Early drought detection by spectral analysis of satellite time series of precipitation and normalized difference vegetation index (NDVI). Remote Sens. 2016, 8, 422. [Google Scholar] [CrossRef]
  34. van Ginkel, M.; Biradar, C. Drought early warning in agri-food systems. Climate 2021, 9, 134. [Google Scholar] [CrossRef]
  35. Jones, R.L.; Guha-Sapir, D.; Tubeuf, S. Human and economic impacts of natural disasters: Can we trust the global data? Sci. Data 2022, 9, 572. [Google Scholar] [CrossRef]
  36. Freire-González, J.; Decker, C.; Hall, J.W. The Economic Impacts of Droughts: A Framework for Analysis. Ecol. Econ. 2017, 132, 196–204. [Google Scholar] [CrossRef]
  37. Rejekiningrum, P.; Apriyana, Y.; Sutardi; Estiningtyas, W.; Sosiawan, H.; Susilawati, H.L.; Hervani, A.; Alifia, A.D. Optimising Water Management in Drylands to Increase Crop Productivity and Anticipate Climate Change in Indonesia. Sustainability 2022, 14, 11672. [Google Scholar] [CrossRef]
  38. Balti, H.; Ben Abbes, A.; Mellouli, N.; Farah, I.R.; Sang, Y.; Lamolle, M. A review of drought monitoring with big data: Issues, methods, challenges and research directions. Ecol. Inform. 2020, 60, 101136. [Google Scholar] [CrossRef]
  39. Hazaymeh, K.; Hassan, Q.K. Remote sensing of agricultural drought monitoring: A state of art review. AIMS Environ. Sci. 2016, 3, 604–630. [Google Scholar] [CrossRef]
  40. Qazvini, A.T.; Carrion, D. A Spatiotemporal Drought Analysis Application Implemented in the Google Earth Engine and Applied to Iran as a Case Study. Remote Sens. 2023, 15, 2218. [Google Scholar] [CrossRef]
  41. Ejaz, N.; Bahrawi, J.; Alghamdi, K.M.; Rahman, K.U.; Shang, S. Drought Monitoring Using Landsat Derived Indices and Google Earth Engine Platform: A Case Study from Al-Lith Watershed, Kingdom of Saudi Arabia. Remote Sens. 2023, 15, 984. [Google Scholar] [CrossRef]
  42. Adell, M.; Domínguez-Gómez, J.A.; Soria, J. Monitoring of forty years of agricultural expansion in the Oum Er Rbia valley (Morocco). The use of Google Earth Engine compared to Sentinel Application Platform. Preprints 2021. [Google Scholar] [CrossRef]
  43. Oularbi, Y.; Dahmani, J.; Mounir, F. Dynamics of land-use Change using Geospatial Techniques From 1986 to 2019: A Case Study of High Oum Er-Rbia Watershed (Middle Atlas Region). J. Exp. Biol. Agric. Sci. 2022, 10, 369–378. [Google Scholar] [CrossRef]
  44. Adaawen, S. Understanding climate change and drought perceptions, impact and responses in the rural Savannah, West Africa. Atmosphere 2021, 12, 594. [Google Scholar] [CrossRef]
  45. Tsesmelis, D.E.; Leveidioti, I.; Karavitis, C.A.; Kalogeropoulos, K.; Vasilakou, C.G.; Tsatsaris, A.; Zervas, E. Spatiotemporal Application of the Standardized Precipitation Index (SPI) in the Eastern Mediterranean. Climate 2023, 11, 95. [Google Scholar] [CrossRef]
  46. Sun, J.; Bi, S.; Bashir, B.; Ge, Z.; Wu, K.; Alsalman, A.; Ayugi, B.O.; Alsafadi, K. Historical Trends and Characteristics of Meteorological Drought Based on Standardized Precipitation Index and Standardized Precipitation Evapotranspiration Index over the Past 70 Years in China (1951–2020). Sustainability 2023, 15, 10875. [Google Scholar] [CrossRef]
  47. Nalbantis, I.; Tsakiris, G. Assessment of Hydrological Drought Revisited. Water Resour. Manag. 2009, 23, 881–897. [Google Scholar] [CrossRef]
  48. Shi, H.; Chen, J.; Wang, K.; Niu, J. A new method and a new index for identifying socioeconomic drought events under climate change: A case study of the East River basin in China. Sci. Total Environ. 2018, 616–617, 363–375. [Google Scholar] [CrossRef] [PubMed]
  49. Cao, M.; Chen, M.; Liu, J.; Liu, Y. Assessing the performance of satellite soil moisture on agricultural drought monitoring in the North China Plain. Agric. Water Manag. 2022, 263, 107450. [Google Scholar] [CrossRef]
  50. Loup, J. L’Oum er Rebia. Etudes sur une grande rivière des montagnes marocaines. Rev. De Géographie Alp. 1962, 50, 519–555. [Google Scholar] [CrossRef]
  51. Barakat, A.; El Baghdadi, M.; Rais, J.; Aghezzaf, B.; Slassi, M. Assessment of spatial and seasonal water quality variation of Oum Er Rbia River (Morocco) using multivariate statistical techniques. Int. Soil Water Conserv. Res. 2016, 4, 284–292. [Google Scholar] [CrossRef]
  52. van Straaten, C. Regional Modeling of Water Stress Irrigation Water Requirement Meets Water Availability in the Oum Er Rbia Basin. Master’s Thesis, Utrecht University, Utrecht, The Netherlands, 2017. Available online: https://studenttheses.uu.nl/handle/20.500.12932/26915 (accessed on 9 July 2024).
  53. ABHOER (Agence du Bassin Hydraulique de l’Oum Er-Rbia). Assistance Technique pour L’intégration et L’évaluation des Risques Climatiques dans la Planification et le Développement des Ressources en eau du Bassin de l’Oum Er-Rbia–Maroc; [Rapport de synthèse]; ABHOER: Beni-Mellal, Morocco, 2017. [Google Scholar]
  54. Sherif, A.; Fadi, D. Royaume du Maroc Coût de la Dégradation des Ressources en Eau du Bassin de L’oum Er-Rbia Sustainable Water Integrated Management (SWIM)-Support Mechanism. Available online: https://www.swim-sm.eu/files/COED_MOROCCO_final.pdf (accessed on 30 April 2024).
  55. Justice, C.; Townshend, J.; Vermote, E.; Masuoka, E.; Wolfe, R.; Saleous, N.; Roy, D.; Morisette, J. An overview of MODIS Land data processing and product status. Remote Sens. Environ. 2002, 83, 3–15. [Google Scholar] [CrossRef]
  56. Wan, Z. Collection-6 MODIS Land Surface Temperature Products Users’ Guide; ICESS, University of California: Santa Barbara, CA, USA, 2013. [Google Scholar]
  57. Didan, K.; Munoz, A.B. MODIS Vegetation Index User’s Guide (MOD13 Series). Available online: https://vip.arizona.edu (accessed on 30 April 2024).
  58. Cleugh, H.A.; Leuning, R.; Mu, Q.; Running, S.W. Regional evaporation estimates from flux tower and MODIS satellite data. Remote Sens. Environ. 2007, 106, 285–304. [Google Scholar] [CrossRef]
  59. Mu, Q.; Jones, L.A.; Kimball, J.S.; McDonald, K.C.; Running, S.W. Satellite assessment of land surface evapotranspiration for the pan-Arctic domain. Water Resour. Res. 2009, 45. [Google Scholar] [CrossRef]
  60. Mu, Q.; Zhao, M.; Running, S.W. Evolution of hydrological and carbon cycles under a changing climate. Part III: Global change impacts on landscape scale evapotranspiration. Hydrol. Process. 2011, 25, 4093–4102. [Google Scholar] [CrossRef]
  61. MODIS Land Science Team. MODIS Collection 6 (C6) LAI/FPAR Product User’s Guide. Available online: http://modis.gsfc.nasa.gov/data/atbd/atbd_mod15.pdf (accessed on 30 April 2024).
  62. Hubanks, P.A.; Platnick, S.; King, M.D.; Ridgway, B. MODIS Atmosphere L3 Global Gridded Product User’s Guide & algorithm theoretical basis document (ATBD) for C6.1 products: 08_D3, 08_E3, 08_M3. Version 2020, 1, 129. [Google Scholar]
  63. Alsilibe, F.; Bene, K.; Bilal, G.; Alghafli, K.; Shi, X. Accuracy Assessment and Validation of Multi-Source CHIRPS Precipitation Estimates for Water Resource Management in the Barada Basin, Syria. Remote Sens. 2023, 15, 1778. [Google Scholar] [CrossRef]
  64. Dhanesh, Y.; Bindhu, V.M.; Senent-Aparicio, J.; Brighenti, T.M.; Ayana, E.; Smitha, P.S.; Fei, C.; Srinivasan, R. A comparative evaluation of the performance of CHIRPS and CFSR data for different climate zones using the SWAT model. Remote Sens. 2020, 12, 3088. [Google Scholar] [CrossRef]
  65. Funk, C.; Peterson, P.; Landsfeld, M.; Pedreros, D.; Verdin, J.; Shukla, S.; Husak, G.; Rowland, J.; Harrison, L.; Hoell, A.; et al. The climate hazards infrared precipitation with stations—A new environmental record for monitoring extremes. Sci. Data 2015, 2, 150066. [Google Scholar] [CrossRef] [PubMed]
  66. Rodell, M.; Houser, P.R.; Jambor, U.; Gottschalck, J.; Mitchell, K.; Meng, C.-J.; Arsenault, K.; Cosgrove, B.; Radakovich, J.; Bosilovich, M.; et al. The Global Land Data Assimilation System. Bull. Am. Meteorol. Soc. 2004, 85, 381–394. [Google Scholar] [CrossRef]
  67. Liu, Y.; Liu, Y.; Wang, W. Inter-comparison of satellite-retrieved and Global Land Data Assimilation System-simulated soil moisture datasets for global drought analysis. Remote Sens. Environ. 2019, 220, 1–18. [Google Scholar] [CrossRef]
  68. Bi, H.; Ma, J.; Zheng, W.; Zeng, J. Comparison of soil moisture in GLDAS model simulations and in situ observations over the Tibetan Plateau. J. Geophys. Res. 2016, 121, 2658–2678. [Google Scholar] [CrossRef]
  69. Sun, X.; Lai, P.; Wang, S.; Song, L.; Ma, M.; Han, X. Monitoring of Extreme Agricultural Drought of the Past 20 Years in Southwest China Using GLDAS Soil Moisture. Remote Sens. 2022, 14, 1323. [Google Scholar] [CrossRef]
  70. Sangüesa, C.; Pizarro, R.; Ibañez, A.; Pino, J.; Rivera, D.; García-Chevesich, P.; Ingram, B. Spatial and temporal analysis of rainfall concentration using the Gini index and PCI. Water 2018, 10, 112. [Google Scholar] [CrossRef]
  71. Li, C.; Zhang, H.; Gong, X.; Wei, X.; Yang, J. Precipitation trends and alteration in Wei River Basin: Implication for water resources management in the transitional zone between Plain and Loess Plateau, China. Water 2019, 11, 2407. [Google Scholar] [CrossRef]
  72. Liu, S.; Yan, D.; Wang, H.; Li, C.; Weng, B.; Qin, T. Standardized water budget index and validation in drought estimation of Haihe River Basin, North China. Adv. Meteorol. 2016, 2016, 9159532. [Google Scholar] [CrossRef]
  73. Peters, A.J.; Waltershea, E.A.; Ji, L.; Vliia, A.; Hayes, M.; Svoboda, M.D. Drought Monitoring with NDVI-Based Standardized Vegetation Index. 2002. Available online: https://www.asprs.org/wp-content/uploads/pers/2002journal/january/2002_jan_71-75.pdf (accessed on 9 July 2024).
  74. Measho, S.; Chen, B.; Trisurat, Y.; Pellikka, P.; Guo, L.; Arunyawat, S.; Tuankrua, V.; Ogbazghi, W.; Yemane, T. Spatio-temporal analysis of vegetation dynamics as a response to climate variability and drought patterns in the Semiarid Region, Eritrea. Remote Sens. 2019, 11, 724. [Google Scholar] [CrossRef]
  75. Anderson, M.C.; Zolin, C.A.; Sentelhas, P.C.; Hain, C.R.; Semmens, K.; Yilmaz, M.T.; Gao, F.; Otkin, J.A.; Tetrault, R. The Evaporative Stress Index as an indicator of agricultural drought in Brazil: An assessment based on crop yield impacts. Remote Sens. Environ. 2016, 174, 82–99. [Google Scholar] [CrossRef]
  76. Sánchez, N.; González-Zamora, Á.; Piles, M.; Martínez-Fernández, J. A new Soil Moisture Agricultural Drought Index (SMADI) integrating MODIS and SMOS products: A case of study over the Iberian Peninsula. Remote Sens. 2016, 8, 287. [Google Scholar] [CrossRef]
  77. Gonçalves, S.T.N.; Júnior, F.d.C.V.; Silveira, C.d.S.; Cid, D.A.C.; Martins, E.S.P.R.; da Costa, J.M.F. Comparative Analysis of Drought Indices in Hydrological Monitoring in Ceará’s Semi-Arid Basins, Brazil. Water 2023, 15, 1259. [Google Scholar] [CrossRef]
  78. Chai, Q.; Wang, T.; Di, C. Evaluating the impacts of environmental factors on soil moisture temporal dynamics at different time scales. J. Water Clim. Chang. 2021, 12, 420–432. [Google Scholar] [CrossRef]
  79. Zhang, L.; Cao, Q.; Liu, K. Mutation Characteristics of Precipitation Concentration Spatiotemporal Variation and Its Potential Correlation with Low-Frequency Climate Factors in the LRB Area from 1960 to 2020. Water 2023, 15, 955. [Google Scholar] [CrossRef]
  80. Jain, S.K.; Keshri, R.; Goswami, A.; Sarkar, A.; Chaudhry, A. Identification of drought-vulnerable areas using NOAA AVHRR data. Int. J. Remote Sens. 2009, 30, 2653–2668. [Google Scholar] [CrossRef]
  81. Tsiros, E.; Domenikiotis, C.; Spiliotopoulos, M.; Dalezios, N.R. Use of Noaa/Avhrr-Based Vegetation Condition Index (Vci) and Temperature Condition Index (TCI) for Drought Monitoring in Thessaly, Greece. Available online: https://www.researchgate.net/publication/236577458 (accessed on 30 April 2024).
  82. Jiao, W.; Tian, C.; Chang, Q.; Novick, K.A.; Wang, L. A new multi-sensor integrated index for drought monitoring. Agric. For. Meteorol. 2019, 268, 74–85. [Google Scholar] [CrossRef]
  83. Liu, Y.; Yue, H. The Temperature Vegetation Dryness Index (TVDI) based on bi-parabolic NDVI-Ts space and gradient-based structural similarity (GSSIM) for long-term drought assessment across Shaanxi Province, China (2000–2016). Remote Sens. 2018, 10, 959. [Google Scholar] [CrossRef]
  84. Sobhani, B.; Zengir, V.S.; Kianian, M.K. Drought monitoring in the Lake Urmia basin in Iran. Arab. J. Geosci. 2019, 12, 448. [Google Scholar] [CrossRef]
  85. Sandholt, I.; Rasmussen, K.; Andersen, J. A simple interpretation of the surface temperature/vegetation index space for assessment of surface moisture status. Remote Sens. Environ. 2002, 79, 213–224. [Google Scholar] [CrossRef]
  86. Guo, H.; Bao, A.; Liu, T.; Ndayisaba, F.; Jiang, L.; Zheng, G.; Chen, T.; De Maeyer, P. Determining variable weights for an Optimal Scaled Drought Condition Index (OSDCI): Evaluation in Central Asia. Remote Sens. Environ. 2019, 231, 111220. [Google Scholar] [CrossRef]
  87. Rhee, J.; Im, J.; Carbone, G.J. Monitoring agricultural drought for arid and humid regions using multi-sensor remote sensing data. Remote Sens. Environ. 2010, 114, 2875–2887. [Google Scholar] [CrossRef]
  88. Sun, X.; Wang, M.; Li, G.; Wang, Y. Regional-scale drought monitor using synthesized index based on remote sensing in northeast China. Open Geosci. 2020, 12, 163–173. [Google Scholar] [CrossRef]
  89. Munyaka, J.-C.B.; Chenal, J.; Mabaso, S.; Tfwala, S.S.; Mandal, A.K. Geospatial Tools and Remote Sensing Strategies for Timely Humanitarian Response: A Case Study on Drought Monitoring in Eswatini. Sustainability 2024, 16, 409. [Google Scholar] [CrossRef]
  90. Zeng, J.; Zhang, R.; Qu, Y.; Bento, V.A.; Zhou, T.; Lin, Y.; Wu, X.; Qi, J.; Shui, W.; Wang, Q. Improving the drought monitoring capability of VHI at the global scale via ensemble indices for various vegetation types from 2001 to 2018. Weather. Clim. Extrem. 2022, 35, 100412. [Google Scholar] [CrossRef]
  91. Yager, R.R. On Ordered Weighted Averaging Aggregation Operators in Multicriteria Decisionmaking. In Readings in Fuzzy Sets for Intelligent Systems; Elsevier: Amsterdam, The Netherlands, 1993; pp. 80–87. ISBN 9781483214504. [Google Scholar] [CrossRef]
  92. Yager, R. On ordered weighted averaging aggregation operators in multicriteria decisionmaking. IEEE Trans. Syst. Man Cybern. 1988, 18, 183–190. [Google Scholar] [CrossRef]
  93. Figuerola-Wischke, A.; Merigó, J.M.; Gil-Lafuente, A.M.; Boria-Reverter, J. A Bibliometric Review of the Ordered Weighted Averaging Operator. Mathematics 2024, 12, 1053. [Google Scholar] [CrossRef]
  94. Malczewski, J.; Liu, X. Local ordered weighted averaging in GIS-based multicriteria analysis. Ann. GIS 2014, 20, 117–129. [Google Scholar] [CrossRef]
  95. Jiao, W.; Zhang, L.; Chang, Q.; Fu, D.; Cen, Y.; Tong, Q. Evaluating an enhanced vegetation condition index (VCI) based on VIUPD for drought monitoring in the continental United States. Remote Sens. 2016, 8, 224. [Google Scholar] [CrossRef]
  96. Vélez-Nicolás, M.; García-López, S.; Ruiz-Ortiz, V.; Zazo, S.; Molina, J.L. Precipitation Variability and Drought Assessment Using the SPI: Application to Long-Term Series in the Strait of Gibraltar Area. Water 2022, 14, 884. [Google Scholar] [CrossRef]
  97. Elbeltagi, A.; AlThobiani, F.; Kamruzzaman, M.; Shaid, S.; Roy, D.K.; Deb, L.; Islam, M.; Kundu, P.K.; Rahman, M. Estimating the Standardized Precipitation Evapotranspiration Index Using Data-Driven Techniques: A Regional Study of Bangladesh. Water 2022, 14, 1764. [Google Scholar] [CrossRef]
  98. Souza, A.G.S.S.; Neto, A.R.; de Souza, L.L. Soil moisture-based index for agricultural drought assessment: SMADI application in Pernambuco State-Brazil. Remote Sens. Environ. 2021, 252, 112124. [Google Scholar] [CrossRef]
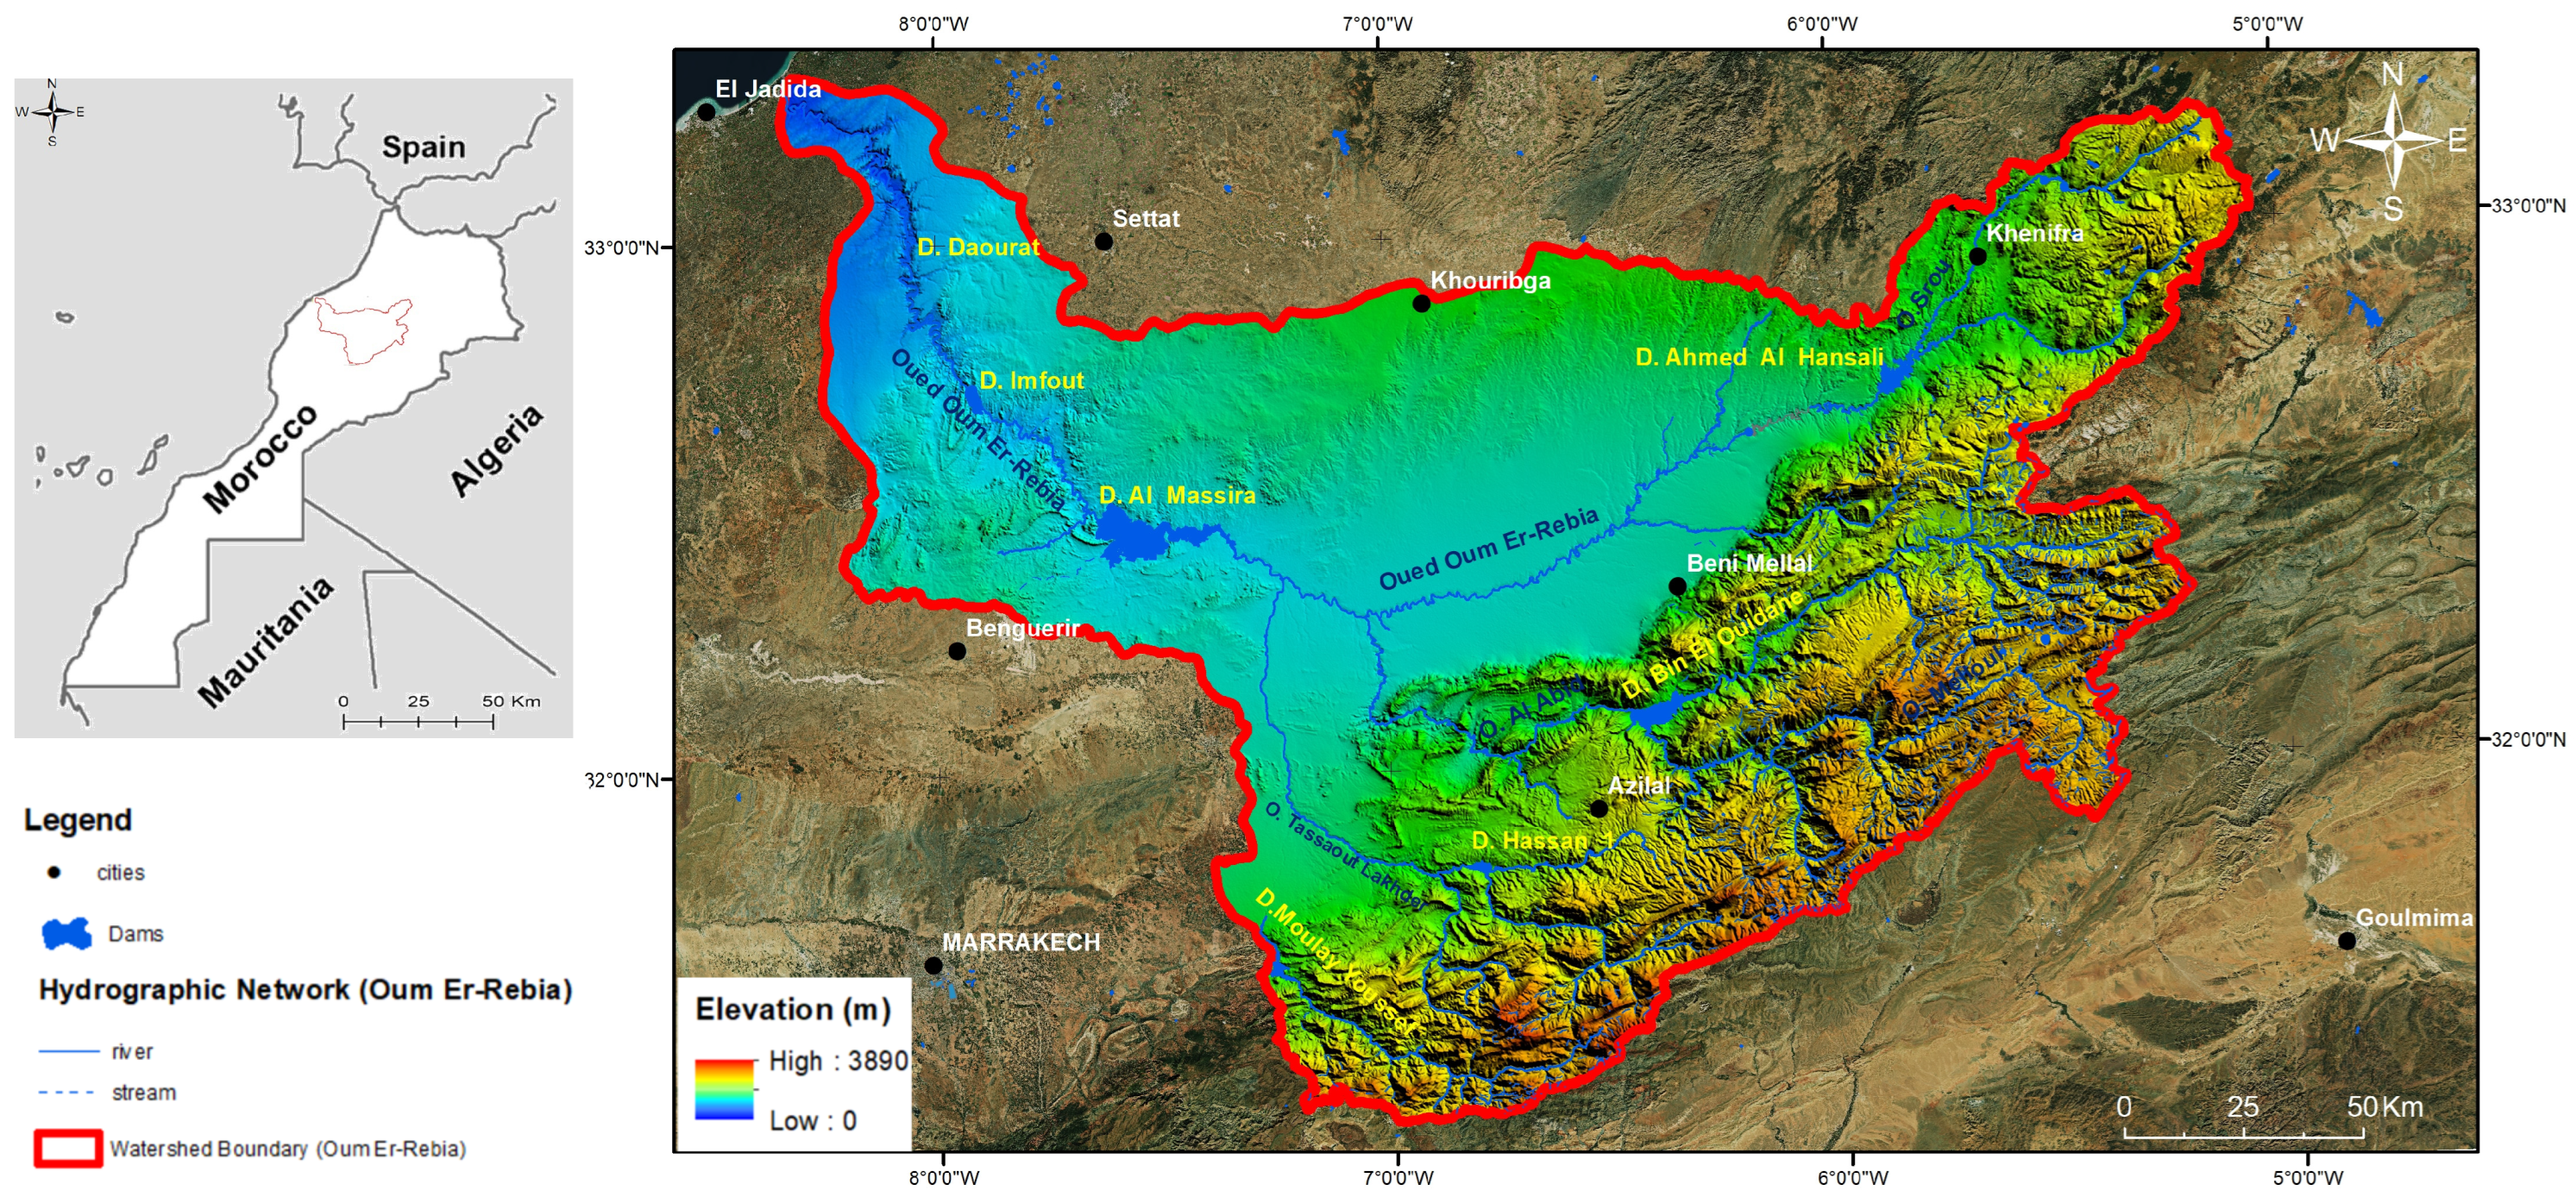
Figure 1. Geographical situation of the Oum Er-Rebia watershed.
Remotesensing 16 03398 g001
Figure 2. LST-VIUPD feature space and definition of TVDI.
Remotesensing 16 03398 g002
Figure 3. Workflow of the data processing and analysis.
Remotesensing 16 03398 g003
Figure 4. Temporal analysis of precipitation, temperature, water balance, and SPEI from 2002 to 2022.
Remotesensing 16 03398 g004
Figure 5. Time Series of Standardized Precipitation Index (SPI) at 1-Month, 3-Month, and 6-Month Scales (2002–2022).
Remotesensing 16 03398 g005
Figure 6. Time Series of Drought Indices (2002–2022): SDI, SEDI, SMCI, and WIMDI.
Remotesensing 16 03398 g006
Figure 7. The seven single-condition indices utilized as inputs for the newly developed index: (a) PCI; (b) SWI; (c) SVI; (d) ESI; (e) SMCI; (f) VCI; (g) TVDI.
Remotesensing 16 03398 g007
Figure 8. Seasonal Comparison of WIMDI with various drought types indices.
Remotesensing 16 03398 g008
Figure 9. Seasonal comparison of WIMDI with aggregated drought indices.
Remotesensing 16 03398 g009
Figure 10. Drought indices yearly mean comparison (SPI, VHI, VDSI, SDCI, and WIMDI) for the Years 2005, 2010, and 2022.
Remotesensing 16 03398 g010
Figure 11. OER watershed drought monitoring cloud interface. URL application: https://imaneserbouti.users.earthengine.app/view/wimdi-oer-watershed-morocco (accessed on 3 September 2024).
Remotesensing 16 03398 g011
Figure 12. Evolution of Irrigated Areas in Green for 2002 (a), 2010 (b), and 2022 (c).
Remotesensing 16 03398 g012
Figure 13. Evolution of built-up areas in red for 2002 (a), 2010 (b), and 2022 (c).
Remotesensing 16 03398 g013
Figure 14. Spatial correlation between drought severity map (a), built-up areas (b), and irrigated areas (c) in the OER Basin for the year 2022.
Remotesensing 16 03398 g014
Table 1. MODIS product descriptions used in this study from the website [62].
ID of Product Name DataDescriptionResolution (m)
MOD11A2MODIS LST and Emissivity 8-DayProvides 8-day composite estimates of land surface temperature (LST) and emissivity derived from thermal infrared data. 1000
MOD13Q1MODIS Vegetation Indices 16-DayThe values of the Normalized Difference Vegetation Index (NDVI) and the Enhanced Vegetation Index (EVI) during a 16-day period vary depending on the specific location and time of year. Typically, these indices range from negative values to values close to 1, with higher values indicating healthier vegetation cover.250
MOD16A2MODIS Vegetation Indices MonthlyProvides global estimates of evapotranspiration (ET) and potential evapotranspiration (PET) at an 8-day temporal resolution.500
MOD09GAMODIS daily surface reflectance Provides daily surface reflectance data, which can be used to calculate the Normalized Difference Water Index (NDWI).500 and 1000
Table 2. Overview of the aggregated drought indices applied in this study. The equation column indicates how the weights of individual drought indices were calculated.
IndexEquationReferences
SDCI S D C I i j k = 0.25 × V C I i j k + 0.25 × T C I i j k + 0.5 × P C I i j k [86,87]
VDSI V D S I i j k = 0.33 × S V I i j k + 0.33 × S W I i j k + 0.33 × E S I i j k [88]
VHI V H I i j k = 0.5 × V C I i j k + 0.5 × T C I i j k [89,90]
These three indices will be used for a comparison with the new index that we have developed in next section.
Table 3. Optimal order weights λk* for selected α parameter values with a criterion count of n = 7.
α00.10.20.30.40.50.60.70.80.91
λ100.0150.0160.0400.0410.1420.2350.2770.3000.3021
λ200.0500.0550.0910.0930.1420.2000.1930.1870.1800
λ300.0900.1000.1030.1050.1420.1800.1750.1700.1650
λ400.1300.1320.1330.1380.1420.1380.1350.1300.1290
λ500.1550.1560.1580.1590.1420.1140.1100.1050.1000
λ600.2000.210.2150.2160.1420.0920.0800.0770.0670
λ710.3550.3600.3630.3640.1420.0410.0300.0270.0250
Table 4. Correlation coefficients (r-values) between drought indices (SPIs over various time scales) and LOWAs across different α values, showing statistical significance with p-values below 0.01 in all instances.
αr-Value
SPI1SPI3SPI6
0.10.7020.7440.665
0.20.7050.7300.689
0.30.7380.7390.701
0.40.7280.7050.612
0.50.7100.7310.664
0.60.7200.7370.699
0.70.7390.7400.705
0.80.6680.6400.680
0.90.6610.6220.677
Table 5. Evaluation of the correlation coefficient (r) between WIMDI, SDCI, VDSI, VHI, and reference drought indices SPI 1-, 3-, and 6-month, SDI, SEDI, and SMCI.
Drought Indices r-Value
SPI-1SPI-3SPI-6SDISEDISMCI
VHI0.3450.3330.3020.3200.3200.320
VDSI0.3500.3700.4040.3800.3800.380
SDCI0.6500.5500.6030.5900.5900.590
WIMDI0.728 *0.805 *0.733 *0.750 *0.730 *0.710 *
The asterisk (*) indicates the highest value in each column.
Table 6. Comparison of RMSE values between WIMDI, SDCI, VDSI, VHI, and reference drought indices including 1-, 3-, and 6-month SPI, SDI, SEDI, and SMCI.
Drought Indices RMSE
SPI-1SPI-3SPI-6SDISEDISMCI
VHI0.7021.2051.4041.2201.2201.220
VDSI0.7761.3701.8541.5001.5001.500
SDCI0.7501.5501.8831.6501.6501.650
WIMDI0.698 *1.106 *1.133 *1.100 *1.090 *1.080 *
An asterisk (*) indicates the minimum value in each column.
Disclaimer/Publisher’s Note: The statements, opinions and data contained in all publications are solely those of the individual author(s) and contributor(s) and not of MDPI and/or the editor(s). MDPI and/or the editor(s) disclaim responsibility for any injury to people or property resulting from any ideas, methods, instructions or products referred to in the content.