Article

Summer Chukchi Sea Near-Surface Salinity Variability in Satellite Observations and Ocean Models

1
Department of Atmospheric and Oceanic Science, University of Maryland, College Park, MD 20742, USA
2
Laboratoire d’Océanographie Physique et Spatiale (LOPS), CNRS, IRD, IUEM, Ifremer, University Brest, 29280 Plouzané, France
3
Ocean Process Analysis Laboratory, University of New Hampshire, Durham, NH 03824, USA
*
Author to whom correspondence should be addressed.
Remote Sens. 2024, 16(18), 3397; https://doi.org/10.3390/rs16183397
Submission received: 28 June 2024 / Revised: 9 September 2024 / Accepted: 9 September 2024 / Published: 12 September 2024
(This article belongs to the Special Issue Application of Remote Sensing in Coastline Monitoring)

Abstract

:
The Chukchi Sea is an open estuary in the southwestern Arctic. Its near-surface salinities are higher than those of the surrounding open Arctic waters due to the key inflow of saltier and warmer Pacific waters through the Bering Strait. This salinity distribution may suggest that interannual changes in the Bering Strait mass transport are the sole and dominant factor shaping the salinity distribution in the downstream Chukchi Sea. Using satellite sea surface salinity (SSS) retrievals and altimetry-based estimates of the Bering Strait transport, the relationship between the Strait transport and Chukchi Sea SSS distributions is analyzed from 2010 onward, focusing on the ice-free summer to fall period. A comparison of five different satellite SSS products shows that anomalous SSS spatially averaged over the Chukchi Sea during the ice-free period is consistent among them. Observed interannual temporal change in satellite SSS is confirmed by comparison with collocated ship-based thermosalinograph transect datasets. Bering Strait transport variability is known to be driven by the local meridional wind stress and by the Pacific-to-Arctic sea level gradient (pressure head). This pressure head, in turn, is related to an Arctic Oscillation-like atmospheric mean sea level pattern over the high-latitude Arctic, which governs anomalous zonal winds over the Chukchi Sea and affects its sea level through Ekman dynamics. Satellite SSS anomalies averaged over the Chukchi Sea show a positive correlation with preceding months’ Strait transport anomalies. This correlation is confirmed using two longer (>40-year), separate ocean data assimilation models, with either higher- (0.1°) or lower-resolution (0.25°) spatial resolution. The relationship between the Strait transport and Chukchi Sea SSS anomalies is generally stronger in the low-resolution model. The area of SSS response correlated with the Strait transport is located along the northern coast of the Chukotka Peninsula in the Siberian Coastal Current and adjacent zones. The correlation between wind patterns governing Bering Strait variability and Siberian Coastal Current variability is driven by coastal sea level adjustments to changing winds, in turn driving the Strait transport. Due to the Chukotka coastline configuration, both zonal and meridional wind components contribute.

1. Introduction

The rich ecosystem and specifics of ocean circulation in the Chukchi Sea are largely determined by inflow from the Bering Sea. Pacific water inflow through the Bering Strait delivers heat, salt, and nutrients [1,2]. In an ice-free warm period, the currently accepted circulation of the Chukchi Sea, adapted from [3], suggests that Bering Sea water (BSW) and its constituents enter through the western and central parts of the Strait, while Alaskan coastal water (ACW, which is warmer/fresher than BSW), produced by Alaskan continental runoff, enters through the eastern Strait. Bering Strait inflow is on average warmer and saltier than Chukchi Sea waters. The impact of Bering Strait inflow is apparent in the downstream Chukchi Sea as it produces a relatively salty regime there, with sea surface salinities (SSS) saltier than SSS in the surrounding Arctic Ocean by a few practical salinity units (psu) (Figure 1a). Given such an apparent impact of the Strait inflow on the time mean SSS in the Chukchi Sea, the following hypothesis is to be tested: can interannual changes in SSS distributions in the Chukchi Sea be used as an indirect indicator of corresponding changes in the Bering Strait inflow?
Bering Strait volume transport depends on a combination of factors. Examination of the geostrophic balance in meridionally oriented shallow channels with zero cross-channel velocity shows [2] that Bering Strait volume transport is driven by the strength of local meridional (along-Strait) winds and by the Pacific-to-Arctic sea level difference (the so-called “pressure head”), in line with the earlier analysis of Shtokman (1957) [4]. The pressure head is a persistent large-scale Pacific-to-Arctic sea surface height (SSH) difference responsible for the annual mean northward flow in the Bering Strait [5]. The Strait transport has substantial seasonal variations. It accelerates in the summer and decelerates in the winter when seasonally strengthened northeasterly winds oppose the pressure head (e.g., [4,6]).
The pressure head is not a well-defined parameter. Using observations of ocean bottom pressure anomalies from the Gravity Recovery and Climate Experiment (GRACE) satellite mission and long-term moorings in the Bering Strait, it has been found that the pressure head variability is predominantly driven from the Arctic [7]. This is especially observed during the summer, when the Bering Strait inflow is generally the largest, and to a lesser extent during the winter, when local wind forcing dominates the total flow variability. Studies, e.g., [7,8], suggest that the summer pressure head is remotely controlled by the strength of the Arctic zonal winds (hence, the polar mean sea level atmospheric pressure (MSLP) in an Arctic Oscillation-like pattern [9]) that impact sea level in the Chukchi and East Siberian Sea through the meridional Ekman response to zonal wind variations. Using finite-element sea-ice ocean model simulations with about 24 km resolution in the Arctic, it was found that, during most of the satellite altimeter period (after 1994), winds over the western Arctic Ocean explain a larger part of the variability of Bering Strait volume transport than the winds outside the Arctic Ocean [10]. Also, wind-generated coastal Kelvin waves propagating northward along the Alaska coast and southward along the Chukotka coast (Figure 1b) may project non-local transient wind impacts on the Strait transport [11].
Due to wind tunneling over the Strait, the predominant local wind direction is along-channel (approximately meridional). In situ currents from long-term Bering Strait mooring records [12] reveal that, on monthly and longer time scales, the along-channel (northward) wind velocity acceleration in summer is in line with the current strength seasonality. Hence, satellite SSS available during the ice-free annual period corresponds to the seasonal peak of Strait transport. Its spatial distribution in the southern and central Chukchi Sea is related to the horizontal advection downstream of the Bering Strait [13]. Because the water entering the Chukchi Sea from the Bering Strait has less than a year of residence time, interannual fluctuations in the Bering Strait transport should reflect in the same-year salinity fluctuations across the Chukchi Sea [14].
Near-surface currents in the Bering–Chukchi region are discussed in several publications, including [3,15]. The source waters entering the Bering Strait from the south are transported along the Russian coast by the Anadyr Current and along the US coast by the Alaska Coastal Current (ACC, Figure 1e), as well as Bering shelf water transport in between (not shown). The downstream circulation in the Chukchi Sea is quite complex [3] and can be approximated as a northward flow that produces relatively salty interior Chukchi Sea water. This northward flow reaches the north boundary of the Chukchi Sea at the shelf break and turns clockwise, merging with an eastward shelf break flow.
In addition to the above currents transporting waters from the south into the Chukchi Sea along the Bering Strait, an opposite current that flows southeastward from the East Siberian Sea develops in some years. This cold and fresh Siberian Coastal Current (SSC, also named the East Siberian Current) flows along the northern Chukotka Peninsula [16] (Figure 1a). In the Chukchi Sea, the SSC is bounded offshore by a broad (~60 km) front separating cold, dilute Siberian coastal water from warmer, saltier Bering Sea water. The SSC is incoherent and contains energetic eddies generated by frontal (baroclinic) instabilities, which produce horizontal mixing and weaken the cross-shore density gradient along the SCC path. Eventually, the SCC converges with the northward flow from the Bering Strait, where it deflects offshore and mixes with that inflow. Examination of SSC variability in the global operational system 1/12° Mercator Océan Global Reanalysis (GLORYS12v1) [17] shows that SSC transport variations are negatively correlated with Bering Strait transport variations [18]. Although SCC transport is small (~0.1 Sv) compared to the Bering Strait transport of ~1 Sv, its diluted waters could substantially freshen the Bering Strait inflow and affect spatial patterns of salinity distributions in the near-surface Chukchi Sea [16,18].
Anomalous fresh Chukchi Sea SSS conditions periodically develop in the summer to the autumn in response to anomalous meridional shifts of the ice edge and its meltwater source. These anomalous ice conditions are produced by anomalous zonal winds over the Chukchi Sea through the related meridional Ekman transport of ice fields. In turn, these affect the southern extent of the ice edge and the late-season meltwater source. Meltwater lenses are not unusual in the Chukchi Sea [19]. Their abnormal southward spread during the September 2021 fresh Chukchi Sea conditions were accompanied by the substantial southward ice edge expansion, by far the largest in the 1981–2021 de-trended ice records [20].
Before the 2010s, regional surface salinity observations were sparse and only available from in situ sensors. In the last decade, these limited data have been augmented by about weekly panoramic SSS maps from three separate microwave L-band (1.4 GHz) satellite salinity missions [21]. Although high-latitude satellite SSS retrievals are challenging, the SSS variability, especially in high northern latitudes, is large enough to produce detectable satellite-derived SSS measurements [22,23] and to allow their evaluation/validation against collocated in situ data [24]. Using an SSS anomaly (SSSA) instead of SSS directly helps to reduce systematic biases in cold-water regions. In these coastal oceans, a combination of low instrument sensitivity to salinity in the L-band and ‘antenna land and sea-ice contamination’ factors may lead to non-negligible and seasonally varying biases in satellite SSS. Computing SSSA relative to the observed seasonal cycle helps to remove these biasing factors. It also removes the real seasonal cycle itself. Most significantly, the use of SSSA extends the applicability of satellite SSS data beyond warm SST zones to higher latitudes and closer to the coast and ice edges [25,26]. Such an approach allows for satellite-based assessment of interannual SSSA and their geographical gradients, as demonstrated by [27] in the Gulf of Maine, where winter SST is equally cold and bordering coastlines are similarly complex.
Anomalous winds have a strong impact on the thermohaline characteristics of the Chukchi Sea. There is a growing number of observations suggesting the presence of Chukchi Sea response to transient atmospheric events. In particular, anomalously warm SST caused by a rapid ocean response to the southerly winds associated with episodic atmospheric blocking over the Bering Sea [28] was observed in autumn 2018, which delayed the seasonal southward sea ice advance. Opposite conditions observed in September 2009 were caused by anomalous northerly winds over the Strait due to an abnormally deep Aleutian low and elevated Siberian high atmospheric pressure system [29].
In addition to the mostly interannual advection factors discussed above, the SSS anomaly variance in the Arctic is also affected by a gradually changing environment. With a declining sea ice cover, the ice edge meltwater source shifts northward, and there is as well an atmospheric moisture and precipitation increase because of the potential for increased evaporation over open water (e.g., [20,30]). These long-term factors are not part of our analyses and are excluded from the model data below by de-trending salinity simulations.
In this paper, we investigate the impacts of large-scale atmospheric systems and their coherent influence on the Bering Strait and main regional current transport. These relationships are examined observationally using time-limited satellite data and compared with ocean model reanalyses with ocean models at two different spatial resolutions: (1) to be comparable with satellite SSS spatial resolution (1/4°) and (2) to better capture the Bering Strait area and (sub) mesoscale activities (<0.1°). Likely, interannual variations in regional boundary currents, Bering Strait transport, and ice edge shifts are interrelated through atmospheric pressure fields via their impact on coastal and estuarine sea level anomalies caused by Ekman transport anomalies. In relation to this important oceanographic problem (Bering Strait exchanges), the role of remote sensing, especially recently available satellite SSS, is investigated as a complement to the traditional regional observing system.
Anticipating the key role that Bering Strait inflow plays in the shaping of salinity distributions in the downstream Chukchi Sea, the general methodology employed in the paper is based on examining links between lagged characteristics of the inflow and resulting salinity changes. In terms of observations, this requires spatial patterns of salinity in the Chukchi Sea that have been available since 2010 from satellite remote sensing of the sea surface salinity, e.g., [21], whilst Bering Strait inflow changes are attributed to their geostrophic component available from satellite altimetry since 1993. This examination focuses on the ice-free period, which coincides with the period of maximum Bering Strait inflow. Temporal variations of Bering Strait inflow are linked to temporal variations in major large-scale summer atmospheric pressure patterns, confirming that the primary action comes from the Arctic sector. A similar approach is applied to several data assimilation models that provide a longer perspective.

2. Materials and Methods

Satellite data: this study is based on several monthly satellite datasets. The primary dataset is global monthly satellite SSS from the Soil Moisture Active Passive (SMAP) mission (version 6.0 [31] (see also https://data.remss.com/smap/SSS/V06.0/documents/Release_V6.0.pdf, accessed on 1 August 2024)) available on a 0.25° grid since April 2015. A second satellite dataset comes from the Regional Arctic Level 3 (version 2) Soil Moisture and Ocean Salinity (SMOS) SSS retrieval data product that is available on an equidistant ~25 km polar grid and for the period from July 2010 to August 2023 produced by the French Centre Aval de Traitement des Données SMOS (CATDS) (see more information and product access on https://doi.org/10.17882/98769). This product is referred to as Arctic-SMOS. Another SMOS-based product is the SMOS de-biased version 9 SSS, which is available globally on an approximately 25 km grid (https://doi.org/10.17882/52804) and is referred to here as SMOS DB. For additional satellite SSS comparisons, two multi-satellite climate SSS analyses are also employed. The first analysis is the multi-mission Optimally Interpolated Sea Surface Salinity (OISSS) Level 4 V2.0 dataset (https://www.esr.org/data-products/oisss/, accessed on 1 August 2024) available since August 2011 on a 0.25° grid [32]. It combines AQUARIUS/SAC-D (August 2011 to June 2015) with SMAP data (April 2015 to present), with secondary use of SMOS data [21]. The two-month overlap between Aquarius and SMAP is used to merge the two satellite records, while SMOS data are used only to fill gaps in the SMAP data. The second analysis is the ESA Climate Change Initiative (CCI) SSS, which combines data from all three satellite salinity missions. The current version (v04.41) is available on a 0.25° grid and spans 2010 through October 2022 (https://climate.esa.int/en/odp/#/project/sea-surface-salinity, accessed on 1 August 2024).
For higher-latitude cold sea surface temperature regions, the accuracy of satellite salinity estimates is sometimes questioned due to the low sensitivity of observed L-band microwave emission to SSS. But if one focuses on SSS anomalies (SSSA) rather than on absolute SSS, and strong SSS variability and gradients are present, then satellite-based salinity investigations become plausible (see, e.g., [27]).
Satellite sea-surface height (SSH) data used in this study are obtained from the AVISO multi-satellite merged altimeter dataset. These data are now distributed through the Copernicus Marine Environment Monitoring Service (http://marine.copernicus.eu, accessed on 1 August 2024).
Atmospheric reanalysis data: atmospheric conditions over the studied region are characterized using the monthly surface data on a 0.75° grid from the ERA5. This is the fifth-generation ECMWF atmospheric reanalysis of the global climate covering the period from January 1940 to the present [33]. We rely on atmospheric reanalysis data rather than satellite scatterometer wind data to employ the whole spatial coverage, including ice-covered polar areas.
In situ data: satellite SSS data are compared with several examples of regional thermosalinograph (TSG) ship transect data. The majority of the TSG data were obtained on request from the Japan Agency for Marine-Earth Science and Technology (JAMSTEC) (https://www.jamstec.go.jp/e/database/, accessed on 1 January 2024). These TSG data were taken on board the R/V Mirai in late summer to early autumn from 2010 to 2023. Data are not available from 2011. Also, 2012 Mirai TSG data were disregarded due to frequent TSG water rate volume fluctuations and the substantial presence of unrealistically low salinity measurements with SSS < 25 psu. These TSG data are augmented by Chinese Arctic and Antarctic Administration Arctic Expedition (CHINARE) TSG data collected during the CHINARE 2106, -18, and -19 Arctic cruises (https://doi.org/10.18739/A28C9R506, https://doi.org/10.18739/A24M91B79, and https://doi.org/10.25921/6qke-ks71). The above TSG data are augmented by September–October 2011 and 2012 TSG data taken from R/V Healy (obtained from the SAMOS archive at https://ftp.coaps.fsu.edu/samos_pub/data/research/, accessed on 1 August 2024).
Model data: given that satellite SSS observations have been available only since 2010, this paper also extends the period of investigation by using the new regional Arctic Ocean/sea ice reanalysis (RARE) model data collected over a subpolar/polar region north of 45°N [34]. The ocean/sea ice model uses GFDL MOM5/SIS1 numerics. Sequential data assimilation constrains temperature and salinity using World Ocean Database profiles as well as in situ and satellite SST and PIOMAS sea ice thickness estimates. The result, employed here, is the 42-year (1980–2021) RARE1.15.2 ocean reanalysis with resolution varying between 2 and 8 km horizontally (generally with higher resolution toward the north) and 1–10 m vertically in the upper 100 m. In particular, the Bering Strait area has about a 4.6 km horizontal resolution. To check the impact of ocean model resolution, RARE1.15.2 analysis is compared to a coarser-resolution (nominal 0.25°) SODA3.4.2 reanalysis [35], which uses the same modeling and data assimilation system and similar wind forcing based on the ERA-Interim atmospheric reanalysis. These model runs are hereafter referred to as RARE1 and SODA3 (see https://www.soda.umd.edu/ (accessed on 1 August 2024) for a brief description and data access).
The approach utilized in this paper is based on a synergy of observation and model data. A similar approach has been previously applied to the Gulf of Maine [36]. This approach could be considered as a simplified version of the integrated approach in oceanography more closely discussed in, e.g., [37].
For each month, the anomaly of any variable is calculated relative to this variable calendar mean. The characterization of salinity variability in the Chukchi Sea is focused on calendar September and over the Chukchi Sea domain (Figure 1c). September Chukchi Sea salinity anomalies reflect regional salinity conditions during the maximum annual sea ice retreat. The Chukchi Sea SSSA values are analyzed along with the preceding May–August characteristics of Bering Strait volume transport and atmospheric fields. These ‘forcing’ terms are averaged from May to August, the annual period starting from the Chukchi Sea re-stratification in May, e.g., [14], and preceding the ice coverage minimum in September.

3. Results

3.1. Satellite SSS Validation

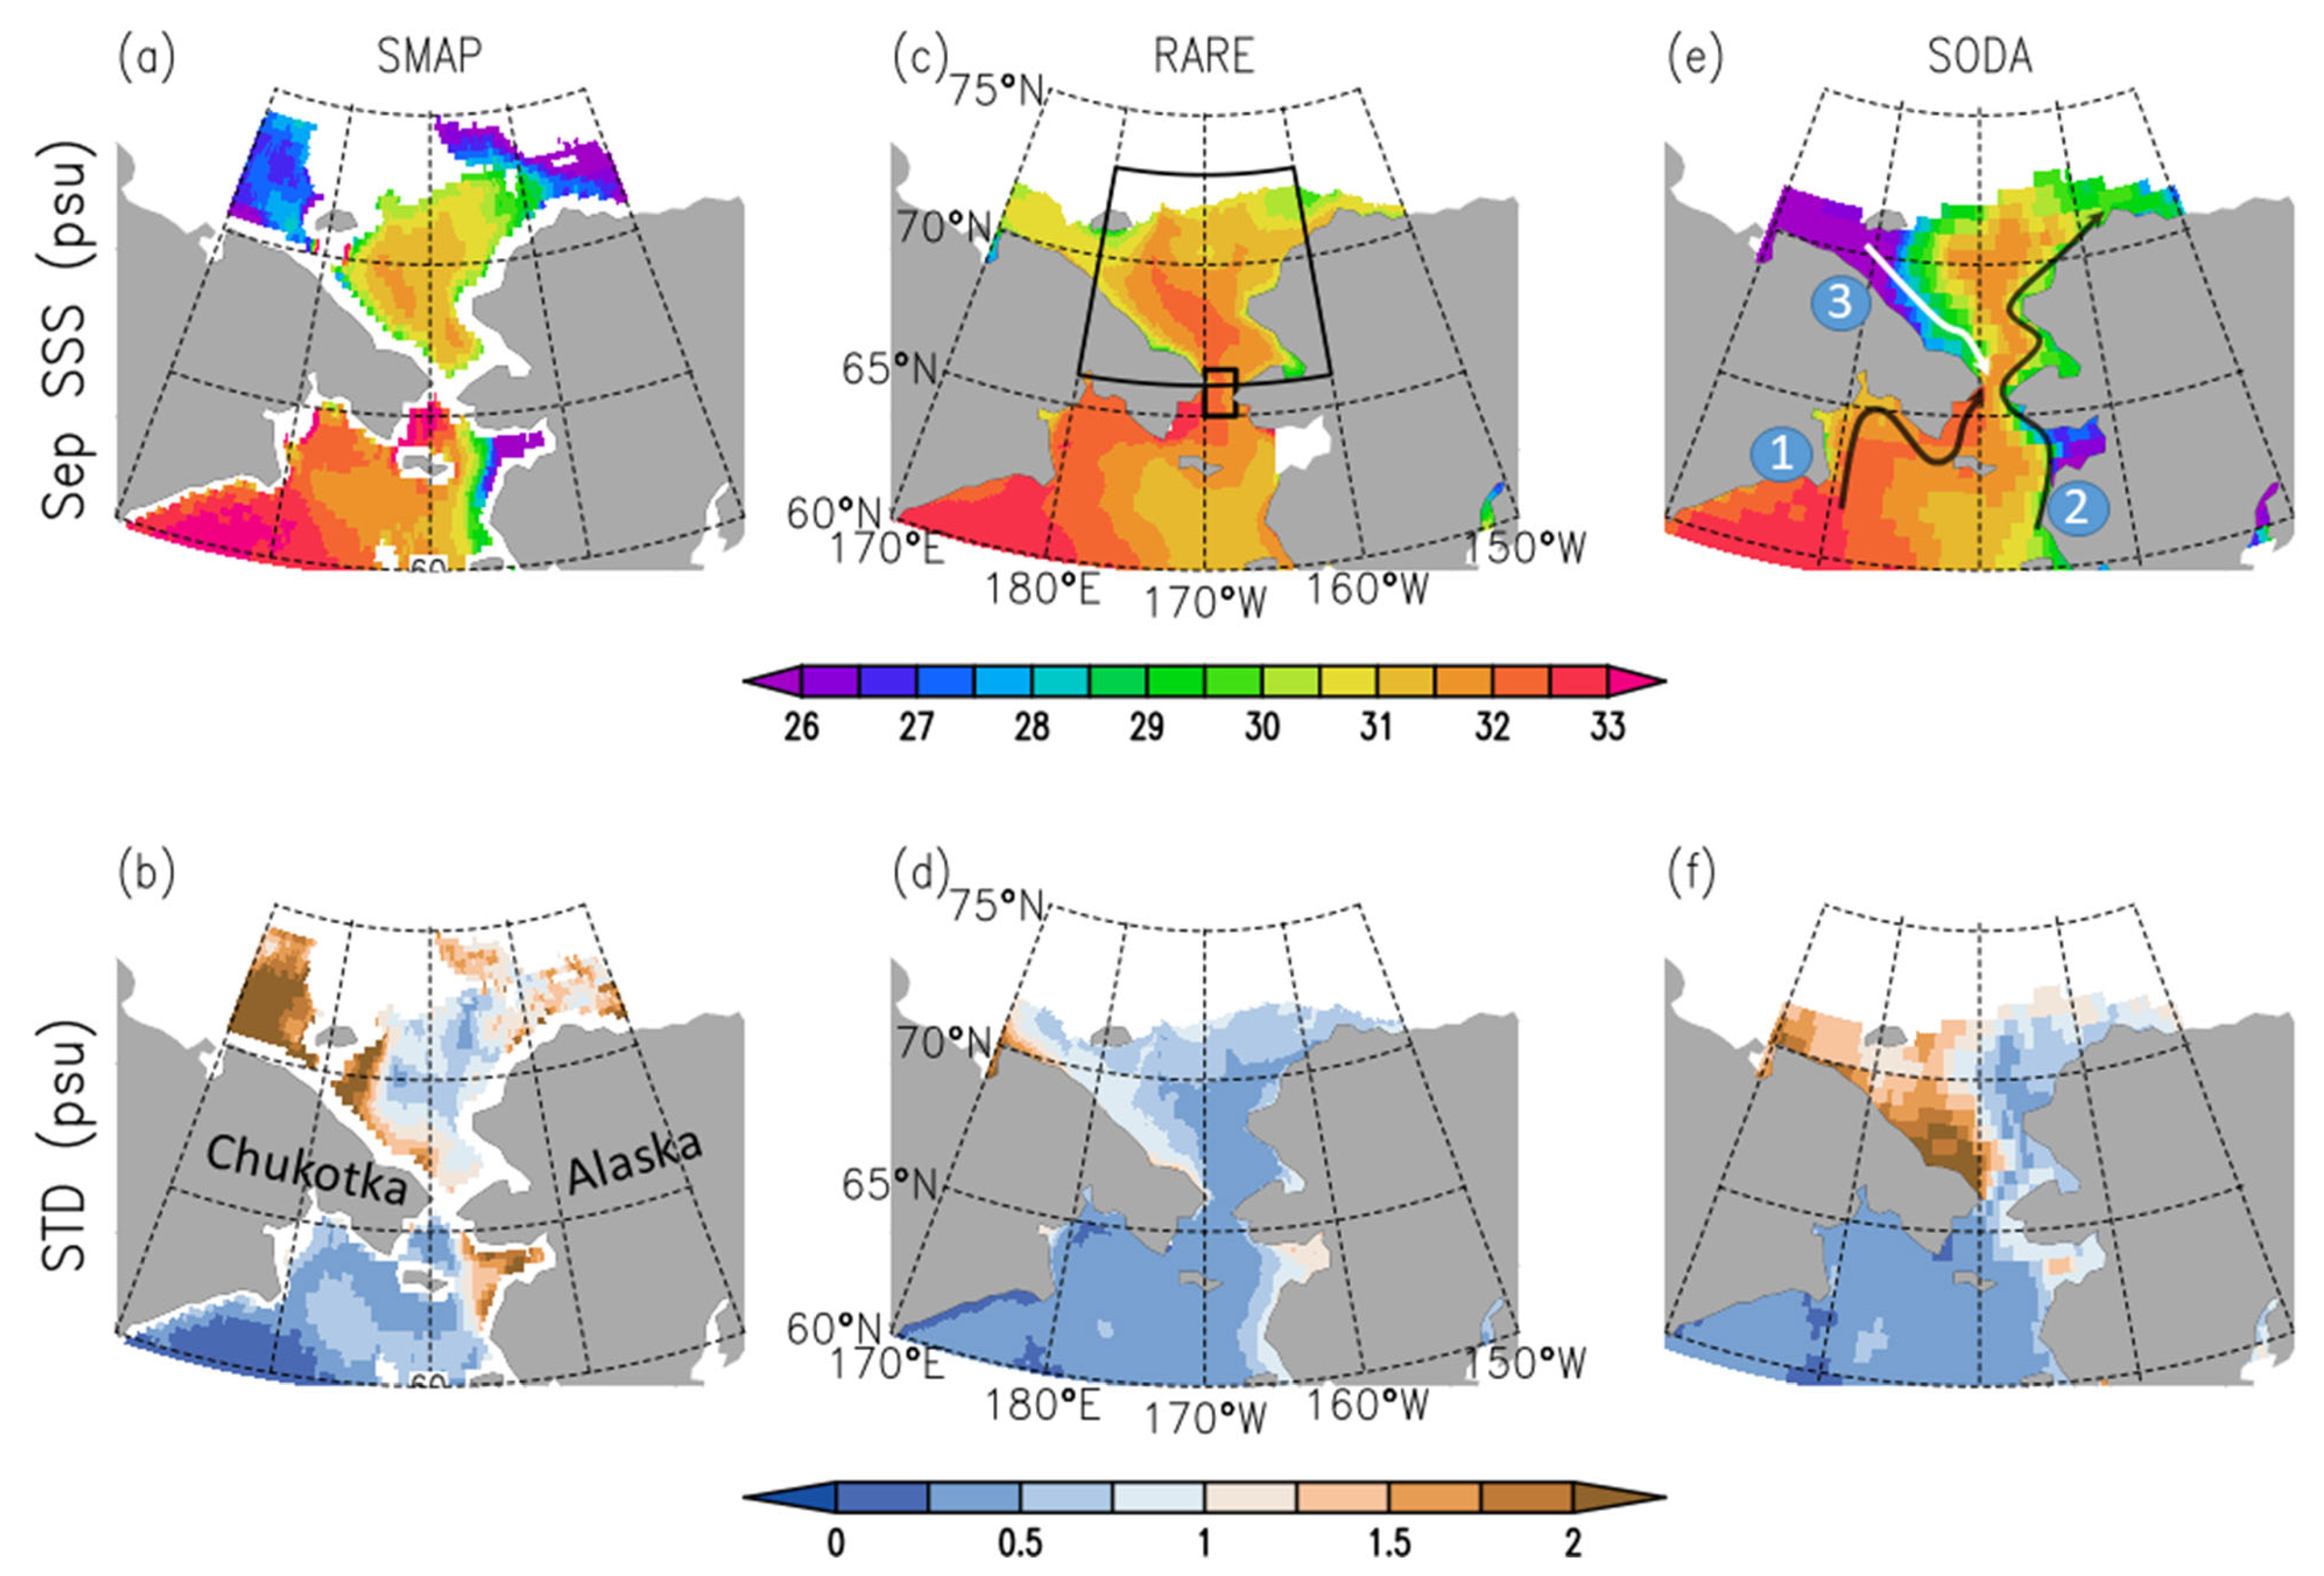
The accuracy of satellite SSS in high-latitude cold seas is reduced in comparison to in the mid-latitude and tropical waters [21], mainly because of reduced brightness temperature (Tb) sensitivity to SSS but also because of Tb contamination at land and sea ice/open water transitions. Fortunately, in distinction from the South Ocean, the SSS variability in the Arctic is sufficiently strong (~1 psu, e.g., [22]) to be detected from space. SSS values in the Chukchi Sea (Figure 1a) show a distinct contrast with the surrounding ice-free Arctic where SSS is fresher by at least a few psu. This SSS distribution indicates a clear connection with the salty inflow of Pacific summer waters (BSW, in particular) that maintains a relatively salty regime in this marginal sea. Bering Strait inflow carries not only salty BSW along the western side of the Strait but also fresh ACW along the eastern side of the Strait. Its northward progression in the ACC (Figure 1e) is reflected in somewhat fresher SSS along the Alaska coast (fresher than in the internal Chukchi Sea, Figure 1a). In SMAP SSS climatology, the SSS is also relatively fresh along the Chukchi Peninsula coast (also termed Chukotka). The latter intrusion of fresh coastal water is related to the SCC (Figure 1e), which carries fresh/cold water from Siberian coastal areas west of the Chukchi Sea [16].
SMAP observations also allow a mapping of SSS variability (Figure 1b), where it is clear that SSS variability in the southern Chukchi Sea is higher than south of the Bering Strait in the northern Bering Sea. In the southern Chukchi Sea, the standard deviation (STD) of September SSS reaches ~1 psu (Figure 1b), a level readily detected using satellites. As noted in [18], the strongest SSS variability is located along the Chukotka, where it is related to the lateral frontal mixing in the SCC [16].
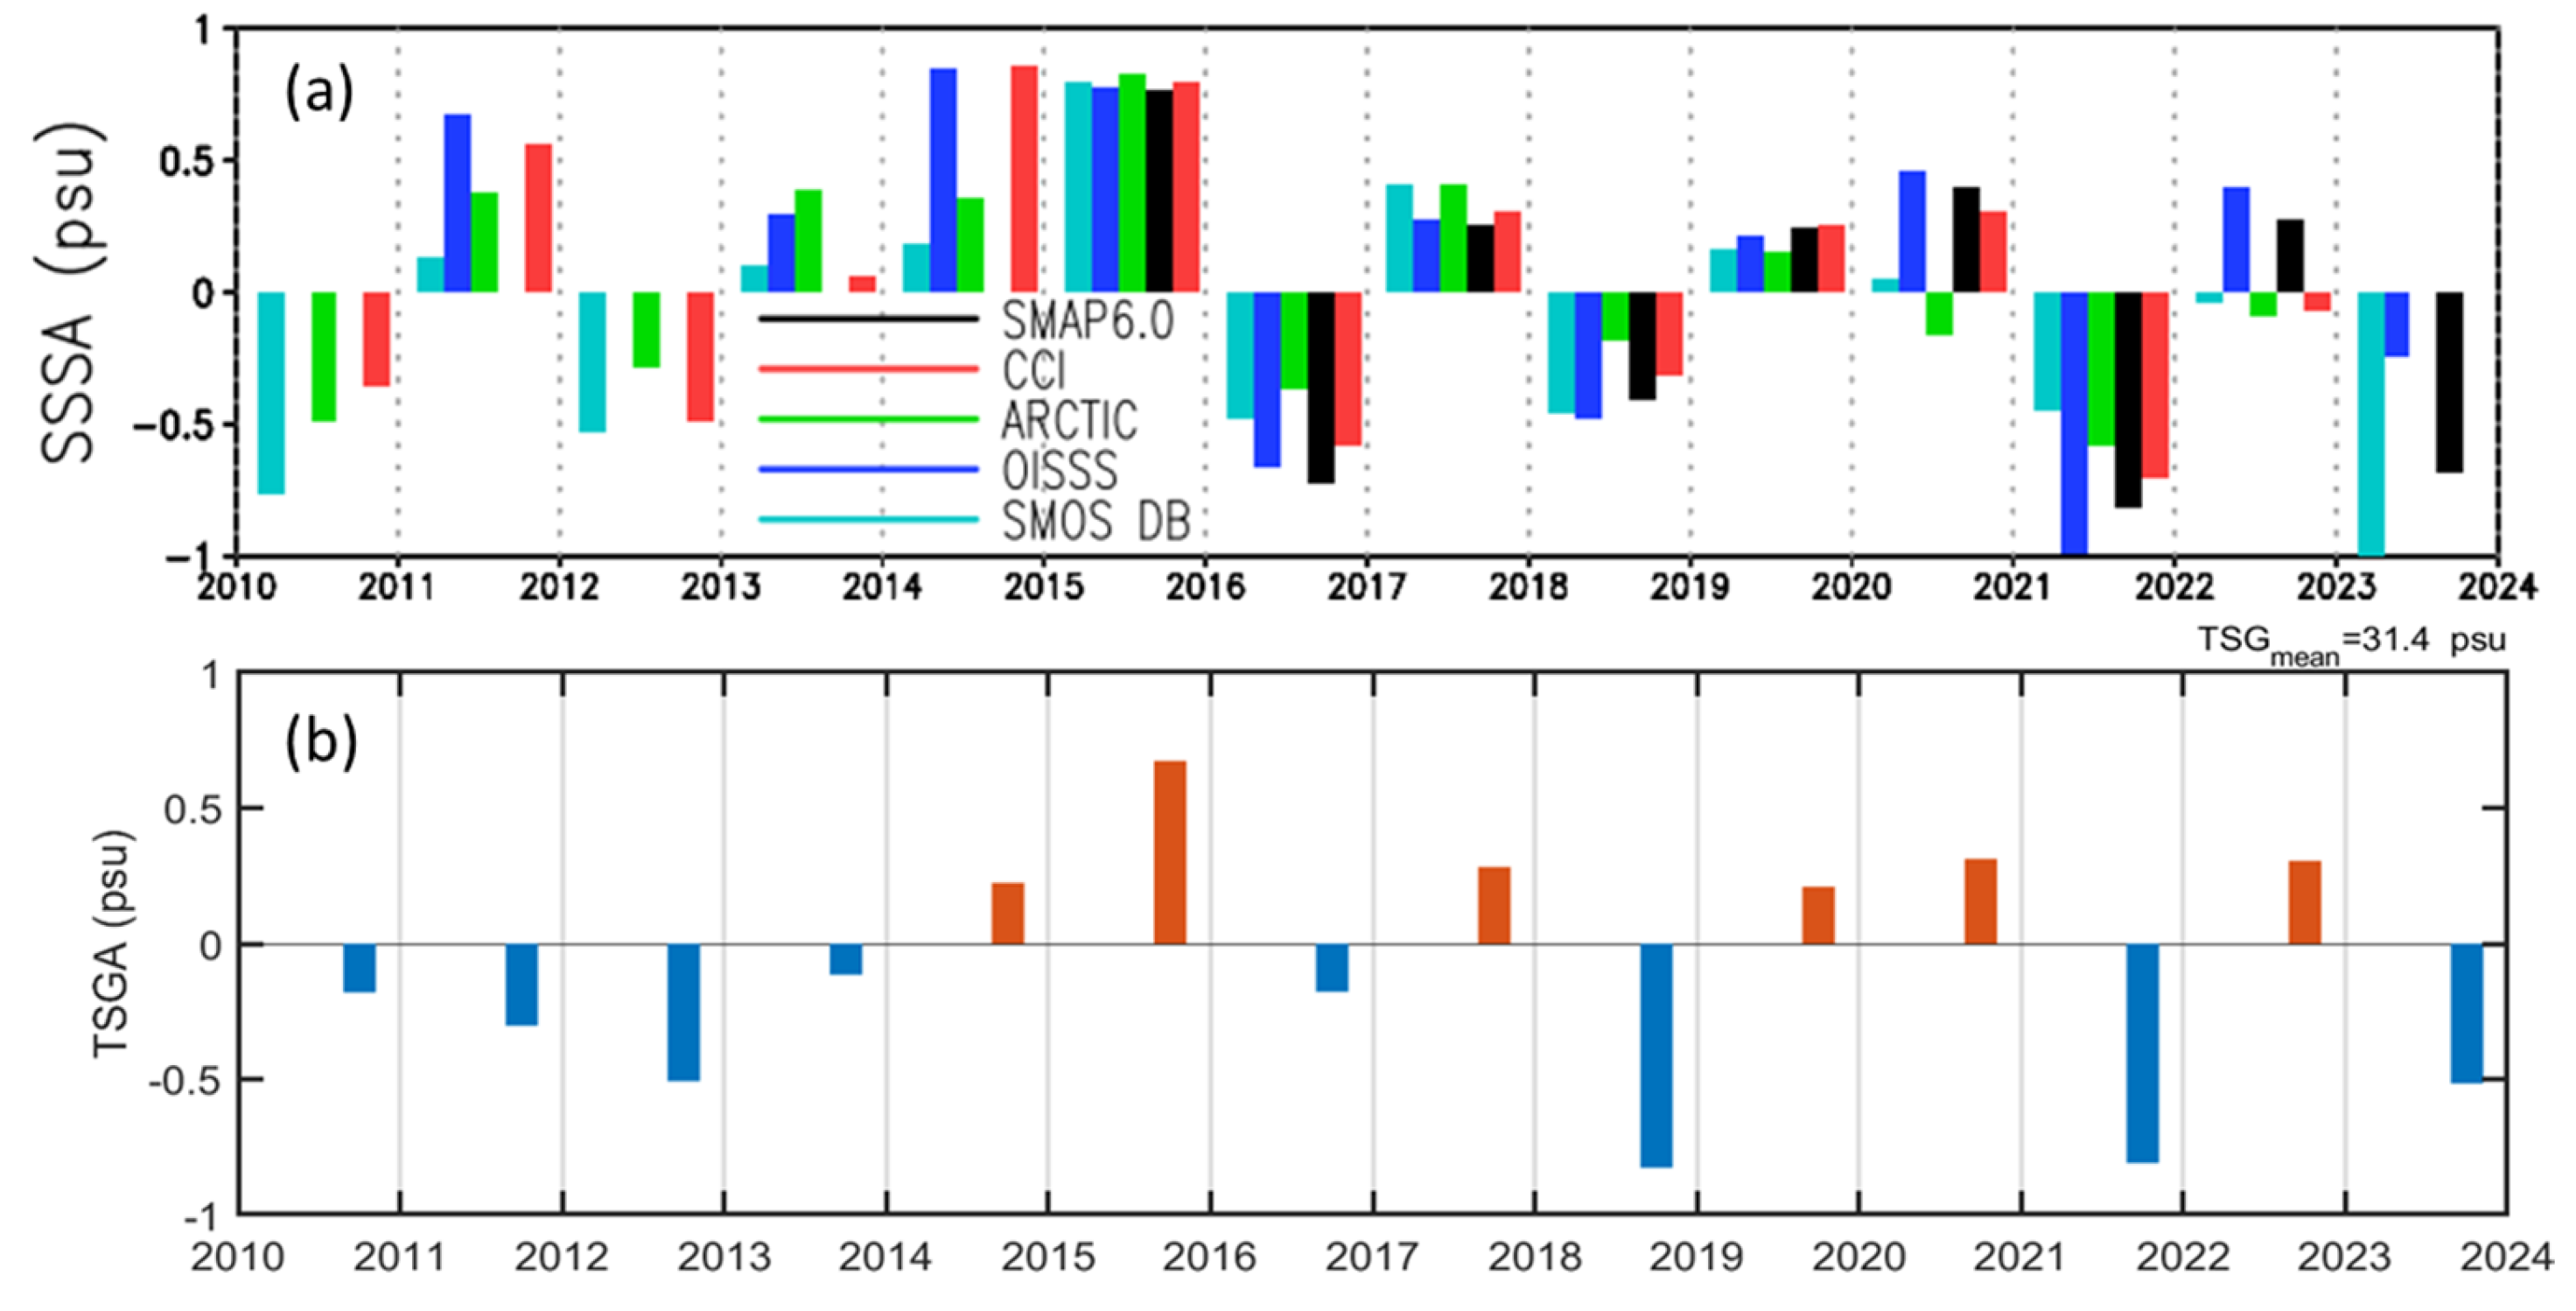
Anomalous SSS spatially averaged over the Chukchi Sea-wide box (Figure 1c) reveals generally similar temporal variations among the five satellite products during the ice-free September–October timeframe (Figure 2a). This resemblance highlights the benefits of utilizing SSSA rather than SSS. Although not illustrated, the difference between the corresponding absolute SSS levels is more significant. Over the majority of satellite SSS years since 2010, all products had the same SSSA sign. The strongest salty anomalies were observed in 2014–2015, while the freshest conditions were present in 2016 and 2021. The 2021 fresh event in the Chukchi Sea was associated with an abnormally strong southward shift of the ice edge and its associated meltwater source in summer and early autumn that year [20]. Other year conditions will be examined in Section 3.2.
In addition to the general consistency among SSS anomalies derived from different satellite products, the strongest inter-product scatter is observed in 2022, when SMAP-based and SMOS-based SSS anomalies have opposite signs. Further insights into the origins of such scatter may be inferred from comparisons with collocated in situ data. The five satellite SSSA products demonstrate general consistency in comparison with ship-based thermosalinograph transects (TSG) taken in different years in September–October. In particular, the positive sign of the SMAP and OISSS salinity anomalies coincides with that of TSG data in 2022, whereas CCI and Arctic-SMOS salinity anomalies (which rely more heavily on SMOS data) show weak negative SSSA in 2022. Nonetheless, in 2011 and 2013, all satellite products’ SSSA signs differed from TSG data. In part, such occasional disconnects are expected given the differences in spatial statistics between panoramic satellite data and along-track TSG data, as well as in the averaging domains.
Overall, the general consistency of satellite SSS products and their appropriate comparison with in situ salinity data leads us to conclude that the existing satellite SSS products can be used to study the regional salinity variability in the Chukchi Sea and adjacent areas.

3.2. Chukchi Sea SSS Variability from Satellite Data

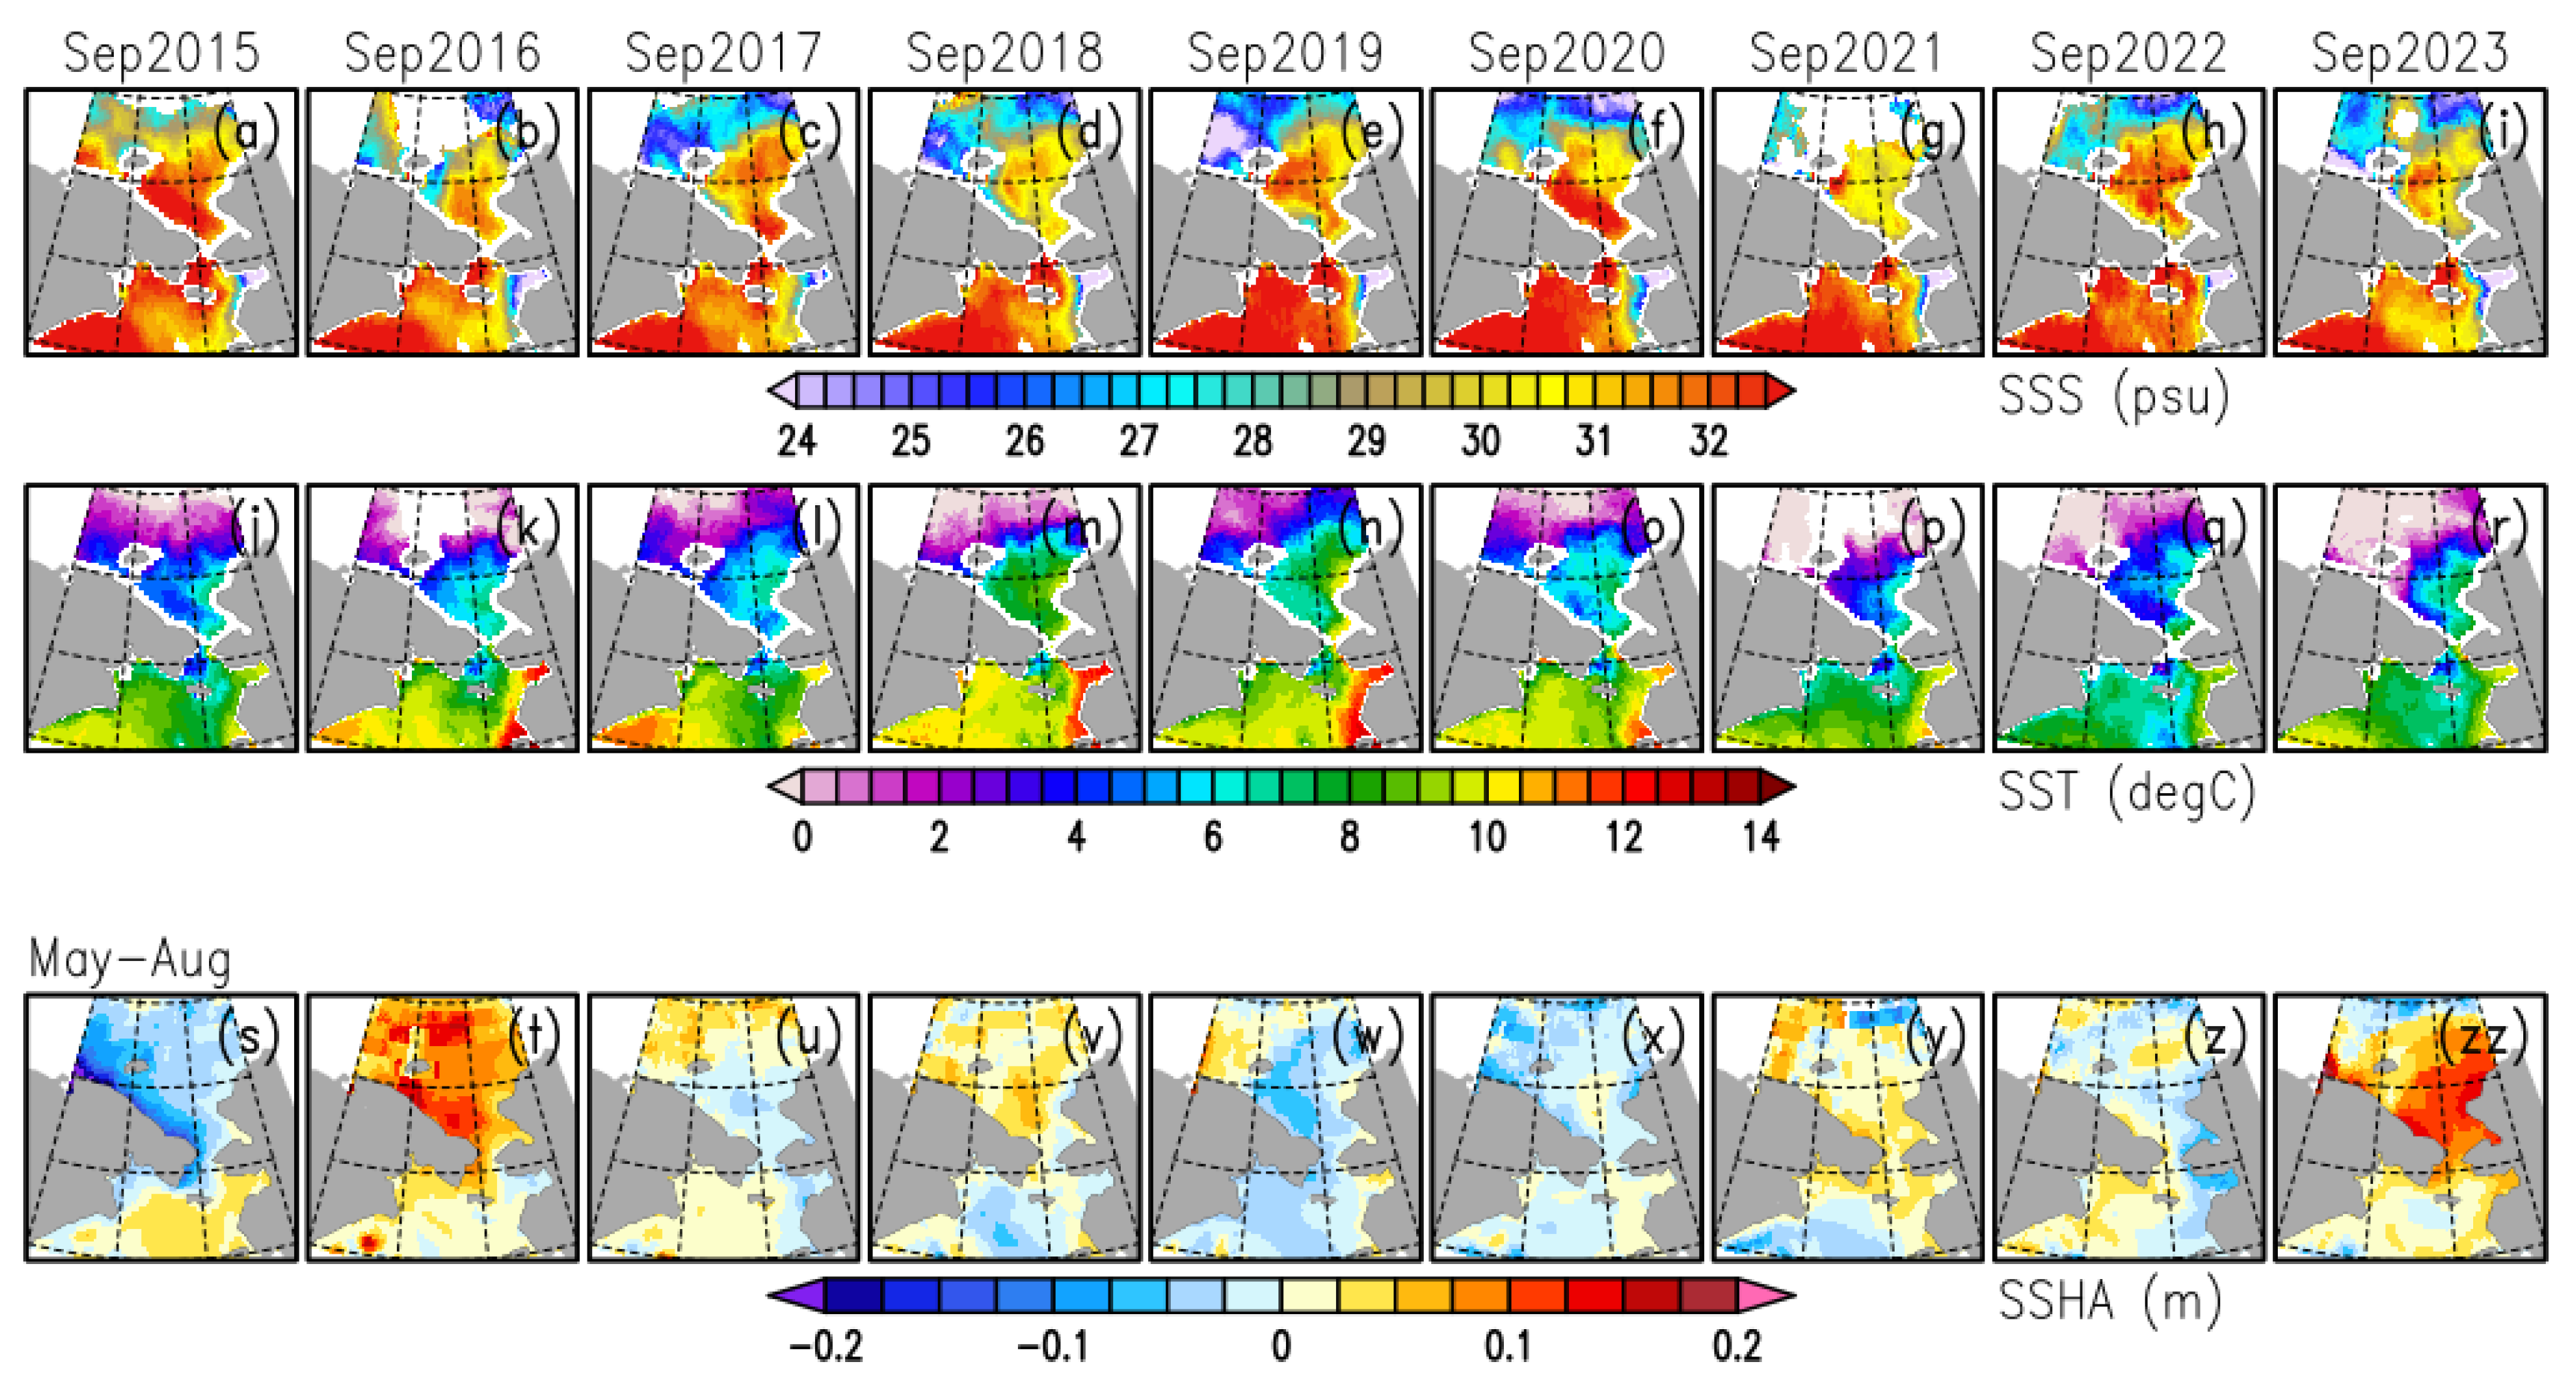
Chukchi Sea near-surface salinity is characterized using SMAP SSS data that have the highest regional accuracy in the Arctic [22]. The downside of this choice is the shorter time record that starts only in April 2015. Figure 3 illustrates September SSS and SST along with the preceding (May–August) SSH data. This altimeter-based measure is provided to illustrate the pressure head variations [7]. Figure 3 (top and middle rows) illustrates interannual changes of SSS and SST in September. Notice that for the same calendar month, the year-to-year changes of SSS and SST are equal to the year-to-year changes in SSS and SST anomalies. However, showing SSS and SST allows for easier visual focus on changes in the relatively salty and warm Chukchi Sea. Using visual inspection, no clear relationship between changes in SSS and SST is apparent. This suggests different drivers for the two. While SSTA is primarily driven by air–sea interactions, the impact of advection is stronger for SSSA (see, e.g., [38]). In contrast, there is a lagged relationship between preceding SSHA and resulting SSSA in the Chukchi Sea (Figure 3, top and bottom rows). First, notice that the positive (negative) SSH anomaly in the Chukchi Sea decreases (increases) the time mean pressure head (Pacific-to-Arctic sea level difference) and thus Bering Strait transport, respectively [4]. Assuming that the transport is mainly associated with salty BSW inflow (which may be not always the case), the preceding SSHA and the resulting SSSA should be negatively correlated in the Chukchi Sea. The presence of such a negative correlation is apparent in 2015 (Figure 3a,s), 2016 (Figure 3b,f), and 2023 (Figure 3i,zz). Less apparently, an increased pressure head leads to saltier conditions in 2017 and 2019 (Figure 3c,u,e,w), while a decreased pressure head leads to fresher conditions in 2018 (Figure 3d,v).
The remaining three years of SMAP records (2020–2022) do not follow the negative SSHA/SSSA correlation. In 2020, a salty SSSA in the southwestern Chukchi Sea developed during almost zero SSHA (Figure 3f,x). A similarly weak SSHA pattern (with a minor gradient between the northern Bering Sea and southern Chukchi Sea) corresponds to the 2021 Chukchi Sea record freshening (Figure 3g,y). As noted above, the 2021 fresh event in the Chukchi Sea was associated with impacts from the north and related to an abnormally strong southward shift of the ice edge and its associated meltwater source [20]. Finally, a deviation from the negative SSHA/SSSA correlation is also observed in 2022 (Figure 3h,z). A closer inspection of SSHA in Figure 3z suggests that the deviation may be a consequence of the negative SSHA along the Alaska coast, which is indicative of the ACC attenuation and results in less fresh ACW transported into the southern Chukchi Sea and horizontally mixed there.
The above examples illustrate that variations in the pressure head are not the only factor defining variations in the Bering Strait transport, with variations of meridional winds over the Strait being another contributing factor not included in Figure 3. Also, the 2022 example shows that Strait transport variations do not always reflect only variations of salty BSW transport along the Chukotka but also variations of fresh ACW transport along the Alaskan coast. These two components have opposite effects on variations of salinity transport in the Bering Strait.
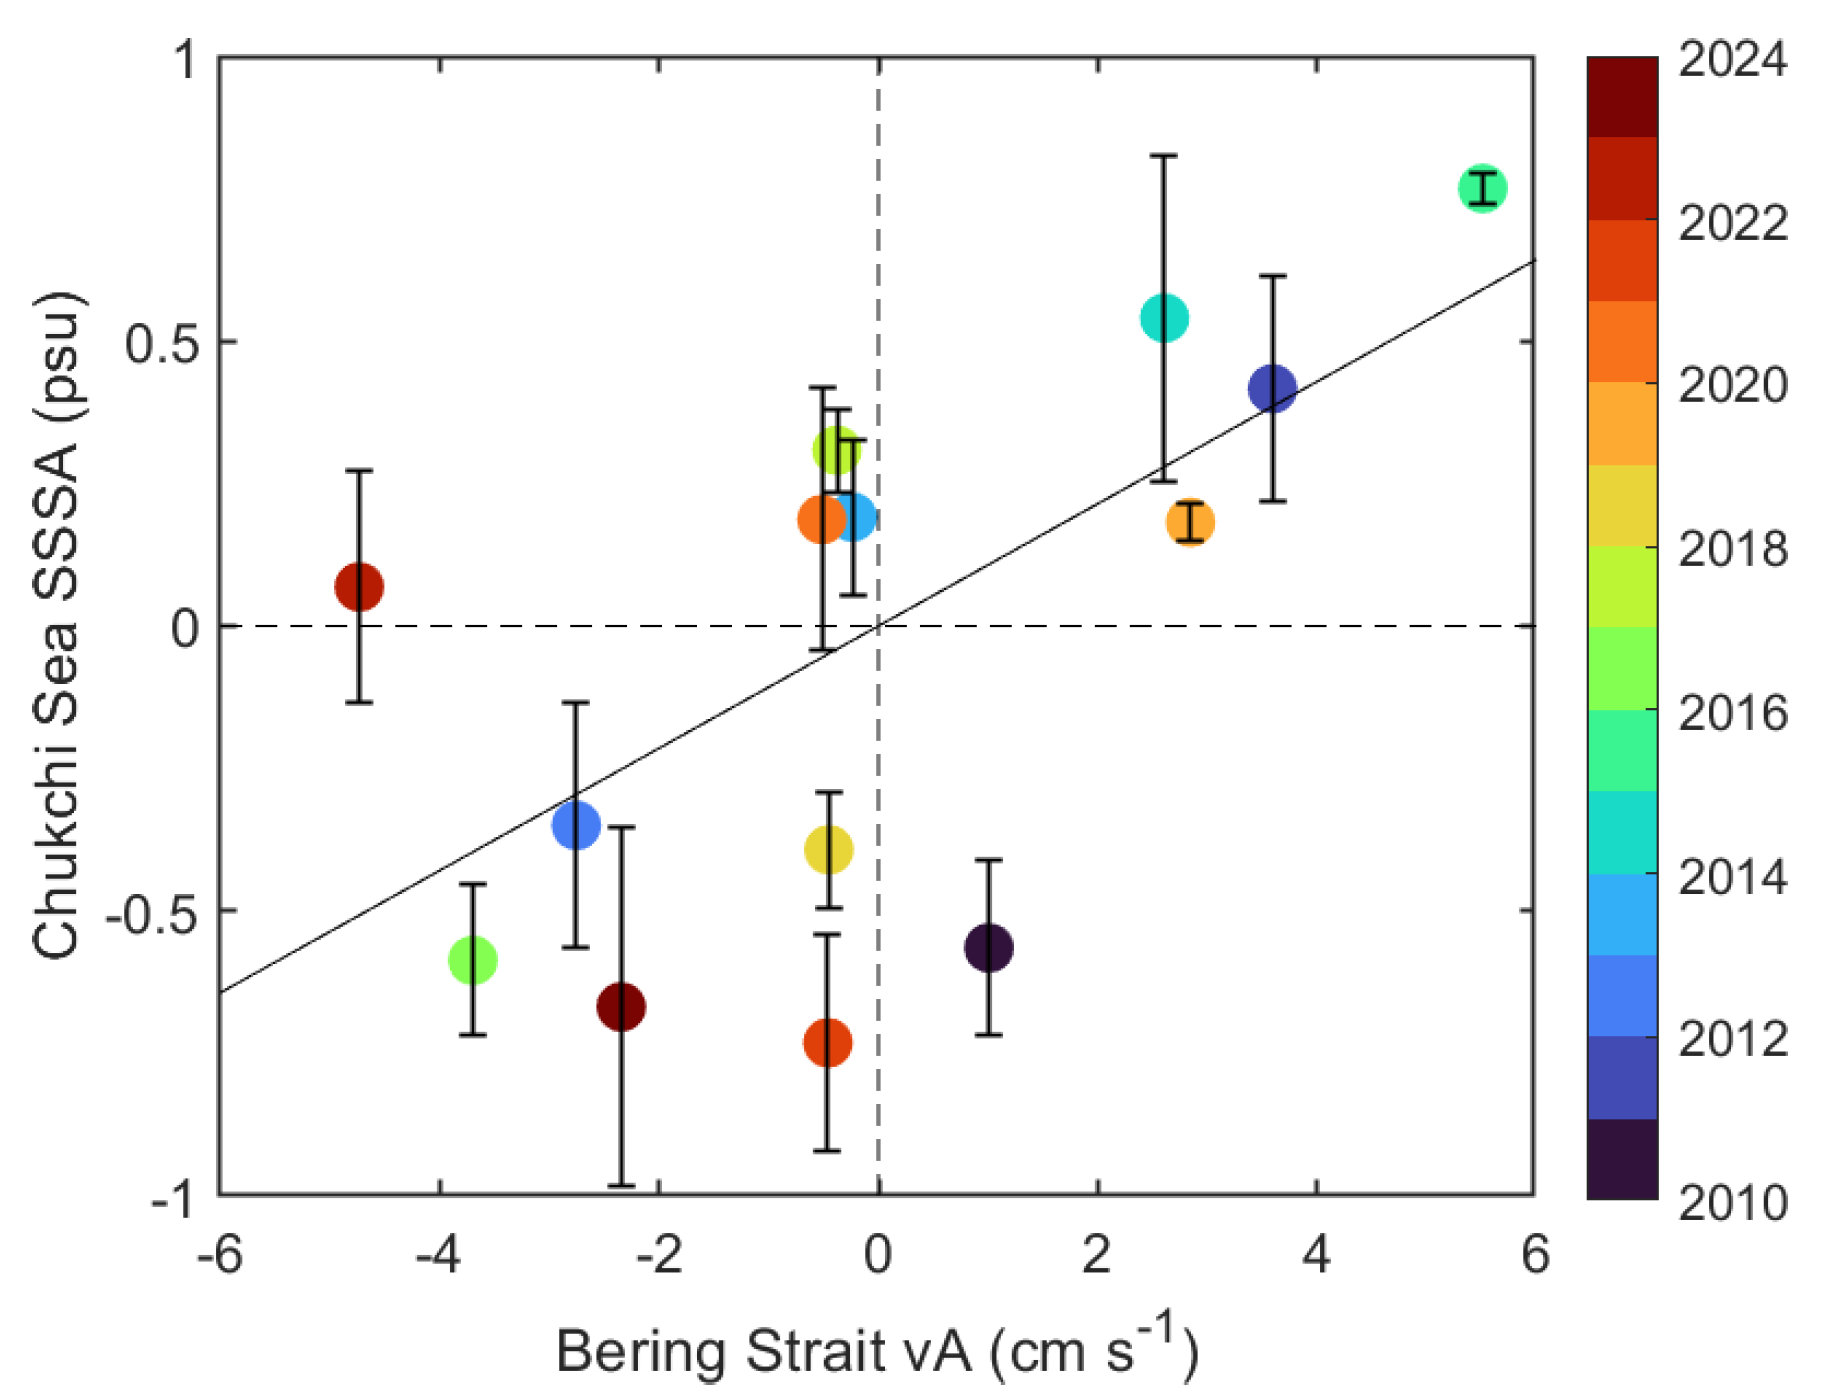
Such a complex combination of factors governing Bering Strait impacts on downstream SSS in the Chukchi Sea raises a question about if the two variables are interrelated at all. An ensemble mean of SSSA from all available satellite products for a given year is used in Figure 4 to explore the relationship between the September Chukchi Sea SSSA and the preceding May–August Bering Strait geostrophic velocity anomalies ( v A ). Notice that the number of different satellite datasets ( 5 ) varies by year (Figure 2a).
The relationship between SSSA and v A is noisy (Figure 4). The linear regression between v A and Chukchi Sea-wide SSSA explains about 40% of SSSA variance. Although it is statistically significant at the 95% level (the confidence interval of the regression coefficient does not include zero), the large scatter of data points indicates that the volume transport anomaly reflected by v A may have a complex relationship with the salinity transport anomaly due to changing BSW and ACW partitioning. Also, Ekman transport from the north, including the late summer meltwater transport, could factor in. Regardless of all these complicating factors, the generally positive correlation between SSSA and geostrophic v A is present in Figure 4. The scatter of data points is larger for fresh SSSA in comparison with salty SSSA, which may be attributed to highly variable meltwater lenses present during fresh SSSA conditions, as studied in, e.g., [19]. Also, some data scatter may be attributed to using the geostrophic v A from altimeter data instead of the total v A . The relationship between geostrophic and total velocity anomalies is illustrated in Appendix A using the RARE1 model simulations. This comparison shows that the two are highly correlated, but the geostrophic v A accounts only for about 63% of the total v A .

3.3. Atmospheric Fields Driving Bering Strait Variability

Bering Strait volume transport is driven by the strength of local meridional (along Strait) winds and by the Pacific-to-Arctic sea level difference (“pressure head”) [2,4]. Although the relationship between meridional winds over the Strait and atmospheric pressure fields is almost apparent, the relationship between the pressure head and large-scale atmospheric fields is less obvious. Studies, e.g., [7,8], suggest that the summer pressure head is remotely controlled by the strength of the Arctic zonal winds (hence, the polar mean sea level atmospheric pressure (MSLP)). The present analysis generally confirms the above relationship. We start with a time series of SSH variability in the Chukchi–Bering Sea sector.

3.3.1. Leading Mode of Regional SSH Variability

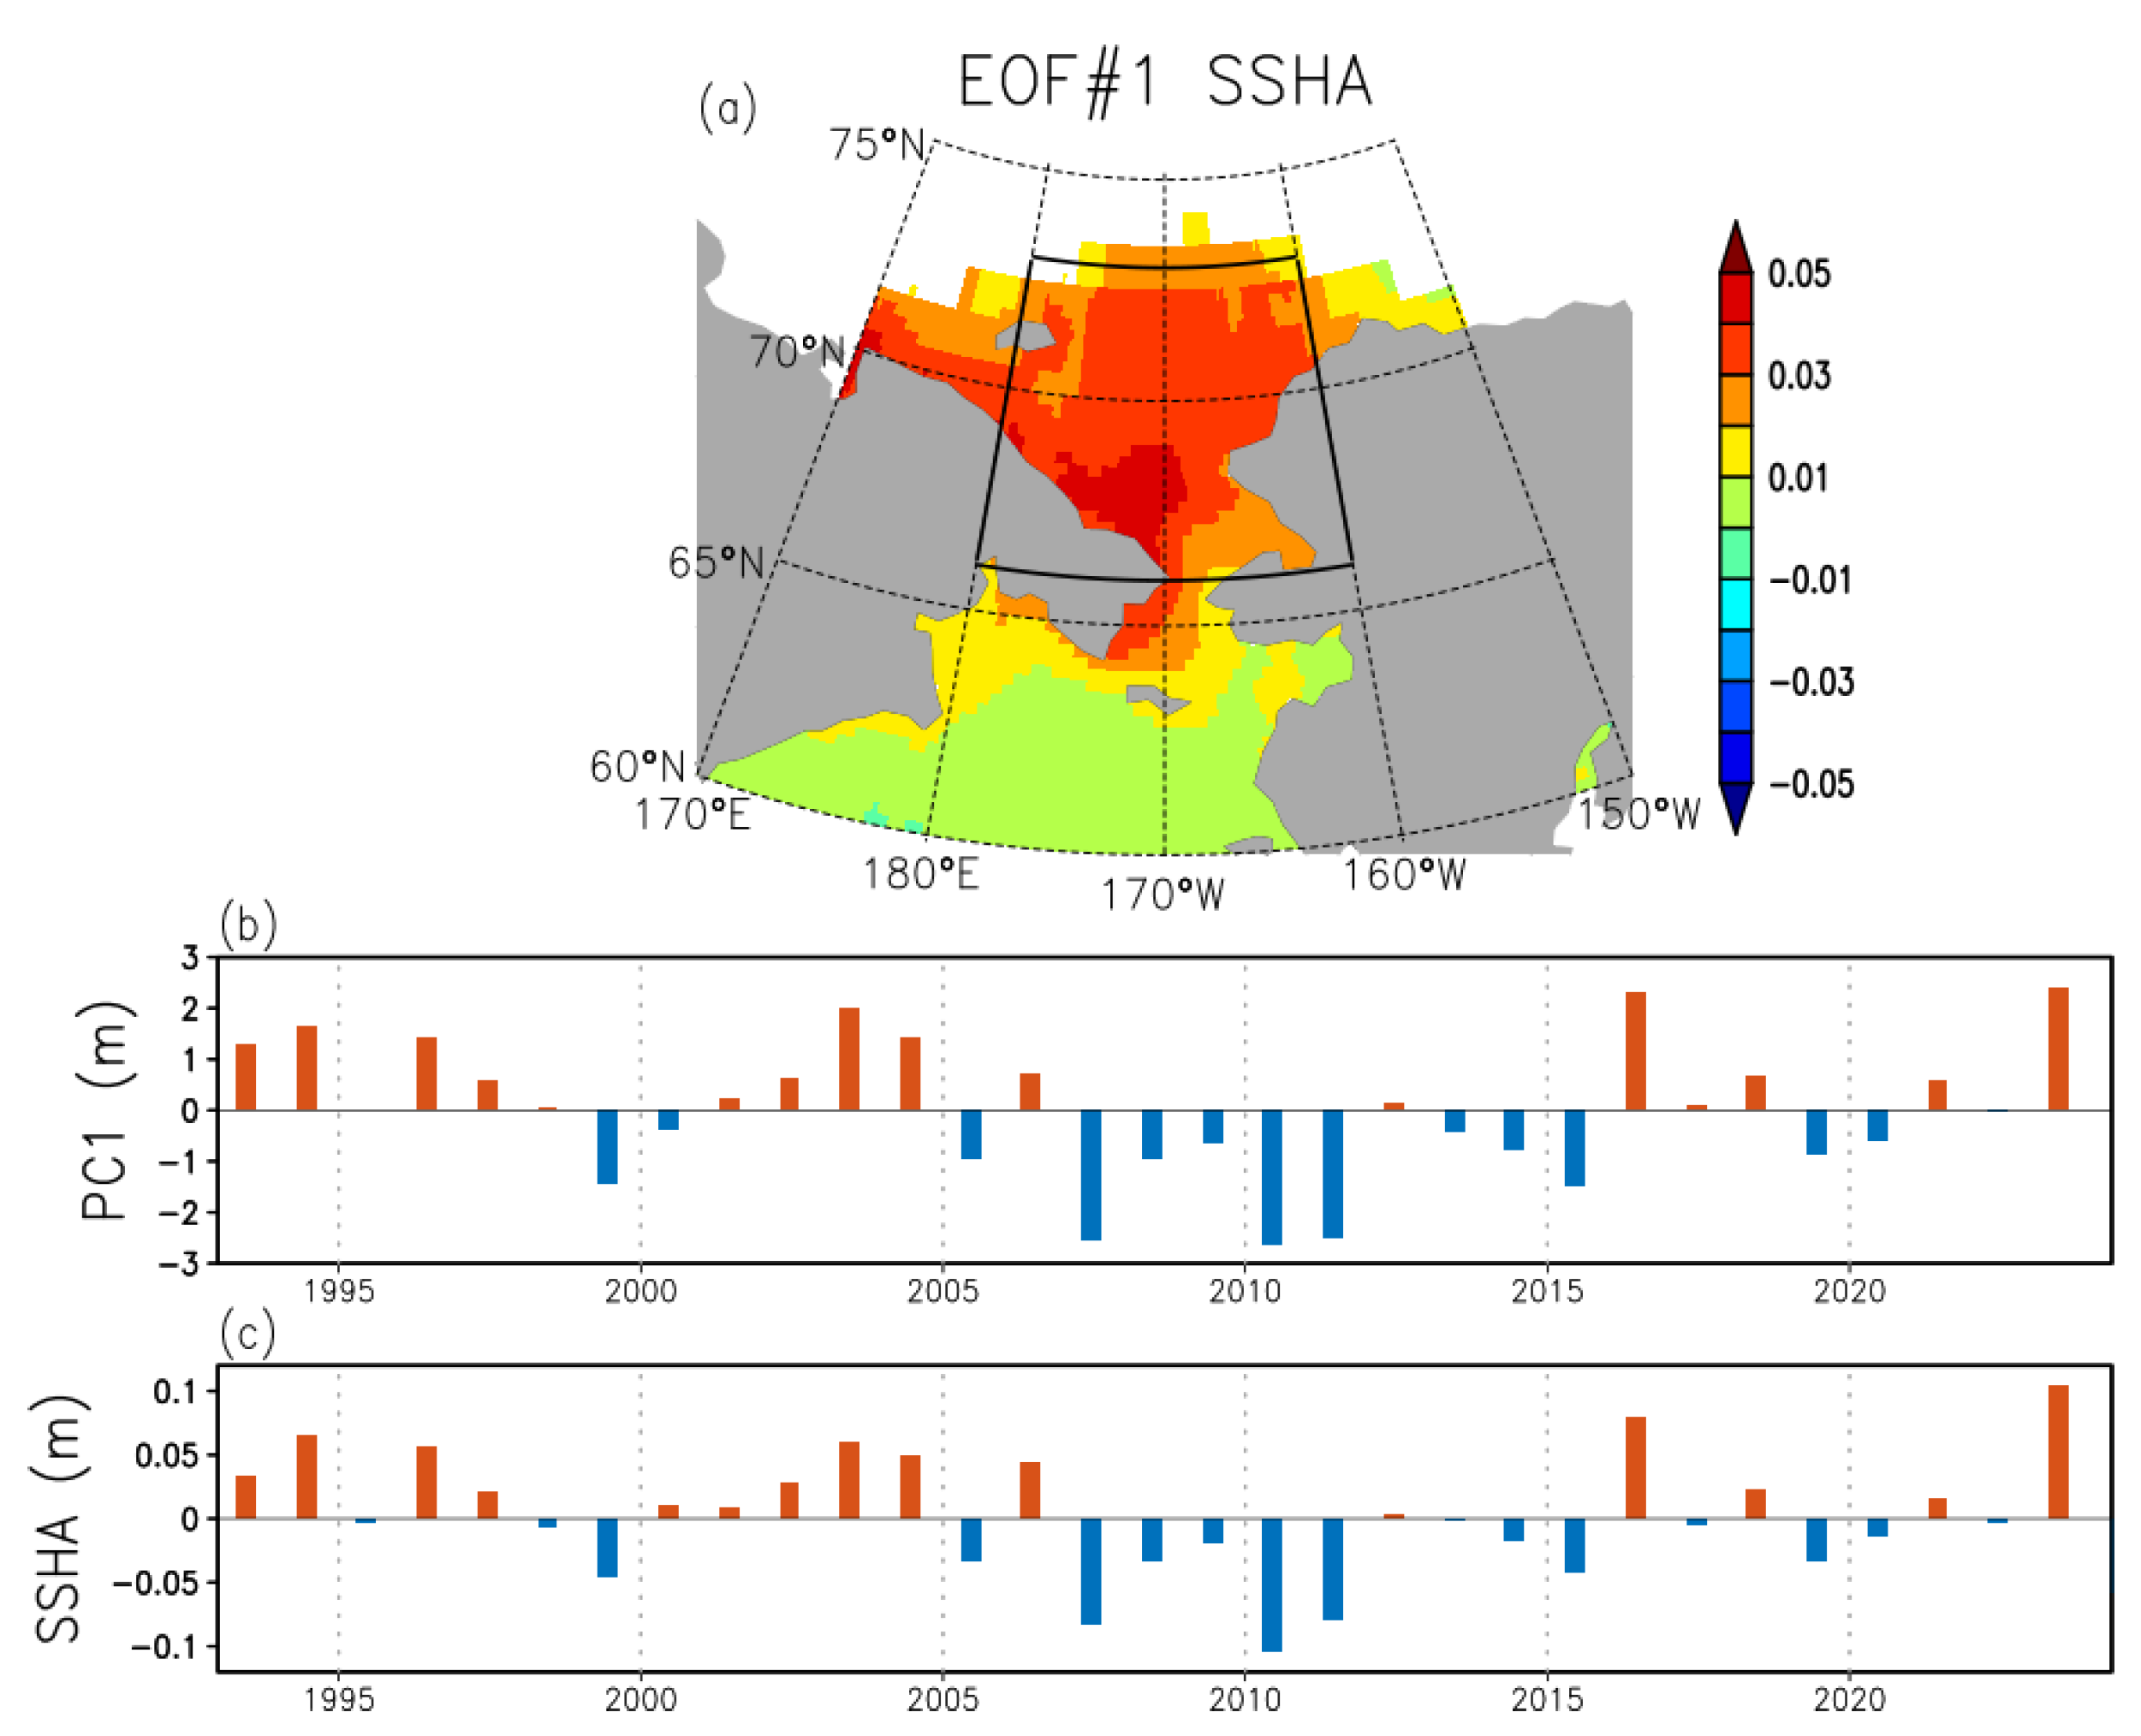
The leading mode of SSHA variability in the Chukchi–Bering Seas illustrates the spatial pattern associated with interannual changes in the pressure head. During the satellite altimeter period (since 1993), the variability of SSHA, averaged in May–August each year, concentrates on the Arctic sector, with less variability in the Bering Sea sector (Figure 5a). This spatial pattern is in line with observation analysis [7] and model simulations [10].
Given the high concentration of the leading EOF in the Chukchi Sea sector (Figure 5a), its temporal changes (PC1, Figure 5b) are almost identical to the temporal changes in anomalous SSH averaged over the Chukchi Sea box (Figure 5c). This latter time series will be used to identify large-scale atmospheric MSLP patterns responsible for observed sea level variability in the Chukchi Sea (thus, interannual variability of the pressure head).

3.3.2. Atmospheric MSLP Patterns

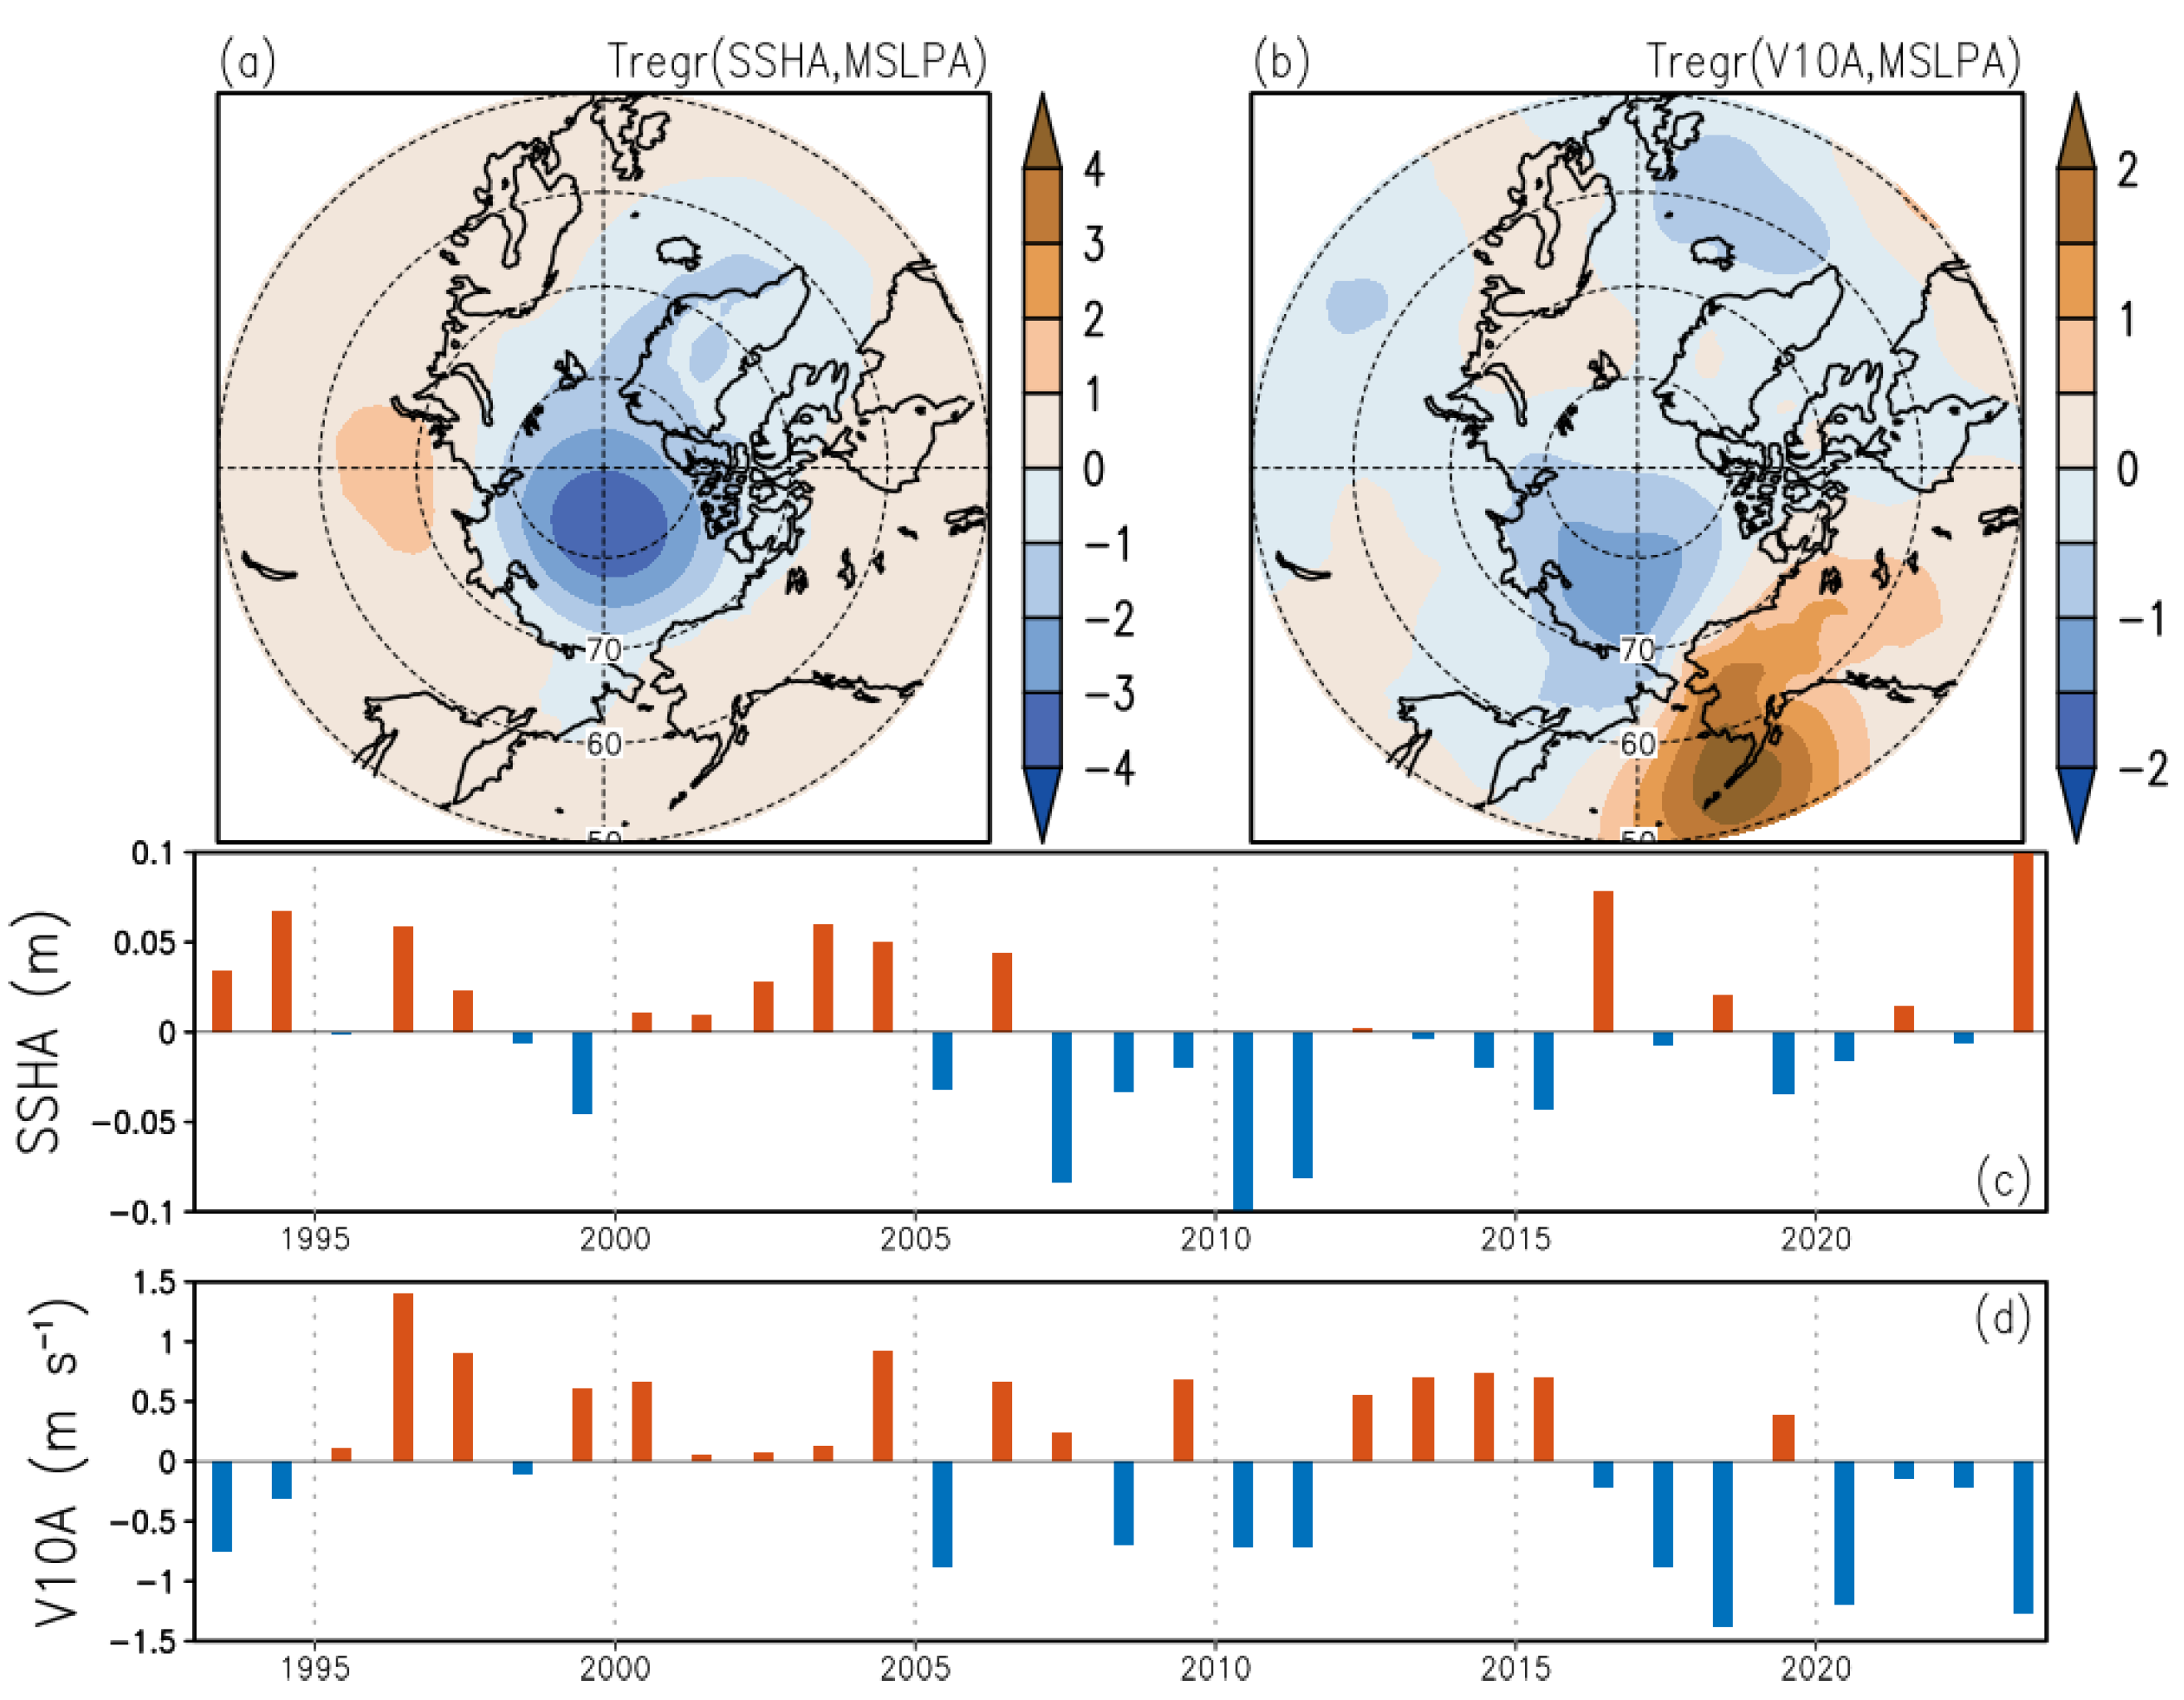
To evaluate atmospheric patterns related to Bering transport variations, the dynamical factors affecting its variability are considered. They include the pressure head and the along-channel winds ( V 10 ) over the Strait [2,4]. The time series of the two parameters are calculated May–August each year and projected on the May–August MSLP anomaly from the ERA5 reanalysis (Figure 6).
The summer atmospheric MSLP pattern corresponding to variations in the summer pressure head resembles the Arctic Oscillation (AO) pattern (Figure 6a). Notice that the time series of the Chukchi Sea SSHA is used, in which positive values correspond to a weakened Pacific-to-Arctic pressure head. As shown in [10], the physical mechanism of the AO impact on the Chukchi Sea SSHA involves its impact on wind-driven currents that modify the SSH in the open estuary (Chukchi Sea) and along the southern Arctic coast. In particular, anomalous cyclonic circulation (westerlies) associated with a strengthened polar MSLP low leads to anomalous onshore Ekman transport. It increases the sea level along the coasts and in the interior Chukchi Sea and, thus, decreases the Bering Strait transport. A wind-induced positive coastal SSH anomaly accelerates the SSC and its freshwater transport, decreases salty water uplift in the coastal upwelling, and thus, leads to a negative correlation between Bering Strait and SSC transport variations [10,18]. All these factors lead to the same sign of salinity changes and amplify their combined effect on Chukchi Sea salinity. Hence, the wind-driven dynamics is ultimately responsible for coherent variations in the Bering Strait–SSC system.
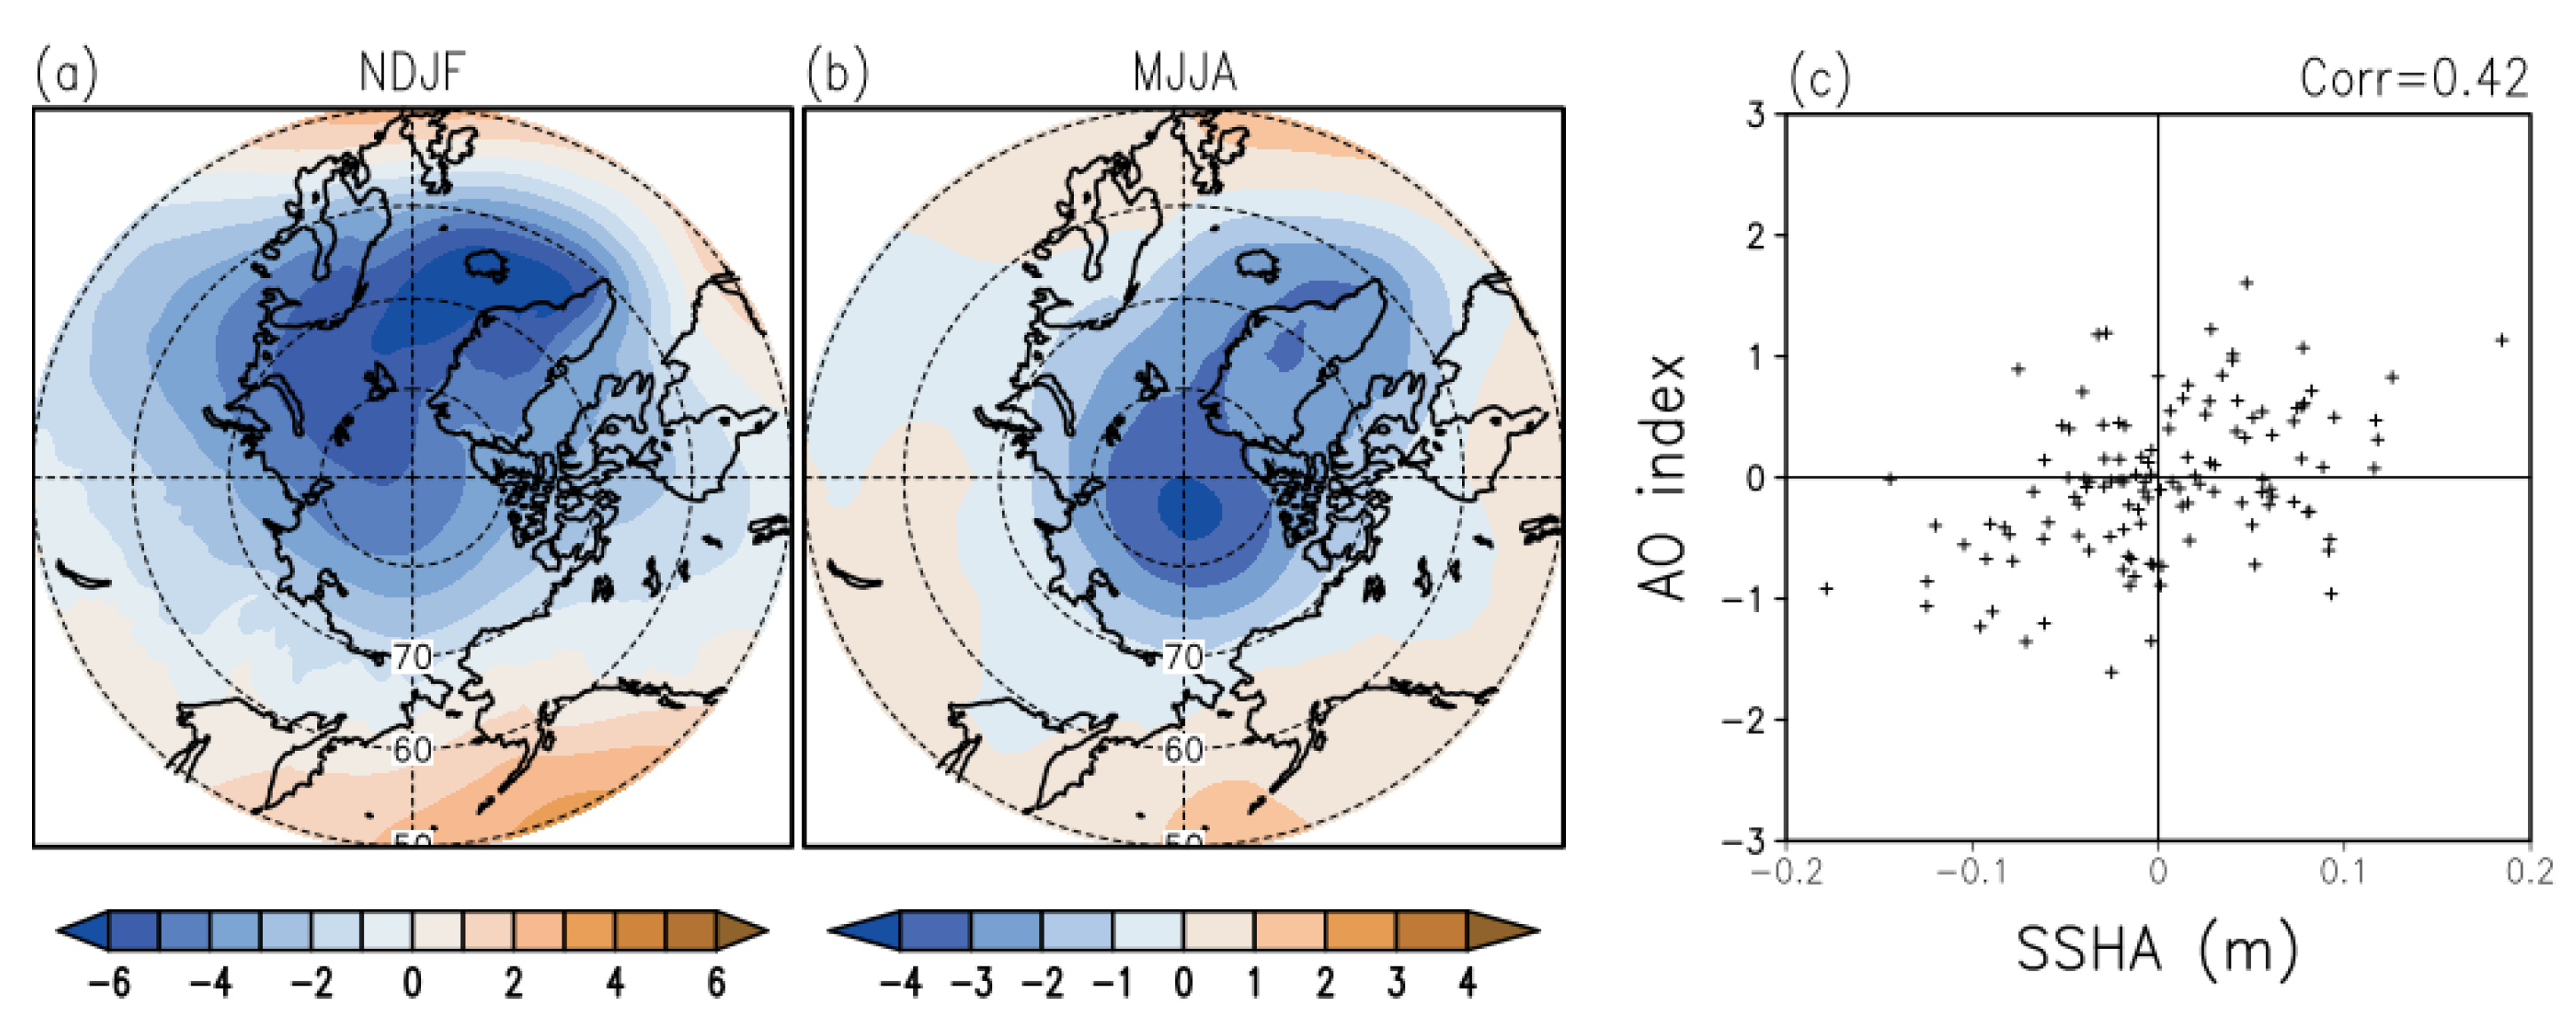
Figure 6a results suggest that interannual changes in the Bering Strait volume transport are related to an Arctic Oscillation-like MSLP pattern [9]. However, we find that the temporal correlation between summer values of the AO index and Chukchi Sea SSHA is only marginal, ~0.42 (see Appendix B). This may be a consequence of the focus on ice-free conditions in summer months, while the classic AO pattern is dominated by winter variability.
Changes in along-channel winds over the Bering Strait are related to an expected atmospheric zonal MSLP dipole, with a stronger pole over the Aleutian low time-mean location (Figure 6b). The anomalous circulation around the weakened Aleutian low (positive MSLP pole in Figure 6b) leads to a predominantly northward wind anomaly over the Strait, as one might expect from the geostrophic balance.
Changes in the Pacific-to-Arctic pressure head are coincident with the SSH anomaly along the Chukotka coast and the zonal SSH gradient across the Bering Strait (Figure 5a). This zonal gradient reflects the response of the geostrophic component of the Bering Strait inflow, which makes it detectable by satellite altimeter measurements [39].

3.3.3. Two-Parameter Bering Strait Transport Linear Model

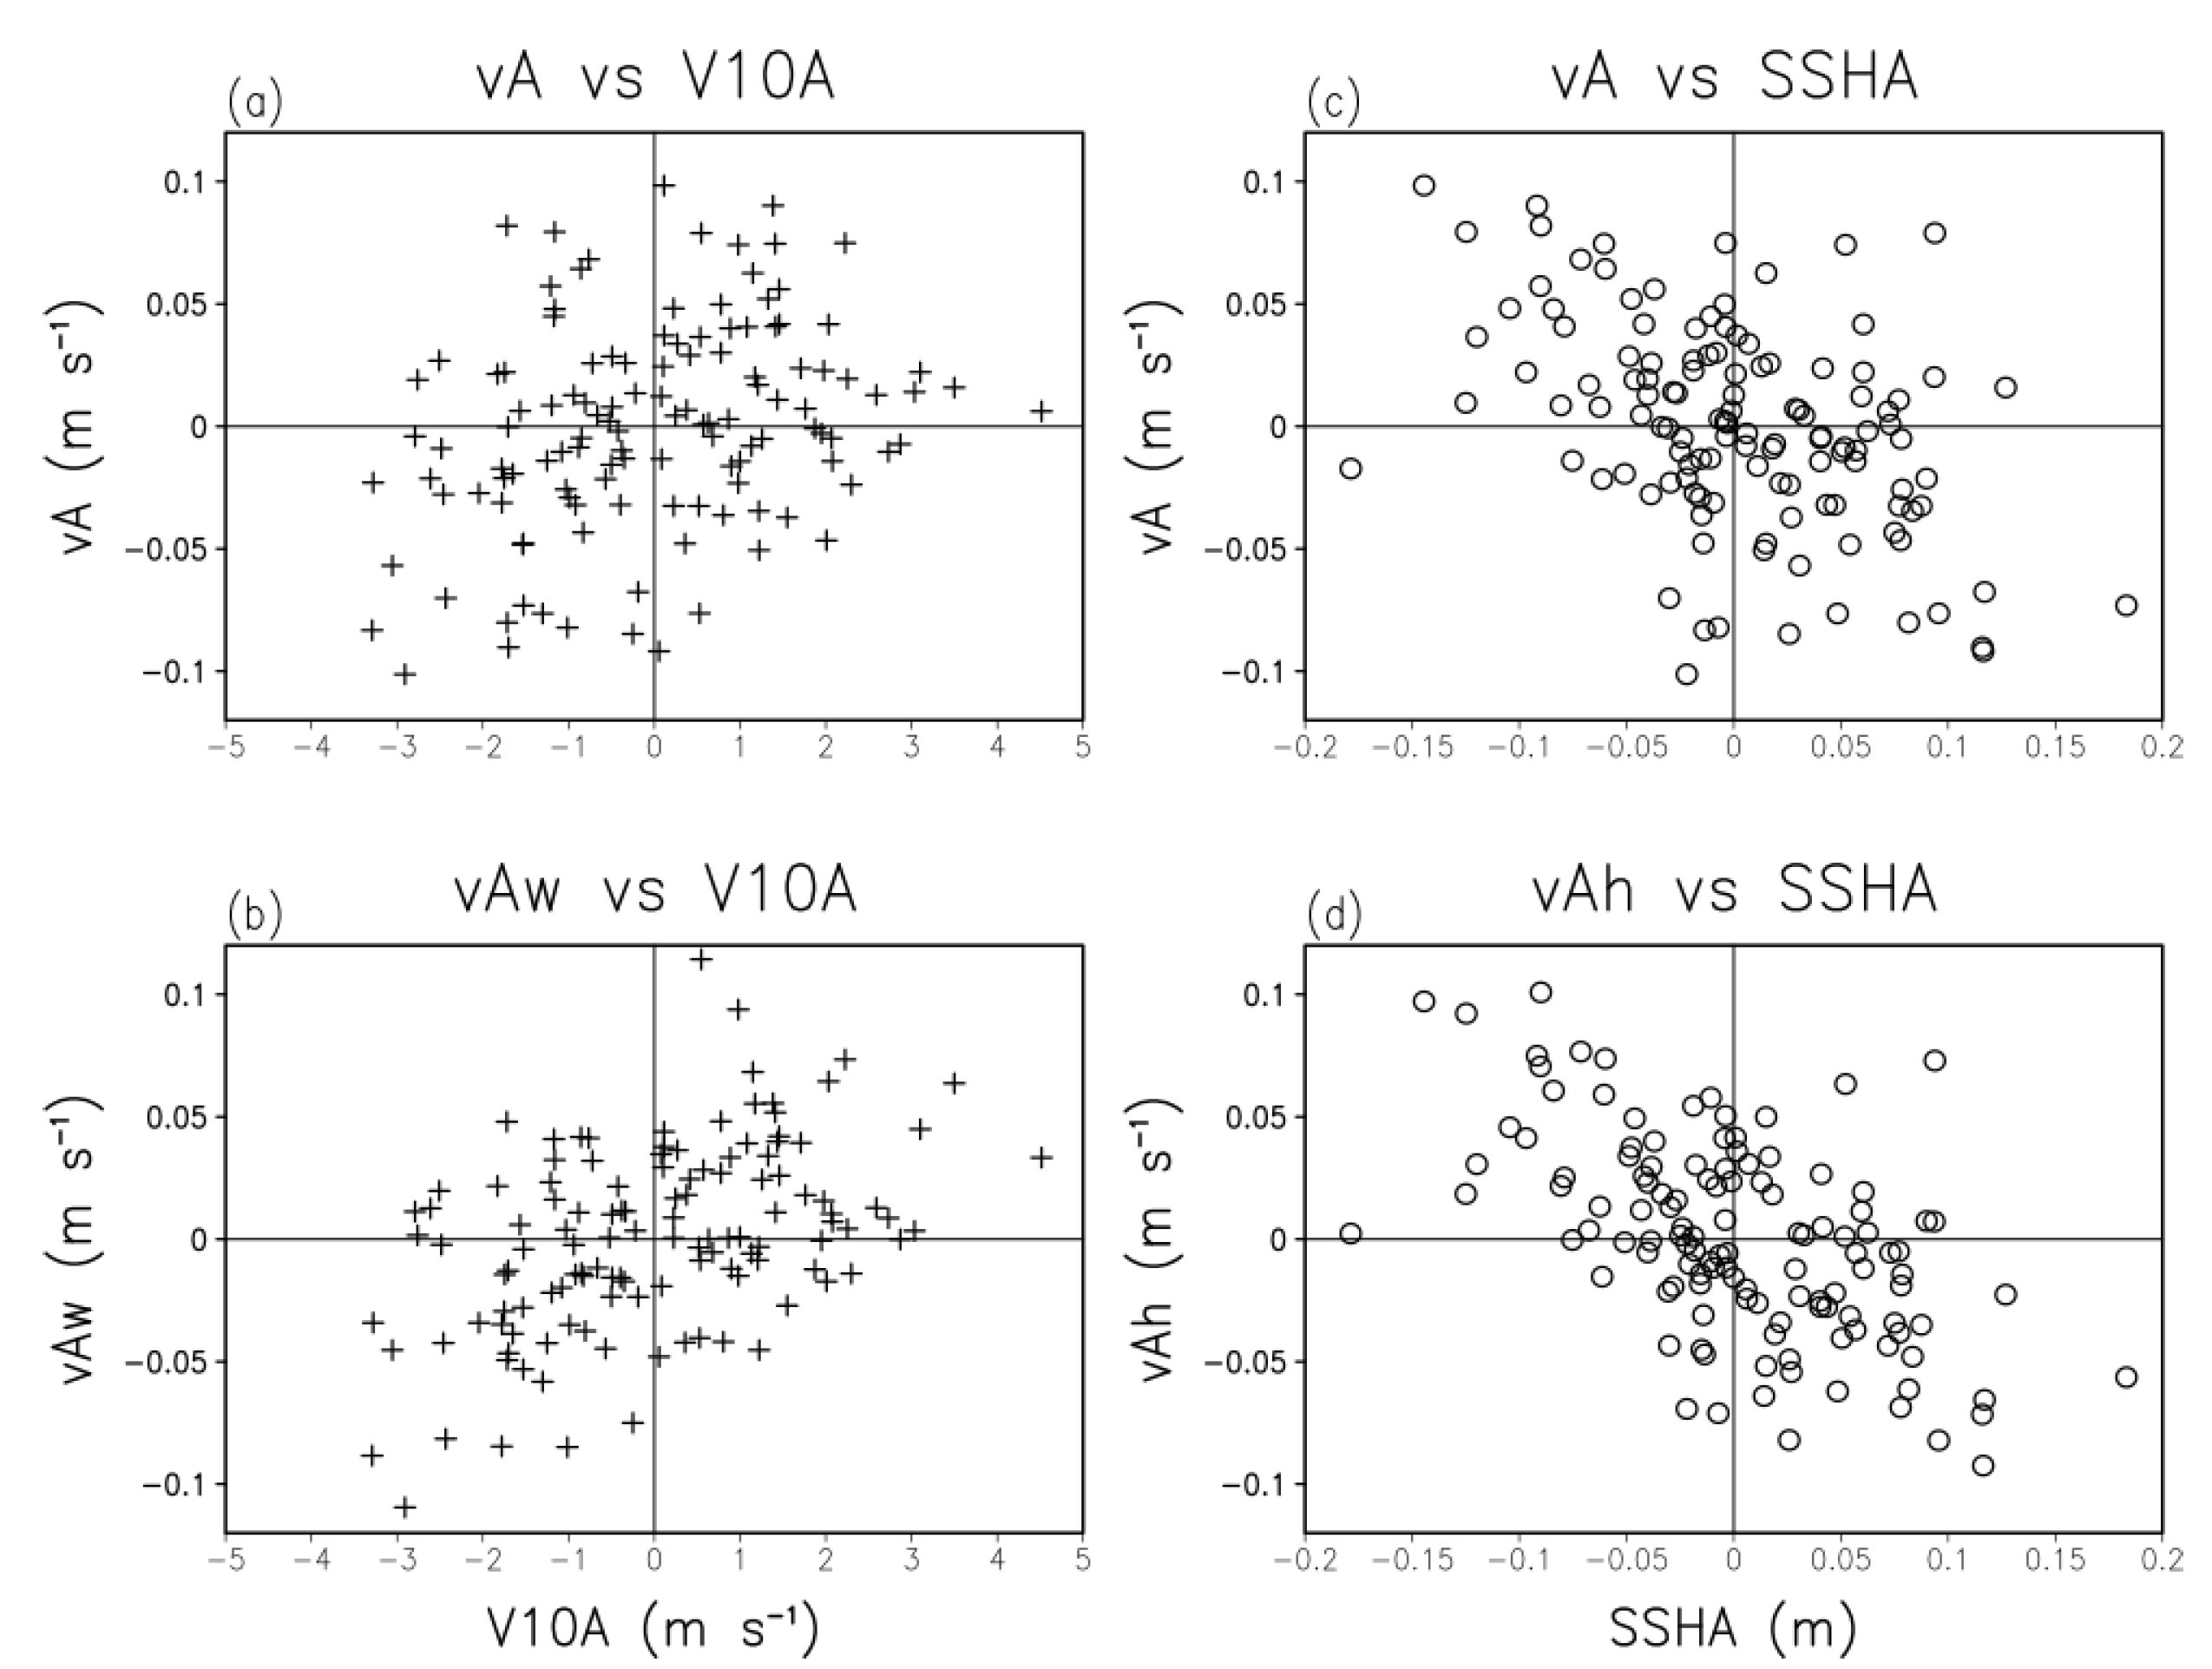
Both factors, Chukchi Sea SSHA and meridional winds over the Strait, V 10 A , affect summer-period Bering Strait transport. As expected, the observed northward meridional velocity anomaly, v A , averaged over the Strait box, accelerates when the southerly local winds strengthen (Figure 7a) and decelerates when the Chukchi Sea SSHA elevates (pressure head decrease, Figure 7c).
A noticeable negative correlation between observed v A and SSHA is seen in Figure 7c, while a larger scatter between observed v A and V 10 A is seen in Figure 7a. This difference suggests that, during the altimeter period, the impact of Chukchi Sea SSHA on the pressure head is the dominant factor that affects the Bering Strait velocity anomaly, v A . A simple two-parameter linear regression model is used to separate the impacts of V 10 A and Chukchi Sea SSHA on v A (see also [40]):
v A = α S S H A v A h + β V 10 A v A w + o f f s e t
With altimeter-derived v A , SSHA, and V 10 A from the ERA5, offset = 0.001 0.005 0.007 (where the upper and lower subscript values are the 95% confidence interval), α = 0.377 0.477 0.276 , and β = 0.011 0.007 0.015 . Because the offset is not statistically different from zero, it is neglected. After removing the contribution of SSHA, v A w = v A α S S H A , the positive correlation between wind-induced Bering Strait velocity component, v A w , and winds, V 10 A , visually improves (compare Figure 7a,b). But removing the contribution of wind, v A h = v A β V 10 A , has a smaller impact on the negative correlation between the pressure-head-induced Bering Strait velocity component, v A h , and the Chukchi Sea SSHA (compare Figure 7c,d). Based on these data, the v A h component dominates and explains ~41% of v A variance, whereas v A w explains ~16% of v A variance. A similar two-parameter decomposition of v A will be used for model simulation analyses below.

3.4. Chukchi Sea SSS Variability from Model Simulations

Observation-based analyses in Section 3.3 are based on the Bering Strait volume transport anomaly as an indicator. It is evaluated using altimeter-based geostrophic velocity anomaly data. Using the volume transport anomaly instead of the salt transport anomaly, which governs salinity budgets, is due to observation limitations. Currently, SSS in the Strait or its upstream value in the very northern Bering Sea (Chirikov Basin) is not readily available from remote sensing data (due to complex land contamination of satellite L-band microwave data, from which the SSS is inferred). Instead, model simulations are now used to examine the relationship between salinity distributions in the Chukchi Sea and upstream salinity transport in the Bering Strait.
To examine the relative roles of different factors, the anomaly of salinity transport, v Δ S , is linearly decomposed into a sum of transport-related and salinity-related anomalies, v Δ S ¯ + v ¯ S . Here, Δ S ¯ 1 psu is a scale factor that has the meaning of the characteristic salinity difference between May–August salinity in the Bering Strait and September salinity in the Chukchi Sea box. The overbar stands for the time mean (for simplicity, it will be omitted next). The first term, v Δ S , represents a volume transport anomaly acting on the mean salinity difference. Its variability simply reflects the variability of volume transport. The second term, v S , represents the salinity anomaly in the Bering Strait acting on the mean volume transport. This term cannot be confidently inferred from remote sensing SSS observations because satellite SSS is still not available in the Bering Strait.
It should be noted that there is a gradual increase in near-surface salinity in the Chukchi Sea box in this model (with a rate of 0.0185 psu yr−1). This trend is probably related to the gradual northward ice edge retreat (and its meltwater source, see, e.g., [20]) and is removed from further calculations.
First, a simple linear regression between September SSSA spatially averaged over the Chukchi Sea box and May–August salinity flux anomaly components in the Bering Strait box is evaluated using the RARE1 model simulations, S S S A = a v Δ S + b v S . This two-factor regression suggests (see Table 1) that the relationship between SSSA and v Δ S is only marginally statistically significant (the subscripts in Table 1 represent the 95% confidence interval). At the same time, the relationship between SSSA and v S is not significant (because its confidence interval includes zero). In general, such wide confidence intervals reflect a strong data scatter. The positive correlation between SSSA and v Δ S along with the strong scatter between these two are in line with Figure 4, which also shows a rather strong scatter between the observed Chukchi Sea SSSA and the Bering Strait geostrophic velocity anomaly. Next, it will be shown that SSSA is not spatially homogeneous over the Chukchi Sea box. This is the reason for a rather weak correlation between the box-averaged Chukchi Sea SSSA and the Bering Strait salinity transport anomaly.

Spatial Patterns of Chukchi Sea SSSA Correlated with Bering Strait Variability

Observed patterns of SSS variability in the Chukchi Sea during the annual maximum of ice retreat in September are highly variable (Figure 3). Consistent with the shorter timeframe remote sensing SSS observations, this high spatial variability leads to uncertainties in the relationship between Bering Strait variability and resulting salinity variability in the downstream Chukchi Sea (Figure 4). Next, longer simulations from the higher-resolution RARE1 ocean reanalysis are employed to better expose potential relationships. These are compared with the lower-resolution SODA3 ocean reanalysis.
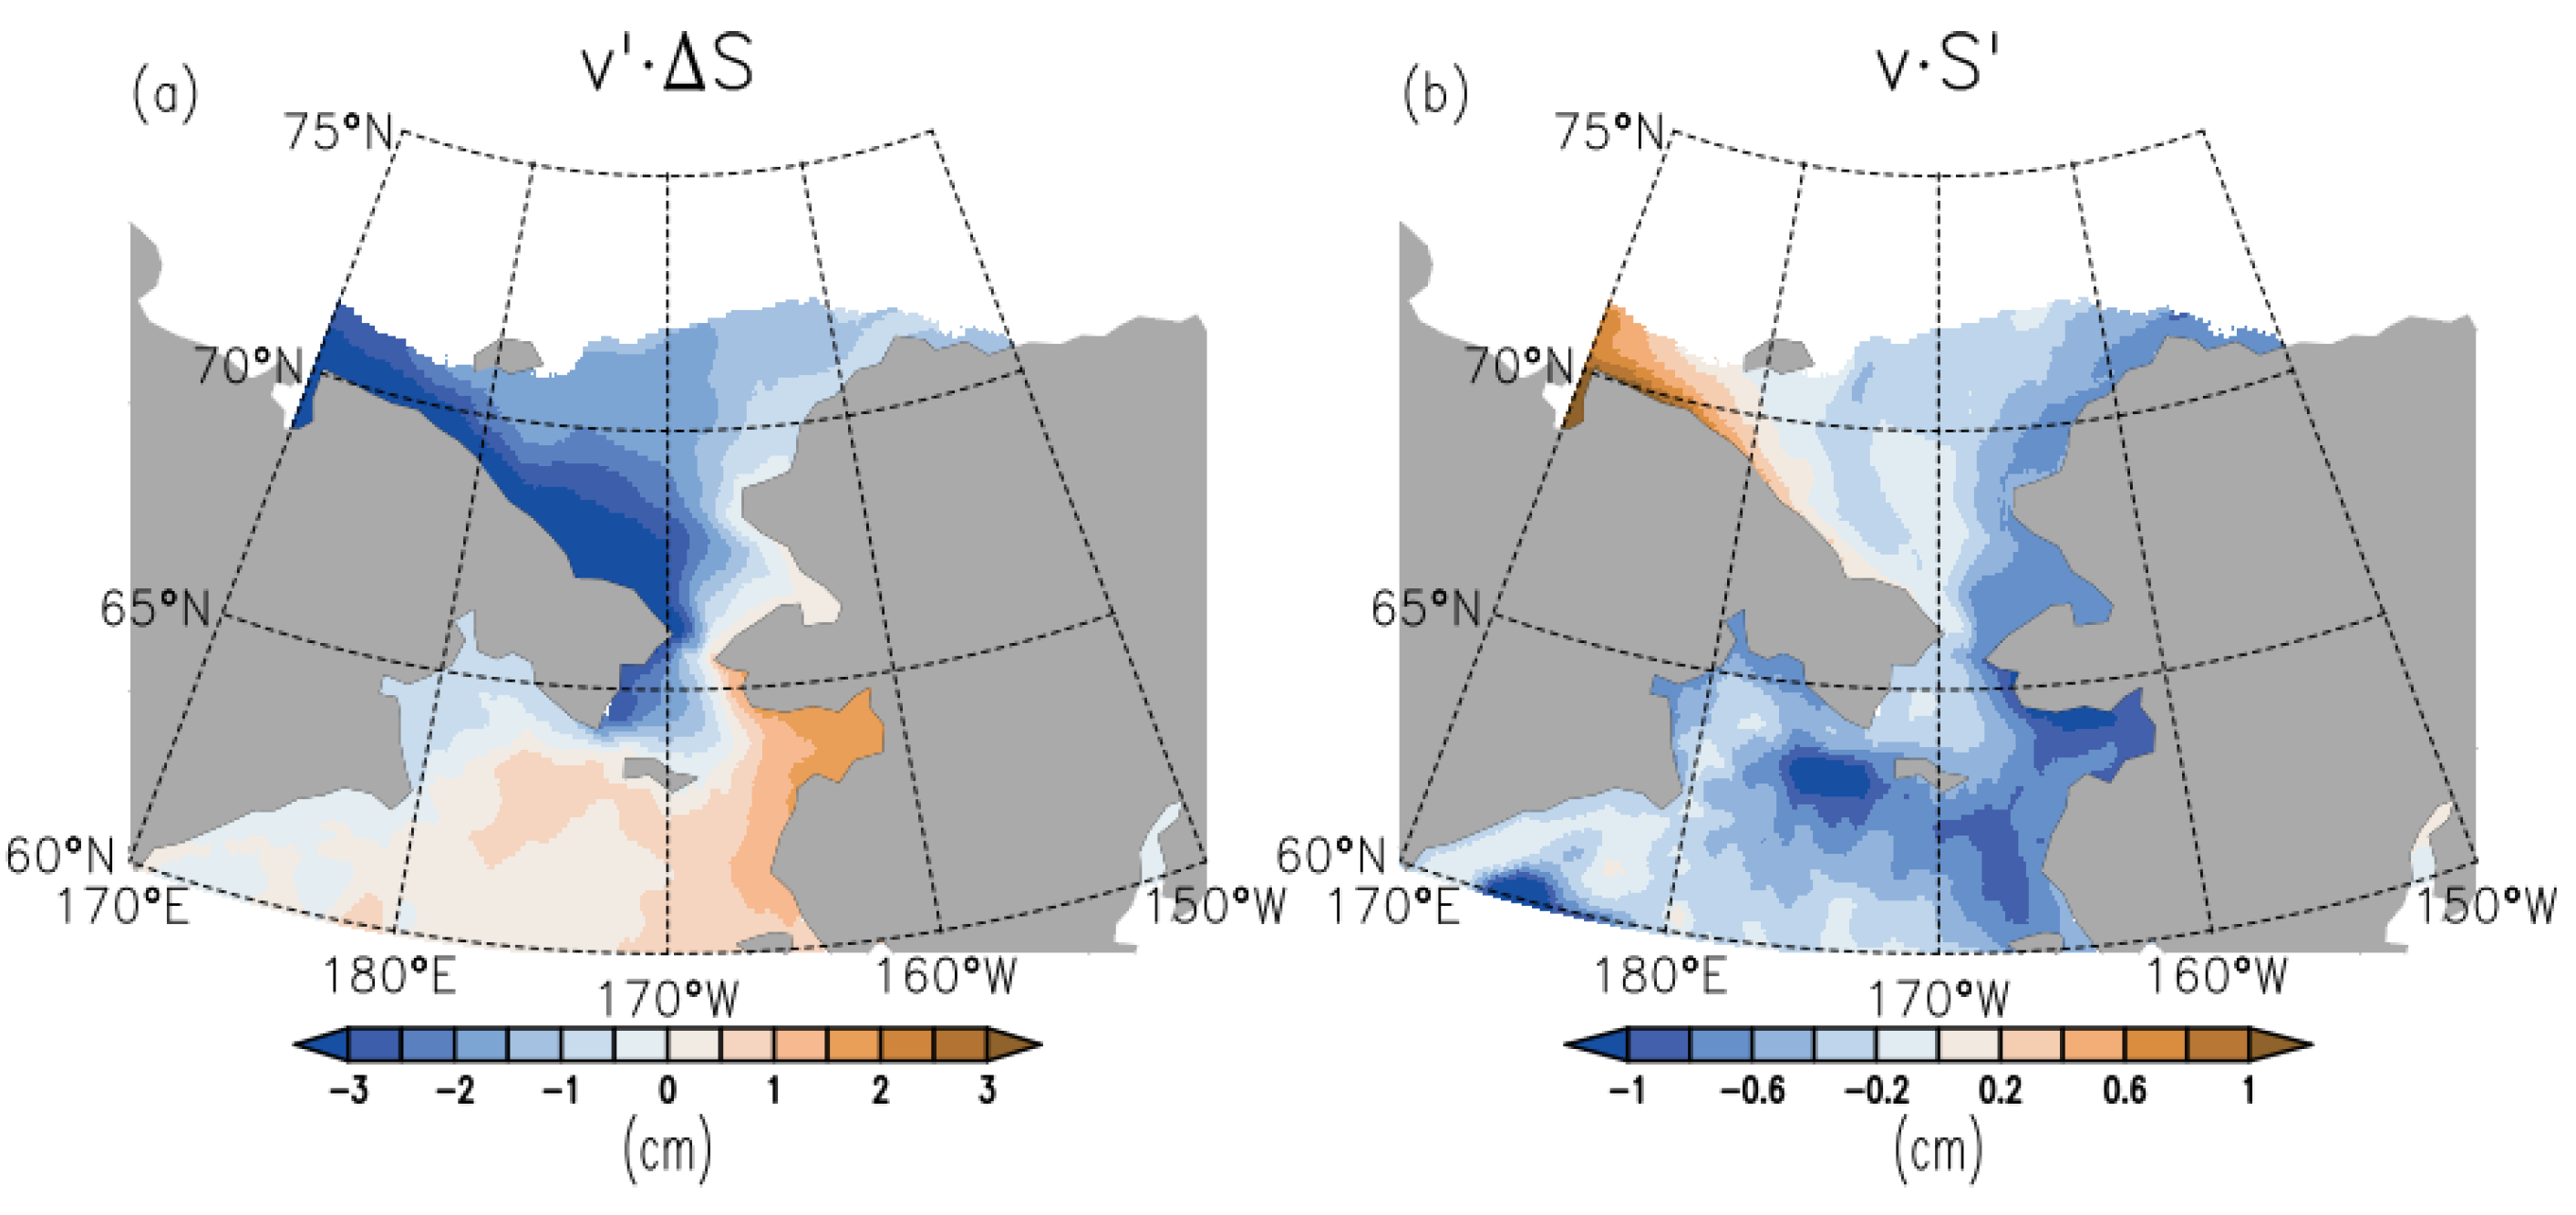
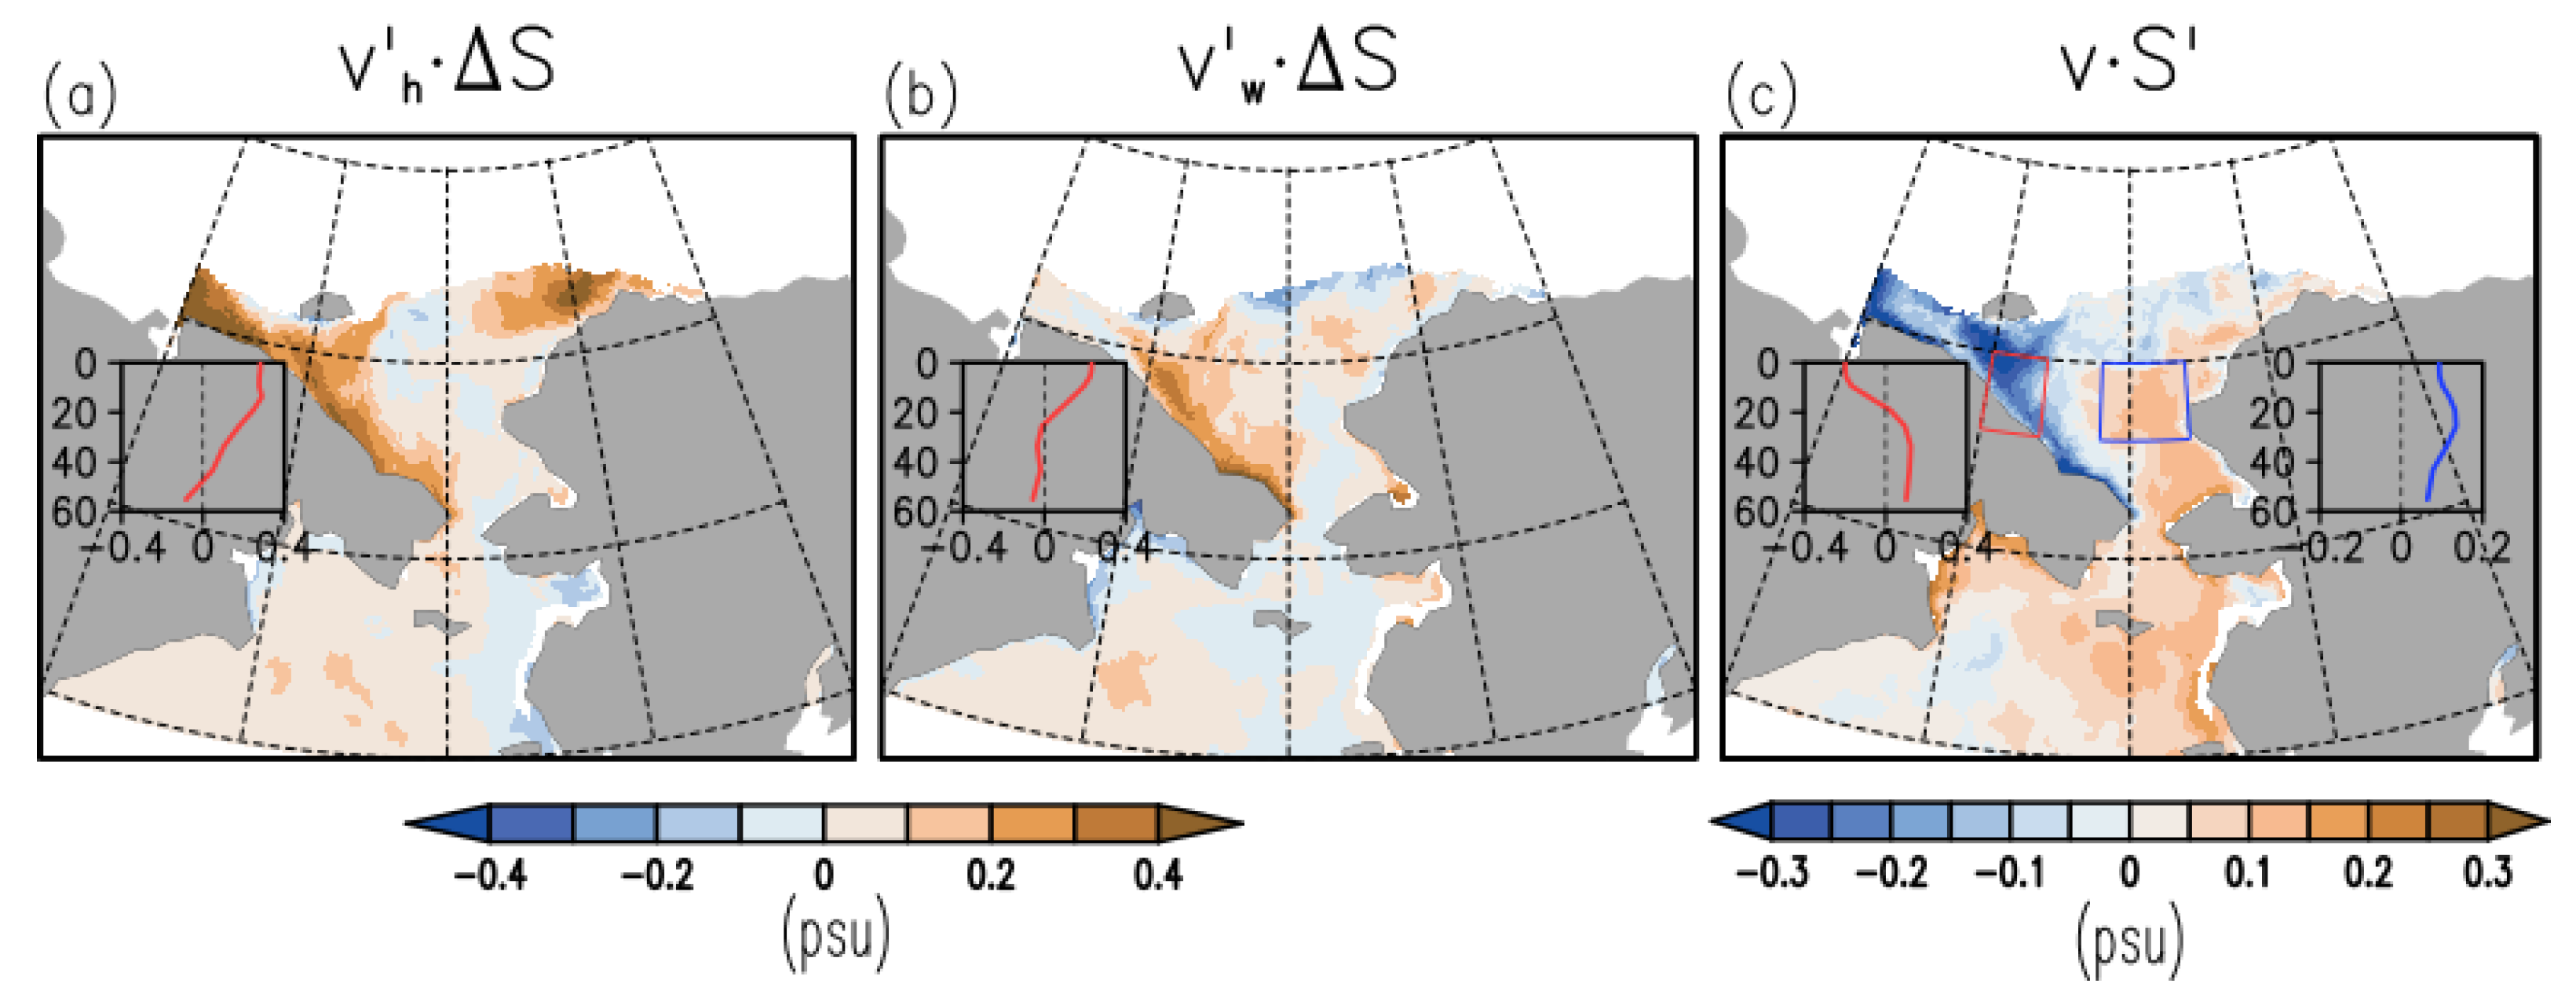
RARE1 salinity variations in the Chukchi Sea are temporally regressed versus the Bering Strait salinity flux anomaly components, v Δ S and v S . Following Section 3.3.3, the Bering Strait transport anomaly, v , is represented as a sum of two terms forced by the pressure head anomaly and the local meridional wind anomaly, v h + v w .
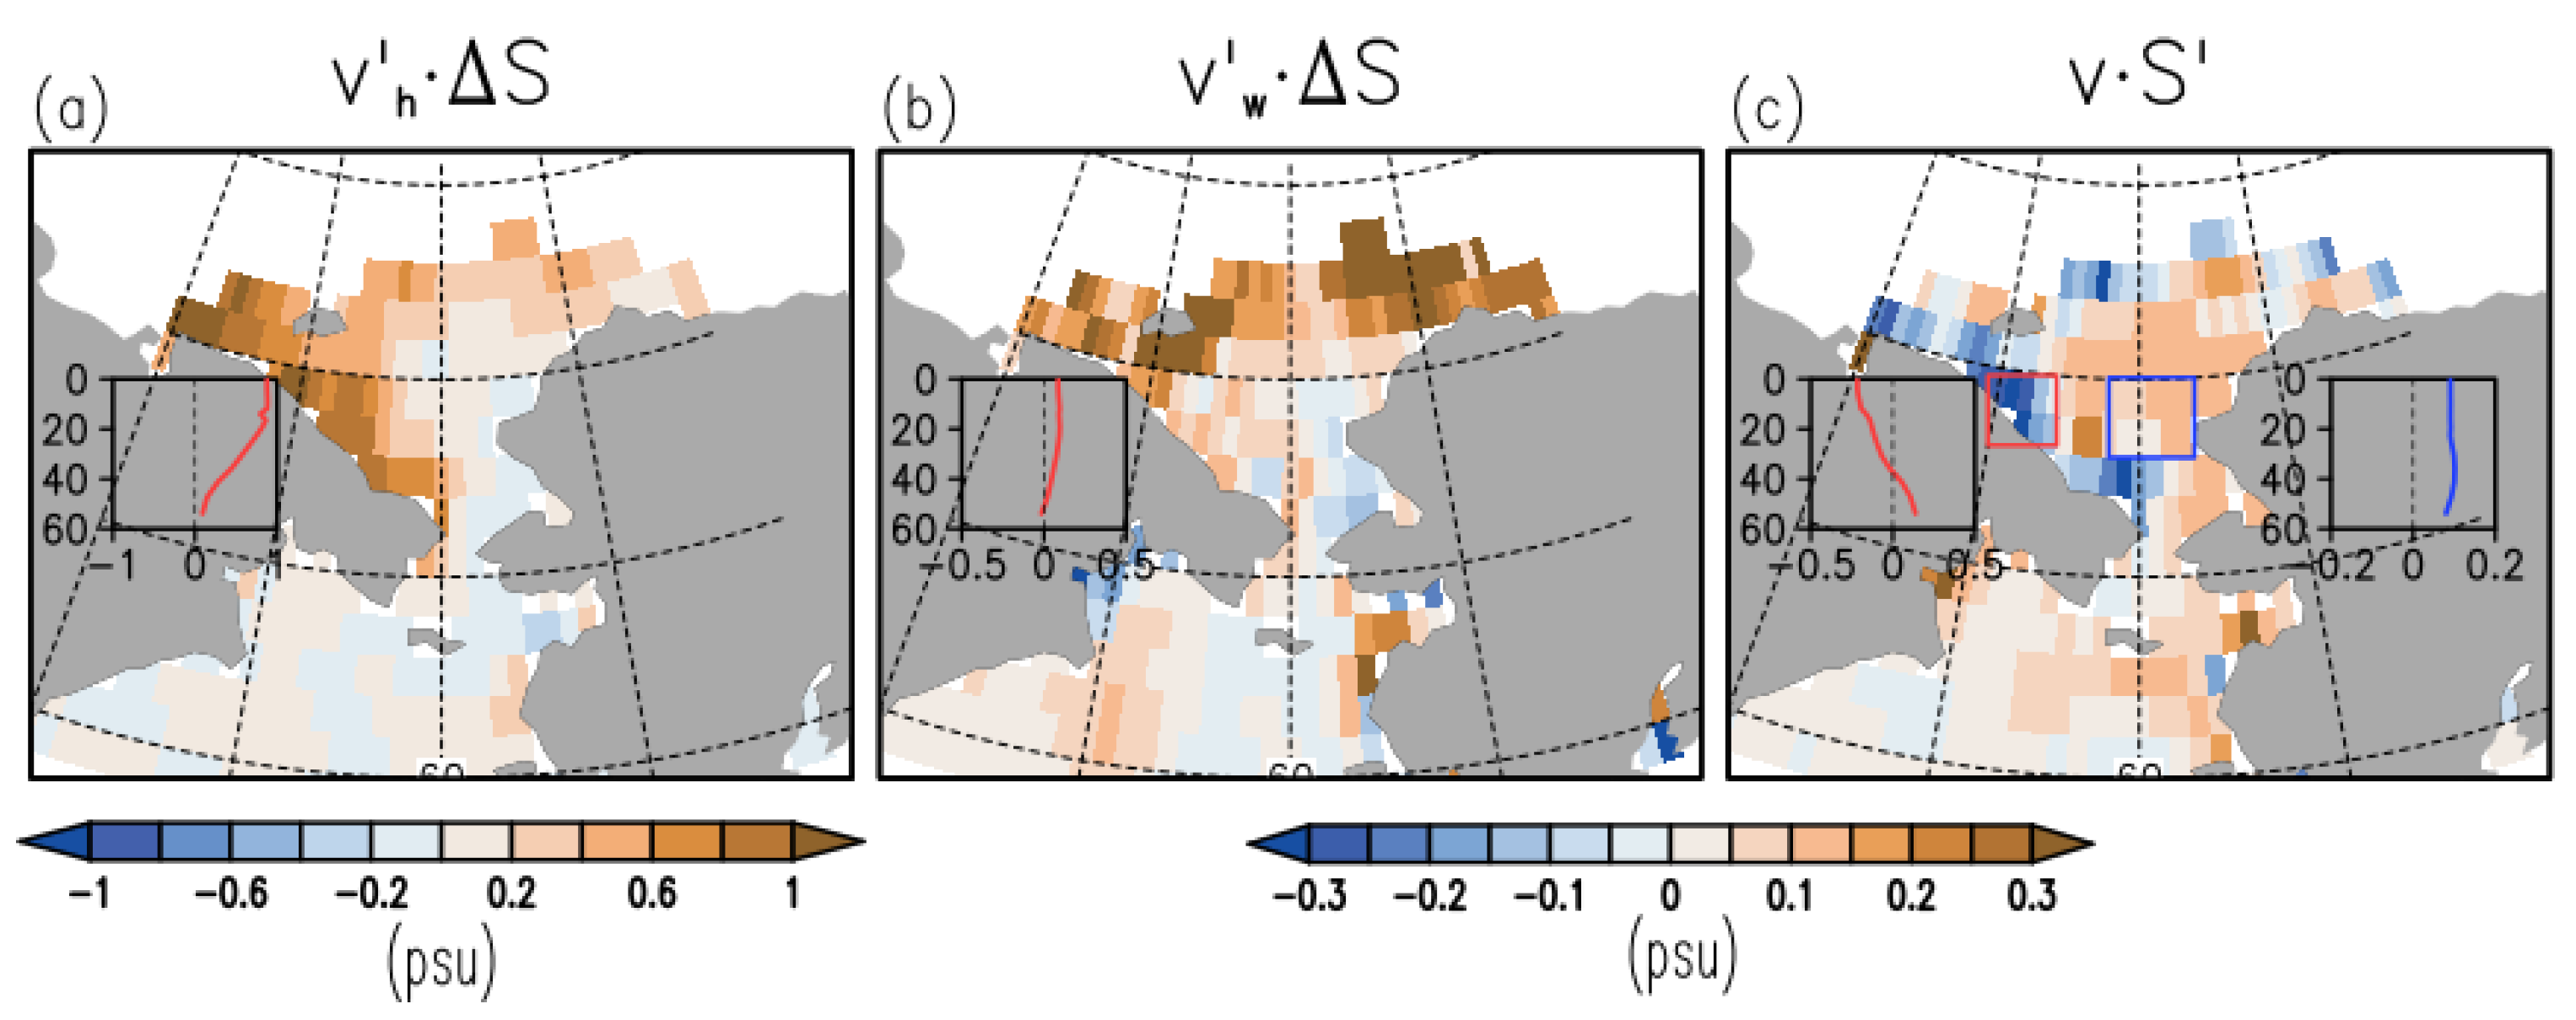
Although consistent with previous model-based assessments, e.g., [10], the results in Figure 8 are not fully expected. In particular, they differ from the time-mean basin-wide Chukchi Sea SSS patterns in Figure 1 that show a connection with the salty Bering Strait inflow. For interannual anomalies, the SSS response correlated with Bering Strait transport anomaly components, v h Δ S and v w Δ S , is located along the northern coast of Chukotka (Figure 8a,b).
Northward Bering Strait acceleration, v h > 0 and v w > 0 , is related to either an easterly zonal wind anomaly over the Chukchi Sea or a southerly wind anomaly over the Strait (Figure 6). The same components of winds cause an upwelling-like response along the northern Chukotka coast. Both the coastal upwelling [10] and the related SCC deceleration [18] lead to coastal salinification via vertical and lateral exchanges, respectively. This wind-driven coastal salinity response is surface-intensified in the upper 20 m, with sharper vertical distribution driven by meridional winds (Figure 8a,b). In that sense, a salty anomaly along the northern coast of Chukotka coincides with an acceleration of the Bering Strait volume transport, but it is not caused by this acceleration. In distinction from the satellite-based observations where the variations of Bering Strait geostrophic velocity explain about 40% of observed satellite SSSA variance in the Chukchi Sea box (Figure 4), the model salinity flux component, v Δ S , explains only 11% of the variance of model SSSA averaged over the Chukchi Sea box. Such a low explained percentage is related to the coastally limited patterns (Figure 8a,b), with weak SSS response over much of the Chukchi Sea box.
In contrast to the v Δ S component, the change in salinity of the Bering Strait inflow, v S , is positively correlated with a downstream SSS anomaly in the central and eastern Chukchi Sea (Figure 8c). However, the magnitude of the surface response to v S is weaker than that to v Δ S along the northern Chukotka coast (Figure 8). Also, the response to v S increases by ~ 50 % at mid-depths in comparison to the surface value (Figure 8c, right inlay).
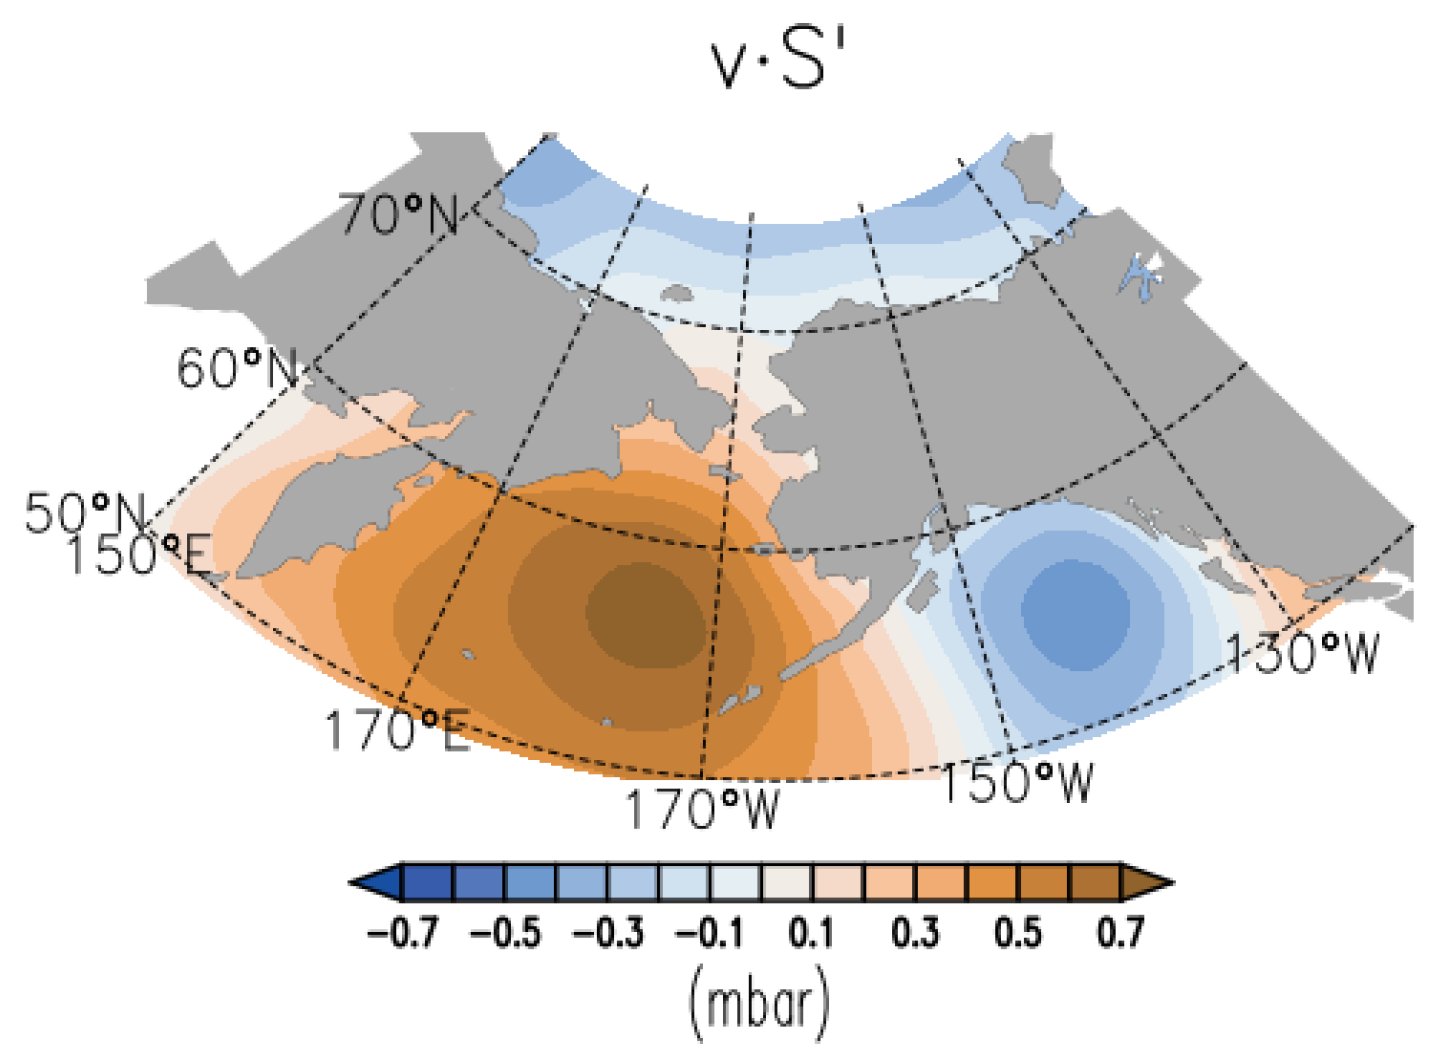
Positive SSS anomalies develop in the interior Chukchi Sea along with fresh anomalies along the coastal Chukotka in response to v S (Figure 8c). The physics of the latter fresh response is still to be understood. It may be related to large-scale MSLP patterns causing v S variations. An atmospheric MSLP anomaly regression with v S (Figure A5) suggests that variations in Bering Strait salinity are concurrent with zonal shifts in the Aleutian low, with positive salinity variations corresponding to eastward shifts. Such eastward shifts result in an MSLP high over the Bering Sea where anomalous northerly winds strengthen coastal upwelling along the Alaska coast (Figure A3b), decelerate the ACC, and thus, decrease its fresh transport. There are also indications of a strengthening of westerly winds over the Chukchi Sea, which accelerate the SCC and, thus, lead to a freshening along the northeastern Chukotka.
An alternative explanation of the anomalous freshwater tongue in the SSC region along Chukotka during positive v S   episodes involves positive feedback in coastal jets not related to direct wind forcing. An increase in salinity in the interior Chukchi Sea (Figure 8c) leads to sea level depression due to salinity contraction. It results in a relative sea level coastal high. In turn, the coastal SSH high accelerates the SSC that transports fresher water and, thus, further increases the coastal SSH high. Such a positive feedback loop may cause SSC accelerations temporally correlated with salty anomalies in the Bering Strait (see also Appendix C for anomaly SSH patterns corresponding to Bering Strait salinity flux components, v Δ S , and v S ).
SSSA correlation with Bering Strait volume transport, v Δ S , is spatially inhomogeneous, with larger magnitudes along the northern Chukotka and weak values in the central-eastern Chukchi Sea (Figure 8a,b). This inhomogeneity explains the generally low correlation of SSSA averaged over the large Chukchi Sea box with the Bering Strait transport anomalies (~11% of explained variance in the RARE1). The correlation is higher but only moderately so in the observations (Figure 4, ~40% of explained variance, see Figure 1c for the Chukchi Sea box location).
The spatial pattern of the Chukchi Sea SSSA correlation with v S (Figure 8c) is even more complex than that for v Δ S . It includes a dipole with different signs of SSSA response in western and central-eastern parts of the Chukchi Sea that compensate each other. Hence, there is no significant correlation between all Chukchi Sea box-averaged SSSA and v S .
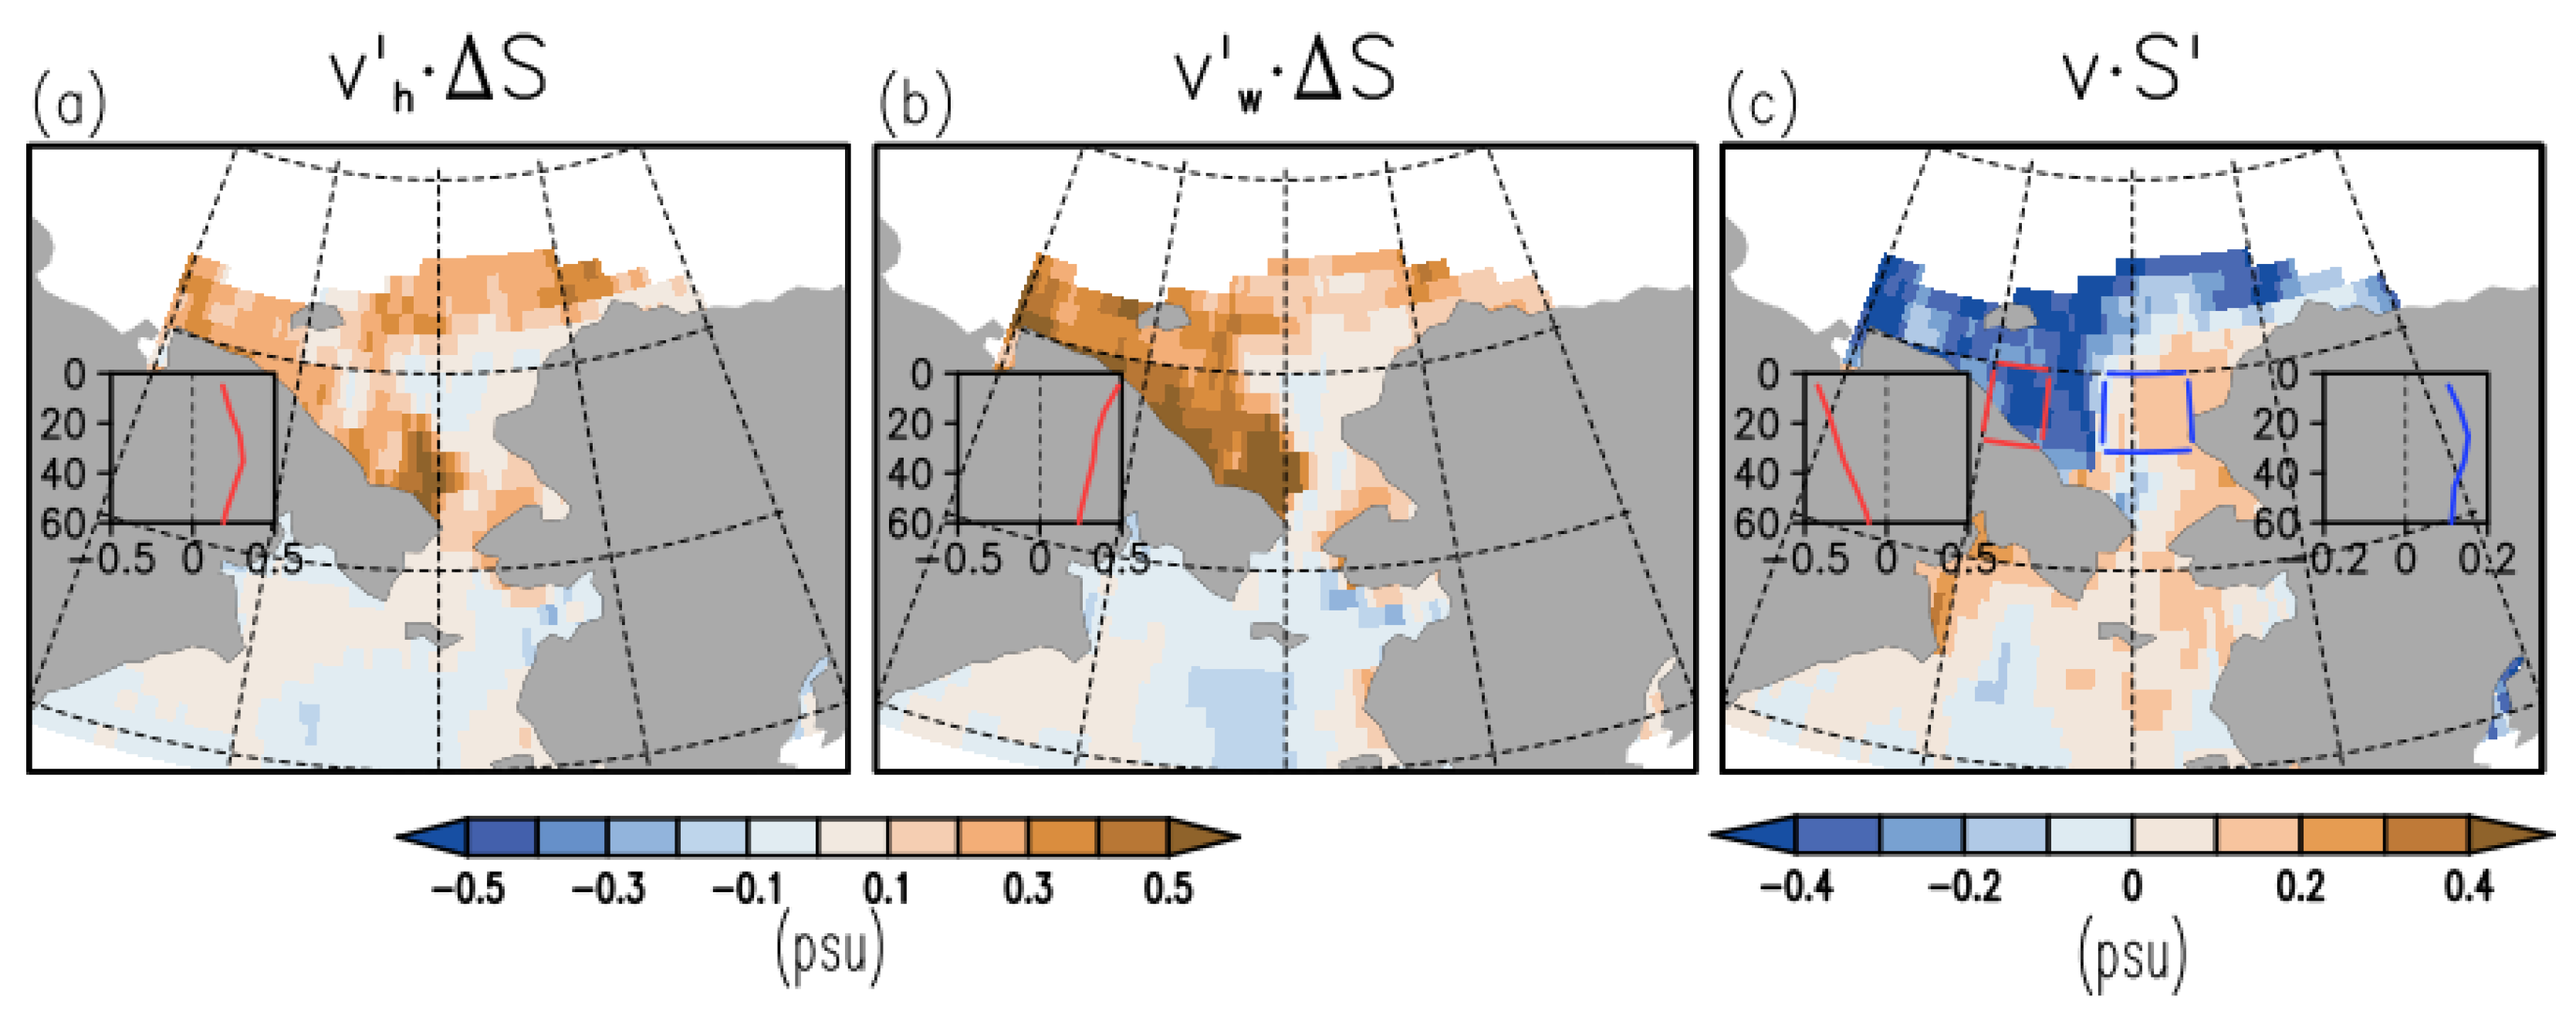
Computing Bering Strait–Chukchi Sea correlations from the lower resolution (~0.25°) SODA3 ocean reanalysis produces similar patterns in terms of the sign but with different spatial scales and higher magnitudes (compare Figure 8 and Figure 9).
In the low-resolution SODA3, the SSS response correlated with Bering Strait transport anomaly components, v h Δ S and v w Δ S , also concentrates along the northern coast of Chukotka (Figure 9a,b). It has a larger magnitude than in the higher-resolution RARE1 and extends farther into the western Chukchi Sea interior (compare with Figure 8a,b). These patterns are more consistent with the “eastern” and “western” types of SSS distribution suggested in [18]. Linear regression between v Δ S and Chukchi Sea box-averaged SSSA explains ~16% of box-averaged SSSA variance, whereas the regression with v S is not statistically significant due to the compensating contribution of SSSA from eastern and western parts of the Chukchi Sea (Figure 9c, Table 1).
Correlation patterns similar to those based on the GFDL MOM ocean model (Figure 8 and Figure 9) are also present in some other regional [10] and global models [18]. In particular, Appendix D illustrates results based on the ECMWF ocean analysis-reanalysis system (ORA5S). The ORA5S is based on the Nucleus for European Modelling of the Ocean (NEMO v3.4.1) ocean model coupled to the LIM2 sea-ice model and the NEMOVAR ocean assimilation system [41]. These latter results confirm the presence of the response along the northeastern Chukotka coast, including some indications of the fresh response to positive v S variations.

4. Discussions

Salty Bering Strait inflow to the fresher Chukchi Sea is a key mechanism for maintaining relatively high salinity in this marginal sea. This has significant implications for its freshwater balance, sea ice coverage, and ecosystem dynamics. This inflow is part of the global ocean circulation, and further research into its driving mechanisms is critical. This study focuses on new insights that may be gained from remote sensing data, such as altimeter sea surface height (SSH), satellite sea surface salinity (SSS), and atmospheric reanalyses.
This study shows that spatially resolving satellite maps are applicable in ice-free summer conditions for monitoring SSS and, thus, near-surface water masses in the Chukchi Sea. Their constituents largely affect the rich Chukchi Sea ecosystem and are determined by partitioning among Pacific water inflow from the Bering Sea, East Siberian Sea water transport in the SSC, and meltwater advection from the ice edge. It is shown that in interannual periods, the above water mass changes are wind-driven and thus interrelated. In turn, this opens a question of how secular ice retreat and larger open ocean exposure to the atmosphere may project on Arctic winds and their effect on water mass exchanges in the Chukchi Sea and adjacent areas. Also, the attribution of the observed acceleration of Bering Strait inflow [2] and its impact on Chukchi Sea ecosystem dynamics are still debatable.
Can satellite SSS be used in the Chukchi Sea? The applicability of satellite SSS in high-latitude marginal cold seas is still debatable due to low salinity-signal sensitivity over cold SST and land contamination of L-band microwave signals. However, the SSS variability in the Arctic is rather strong ( ~ 1 psu), making it easier to detect [22] and apply for liquid freshwater content analyses [42]. Like in in situ observations, the time mean distribution of satellite SSS in the Chukchi Sea (Figure 1a) differs significantly from the surrounding ice-free Arctic, where the SSS is fresher by at least a few psu than the SSS in the Chukchi Sea. Such SSS distribution is linked to the salty inflow of Pacific summer waters (BSW, in particular) that maintains a relatively salty regime in this marginal sea. Bering Strait inflow carries not only salty BSW along the western side of the Strait but also fresh ACW along the eastern side of the Strait. Its northward progression in the ACC (Figure 1e) is reflected in somewhat fresher SSS along the Alaska coast (compared to the interior Chukchi Sea, Figure 1a). The SSS is also relatively fresh along the northern coast of Chukotka. This intrusion of fresh coastal water is associated with the SCC (Figure 1e), which transports fresh/cold water from Siberian coastal areas west of the Chukchi Sea [16].
This study makes use of several satellite SSS datasets. The primary dataset is the global monthly SSS from the Soil Moisture Active Passive (SMAP) mission (version 6.0) available since 2015. During the generally ice-free September–October timeframe, the Chukchi Sea-wide anomalous SSS reveals similar temporal variations among the five major satellite products (Figure 2a). This anomalous SSS is compared with the in situ temporally collocated thermosalinograph data along the central Chukchi Sea meridional transects. General consistency among SSS variations derived from different satellite SSS products and their appropriate comparison with in situ salinity data demonstrate the applicability of satellite SSS to this high-latitude cold SST region.
During satellite SSS recordings since 2010, the strongest salty anomalies were seen in 2014 and 2015, while fresher conditions were found in 2010, 2016, 2018, 2021, and 2023. During the SMAP satellite mission period (since 2015), Chukchi Sea salty conditions in September 2015 and fresh conditions in 2016, 2018, and 2023 correlate with the prior months’ (May–August) Chukchi Sea altimeter SSH low and high, respectively (negative delayed correlation, Figure 2 and Figure 3). The May–August annual period for the ‘forcing’ terms starts from the Chukchi Sea re-stratification in May [14] and precedes the minimal ice coverage in September. Variations of May–August Bering Strait volume transport inferred from altimeter geostrophic currents accounts for approximately 40 % of the variance of September satellite-observed SSSA averaged over the Chukchi Sea box. Such a modest percentage of the explained variance is related to complex patterns of salinity response within the large Chukchi Sea box, as well as contributions from other factors. In particular, the 2021 early autumn fresh event in the Chukchi Sea was associated with an abnormal southward shift of the ice edge and its associated meltwater source [20].
Which physical factors govern variations in Bering Strait inflow? The negative temporally lagged correlation between SSH and resulting SSS in the Chukchi Sea highlights the role of the Pacific-to-Arctic pressure head as a driving mechanism of the Bering Strait volume transport, with reduced transport during SSH high conditions in the Chukchi Sea and fresher SSS there. The pressure head proxy (estimated from SSH anomaly averaged over the Chukchi Sea box) explains around 41 % of the May–August Bering transport interannual anomaly, whereas the strength of local meridional winds over the Strait (derived from ERA5 data) accounts for ~ 16 % . During the satellite altimeter period (since 1993), the pressure head is dominated by an SSH anomaly in the Chukchi Sea.
The variability of the summer Bering Strait transport is largely wind-driven. Its driving factors include the along-Strait (meridional) winds and the Chukchi Sea-wide SSH (pressure head). The latter factor is correlated with an Arctic Oscillation-like summer atmospheric pressure pattern that drives the strength of zonal winds over the northern Chukchi Sea and, thus, the meridional Ekman transport that is balanced by the meridional SSH gradient in this semi-enclosed estuary [7]. During summer months, the time series of the latter atmospheric pattern only modestly correlates with the time series of the Arctic Oscillation index [10], a pattern known for higher variability in winter.
What do models tell about Bering Strait–Chukchi Sea connections? Given that satellite observations of SSS are still time-limited (only since 2010), two 42-year-long ocean reanalyses (high-resolution RARE1 and lower-resolution SODA3) are used to attribute the interannual variability of Bering Strait salinity in-flow to the interannual variability of downstream salinity in the Chukchi Sea and to compare with observations. Aside from their longer timespan, models allow us to estimate the influence of Bering Strait salinity flux (rather than volume transport), a parameter that is not currently available from remote sensing measurements.
Model Bering Strait salinity transport, v Δ S , is estimated at 65.75°N and linearly decomposed into a sum of transport-related and salinity-related terms, v Δ S + v S , with the characteristic Bering Strait–Chukchi Sea salinity difference, Δ   S 1 psu. The first term, v Δ S , represents a volume transport anomaly acting on the mean Δ S . The second term, v S , represents a Bering Strait salinity anomaly acting on the mean volume transport; the term is still not inferable from remote-sensing SSS.
High-resolution RARE1. In distinction from the time-mean Chukchi Sea SSS distribution in Figure 1, which shows a connection with the salty Bering Strait inflow, the model SSS response to Bering Strait variations is weak on interannual scales in the central and eastern Chukchi Sea (Figure 8a,b). The SSS pattern correlated with the Bering Strait transport anomaly, v Δ S , concentrates along the northern coast of Chukotka. This pattern is an indirect indicator of v Δ S , as it is induced by the same wind forcing (but not directly by Bering Strait variability) through an upwelling-like response along the northern Chukotka that modifies the local SSS via vertical exchanges [10] and lateral SCC transport changes [18]. In distinction from the observations where the variations of Bering Strait geostrophic velocity explain about 40 % of the observed satellite SSSA variance within the Chukchi Sea box (Figure 4), the model salinity flux component, v Δ S , explains only 11 % of the variance of model SSSA averaged over the Chukchi Sea box due to the coastally trapped SSS response patterns (Figure 8a,b) and weak SSS response over much of the Chukchi Sea box.
The salt flux anomaly component due to changes in the salinity of Bering Strait inflow, v S , is positively correlated with the downstream SSS anomaly in the central and eastern Chukchi Sea (Figure 8c). Its magnitude increases by ~ 50 % at mid-depths in comparison to the surface value. Positively correlated SSS anomalies in the interior Chukchi Sea develop along with negatively correlated anomalies along coastal Chukotka (Figure 8c). The two anomalies of different signs cancel each other out if averaging over the large Chukchi Sea box. This results in a statistically insignificant correlation between v S and SSSA averaged over the Chukchi Sea box (Table 1).
Low-resolution SODA3. Like in the high-resolution RARE1, the SSS response correlated with the Bering Strait transport anomaly, v Δ S , concentrates along the northern coast of Chukotka. In the low-resolution SODA3, this coastal response has a larger magnitude than in the higher-resolution RARE1 and extends farther into the Chukchi Sea interior (Figure 9a,b). Linear regression between v Δ S and Chukchi Sea box-averaged SSSA explains ~16% of box-averaged SSSA variance, whereas the regression with v S is not statistically significant due to the compensating contribution of SSSA from eastern and western parts of the Chukchi Sea (Figure 9c).
The models help to explain only a moderate level of the Bering Strait–Chukchi Sea correlation as a result of the spatially inhomogeneous response of Chukchi Sea SSSA correlated with Strait transport variations. However, apparent differences between observation- and model-derived statistics suggest a need for longer observations and additional models. However, ocean data assimilation approaches in the Arctic sector face great challenges due to apparent disconnects between the density of existing observations and the need for high-resolution modeling resolving coastal jets with characteristic widths comparable to the high-latitude baroclinic Rossby radius of deformation.
5. Conclusions

The examination of observed and modeled Chukchi Sea near-surface salinity response to changes in the upstream Bering Strait transport shows the following:
  • The time-mean distribution of satellite SSS in the Chukchi Sea differs significantly from the surrounding ice-free Arctic, where the SSS is fresher by at least a few psu. Such surface salinity conditions are linked to the salty inflow through the Bering Strait. The skill of satellite SSS for the detection of interannual variations in the Chukchi Sea is validated by comparisons with in situ collocated thermosalinograph data. During satellite SSS recordings since 2010, the strongest salty anomalies were seen in 2014 and 2015, while fresher conditions were found in 2010, 2016, 2018, 2021, and 2023.
  • Chukchi Sea salty and fresh conditions in September correlate with the prior months’ (May–August) Chukchi Sea altimeter SSH low and high, respectively (negative delayed correlation). The May–August annual period for the ‘forcing’ terms starts from the Chukchi Sea re-stratification in May and precedes the minimal ice coverage in September. The negative temporally lagged correlation between SSH and resulting SSS in the Chukchi Sea highlights the role of the Pacific-to-Arctic pressure head as an important driving mechanism of the Bering Strait volume transport, with reduced transport during SSH high conditions in the Chukchi Sea and fresher SSS there. Variations of the May–August Bering Strait volume transport inferred from altimeter geostrophic currents accounts for approximately 40 % of the variance of the September satellite-observed Chukchi Sea-wide SSS anomaly. Such a modest percentage of the explained variance is related to complex patterns of salinity response within the Chukchi Sea, as well as to possible contributions from other factors.
  • Given the differences between model-based and remote-sensing-based assessments of linkages between salinity anomalies in the Chukchi Sea and Bering Strait anomalies, both longer observations and improved high-resolution modeling are required. The coming Copernicus Imaging Microwave Radiometer (CIMR, https://sentinels.copernicus.eu/web/sentinel/copernicus/cimr) mission with expected better noise characteristics and improved SSS retrieval accuracy (compared to the SMAP mission) may be a breakthrough for Arctic salinity surveys.

Author Contributions

All authors discussed and developed the paper. S.A.G. conducted the final editing. All authors have read and agreed to the published version of the manuscript.

Funding

Supported by the NASA Ocean Surface Salinity Team (OSST).

Data Availability Statement

All data are available as outlined in the Materials and Methods Section.

Acknowledgments

We are grateful to JAMSTEC, which made its TSG data available to us.

Conflicts of Interest

The authors declare no conflicts of interest.

Appendix A

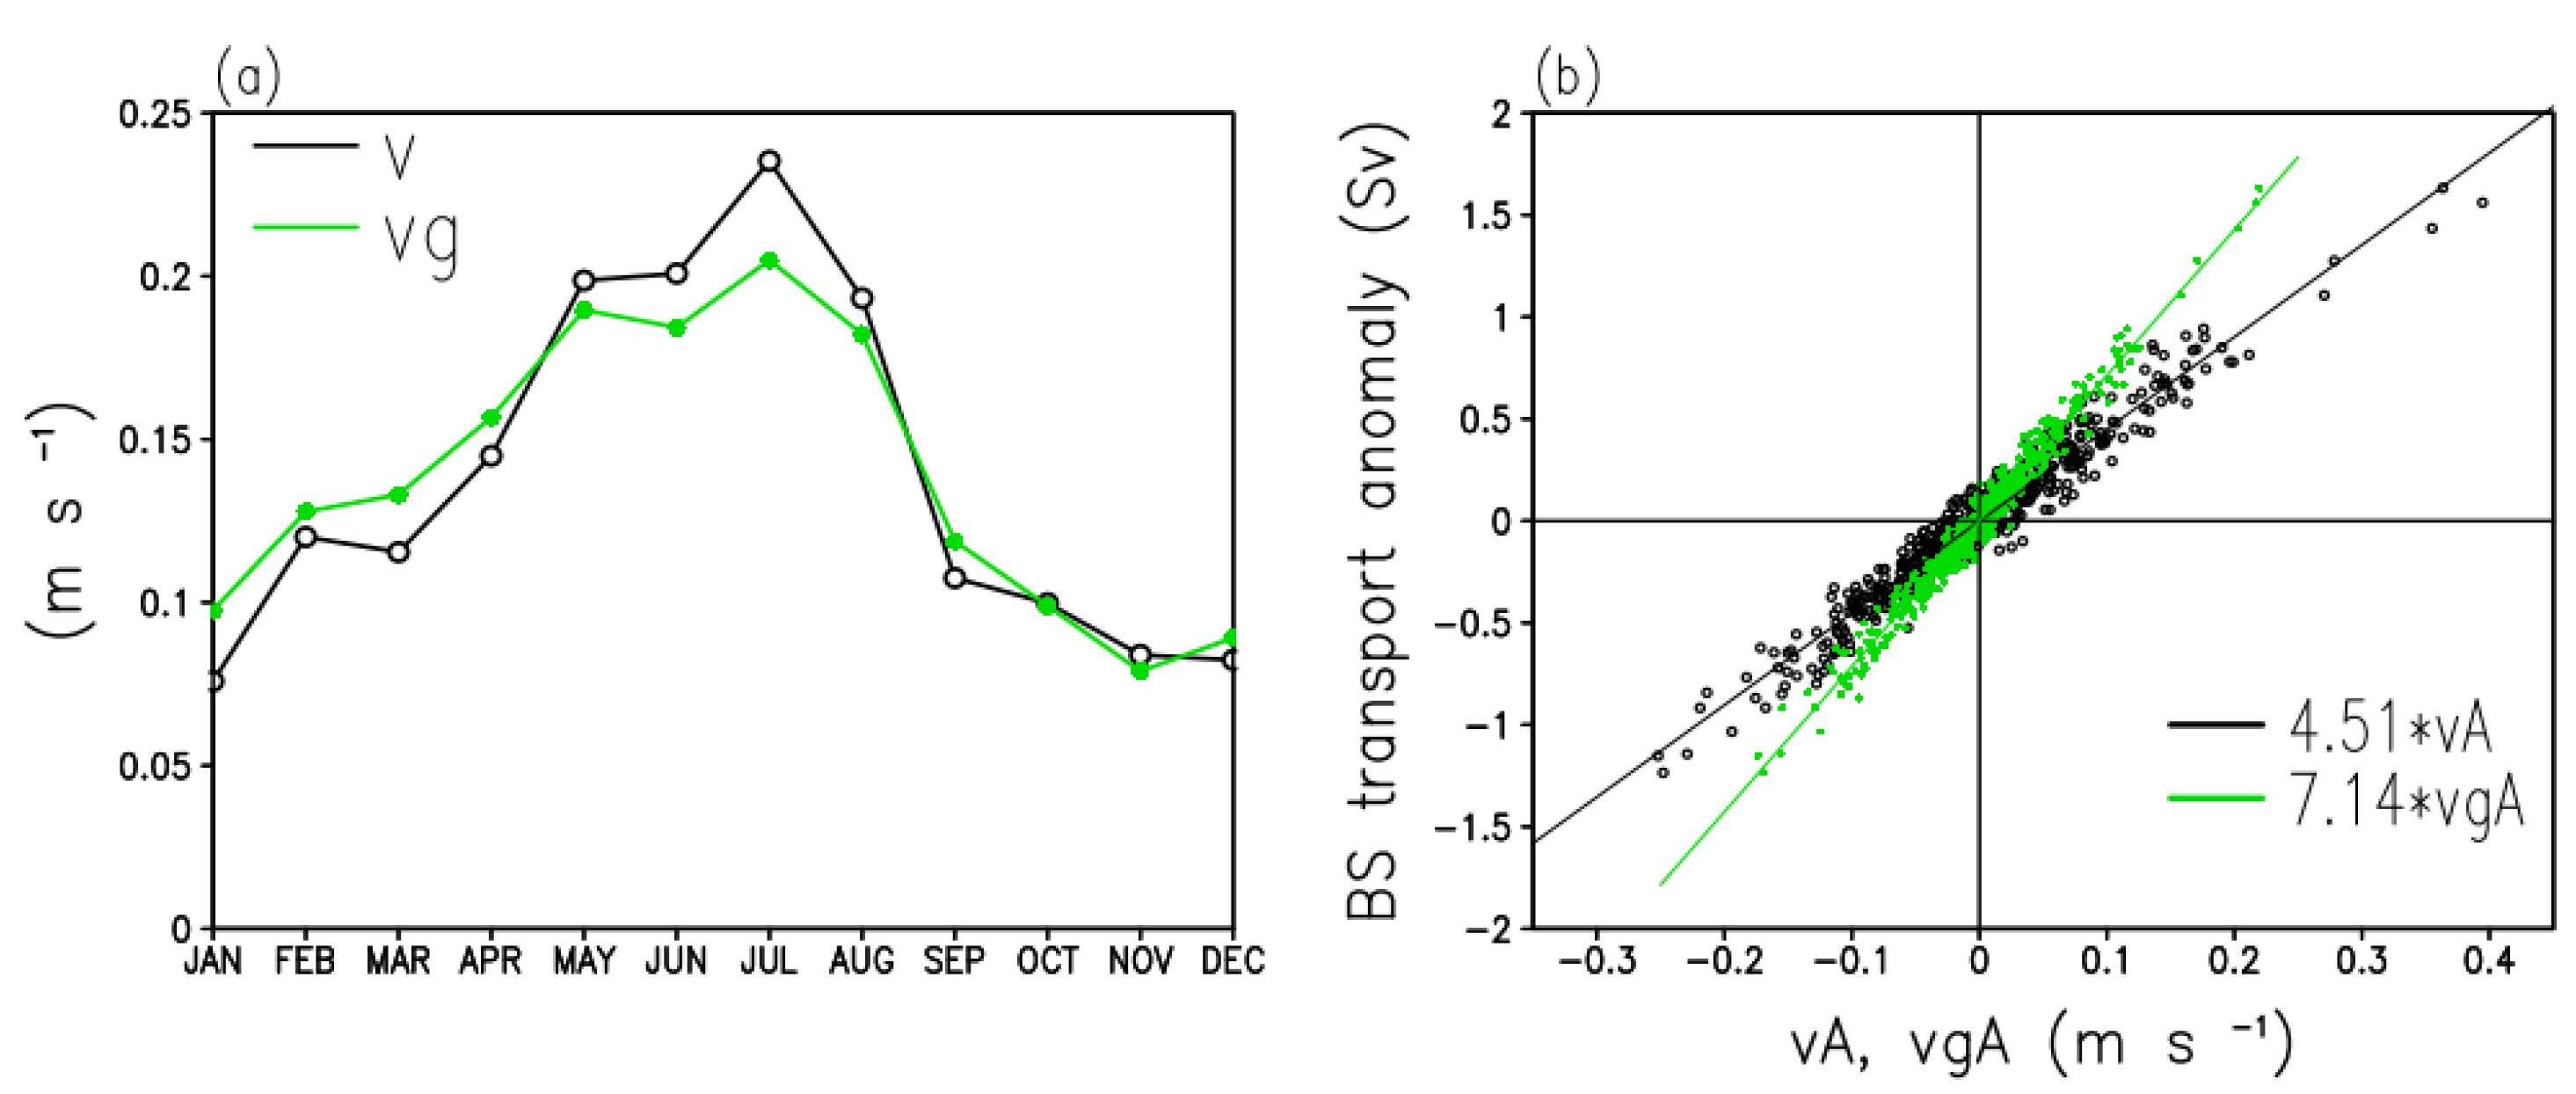
Seasonal cycles of the total ( v ) and geostrophic ( v g ) northward surface velocity from the 42-year RARE1.15.2 ocean reanalysis are close (Figure A1a). The remaining difference between the two is consistent with the seasonal cycle of winds over the Bering Strait, with northerly/southerly winds intensifying in winter/summer, respectively.
Figure A1. (a) Seasonal cycle of total ( v ) and geostrophic ( v g ) at the surface averaged across Bering Strait along 65.75N. (b) Scatter diagram of Bering Strait volume transport anomaly with total ( v A ) and geostrophic ( v g A ) monthly anomalies. Because both velocity anomalies are linearly correlated with Bering Strait (BS) transport anomalies, they also are mutually correlated, v g A = 0.63 v A .
Remotesensing 16 03397 g0a1
Both monthly velocity anomalies, v A and v g A , are highly temporally correlated with concurrent Bering Strait transport anomalies (TCORR 0.98 ), Figure A1b). Hence, using observed geostrophic velocity anomaly ( v g A ) instead of total velocity anomaly ( v A ) as an indicator of a transport anomaly seems reasonable because the two monthly velocity anomalies are linearly related, v g A 0.63 v A .

Appendix B

Spatial patterns of the MSLP corresponding to winter (November–February, Figure A2a) and summer (May–August, Figure A2b) periods are calculated by regressing winter and summer AO index time series on anomalous MSLP, respectively. Note that the magnitude of MSLP variability in winter exceeds that in summer. While the winter spatial pattern (Figure A2a) is close to the original AO pattern, with a slight shift toward the eastern Arctic, the summer pattern is shifted toward the western Arctic. Although the summer patterns resemble those in Figure 6a, the scatter between summer AO index values and summer Chukchi Sea SSHA is essential (Figure A2c), with only a moderate correlation between the two, (~0.42). Such behavior is expected because the classical AO pattern is dominated by winter MSLP variability in the Arctic sector [9]. Therefore, the local details of winds over the western Arctic Ocean are important and not fully accounted for by climatic indices like the AO.
Figure A2. Regression of (a) winter (November–February) and (b) summer (May–August) AO index with ERA5 monthly MSLPA. MSLP values correspond to one standard deviation of AO index during winter and summer months. Note the difference in color scale limits between (a,b). (c) Scatter diagram of summer sea level anomaly averaged over the Chukchi Sea box (Figure 1c) and AO index.
Remotesensing 16 03397 g0a2

Appendix C

Figure A3 shows May–August sea level anomalies temporally correlated with Bering Strait salinity flux anomaly components, v Δ S and v S , from the RARE1 ocean model.
Figure A3. Time regression of May–August Bering Strait salinity flux anomaly components, (a) v Δ S and (b) v S , on concurrent de-trended SSH anomalies. Magnitudes correspond to one standard deviation of the respective salinity flux component.
Remotesensing 16 03397 g0a3
Bering Strait transport increase, v Δ S , is forced either by easterly anomalous winds over the Chukchi Sea (via the pressure head) or southerly anomalous winds over the Strait. Both wind patterns cause upwelling along the northern coast of Chukotka and, thus, decrease SSH there (Figure A3a). This coastal upwelling and the related SSC deceleration cause the coastal salinification due to the stable haline stratification and decreased freshwater horizontal transport in the SSC (Figure 8a,b). Figure A3a also suggests a local SSH high along the Alaska coast, in turn suggesting more freshwater inflow in the ACC. A combination of salty water inflow increase across the western Bering Strait with freshwater inflow increase across the eastern Bering Strait may cause compensating salinity anomalies downstream and be responsible for weak SSS anomalies in the central-eastern Chukchi Sea in Figure 8a,b.
The SSH pattern correlated with the v S component depicts an SSH low along the Alaska coast, suggesting that an anomalous salty inflow is related to decreased ACW inflow (Figure A3b). In contrast, an SSH high is formed along the northern Chukotka, which is indicative of a depressed coastal upwelling and accelerated SSC. Either of these two factors leads to the local water freshening and causes a dipole-like SSSA pattern in Figure 8c.

Appendix D

Here, the results of Section 3.4 (which are based on the GFDL MOM ocean model) are compared with results based on the ECMWF ocean analysis-reanalysis system (ORA5S). It is based on the Nucleus for European Modelling of the Ocean (NEMO v3.4.1) ocean model coupled to the LIM2 sea-ice model and the NEMOVAR ocean assimilation system, with ~25 km spatial resolution in the tropics increasing to 9 km in the Arctic [41]. For convenience, ORA5S fields interpolated on a regular 1 × 1 degree grid are used (https://icdc.cen.uni-hamburg.de/thredds/catalog/ftpthredds/EASYInit/oras5/r1x1/catalog.html, accessed on 1 August 2024). Only the consolidated data (1979–2014) forced by the ERA-I from the model control run are used. Although different in many aspects from MOM-based results, these latter NEMO-based results suggest a similar response along the northeastern Chukotka coast, including some indications of the fresh response to positive v S variations. However in the ORA5S, the latter signal is not as indicative as in MOM-based simulations (compare Figure A4 with Figure 8 and Figure 9).
Figure A4. The same as in Figure 8 but for ORA5S reanalysis based on the NEMO ocean model.
Remotesensing 16 03397 g0a4
Atmospheric mean sea level pressure anomaly regression with v S (Figure A5) shows that variations in Bering Strait salinity are caused by zonal shifts in the Aleutian Low, with positive salinity variations corresponding to eastward shifts. Such eastward shifts result in an MSLP anomaly high over the Bering Sea and associated anomalous anticyclonic winds. Northerly wind anomalies along the Alaska coast strengthen coastal upwelling (Figure A3b), decelerate the ACC, and decrease its fresh transport. There are also indications of a strengthening of westerly winds over the Chukchi Sea. These anomalous westerlies accelerate the SCC and, thus, lead to a freshening along the northeastern Chukotka.
Figure A5. Time regression of May–August Bering Strait salinity flux anomaly component, v S , on concurrent atmospheric mean sea level pressure anomaly. Magnitude corresponds to one STD of v S .
Remotesensing 16 03397 g0a5
The relationship between the saltier Bering Strait inflow and the fresher Siberian Coastal Current needs further evaluation based on a wider ensemble of ocean models.

References

  1. Grebmeier, J.M.; Cooper, L.W.; Feder, H.M.; Sirenko, B.I. Ecosystem dynamics of the Pacific-influenced Northern Bering and Chukchi Seas in the Amerasian Arctic. Prog. Oceanogr. 2006, 71, 331–361. [Google Scholar] [CrossRef]
  2. Woodgate, R.A. Increases in the Pacific inflow to the Arctic from 1990 to 2015, and insights into seasonal trends and driving mechanisms from year-round Bering Strait mooring data. Prog. Oceanogr. 2018, 160, 124–154. [Google Scholar] [CrossRef]
  3. Brugler, E.T.; Pickart, R.S.; Moore, G.W.K.; Roberts, S.; Weingartner, T.J.; Statscewich, H. Seasonal to interannual variability of the Pacific water boundary current in the Beaufort Sea. Prog. Oceanogr. 2014, 127, 1–20. [Google Scholar] [CrossRef]
  4. Shtokman, V.B. Influence of wind on currents in Bering Strait, the causes of their high speeds and predominantly northerly direction. Trans. Inst. Oceanol. Acad. Sci. USSR 1957, 25, 171–197. [Google Scholar]
  5. Stigebrandt, A. The North Pacific: A Global-Scale Estuary. J. Phys. Oceanogr. 1984, 14, 464–470. [Google Scholar] [CrossRef]
  6. Gong, D.; Pickart, R.S. Summertime circulation in the eastern Chukchi Sea. Deep Sea Res. Part II Top. Stud. Oceanogr. 2015, 118, 18–31. [Google Scholar] [CrossRef]
  7. Peralta-Ferriz, C.; Woodgate, R.A. The Dominant Role of the East Siberian Sea in Driving the Oceanic Flow Through the Bering Strait—Conclusions From GRACE Ocean Mass Satellite Data and In Situ Mooring Observations Between 2002 and 2016. Geophys. Res. Lett. 2017, 44, 11472–11481. [Google Scholar] [CrossRef]
  8. Serreze, M.C.; Barrett, A.P.; Crawford, A.D.; Woodgate, R.A. Monthly Variability in Bering Strait Oceanic Volume and Heat Transports, Links to Atmospheric Circulation and Ocean Temperature, and Implications for Sea Ice Conditions. J. Geophys. Res. Ocean. 2019, 124, 9317–9337. [Google Scholar] [CrossRef]
  9. Thompson, D.W.J.; Wallace, J.M. The Arctic oscillation signature in the wintertime geopotential height and temperature fields. Geophys. Res. Lett. 1998, 25, 1297–1300. [Google Scholar] [CrossRef]
  10. Zhang, W.; Wang, Q.; Wang, X.; Danilov, S. Mechanisms Driving the Interannual Variability of the Bering Strait Throughflow. J. Geophys. Res. Ocean. 2020, 125, e2019JC015308. [Google Scholar] [CrossRef]
  11. Danielson, S.L.; Weingartner, T.J.; Hedstrom, K.S.; Aagaard, K.; Woodgate, R.; Curchitser, E.; Stabeno, P.J. Coupled wind-forced controls of the Bering–Chukchi shelf circulation and the Bering Strait throughflow: Ekman transport, continental shelf waves, and variations of the Pacific–Arctic sea surface height gradient. Prog. Oceanogr. 2014, 125, 40–61. [Google Scholar] [CrossRef]
  12. Woodgate, R.A.; Aagaard, K.; Weingartner, T.J. Monthly temperature, salinity, and transport variability of the Bering Strait through flow. Geophys. Res. Lett. 2005, 32, L04601. [Google Scholar] [CrossRef]
  13. Tian, F.; Pickart, R.S.; Lin, P.; Pacini, A.; Moore, G.W.K.; Stabeno, P.; Weingartner, T.; Itoh, M.; Kikuchi, T.; Dobbins, E.; et al. Mean and Seasonal Circulation of the Eastern Chukchi Sea From Moored Timeseries in 2013–2014. J. Geophys. Res. Ocean. 2021, 126, e2020JC016863. [Google Scholar] [CrossRef]
  14. Spall, M.A. Circulation and water mass transformation in a model of the Chukchi Sea. J. Geophys. Res. 2007, 112, C05025. [Google Scholar] [CrossRef]
  15. Stabeno, P.; Kachel, N.; Ladd, C.; Woodgate, R. Flow Patterns in the Eastern Chukchi Sea: 2010–2015. J. Geophys. Res. Ocean. 2018, 123, 1177–1195. [Google Scholar] [CrossRef]
  16. Weingartner, T.J.; Danielson, S.; Sasaki, Y.; Pavlov, V.; Kulakov, M. The Siberian Coastal Current: A wind- and buoyancy-forced Arctic coastal current. J. Geophys. Res. Ocean. 1999, 104, 29697–29713. [Google Scholar] [CrossRef]
  17. Lellouche, J.-M.; Le Galloudec, O.; Regnier, G.; Levier, B.; Greiner, E.; Drévillon, M. Quality Information Document for Global Sea Physical Analysis and Forecasting Product. Copernicus Marine Environmental Monitoring Service Report CMEMS-GLO-QUID-001-024. 2019. Available online: https://catalogue.marine.copernicus.eu/documents/QUID/CMEMS-GLO-QUID-001-027.pdf (accessed on 1 August 2024).
  18. Zhuk, V.R.; Kubryakov, A.A. Interannual Variability of Salinity in the Chukchi Sea and Its Relationships with the Dynamics of the East Siberian Current during 1993–2020. Remote Sens. 2023, 15, 5648. [Google Scholar] [CrossRef]
  19. Supply, A.; Boutin, J.; Kolodziejczyk, N.; Reverdin, G.; Lique, C.; Vergely, J.-L.; Perrot, X. Meltwater Lenses Over the Chukchi and the Beaufort Seas During Summer 2019: From In Situ to Synoptic View. J. Geophys. Res. Ocean. 2022, 127, e2021JC018388. [Google Scholar] [CrossRef]
  20. Grodsky, S.A.; Reul, N.; Bentamy, A.; Vandemark, D. Anomalously fresh Chukchi Sea surface salinity in summer-autumn 2021. Remote Sens. Lett. 2023, 14, 135–147. [Google Scholar] [CrossRef]
  21. Reul, N.; Grodsky, S.A.; Arias, M.; Boutin, J.; Catany, R.; Chapron, B.; D’Amico, F.; Dinnat, E.; Donlon, C.; Fore, A.; et al. Sea surface salinity estimates from spaceborne L-band radiometers: An overview of the first decade of observation (2010–2019). Remote Sens. Environ. 2020, 242, 111769. [Google Scholar] [CrossRef]
  22. Fournier, S.; Lee, T.; Tang, W.; Steele, M.; Olmedo, E. Evaluation and Intercomparison of SMOS, Aquarius, and SMAP Sea Surface Salinity Products in the Arctic Ocean. Remote Sens. 2019, 11, 3043. [Google Scholar] [CrossRef]
  23. Supply, A.; Boutin, J.; Vergely, J.-L.; Kolodziejczyk, N.; Reverdin, G.; Reul, N.; Tarasenko, A. New insights into SMOS sea surface salinity retrievals in the Arctic Ocean. Remote Sens. Environ. 2020, 249, 112027. [Google Scholar] [CrossRef]
  24. Vazquez-Cuervo, J.; Gentemann, C.; Tang, W.; Carroll, D.; Zhang, H.; Menemenlis, D.; Gomez-Valdes, J.; Bouali, M.; Steele, M. Using Saildrones to Validate Arctic Sea-Surface Salinity from the SMAP Satellite and from Ocean Models. Remote Sens. 2021, 13, 831. [Google Scholar] [CrossRef]
  25. Boutin, J.; Martin, N.; Kolodziejczyk, N.; Reverdin, G. Interannual anomalies of SMOS sea surface salinity. Remote Sens. Environ. 2016, 180, 128–136. [Google Scholar] [CrossRef]
  26. Lee, T. Consistency of Aquarius sea surface salinity with Argo products on various spatial and temporal scales. Geophys. Res. Lett. 2016, 43, 3857–3864. [Google Scholar] [CrossRef]
  27. Grodsky, S.; Vandemark, D.; Feng, H. Assessing Coastal SMAP Surface Salinity Accuracy and Its Application to Monitoring Gulf of Maine Circulation Dynamics. Remote Sens. 2018, 10, 1232. [Google Scholar] [CrossRef]
  28. Kodaira, T.; Waseda, T.; Nose, T.; Inoue, J. Record high Pacific Arctic seawater temperatures and delayed sea ice advance in response to episodic atmospheric blocking. Sci. Rep. 2020, 10, 20830. [Google Scholar] [CrossRef]
  29. Pisareva, M.N.; Pickart, R.S.; Spall, M.A.; Nobre, C.; Torres, D.J.; Moore, G.W.K.; Whitledge, T.E. Flow of pacific water in the western Chukchi Sea: Results from the 2009 RUSALCA expedition. Deep Sea Res. Part I Oceanogr. Res. Pap. 2015, 105, 53–73. [Google Scholar] [CrossRef]
  30. Ford, V.L.; Frauenfeld, O.W. Arctic precipitation recycling and hydrologic budget changes in response to sea ice loss. Glob. Planet. Change 2022, 209, 103752. [Google Scholar] [CrossRef]
  31. Meissner, T.; Manaster, A. SMAP Salinity Retrievals near the Sea-Ice Edge Using Multi-Channel AMSR2 Brightness Temperatures. Remote Sens. 2021, 13, 5120. [Google Scholar] [CrossRef]
  32. Melnichenko, O.; Hacker, P.; Maximenko, N.; Lagerloef, G.; Potemra, J. Optimum interpolation analysis of Aquarius sea surface salinity. J. Geophys. Res. Ocean. 2016, 121, 602–616. [Google Scholar] [CrossRef]
  33. Hersbach, H.; Bell, B.; Berrisford, P.; Hirahara, S.; Horányi, A.; Muñoz-Sabater, J.; Nicolas, J.; Peubey, C.; Radu, R.; Schepers, D.; et al. The ERA5 global reanalysis. Q. J. R. Meteorol. Soc. 2020, 146, 1999–2049. [Google Scholar] [CrossRef]
  34. Carton, J.A.; Chepurin, G.A. RARE: The Regional Arctic Reanalysis. J. Clim. 2023, 36, 2333–2348. [Google Scholar] [CrossRef]
  35. Carton, J.A.; Chepurin, G.A.; Chen, L. SODA3: A New Ocean Climate Reanalysis. J. Clim. 2018, 31, 6967–6983. [Google Scholar] [CrossRef]
  36. Levin, J.C.; Grodsky, S.A.; Vandemark, D.; Wilkin, J.L. Haline Control of Unusually Deep Winter Mixing in the Gulf of Maine Investigated Using a Regional Data-Assimilative Model. J. Geophys. Res. Ocean. 2022, 127, e2021JC018281. [Google Scholar] [CrossRef]
  37. She, J.; Muñiz Piniella, Á.; Benedetti-Cecchi, L.; Boehme, L.; Boero, F.; Christensen, A.; Crowe, T.; Darecki, M.; Nogueira, E.; Gremare, A.; et al. An Integrated Approach to Coastal and Biological Observations. Front. Mar. Sci. 2019, 6, 314. [Google Scholar] [CrossRef]
  38. Foltz, G.R.; Grodsky, S.A.; Carton, J.A.; McPhaden, M.J. Seasonal salt budget of the northwestern tropical Atlantic Ocean along 38° W. J. Geophys. Res. Ocean. 2004, 109, C03052. [Google Scholar] [CrossRef]
  39. Cherniawsky, J.Y.; Crawford, W.R.; Nikitin, O.P.; Carmack, E.C. Bering Strait transports from satellite altimetry. J. Mar. Res. 2005, 63, 887–900. [Google Scholar] [CrossRef]
  40. Mizobata, K. Reconstruction of Bering Strait volume transport suggesting the contribution of Bering Sea continental shelf to the pressure head forcing. Polar Sci. 2021, 27, 100560. [Google Scholar] [CrossRef]
  41. Zuo, H.; Balmaseda, M.A.; Tietsche, S.; Mogensen, K.; Mayer, M. The ECMWF operational ensemble reanalysis–analysis system for ocean and sea ice: A description of the system and assessment. Ocean Sci. 2019, 15, 779–808. [Google Scholar] [CrossRef]
  42. Umbert, M.; De Andrés, E.; Sánchez, M.; Gabarró, C.; Hoareau, N.; González-Gambau, V.; García-Espriu, A.; Olmedo, E.; Raj, R.P.; Xie, J.; et al. Contribution of satellite sea surface salinity to the estimation of liquid freshwater content in the Beaufort Sea. Ocean Sci. 2024, 20, 279–291. [Google Scholar] [CrossRef]
Figure 1. September climatological SSS and standard deviation of monthly SSS from (a,b) satellite SMAP data (2015–2024), (c,d) high-resolution RARE1 (1980–2021) ocean reanalysis, and (e,f) low-resolution SODA (1980–2015) ocean reanalysis. Anadyr Current (1), Alaska Coastal Current (2), and Siberian Coastal Current (3) are sketched in (e). Chukchi Sea (180–200°E, 66–73°N) and Bering Strait (190–192.5°E, 65–66.5°N) box areas are shown in (c).
Remotesensing 16 03397 g001
Figure 2. September–October SSS anomaly (SSSA) from (a) four different satellite salinity products averaged over the Chukchi Sea box and (b) TSG transects averaged over (65.5°–70°N, 170°–167°W) domain. Bars for different satellite products are shifted in (a) to avoid overlapping. X-ticks correspond to Jan. See Section 2 for description of satellite datasets. For each satellite dataset, the seasonal cycle of SSS is calculated based on the SMAP period since 2015.
Remotesensing 16 03397 g002
Figure 3. September (ai) SMAP SSS, (jr) ancillary SST from the Canada Meteorological Center (CMC) included in SMAP version 6.0. (szz) May–August de-trended multi-satellite sea level anomaly (SSHA).
Remotesensing 16 03397 g003
Figure 4. September SSS anomaly (SSSA) averaged over the Chukchi Sea box versus May–August along channel geostrophic velocity component ( v A ) averaged over the Bering Strait box from the AVISO all-satellite altimeter analysis. Each symbol represents the mean of up to five satellite datasets shown in Figure 2a, while vertical bars represent their STD. See Figure 1c for the locations of the two boxes. Symbol colors correspond to years. Linear regression (solid), S S S A = 0.11 0.03 0.19   v A explains ~40% of SSSA variance, where subscripts are the 95% confidence interval of the regression coefficient.
Remotesensing 16 03397 g004
Figure 5. (a) Spatial and (b) temporal parts of the leading EOF of May–August monthly de-trended SSH anomalies (SSHA) from satellite altimetry (1993–2023, ~53% of explained variance). EOF is computed for grid points with at least half of ice-free data. (c) SSHA averaged over the Chukchi Sea box (black in a, the same as in Figure 1c).
Remotesensing 16 03397 g005
Figure 6. Time regression of May–August anomalies of (a) Chukchi Sea SSHA, (b) Bering Strait northward wind ( V 10 A ) with atmospheric mean sea level pressure anomaly (MSLPA) elsewhere. (c,d) Time series of May–August mean SSHA and V 10 A . Values in (a,b) show MSLPA (mbar) corresponding to one STD of SSHA and V 10 A , respectively. Panel (c) is the same as in Figure 5c.
Remotesensing 16 03397 g006
Figure 7. Monthly (May–August) Bering Strait geostrophic velocity anomaly ( v A ) from satellite altimetry vs. (a) Bering Strait meridional wind anomaly ( V 10 A ) and (c) Chukchi Sea surface height anomaly (SSHA). Velocity anomaly components (b) due to wind ( v A w ), and (d) Chukchi Sea SSHA ( v A h ), which are calculated by subtracting signals linearly correlated with SSHA and V 10 A , respectively.
Remotesensing 16 03397 g007
Figure 8. Chukchi Sea SSS anomaly temporally regressed on BS salinity transport anomaly components due to (a) pressure head ( v h Δ S ), (b) meridional winds over the Strait ( v w Δ S ), and (c) salinity variations in the Strait ( v S ). Magnitudes correspond to one standard deviation of the respective Bering Strait forcing factor. Inlays show vertical profiles of salinity response in red (Chukotka) and blue (eastern Chukchi Sea) boxes shown in (c). Eastern box vertical profiles are not shown in (a,b) due to negligible response magnitudes. Data are from 1980–2021 RARE1 ocean reanalysis. Points with fewer than 20 examples of September ice-free data are blanked. The geographic grid is drawn with 10° and 5° intervals in longitude and latitude, respectively, starting from 170°E, 60°N.
Remotesensing 16 03397 g008
Figure 9. The same as in Figure 8 but for lower-resolution SODA3 reanalysis.
Remotesensing 16 03397 g009
Table 1. Characteristics of monthly Bering Strait inflow in RARE1 and SODA3 ocean data assimilation models and their relationship with SSS anomaly in the Chukchi Sea box.
Bering Strait Transport (Sv)STD
(Sv psu)
Regression Coefficient of Chukchi Sea SSSA (Sv−1) with
u Δ S u S u Δ S u S
RARE11.010.130.25 0.93 0.1 1.76 0.07 0.35 0.48
SODA31.250.150.25 1.47 0.35 2.59 0.14 0.47 0.76
Disclaimer/Publisher’s Note: The statements, opinions and data contained in all publications are solely those of the individual author(s) and contributor(s) and not of MDPI and/or the editor(s). MDPI and/or the editor(s) disclaim responsibility for any injury to people or property resulting from any ideas, methods, instructions or products referred to in the content.