Article

Correction of Ionospheric Phase in SAR Interferometry Considering Wavenumber Shift

1
Radar Technology Research Institute, School of Information and Electronics, Beijing Institute of Technology, Beijing 100081, China
2
National Key Laboratory of Space-Born Intelligent Information Processing, Beijing 100081, China
*
Author to whom correspondence should be addressed.
Remote Sens. 2024, 16(14), 2555; https://doi.org/10.3390/rs16142555
Submission received: 20 May 2024 / Revised: 5 July 2024 / Accepted: 11 July 2024 / Published: 12 July 2024

Abstract

:
The ionospheric effects in repeat-pass SAR interferometry (InSAR) have become a rising concern with the increasing interest in low-frequency SAR. The ionosphere will introduce serious phase errors in the interferogram, which should be properly corrected. In this paper, the influence of the wavenumber shift on the Range Split-Spectrum (RSS) method is analyzed quantitatively. It is shown that the split-spectrum processing deteriorates the coherence of the sub-band interferogram and then greatly reduces the estimation accuracy. The RSS method combined with common band filtering (CBF) can improve the coherence of sub-band interferograms and estimation accuracy, but the estimation is biased due to the RSS model mismatch. To address the problem, a modified truncated singular value decomposition (MTSVD) based multi-sub-band RSS method is proposed in this paper. The proposed method divides the range common spectrum into multiple sub-bands to jointly estimate the ionospheric phase. The performance of the proposed method is analyzed and validated based on simulation experiments. The results show that the proposed method has stronger robustness and higher accuracy.

1. Introduction

The spaceborne synthetic aperture radar interferometry (InSAR) technique has been widely used in the fields of topographic mapping, forestry research, and geological disaster monitoring with its high-accuracy measurement capability of digital height model (DEM) and surface deformation [1,2]. The inversion of atmospheric refraction parameters can effectively correct the phase errors caused by the troposphere [3,4]. However, the ionosphere will introduce serious phase errors in low-frequency interferograms, which hinders the realization of high-quality InSAR measurements. Correction of ionospheric effects in InSAR have become a rising concern with the increasing interest in low-frequency synthetic aperture radar (SAR) [5,6,7,8,9].
The Global Navigation Satellite System (GNSS) can measure the total electron content (TEC) directly by radio occultation technique [10]. However, due to the poor spatial resolution and accuracy, this method cannot be directly applied to correct the ionospheric effects in InSAR [11]. To correct the ionospheric effects in InSAR accurately, several ionosphere correction methods are proposed, and they can be roughly divided into three categories [12]: the Faraday rotation method [13,14], azimuth shift method [15,16], and range split-spectrum (RSS) method [17,18].
Firstly, the Faraday rotation method estimates the TEC value and the ionospheric phase from the Faraday rotation angle based on the anisotropic properties of the ionosphere. However, the Faraday rotation method requires full-polarization SAR data, which greatly limits the application of this method [14]. Secondly, the azimuth shift method can recover small-scale azimuth variations of the ionospheric phase screen (IPS) based on the approximate linear relationship between the IPS and the azimuth shift estimated by cross-correlation of SAR images or multiple-aperture interferometry (MAI) [15,16]. However, the azimuth shift method is unable to recover large-scale azimuth variations or range variations of the IPS, and the along-track ground displacements are coupled with ionospheric shifts [19]. Thirdly, the RSS method divides the spectrum of the radar signal in range direction into two sub-bands to separate the different frequency behavior of the dispersive and nondispersive components of the interferometric phase [17]. Due to the narrow bandwidth in low frequency, the estimation accuracy of the ionospheric phase is low, and many samples need to be averaged to increase the accuracy by applying a spatial filter [18]. The method can recover range variations IPS, but it is not sensitive to rapid changes of the ionosphere [19].
As some practical issues in the RSS method have been analyzed and solved [17], researchers have regained interest in the method. Moreover, the RSS method has been successfully applied to many different applications, including geodetic monitoring, natural hazard monitoring, and glacier motion [20,21]. However, the influence of wavenumber shift on the RSS method will cause serious errors, which cannot be neglected in some cases. In this paper, the influence of the wavenumber shift on the RSS method is analyzed quantitatively. It is shown that the split-spectrum processing without common band filter (CBF) deteriorates the coherence of sub-band interferograms sharply and then the estimation accuracy. The RSS method combined with CBF can improve the coherence of sub-band interferograms and estimation accuracy, but the estimation is biased due to the model mismatch. To address this problem and correct the ionospheric effects accurately and precisely, a modified truncated singular value decomposition (MTSVD) based multi-sub-band RSS method is proposed. Different from the traditional RSS method, which only uses the upper and lower sub-bands, the proposed method divides the range common spectrum into multiple sub-bands to jointly estimate the ionospheric phase, and the prior information of TEC, estimated by GNSS, is introduced to construct the regularization matrix and solve the ill-posed problem. The performance of the proposed method is analyzed and validated based on a simulation experiment. The results show that the proposed method has stronger robustness and higher accuracy.
The paper is organized as follows. In Section 2, the influence of wavenumber shift on the RSS method without and with CBF is analyzed, and a MTSVD-based multi-sub-band RSS method considering wavenumber shift is proposed to correct the ionospheric effects in InSAR. Simulation results are presented in Section 3 to demonstrate the performance of the proposed method. Finally, conclusions are drawn and discussed in Section 4.

2. Materials and Methods

2.1. Influence of Wavenumber Shift on RSS method without CBF

For repeat-pass InSAR, the interferogram formed from the reference and secondary acquisitions can be written as [22]
φ = φ n d + φ i o n o ,
and
φ n d = 4 π f 0 c r d + r g e o m + r t r o p ,
φ i o n o = 4 π K 0 c f 0 T E C ,
where φ n d is the nondispersive component including the deformation, geometric, and tropospheric delay. φ i o n o is the dispersive ionospheric phase, T E C = T E C 1 T E C 2 is the differential TEC value between the reference and secondary acquisition, f 0 is the carrier frequency, K 0 is a constant with the value of 40.28 m 3 / s 2 , and c is the speed of light in vacuum.
According to Equations (1)–(3), if we can obtain two InSAR interferograms at different carrier frequencies, then the dispersive ionospheric phase can be easily solved. As illustrated in Figure 1, the RSS method separates the range spectrum into non-overlapping sub-bands, and only the two most distant sub-bands are used to generate two interferograms at a higher and lower frequency, which can be expressed as [23]
φ H = φ n d f H f 0 + φ i o n o f 0 f H ,
φ L = φ n d f L f 0 + φ i o n o f 0 f L ,
where f H and f L are the center frequencies of the higher sub-band and lower sub-band, respectively. Then, the dispersive ionospheric term and the nondispersive term can be estimated as
φ ^ i o n o = f H f 0 f L f H f H 2 f L 2 φ L φ H f L f H ,
φ ^ n d = f 0 f H f H 2 f L 2 φ H φ L f L f H .
According to Equation (6), since the higher and lower interferograms are independent, the estimation accuracy of the ionospheric phase can be calculated by
σ φ i o n o = f H f 0 f L f H f H 2 f L 2 σ φ L 2 + σ φ H 2 f L f H 2 ,
where σ φ L and σ φ H are the phase variances of the low-band and high-band interferograms, respectively. If the phase variances of the sub-band interferograms are equal, Equation (8) can be rewritten as
σ φ i o n o f 0 2 f H f L 2 σ s u b b a n d .
Compared with the carrier frequency f 0 , the difference of the sub-band center frequency f H f L is small, which is usually less than one-hundredth of the carrier frequency f 0 , so the phase variance of sub-band interferograms will be amplified hundreds of times according to Equation (9). Fortunately, we can reduce the phase variances by multi-look processing to achieve acceptable estimation accuracy.
However, considering the different wavenumber shifts caused by different look angles, the same ground reflectivity spectrum corresponds to different frequency domains in the SAR signal spectrum [24]. As shown in Figure 2, the spectrum shift will introduce phase noise in the sub-band interferogram and reduce the coherence of the sub-band interferogram. Assuming that the coherence of the full-band interferogram is γ, then the coherence of the sub-band interferogram can be written as
γ b = 1 N b f B 1 f B γ , N b f < B ,
where N b = B / b is the split-spectrum factor, ∆f is the range spectrum shift caused by the wavenumber shift effect. Substituting Equation (10) into Equation (9), the estimation accuracy of the ionospheric phase can be rewritten as
σ φ i o n o = f 0 2 B N b 1 1 N b 1 N L 1 γ b 2 γ b 2 ,
where N L is the effective number of looks.

2.2. Influence of Wavenumber Shift on RSS Method with CBF

To increase the coherence of sub-bands and then the estimation accuracy of the ionospheric phase, the CBF is usually performed before the range spectrum split processing.
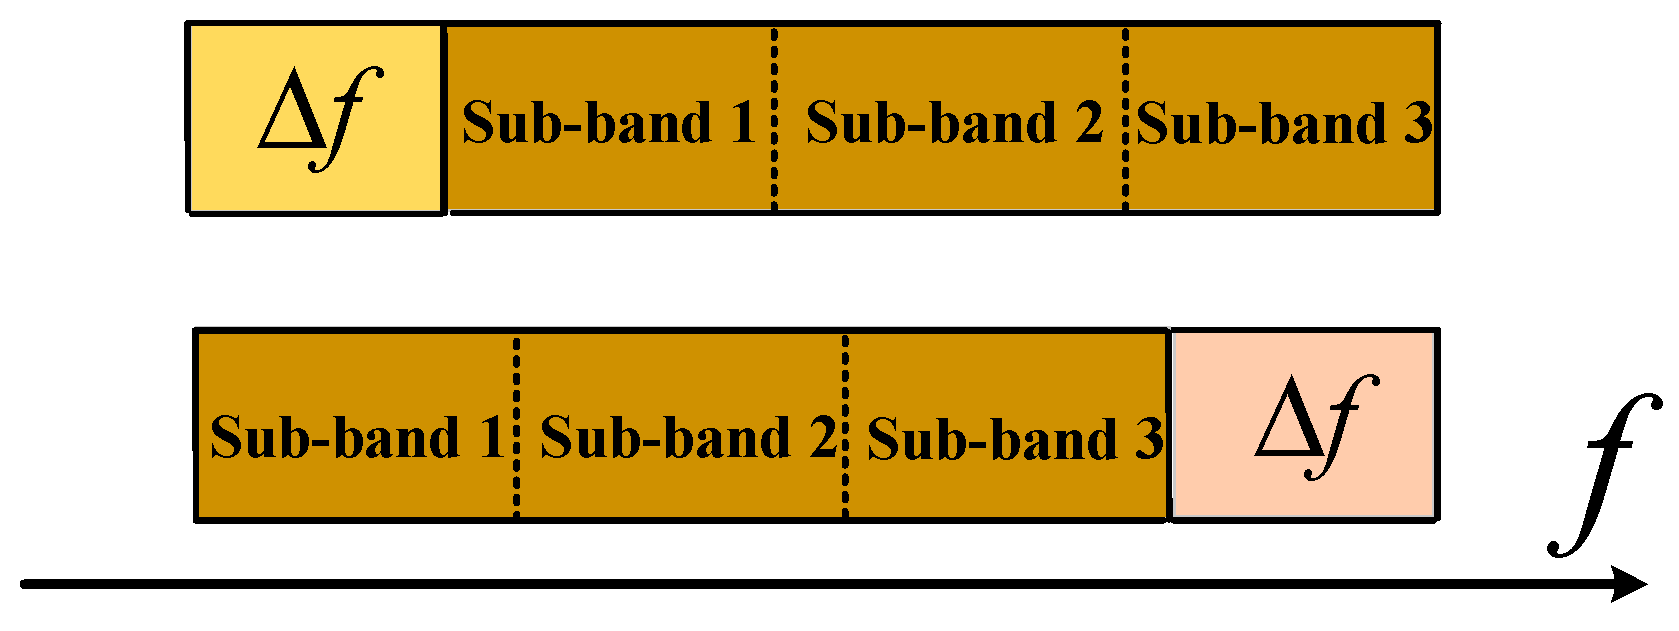
As shown in Figure 3, the carrier frequencies of the full-band interferometric image pairs become f 0 + f / 2 and f 0 f / 2 after CBF, respectively. Because the carrier frequencies of the interferometric single look complex images (SLCs) are no longer equal, according to [17], the ionospheric phase in Equation (3) can be modified as
φ i o n o _ c b f = 4 π K 0 c T E C 1 f 0 + f 2 T E C 2 f 0 f 2 .
Considering f f 0 , the above formula can be simplified as
φ i o n o _ c b f = φ i o n o f 2 f 0 φ Σ i o n o ,
and
φ i o n o = 4 π K 0 c f 0 T E C ,
φ Σ i o n o = 4 π K 0 c f 0 Σ T E C ,
where Σ T E C = T E C 1 + T E C 2 . Obviously, the ionospheric phase is related not only to ∆TEC, but also to ΣTEC.
Then, the higher and lower interferograms, namely Equations (4) and (5), can be rewritten as
φ H = φ n d f H f 0 + φ i o n o f 0 f H φ Σ i o n o f 0 f 2 f H 2
φ L = φ n d f L f 0 + φ i o n o f 0 f L φ Σ i o n o f 0 f 2 f L 2
and
f H = f 0 + N 1 2 N B f
f L = f 0 N 1 2 N B f
where N = B f / b is the split-spectrum factor after CBF. Substituting Equations (16) and (17) into Equation (6), the estimated ionospheric phase by the RSS method can be written as
φ ^ i o n o φ i o n o 3 f 4 f 0 φ Σ i o n o .
In addition, substituting Equations (18) and (19) into (8), the estimation accuracy after CBF can be reformulated as
σ φ i o n o f 0 2 B N 1 1 N K 1 N L 1 γ 2 γ 2 ,
where K = B / B f 3 2 is the degraded factor due to the reduced bandwidth after CBF.
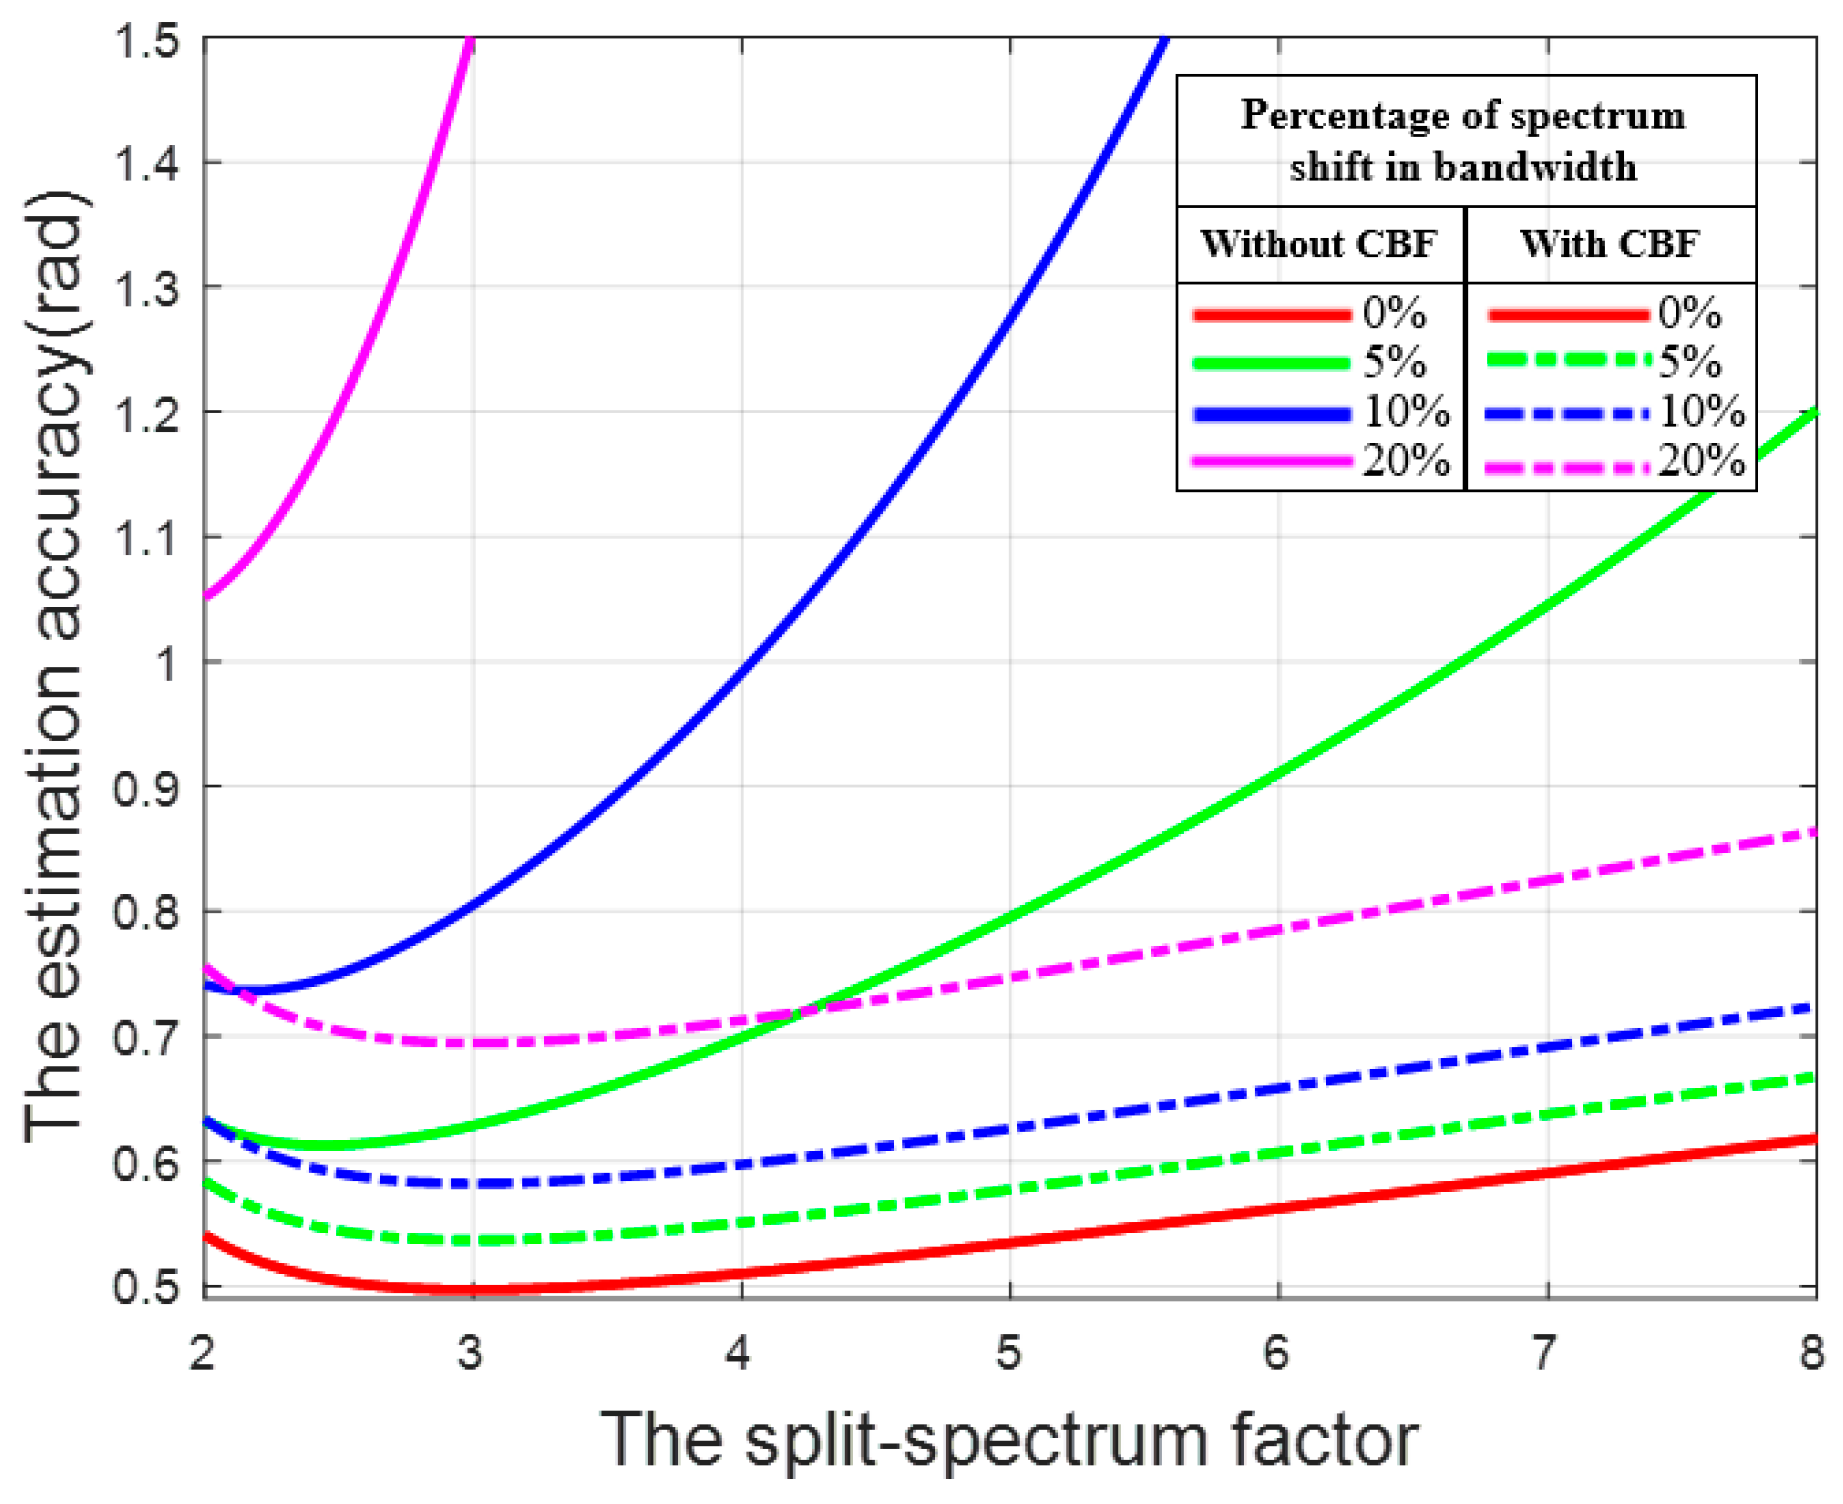
The estimation accuracy of the RSS method without CBF and with CBF in different spectrum shifts is shown in Figure 4. The estimation accuracy of the ionospheric phase without CBF (the solid line) deteriorates rapidly as the spectrum shift increases. This is because the split-spectrum processing without CBF accentuates the spatial decorrelation of sub-bands. Moreover, the split-spectrum factor also affects the estimation accuracy. When there is no spectrum shift and the split-spectrum factor is 3, the estimation accuracy of the ionospheric phase is optimum [25]. With the increase in spectrum shift, the optimal split-spectrum factor gradually moves to 2. In addition, when N b f B , there is no common spectrum in the sub-bands resulting in complete decorrelation and the RSS method without CBF is no longer valid. For comparison, the estimation accuracy of the ionospheric phase with CBF (the dotted line) deteriorates slowly as the spectrum shift increases. This is because the CBF preprocessing prevents the deterioration of sub-band coherence but reduces the effective interferometric bandwidth. Compared with the RSS method without CBF, the RSS method with CBF could obtain better estimation accuracy when the optimal split-spectrum factor is achieved. In addition, when the percentage of spectrum shift in bandwidth is less than 5%, whether to perform CBF preprocessing has little difference in the estimation accuracy. At this time, the RSS method without CBF is preferred. When the percentage of spectrum shift in bandwidth is large, the RSS method without CBF has the risk of failure. At this time, the CBF preprocessing is required.
However, by comparing Equations (13) and (20), it can be seen that the estimated ionospheric phase is biased by the RSS method with CBF. Considering f = f 0 B / R t a n θ α , the estimation bias is
                                  φ ^ b i a s = φ i o n o _ c b f φ ^ i o n o = π K 0 c f 0 R B t a n θ α Σ T E C .
where θ is the incident angle, α is the terrain slope angle, B is the perpendicular baseline length, and R is the slant range. Obviously, the estimation bias is related to perpendicular baseline length, terrain slope angle, and the total TEC value. Due to the spatial change in the terrain slope angle and the total TEC value, the estimation bias is also spatial-variant, which will introduce serious relative measurement error.

2.3. The MTSVD-Based Multi-Sub-Band RSS Method Considering Wavenumber Shift

To correct the errors of the RSS method caused by the wavenumber shift, a MTSVD-based multi-sub-band RSS method considering wavenumber shift is proposed, and the processing workflow is also introduced in this section.

2.3.1. Multi-Sub-Band RSS Method Based on MTSVD

To obtain the unbiased estimation of Equation (13), the problem is transformed into the estimate of φ i o n o and φ Σ i o n o . Dividing the full band of the reference and secondary SLCs into N sub-bands ( N 3 ), according to Equations (16) and (17), the N sub-band interferograms φ o b s = φ 1   φ 2   φ N T can be written as
φ o b s = F m ,
and
F = f 1 f 0 f 2 f 0 f N f 0           f 0 f 1 f 0 f 2 f 0 f N         f 0 f 1 · f 2 f 1 f 0 f 2 · f 2 f 2 f 0 f N · f 2 f N ,
m = φ n d φ i o n o φ i o n o .
In addition, the center frequency of sub-band interferograms in Equation (24) should be modified as
f n = f 0 + B f n 1 2 N 1 2 ,   n = 1,2 , , N .
To solve Equation (23) and estimate φ i o n o and φ Σ i o n o at center frequency f 0 , the weighted least square (WLS) is adopted [18], and the solution can be written as
m L S = F T W 1 F 1 F T W 1 φ o b s ,
where W is the variance–covariance matrix of φ o b s . Since the N sub-band interferograms have non-overlapping equal bandwidth, it is reasonable to assume that all sub-bands are independent and have identical phase statistical properties. The variance–covariance matrix of all sub-bands can be written as
W = d i a g σ 2 s u b b a n d 1 , , σ 2 s u b b a n d N ,
where σ s u b b a n d 1 = σ s u b b a n d N = σ s u b b a n d is the phase standard deviation of sub-band interferograms. Then, the unbiased estimation of the full-band ionospheric phase after CBF can be written as
φ ^ i o n o _ L S = G m L S ,
where
G = 0       1     f 2 f 0 .
The estimation accuracy of the ionospheric phase is therefore obtained as
σ φ ^ i o n o _ L S = G C L S G T
where · T means the transpose of a vector or matrix and C L S =   F T W 1 F 1 is the variance–covariance matrix of m L S .
According to Equation (31), the variation of the estimation accuracy with the number of sub-bands is simulated and the result is shown in Figure 5. The parameters are in accordance with ALOS PALSAR as shown in Table 1. The coherence is set to 0.6, and 25,000 looks are taken; the spectrum shift is about 4.4 MHz. It can be seen that the estimation accuracy gradually converges with the increase in the number of sub-bands. In addition, we notice that, although the estimation is unbiased, the accuracy of the WLS solution is still poor. It is due to the existence of approximately collinear column vectors in the F matrix, which is a severely ill-conditioned matrix. Thus, the WLS solution is difficult to achieve a precise estimated result. In other words, even a small observation error in φ o b s will cause a large estimation error of φ ^ i o n o . Problems of this kind are referred to as ill-posed problems, which occur frequently in science and engineering.
To solve the ill-posed problem, here a modified truncated singular value decomposition (MTSVD) method is introduced [26]. Instead of trying to solve Equation (23) directly, the MTSVD method seeks to solve the minimization problem
m i n L m s u b j e c t   t o   m i n F m φ o b s ,
where · means the 2-norm of a vector or matrix, and L is the regularization matrix. When L = I 3 is a 3 × 3 identity matrix, Equation (32) becomes the truncated singular value decomposition (TSVD) method. The TSVD method solves the following restricted least squares problem
m i n m s u b j e c t   t o   m S k = m |   F k m φ o b s = m i n ,
where F k is a best rank- k approximation to F with respect to the 2-norm and the approximation error is
F k F = σ k + 1 ,
where σ k + 1 is the k + 1 t h large singular value of F . The singular value decomposition (SVD) of F can be written as
F = U Σ V T = i = 1 3 u i σ i v i T ,
where U = u 1 , u 2 , u 3 and V = v 1 , v 2 , v 3 are matrices with orthonormal columns, U T U = V T V = I 3 , and Σ = d i a g σ 1 , σ 2 , σ 3 has nonnegative diagonal elements appearing in non-increasing order such that
σ 1 σ 2 σ 3 0 ,
The numbers σ i are the singular values of F while the vectors u i and v i are the left and right singular vectors of F , respectively.
By observing Equation (24), we found that when k = 2 , the best regularized solution can be achieved. Then, the solution of the TSVD method is given by [27]
m t s v d = u 1 T φ o b s σ 1 v 1 + u 2 T φ o b s σ 2 v 2 ,
and the estimation of ionospheric phase after CBF can be written as
φ ^ i o n o _ t s v d = G m t s v d
However, the TSVD method changes the structure of the observation matrix, so the estimation is biased. By observing the structural characteristics of F , we find that the TSVD-based method is reduced to the multi-sub-band RSS method.
On the basis of the TSVD method, the MTSVD method can be understood as drawing the solution toward the null space N L of the regularization matrix L . In this paper, we consider exploiting the prior information on m to construct the regularization matrix, which can be written as
L = 0 1 T E C ^ T E C 1 ^ + T E C 2 ^ ,
where T E C 1 ^ and T E C 2 ^ are the TEC values estimated by the International GNSS Service (IGS) Analysis Centers (ACs) at the reference and secondary acquisition time, T E C ^ can be estimated by the TSVD solution. Then, the MTSVD method solves the following restricted least squares problem
m i n L m   s u b j e c t   t o   m S k = m |   F k m φ o b s = m i n ,
and the solution of the MTSVD method is given by [27]
m m t s v d = m t s v d v 3 L v 3 L m t s v d ,
where · means the pseudoinverse of a matrix. Finally, the estimated ionospheric phase by the MTSVD method can be written as
φ ^ i o n o _ m t s v d = G m m t s v d .
Similarly, the least square solution m L S can also be represent in the form of SVD as
m L S = u 1 T φ o b s σ 1 v 1 + u 2 T φ o b s σ 2 v 2 + u 3 T φ o b s σ 3 v 3 .
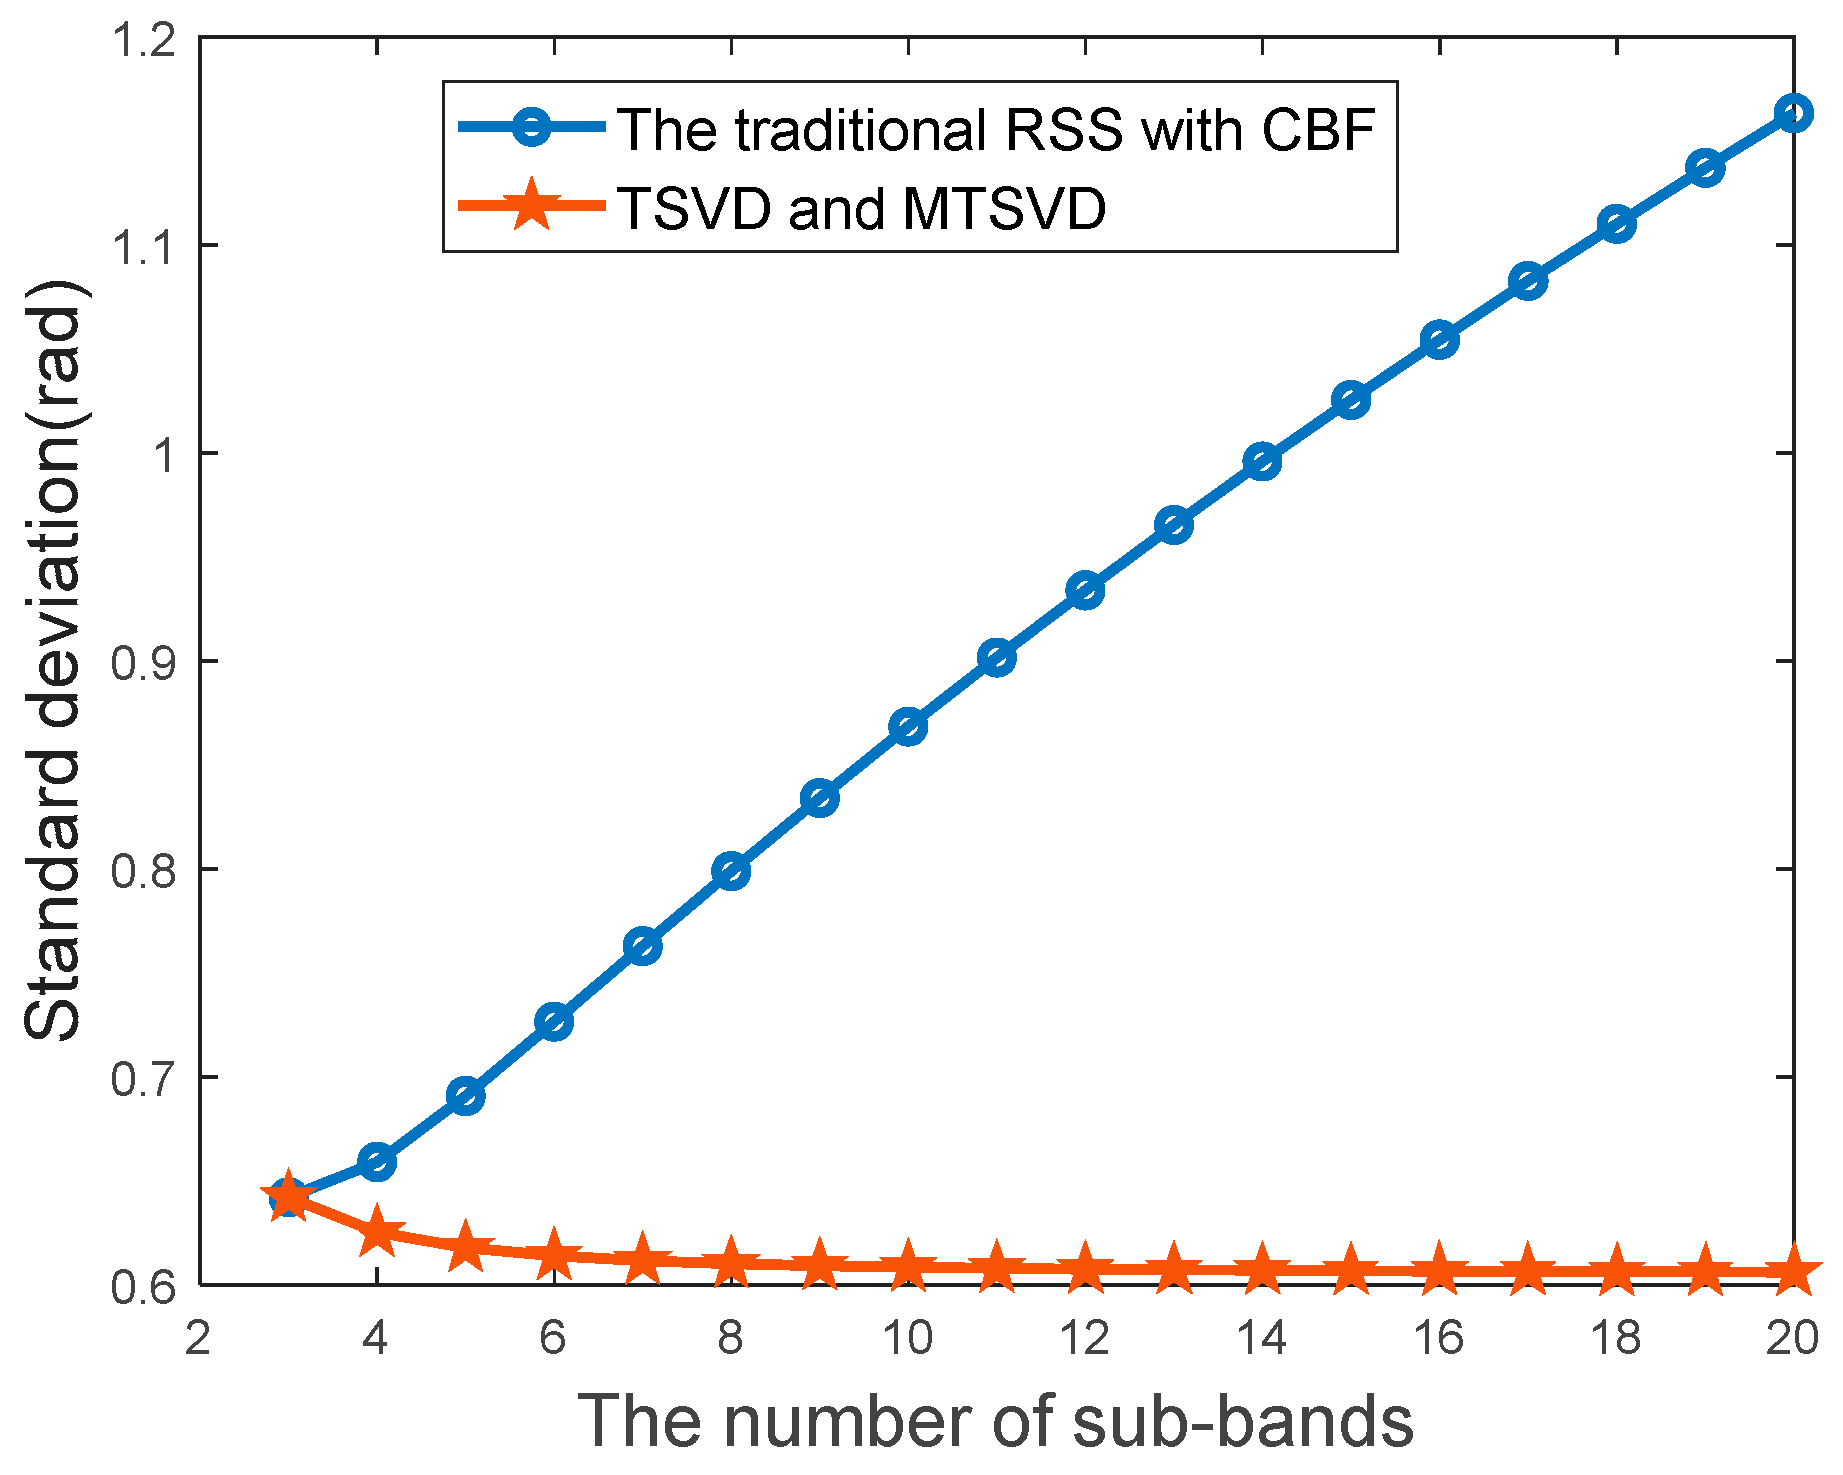
The standard deviation of the estimated ionospheric phase with CBF is shown in Figure 6. It can be seen that the estimation accuracy gradually converges with the increase in sub-band number based on the TSVD and MTSVD method. Moreover, compared with the WLS method in Figure 5, the TSVD and MTSVD methods reduce the condition number of the WLS method from σ 1 σ 3 to σ 1 σ 2 [28], so they have stronger robustness. In addition, compared with the traditional RSS method with CBF, the TSVD and MTSVD methods could achieve a higher accuracy with the increase in sub-band number.
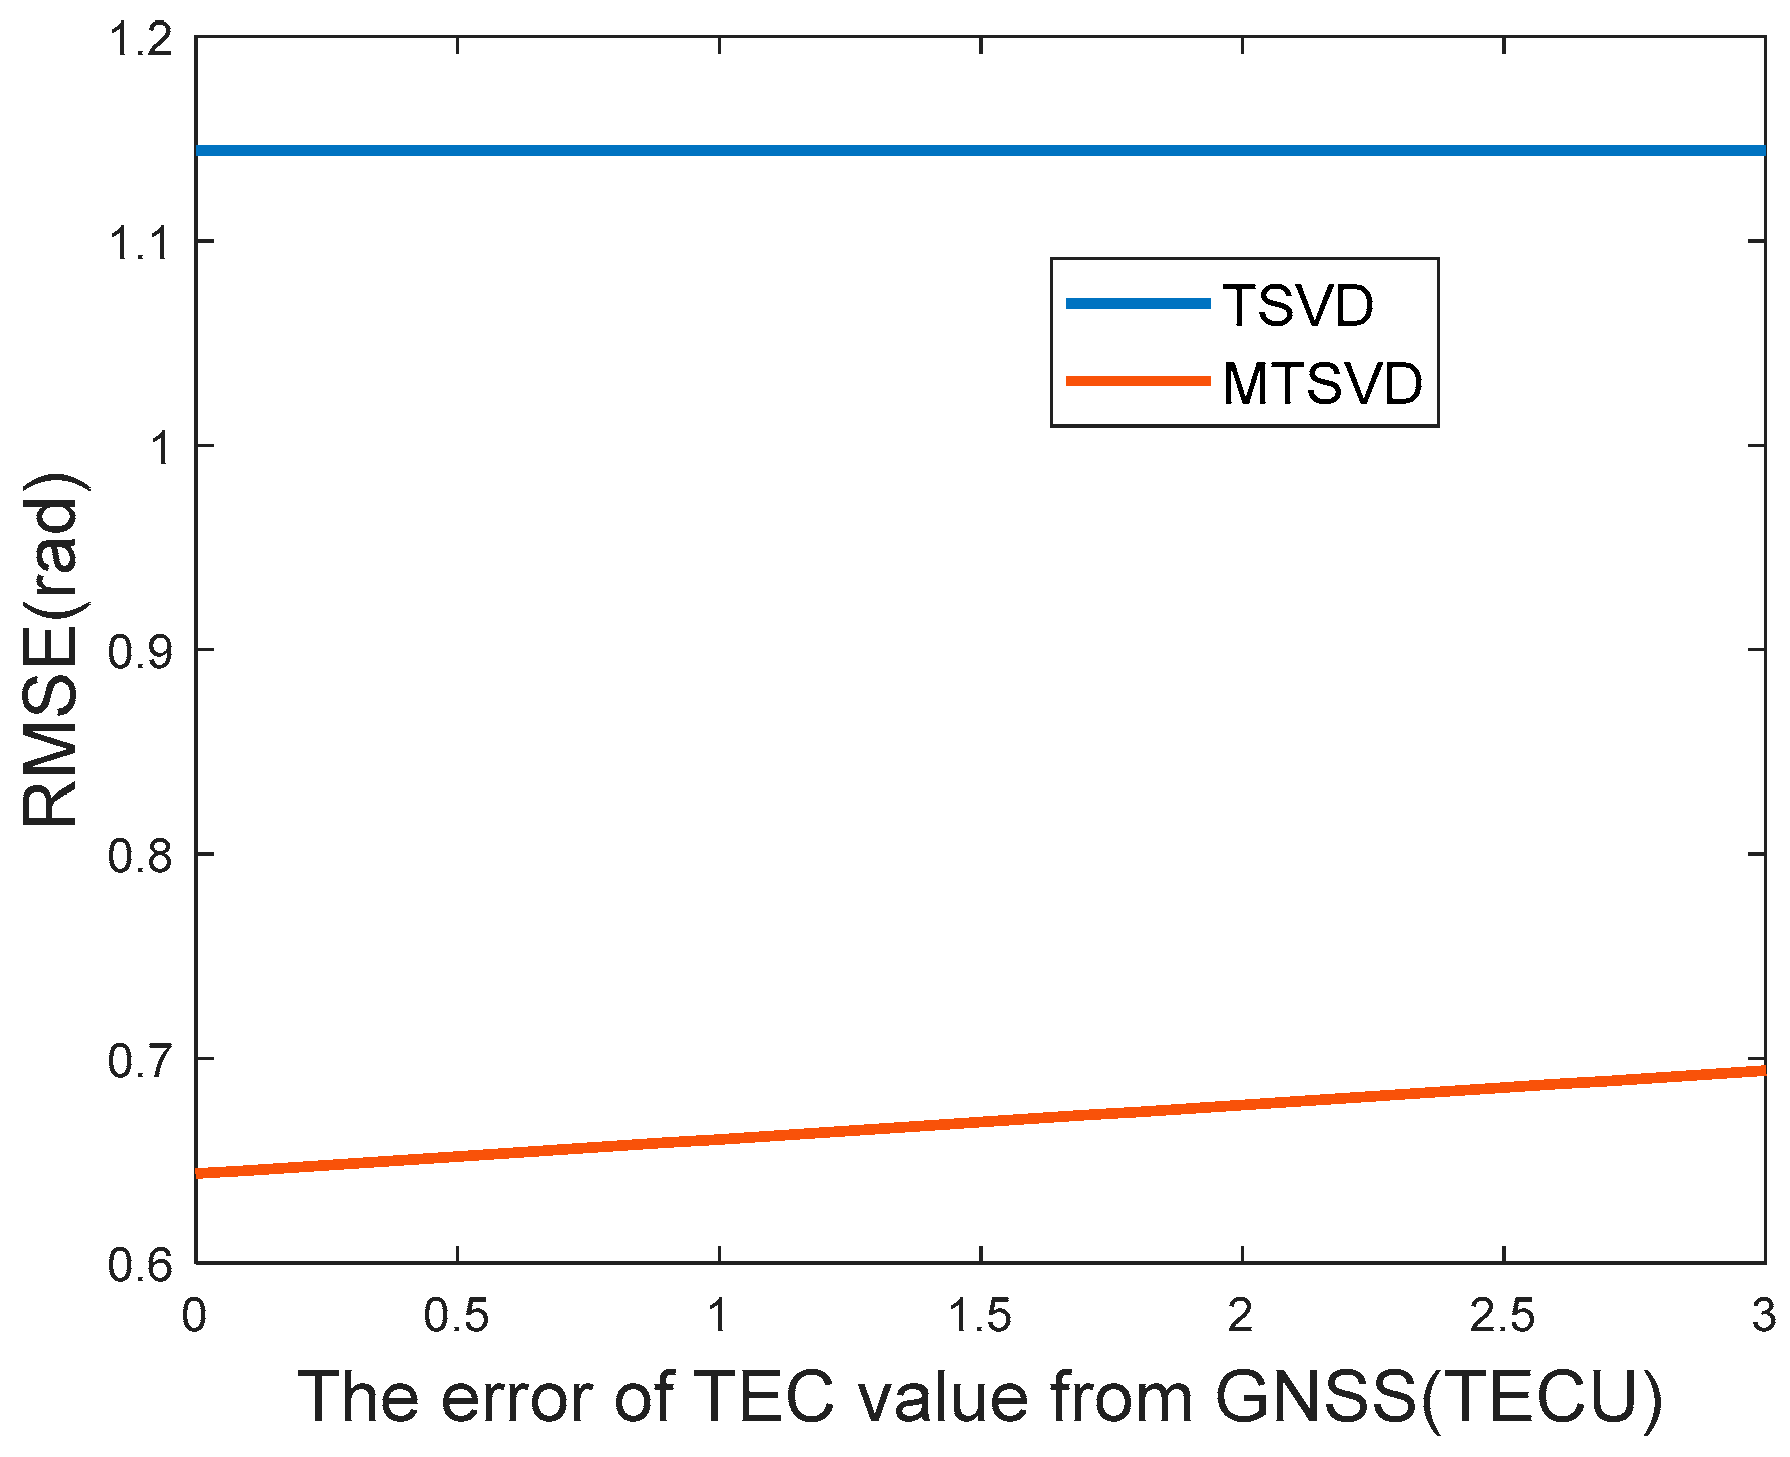
As aforementioned, the TEC value obtained from GNSS contains errors, which can achieve an accuracy of about 2~3 TECU [29]. Therefore, the regularization matrix L ^ is also inaccurate, which can cause an estimation error in φ ^ i o n o _ m t s v d . Assuming that the TEC error obtained by GNSS followed a Gaussian distribution N 0 , σ T E C 2 , with the increase in σ T E C , the root mean square error (RMSE) of estimated results is shown in Figure 7. The simulation parameters are in accordance with Figure 5 and the number of sub-bands is set to 5. It can be seen that when the TEC error is 0, the RMSE is equal to the standard deviation, which proves that the estimation result of MTSVD is unbiased. In contrast, the RMSE of TSVD is greater than the standard deviation because the estimation result of TSVD is biased. The RMSE of the MTSVD method increases with the error of the TEC value. Even if the error increases to 3, the MTSVD method can still achieve a better RMSE than the TSVD method. Therefore, although the TEC value obtained from GNSS is not high enough to compensate the ionospheric phase directly [11], it is enough for the calculation of the regularization matrix.

2.3.2. Processing Workflow

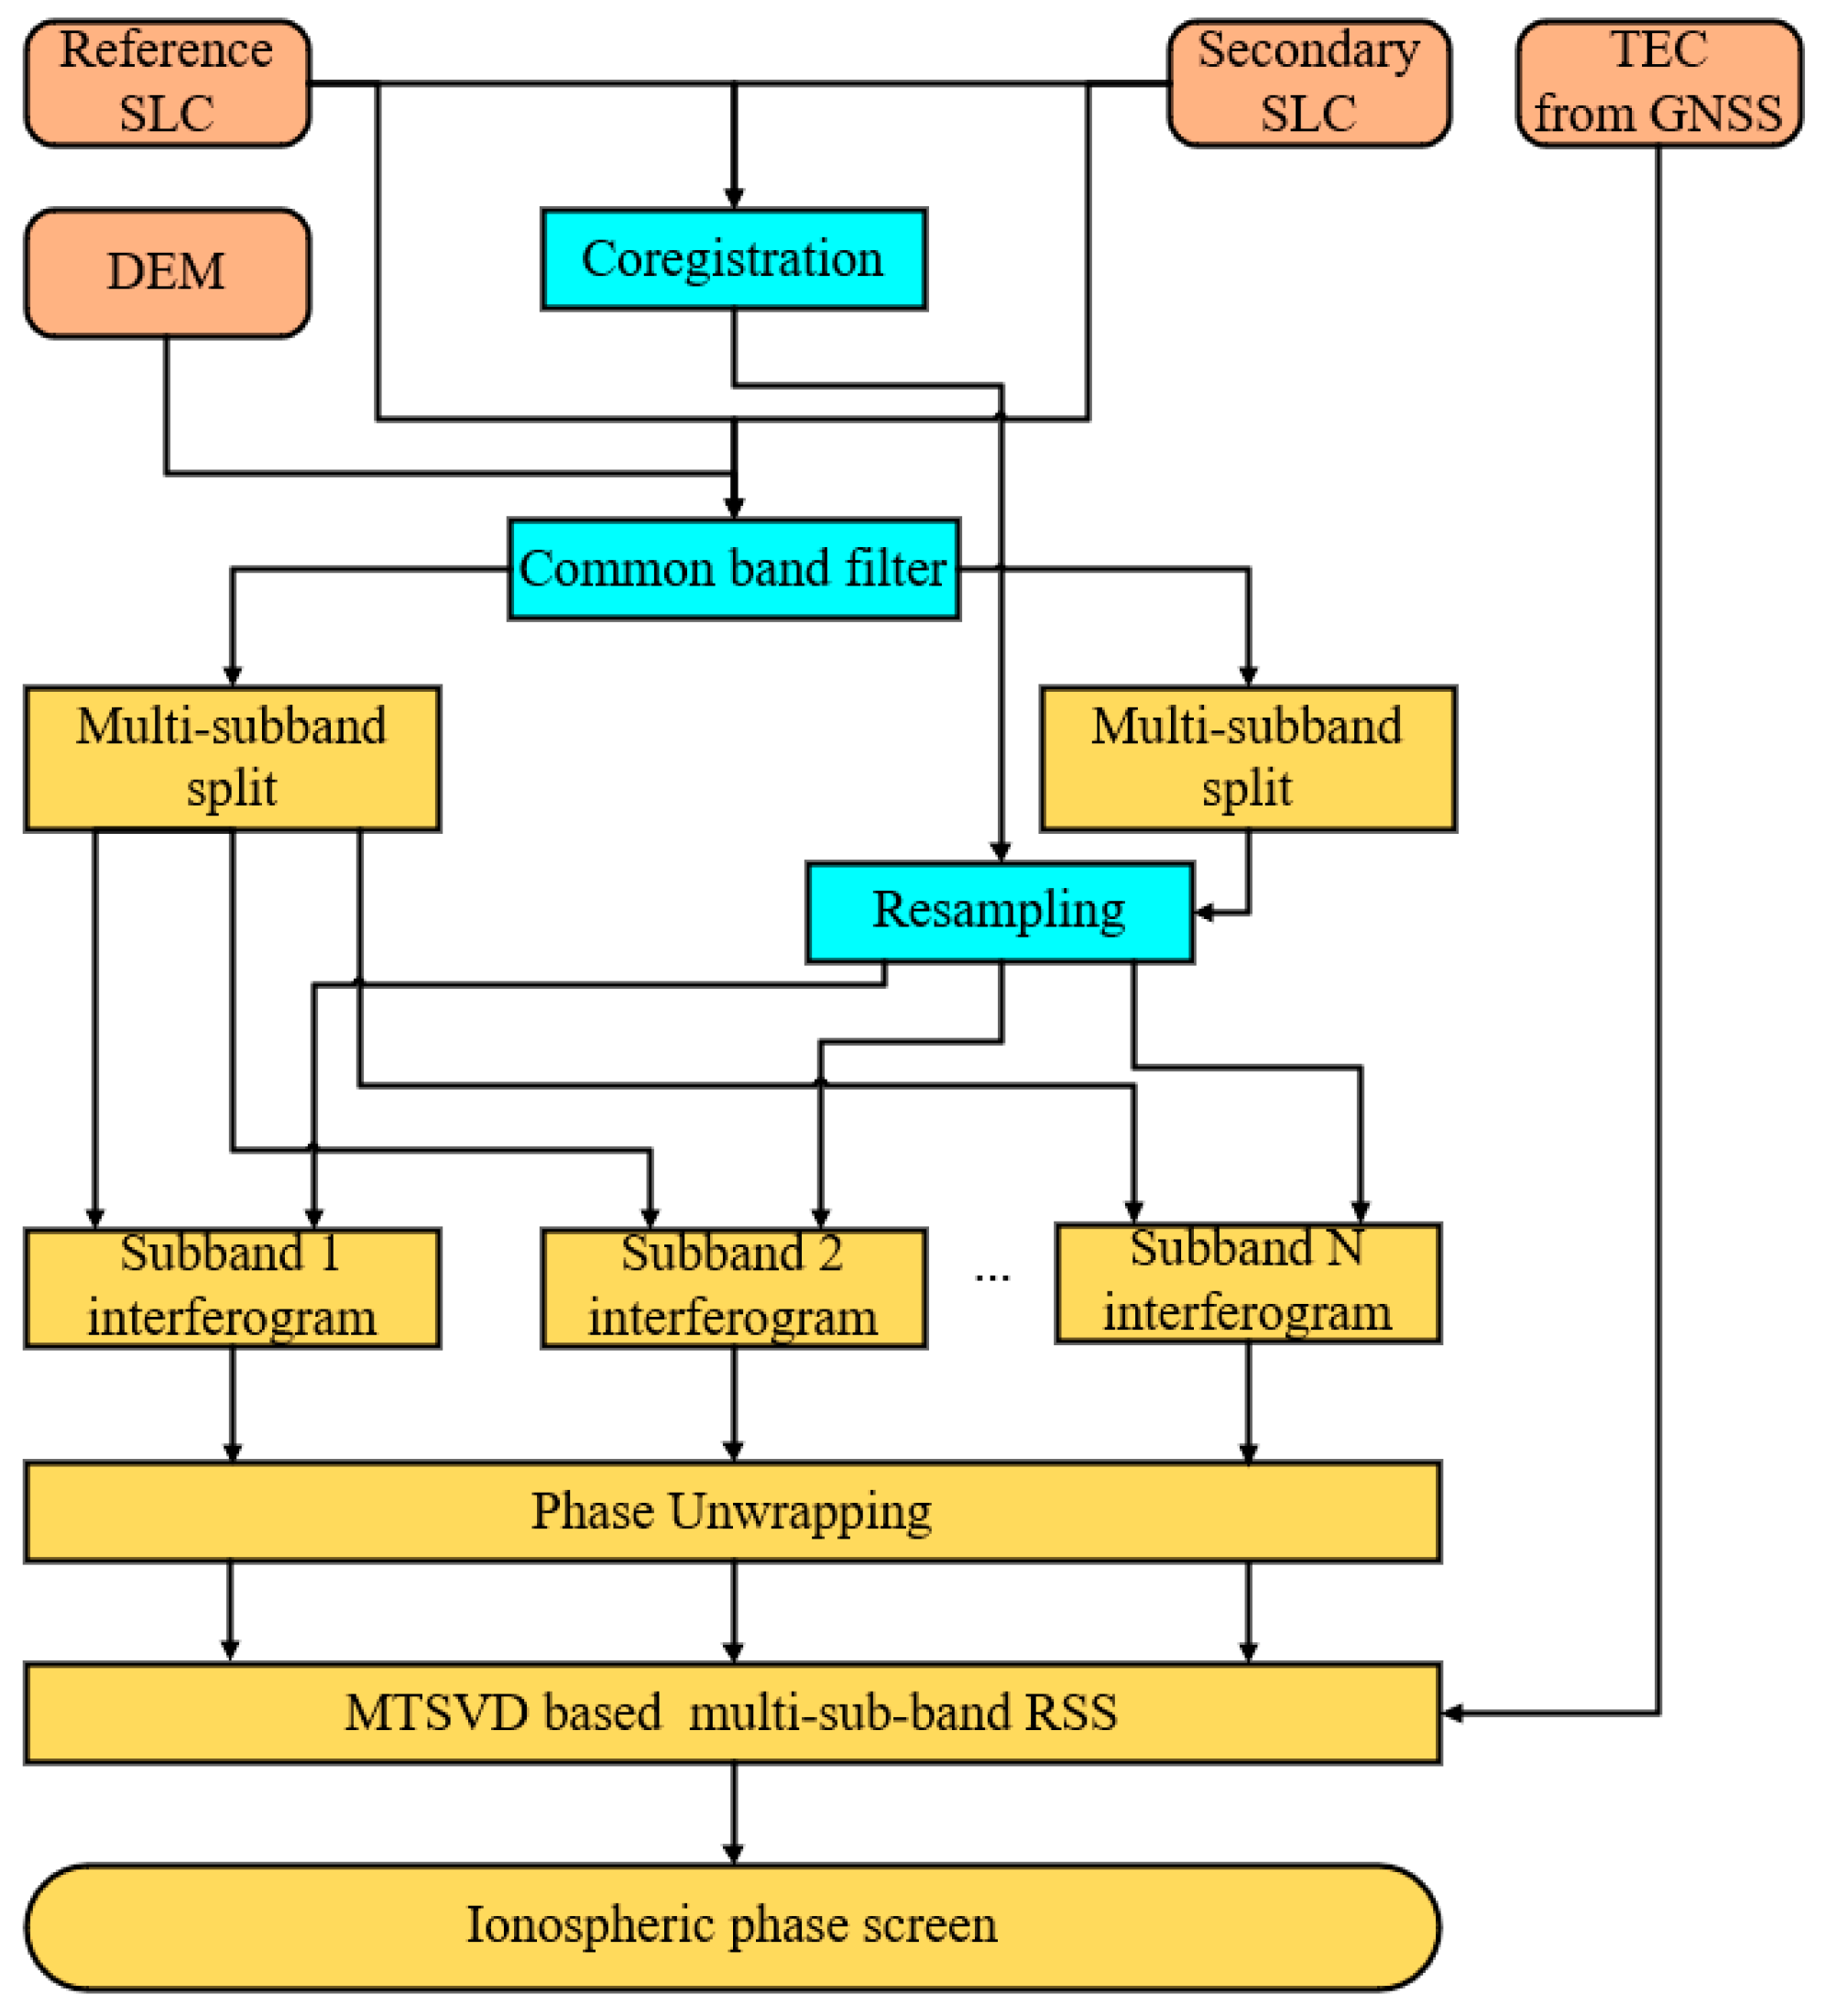
The processing workflow for the proposed method is summarized in Figure 8. The workflow can be divided into the following four main blocks:
  • Terrain-adaptive common band filtering
The range spectrum shift is related to the terrain slope angle. However, the traditional CBF processing assumes that the topography is planar, which rarely occurs in reality. Moreover, the traditional CBF may exacerbate the decorrelation in the regions where the topography has significant excursions.
Therefore, the terrain-adaptive common band filtering method is adopted here. An auxiliary DEM is needed to estimate the range spectrum shift varying with the terrain. Then, the low-pass filters are constructed according to the frequency shift to complete the common band filtering of the reference and secondary SLCs. The scheme is fairly simple, and the full details are obtainable from refs. [30,31].
2.
Multi-sub-band split and interferograms generation
After the terrain-adaptive common band filtering processing, the center frequencies of the reference and secondary images are f 0 + f / 2 and f 0 f / 2 , respectively. Then, we apply band-pass filters to divide the full-band SLCs into N sub-bands. The lower cutoff frequencies of the reference and secondary sub-band images are f r e f _ l o w and f s e c _ l o w , respectively, which can be written as
                    f r e f _ l o w = f 0 B 2 + m 1 B f N + f ,
f s e c _ l o w = f 0 B 2 + m 1 B f N .
Then, the higher cutoff frequencies of the reference and secondary sub-band images are f r e f _ l o w + B f / N and f s e c _ l o w + B f / N , respectively. After band-pass filtering, the sub-bands are demodulated by multiplying a phase ramp to obtain a symmetric spectrum. The center frequency of the sub-band spectrum can be calculated by Equation (26).
It should be noted that the band-pass filtering processing is conducted before the coregistration processing of the SLCs to avoid the secondary SLC range spectrum being disturbed by the resampling processing [32]. Then the secondary sub-band SLCs can be resampled to the reference grid by using coregistration offset which has been estimated during the full-band coregistration processing. After resampling, the sub-band interferograms are achieved. Usually, the flat-earth phase and topography-related phase are also removed in this step.
3.
Phase unwrapping
Before phase unwrapping, complex multi-looking processing is needed to reduce phase noise and increase the signal-to-noise ratio and enhance the unwrapping. With the increasing multi-looking window size, more available samples are included to denoise phase. However, the samples in the window should be stationary and homogeneous, which restricts the window from being large. In addition, the Goldstein filter is also introduced to improve phase unwrapping accuracies. Then, the interferograms of sub-band are unwrapped by the statistical-cost network-flow algorithm, which can neglect regions of a great deal of phase noise and achieve a more reasonable result [33].
4.
Ionospheric phase screen (IPS) estimation
According to Equations (32) and (39), the ionospheric phase screen can be estimated by the proposed MTSVD-based multi-sub-band RSS method. The key to the method is the construction of the regularization matrix. In this study, Global Ionosphere Maps (GIMs) [34] provided by the IGS are used as a priori information to calculate the regularization matrix. However, the GIMs basically have 1 h or 2 h temporal resolution and a spatial resolution in 5 and 2.5 for longitude and latitude, respectively. To increase resolution, spherical harmonic expansion and a proper interpolation are required. Then, based on the interpolated GIMs, the vertical TEC (VTEC) at the pierce point is obtained. Finally, the VTEC should be transformed to the slant TEC (STEC) value in the path direction [35]. Due to the noise amplification effect, the estimated IPS contains lots of high-frequency noise, which should be filtered to increase the estimation accuracy. Here a 2-D Gaussian filter is implemented to smooth the IPS. The selection of the filter window size can be determined by the desired final estimated accuracy, which can be calculated by [17].

3. Experimental Results

To validate the influence of wavenumber shift on the RSS method and the effectiveness of the proposed method, ALOS PALSAR data processing is carried out in this section.
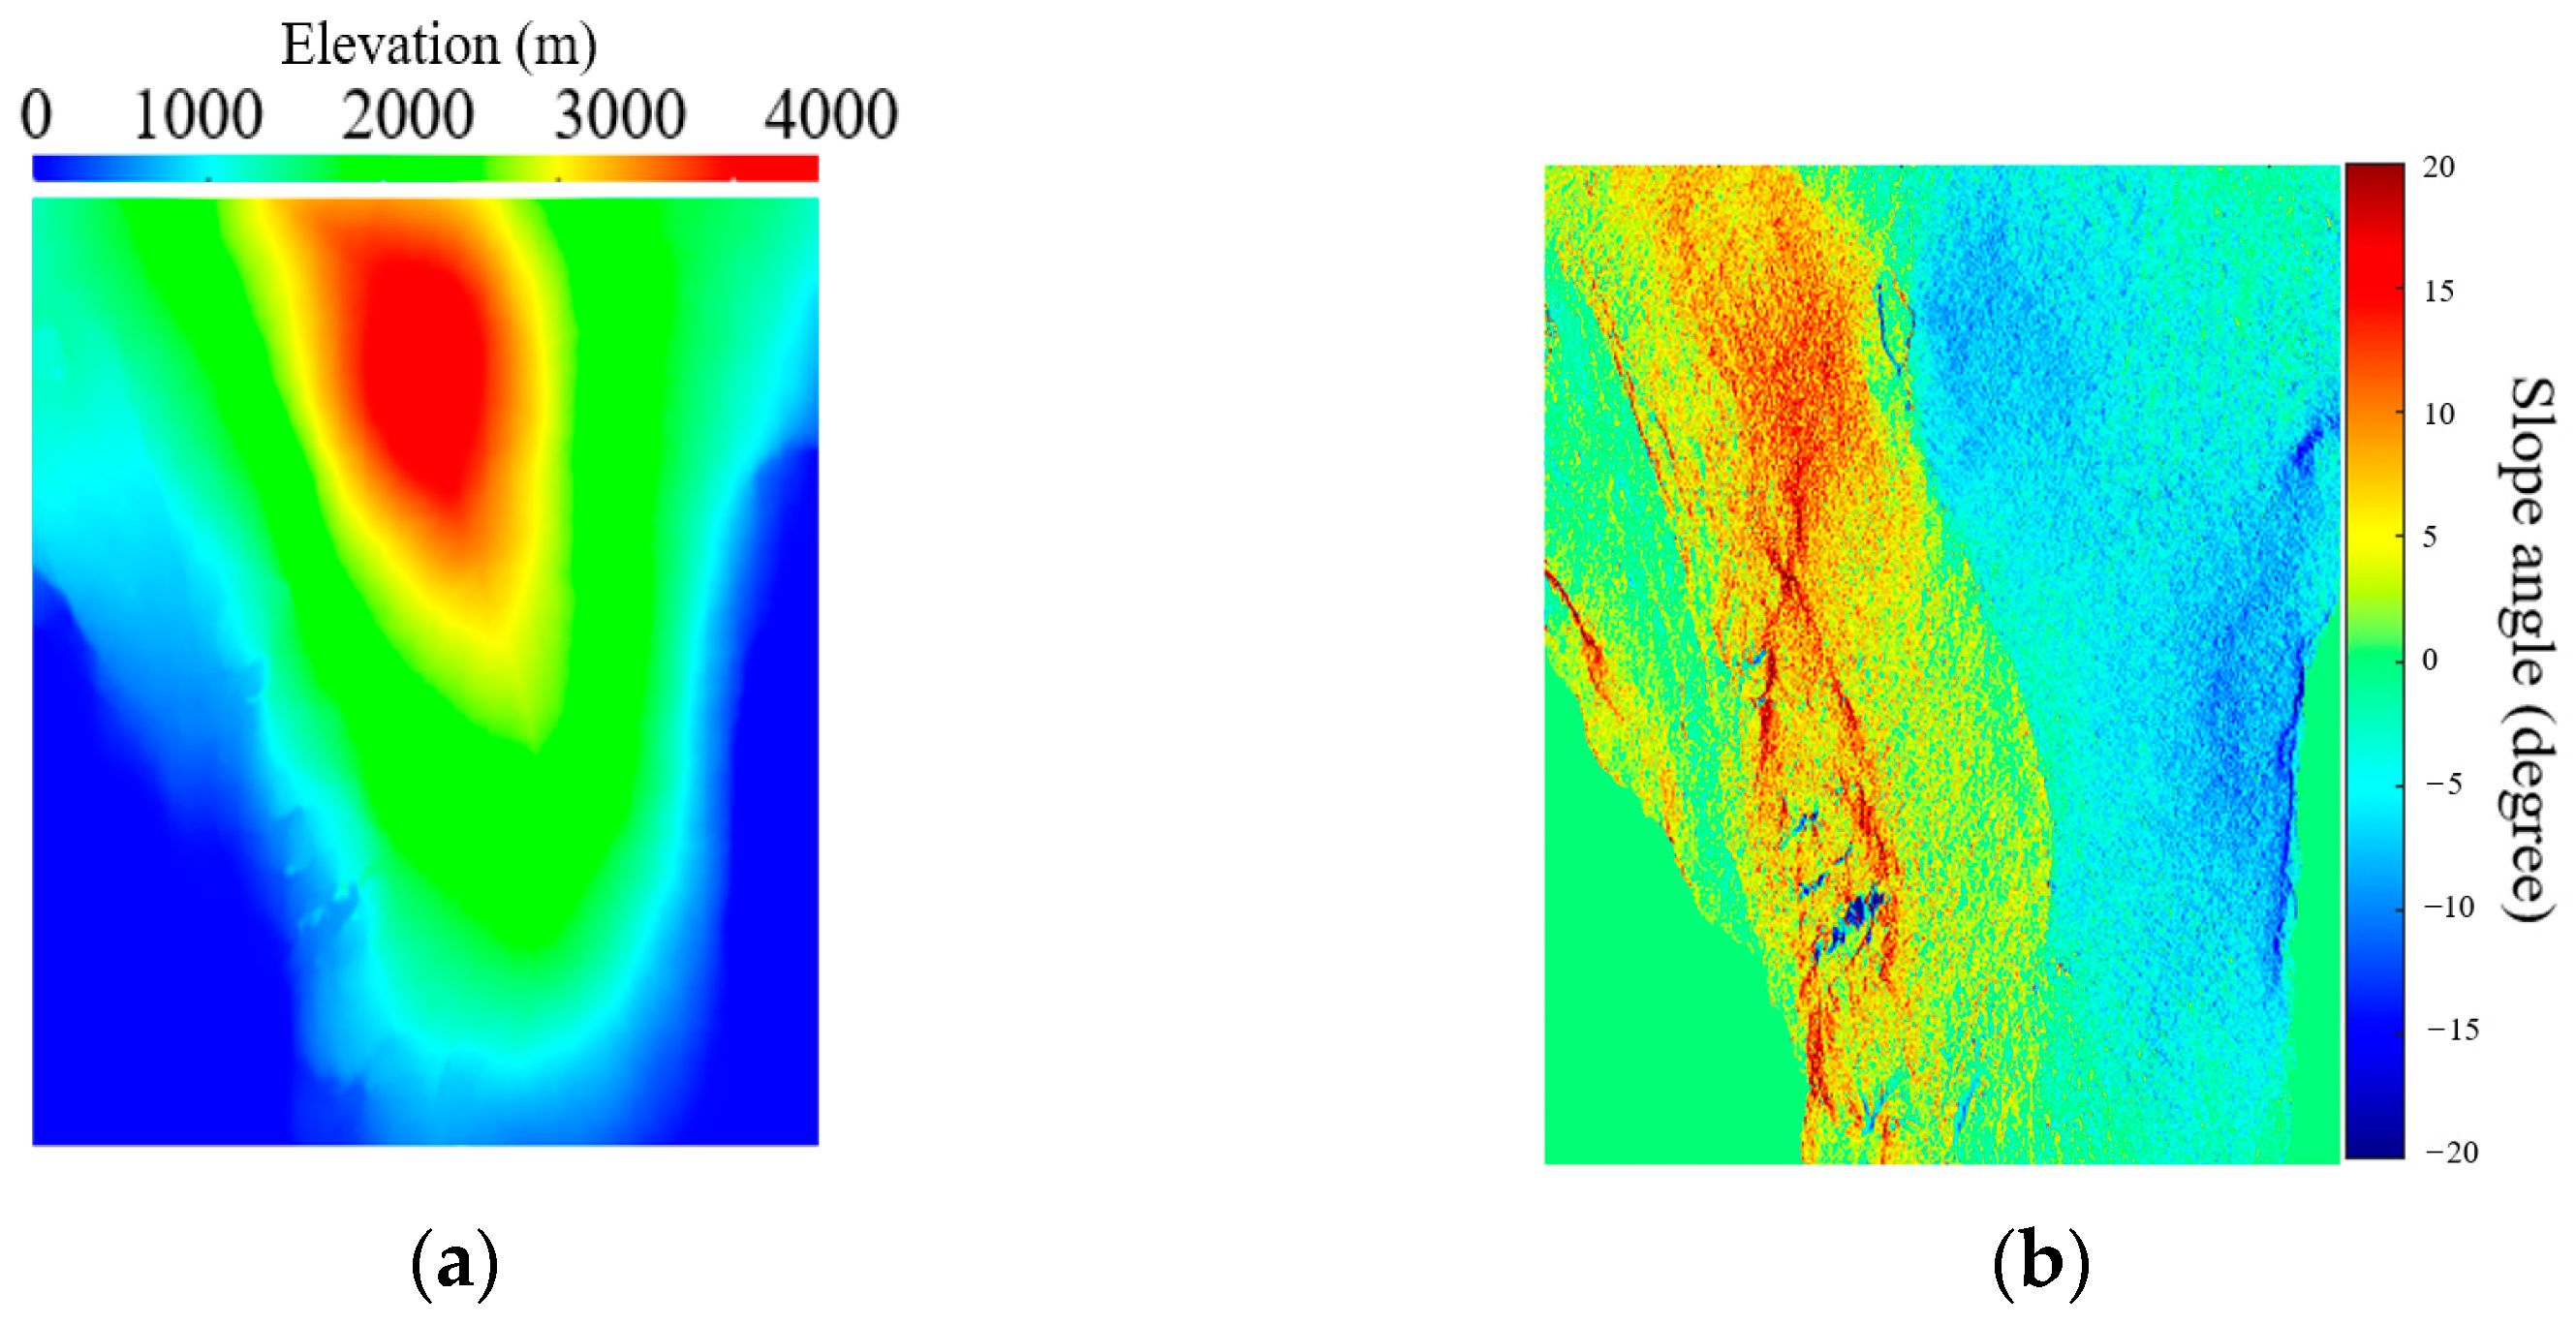
A pair of InSAR images from ALOS PALSAR over the Hawaii island are acquired, and the geographical location of the dataset is shown in Figure 9. The data set includes the footprint of Mauna Loa volcano, which is the largest subaerial volcano in both mass and volume, and the elevation of this region is from 13 m to 4179 m. Therefore, the terrain fluctuates greatly and the local terrain slope changes from about 20 ° to 20 ° as shown in Figure 10. More detailed information about the InSAR data set can be found in Table 1.

3.1. The RSS Method without CBF

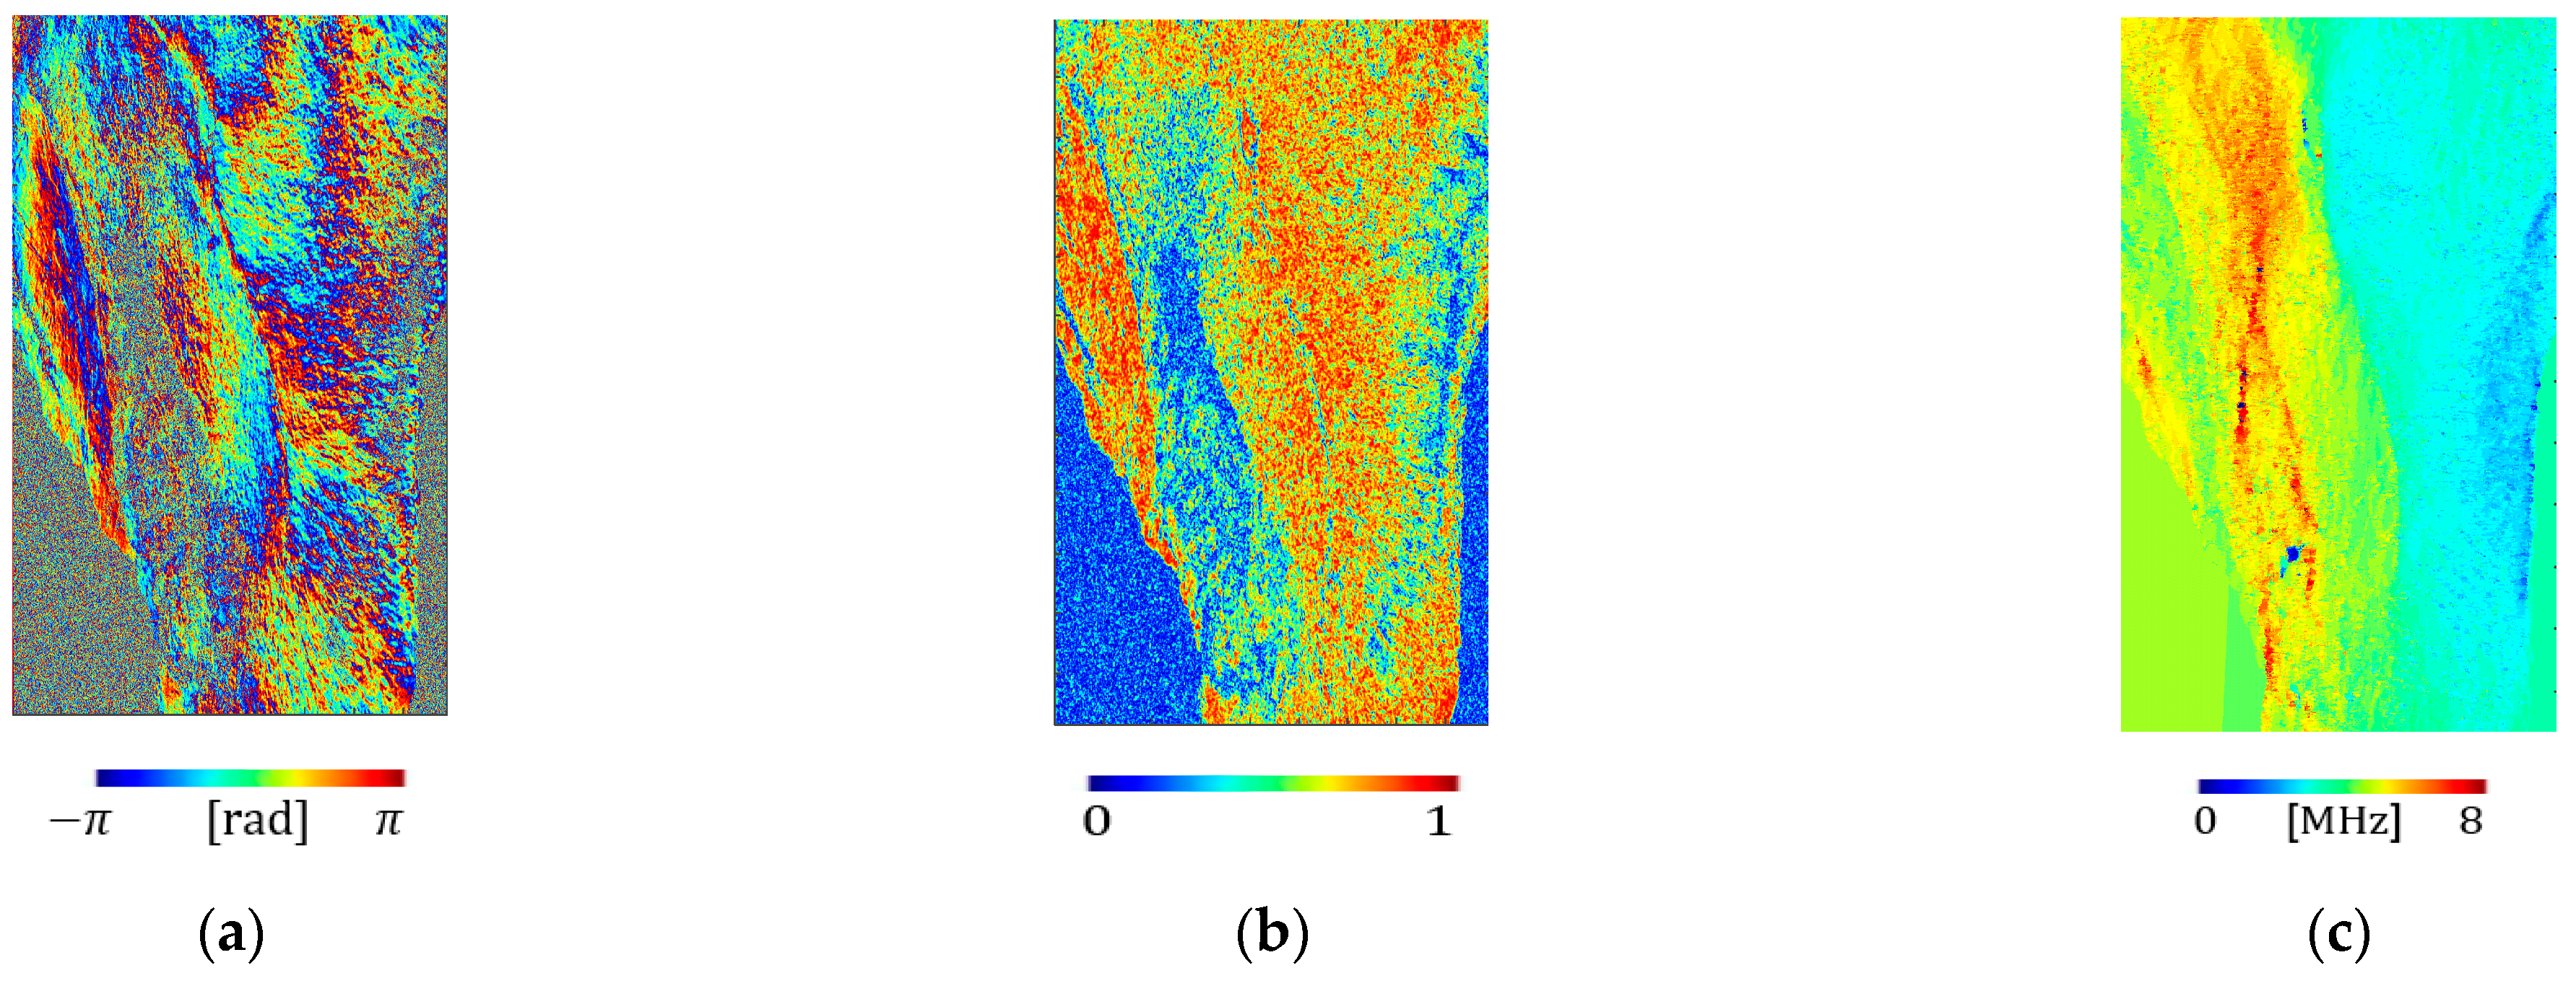
According to Table 1, the two SAR datasets have a large spatial baseline of more than 2400 m, which leads to a significant spectrum shift of about 4.4 MHz in the flat ground. Due to the severe topographic relief in this area, the spectrum shift is also not constant and varies from 1 MHz to 8 MHz as shown in Figure 11c, and the side facing the slope has a greater spectrum shift compared to the side facing away from the slope. Without CBF, the spectrum shift will introduce phase noise in the interferogram, and deteriorate the coherence of InSAR image pairs as shown in Figure 11a,b.
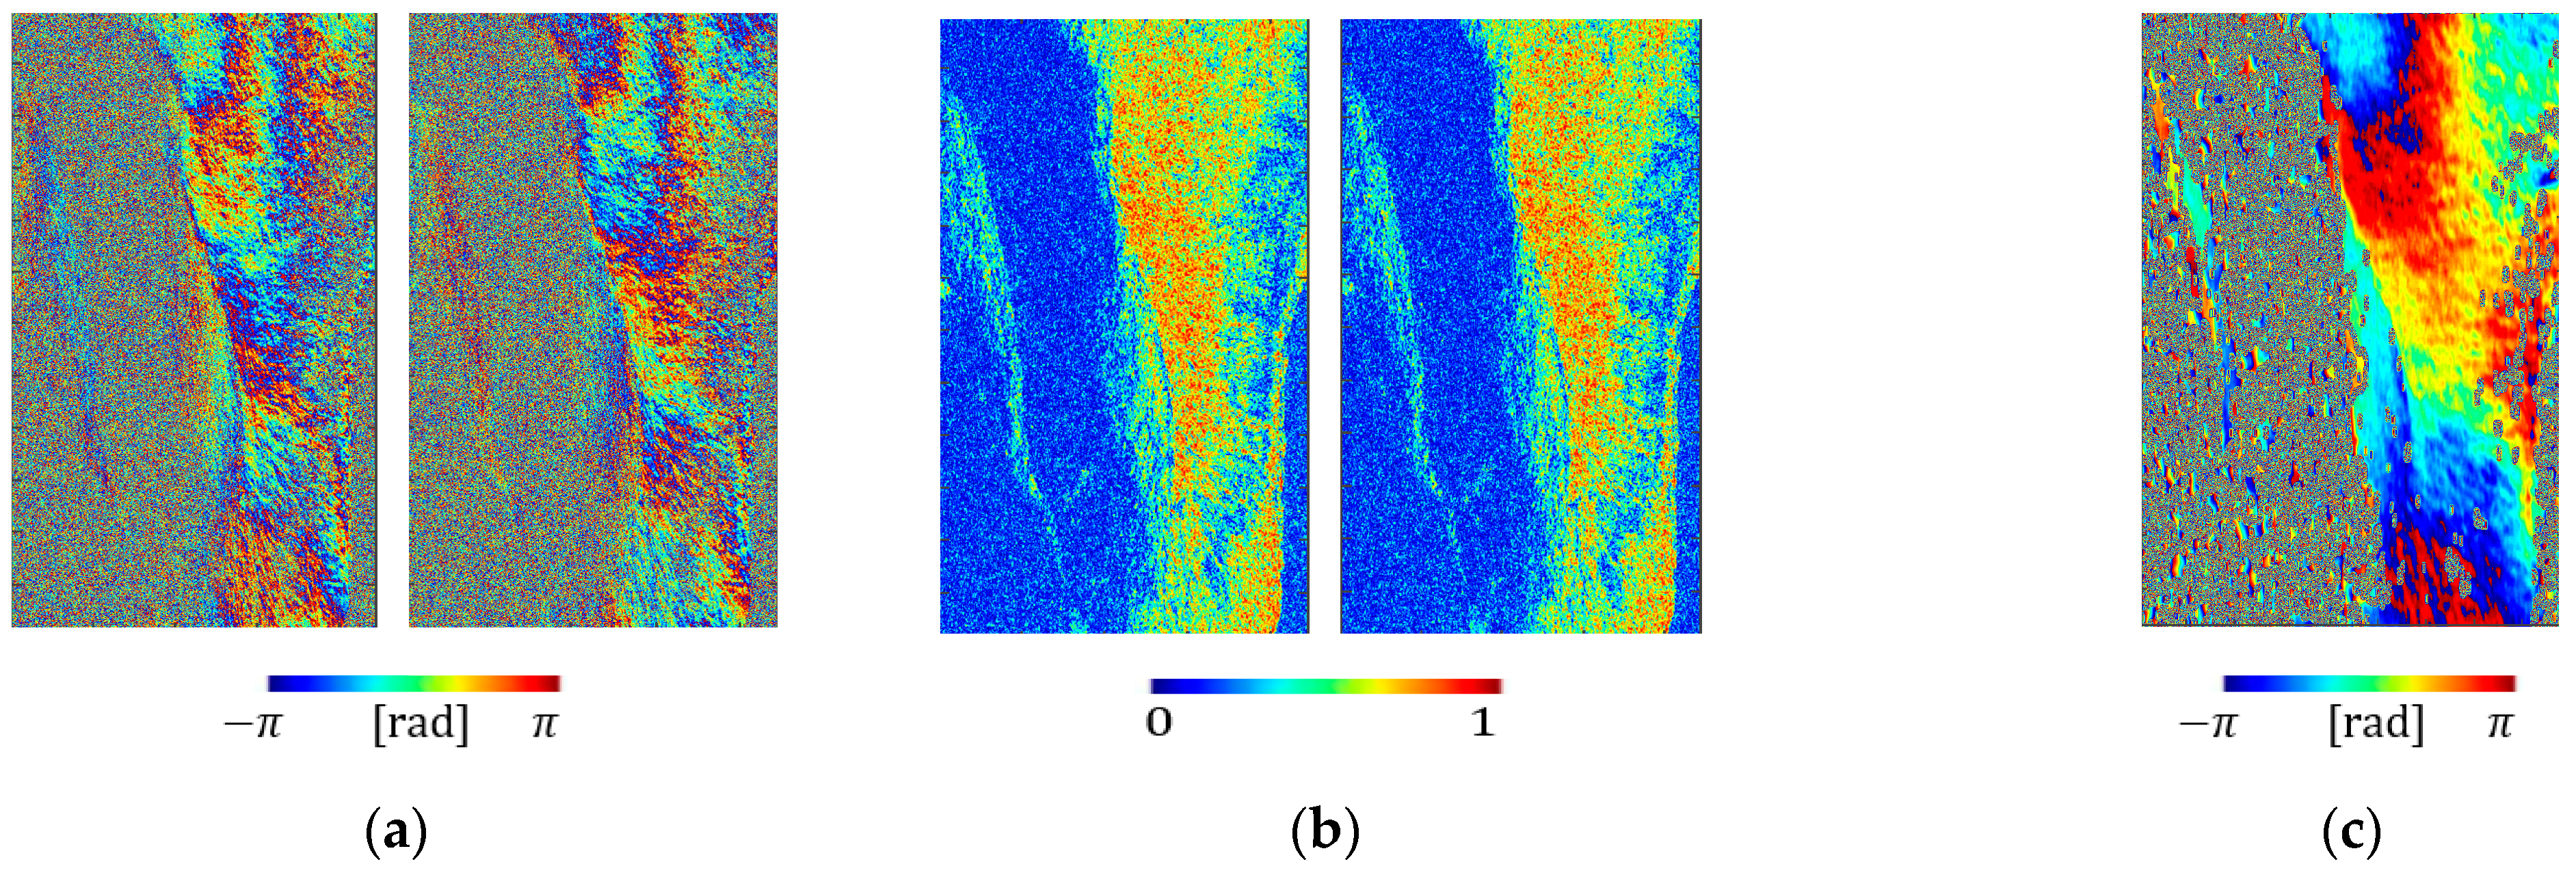
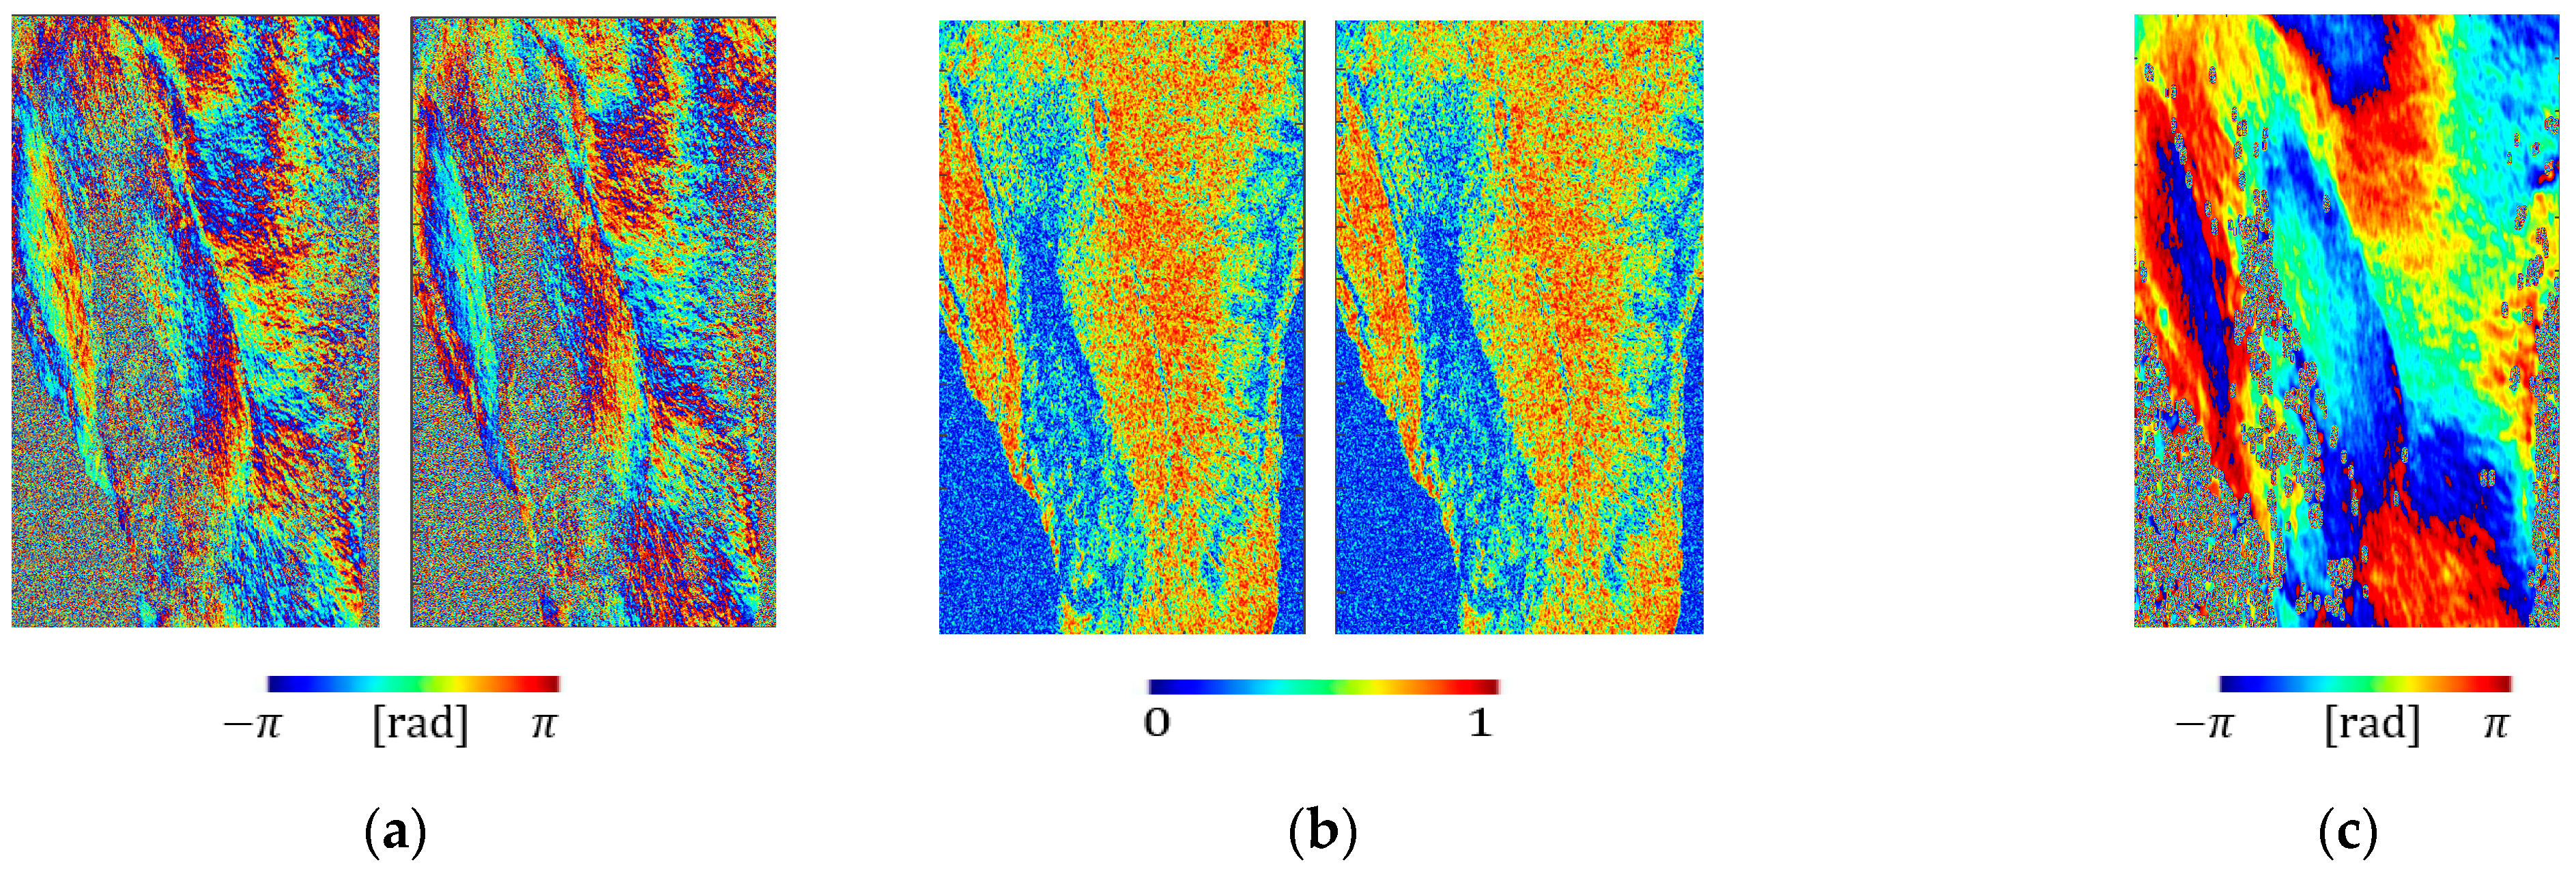
The split-spectrum processing will exacerbate the impact of wavenumber shift, and the performance of the traditional RSS method without CBF will become poor. As is shown in Figure 12, the number of sub-bands is 3, and it is obvious that the coherence and interferometric phase quality is seriously reduced compared with the full-band interferogram. Furthermore, in the facing slope area, the sub-band interferograms are even completely submerged by noise. In combination with the spectrum shift in Figure 11c and the coherence map in Figure 11b, it can be seen that the percentage of spectrum shift in bandwidth is greater than 1/3, and the coherence has been reduced to 0 in that area. Therefore, the ionospheric phase cannot be estimated correctly in that area as shown in Figure 12c. While in the area facing away from the slope, the spectrum shift is relatively small (less than 4 MHz), and the ionospheric phase can be estimated after filtering.
Figure 13 presents the results of the RSS method without CBF when the number of sub-bands is 2. It is obvious that the coherence and interferometric phase quality is kept in good condition compared to the 3 sub-bands case. Especially, in the facing slope area, the percentage of spectrum shift in bandwidth is about 30%~50%. The split-spectrum processing did not lead to complete decorrelation, and the interferometric phase can be reserved by spatial filtering and multi-look processing. Therefore, the ionospheric phase can also be estimated correctly in that area as shown in Figure 13c.
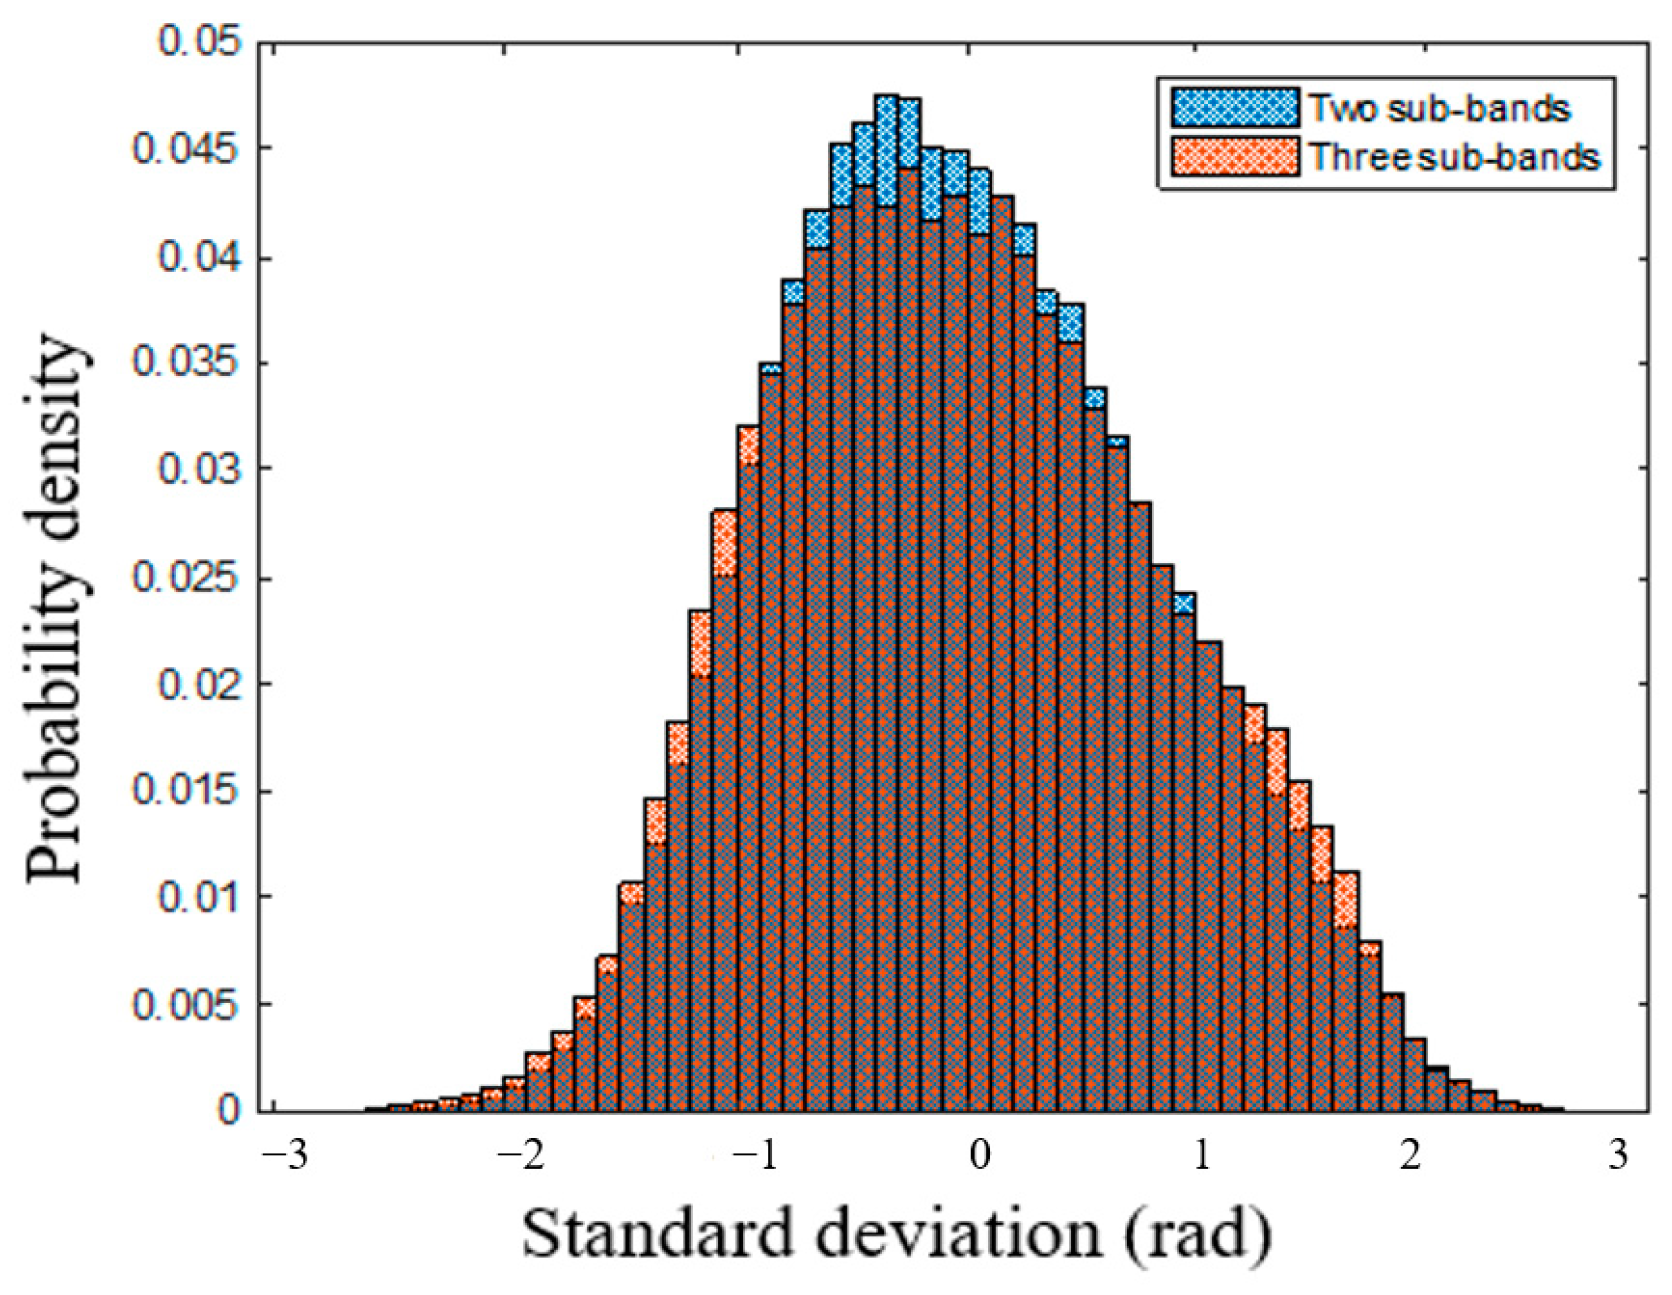
As shown in Figure 14, the standard deviations of the estimated ionospheric phase are counted after IPS correction, assuming an independent Gaussian distribution for phase errors. The standard deviation of the RSS method without CBF in two sub-bands and three sub-bands are 0.812 rad and 0.889 rad, respectively. This was a very practical demonstration of the optimal split-spectrum factor gradually moves to two with the increase in spectrum shift by the RSS method without CBF.

3.2. The RSS Method with CBF

The CBF preprocessing before split-spectrum can increase the coherence of sub-bands and then the estimation accuracy of ionospheric phase. However, due to the traditional RSS model mismatch, the estimation is biased. Especially in the case of large baseline and rugged terrain areas, the variation of the estimation bias will introduce serious relative measurement error by the traditional RSS method with CBF.
According to Equation (22), the estimated bias is also related to the sum of TEU value Σ T E C . Since the reference and secondary images are acquired in the ionospheric quiet period, it is difficult to see the relative measurement error caused by spectrum shift. Therefore, a simulation experiment is conducted by increasing the absolute value of the ionospheric TEC [36].
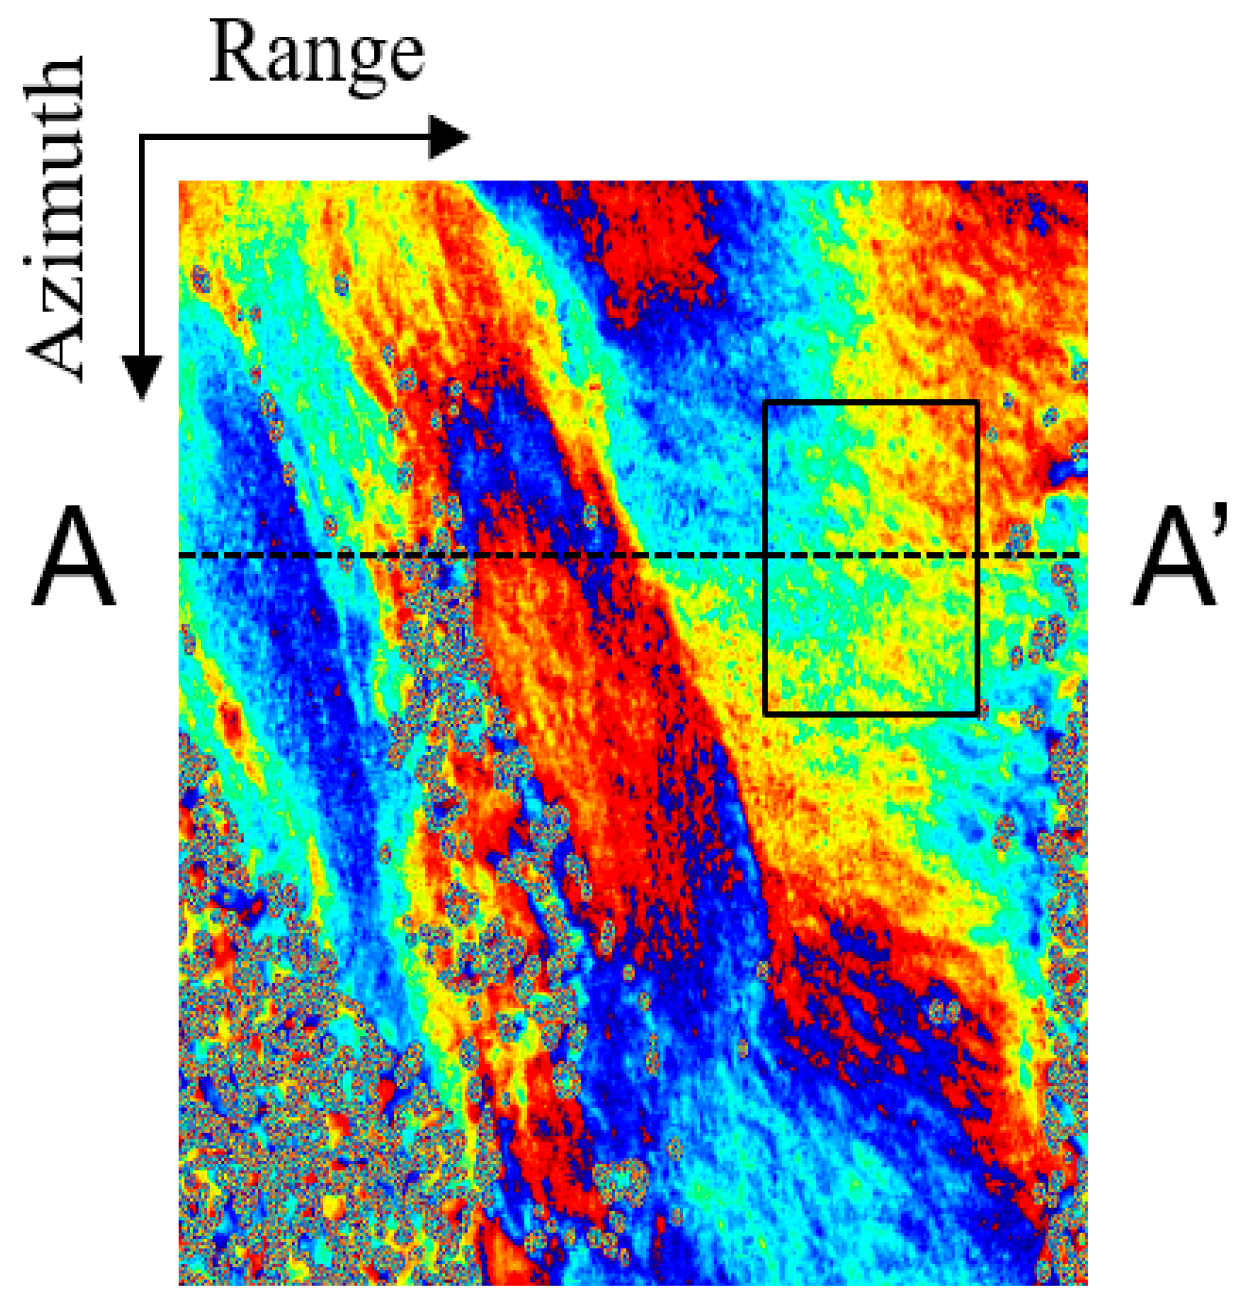
According to the estimated ionospheric phase by the RSS method without CBF, we can calculate the spatial changes of the ionospheric T E C . Then, the TEC value of the reference acquisition is set to T E C 1 = 50 + T E C   T E C U , and, for simplicity, the TEC value of the secondary acquisition is set to a constant T E C 2 = 46   T E C U . According to Equation (12) and the spectrum shift map in Figure 11c, the full-band interferogram after CBF can be obtained as shown in Figure 15. It should be noted that, according to coherence map in Figure 10b, the phase variances are also added to the full-band and sub-band interferograms to simulate the expected noise:
σ φ = N 2 N L 1 γ p 2 γ p 2 ,
where γ p is the coherence of the pixel P.
Then, three RSS methods, the traditional RSS method with CBF, TSVD-based multi-sub-band RSS method, and MTSVD-based multi-sub-band RSS method, are adopted to estimate and compensate the ionospheric phase. Here, the numbers of sub-band are set to 3 and 5, respectively, for the traditional RSS method with CBF and the multi-sub-band RSS method. In addition, an uncertainty of 2 TECU is added to T E C 1 and T E C 2 as the TEC value obtained by GNSS.
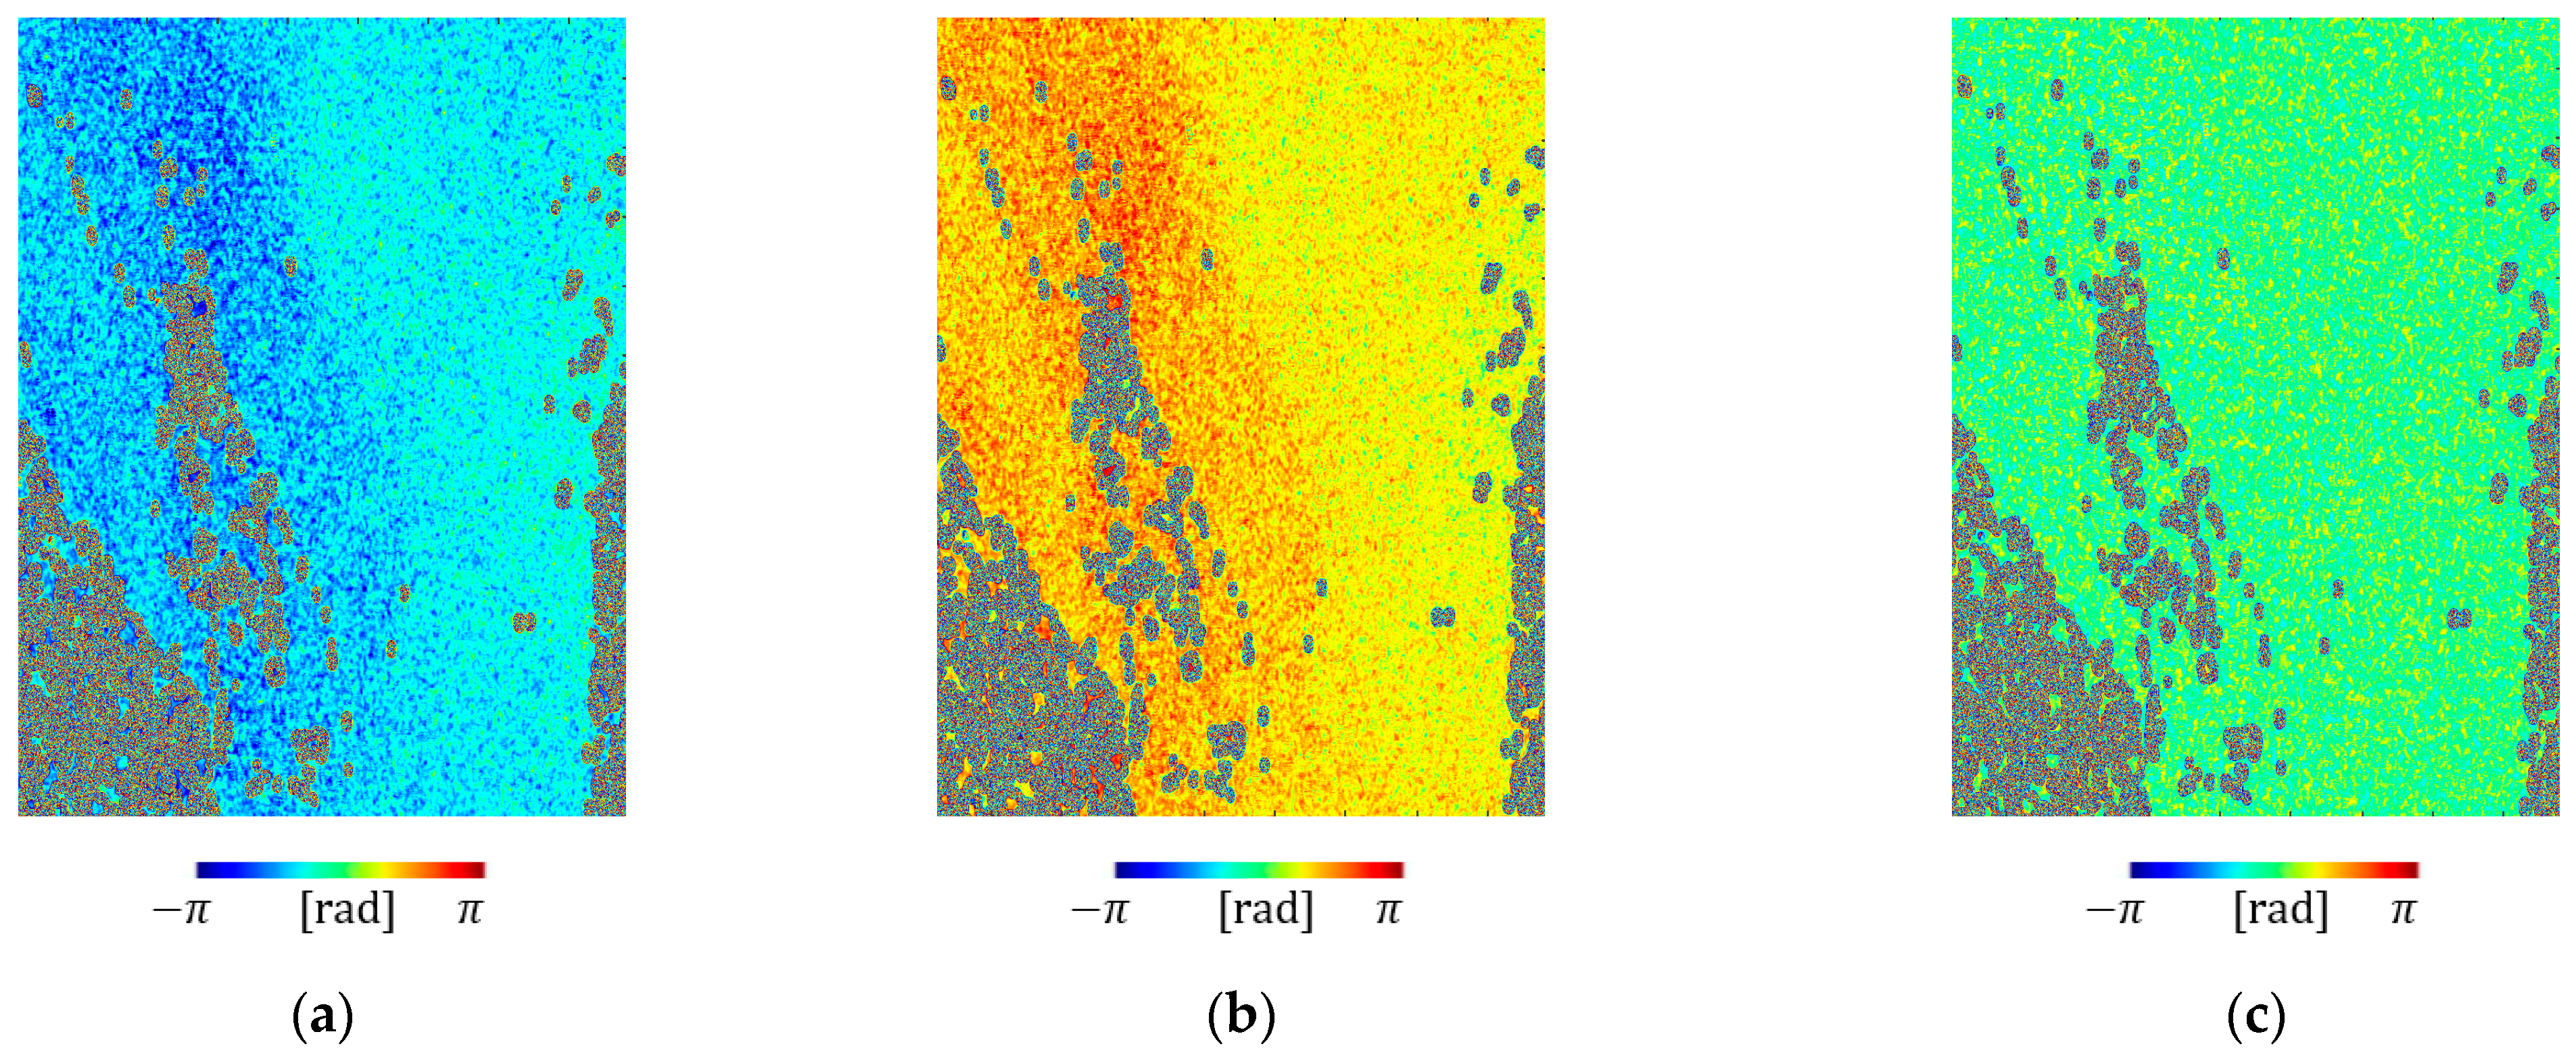
The compensated interferograms are shown in Figure 16. Since only random phase noise is added to the sub-band interferograms, when the estimation is unbiased, the average interferometric phase after compensation should be zero. However, as shown in Figure 16a,b, the traditional RSS method with CBF and the TSVD-based method are all biased. As previously analyzed, the RSS method with CBF does not consider the frequency difference between the primary and secondary images brought by the common band filtering, so the estimation results are biased. The TSVD-based method improves the morbidity of the model by truncating the small singular value of ill-posed observational equation matrix and increases the stability and accuracy of the parameter estimation. However, the structure of the observation equation has been changed after removing the small singular values, which makes the estimation biased. Moreover, the estimation bias changes with the terrain slope angle and the spectrum shift. As shown in Figure 16c, the MTSVD-based method, drawing the solution toward the null space of the regularization matrix constructed by the estimated TEC value from GNSS, can achieve an unbiased estimation.
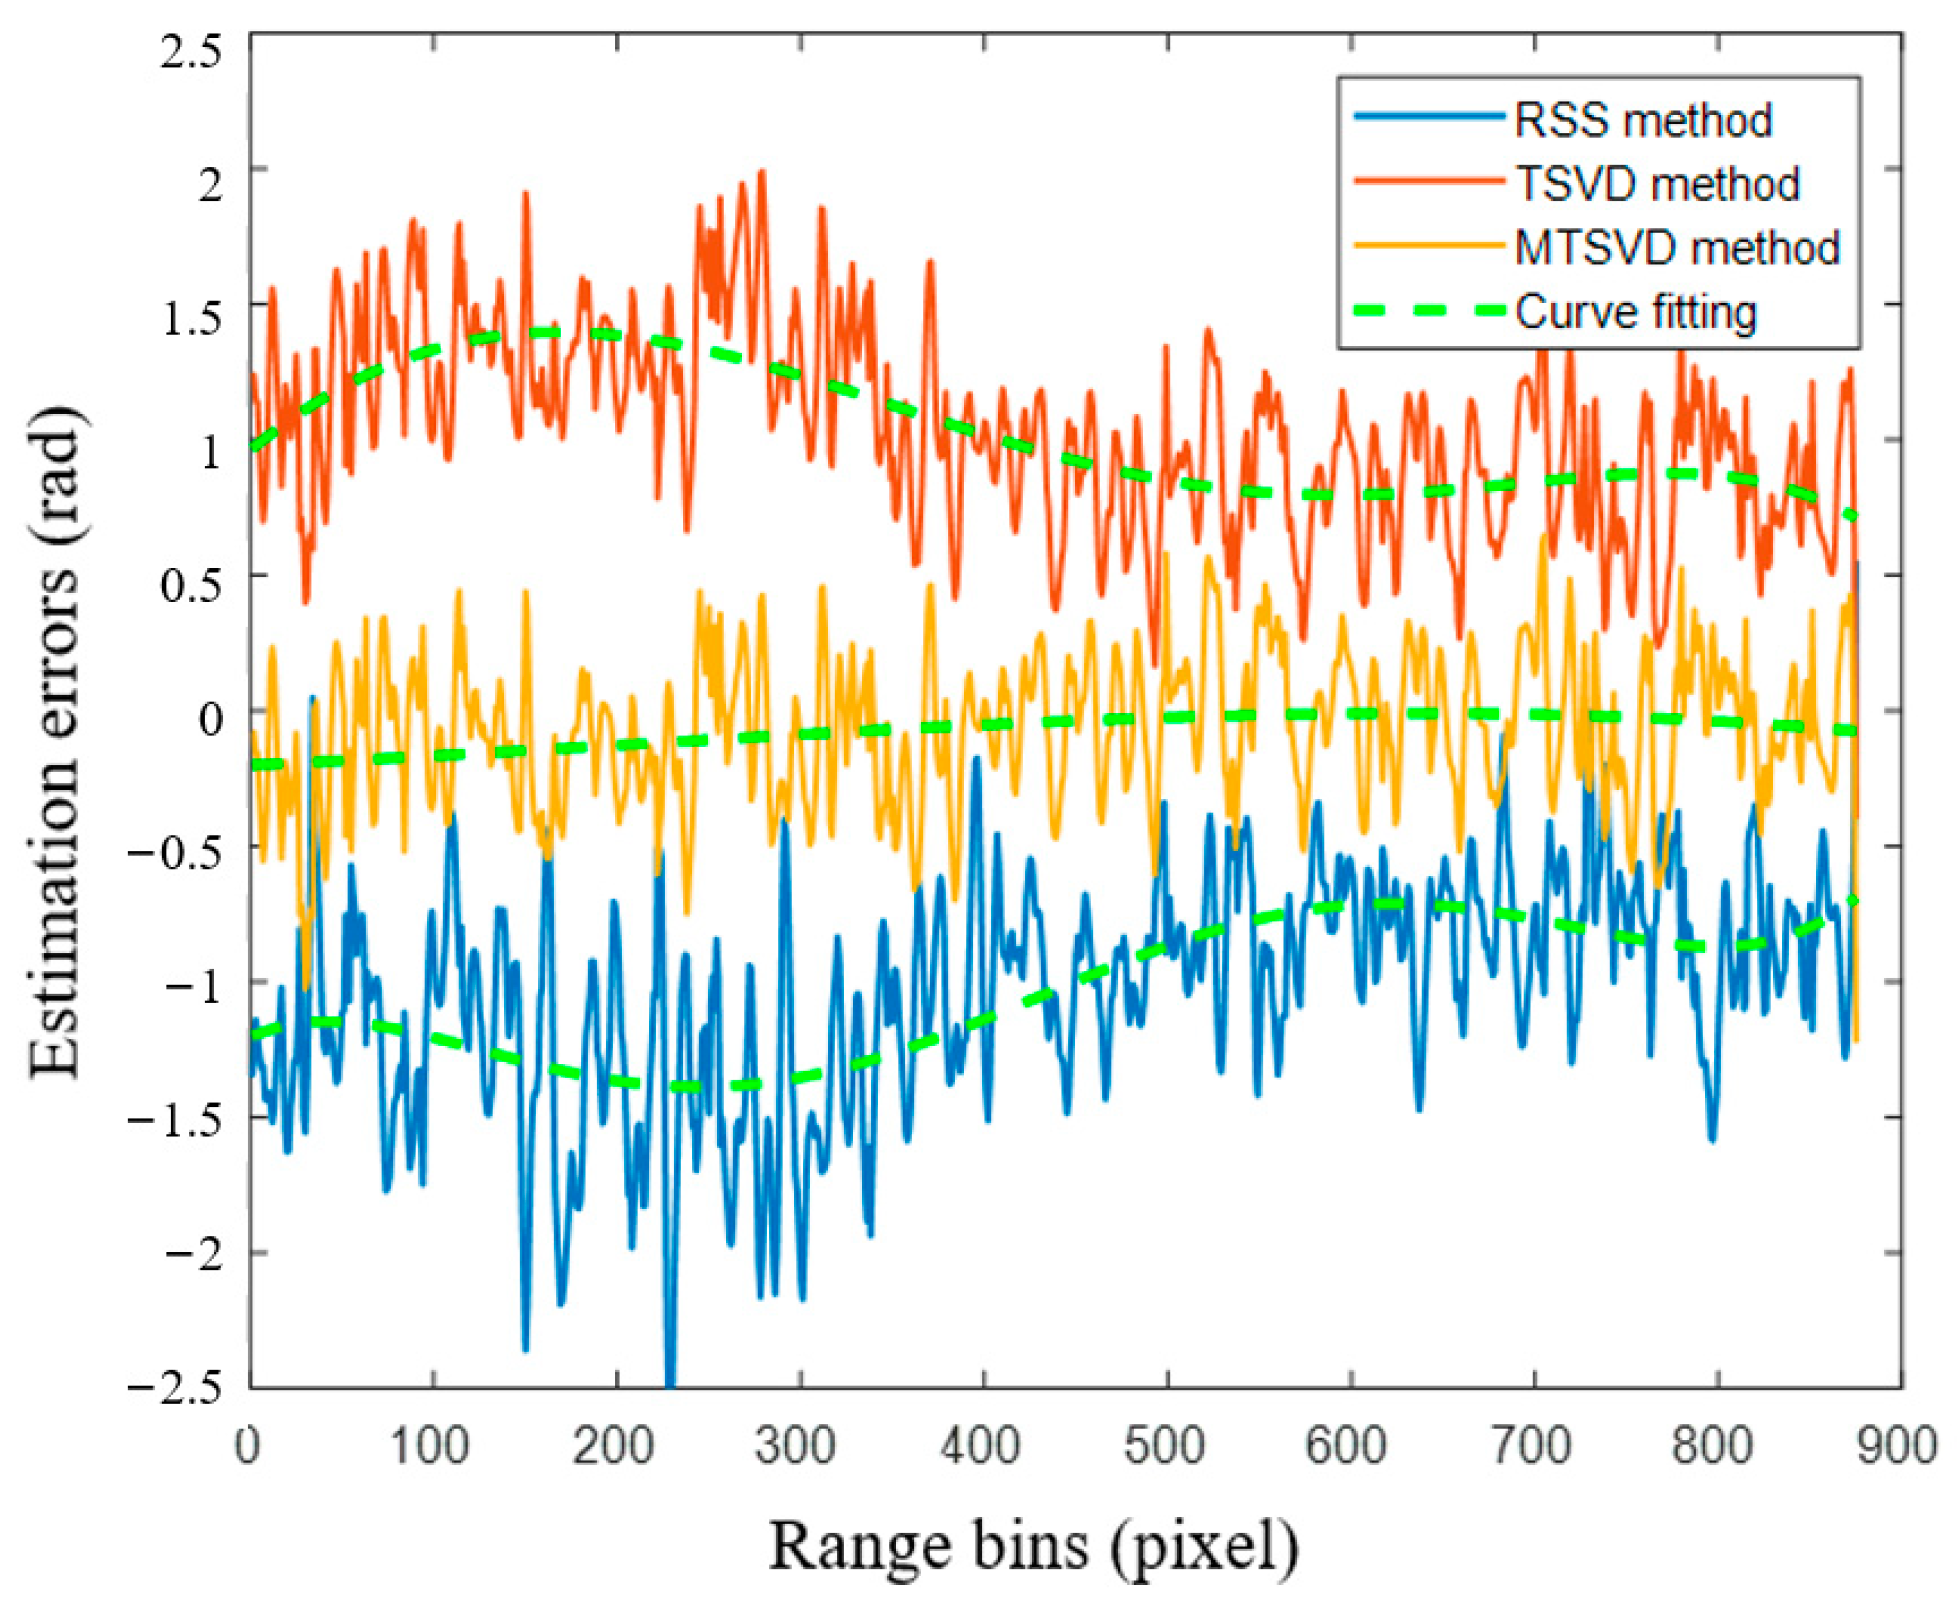
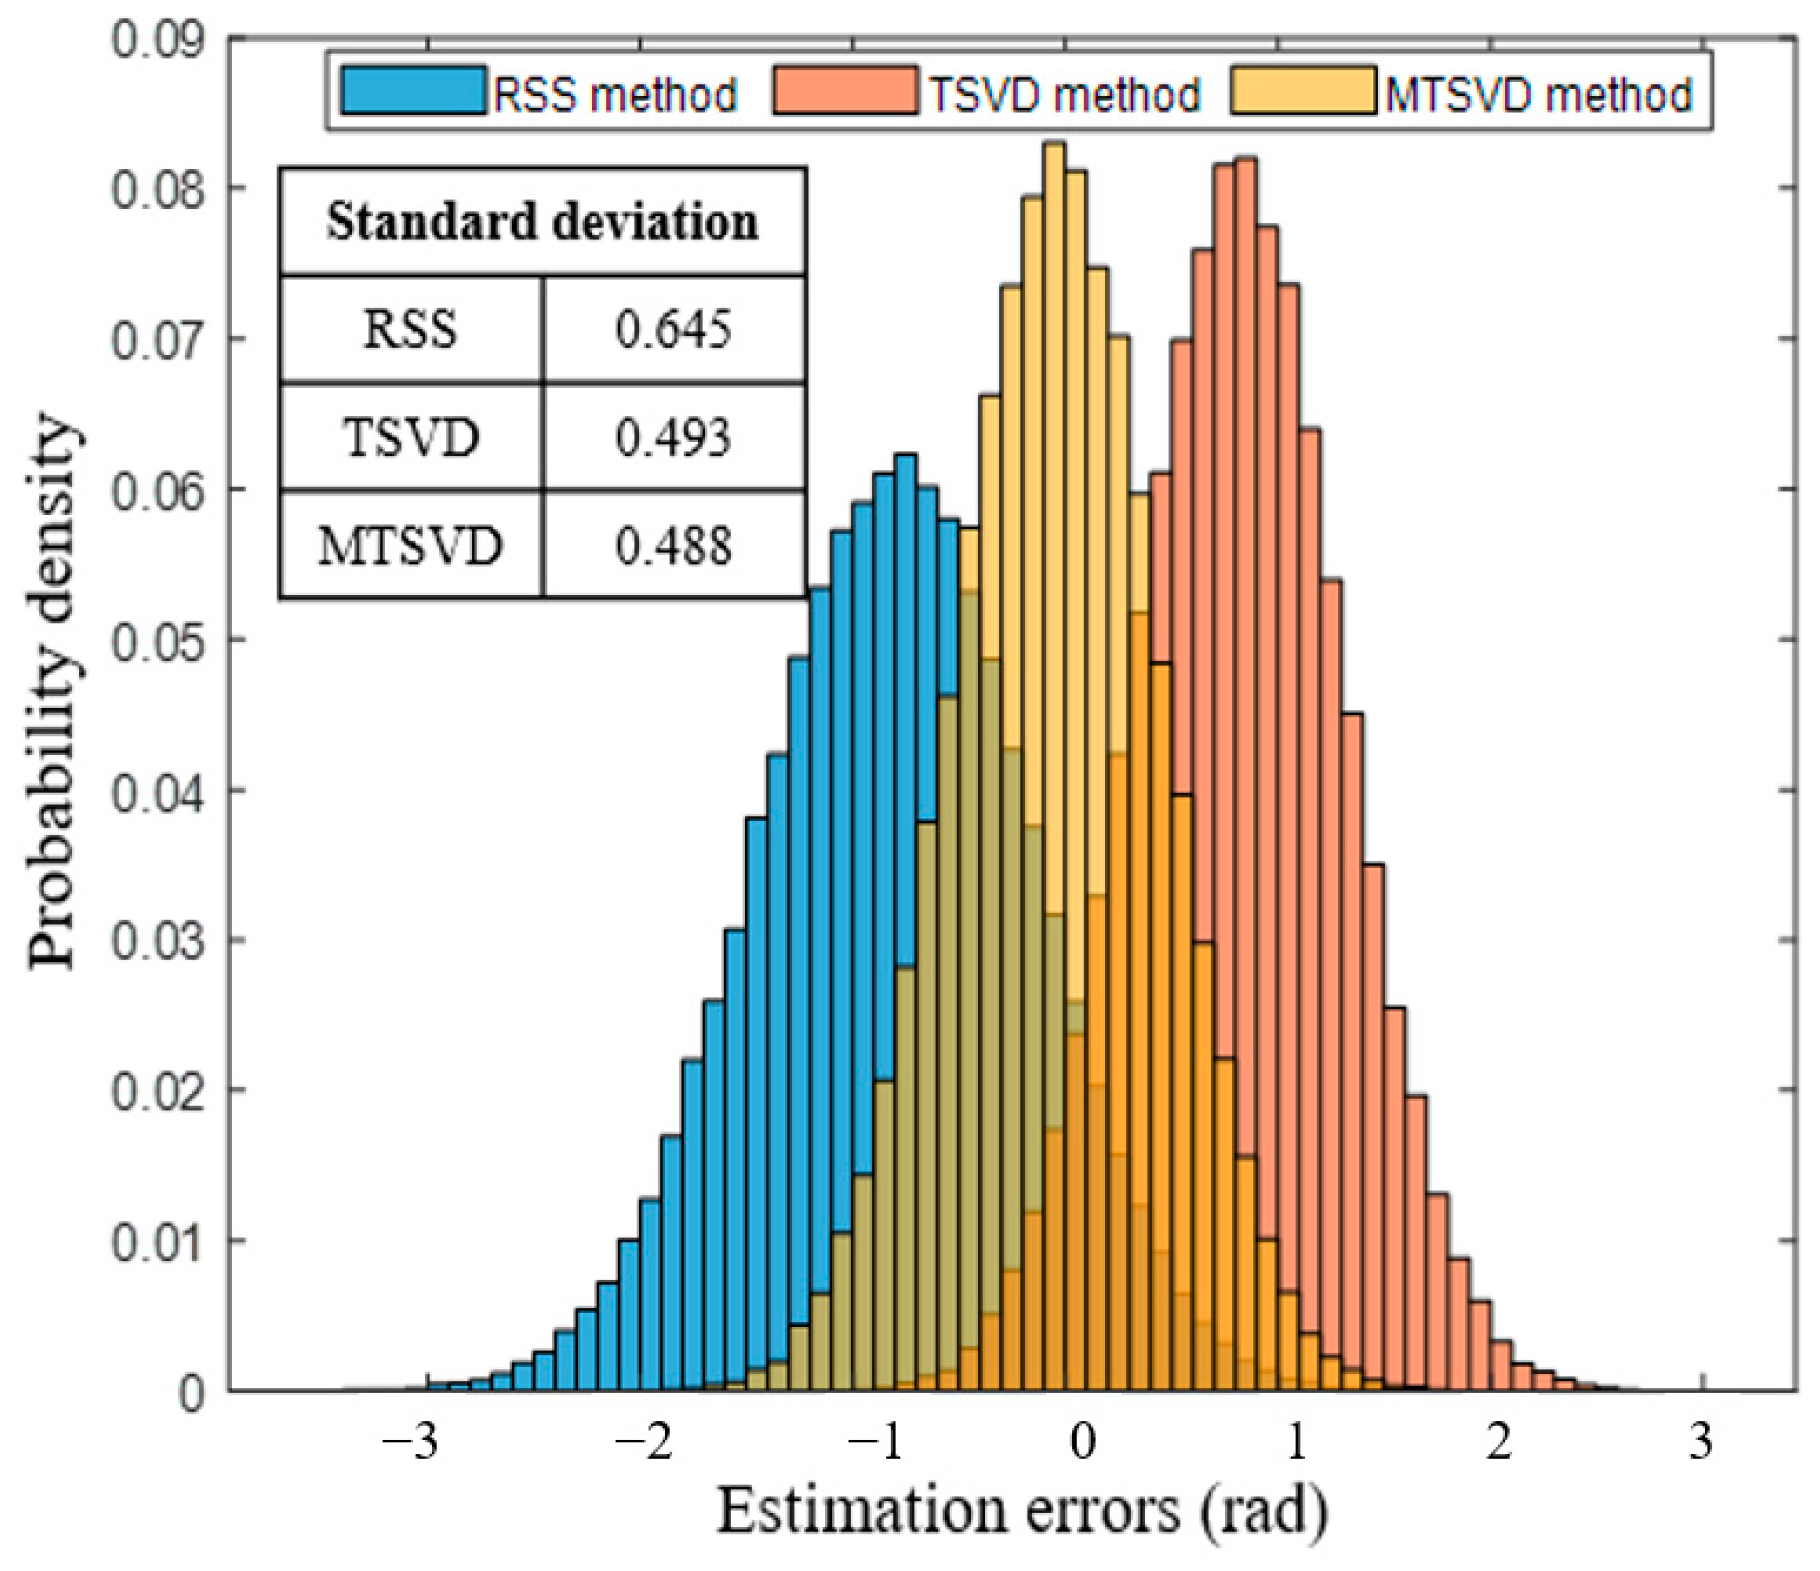
The estimated errors along the range profiles of A-A’ are shown in Figure 17. Combined with the spectrum shift map, it is clear that the changing trend of the estimated bias of the RSS method and TSVD-based method is consistent with the spectrum shift, and the MTSVD-based method can obtain an almost unbiased estimation. Moreover, to evaluate the accuracy of these three methods, the probability density of the estimated error in the black box area in Figure 15 is counted as shown in Figure 18. The standard deviations of the RSS method, TSVD-based method, and MTSVD method are 0.645 rad, 0.493 rad, and 0.488 rad, respectively. Compared with the conventional RSS method, the multi-sub-band-based method could achieve better estimation accuracy for using all available sub-bands.
The reason there appears to be little difference between the TSVD and MTSVD methods in the normalized probability of the standard deviation of the estimated ionospheric phase error is that we only performed the statistical analysis within the small region indicated by the black box in Figure 15. In this region, the frequency shift is consistent, leading to minimal differences in the standard deviation between the two methods. However, it is important to note that while the standard deviation differences are small, the TSVD method produces biased estimates, whereas the MTSVD method provides unbiased estimates. This distinction is evident from the results shown in Figure 16 and Figure 17. The bias in TSVD can result in deformation measurement errors, leading to a false impression of relative deformation on the volcano’s sides, which does not actually exist. The MTSVD algorithm is proposed to address this issue of bias. By providing unbiased estimates, the MTSVD method ensures more accurate deformation measurements, eliminating the erroneous interpretation of relative deformation that could significantly impact the analysis and understanding of volcanic activity.

4. Discussion

According to Equation (22), the ionospheric phase bias is related to the sum of TEU value and the perpendicular baseline length during repeat-pass observation. The TEC value varies according to geographic location, time, season, solar activity, and other space weather phenomena. In specific cases, such as during solar storms or geomagnetic storms, TEC values can significantly increase, leading to abnormally high TEC values in the ionosphere [37,38]. As indicated by the simulation results, it is necessary at this point to consider the ionospheric estimation bias introduced by wavenumber shift and employ the MTSVD-based method proposed in this paper for correction.
In addition, the small baseline interferometric pairs are preferred to measure the land surface deformation, because the spatial decoherence is small and they have low requirements for DEM elevation accuracy. However, large baselines are also desired to achieve a sensitive radar interferometer with a good phase-to-height scaling [39]. This dilemma becomes especially pronounced for future radar sensors, which will provide a high range bandwidth and enable coherent data acquisitions with large interferometric baselines. Moreover, large baselines are also required to achieve a short repeat-pass interval [40]. For example, the ERS-ENVISAT cross-interferometry is a unique tool for a number of applications since it combines a short repeat-pass interval of 28 min with a long perpendicular baseline of 2 km [41]. In addition, large baselines are unavoidable in some cases, such as Moon-based repeat-pass InSAR for the Earth [42,43] and pass-to-pass InSAR for Venus [44]. Therefore, the effect of wavenumber shift on ionospheric phase is important in some specific applications.

5. Conclusions

The influence of wavenumber shift on the RSS method was analyzed profoundly in this paper. It was shown that the split-spectrum processing without CBF deteriorates the coherence of sub-band interferograms sharply and then the estimation accuracy. Moreover, with the increase in spectrum shift, the optimal split-spectrum factor gradually moves from 3 to 2. The conventional RSS method combined with CBF can improve the coherence of sub-band interferograms and estimation accuracy, but the estimation is biased due to the conventional RSS model mismatch. To address the problem, a MTSVD-based multi-sub-band RSS method is proposed in this paper. It divides the range common spectrum into multiple sub-bands to jointly estimate the ionospheric phase, and the prior information of TEC, estimated by GNSS, is introduced to solve the ill-posed problem. The experiment results showed that the proposed method could achieve unbiased estimation and has higher accuracy than that of the conventional RSS method.

Author Contributions

Conceptualization, G.L. and Z.D.; methodology, G.L.; software, H.L.; validation, Z.H.; formal analysis, G.L.; investigation, G.L. and Y.W.; resources, Z.D.; data curation, G.L.; writing—original draft preparation, G.L.; writing—review and editing, G.L.; visualization, Z.H.; supervision, Z.D.; project administration, Z.D.; funding acquisition, Z.D. All authors have read and agreed to the published version of the manuscript.

Funding

This work was supported by the Postdoctoral Fellowship Program of CPSF under Grant GZC20233416, and in part by the National Natural Science Foundation of China (No.61931002, 62101035).

Data Availability Statement

The raw data supporting the conclusions of this article will be made available by the authors on request.

Acknowledgments

ALOS PALSAR data used in this study were provided by the Earth Science Data Systems (ESDS) Program. We are very grateful for the above support. In addition, we would like to thank the anonymous referees and the Associate Editor for useful comments that have helped to improve the presentation of this paper.

Conflicts of Interest

The authors declare no conflicts of interest.

References

  1. Rosen, P.A.; Hensley, S.; Joughin, I.R.; Li, F.K.; Madsen, S.N.; Rodriguez, E.; Goldstein, R.M. Synthetic Aperture Radar interferometry. Proc. IEEE 2000, 88, 333–382. [Google Scholar] [CrossRef]
  2. Bamler, R.; Hartl, P. Synthetic Aperture Radar interferometry. Inverse Probl. 1998, 14, R1. [Google Scholar] [CrossRef]
  3. Liao, Q.; Sheng, Z.; Zhou, S.; Guo, P.; Long, Z.; He, M.; Guan, J. A preliminary study on the inversion method for the refraction structure parameter from vortex electromagnetic waves. Remote Sens. 2023, 15, 3140. [Google Scholar] [CrossRef]
  4. He, Y.; Zhu, X.; Sheng, Z.; He, M. Identification of stratospheric disturbance information in China based on the round-trip intelligent sounding system. Atmos. Chem. Phys. 2024, 24, 3839–3856. [Google Scholar] [CrossRef]
  5. Zebker, H.A.; Rosen, P.A.; Hensley, S. Atmospheric effects in interferometric synthetic aperture radar surface deformation and topographic maps. J. Geophys. Res. Solid Earth 1997, 102, 7547–7563. [Google Scholar] [CrossRef]
  6. Meyer, F.J.; Nicoll, J. The impact of the ionosphere on interferometric SAR processing. In Proceedings of the IGARSS 2008—2008 IEEE International Geoscience and Remote Sensing Symposium, Boston, MA, USA, 6–11 July 2008. [Google Scholar]
  7. Wegmuller, U.; Werner, C.; Strozzi, T.; Wiesmann, A. Ionospheric electron concentration effects on SAR and insar. In Proceedings of the 2006 IEEE International Symposium on Geoscience and Remote Sensing, Denver, CO, USA, 31 July–4 August 2006. [Google Scholar]
  8. Meyer, F.J. Performance requirements for ionospheric correction of low-frequency SAR Data. IEEE Trans. Geosci. Remote Sens. 2011, 49, 3694–3702. [Google Scholar] [CrossRef]
  9. Yunjun, Z.; Fattahi, H.; Pi, X.; Rosen, P.; Simons, M.; Agram, P.; Aoki, Y. Range geolocation accuracy of C-/L-band SAR and its implications for operational stack coregistration. IEEE Trans. Geosci. Remote Sens. 2022, 60, 1–19. [Google Scholar] [CrossRef]
  10. Jin, S.; Park, J.U.; Wang, J.L.; Choi, B.K.; Park, P.H. Electron density profiles derived from ground-based GPS observations. J. Navig. 2006, 59, 395–401. [Google Scholar] [CrossRef]
  11. Liao, W.-T.; Tseng, K.-H.; Lee, I.-T.; Liibusk, A.; Lee, J.-C.; Liu, J.-Y.; Chang, C.-P.; Lin, Y.-C. Sentinel-1 interferometry with ionospheric correction from global and local TEC maps for land displacement detection in Taiwan. Adv. Space Res. 2020, 65, 1447–1465. [Google Scholar] [CrossRef]
  12. Gomba, G.; De Zan, F. Bayesian data combination for the estimation of ionospheric effects in sar interferograms. IEEE Trans. Geosci. Remote Sens. 2017, 55, 6582–6593. [Google Scholar] [CrossRef]
  13. Freeman, A. Calibration of linearly polarized polarimetric SAR data subject to Faraday rotation. IEEE Trans. Geosci. Remote Sens. 2004, 42, 1617–1624. [Google Scholar] [CrossRef]
  14. Rosen, P.; Lavalle, M.; Pi, X.; Buckley, S.; Szeliga, W.; Zebker, H.; Gurrola, E. Techniques and tools for estimating ionospheric effects in interferometric and polarimetric SAR data. In Proceedings of the 2011 IEEE International Geoscience and Remote Sensing Symposium, Vancouver, BC, Canada, 24–29 July 2011. [Google Scholar]
  15. Jung, H.-S.; Lee, D.-T.; Lu, Z.; Won, J.-S. Ionospheric correction of Sar Interferograms by multiple-aperture interferometry. IEEE Trans. Geosci. Remote Sens. 2013, 51, 3191–3199. [Google Scholar] [CrossRef]
  16. Chen, A.C.; Zebker, H.A. Reducing ionospheric effects in Insar data using accurate coregistration. IEEE Trans. Geosci. Remote Sens. 2014, 52, 60–70. [Google Scholar] [CrossRef]
  17. Gomba, G.; Parizzi, A.; De Zan, F.; Eineder, M.; Bamler, R. Toward operational compensation of ionospheric effects in sar interferograms: The split-spectrum method. IEEE Trans. Geosci. Remote Sens. 2016, 54, 1446–1461. [Google Scholar] [CrossRef]
  18. Fattahi, H.; Simons, M.; Agram, P. Insar Time-series estimation of the Ionospheric Phase Delay: An extension of the split range-spectrum technique. IEEE Trans. Geosci. Remote Sens. 2017, 55, 5984–5996. [Google Scholar] [CrossRef]
  19. Gomba, G.; De Zan, F.; Parizzi, A. Ionospheric phase screen and ionospheric azimuth shift estimation combining the split-spectrum and multi-squint methods. In Proceedings of the EUSAR 2016: 11th European Conference on Synthetic Aperture Radar, Hamburg, Germany, 6–9 June 2016; VDE: Berlin, Germany, 2016. [Google Scholar]
  20. Zhang, B.; Wang, C.; Ding, X.; Zhu, W.; Wu, S. Correction of ionospheric artifacts in sar data: Application to fault slip inversion of 2009 southern sumatra earthquake. IEEE Geosci. Remote Sens. Lett. 2017, 15, 1327–1331. [Google Scholar] [CrossRef]
  21. Zhang, B.; Ding, X.; Zhu, W.; Wang, C.; Zhang, L.; Liu, Z. Mitigating ionospheric artifacts in COSEISMIC interferogram based on offset field derived from Alos-Palsar Data. IEEE J. Sel. Top. Appl. Earth Obs. Remote Sens. 2016, 9, 3050–3059. [Google Scholar] [CrossRef]
  22. Rosen, P.A.; Hensley, S.; Chen, C. Measurement and mitigation of the ionosphere in L-band interferometric SAR Data. In Proceedings of the 2010 IEEE Radar Conference, Arlington, VA, USA, 10–14 May 2010. [Google Scholar]
  23. Brcic, R.; Parizzi, A.; Eineder, M.; Bamler, R.; Meyer, F. Estimation and compensation of ionospheric delay for sar interferometry. In Proceedings of the 2010 IEEE International Geoscience and Remote Sensing Symposium, Honolulu, HI, USA, 25–30 July 2010. [Google Scholar]
  24. Gatelli, F.; Guamieri, A.M.; Parizzi, F.; Pasquali, P.; Prati, C.; Rocca, F. The wavenumber shift in sar interferometry. IEEE Trans. Geosci. Remote Sens. 2010, 32, 855–865. [Google Scholar] [CrossRef]
  25. Bamler, R.; Eineder, M. Accuracy of differential shift estimation by correlation and split-bandwidth interferometry for wideband and delta-k SAR systems. IEEE Geosci. Remote Sens. Lett. 2005, 2, 151–155. [Google Scholar] [CrossRef]
  26. Hansen, P.C.; Sekii, T.; Shibahashi, H. The modified truncated SVD method for regularization in general form. SIAM J. Sci. Stat. Comput. 1992, 13, 1142–1150. [Google Scholar] [CrossRef]
  27. Hansen, P.C. Regularization tools: A MATLAB package for analysis and solution of discrete ill-posed problems. Numer. Algorithms 1994, 6, 1–35. [Google Scholar] [CrossRef]
  28. Noschese, S.; Reichel, L. A modified truncated singular value decomposition method for discrete ill-posed problems. Numer. Linear Algebra Appl. 2014, 21, 813–822. [Google Scholar] [CrossRef]
  29. Li, Z.; Yuan, Y.; Wang, N.; Hernandez-Pajares, M.; Huo, X. Shpts: Towards a new method for generating precise global ionospheric TEC map based on spherical harmonic and generalized trigonometric series functions. J. Geod. 2014, 89, 331–345. [Google Scholar] [CrossRef]
  30. Fletcher, K. Insar Principles: Guidelines for SAR Interferometry Processing and Interpretation; ESA: Noordwijk, The, Netherlands, 2007. [Google Scholar]
  31. Fornaro, G.; Guarnieri, A.M. Minimum mean square error space-varying filtering of interferometric SAR data. IEEE Trans. Geosci. Remote Sens. 2002, 40, 11–21. [Google Scholar] [CrossRef]
  32. Wegmüller, U.; Werner, C.; Frey, O.; Magnard, C.; Strozzi, T. Reformulating the split-spectrum method to facilitate the estimation and compensation of the ionospheric phase in sar interferograms. Procedia Comput. Sci. 2018, 138, 318–325. [Google Scholar] [CrossRef]
  33. Chen, C.W.; Zebker, H.A. Phase unwrapping for large SAR interferograms: Statistical segmentation and Generalized Network Models. IEEE Trans. Geosci. Remote Sens. 2002, 40, 1709–1719. [Google Scholar] [CrossRef]
  34. Chen, P.; Yao, Y.; Yao, W. Global ionosphere maps based on GNSS, satellite altimetry, radio occultation and Doris. GPS Solut. 2016, 21, 639–650. [Google Scholar] [CrossRef]
  35. Reuveni, Y.; Bock, Y.; Tong, X.; Moore, A.W. Calibrating interferometric synthetic aperture radar (INSAR) images with regional GPS network atmosphere models. Geophys. J. Int. 2015, 202, 2106–2119. [Google Scholar] [CrossRef]
  36. Du, S.; Yu, A.; Zhang, Y.; Zhang, Q.; Wu, P.; Wang, Q. Research on ionospheric effects and error calibration for L-band spaceborne D-InSAR. In Proceedings of the 2016 IEEE International Geoscience and Remote Sensing Symposium (IGARSS), Beijing, China, 10–15 July 2016; pp. 5943–5946. [Google Scholar]
  37. Yang, J.; Huang, W.; Xia, G.; Zhou, C.; Chen, Y. Operational forecasting of Global Ionospheric TEC maps 1-, 2-, and 3-day in advance by CONVLSTM model. Remote Sens. 2024, 16, 1700. [Google Scholar] [CrossRef]
  38. Cooper, C.; Mitchell, C.N.; Wright, C.J.; Jackson, D.R.; Witvliet, B.A. Measurement of ionospheric total electron content using single-frequency geostationary satellite observations. Radio Sci. 2019, 54, 10–19. [Google Scholar] [CrossRef]
  39. Pinheiro, M.; Reigber, A.; Moreira, A. Large-baseline insar for precise topographic mapping: A framework for tandem-X large-baseline data. Adv. Radio Sci. 2017, 15, 231–241. [Google Scholar] [CrossRef]
  40. Krieger, G.; Hajnsek, I.; Papathanassiou, K.P.; Younis, M.; Moreira, A. Interferometric synthetic aperture radar (SAR) missions employing formation flying. Proc. IEEE 2010, 98, 816–843. [Google Scholar] [CrossRef]
  41. Wegmuller, U.; Santoro, M.; Werner, C.; Strozzi, T.; Wiesmann, A. ERS-Envisat Tandem Cross—Interferometry coherence estimation. In Proceedings of the 2009 IEEE International Geoscience and Remote Sensing Symposium, Cape Town, South Africa, 12–17 July 2009. [Google Scholar]
  42. Jiang, H.; Dong, J.; Jiang, L.; Li, D. Moon-based SAR for Earth observation and its spatial baseline decorrelation in repeat-pass interferometry. In Proceedings of the IGARSS 2019—2019 IEEE International Geoscience and Remote Sensing Symposium, Yokohama, Japan, 28 July–2 August 2019. [Google Scholar]
  43. Li, G.; Ding, Z.; Li, M.; Zhang, T.; Zeng, T.; Long, T. Earth-based repeat-pass SAR interferometry of the moon: Spatial–temporal baseline analysis. IEEE Trans. Geosci. Remote Sens. 2022, 60, 1–14. [Google Scholar] [CrossRef]
  44. Meyer, F.J.; Sandwell, D.T. SAR interferometry at Venus for topography and change detection. Planet. Space Sci. 2012, 73, 130–144. [Google Scholar] [CrossRef]
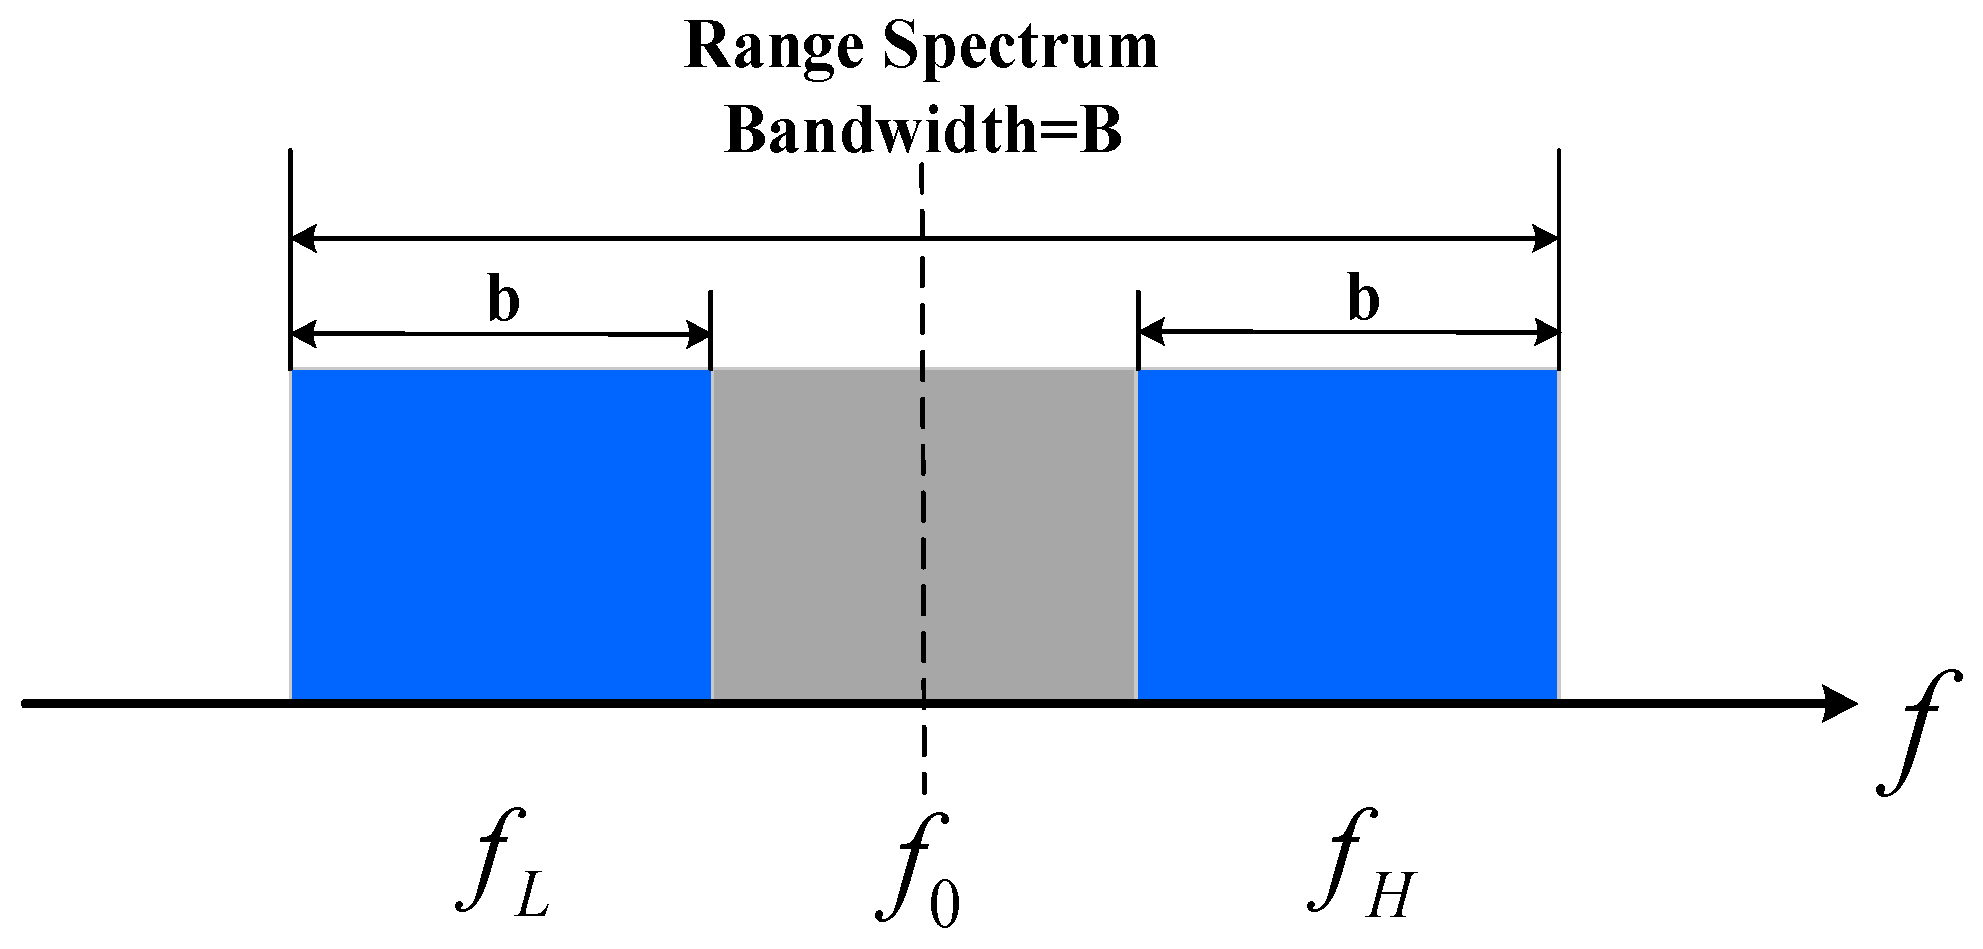
Figure 1. Range split-spectrum. B and b are the bandwidth of the full-band and the sub-band interferograms, respectively.
Remotesensing 16 02555 g001
Figure 2. The RSS method without CBF: the common spectrum parts, corresponding to available range spectrum yield interferometric information, in sub-bands greatly diminished.
Remotesensing 16 02555 g002
Figure 3. The RSS method with CBF: the center frequencies of the full-band and sub-band interferometric pairs are no longer equal.
Remotesensing 16 02555 g003
Figure 4. The estimation accuracy of the RSS method without CBF and with CBF in different spectrum shifts.
Remotesensing 16 02555 g004
Figure 5. The estimation accuracy of the WLS-based RSS method.
Remotesensing 16 02555 g005
Figure 6. The variation of estimation standard deviation of TSVD and MTSVD with the number of sub-bands.
Remotesensing 16 02555 g006
Figure 7. The variation of estimation RMSE of TSVD and MTSVD with the error of TEC value.
Remotesensing 16 02555 g007
Figure 8. The processing workflow of the MTSVD-based multi-sub-band method.
Remotesensing 16 02555 g008
Figure 9. Red box indicates coverage of the dataset used in this study.
Remotesensing 16 02555 g009
Figure 10. Topographic map and local terrain slope angle: (a) Elevation map. (b) Local terrain slope angle.
Remotesensing 16 02555 g010
Figure 11. Full-band: (a) Original interferogram. (b) Coherence map. (c) Spectrum shift map.
Remotesensing 16 02555 g011
Figure 12. The RSS method without CBF, and the number of sub-band is 3: (a) Interferogram. (b) Coherence map. (c) The estimated ionospheric phase.
Remotesensing 16 02555 g012
Figure 13. The RSS method without CBF, and the number of sub-band is 2: (a) Interferogram. (b) Coherence map. (c) The estimated ionospheric phase.
Remotesensing 16 02555 g013
Figure 14. Normalized probability of the standard deviation of the estimated ionospheric phase.
Remotesensing 16 02555 g014
Figure 15. The original interferogram after CBF.
Remotesensing 16 02555 g015
Figure 16. The compensated interferograms by: (a) RSS method, (b) TSVD-based method, and (c) MTSVD-based method.
Remotesensing 16 02555 g016
Figure 17. The estimated errors along profiles of A-A’.
Remotesensing 16 02555 g017
Figure 18. Normalized probability of the standard deviation of the estimated ionospheric phase error.
Remotesensing 16 02555 g018
Table 1. Scenes acquisition information.
ParametersValueUnit
Radar frequency1.27GHz
Incident angle34.3degrees
InclinationDescending/
Reference SLCDate4 May 2008
Time20:42 (UTC)
ModeFBD
Secondary SLCDate19 June 2008/
Time20:41 (UTC)
ModeFBD
AzimuthResolution3.2m
Width60km
Ground rangeResolution16.6m
Width70km
Perpendicular baseline2400m
Temporal baseline46day
Disclaimer/Publisher’s Note: The statements, opinions and data contained in all publications are solely those of the individual author(s) and contributor(s) and not of MDPI and/or the editor(s). MDPI and/or the editor(s) disclaim responsibility for any injury to people or property resulting from any ideas, methods, instructions or products referred to in the content.