Article

Evaluation of Radar Precipitation Products and Assessment of the Gauge-Radar Merging Methods in Southeast Texas for Extreme Precipitation Events

1
Department of Civil Engineering, The University of Texas at Arlington, Arlington, TX 76010, USA
2
Department of Civil and Environmental Engineering, Rice University, Houston, TX 77005, USA
*
Author to whom correspondence should be addressed.
Remote Sens. 2023, 15(8), 2033; https://doi.org/10.3390/rs15082033
Submission received: 25 February 2023 / Revised: 7 April 2023 / Accepted: 9 April 2023 / Published: 12 April 2023
(This article belongs to the Special Issue Hydrometeorological Hazards in the USA and Europe)

Abstract

:
Many radar-gauge merging methods have been developed to produce improved rainfall data by leveraging the advantages of gauge and radar observations. Two popular merging methods, Regression Kriging and Bayesian Regression Kriging were utilized and compared in this study to produce hourly rainfall data from gauge networks and multi-source radar datasets. The authors collected, processed, and modeled the gauge and radar rainfall data (Stage IV, MRMS and RTMA radar data) of the two extreme storm events (i.e., Hurricane Harvey in 2017 and Tropical Storm Imelda in 2019) occurring in the coastal area in Southeast Texas with devastating flooding. The analysis of the modeled data on consideration of statistical metrics, physical rationality, and computational expenses, implies that while both methods can effectively improve the radar rainfall data, the Regression Kriging model demonstrates its superior performance over that of the Bayesian Regression Kriging model since the latter is found to be prone to overfitting issues due to the clustered gauge distributions. Moreover, the spatial resolution of rainfall data is found to affect the merging results significantly, where the Bayesian Regression Kriging model works unskillfully when radar rainfall data with a coarser resolution is used. The study recommends the use of high-quality radar data with properly spatial-interpolated gauge data to improve the radar-gauge merging methods. The authors believe that the findings of the study are critical for assisting hazard mitigation and future design improvement.

1. Introduction

Accurate and high-resolution rainfall data are essential for most hydrological and hydraulic (H&H) studies, including water resource management, flood hazard mitigation, and flood modeling for developing early warning and prompt emergency response systems [1,2,3]. Precipitation can be measured in various ways, including directly using rain gauges and indirectly using radar or satellite systems [4]. Though the rain gauge data are considered as ground reference, spatial interpolation is needed to obtain a larger regional coverage since the distribution of rain gauges is sometimes scattered and limited to specific locations, making it challenging to represent the rainfall on a larger scale [5,6]. Another source of precipitation estimates involves satellite-based data, which provides large spatial coverage. Still, it is limited to coarse spatial resolution (10–25 km) with low accuracy that leaves it inadequate for local flooding analysis.
Alternatively, radar-based quantitative precipitation estimation (QPE) data cover spatially continuous information in higher spatial resolution and precision. The data have been evolving over the last two decades with improved precision quality and thus broadly used for engineering design standard, H&H studies and flood forecasting [7,8,9,10]. However, many sources of radar-based data are still prone to uncertainties from errors in reflectivity-to-rainfall conversion (i.e., Z-R relationship) and signal measurements [11,12,13]. Many studies also found that the data of rain gauges, weather radar, and satellite QPEs bear uncertainties in measuring extreme precipitation, which can further limit the QPE products for their reliable usage in flooding prediction and disaster mitigation [14,15,16]. Therefore, better methods for enhancing the accuracy of radar estimates are still needed. With the advantages of radar rainfall data in preserving spatial coverage and rain gauge data in obtaining accurate site value, a merged product of both has demonstrated a promising potential for achieving superior rainfall estimations [17,18]. From the early 1980s, numerous methods have been developed concerning the merging of radar-rain gauge data that can be classified according to (1) bias reduction or error variance minimization methods [19,20,21], which focus on approaches to improving the quality of radar QPE products; (2) data-fusion or geostatistical and non-geostatistical methods [11,22,23,24], where geostatistical methods usually make use of (semi)variogram to present the rainfall field’s spatial covariance structure; (3) adjustment, interpolation, or integration methods [16,17,25], where the adjustment methods focus on using rain gauge records to adjust radar estimates, the interpolation methods use radar spatial association as additional information for interpolating gauge data, and the integration methods conduct a true integration of radar and gauge rainfall data. More details of the rainfall-gauge merging methods can be found in the review papers [26,27,28].
Many studies found that rainfall-gauge merging methods almost always lead to better rainfall estimates than those from solely using the radar QPE or rain gauge data [29,30,31], especially on large scales [32,33,34,35,36]. In turn, there is increasing interest in studies of intercomparing various merging methods [37,38,39,40,41], and their applicability in urban scales with finer resolutions for extreme events [9,19,42,43]. While merged rainfall products were generally evaluated in those studies on considering statistical measures (e.g., Pearson correlation coefficient or the coefficient of determination) based on point gauge data, the other factors, such as physical rationality (e.g., rainfall pattern or quantity) were inadequately considered and evaluated.
This study aimed to evaluate the most used radar QPE products and to assess how two different radar-gauge merging methods (Regression Kriging and Bayesian Regression Kriging methods) can produce improved high-resolution precipitation products for two severe storm events (Hurricane Harvey in 2017 and Tropical Storm Imelda in 2019). The performance of each method for both events was systematically evaluated, compared, and discussed concerning their statistical metrics using validation gauges, as well as physical expandability based on spatiotemporal distributions. Based on the analysis, the best-performing and most efficient merging techniques of each event were identified and evaluated, thereby further showing their potential applications for future flood forecasting and rapid disaster mitigation.

2. Data and Methodology

2.1. Study Area

The study area resides along the coastline in Southeastern Texas between Houston and Beaumont, Texas with the Interstate Highway-10 across the area in the center, including seventeen HUC-10 watersheds of 8265 square kilometers (Figure 1) and 168 rain gauges. The region is located from latitude 29°21′3.5994″ to 30°28′19.2″N and longitude 93°35′2.4″ to 95°5′20.3994″W, covering the whole Chambers County, most areas of Jefferson County, Orange County, and some parts of Galveston County, Harris County, Liberty County, and Jasper County. This region is vulnerable to extreme rainfall events such as hurricanes and tropical storms [44,45]. During Hurricane Harvey in 2017, this area experienced the most intensive and accumulated amount of rainfall among the impacted coastal communities.

2.2. Radar Rainfall Data

This study assesses three radar rainfall quantitative precipitation estimation (QPE) products, namely: (1) NCEP/EMC 4-km Gridded Data Stage IV Data (Stage IV) [46]; (2) 1-km Multi-Radar Multi-Sensor (MRMS) [47]; and (3) 2.5-km Real-Time Mesoscale Analysis (RTMA) [48].
Stage IV product is a national mosaic of regional multi-sensor (combination of quality-controlled WSR-88D, and rain gauge data) precipitation estimates which are produced hourly at the National Weather Service (NWS) River Forecast Centers (RFCs) for operational hydrologic forecasting at the Hydrologic Rainfall Analysis Project (HRAP) grid of approximately 4 × 4 km2 spatial resolution [49].
MRMS, another emerging radar-based weather sensing/monitoring system, was developed at the NOAA/NSSL (National Severe Storms Laboratory, Norman, OK, USA) and has been operational at the National Oceanic and Atmospheric Administration/National Centers for Environmental Prediction (NOAA/NCEP) since September 2014. The gauge bias-corrected product of MRMS has a 1 km2 spatial resolution and hourly temporal resolution. The rain gauge data used for bias correction in MRMS is quality-controlled from the Hydrometeorological Automated Data System (HADS; www.nws.noaa.gov/oh/hads/, accessed on 31 January 2022). In this study, version 11.0 and version 11.6.1 of the gauge-corrected MRMS products were accessed on 25 November 2021 and used for Hurricane Harvey (2017) and Tropical Storm Imelda (2019), respectively. In May of 2018, MRMS Version 11.5 became operational and available in the National Weather Service (NWS) with a number of updates that impact the generation and delivery of MRMS QPE products, including the ability to handle new volume coverage patterns from the NWS fleet of WSR-88D radars, new radar quality index logic, more hourly gauges, and reduced product latency [50,51].
RTMA, which is also produced by NOAA/NCEP, has a 2.5 km spatial resolution and hourly temporal resolution for near-surface weather conditions. It is developed by interpolating the early version NCEP Stage II multi-sensor hourly precipitation analysis from the 4-km HRAP grid [49] onto the 2.5-km RTMA grid using the Gridpoint Statistical Interpolation [52] package.
All these radar QPE data have been widely used and their overall accuracy and performance evaluated in hydrologic simulations during extreme events [53,54,55]. In this study, the three products were evaluated before and after merging with rain gauge data and the impact of the radar spatial resolution (1 km, 2.5 km, and 4 km) on the radar-gauge merging results was also investigated.

2.3. Rain Gauge Data

Rain gauge data were obtained from the Community Collaborative Rain, Hail, and Snow Network (CoCoRaHS), NOAA’s National Centers for Environmental Information (NCEI), Harris County Flood Control District (HCFCD), Jefferson County Drainage District No. 6 (DD6), Southeast Texas Regional Alerting & Information Network (RAIN), the Hydrometeorological Automated Data System (HADS) and the Automated Surface Observing System (ASOS). All 168 gauges analyzed in this study are presented in Figure 1.
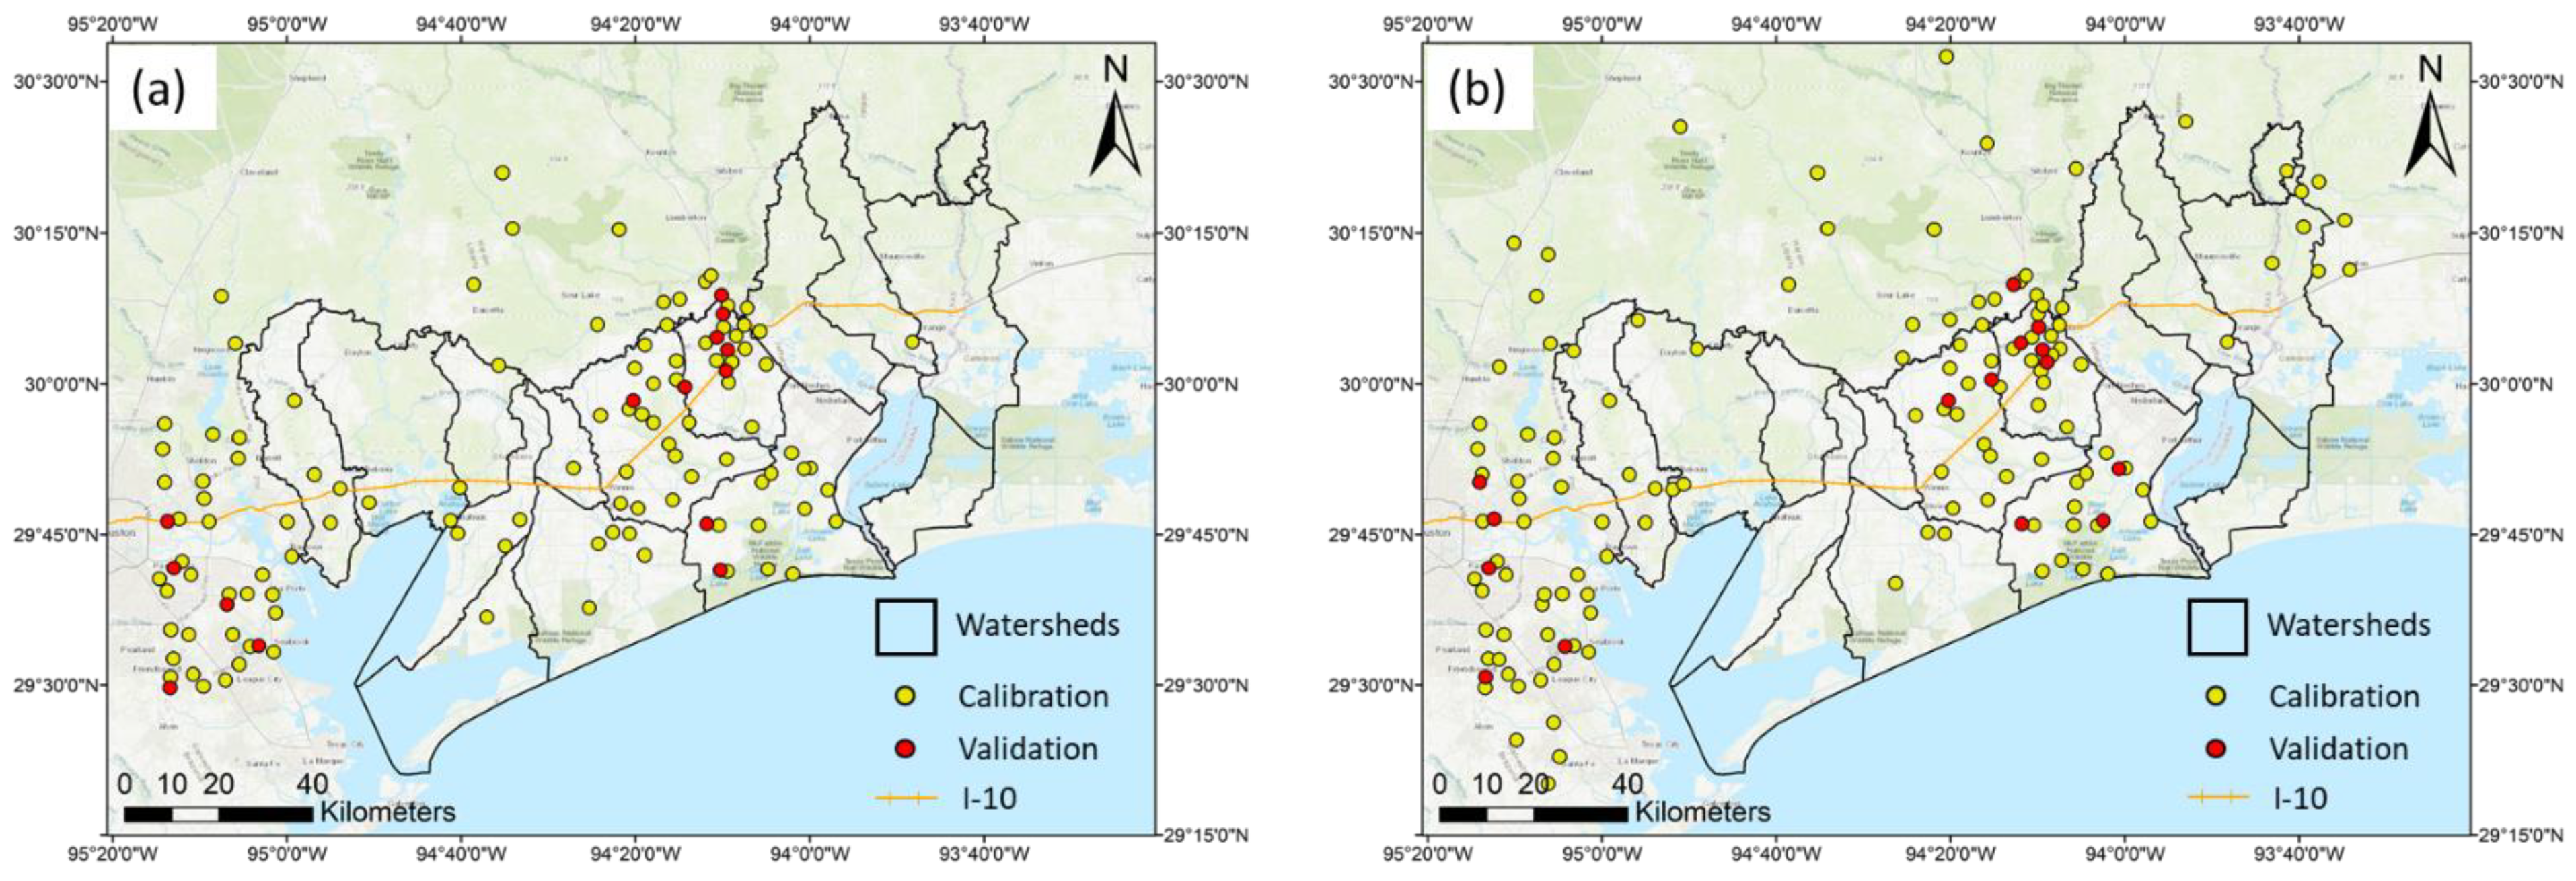
Hurricane Harvey (Harvey) started on 23 August 2017 to 3 September 2017 with a 12-day duration. The rainfall data were collected for a total of 146 hourly gauges within/near the study area for Hurricane Harvey (2017), as shown in Figure 2a. Hourly rainfall information from gauges within/near the study area was used as a benchmark to evaluate the performance of different gauge-adjusted radar products in the analysis. After evaluating all the collected gauge rainfall data, the authors excluded a total of 20 rain gauges that were found with issues (like missing and erroneous values), resulting in a total of 126 gauges with an average of 103.53 cm, among which 112 gauges were used for calibration and 14 gauges reserved for further validation in the rainfall analysis (Table 1).
Tropical Storm Imelda (Imelda) started on 17 September 2019 to 22 September 2019 with a 5-day duration. A total of 156 hourly gauges within/near the study area were collected for Tropical Storm Imelda, as shown in Figure 2b. Like Hurricane Harvey (2017), the rainfall information from the gauges was used as a benchmark for evaluating gauge-adjusted radar products. After assessing all the collected gauge rainfall data, the authors excluded a total of six (6) hourly rain gauges with issues, resulting in a total of 150 rain gauges with an average of 42.29 cm, among which 135 rain gauges were used for calibration, and 15 rain gauges used for validation in the rainfall analysis (Table 1).

2.4. Radar-Gauge Merging Methods for Calibration

Numerous radar-gauge merging methods have been developed ever since radars started to be used as precipitation-measuring devices [19,25,54,56,57]. This study applied (1) Regression kriging (RK) and (2) Bayesian regression kriging (BRK) as the radar-gauge merging algorithms since they are known to reduce error variance in addition to bias (error mean) correction of the radar data using gauge information, which have been widely used in various applications [56,57,58].
Regression kriging (RK) is an extension of kriging interpolation in which external variables, in this case, radar rainfall data, are used as auxiliary information in the interpolation process. In RK, the linear weights employed in the interpolation of point gauge values are further constrained by the spatial association between radar values at the target and rain gauge locations. It is noted that RK is mathematically identical to “Kriging with External Drift” and “Universal Kriging” interpolation methods, which rely on the auxiliary predictors (e.g., radar rainfall raster data in this study) to solve kriging weights [59].
Bayesian regression kriging (BRK) explicitly quantifies the estimation uncertainty (in terms of estimation error covariance) of radar and rain gauge data and then combines them in such a way that the overall estimation uncertainty can be minimized [60,61]. BRK attempts to overcome some limitations of classical kriging by using an ensemble of variograms that are applied to subsets of the data. For each subgroup, a variogram ensemble is iteratively generated by using the original estimated variogram to produce new data values, which are then used to produce new variograms. BRK enables non-stationarity as well as uncertainty in the variogram estimation to be better accounted for [62]. BRK Regression Prediction (BRKRP) builds on BRK by using the information provided by additional explanatory variables.
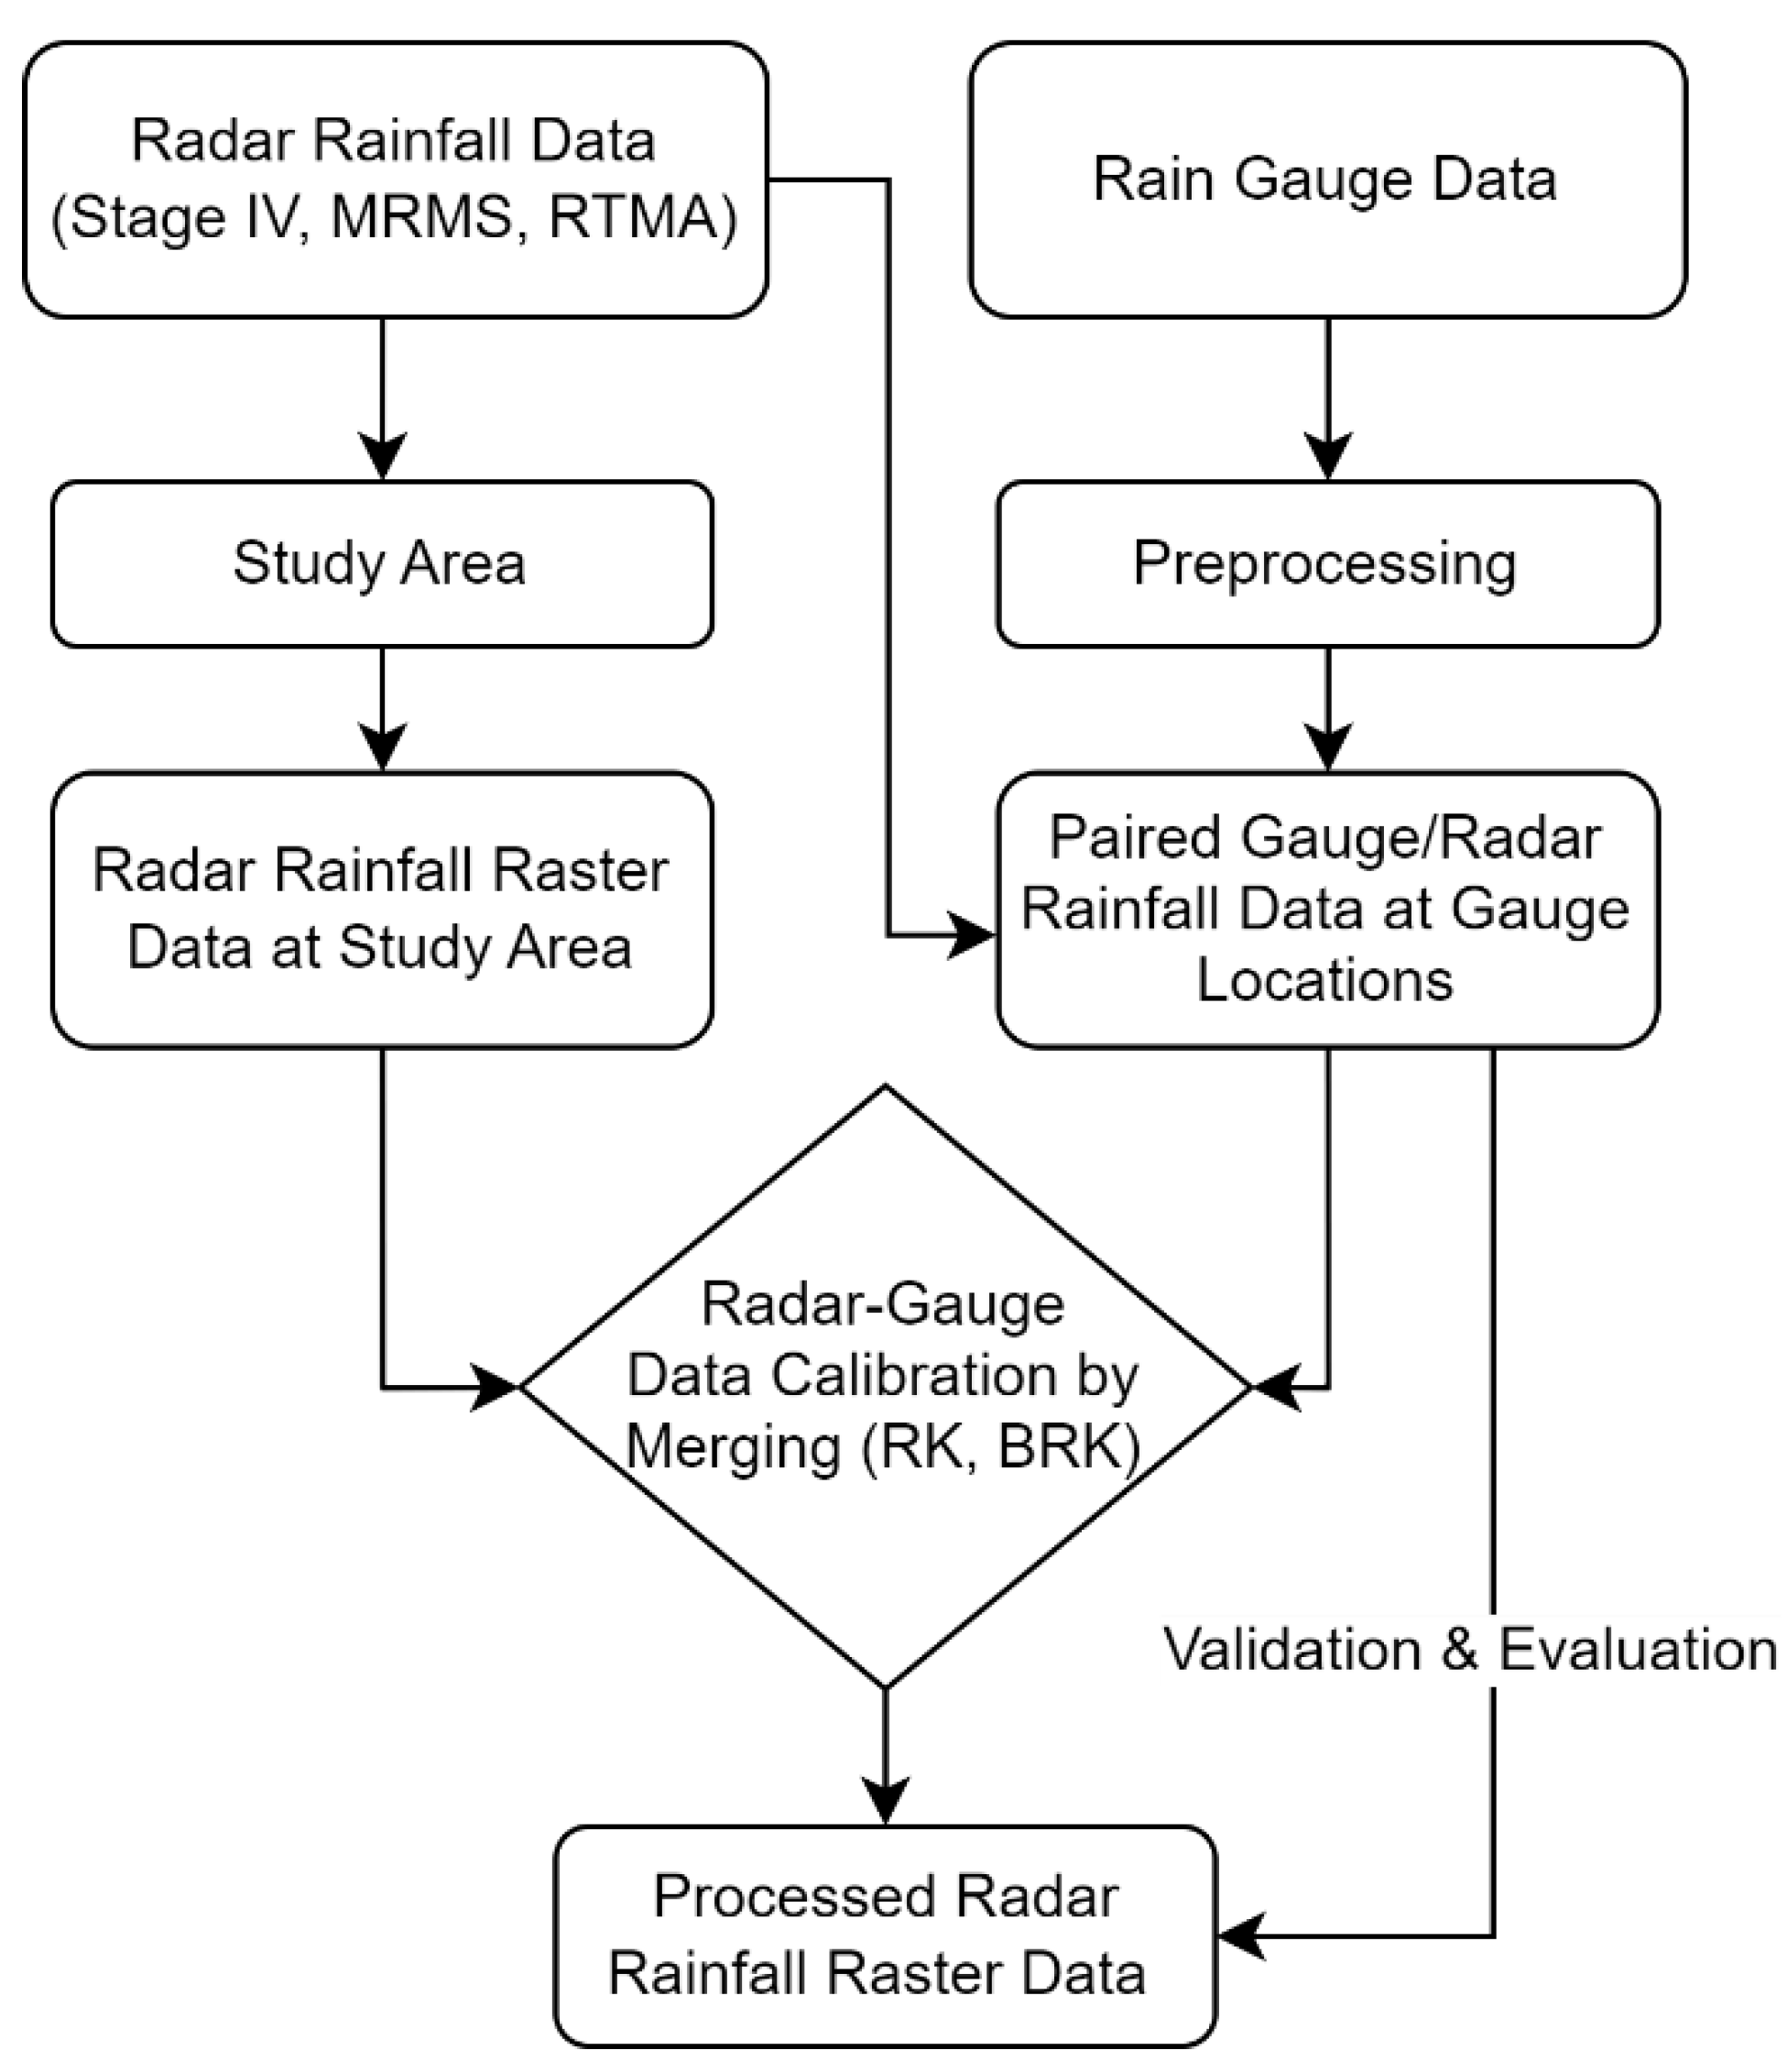
Figure 3 shows the schematic diagram of the radar rainfall merging process. First, the hourly radar rainfall and rain gauge data are obtained for the events. The radar rainfall data are trimmed to a raster dataset that includes the study area. Second, the rain gauge data are preprocessed (1) to exclude the erroneous records, (2) to combine the gauges’ data contained in the same radar image pixel, and (3) to include both datasets from calibration and validation. This process generates a one-to-one paired gauge/radar rainfall dataset at each gauge location. Third, the radar/gauge rainfall data are calibrated with the data-merging approaches using the RK or BRK methods to generate processed radar rainfall raster data. Last, the processed radar rainfall raster data are evaluated by the data from the validation gauges.

2.5. Quantitative Statistics

The results of applying the radar-gauge merging method to the QPE products are evaluated using the root mean squared error (RMSE) (Equation (1), correlation coefficient (CC) (Equation (2)), and Nash–Sutcliffe model efficiency coefficient (NSE) (Equation (3)).
RMSE demonstrates the difference between the radar and gauge data at the gauge locations. The applicable gauges are selected for quantitative analysis with maintained independence. Specifically, the gauges utilized for their original bias correction in the MRMS data itself are excluded. Meanwhile, CC depicts their correlation and consistency. Similarly, NSE also evaluates the consistency of radar and gauge using error variance. NSE equals 1 (NSE = 1) means a perfect match that has an estimation error variance equal to zero. NSE equals 0 (NSE = 0) occurs when the radar data have the same performance as the mean of the time series gauge rainfall data, while NSE is less than 0 (NSE < 0) means that the observed gauge mean value is a better predictor than the radar data.
R M S E = i = 1 n ( P r a d i P g a u g e i ) 2 n
C C = 1 n 1 i = 1 n ( P r a d i μ r a d σ r a d ) ( P g a u g e i μ g a u g e σ g a u g e )
N S E = 1 i = 1 n ( P r a d i P g a u g e i ) 2 i = 1 n ( P g a u g e i P g a u g e i ) 2
where P r a d i is the radar rainfall of the ith data, P g a u g e i is the gauge rainfall of the ith observation. μ r a d and σ r a d are the mean and standard deviation of merged radar rainfall, respectively. μ g a u g e and σ g a u g e are those of gauge rainfall, and n is the number of the total data points.

3. Results and Discussions

3.1. Intercomparison of Orignal Radar Rainfall

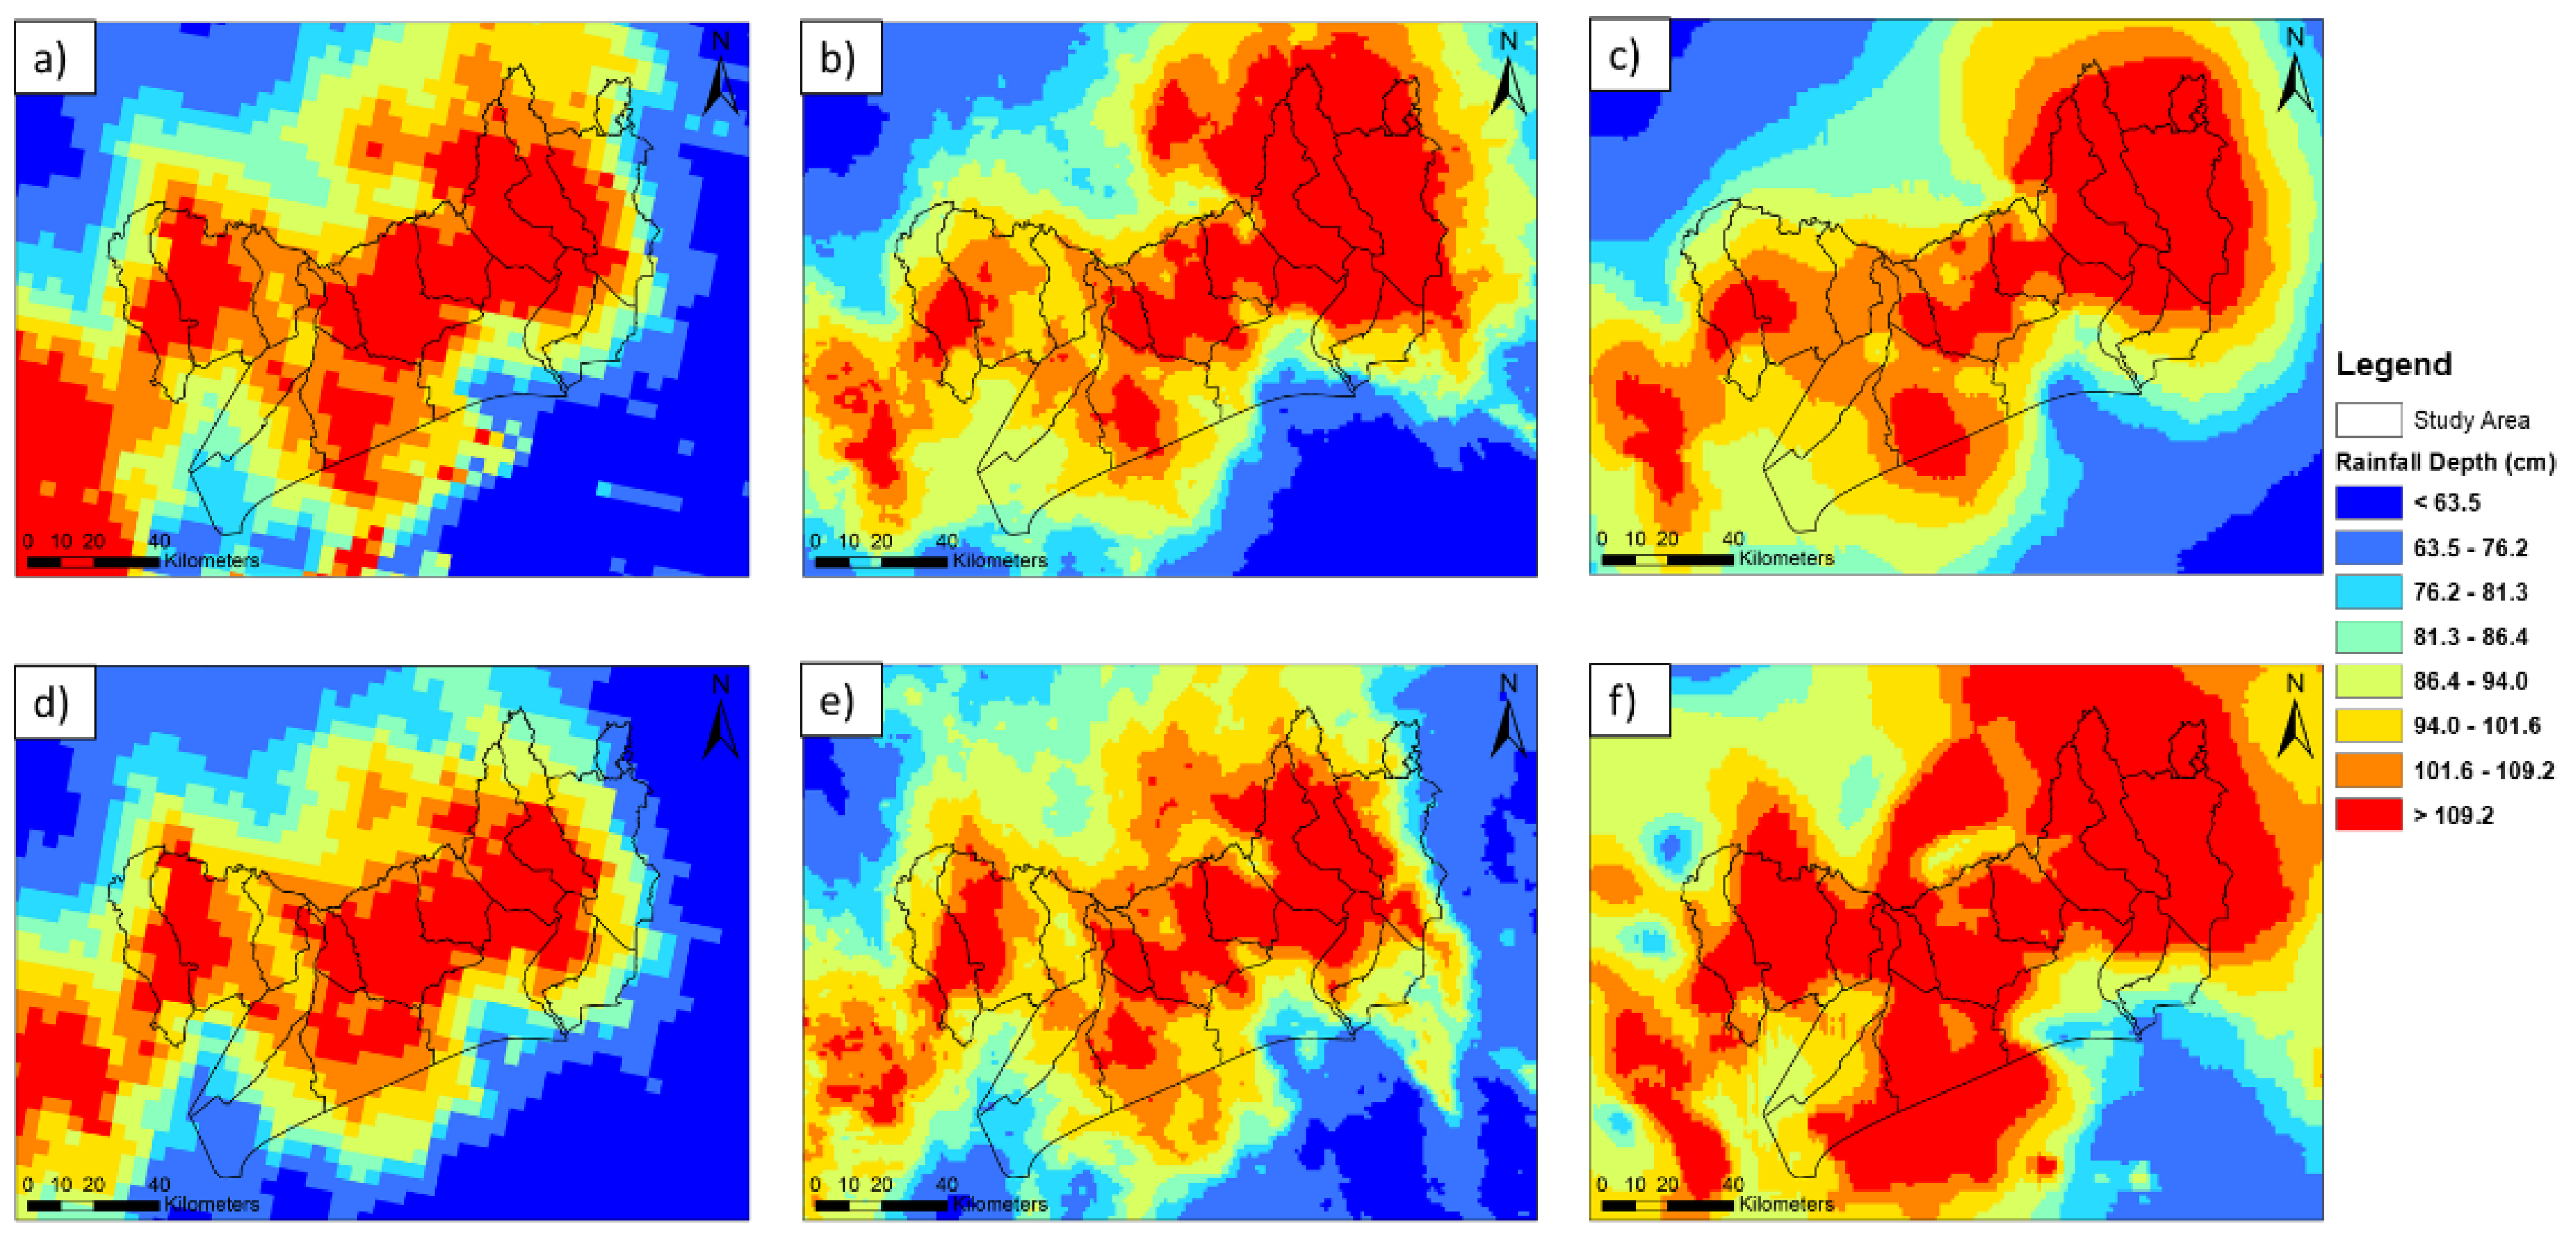
First, the accumulated rainfall depths for Hurricane Harvey (top) and Tropical Storm Imelda (bottom) based on original Stage IV (a,d), MRMS (b,e), and RTMA (c,f) data are shown in Figure 4. For Hurricane Harvey, Figure 4a–c shows a general consistency in the magnitude and distribution of rainfall for all three datasets, where Stage IV in Figure 4a shows the highest accumulation value while some areas of MRMS (<76.2 cm in the west-central region in Figure 4b) and RTMA (<101.6 cm in west and east regions in Figure 4c) show lower values. RTMA also presents higher values in the north outside the watershed area. Similar to the original datasets of Hurricane Harvey, the maps of accumulated rainfall depths (Figure 4d–f) for Tropical Storm Imelda also show a strong consistency regarding the rainfall spatial distribution. Different from the original datasets of Hurricane Harvey, the Stage IV and MRMS show similar magnitude in the heavily rained areas (>76.2 cm in the northwest and central regions in Figure 4d,e), while the RTMA tends to underestimate rainfall amounts in the same areas.
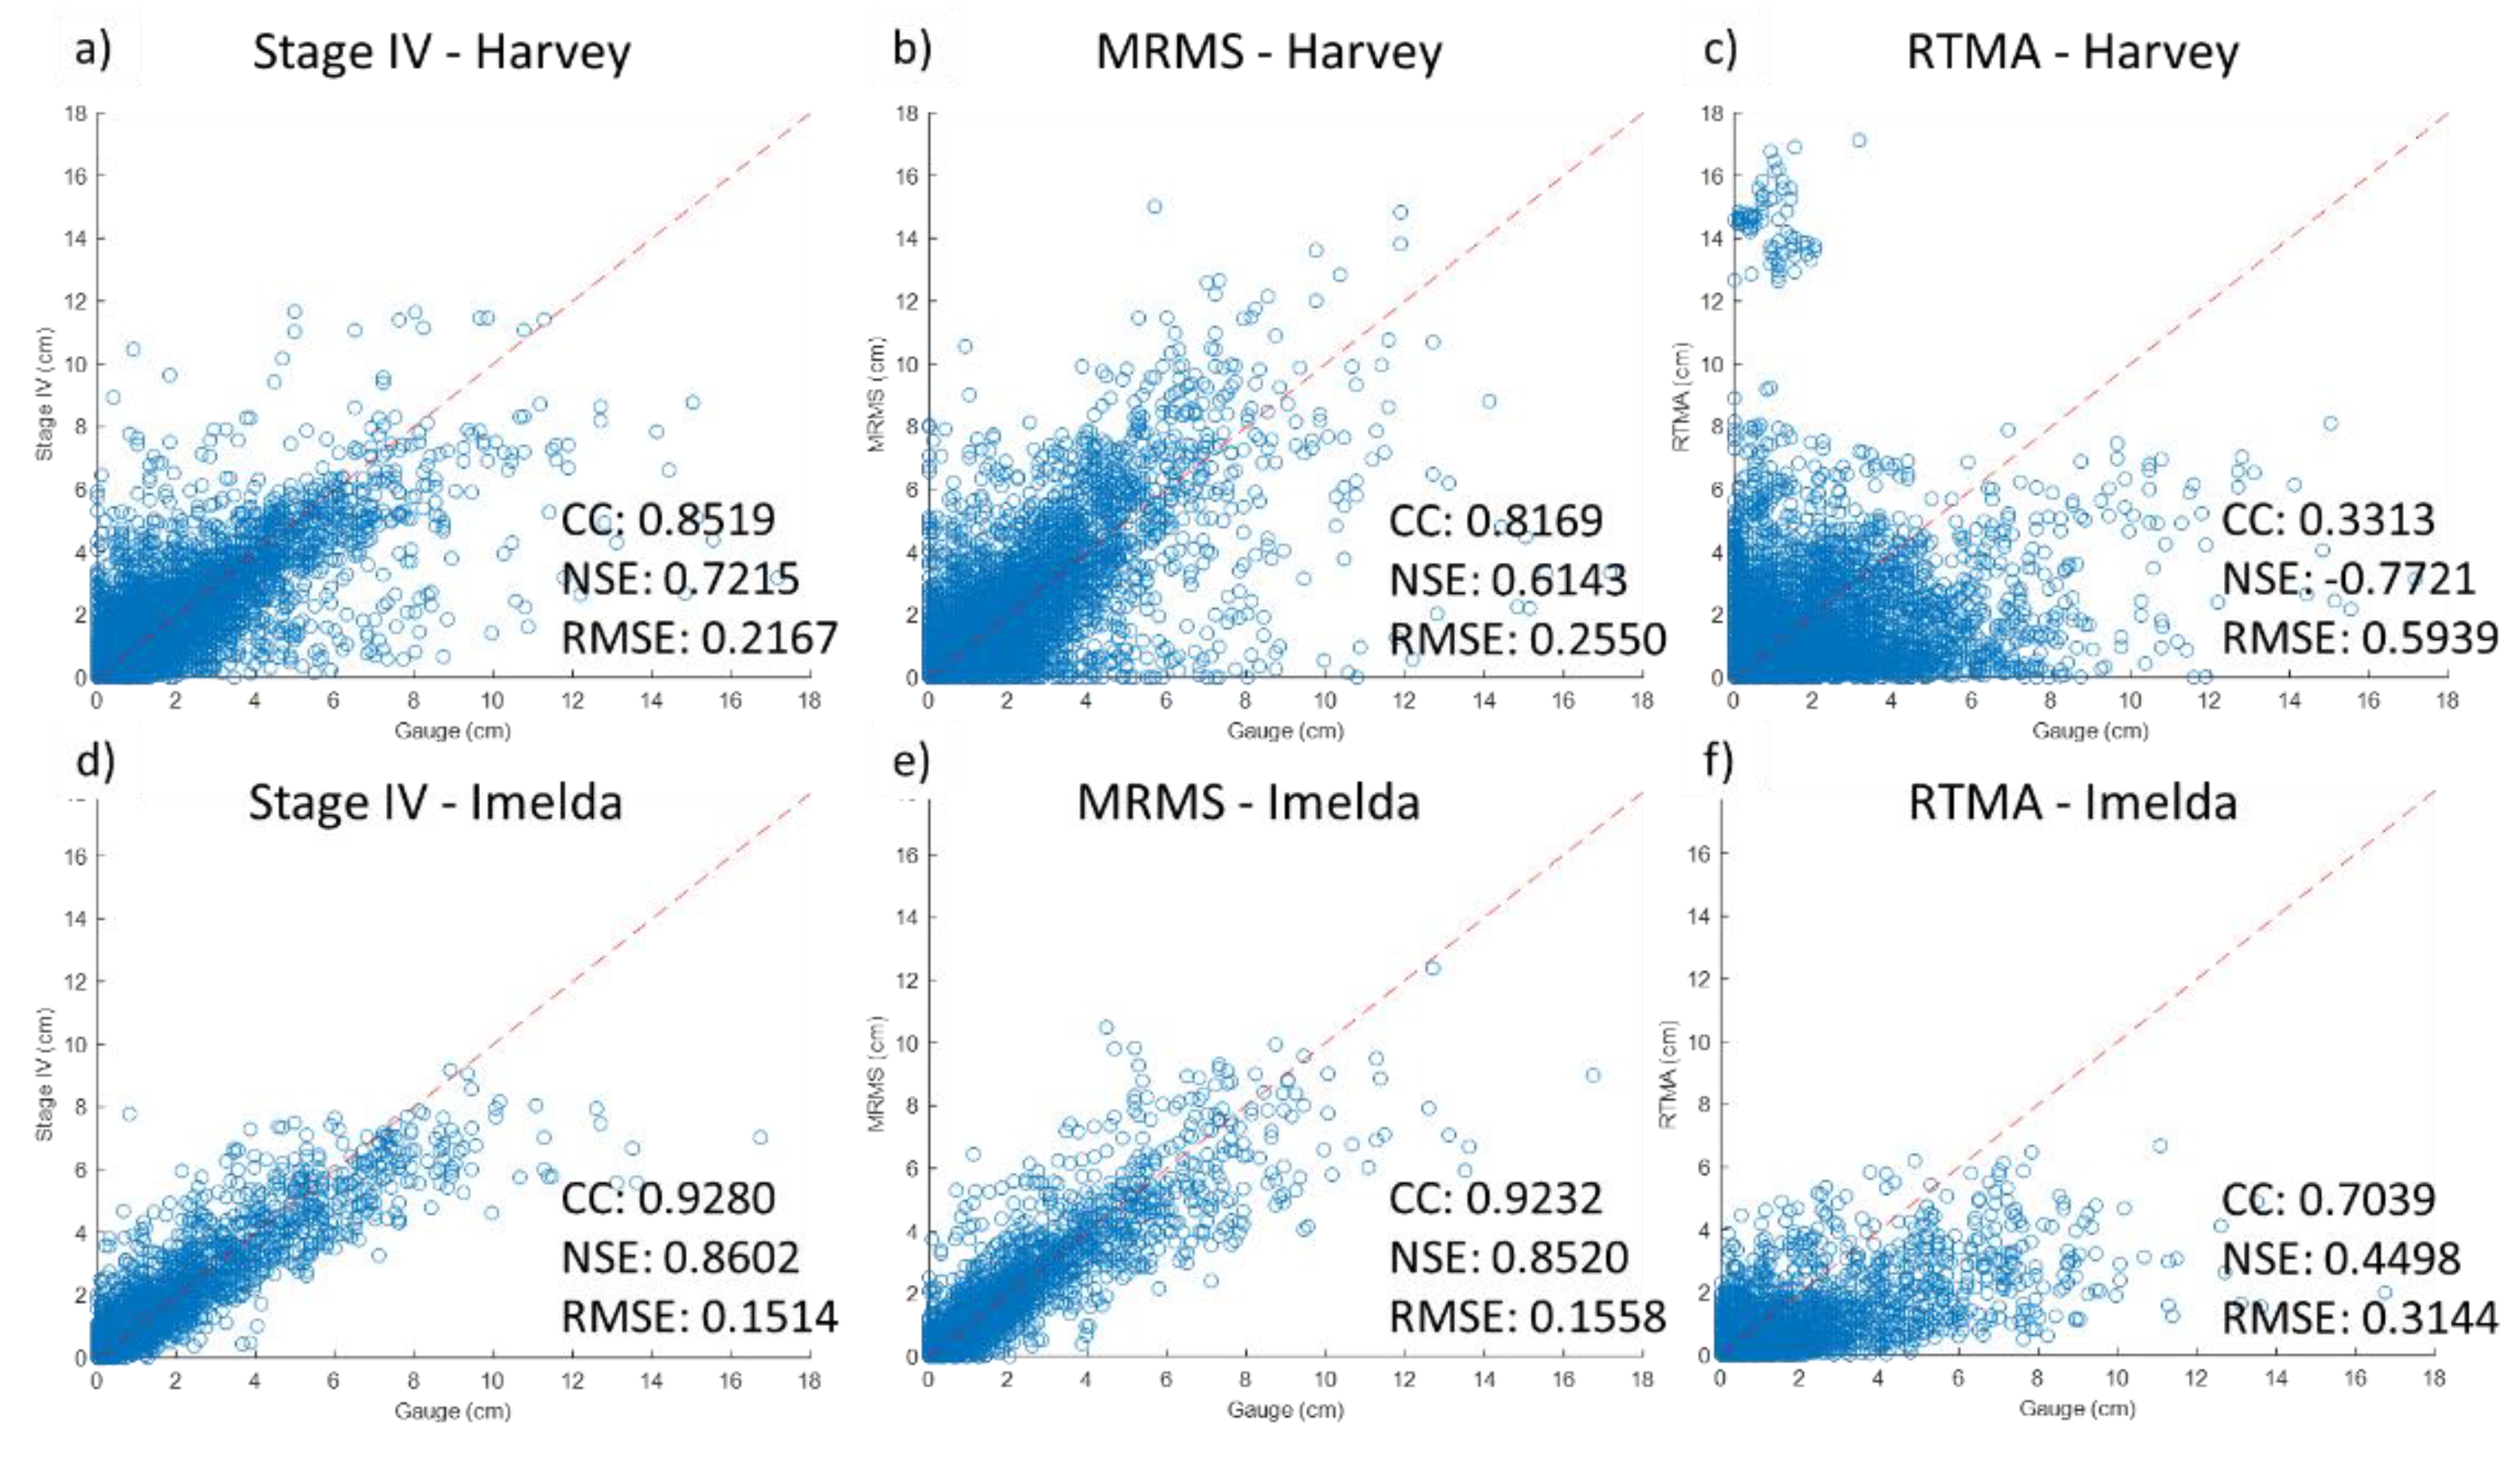
The Radar QPE data are further calibrated using the selected rain gauge data as the scatterplots show in Figure 5 for a comparison between original Radar QPE datasets and the calibrated data for Hurricane Harvey (top) and Tropical Storm Imelda (bottom). Stage IV (Figure 5a,d) shows the best performance concerning the consistency with gauge values in both events, with the highest CC (0.8519 for Hurricane Harvey and 0.9280 for Tropical Storm Imelda) and NSE (0.7215 and 0.8602), as well as the lowest RMSE (0.2167 and 0.1514). MRMS (Figure 5b,e) also provides similar results with slightly lower CC (0.8169 for Hurricane Harvey and 0.9232 for Tropical Storm Imelda) and NSE (0.6143 and 0.8520) with higher RMSE (0.255 and 0.1558). These results show Stage IV has a marginally better accuracy than MRMS in both events. A similar study that compares four flood events (including both Harvey and Imelda) in Harris County [63] shows that both MRMS and Stage IV datasets have very close performance in agreement with the gauge data product which quantified rainfall accurately at hourly temporal resolution. The different observations between this study and [63] may be mainly due to the use of different rain gauges during the comparison process. Another study that also compared the Stage IV and MRMS data for three storms (2015 Memorial Day storm, 2016 Tax Day storm, and Hurricane Harvey) in the Harris County ends up with a consistent finding that the Stage IV and MRMS perform well during the three investigated storms with Stage IV overestimating and MRMS underestimating the hourly rainfall by 2% and 12%, respectively and both QPEs tend to overestimate very light rainfall [49].
Compared with Stage IV and MRMS, RTMA (Figure 5c,f) presents the least consistency, especially the negative NSE value (−0.7721) indicates that its accuracy is worse than the means of the gauge records. A cluster of rain grids are very much higher than the rain gauge record for Hurricane Harvey. This is due to the NCEP Stage II data, as the source of RTMA, lacking the manual quality control process that is contained in the Stage IV data [46]. It is noted that all the radar rainfall products achieve better performance (higher CC and NSE and lower RMSE) for Tropical Storm Imelda, which may be due to the inclusion of more gauge data for bias correction and the improvement of the radar QPE processing since Hurricane Harvey in 2017 [10].

3.2. Merged Radar Rainfall

With the BRK and RK methods applied for calibration by merging the Radar QPE data and the selected rain gauge data, the results of accumulated rainfall depths are shown in Figure 6 for Hurricane Harvey and Figure 7 for Tropical Storm Imelda with the merged radar-gauge data based on Stage IV (a and d), MRMS (b and e), and RTMA (c and f). Compared with Figure 4a, the merged Stage IV data (Figure 6a,d) using both BRK and RK methods show similar spatial patterns of rainfall distributions for Hurricane Harvey. However, the data generated from the BRK method (Figure 6a) show some anomalously higher values in the south and southwestern regions outside of the watershed area than those from the RK method (Figure 6d). The merged MRMS data using both BRK and RK methods (Figure 6b,e) also show overall similar spatial patterns of rainfall distributions to those in Figure 4b, except for their higher values in the west-central region of the study area. However, the data generated from the BRK method show some anomalously higher values in the northeastern regions (Figure 6b) outside of the study area than those from the RK method (Figure 6e). The merged RTMA data using both BRK and RK methods (Figure 6c,f) also show some higher values in the northeastern and southern regions of the study areas, indicating a less desirable accuracy compared to the corresponding scatter plots (Figure 5).
For Tropical Storm Imelda, the merged Stage IV and MRMS data, regardless of using BRK or RK methods, present the same spatial patterns and magnitude of rainfall as shown for Stage IV and MRMS data (Figure 7a,b,d,e) with a slightly higher value from the RK method. At the same time, the merged RTMA data show lower values in the northwestern boundary of the study area than Stage IV and MRMS (Figure 7c,e).
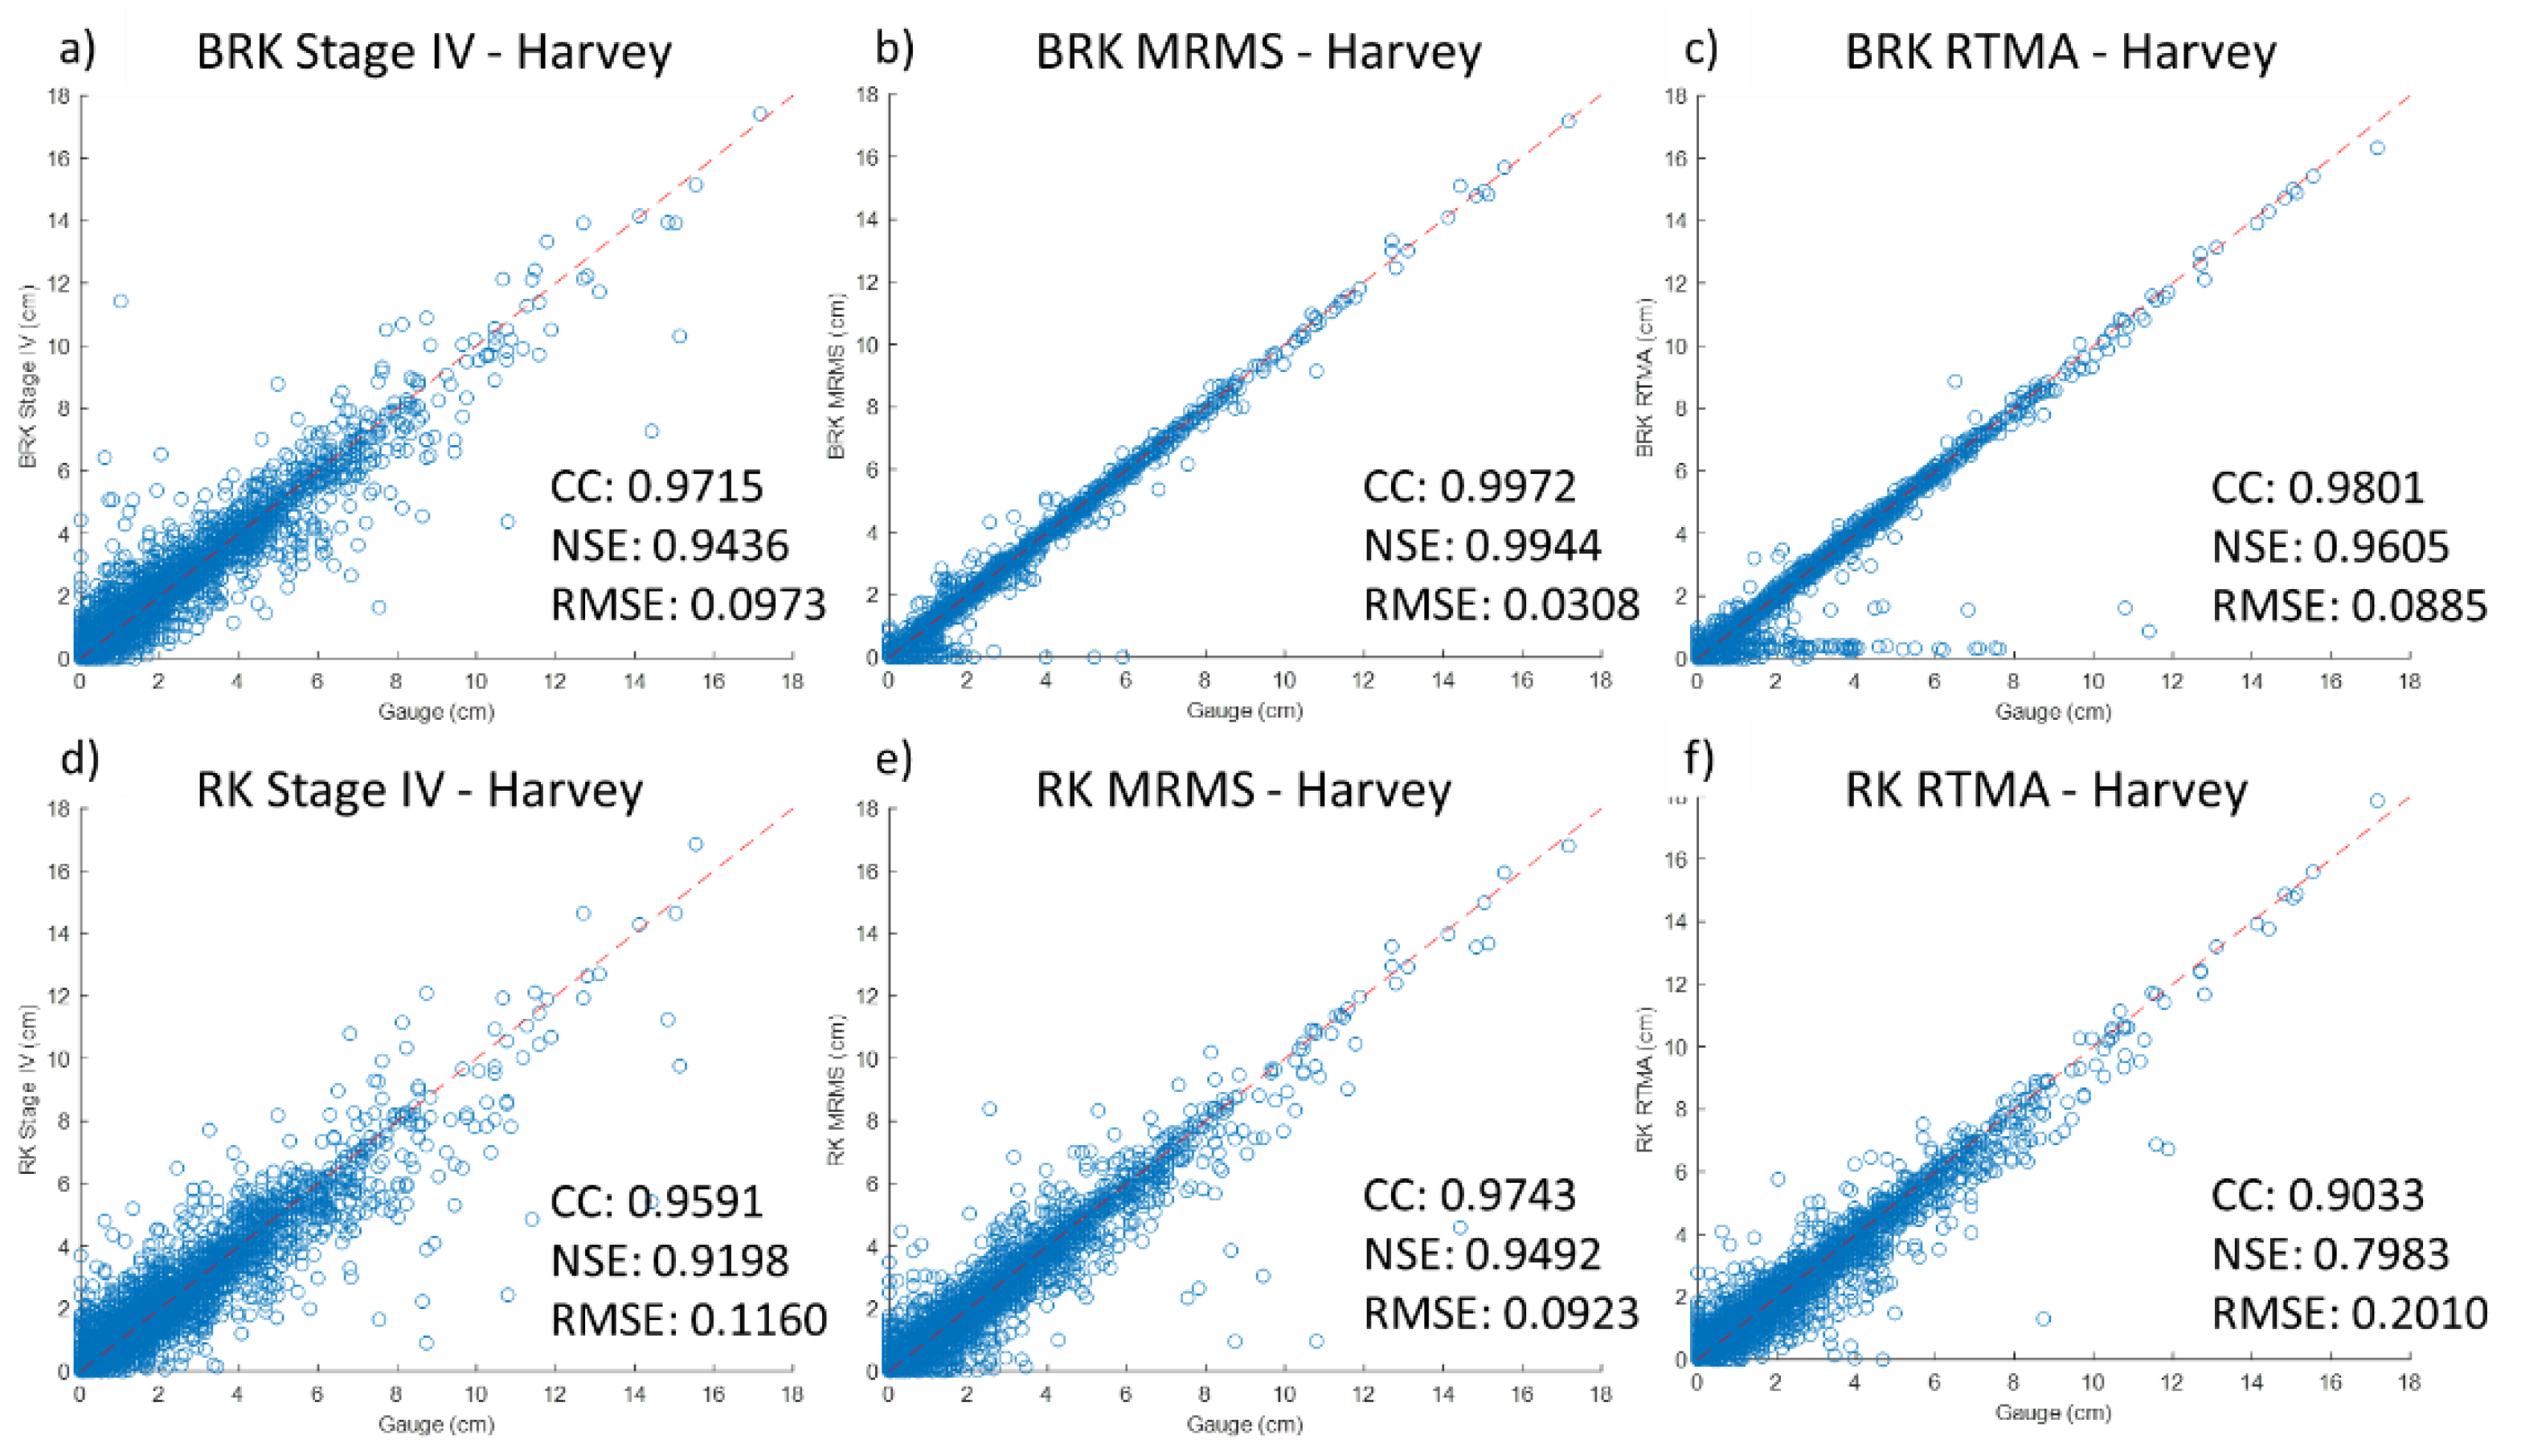
To evaluate the calibration of the two merging methods, scatterplots between the selected calibration rain gauges and the final dataset are illustrated in Figure 8 for Hurricane Harvey. For the BRK method, MRMS data show the highest accuracy with CC and NSE close to 1 (Figure 8b), followed by RTMA (Figure 8c) and then Stage IV (Figure 8a). It is noted that RTMA shows a collection of points that have high gauge values with underestimated radar values near to 0, while such cases are not found in Stage IV. For MRMS datasets, the BRK method tends to underestimate the minor rainfall at the rain gauge locations (less than 2 cm) whereas the RK method shows an evenly spread case. Moreover, the issues of underestimating radar values at some gauge locations are avoided for RTMA when using the RK method (Figure 8f). Overall, both methods demonstrate a good match. For the RK method, the merged radar data show less agreement with gauge observations compared with the findings from using the BRK method.
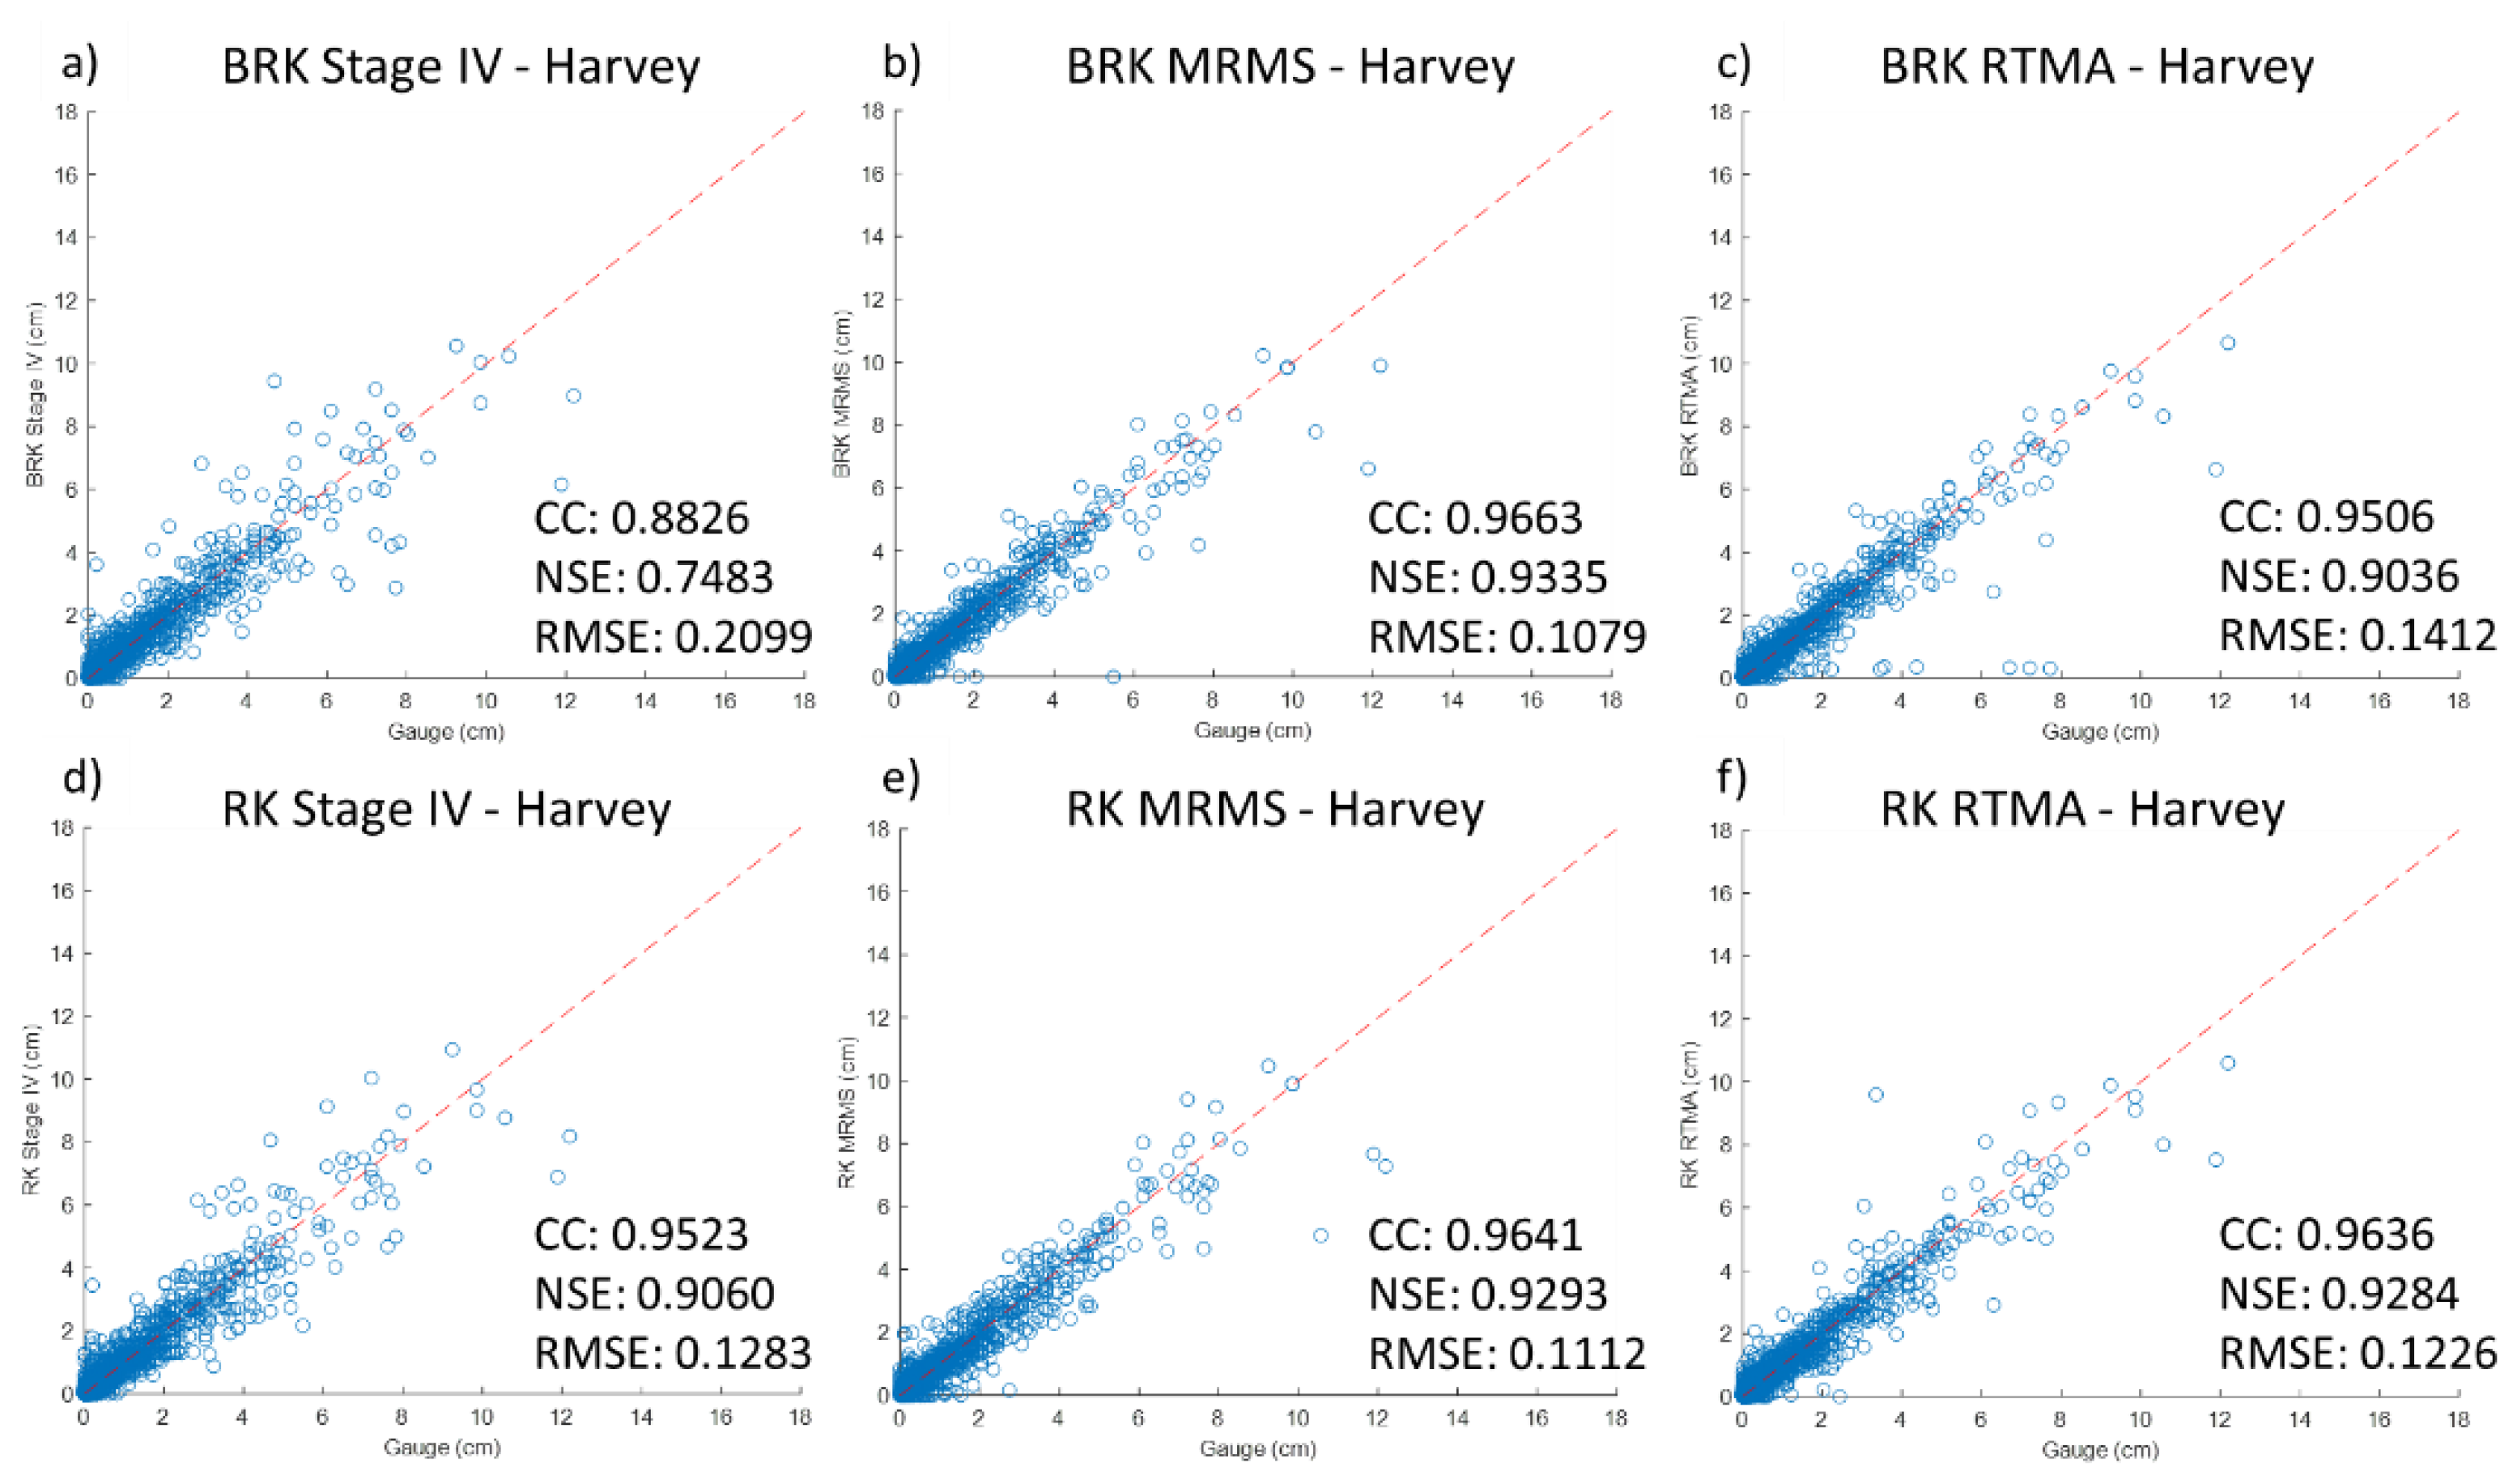
The validation process is also conducted by comparing the processed data to the observations from the gauges reserved for validation as shown Figure 2a. The comparisons imply that the MRMS data present the highest consistency as compared with the other two radar products and the Stage IV data have the lowest CC (0.8826) and NSE (0.7483) values, as demonstrated in Figure 9. Compared to the observations from the calibration process, the validation process using RK generates comparable results for MRMS and RTMA, but no or only slight improvement can be found for the Stage IV data. The BRK method for RTMA still shows issues of underestimation.
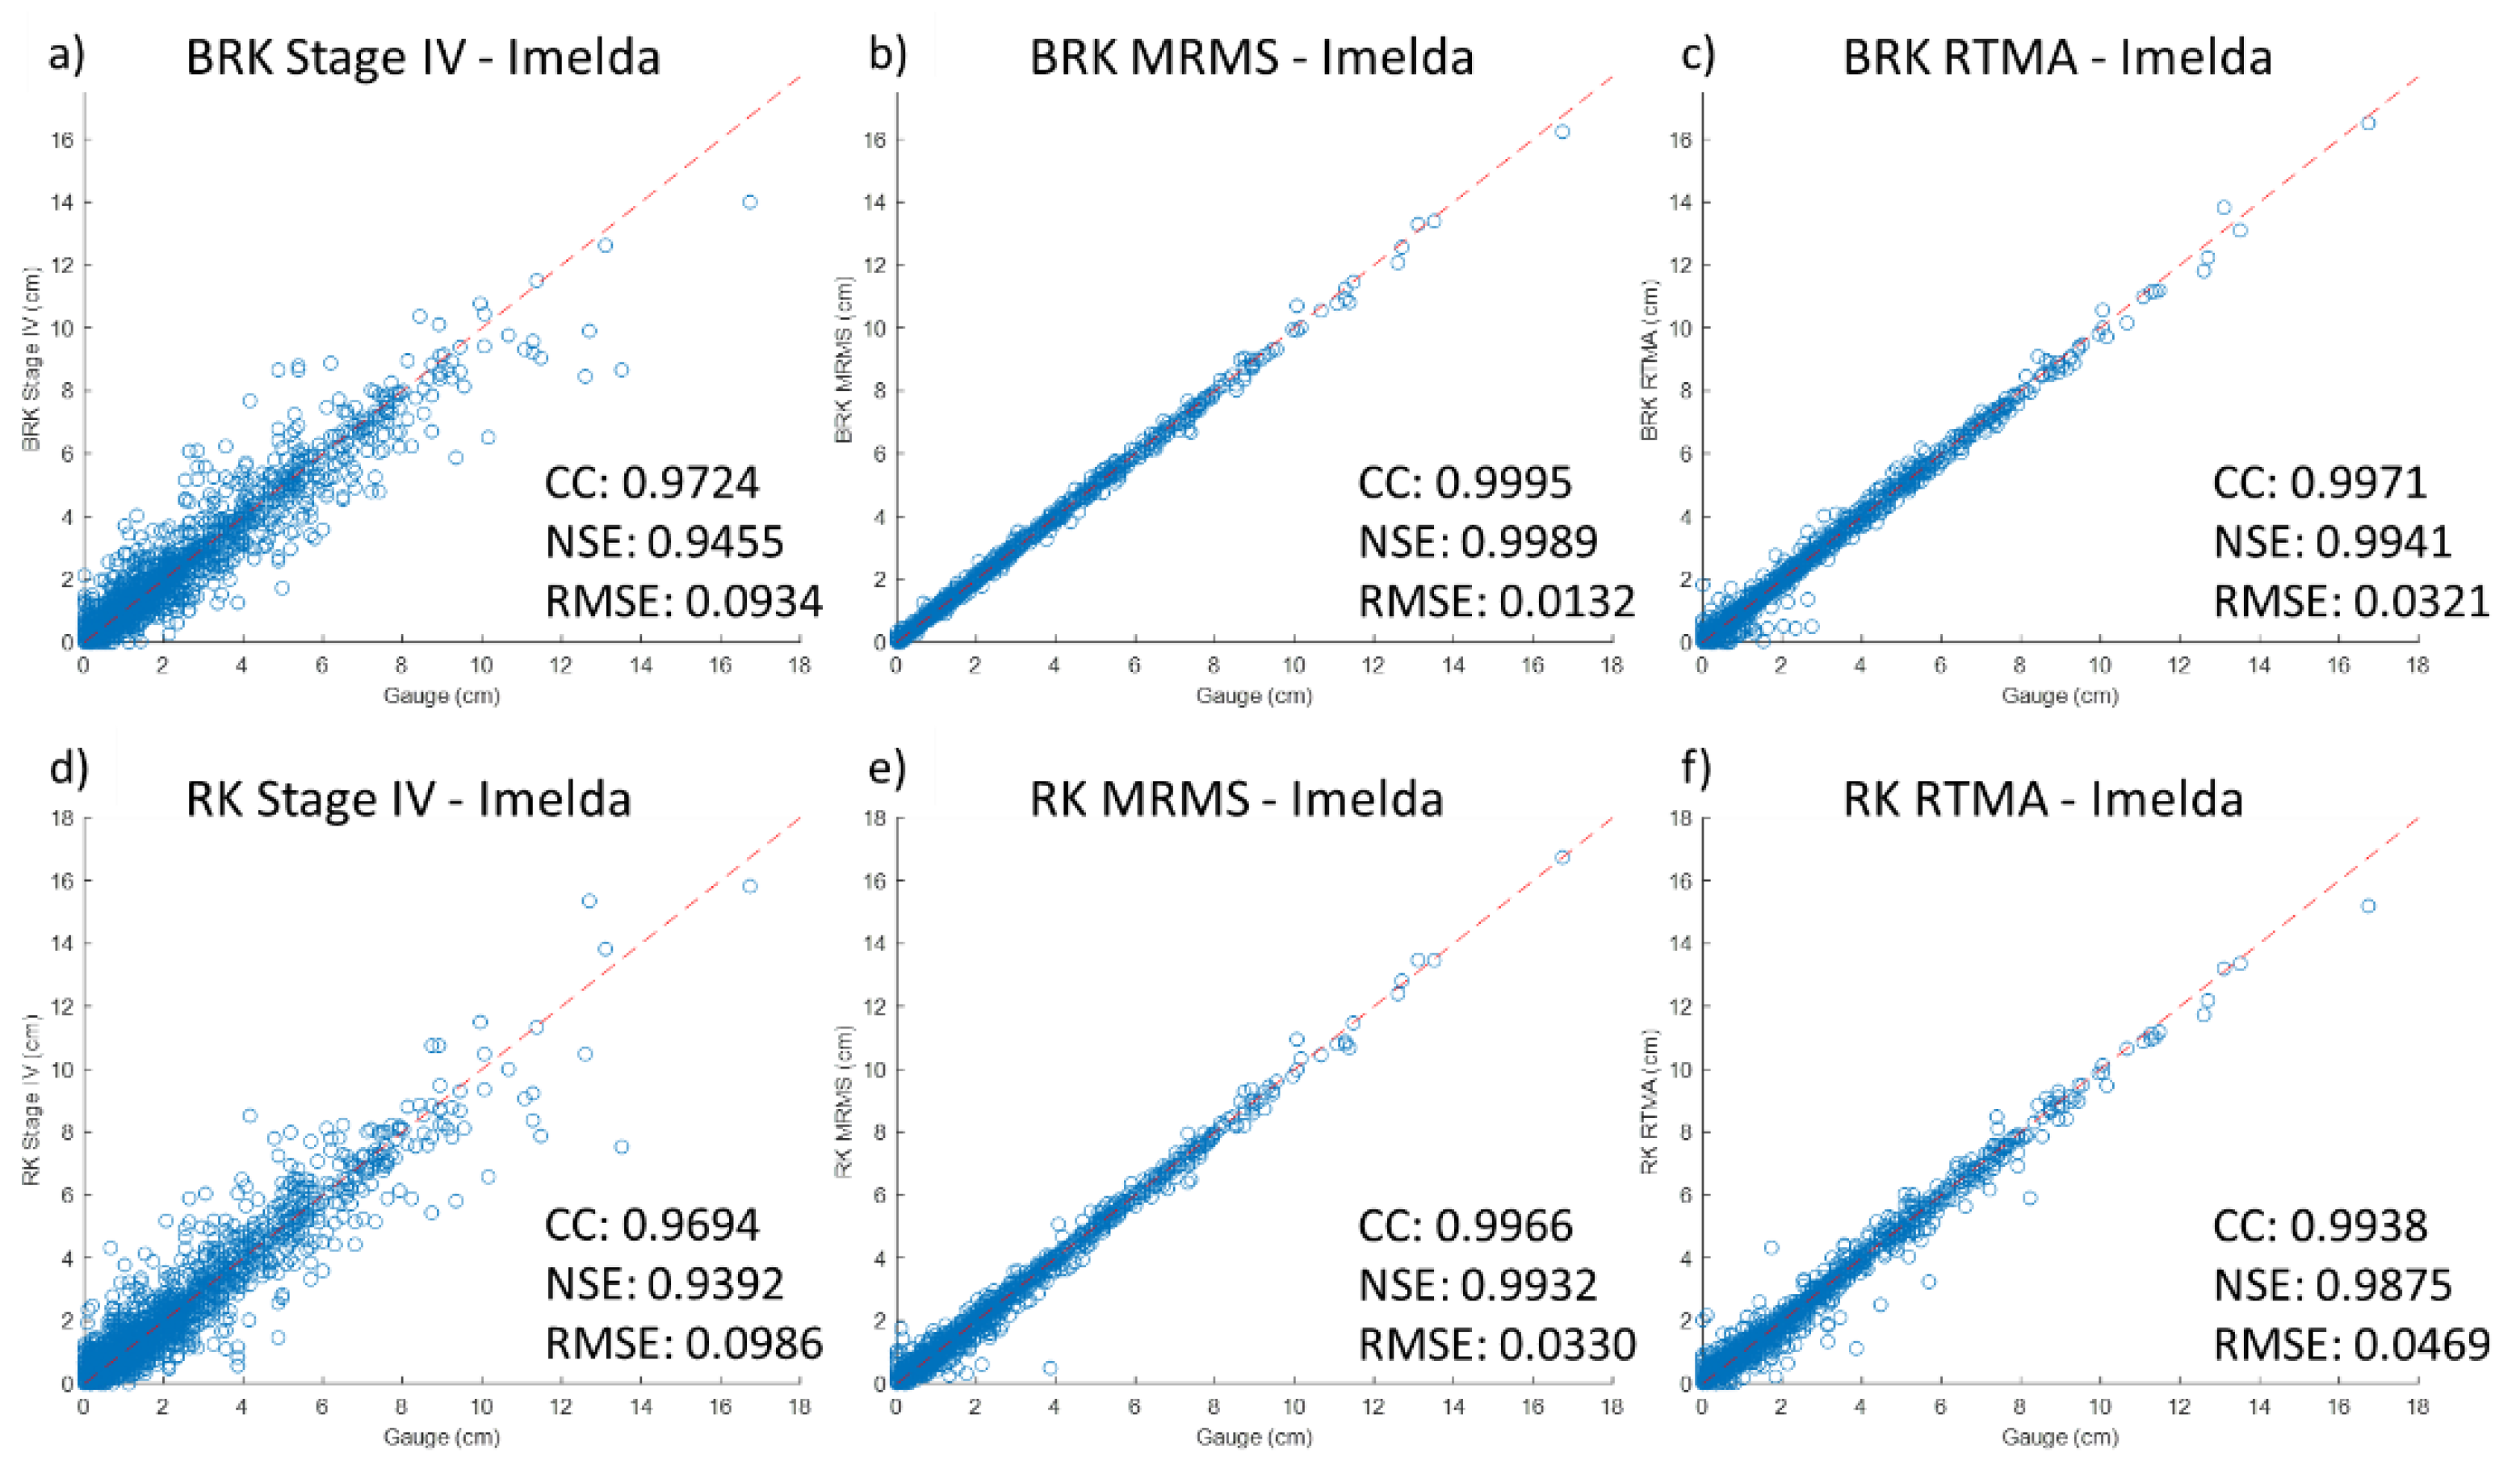
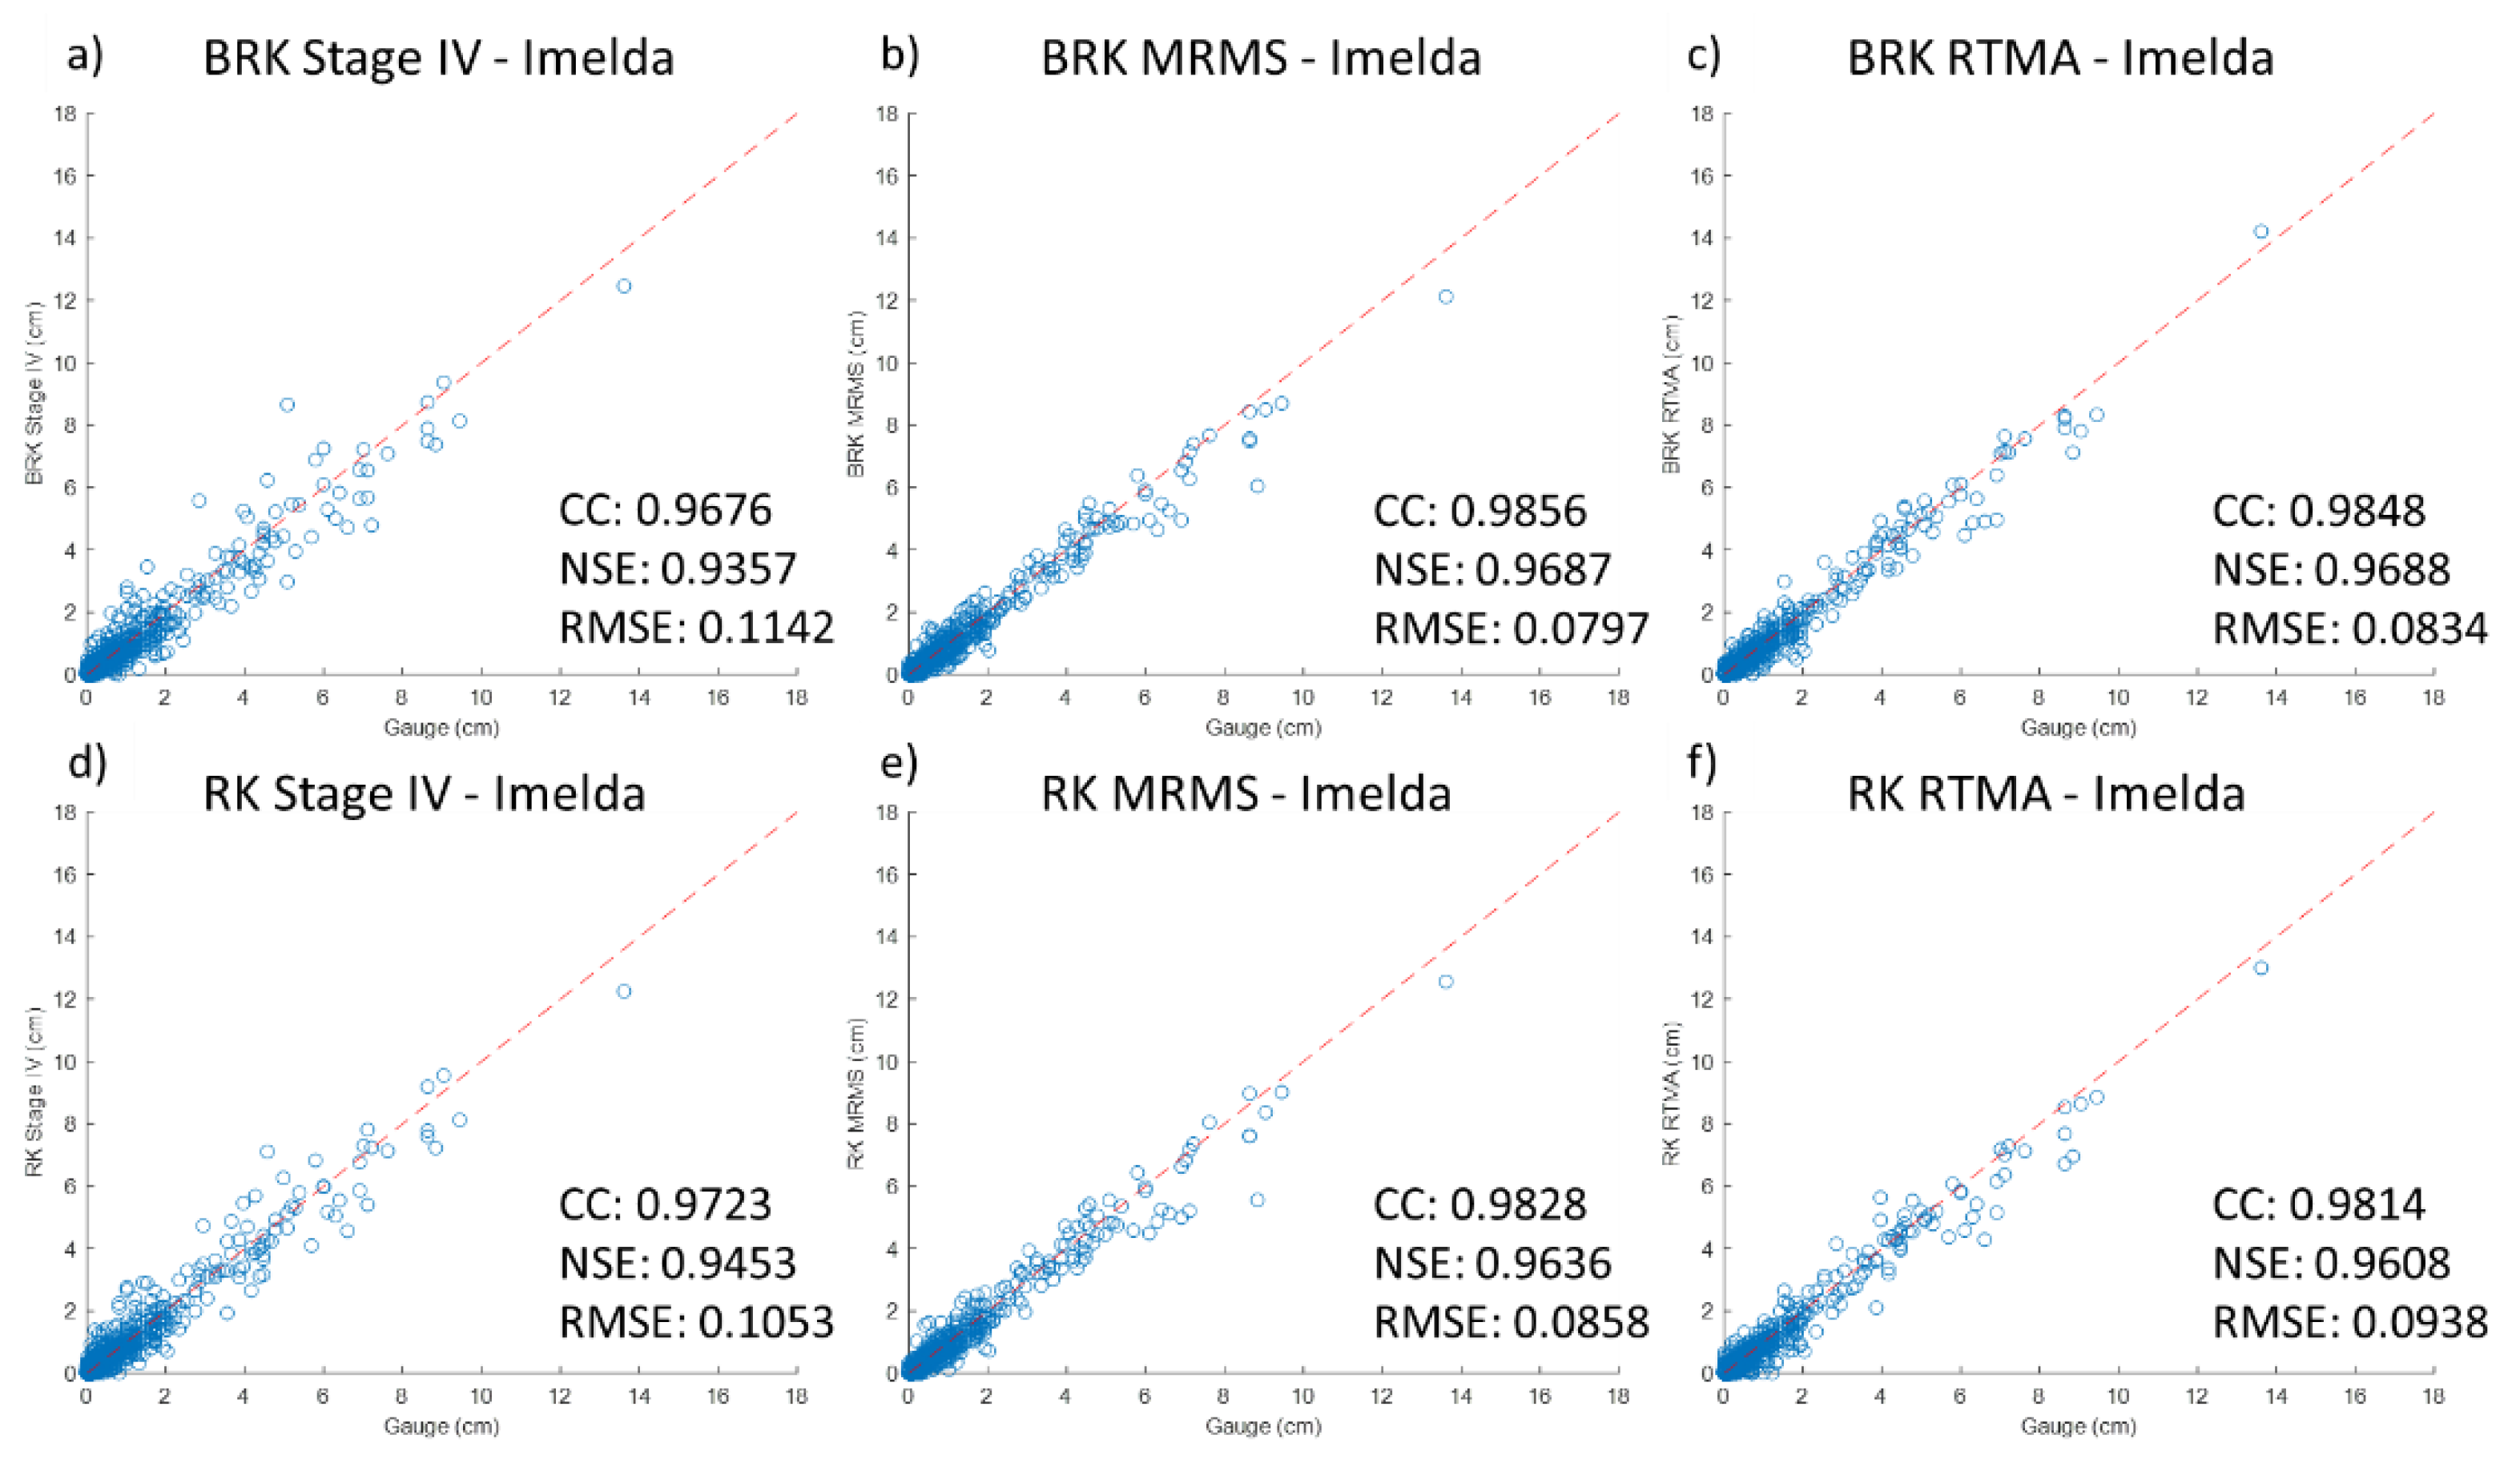
Figure 10 and Figure 11 present the comparisons of the merging methods for Topical Storm Imelda using data from both calibration and validation gauges, respectively. Both figures show that the RK and BRK methods achieve better performance (higher CC and NSE, lower RMSE) for Topical Storm Imelda than those of Hurricane Harvey. The underestimation issue of the radar data as shown in Figure 10c is not as remarkable as in Figure 8c. Similar to the observations from Figure 9, the RK method is found to be able to generate good results comparable to those of the BRK method from the validation process. The better results found for Tropical Storm Imelda could be attributed to the different spatial distribution of the gauges and the improved MRMS radar data in version 11.5 over the older version used for Hurricane Harvey.
Generally, both methods were found to greatly improve the performance of the radar products, especially for the RTMA data (Figure 4 vs. Figure 6 and Figure 7). The improvement of RTMA may not be convincing when compared with the results of Stage IV and MRMS but can be regarded as significant given the fact that RTMA has a relatively lower quality of source data. While the results from using the BRK method present overfitting, they show a high consistency with the calibration gauge data but a low consistency with the validation gauge data as shown in Figure 8 and Figure 9 for Hurricane Harvey and Figure 10 and Figure 11 for Tropical Storm Imelda. The RK method does not show such issues and proves its performance is better than the BRK method for validation (Figure 9 and Figure 11). The authors think that the overfitting issue found when using BRK could be attributed to the limited gauge observations from the east region of the study area, in which only one gauge was available and used for calibration for Hurricane Harvey (Figure 2a). This also explains why BRK shows slightly better accuracy in the calibration process since no gauges were available for validation in the east region (Figure 2). It is also noted that the BRK method (Figure 6b) seems to perform less well than the RK method (Figure 6b) in the calibration of MRMS data for Hurricane Harvey, given that the northeast of the study area presents unexpectedly higher rainfall data generated from the BRK method as shown in Figure 6b than the original radar rainfall data (Figure 4a–c), where such an issue is not found in the RK results. However, since no validation gauge is available in the same area, the BRK method (Figure 8b) presents overall better statistical metrics (i.e., CC, NSE, and RMSE) than those of the RK method (Figure 8e) thus misgiving BRK as a better method than RK. This indicates that besides solely relying on statistical metrics, engineering judgment based on local atmospheric and hydrological knowledge should also be exercised in the evaluation process.
Moreover, the BRK method was found to be more sensitive to spatial resolution than RK, shown by less improvement of Stage IV data of relatively lower resolution (4 km) than MRMS (1 km) and RTMA (2.5 km). In addition, the processing time of using RK (<1 min per image) is significantly lower than the BRK (~10 min per image) based on the workstation configuration (Intel i9-10900 CPU @ 2.8GHz, 16 GB RAM, and 1TB SSD). It is rational to conclude that the RK method is a superior option to the BRK method for efficient radar gauge data merging in this study area for the two events evaluated. However, users need to take precautions when using the RK method in routine use because it also has limitations, as discussed in Hengl et al. [59], such that the regression relationship in RK relies entirely on the quality of the input data. For example, a single poor gauge observation could consequently probably bring down the overall accuracy. The simple solution is to process the data with QA/QC beforehand and increase the number of the point-pairs (e.g., this study has 112 and 135 gauges for Hurricane Harvey and Tropical Storm Imelda, respectively) when the previous studies suggested over 50 points and at least 10 points for using RK [59,64,65].
Lastly, it is appropriate to mention that in spite of the abundance of radar-gauge merging methods and products [29,30,31,32,33,34,35,36], little research has been conducted concerning their performances in running hydrologic or hydraulic models, which is one of the great potential usages of such data and of critical importance to flood forecasting [66,67,68,69,70,71,72,73,74,75,76]. In this study, we tried to use the RK merged rainfall data to run a hydrologic model (i.e., HEC-HMS) for a basin within the study area. The intercomparison among the modeling results shows that the simulated volume from the merged radar dataset is closest to the observation (not shown in the paper). However, the flow observation data are only available for a small watershed at the further west of the study area, which has a relative consistent rainfall amount from different datasets and methods (Figure 4, Figure 6 and Figure 7). Hence, the overall advantage of the merged radar rainfall over the original data as model input cannot be manifested directly. To further utilize the merging methods in the hazard mitigation practices, additional efforts should be invested in a detailed time-step analysis to better understand the impacts from the merging methods on these high-intensity moments. The efforts will help focus more on the predictions of the timing and magnitude of the peak stage or discharge. Additionally, Qiu et al. [40] discussed the challenges of applying merged products for flood forecasting, such as (1) gauge network density across mountainous basins, (2) fitness of hydrologic models for the local watersheds, and (3) preserving rainfall features (e.g., convective) at small scales. As such, it remains largely unexplored for identifying the most suitable and efficient merging technique(s) of high-resolution rainfall products, particularly for running hydrologic models and forecasting floods and other extreme events.

4. Conclusions

This paper evaluated three premier radar datasets (i.e., Stage IV, MRMS, and RTMA) and compared the radar-gauge merging methods (i.e., RK and BRK) using radar data and a dense gauge network for two major tropical storm events (Hurricane Harvey and Tropical Storm Imelda) that occurred in August of 2017 and September of 2019, respectively. The findings and suggestions are summarized as follows:
(1)
Stage IV and MRMS show high consistency for both events with the rain gauge network when RTMA (Figure 5c,f) presents the least consistency, especially the negative NSE value (−0.7721) indicating its accuracy is worse than the means of the gauge records.
(2)
Both RK and BRK can increase the quality of the original radar rainfall products shown by statistical metrics (i.e., CC, NSE, and RMSE), especially for low-quality RTMA data. Moreover, the RK is the preferred method since it enhances the results with explainable spatial distribution identified by specialized knowledge.
(3)
The BRK method presents better statistical metrics while also indicating over-fitting in certain areas with limited gauge presence for calibration, which means that the spatial distribution (i.e., density) of the rain gauges plays a critical role in the algorithms.
(4)
The merged results were found to be sensitive to the original spatial resolution of the radar data for both methods, such that the MMRS with the highest spatial resolution had the best results with both methods and the BRK method worked well on finer resolution than coarse resolution radar data.
In conclusion, radar-gauge merging methods show remarkable improvements over the original radar rainfall products and can be used for further hydrologic and hydraulic analysis. Future studies are suggested to investigate effective rain gauge placing, new model development, and hydrologic/hydraulic model calibration for more applications in rapid hazard response and mitigation.

Author Contributions

Conceptualization, W.L. and Z.N.F.; Methodology, W.L., H.J., P.B.B. and Z.N.F.; Validation, H.J. and D.L.; Formal analysis, W.L. and D.L.; Investigation, D.L. and Z.N.F.; Resources, P.B.B.; Writing—original draft, W.L.; Writing—review and editing, H.J., D.L. and Z.N.F.; Visualization, W.L. and H.J.; Supervision, P.B.B. and Z.N.F.; Project administration, D.L. and Z.N.F.; Funding acquisition, Z.N.F. All authors have read and agreed to the published version of the manuscript.

Funding

This research was funded by the Texas Department of Transportation (TxDOT), grant number: IAC # 25429, and the National Science Foundation, grant numbers: 1832065 and 1940163.

Data Availability Statement

Not applicable.

Acknowledgments

The authors would like to acknowledge the gauge data provided by the Community Collaborative Rain, Hail, and Snow Network (CoCoRaHS), NOAA’s National Centers for Environmental Information (NCEI), Harris County Flood Control District (HCFCD), Jefferson County Drainage District No. 6 (DD6), Southeast Texas Regional Alerting & Information Network (RAIN), the Hydrometeorological Auto-mated Data System (HADS), and the Automated Surface Observing System (ASOS).

Conflicts of Interest

The authors declare no conflict of interest.

References

  1. Salvadore, E.; Bronders, J.; Batelaan, O. Hydrological Modelling of Urbanized Catchments: A Review and Future Directions. J. Hydrol. 2015, 529, 62–81. [Google Scholar] [CrossRef]
  2. Westra, S.; Fowler, H.J.; Evans, J.P.; Alexander, L.V.; Berg, P.; Johnson, F.; Kendon, E.J.; Lenderink, G.; Roberts, N.M. Future Changes to the Intensity and Frequency of Short-Duration Extreme Rainfall: Future intensity of sub-daily rainfall. Rev. Geophys. 2014, 52, 522–555. [Google Scholar] [CrossRef] [Green Version]
  3. Molnar, P.; Fatichi, S.; Gaál, L.; Szolgay, J.; Burlando, P. Storm Type Effects on Super Clausius–Clapeyron Scaling of Intense Rainstorm Properties with Air Temperature. Hydrol. Earth Syst. Sci. 2015, 19, 1753–1766. [Google Scholar] [CrossRef]
  4. Li, D.; Fang, Z.N.; Bedient, P.B. Flood Early Warning Systems under Changing Climate and Extreme Events. In Climate Change and Extreme Events; Elsevier: Amsterdam, The Netherlands, 2021; pp. 83–103. ISBN 978-0-12-822700-8. [Google Scholar]
  5. Park, N.-W. Spatial Downscaling of TRMM Precipitation Using Geostatistics and Fine Scale Environmental Variables. Adv. Meteorol. 2013, 2013, 237126. [Google Scholar] [CrossRef] [Green Version]
  6. Goovaerts, P. Geostatistical Approaches for Incorporating Elevation into the Spatial Interpolation of Rainfall. J. Hydrol. 2000, 228, 113–129. [Google Scholar] [CrossRef]
  7. He, X.; Refsgaard, J.C.; Sonnenborg, T.O.; Vejen, F.; Jensen, K.H. Statistical Analysis of the Impact of Radar Rainfall Uncertainties on Water Resources Modeling: Radar Rainfall Uncertainties on Hydrological Modeling. Water Resour. Res. 2011, 47, W09526. [Google Scholar] [CrossRef]
  8. Chang, W.-Y.; Vivekanandan, J.; Ikeda, K.; Lin, P.-L. Quantitative Precipitation Estimation of the Epic 2013 Colorado Flood Event: Polarization Radar-Based Variational Scheme. J. Appl. Meteorol. Climatol. 2016, 55, 1477–1495. [Google Scholar] [CrossRef]
  9. Vieux, B.; Bedient, P. Assessing Urban Hydrologic Prediction Accuracy through Event Reconstruction. J. Hydrol. 2004, 299, 217–236. [Google Scholar] [CrossRef]
  10. Past Code Updates—MRMS QPE. Available online: https://inside.nssl.noaa.gov/mrms/past-code-updates/ (accessed on 26 August 2022).
  11. Goudenhoofdt, E.; Delobbe, L. Statistical Characteristics of Convective Storms in Belgium Derived from Volumetric Weather Radar Observations. J. Appl. Meteorol. Climatol. 2013, 52, 918–934. [Google Scholar] [CrossRef]
  12. Villarini, G.; Krajewski, W.F. Review of the Different Sources of Uncertainty in Single Polarization Radar-Based Estimates of Rainfall. Surv. Geophys. 2010, 31, 107–129. [Google Scholar] [CrossRef]
  13. Einfalt, T.; Jessen, M.; Mehlig, B. Comparison of Radar and Raingauge Measurements during Heavy Rainfall. Water Sci. Technol. 2005, 51, 195–201. [Google Scholar] [CrossRef] [PubMed]
  14. Li, Z.; Chen, M.; Gao, S.; Hong, Z.; Tang, G.; Wen, Y.; Gourley, J.J.; Hong, Y. Cross-Examination of Similarity, Difference and Deficiency of Gauge, Radar and Satellite Precipitation Measuring Uncertainties for Extreme Events Using Conventional Metrics and Multiplicative Triple Collocation. Remote Sens. 2020, 12, 1258. [Google Scholar] [CrossRef] [Green Version]
  15. Molini, A.; Lanza, L.G.; La Barbera, P. The Impact of Tipping-Bucket Raingauge Measurement Errors on Design Rainfall for Urban-Scale Applications. Hydrol. Process. 2005, 19, 1073–1088. [Google Scholar] [CrossRef]
  16. Dai, Q.; Yang, Q.; Zhang, J.; Zhang, S. Impact of Gauge Representative Error on a Radar Rainfall Uncertainty Model. J. Appl. Meteorol. Climatol. 2018, 57, 2769–2787. [Google Scholar] [CrossRef]
  17. Bárdossy, A.; Das, T. Influence of Rainfall Observation Network on Model Calibration and Application. Hydrol. Earth Syst. Sci. 2008, 12, 77–89. [Google Scholar] [CrossRef] [Green Version]
  18. Arsenault, R.; Brissette, F. Determining the Optimal Spatial Distribution of Weather Station Networks for Hydrological Modeling Purposes Using RCM Datasets: An Experimental Approach. J. Hydrometeorol. 2014, 15, 517–526. [Google Scholar] [CrossRef]
  19. Wang, L.-P.; Ochoa-Rodríguez, S.; Simões, N.E.; Onof, C.; Maksimović, Č. Radar–Raingauge Data Combination Techniques: A Revision and Analysis of Their Suitability for Urban Hydrology. Water Sci. Technol. 2013, 68, 737–747. [Google Scholar] [CrossRef]
  20. Krajewski, W.F. Cokriging Radar-Rainfall and Rain Gage Data. In 1987, Rainfall Fields: Estimation, Analysis, and Prediction; Collected Reprint Series; American Geophysical Union: Washington, DC, USA, 2013; pp. 9571–9580. ISBN 978-1-118-78207-1. [Google Scholar]
  21. Steiner, M.; Smith, J.A.; Burges, S.J.; Alonso, C.V.; Darden, R.W. Effect of Bias Adjustment and Rain Gauge Data Quality Control on Radar Rainfall Estimation. Water Resour. Res. 1999, 35, 2487–2503. [Google Scholar] [CrossRef]
  22. Erdin, R. Geostatistical Methods for Hourly Radar-Gauge Combination: An Explorative, Systematic Application at MeteoSwiss; MeteoSchweiz: Genève, Switzerland, 2013. [Google Scholar]
  23. Jewell, S.A.; Gaussiat, N. An Assessment of Kriging-based Rain-gauge–Radar Merging Techniques. Q. J. R. Meteorol. Soc. 2015, 141, 2300–2313. [Google Scholar] [CrossRef]
  24. Benoit, L. Radar and Rain Gauge Data Fusion Based on Disaggregation of Radar Imagery. Water Res. 2021, 57, e2020WR027899. [Google Scholar] [CrossRef]
  25. Decloedt, C.; Willems, P. Methods and Experiences in Radar Based Fine Scale Rainfall Estimation. 2013. Available online: http://www.raingain.eu/sites/default/files/raingain_wp2-reviewdoc.pdf (accessed on 21 August 2021).
  26. Ochoa-Rodriguez, S.; Wang, L.-P.; Willems, P.; Onof, C. A Review of Radar-Rain Gauge Data Merging Methods and Their Potential for Urban Hydrological Applications. Water Resour. Res. 2019, 55, 6356–6391. [Google Scholar] [CrossRef]
  27. Lo Conti, F.; Francipane, A.; Pumo, D.; Noto, L.V. Exploring Single Polarization X-Band Weather Radar Potentials for Local Meteorological and Hydrological Applications. J. Hydrol. 2015, 531, 508–522. [Google Scholar] [CrossRef]
  28. McKee, J.L.; Binns, A.D. A Review of Gauge–Radar Merging Methods for Quantitative Precipitation Estimation in Hydrology. Can. Water Resour. J./Rev. Can. Des Ressour. Hydr. 2016, 41, 186–203. [Google Scholar] [CrossRef]
  29. Anagnostou, M.; Nikolopoulos, E.; Kalogiros, J.; Anagnostou, E.; Marra, F.; Mair, E.; Bertoldi, G.; Tappeiner, U.; Borga, M. Advancing Precipitation Estimation and Streamflow Simulations in Complex Terrain with X-Band Dual-Polarization Radar Observations. Remote Sens. 2018, 10, 1258. [Google Scholar] [CrossRef] [Green Version]
  30. Reichert, P.; Mieleitner, J. Analyzing Input and Structural Uncertainty of Nonlinear Dynamic Models with Stochastic, Time-Dependent Parameters: Analyzing Input and Structural Uncertainty. Water Resour. Res. 2009, 45, W10402. [Google Scholar] [CrossRef] [Green Version]
  31. Cole, S.J.; Moore, R.J. Hydrological Modelling Using Raingauge- and Radar-Based Estimators of Areal Rainfall. J. Hydrol. 2008, 358, 159–181. [Google Scholar] [CrossRef]
  32. Nanding, N.; Rico-Ramirez, M.A.; Han, D. Comparison of Different Radar-Raingauge Rainfall Merging Techniques. J. Hydroinform. 2015, 17, 422–445. [Google Scholar] [CrossRef]
  33. Rabiei, E.; Haberlandt, U. Applying Bias Correction for Merging Rain Gauge and Radar Data. J. Hydrol. 2015, 522, 544–557. [Google Scholar] [CrossRef]
  34. Seo, D.-J.; Breidenbach, J.P. Real-Time Correction of Spatially Nonuniform Bias in Radar Rainfall Data Using Rain Gauge Measurements. J. Hydrometeor. 2002, 3, 93–111. [Google Scholar] [CrossRef]
  35. Sideris, I.V.; Gabella, M.; Erdin, R.; Germann, U. Real-Time Radar-Rain-Gauge Merging Using Spatio-Temporal Co-Kriging with External Drift in the Alpine Terrain of Switzerland: Real-Time Radar-Rain-Gauge Merging. Q. J. R. Meteorol. Soc. 2014, 140, 1097–1111. [Google Scholar] [CrossRef]
  36. Thorndahl, S.; Einfalt, T.; Willems, P.; Nielsen, J.E.; ten Veldhuis, M.-C.; Arnbjerg-Nielsen, K.; Rasmussen, M.R.; Molnar, P. Weather Radar Rainfall Data in Urban Hydrology. Hydrol. Earth Syst. Sci. 2017, 21, 1359–1380. [Google Scholar] [CrossRef] [Green Version]
  37. Kumar, A.; Binns, A.D.; Gupta, S.K.; Singh, V.P.; McKee, J.L. Analysing the Performance of Various Radar-Rain Gauge Merging Methods for Modelling the Hydrologic Response of Upper Thames River Basin, Canada. In Proceedings of the World Environmental and Water Resources Congress, West Palm Beach, FL, USA, 22–26 May 2016; pp. 359–371. [Google Scholar]
  38. Ochoa-Rodriguez, S.; Wang, L.; Bailey, A.; Schellart, A.; Willems, P.; Onof, C. Evaluation of Radar-Rain Gauge Merging Methods for Urban Hydrological Applications: Relative Performance and Impact of Gauge Density. In Proceedings of the UrbanRain15 Proceedings “Rainfall in Urban and Natural Systems”, Pontresina, Switzerland, 1–5 December 2015. [Google Scholar]
  39. Teng, H.; Ma, Z.; Chappell, A.; Shi, Z.; Liang, Z.; Yu, W. Improving Rainfall Erosivity Estimates Using Merged TRMM and Gauge Data. Remote Sens. 2017, 9, 1134. [Google Scholar] [CrossRef] [Green Version]
  40. Qiu, Q.; Liu, J.; Tian, J.; Jiao, Y.; Li, C.; Wang, W.; Yu, F. Evaluation of the Radar QPE and Rain Gauge Data Merging Methods in Northern China. Remote Sens. 2020, 12, 363. [Google Scholar] [CrossRef] [Green Version]
  41. Zhang, J.; Xu, J.; Dai, X.; Ruan, H.; Liu, X.; Jing, W. Multi-Source Precipitation Data Merging for Heavy Rainfall Events Based on Cokriging and Machine Learning Methods. Remote Sens. 2022, 14, 1750. [Google Scholar] [CrossRef]
  42. Thorndahl, S.; Nielsen, J.E.; Rasmussen, M.R. Bias Adjustment and Advection Interpolation of Long-Term High Resolution Radar Rainfall Series. J. Hydrol. 2014, 508, 214–226. [Google Scholar] [CrossRef]
  43. Villarini, G.; Smith, J.A.; Lynn Baeck, M.; Sturdevant-Rees, P.; Krajewski, W.F. Radar Analyses of Extreme Rainfall and Flooding in Urban Drainage Basins. J. Hydrol. 2010, 381, 266–286. [Google Scholar] [CrossRef]
  44. Sakib, S.; Ghebreyesus, D.; Sharif, H.O. Performance Evaluation of IMERG GPM Products during Tropical Storm Imelda. Atmosphere 2021, 12, 687. [Google Scholar] [CrossRef]
  45. Nielsen-Gammon, J.W.; Zhang, F.; Odins, A.M.; Myoung, B. Extreme Rainfall in Texas: Patterns and Predictability. Phys. Geogr. 2005, 26, 340–364. [Google Scholar] [CrossRef] [Green Version]
  46. Du, J. NCEP/EMC 4KM Gridded Data (GRIB) Stage IV Data; Version 1.0 2011; UCAR/NCAR—Earth Observing Laboratory. Available online: https://data.eol.ucar.edu/dataset/21.093 (accessed on 26 November 2021).
  47. Zhang, J.; Howard, K.; Langston, C.; Kaney, B.; Qi, Y.; Tang, L.; Grams, H.; Wang, Y.; Cocks, S.; Martinaitis, S.; et al. Multi-Radar Multi-Sensor (MRMS) Quantitative Precipitation Estimation: Initial Operating Capabilities. Bull. Am. Meteorol. Soc. 2016, 97, 621–638. [Google Scholar] [CrossRef]
  48. De Pondeca, M.S.F.V.; Manikin, G.S.; DiMego, G.; Benjamin, S.G.; Parrish, D.F.; Purser, R.J.; Wu, W.-S.; Horel, J.D.; Myrick, D.T.; Lin, Y.; et al. The Real-Time Mesoscale Analysis at NOAA’s National Centers for Environmental Prediction: Current Status and Development. Weather Forecast. 2011, 26, 593–612. [Google Scholar] [CrossRef]
  49. Lin, Y.; Mitchell, K.E. The NCEP Stage II/IV Hourly Precipitation Analyses: Development and Applications. In Proceedings of the 19th Conference Hydrology, American Meteorological Society, San Diego, CA, USA, 9–13 January 2005; Volume 10. [Google Scholar]
  50. Cocks, S.B.; Tang, L.; Zhang, P.; Ryzhkov, A.; Kaney, B.; Elmore, K.L.; Wang, Y.; Zhang, J.; Howard, K. A Prototype Quantitative Precipitation Estimation Algorithm for Operational S-Band Polarimetric Radar Utilizing Specific Attenuation and Specific Differential Phase. Part II: Performance Verification and Case Study Analysis. J. Hydrometeorol. 2019, 20, 999–1014. [Google Scholar] [CrossRef]
  51. Martinaitis, S.M.; Osborne, A.P.; Simpson, M.J.; Zhang, J.; Howard, K.W.; Cocks, S.B.; Arthur, A.; Langston, C.; Kaney, B.T. A Physically Based Multisensor Quantitative Precipitation Estimation Approach for Gap-Filling Radar Coverage. J. Hydrometeorol. 2020, 21, 1485–1511. [Google Scholar] [CrossRef]
  52. Wu, W.-S.; Purser, R.J.; Parrish, D.F. Three-Dimensional Variational Analysis with Spatially Inhomogeneous Covariances. Mon. Wea. Rev. 2002, 130, 2905–2916. [Google Scholar] [CrossRef]
  53. Morris, M.T.; Carley, J.R.; Colón, E.; Gibbs, A.; De Pondeca, M.S.F.V.; Levine, S. A Quality Assessment of the Real-Time Mesoscale Analysis (RTMA) for Aviation. Weather. Forecast. 2020, 35, 977–996. [Google Scholar] [CrossRef]
  54. Gao, S.; Zhang, J.; Li, D.; Jiang, H.; Fang, Z.N. Evaluation of Multiradar Multisensor and Stage IV Quantitative Precipitation Estimates during Hurricane Harvey. Nat. Hazards Rev. 2021, 22, 04020057. [Google Scholar] [CrossRef]
  55. Hjelmstad, A.; Shrestha, A.; Garcia, M.; Mascaro, G. Propagation of Radar Rainfall Uncertainties into Urban Pluvial Flood Modeling during the North American Monsoon. Hydrol. Sci. J. 2021, 66, 2232–2248. [Google Scholar] [CrossRef]
  56. Ali, A.; Supriatna, S.; Sa’adah, U. Radar-Based Stochastic Precipitation Nowcasting Using the Short-Term Ensemble Prediction System (Steps) (Case Study: Pangkalan Bun Weather Radar). IJReSES 2021, 18, 91. [Google Scholar] [CrossRef]
  57. Wackernagel, H. Multivariate Geostatistics: An Introduction with Applications; Springer Science & Business Media: Berlin/Heidelberg, Germany, 2003. [Google Scholar]
  58. Ali, G.; Sajjad, M.; Kanwal, S.; Xiao, T.; Khalid, S.; Shoaib, F.; Gul, H.N. Spatial–Temporal Characterization of Rainfall in Pakistan during the Past Half-Century (1961–2020). Sci. Rep. 2021, 11, 6935. [Google Scholar] [CrossRef]
  59. Hengl, T.; Heuvelink, G.B.M.; Rossiter, D.G. About Regression-Kriging: From Equations to Case Studies. Comput. Geosci. 2007, 33, 1301–1315. [Google Scholar] [CrossRef]
  60. Todini, E. A Bayesian Technique for Conditioning Radar Precipitation Estimates to Rain-Gauge Measurements. Hydrol. Earth Syst. Sci. 2001, 5, 187–199. [Google Scholar] [CrossRef] [Green Version]
  61. Krivoruchko, K. Empirical Bayesian Kriging. ArcUser Fall 2012, 6, 1145. [Google Scholar]
  62. Gribov, A.; Krivoruchko, K. Empirical Bayesian Kriging Implementation and Usage. Sci. Total Environ. 2020, 722, 137290. [Google Scholar] [CrossRef] [PubMed]
  63. Habibi, H.; Awal, R.; Fares, A.; Temimi, M. Performance of Multi-Radar Multi-Sensor (MRMS) Product in Monitoring Precipitation under Extreme Events in Harris County, Texas. J. Hydrol. 2021, 598, 126385. [Google Scholar] [CrossRef]
  64. Neter, J.; Kutner, M.H.; Nachtsheim, C.J.; Wasserman, W. Applied Linear Statistical Models; Irwin: Chicago, IL, USA, 1996; Volume 4. [Google Scholar]
  65. Webster, R.; Oliver, M.A. Geostatistics for Environmental Scientists; John Wiley & Sons: Hoboken, NJ, USA, 2007. [Google Scholar]
  66. Rico-Ramirez, M.A.; Liguori, S.; Schellart, A.N.A. Quantifying Radar-Rainfall Uncertainties in Urban Drainage Flow Modelling. J. Hydrol. 2015, 528, 17–28. [Google Scholar] [CrossRef] [Green Version]
  67. Fang, Z.; Safiolea, E.; Bedient, P.B. Enhanced Flood Alert and Control Systems for Houston. In Coastal Hydrology and Processes: Proceedings of the AIH 25th Anniversary Meeting & International Conference Challenges in Coastal Hydrology and Water Quality; Water Resources Publications: Highlands Ranch, CO, USA, 2006; Volume 199; Available online: https://books.google.ro/books/about/Coastal_Hydrology_and_Processes.html?id=nOiq86tJueIC&redir_esc=y (accessed on 26 November 2021).
  68. Bedient, P.B.; Holder, A.W.; Thompson, J.F.; Fang, Z. Modeling of Storm-Water Response under Large Tailwater Conditions: Case Study for the Texas Medical Center. J. Hydrol. Eng. 2007, 12, 256–266. [Google Scholar] [CrossRef]
  69. Fang, Z.; Bedient, P.B.; Benavides, J.; Zimmer, A.L. Enhanced Radar-Based Flood Alert System and Floodplain Map Library. J. Hydrol. Eng. 2008, 13, 926–938. [Google Scholar] [CrossRef]
  70. Fang, Z.; Bedient, P.B.; Buzcu-Guven, B. Long-Term Performance of a Flood Alert System and Upgrade to FAS3: A Houston, Texas, Case Study. J. Hydrol. Eng. 2011, 16, 818–828. [Google Scholar] [CrossRef]
  71. Lindner, J.; Schwertz, D.; Bedient, P.B.; Fang, Z. Flood Prediction and Flood Warning Systems. In Lessons from Hurricane Ike, 1st ed.; Bedient, P.B., Ed.; Texas A&M University Press: College Station, TX, USA, 2012; Chapter 4; ISBN 978-1-60344-588-7. [Google Scholar]
  72. Fang, Z.; Sebastian, A.; Bedient, P.B. Modern Flood Prediction and Warning Systems. Handbook of Engineering Hydrology. Fundamentals and Applications; Eslamian, S., Ed.; CRC Press, Taylor & Francis Group: Boca Raton, FL, USA, 2013; ISBN 978-1-4665-5241-8. [Google Scholar]
  73. Juan, A.; Fang, Z.; Bedient, P.B. Developing a Radar-Based Flood Alert System for Sugar Land, Texas. J. Hydrol. Eng. 2017, 22, E5015001. [Google Scholar] [CrossRef] [Green Version]
  74. Gao, S.; Fang, Z. Using Storm Transposition to Investigate the Relationships between Hydrologic Responses and Spatial Moments of Catchment Rainfall. Nat. Hazards Rev. 2018, 19, 04018015. [Google Scholar] [CrossRef]
  75. Gao, S.; Fang, Z.N. Investigating Hydrologic Responses to Spatio-temporal Characteristics of Storms Using a Dynamic Moving Storm Generator. Hydrol. Process. 2019, 33, 2729–2744. [Google Scholar] [CrossRef]
  76. Sanders, W.; Li, D.; Li, W.; Fang, Z.N. Data-Driven Flood Alert System (FAS) Using Extreme Gradient Boosting (XGBoost) to Forecast Flood Stages. Water 2022, 14, 747. [Google Scholar] [CrossRef]
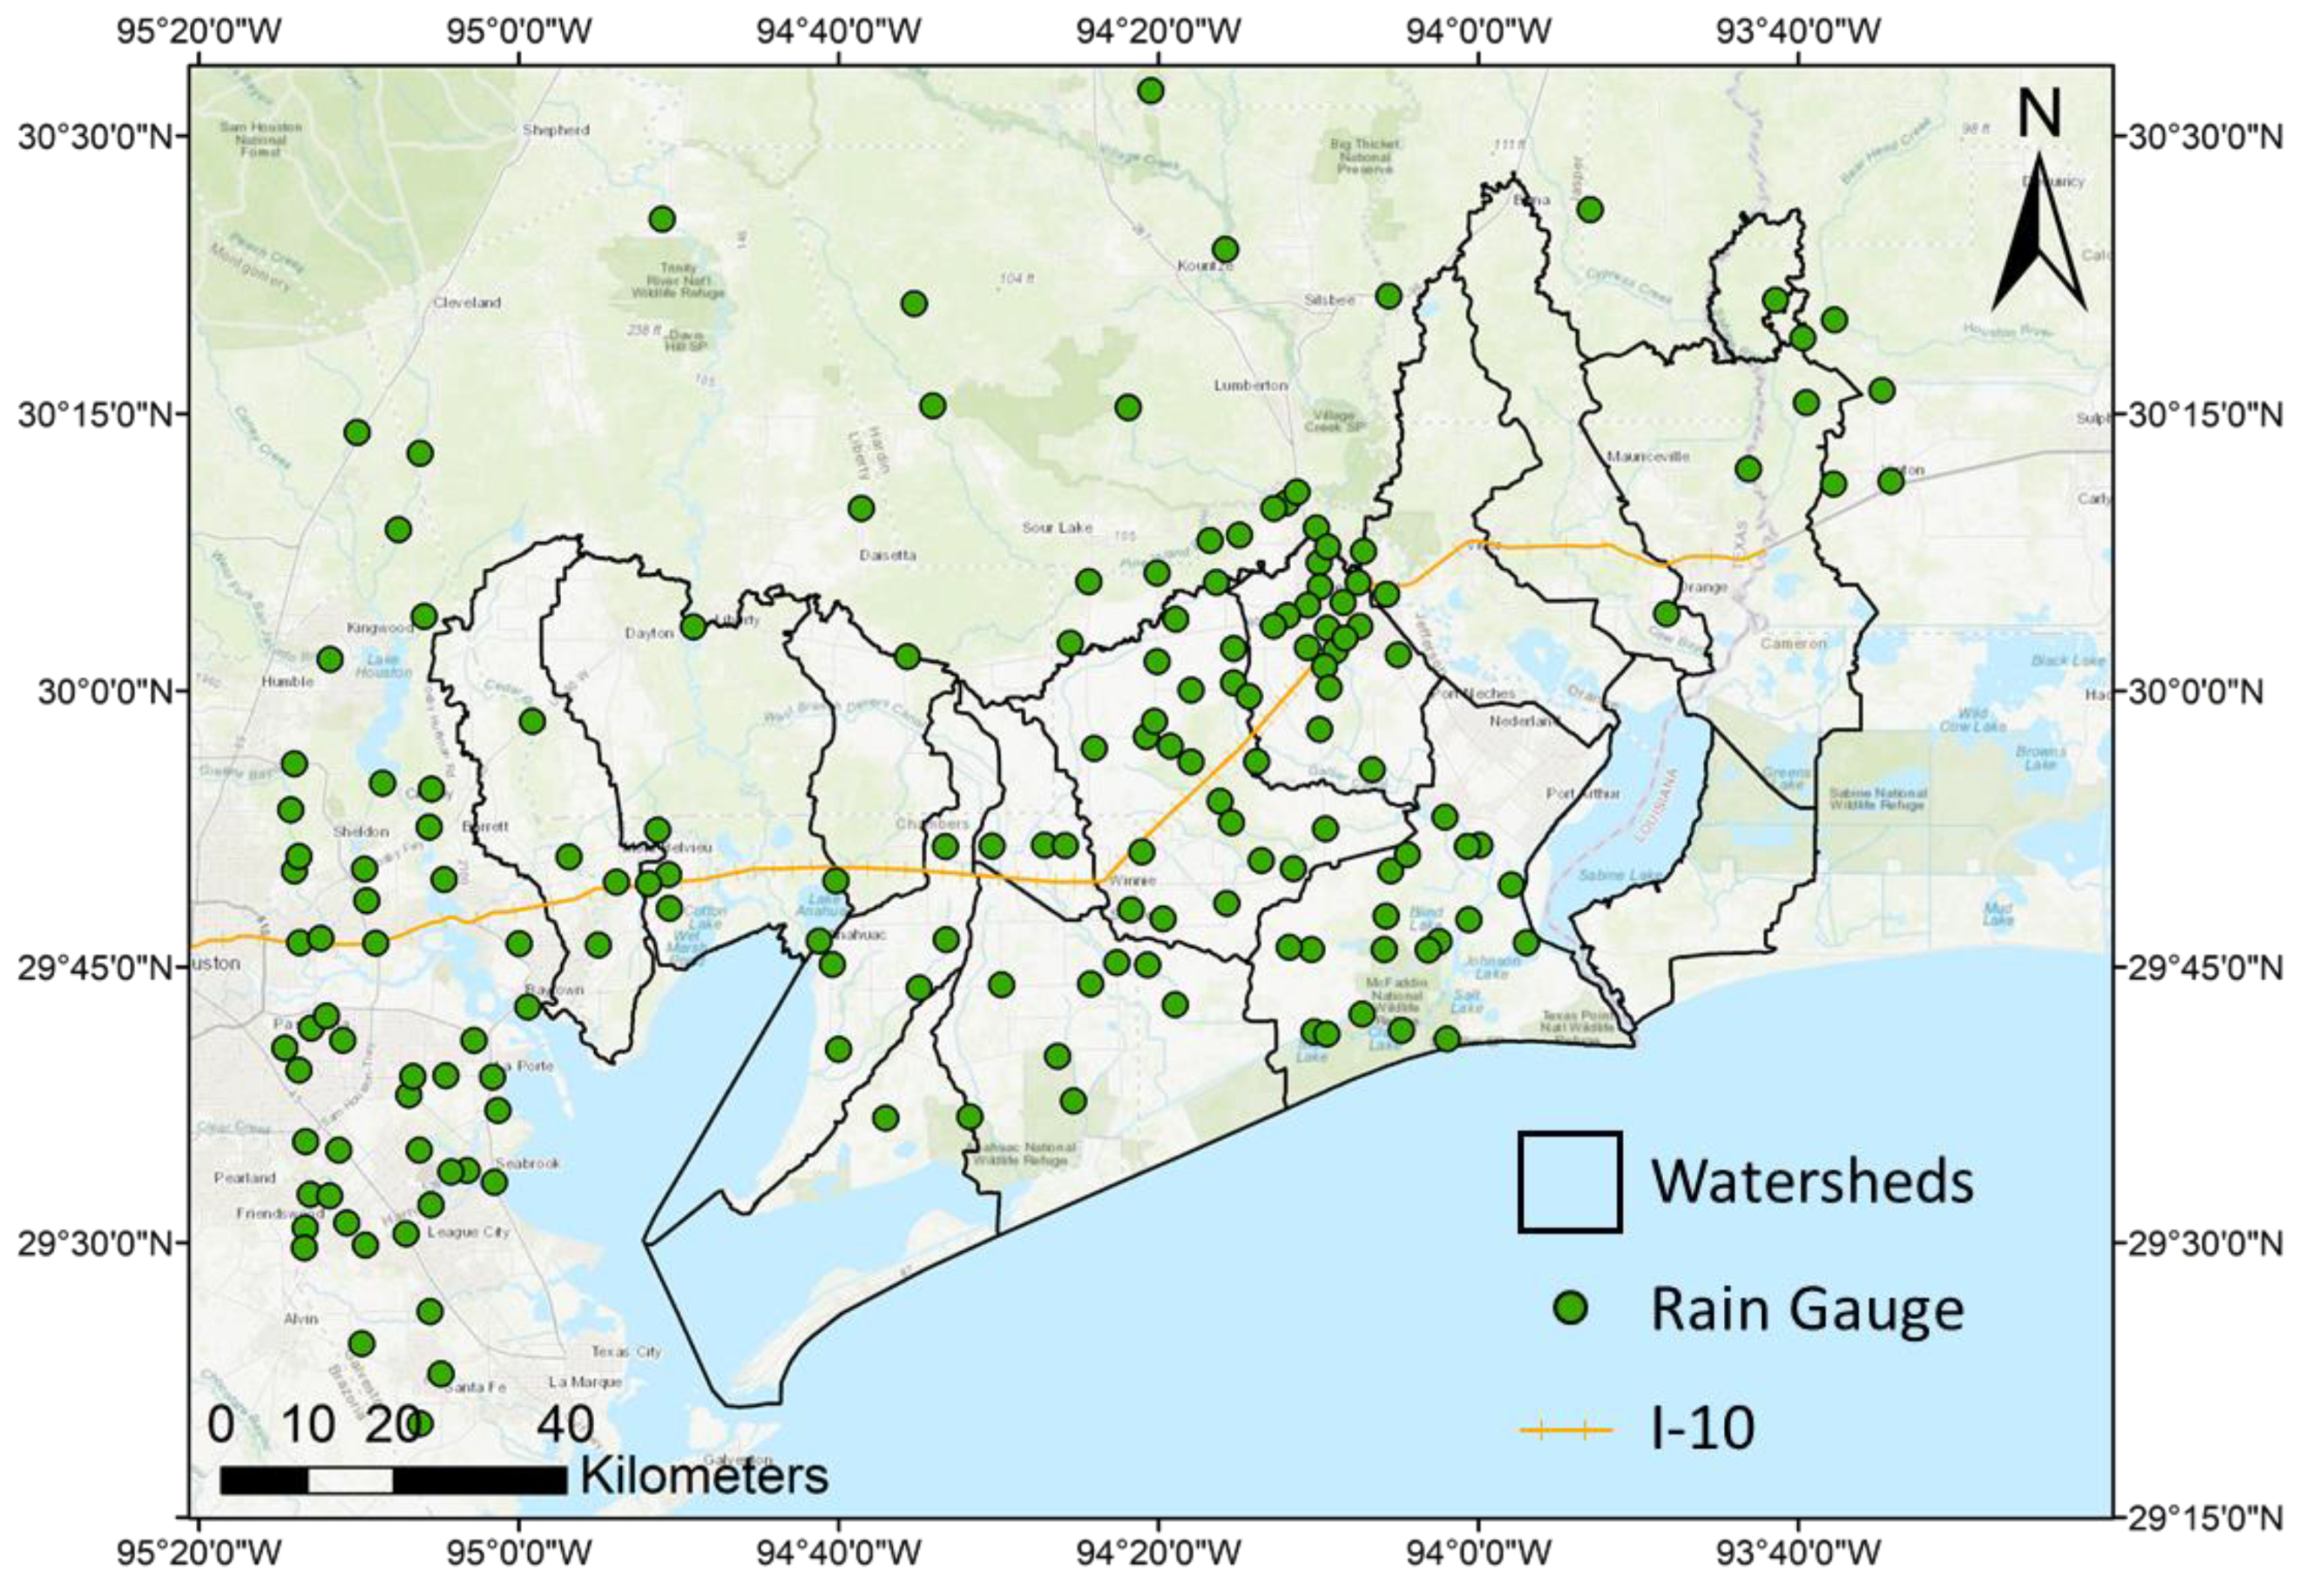
Figure 1. Study area including the watersheds and the total rain gauges assessed.
Remotesensing 15 02033 g001
Figure 2. Rain gauges within/near the study area for (a) Hurricane Harvey (2017) and (b) Tropical Storm Imelda (2019).
Remotesensing 15 02033 g002
Figure 3. Flowchart of the methodology.
Remotesensing 15 02033 g003
Figure 4. (a) Original Stage IV of Hurricane Harvey, (b) Original MRMS of Hurricane Harvey, (c) Original RTMA of Hurricane Harvey, (d) Original Stage IV of Tropical Storm Imelda, (e) Original MRMS of Tropical Storm Imelda and (f) Original RTMA of Tropical Storm Imelda.
Remotesensing 15 02033 g004
Figure 5. Scatterplots of original radar data and calibration gauge data from (a) Stage IV of Hurricane Harvey, (b) MRMS of Hurricane Harvey, (c) RTMA of Hurricane Harvey, and (d) Stage IV of Tropical Storm Imelda, (e) MRMS of Tropical Storm Imelda, (f) RTMA of Tropical Storm Imelda.
Remotesensing 15 02033 g005
Figure 6. Precipitation maps from merged radar-gauge data of (a) Stage IV, (b) MRMS, (c) RTMA using BRK method, (d) Stage IV, (e) MRMS, (f) RTMA using RK method during Hurricane Harvey.
Remotesensing 15 02033 g006
Figure 7. Precipitation maps from merged radar-gauge data of (a) Stage IV, (b) MRMS, (c) RTMA using BRK method, (d) Stage IV, (e) MRMS, (f) RTMA using RK method during Tropical Storm Imelda.
Remotesensing 15 02033 g007
Figure 8. Scatter plots of calibration gauge data and merged radar-gauge data of (a) Stage IV, (b) MRMS, (c) RTMA using the BRK method, (d) Stage IV, (e) MRMS, and (f) RTMA using the RK method during Hurricane Harvey.
Remotesensing 15 02033 g008
Figure 9. Scatter plots of validation gauge data and merged radar-gauge data of (a) Stage IV, (b) MRMS, (c) RTMA using BRK method, (d) Stage IV, (e) MRMS, and (f) RTMA using RK method during Hurricane Harvey.
Remotesensing 15 02033 g009
Figure 10. Scatter plots of calibration gauge data and merged radar-gauge data of (a) Stage IV, (b) MRMS, (c) RTMA using the BRK method, (d) Stage IV, (e) MRMS, and (f) RTMA using the RK method during Tropical Storm Imelda.
Remotesensing 15 02033 g010
Figure 11. Scatter plots of validation gauge data and merged radar-gauge data of (a) Stage IV, (b) MRMS, (c) RTMA using the BRK method, (d) Stage IV, (e) MRMS, and (f) RTMA using the RK method during Tropical Storm Imelda.
Remotesensing 15 02033 g011
Table 1. Number of hourly rain gauges used in the rainfall analysis.
StormsDurationAverage Total DepthTotalCalibrationValidation
2017 Harvey8/23 to 9/3 (12 days)103.53 cm12611214
2019 Imelda9/17 to 9/22 (5 days)42.29 cm15013515
Disclaimer/Publisher’s Note: The statements, opinions and data contained in all publications are solely those of the individual author(s) and contributor(s) and not of MDPI and/or the editor(s). MDPI and/or the editor(s) disclaim responsibility for any injury to people or property resulting from any ideas, methods, instructions or products referred to in the content.