1. Introduction
Infrastructure damage in the Caribbean Antilles Islands (16–19°N, 63–69°W) from gusty winds, heavy rain, and coastal waves may be anticipated by short-term weather forecasts and mitigating behavior by government agencies, local service providers and residents. Long-term strategic planning and preventative measures could play a role in limiting material losses and speeding disaster recovery with guidance on the frequency, intensity, and trends of weather-related risks.
The El Niño–Southern Oscillation (ENSO) plays a well-known role in modulating Caribbean sea surface temperature (SST) and the atmospheric circulation and composition [
1,
2,
3,
4,
5,
6,
7,
8]. The North Atlantic anticyclone tends to weaken with the onset of La Niña, so trade winds retreat, SSTs warm, and tropical cyclones (TCs) tend to increase [
9,
10]. Yet seasonal forcing by air–sea interactions over the Pacific and Atlantic Oceans explains <50% of year-to-year TC variance [
11].
Intra-seasonal pulsing of Caribbean weather can be traced to a number of factors including: (i) the West African monsoon and easterly waves, (ii) the South American monsoon and river plumes [
12,
13], and (iii) the equatorial Madden Julian Oscillation (MJO) [
14,
15]. These features are accurately characterized by modern coupled reanalysis products underpinned by advances in satellite technology and data assimilation.
Our field of study is the teleconnections between local transient weather and regional climate, which is an important space–time scale interaction.
This study addresses the following scientific questions:
- (i)
What constitutes an optimal index of localized severe weather impacts?
- (ii)
How does a Caribbean storm index relate to anomalous circulations across the tropical Pacific and Atlantic Oceans?
- (iii)
Is there sufficient memory in pre-season conditions to anticipate weather-related risks?
- (iv)
What new insights can be gained, and are they site-specific or universal?
Results include a case study that demonstrates how the statistical analysis ‘points’ to a severe weather event. The purpose of this research is to establish a novel way to calculate an objective index of meso-scale storminess. Employing such an index, multi-faceted analyses seek to uncover the large-scale marine climatic ‘envelope’ that governs chances for storm intensification and socio-economic impacts in small islands, which act as a gateway to landfall elsewhere.
2. Data and Methods
European Reanalysis version 5 at 25 km resolution (ERA5; [
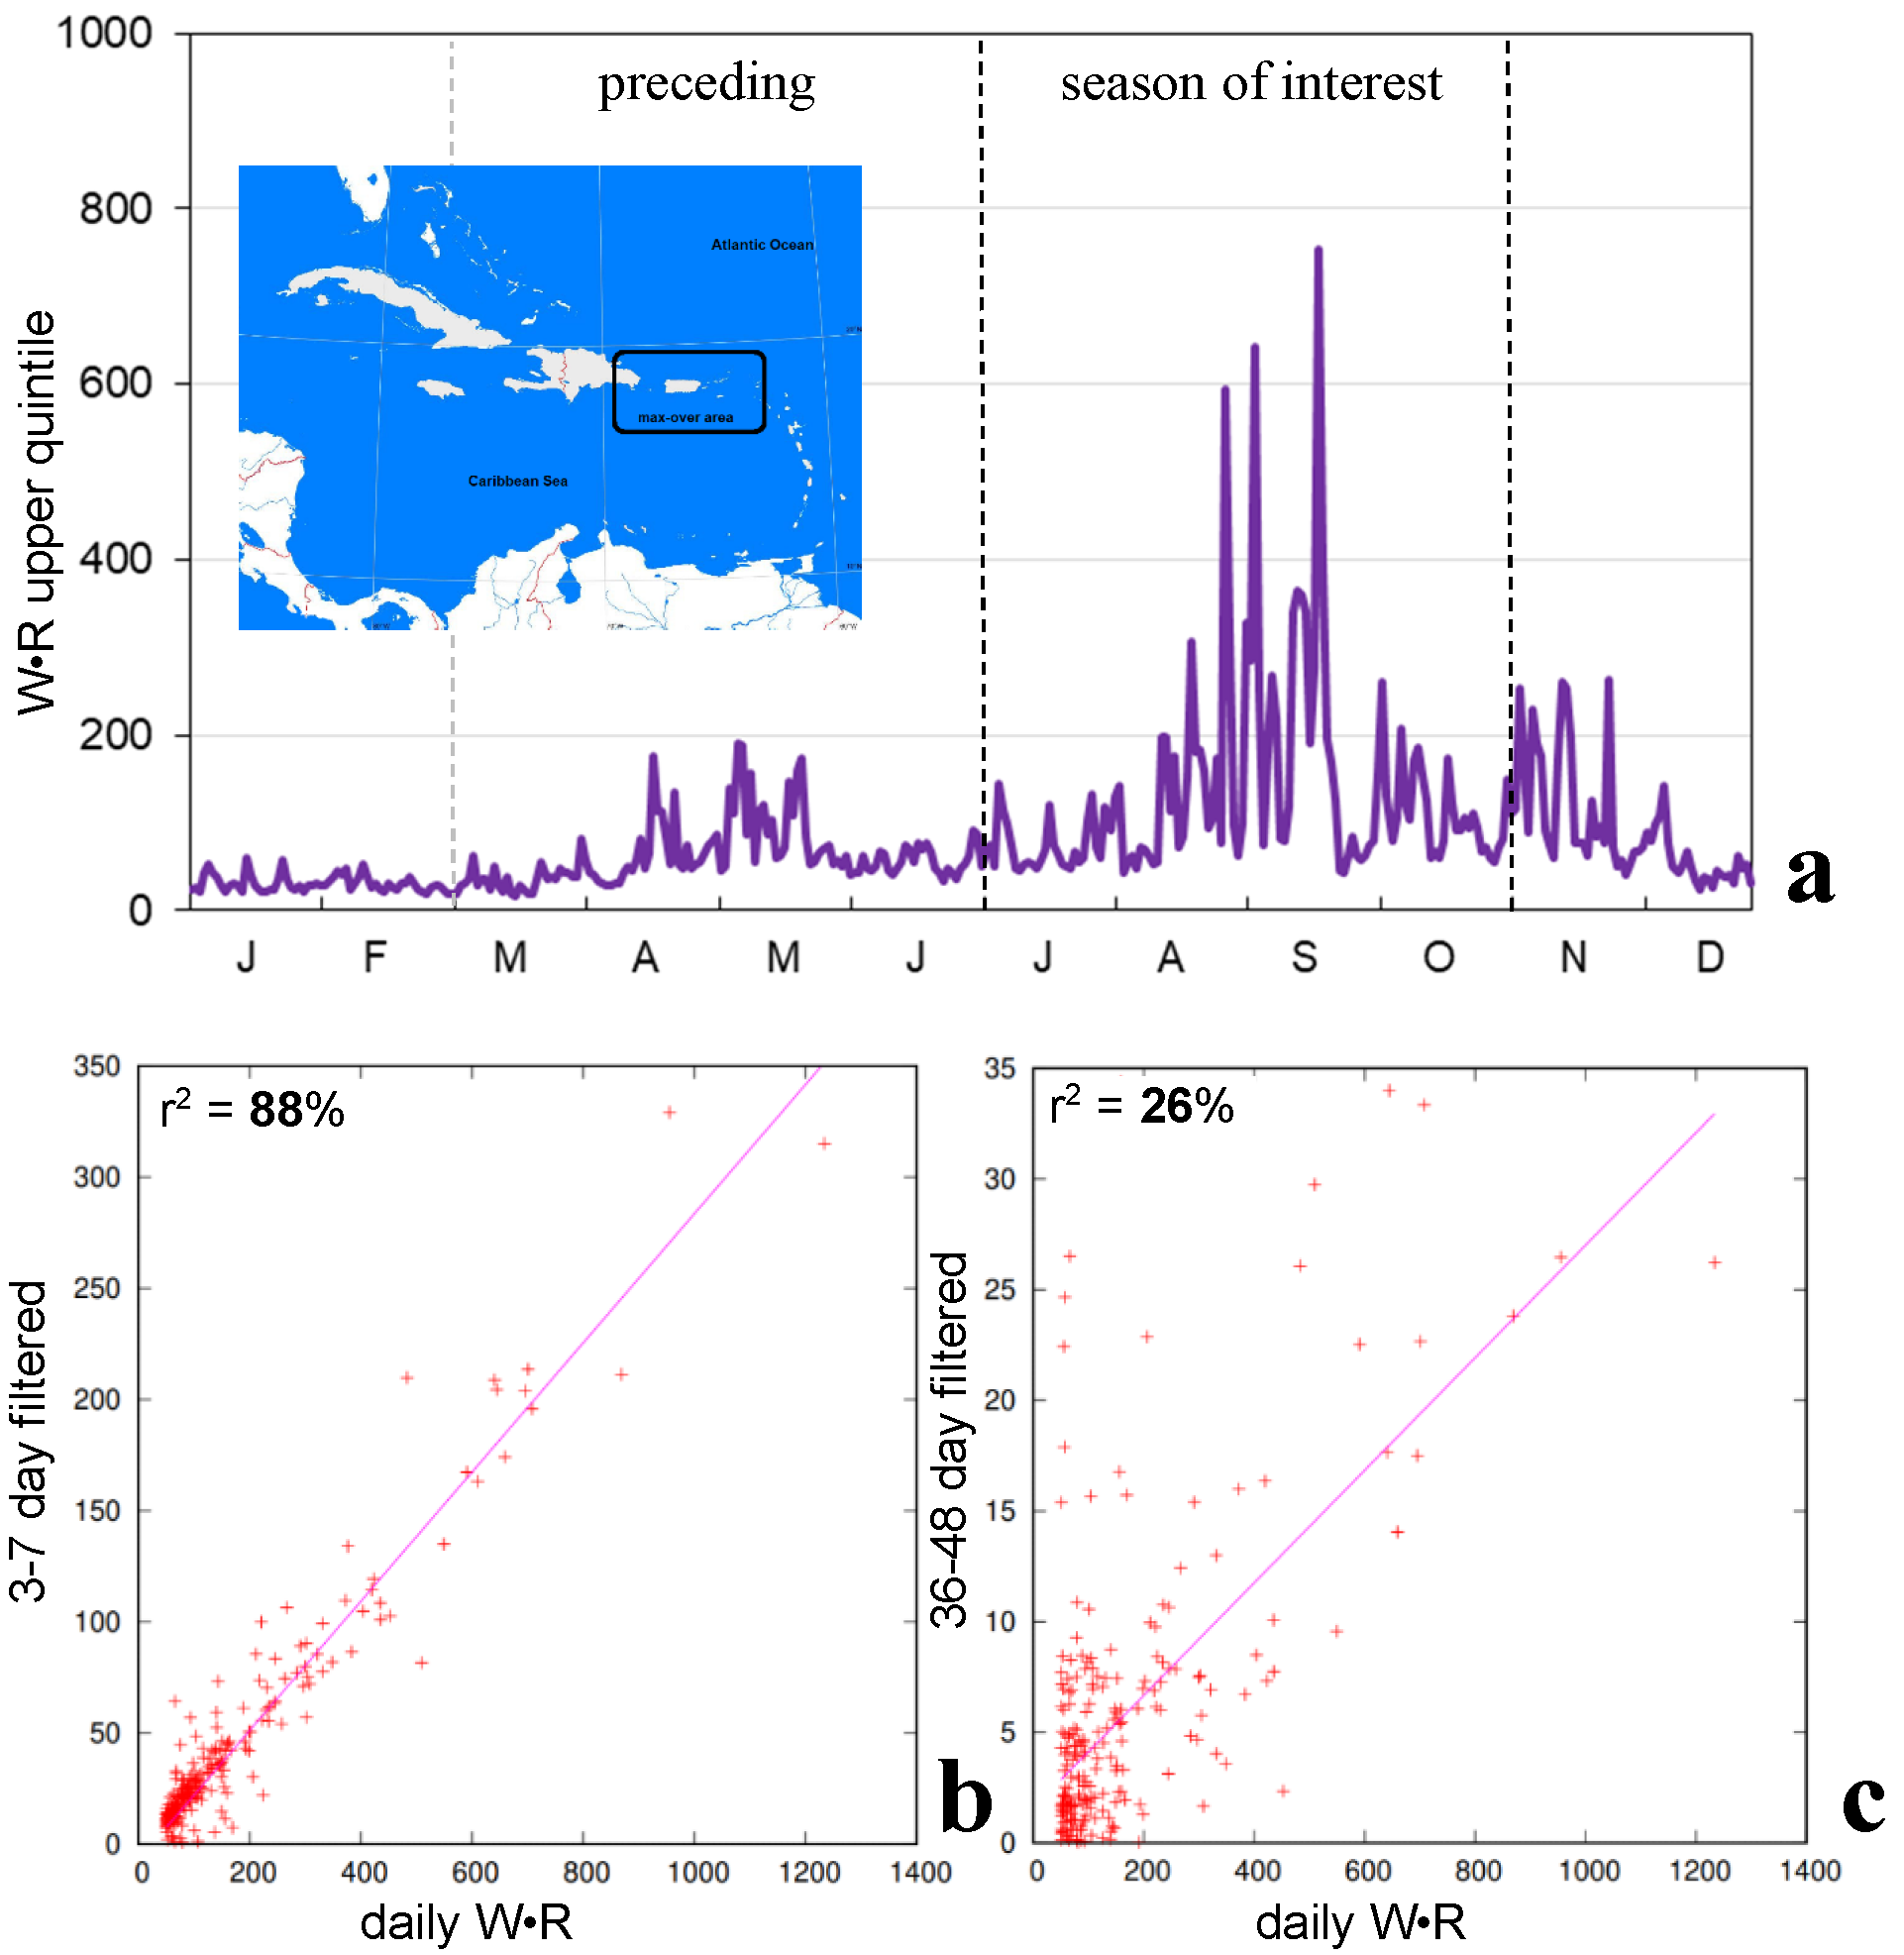
16]) provides daily maximum wind speed (W) and daily maximum rainfall (R) in the period 1970–2021 over the central Caribbean 16–19°N, 63–69°W Antilles Islands. This small domain was selected so that max-over values could not disperse, thus keeping W and R in close proximity. The 3 × 6° area is a gateway for TCs passing from the tropical Atlantic to landfall in the western basin. The lag correlations of the two time series (N = 18,628) peak simultaneously, indicating they could represent local weather impacts. After normalizing for standard deviation, e.g., rain ÷ 7, the two variables were multiplied together to create a daily W•R times series of extreme weather events in the central Antilles. Autocorrelation of the W•R time series with 3–7-day and 36–48-day polynomial band-filtered W•R time series was completed to determine forcing by short easterly waves and long equatorial MJO. The W•R mean annual cycle crests from July to October. To place short-term impacts in seasonal context, the daily W•R time series was reduced to an annual interval by summing daily values >10 m/s > 35 mm/day from July to October. The spatial structure of teleconnections was studied by regression and composite analysis, and temporal associations were analyzed by lag correlation.
The times series of Jul–Oct W•R values was regressed onto Jul–Oct 1970–2021 detrended fields of sea surface temperature (SST; [
17]), satellite net outgoing longwave radiation (OLR; [
18]), and ERA5 200 hPa zonal wind over the domain: 10°S–25°N, 180°W–20°E, as in [
11]. The domain was confined after global analyses identified the location of significant point-to-field teleconnections. Jul–Oct W•R values were ranked to determine the top-10 years (cf.
Table 1) for analysis of composite anomalies of sea level pressure (SLP), winds, salinity, ocean currents, heat flux, atmospheric convection (as indicated by OLR), air and sea temperature. As part of the composite work, an E-W height section of the Walker circulation was analyzed 0–5°N. Regression and composite maps/sections were calculated for the preceding Mar–Jun season to gain predictive insights. Field significance was estimated so that interpretations focus on significant areas with >95% confidence.
Lag correlations were analyzed between the Jul–Oct W•R time series and known climate indices such as the multivariate ENSO (MEI; [
19,
20]). Inter-annual climate influences were evaluated by wavelet spectral analysis of 18-month low-pass filtered W•R time series. The W•R time series and its inter-annual filtered anomalies were cross-correlated with central Antilles 850 hPa and 500 hPa specific humidity, SST, evaporation, sensible heat flux, and with Orinoco River discharge (derived from [
21]). The mean annual cycle of near-surface salinity from ocean reanalysis [
22,
23,
24] was compared with river discharge and SST to link mixed layer depth to upper ocean heating. Statistical evaluations with the Jul–Oct W•R time series have ~50 degrees of freedom; 95% confidence requires a Pearson-product moment r > |0.23|.
The anomalous circulation between the Pacific and Atlantic was analyzed by a Jul–Oct composite N–S height section 80°W, 10°S–25°N of zonal wind, specific humidity and Hadley Cell (as in [
7]). A daily 850 hPa zonal (U) wind time series was formulated over the SW Caribbean 7–15°N, 80°W and lag-correlated with the central Antilles W•R index and SLP field. Linear regression slopes for monthly central Antilles SST and W•R were computed to identify long-term trends 1970–2021.
Caribbean hurricanes > category 1 were mapped, and a leading case (with daily W•R values above threshold) was analyzed: TC Fiona September 2022. Radar reflectivity, mesoscale winds [
25], and Hysplit back-trajectories [
26] describe the weather scenario and airflow from 17 to 19 September 2022 arriving at 18.2 N, 66.5 W, 500 m. Environmental conditions before TC Fiona passage were analyzed for SST, near-surface salinity, ocean currents, satellite vegetation fraction, near-surface wind and specific humidity anomalies from satellite and model reanalysis [
27,
28,
29,
30]. A hovmoller plot 15–20°N, 80°W–20°E of cMorph multi-satellite rainfall [
31] was analyzed for easterly waves in the period 1–20 Sep 2022. TC Fiona resulted in flash floods and landslides in Puerto Rico, causing infrastructure damage of ~
$3 B.
3. Results
3.1. Temporal Analysis and Statistics
The annual cycle of daily W•R time series (
Figure 1a) exhibits intra-seasonal pulsing that crests from July to October due to severe weather events. This defines our season-of-interest and Mar–Jun precursor. Scatterplots of daily W•R time series versus filtered values (
Figure 1b,c) achieve 88% r
2 fit with 3–7 day oscillations and 26% r
2 fit with 36–48 day oscillations (e.g., autocorrelation of raw vs. filtered). Inter-annual fluctuations of the 18-month band-filtered W•R time series (
Figure 1d,e) have significant spectral energy at 3- and 6-year intervals, particularly after 1990. These relate to ocean Rossby waves transiting the tropical Pacific [
32], causing the thermocline to undulate east–west in sympathy with the Walker circulation.
Simultaneous cross-correlations between local climate variables and the Jul–Oct W•R index 1970–2021 (
Table 2) are significant for seasonal 850 and 500 hPa specific humidity (0.30, 0.32) and SST (0.24), and they are noteworthy for salinity (−0.20). Mean annual cycles (cf.
Table 3) exhibit a Jun–Aug peak of river outflow that takes ~3 months to reach the central Antilles with lower salinity < 34.8 ppt. Consequently, a shallow mixed layer is formed that amplifies heating, raising SST > 29 °C from August to October. By contrast, low SSTs in March limit the risk of severe weather impacts then.
Pairwise lag correlations with known climate indices are listed in
Table 4. The Jul–Oct W•R index is significantly associated with MEI and SOI from −2 month lead to +3 month lag. The Niño3 SST index reaches significance at +4 to +6 months, e.g., the following winter. Near-surface zonal winds in the SW Caribbean (U-wind) exhibit significant links at −2 month lead. AMO correlations peak at three months before and after, while the NAO achieves moderate values at −4-month lead. The MEI exhibits its strongest teleconnection with the Jul–Oct W•R index r = −0.44, representing coupled ENSO modulation [
11,
20]. Some temporal instability arises from competing influences of slow vs. fast oscillations from marine vs. monsoon regimes: as evident in running correlations (
Table 5) that are weak in the 1980s and strengthen thereafter.
3.2. Point-to-Field Regression Maps
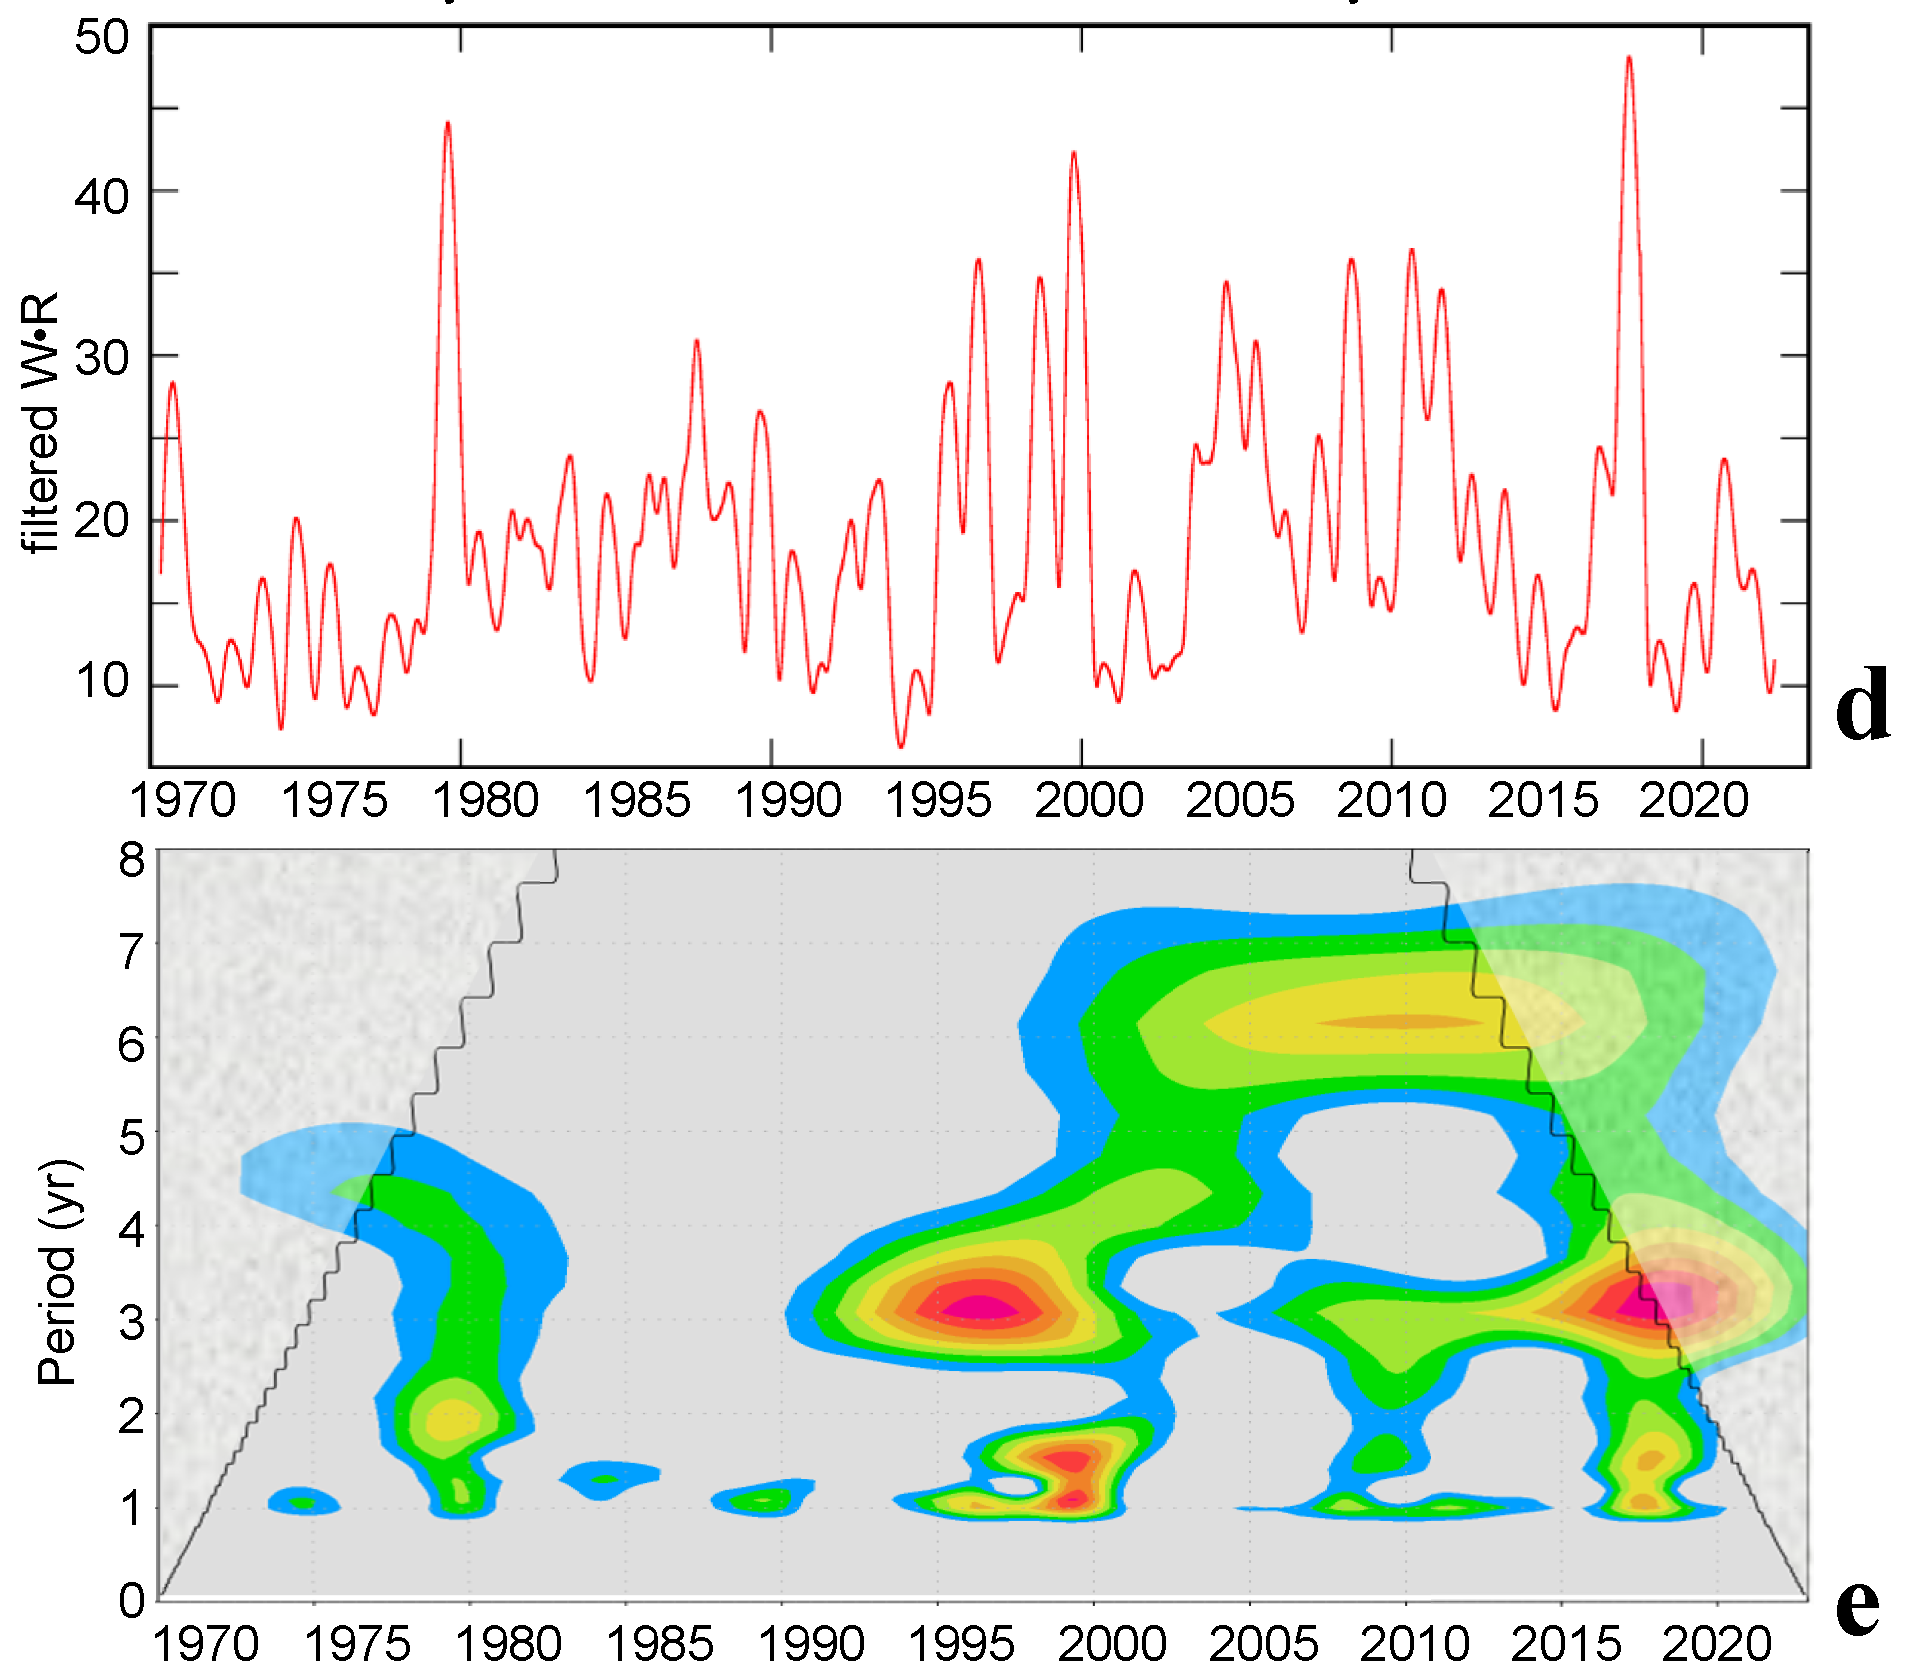
Regional forcing of severe weather in the central Antilles emerges from W•R time-series regressions onto Jul–Oct fields of SST, OLR and 200 hPa zonal wind (
Figure 2a–c). The tropical Atlantic is warmer particularly from 0–50°W, 10°S-20°N, as expected [
11]. An equatorial cold tongue extends across the east Pacific, and atmospheric convection is reduced in the central Pacific (+OLR). Naturally, the Caribbean shows increased atmospheric convection, but the –OLR signal over West Africa is missing [
33]. Where is the easterly wave train from Cabo Verde? Considering the upper air circulation, there is a broad band of 200 hPa easterlies from the South Atlantic to Peru, signaling a retreat of the southern subtropical jet in the Jul–Oct season in response to a weaker meridional air temperature gradient dT/dy from the upstream Pacific La Niña.
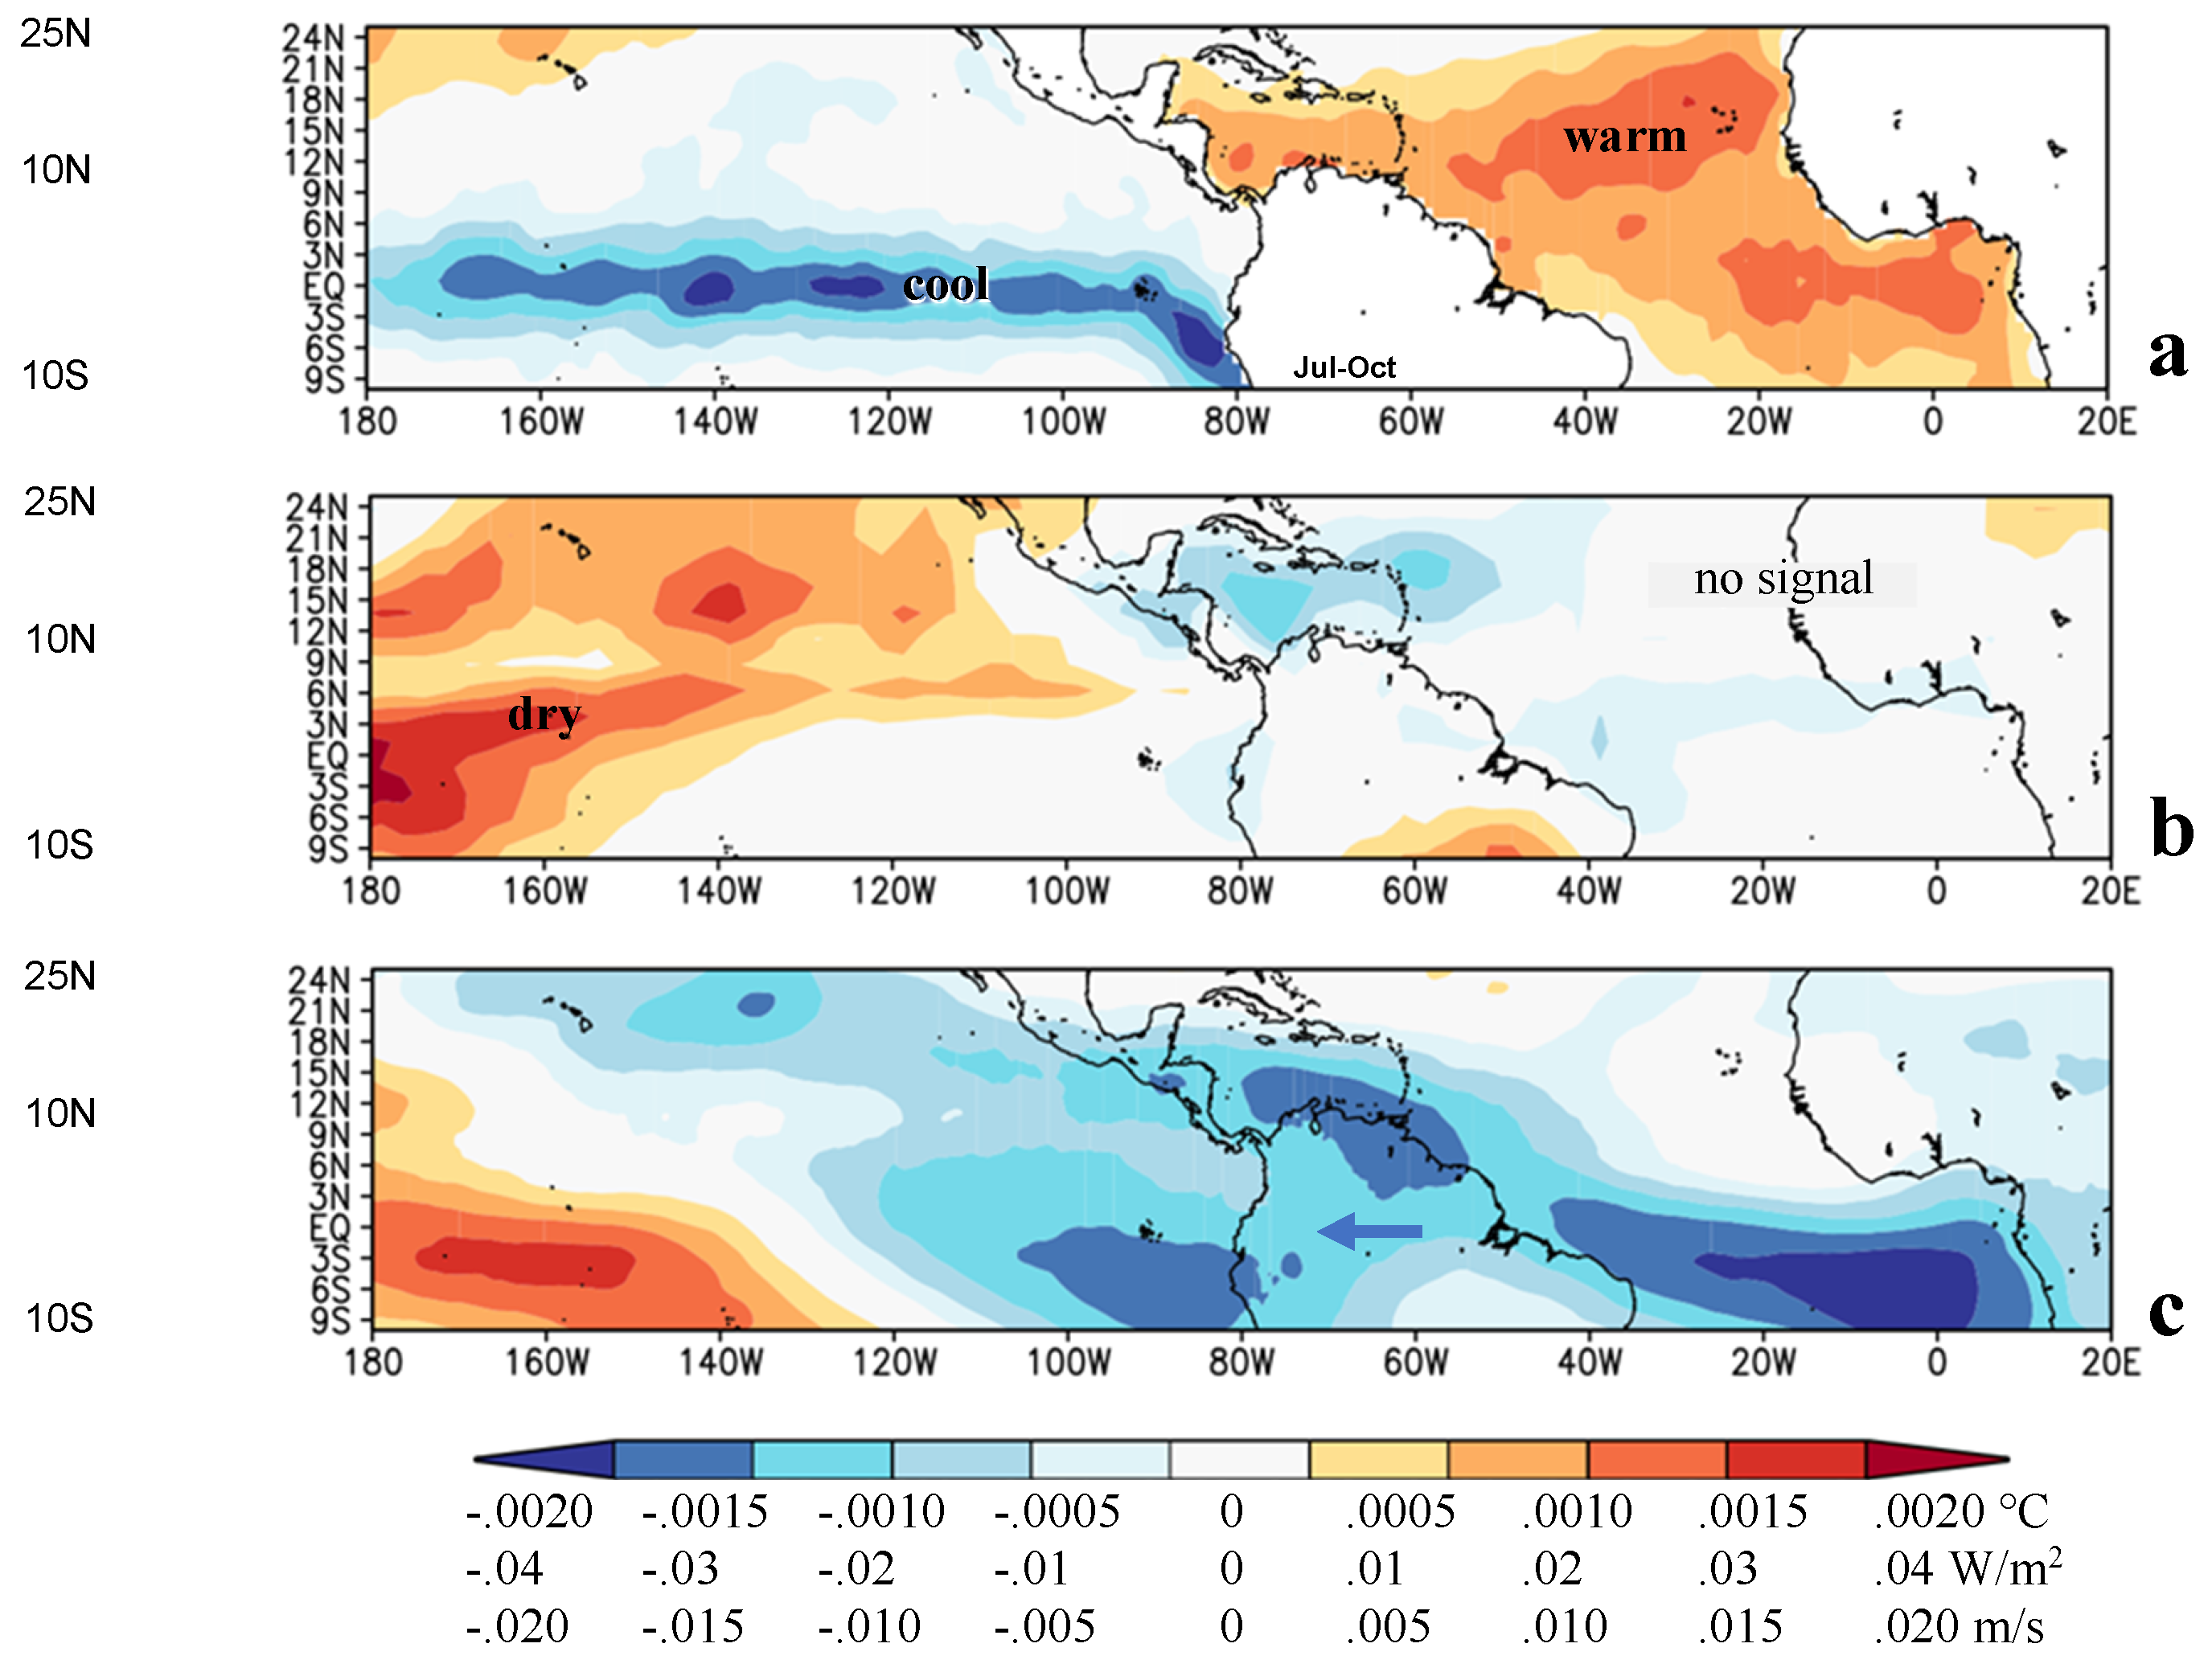
Point-to-field regressions in the preceding Mar–Jun season (
Figure 3a–c) provide clues to anticipate severe weather risks in the central Caribbean. The Pacific SST cool tongue fades out due to ENSO seasonality, but SST warming in the east Atlantic exhibits ‘memory’. The OLR pattern indicates reduced SW cloud bands near Mexico (+OLR). Equatorial Atlantic convection is more active (–OLR) and upper easterly winds are prevalent especially over the South Atlantic (weaker jet) in the Mar–Jun season. The anomalous 200 hPa zonal circulation signals an impending La Niña. Thus, sufficient memory exists to anticipate weather-related risks
not from east Pacific SST but in the large-scale upper atmospheric circulation.
3.3. Composite Analysis of Maps and Sections
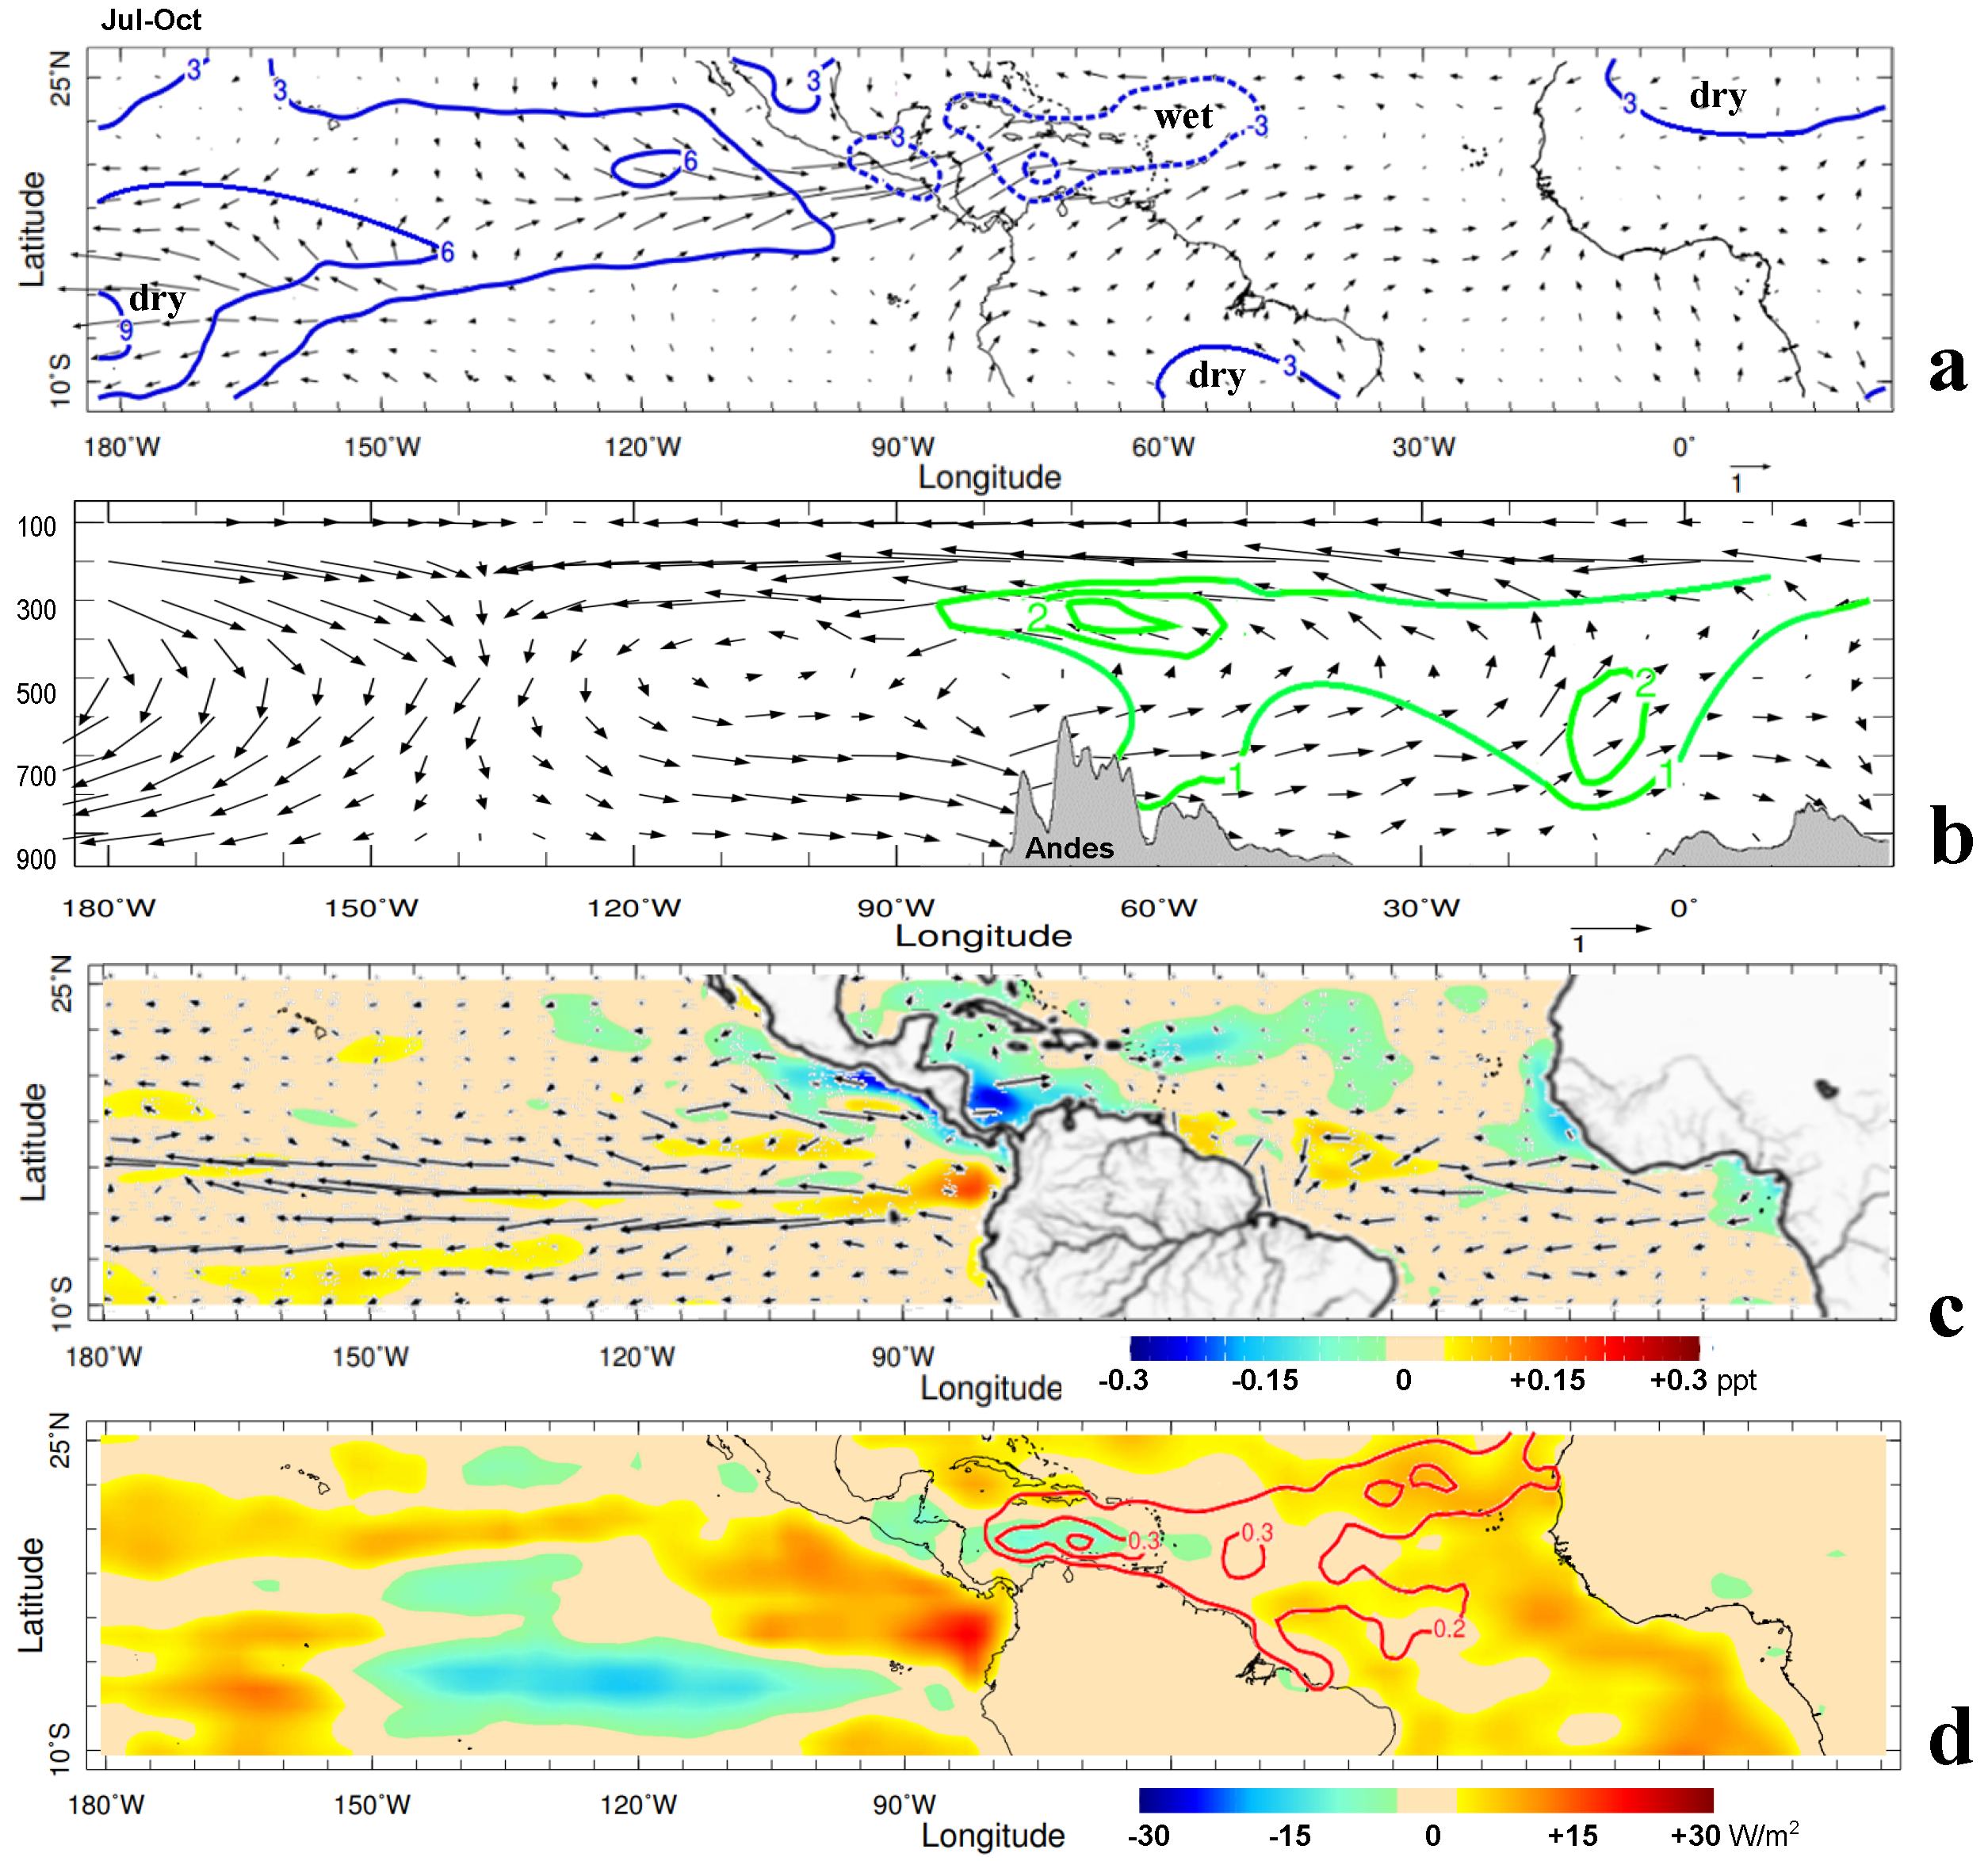
Composite Jul–Oct maps of heat flux, near-surface winds, salinity and current anomalies for top-10 years (based on
Table 1) are plotted in
Figure 4a–d. Surplus (downward) heating appears in the eastern Pacific and eastern Atlantic. Negative salinity anomalies are noted across the tropical Atlantic and western Caribbean, indicating buoyancy that favors warming of the upper ocean, as outlined in [
34]. Westerly wind anomalies extend from the NE Pacific to the Caribbean and converge into the equatorial Atlantic trough (–OLR). In contrast, convective clouds are limited (+OLR) over the central Pacific, Amazon Basin and West Africa in the Jul–Oct composite. The zonal overturning Walker circulation is well established with upper easterlies/lower westerlies and positive humidity anomalies over the Caribbean and tropical Atlantic. Wet conditions over the Sahel (cf. [
12,
35]) are absent. Near-surface ocean current anomalies are westward in the equatorial Atlantic and across the Pacific. Eastward currents in the southern Caribbean coincide with SST anomalies > +0.3C.
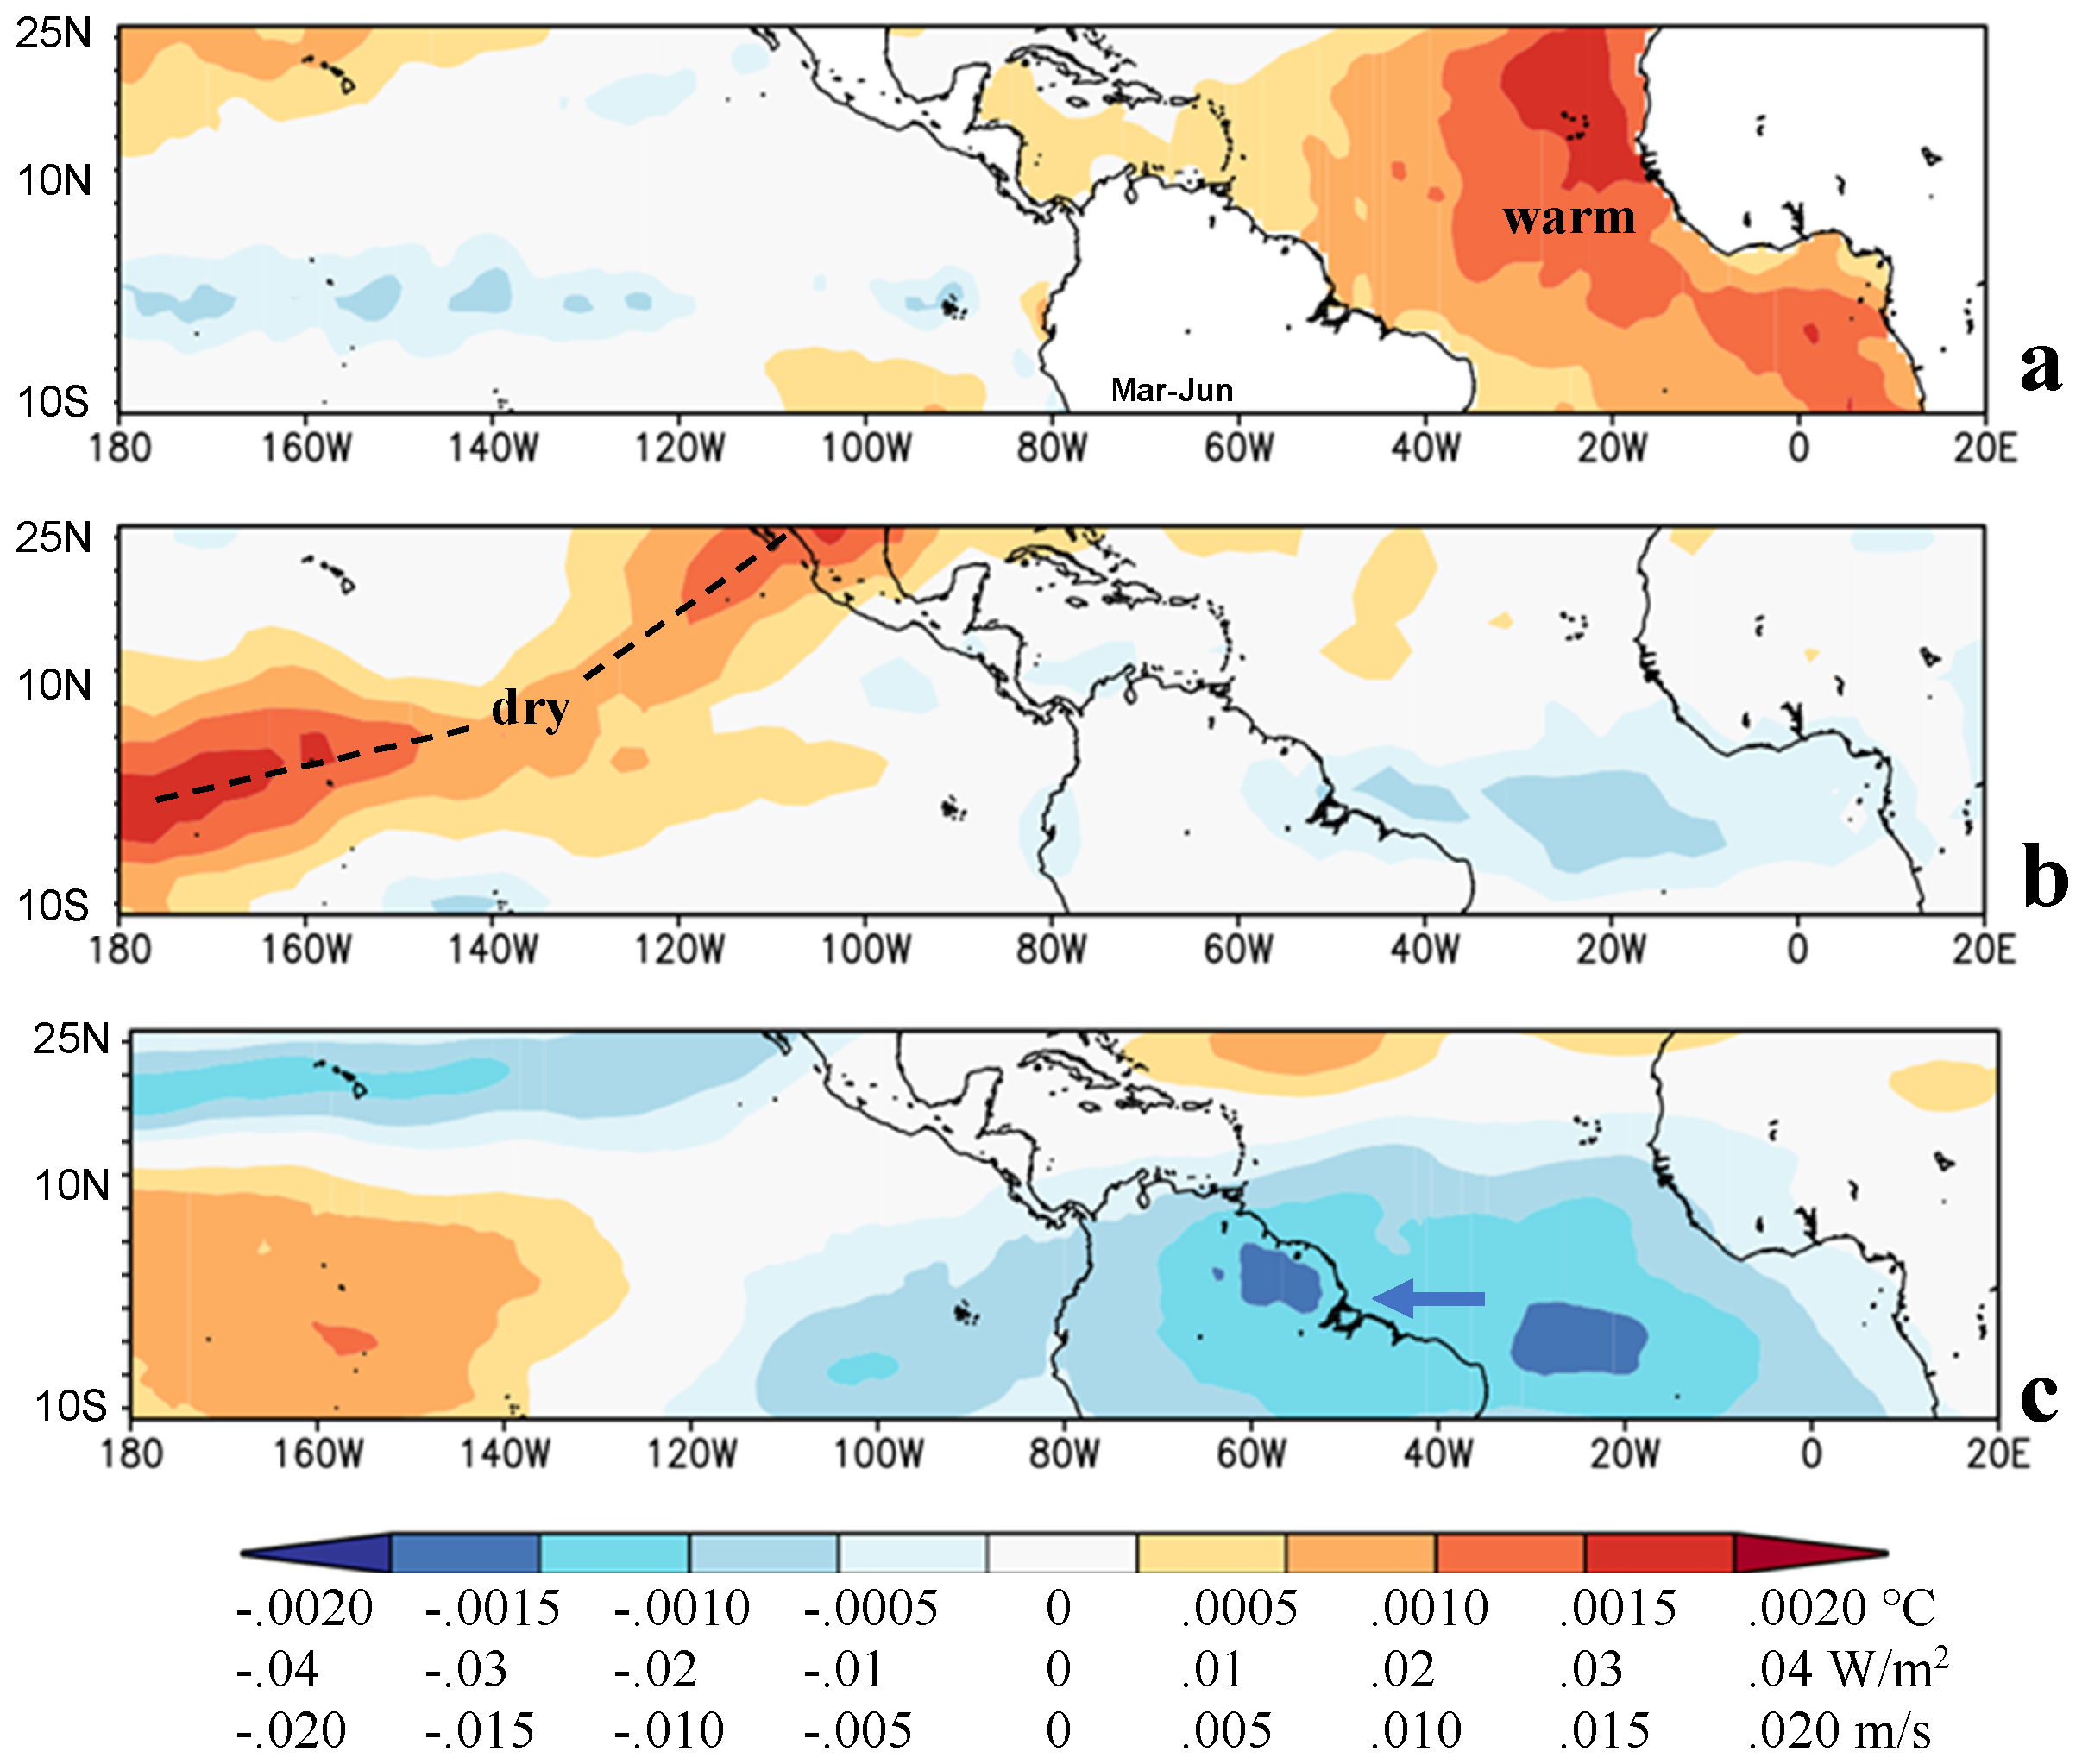
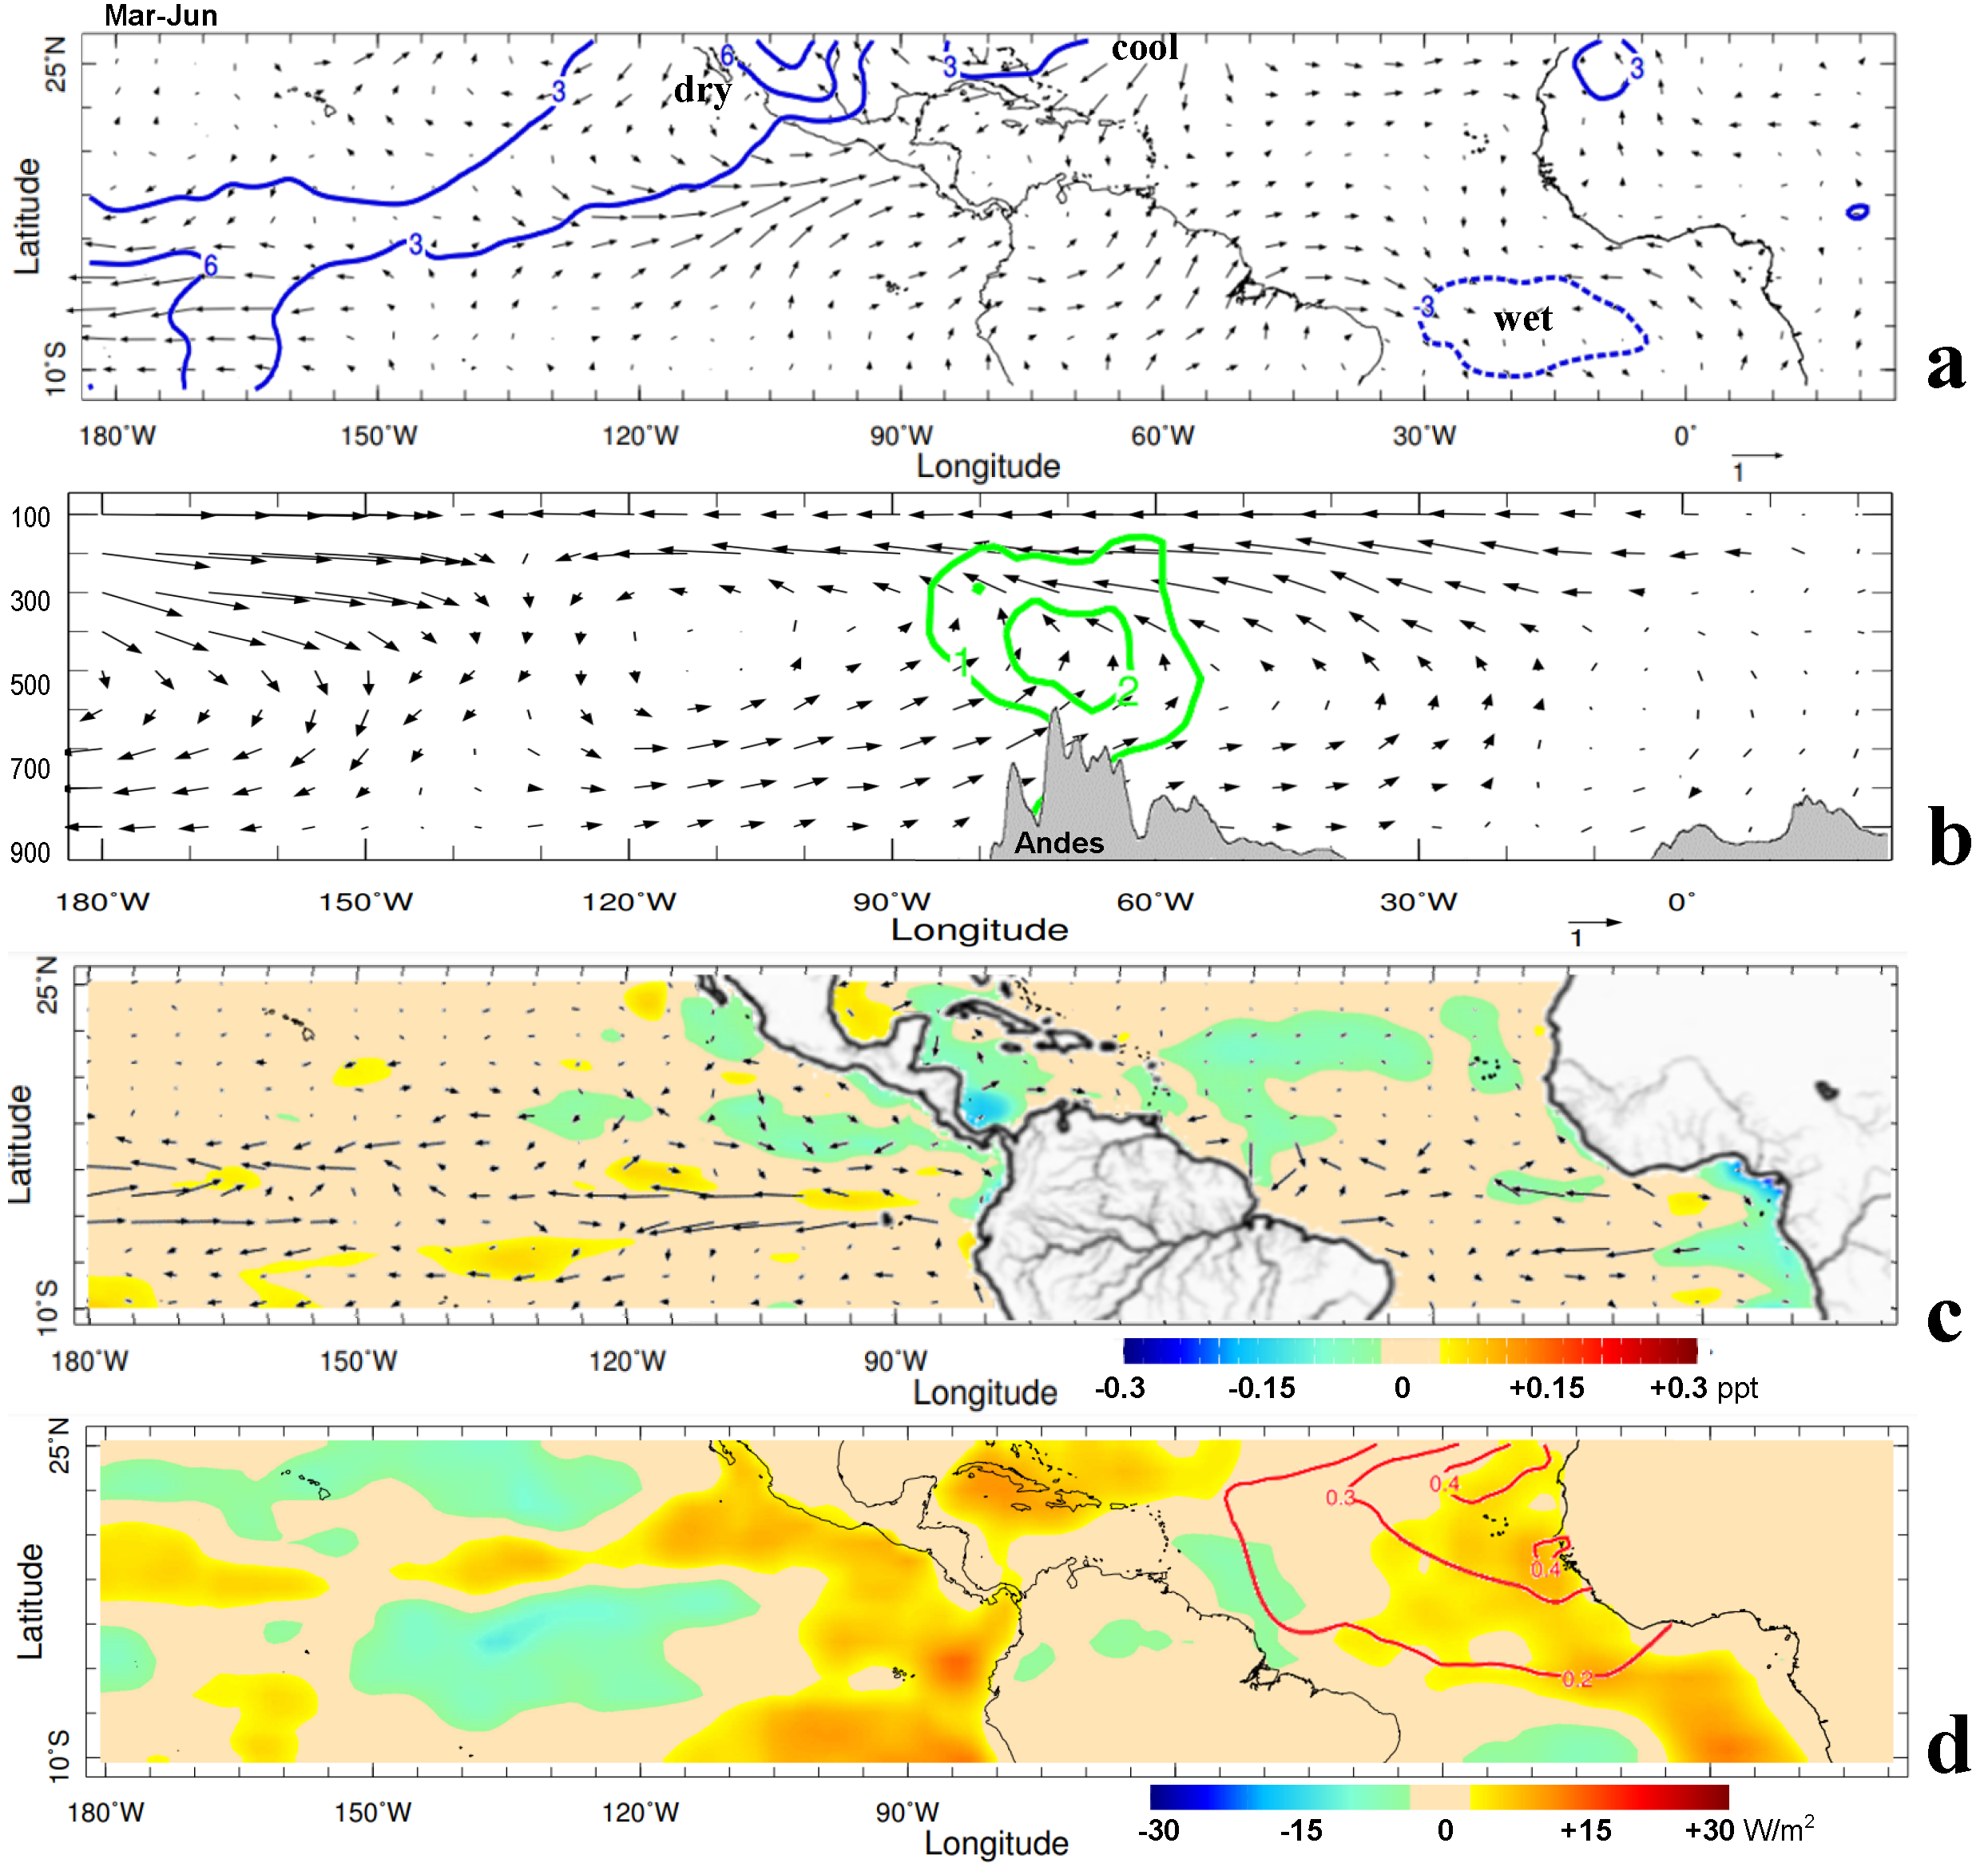
Composite maps for the preceding Mar–Jun season, based on the top-10 years, are plotted in
Figure 5a–d. Surplus heat flux and lower salinity are sustained in pre-season maps. Westerly wind anomalies extend from the Amazon Basin to the Atlantic equatorial trough (–OLR) and NW African upwelling zone, where SSTs are 0.4 °C above normal. The Mar–Jun composite reflects cool northerly winds in the Caribbean prior to Jul–Oct stormy spells. A zonal overturning Walker circulation is established in Mar–Jun ahead of the Pacific cold tongue. Low-level easterlies and sinking motions characterize the central Pacific, while upper easterlies and rising motions over the Andes induce a positive humidity anomaly. The low-level westerly wind anomaly and equatorial Walker circulation extend from 130–30°W in Mar–Jun.
3.4. Pacific–Atlantic Circulation and Trends
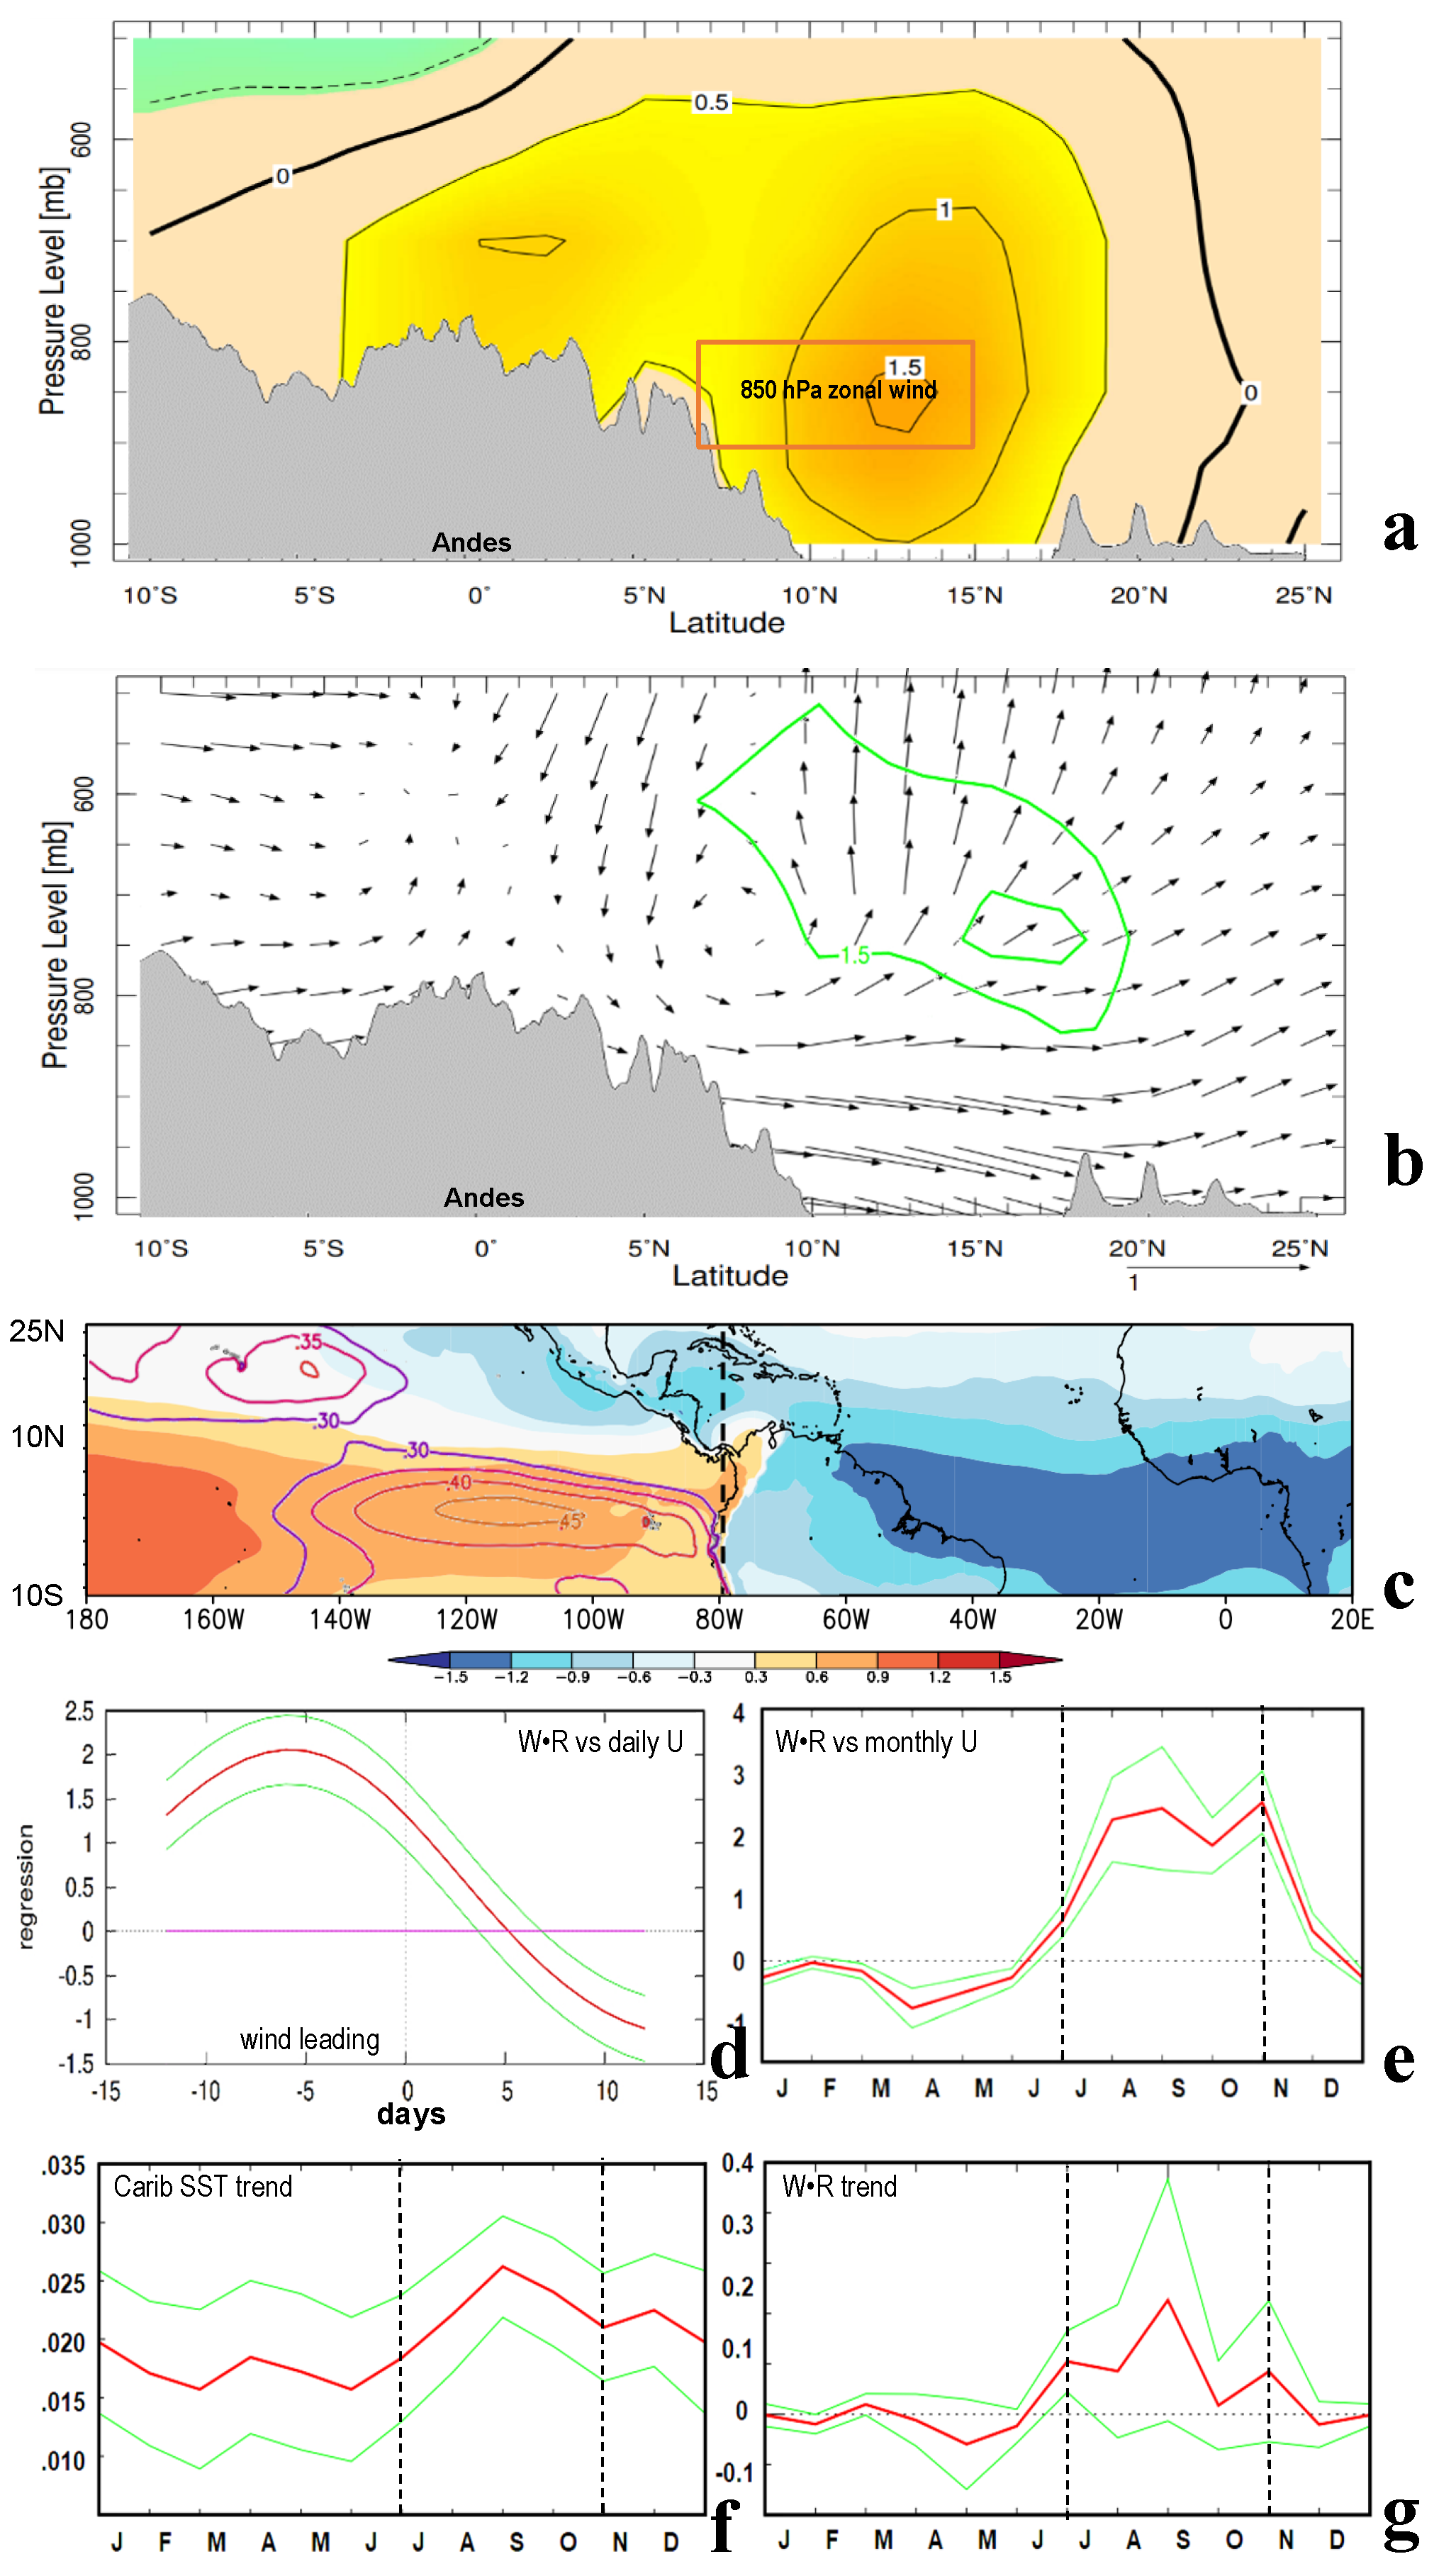
The anomalous Pacific airflow to the SW Caribbean is analyzed by composite height section on 80°W (
Figure 6a,b) based on the top-10 years. A core of westerly wind (0–15°N, 1000–600 hPa) prevails north of Panama. The anomalous meridional overturning circulation has sinking motions at 5°N and rising motions at 15°N embedded in southerly winds, which draw moisture +1.5 g/kg into the Caribbean in the layer 850–500 hPa. The regression of U-wind 1970–2021 onto daily and seasonal Jul–Oct SLP fields (
Figure 6c) reflects a positive/negative dipole across the equatorial Pacific/Atlantic. The Andes Mountains channel the anomalous winds, weakening upwelling north of Colombia/Venezuela which then supply warm moist air on the flank of passing storms. Regression of seasonal U-wind on SLP shows positive values across the tropical east Pacific, but inter-annual signals are weak in the Atlantic.
Temporal lag correlations (
Figure 6d) indicate a 5-day delay between a surge of tropical Pacific air (80°W) and severe weather impacts in the central Caribbean (65°W), yielding a phase speed ~3.5 m/s consistent with MJO [
36]. Regressions between W•R and 36–48-day U-wind (
Figure 6e) exhibit optimal values in the August–November season, e.g., when MJO have an influence on Caribbean storminess. Long-term trends are studied by linear regression applied to Caribbean SST and W•R 1970-2021 (
Figure 6f,g). The steepest upward trend occurs in the Jul–Oct season (+0.25 °C/yr and 20%, respectively); the SST trend is amplified by river plumes (cf.
Table 3), while the W•R trend is partly attributable to numerous intense TCs in September 2017.
3.5. Case Study and Context
TC Fiona struck Puerto Rico 18–19 September 2022 with high winds followed by heavy rainfall (
Figure 7a,b). The storm track/intensity was well forecast, but most residents did not anticipate
$3B infrastructure damage from flash floods, wind gusts > 33 m/s, and 2+ m wave-driven storm surge, resulting in loss of power, water and communication for many weeks. Southeasterly inflow to the TC (
Figure 7c) passed over SST > 29.5 °C, generating copious rainfall in Puerto Rico on 19 September 2022.
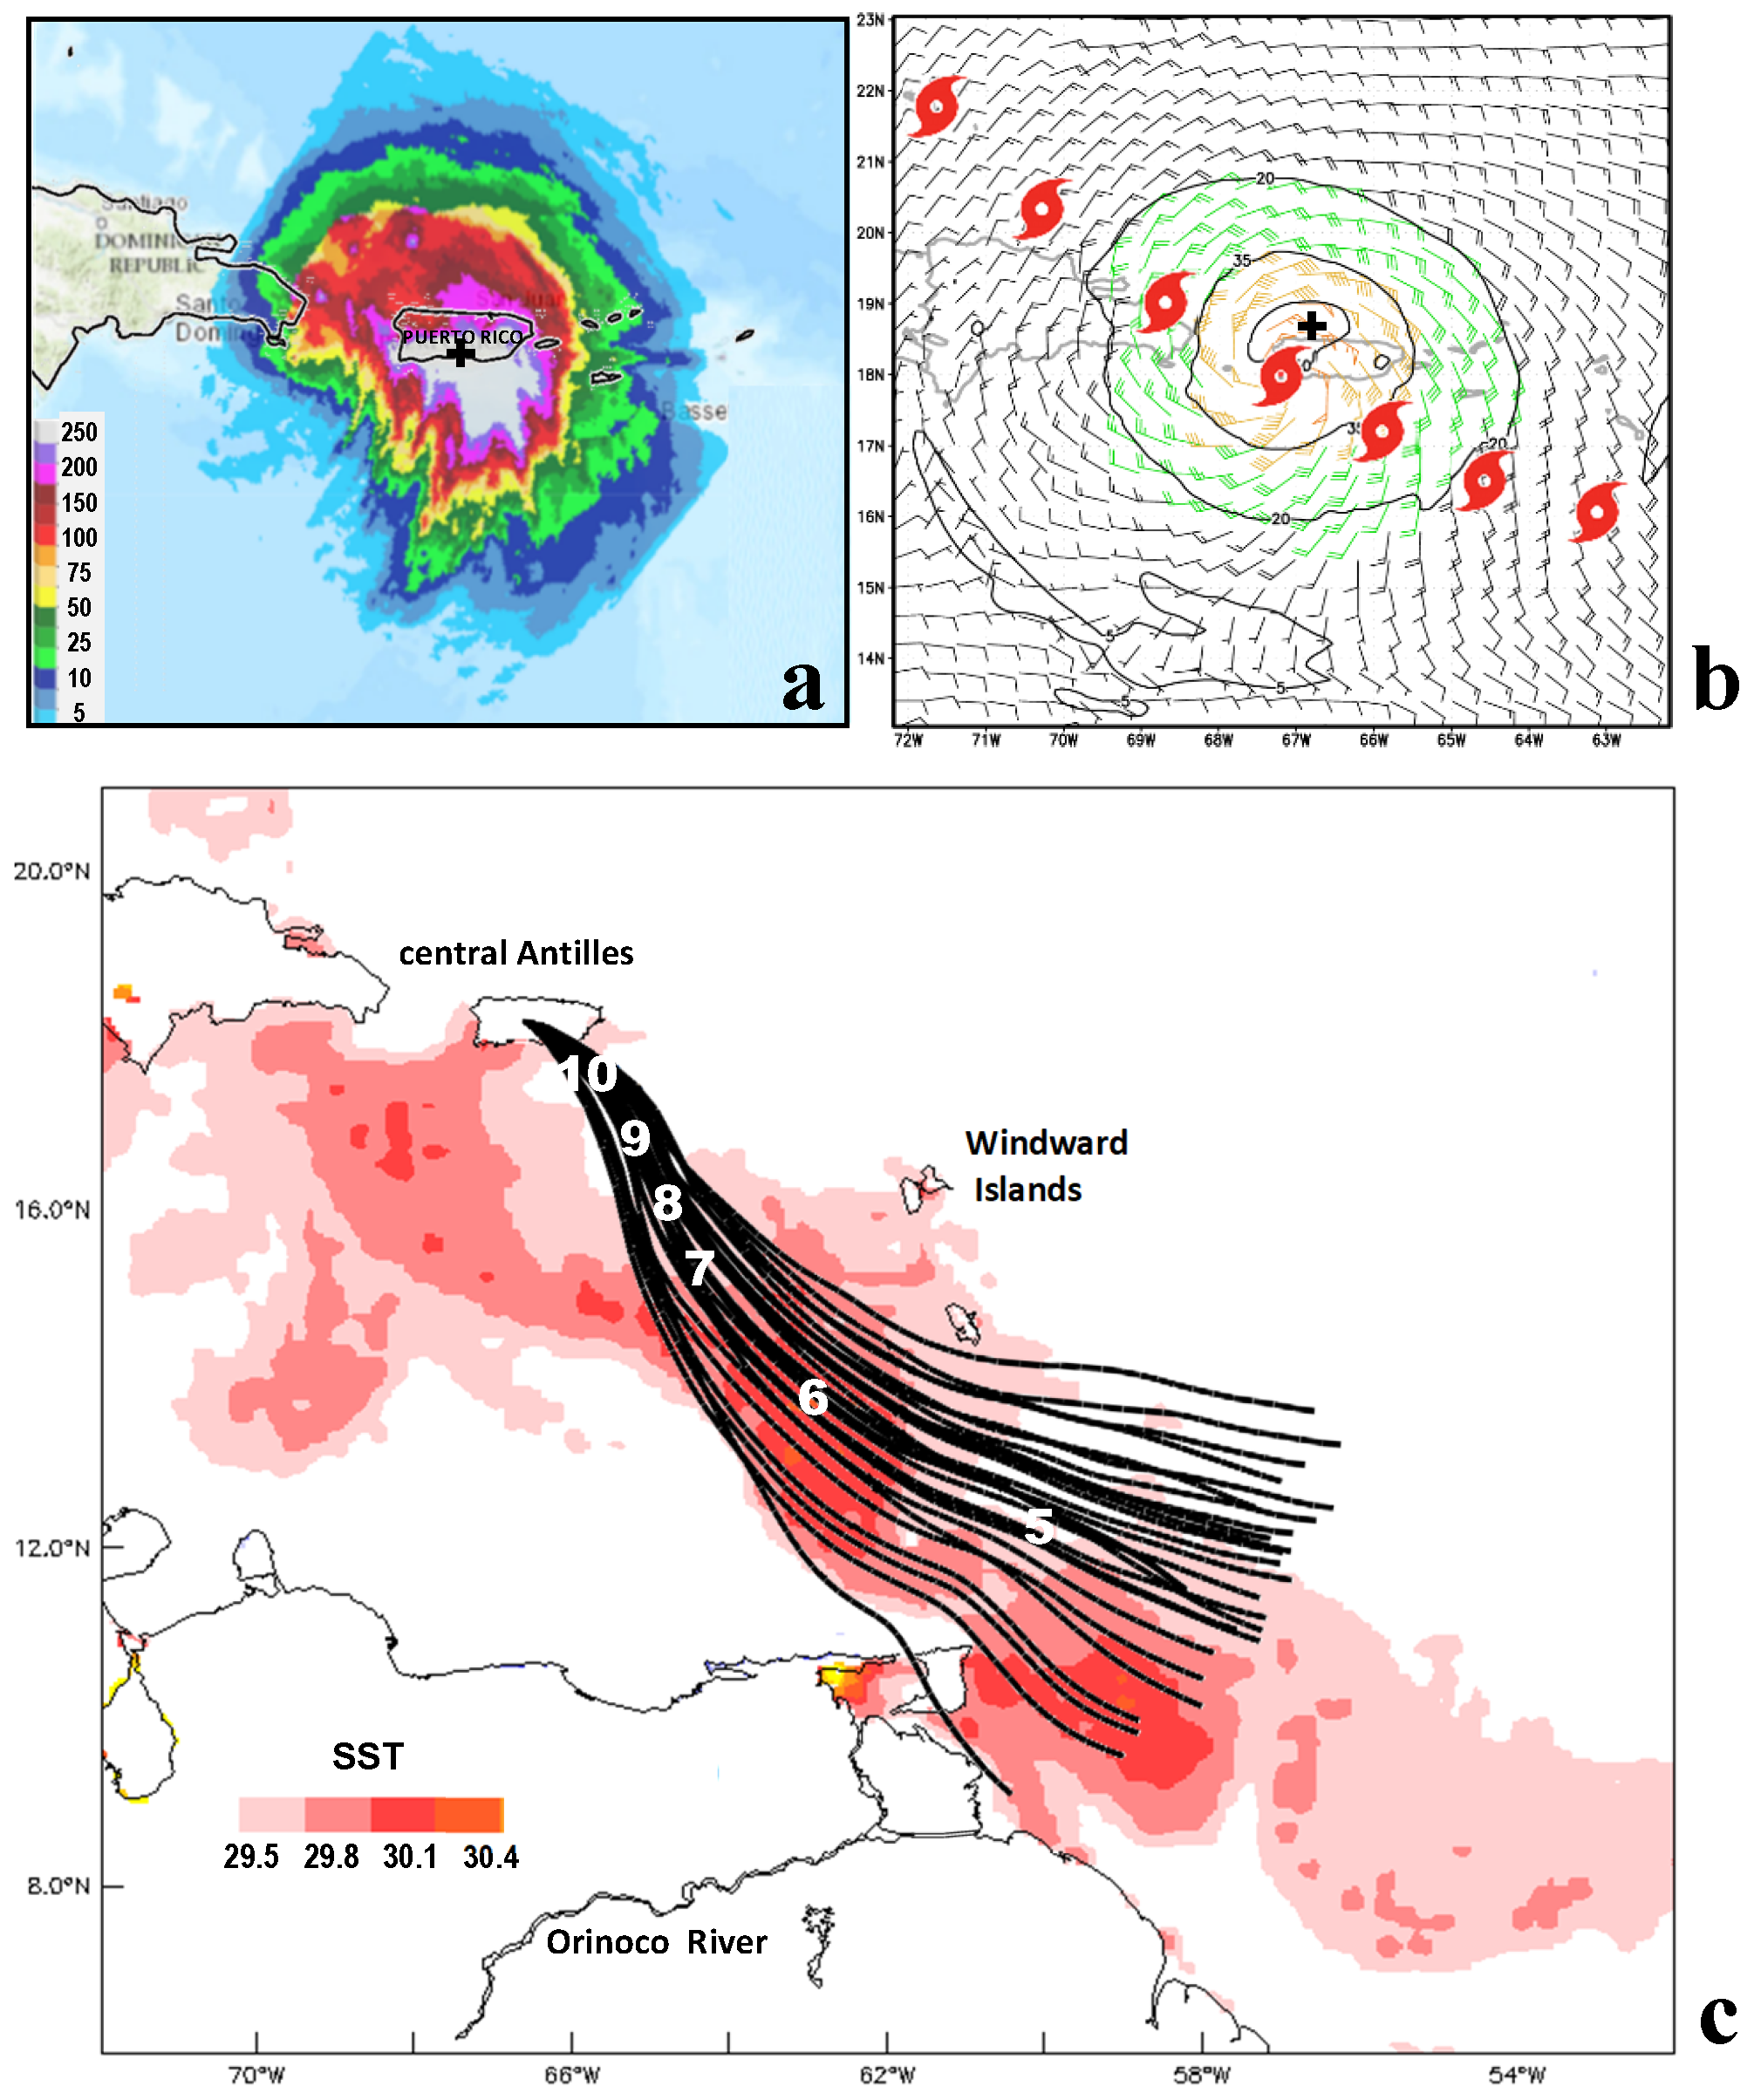
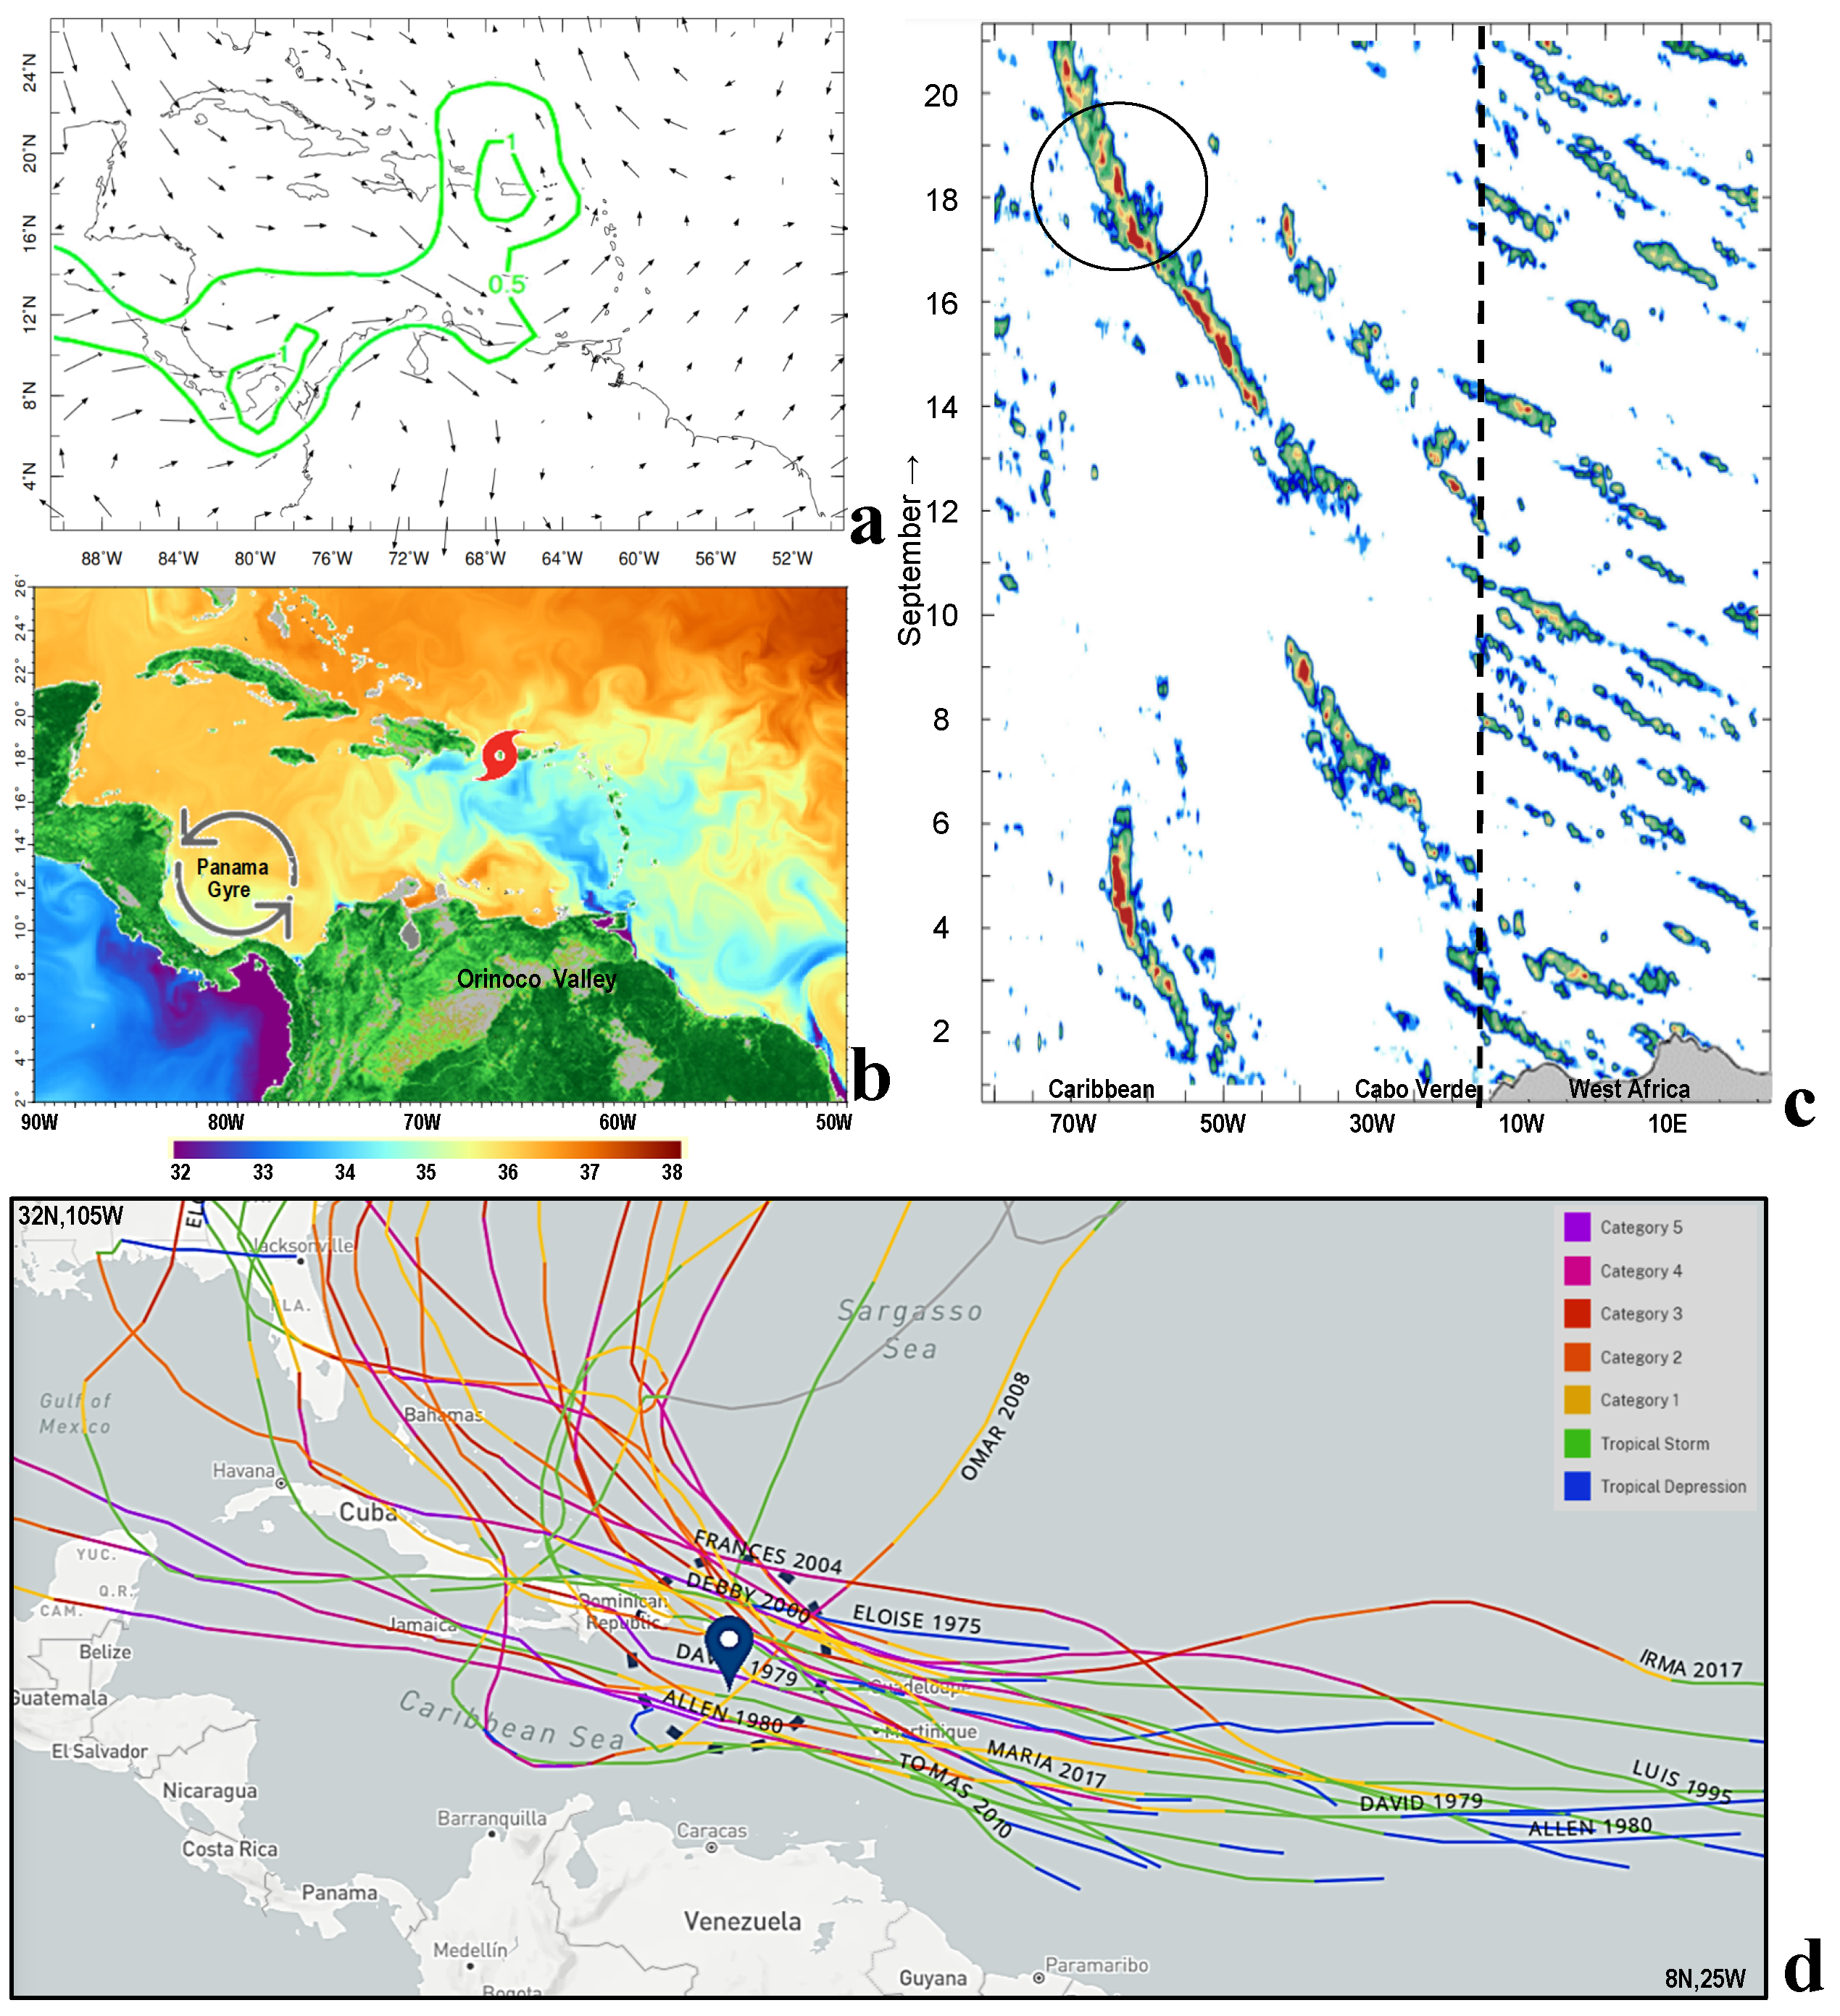
Figure 8a,b illustrate the environmental conditions preceding this destructive event. Near-surface westerly wind anomalies in the SW Caribbean brought higher humidity. The Orinoco River plume (salinity < 34.5 ppt) extended from Trinidad to the Dominican Republic, corresponding with SST > 29.5 °C. Satellite vegetation fraction exceeded 70% over the Orinoco Valley (
Figure 8b), feeding daytime transpiration to the southern flank of the storm. A hovmoller plot of rainfall 15–20°N 1–20 September 2022 (
Figure 8c) demonstrates that TC Fiona could not be traced to a particular African easterly wave. There were two distinct regimes: continental (African) wavelengths ~750 km moving ~15 m/s and marine (Atlantic) wavelengths ~2500 km moving ~7 m/s with Cabo Verde 20–30°W in the transition zone.
Context is provided by mapping past hurricanes in the Jul–Oct W•R index 1970–2021 (
Figure 8d). A total of 26 TCs heading ~290° at ~600 km/day pass the central Antilles. Six TCs can be traced to Cabo Verde; most undergo cyclogenesis near Barbados. Nine TCs make landfall over the western Antilles, while seven make landfall over Florida. Our W•R index thus reflects severe weather impacts well beyond the small area of 3 × 6° in the central Caribbean.
4. Conclusions
Quantifying local weather impacts requires a Eulerian viewpoint that should objectively reflect damage to infrastructure. A Lagrangian framework based on minimum pressure (named TCs) may not offer a first step on this scientific path. Similarly, an economic accounting system yields subjective values that deflate over time. Although TCs are the main culprit, measures of their intensity may not reflect the combined effects of wind and rain. Here, we have taken an unconventional approach, formulating a novel index for use in statistical analyses to understand precursor and simultaneous climate–weather–ocean interactions.
Daily values of wind and rainfall were reduced to seasonal values by applying a threshold (>50) to the summed standardized product (Σ W•R), so that an objective low-frequency analysis could be made in the period 1970–2021. The regression method employed all years—each having variable influence, whereas the composite method used the top-10 years with equal influence, offering different paths to a coherent outcome. New insights include the following: (i) the negative correlation between MEI and W•R indicates a growing role for 3 to 6-year Pacific oscillations, (ii) the West African monsoon has a diminished role in TC genesis via easterly waves, (iii) anomalous low-level inflow to the Caribbean comes from the Pacific along a path north of the Andes, (iv) there is a reduction in SW cloud bands reaching Mexico in the preceding Mar–Jun, (v) equatorial Pacific currents are westward and salinity is lower in the Gyre north of Panama, and (vi) (Orinoco) salinity underpins local SST forcing of TC (cf.
Figure 8b, cf. [
37]). The W•R index enables inferences on the changing roles of Pacific vs. Atlantic in Caribbean TC genesis.
The research has achieved the stated goals and answered scientific questions. Given the historical density of in situ weather monitoring across the Caribbean, there may be few uncertainties in the outcomes reported here. However, in application to poorly observed regions, it is recommended that W•R time series be confined to the satellite microwave era 1990+. Marine and coastal environments are well exposed, but terrestrial applications will need different thresholds for wind and could substitute streamflow measurements for rain.
The confirmatory results of Jul–Oct regression and composite analysis with respect to the above normal Caribbean W•R index include the following: (i) an active equatorial trough and warmer SST in the east Atlantic, (ii) upwelling relaxes off Colombia and Venezuela under westerly wind and current anomalies, (iii) upper level easterly airflow prevails across South America due to equatorial Walker Cell coupling with La Niña (cf.
Figure 4b and
Figure 5b) and retreat of the southern subtropical jet (cf.
Figure 2c and
Figure 3c), (iv) development of the east Pacific cold tongue favors Caribbean W•R, but Niño3 SST signals come too late for prediction.
Inter-annual composite anomalies reflected a weakening of Caribbean trade winds and currents and hence reduced the export of humidity and river plumes in July–October season. The Orinoco plume’s low salinity and coincident warm SST deepens atmospheric humidity (cf.
Figure 4b). At the weather time scale, 3–7-day oscillations from subtropical easterly waves and MJO-modulated surges over Panama correspond with high W•R index values.
Evaluating seasonal trends, the research found a rapid warming of local SST in Jul–Oct (~0.025 °C/yr) where salinity is lowest (34.6 ppt). The Jul–Oct W•R index has drifted upward since 1970, objectively indicating a greater risk of infrastructure damage. Mitigating actions to strengthen the electricity, communication and water supply networks can include the felling of overhanging trees in the low season (Jan–Jun) and better structural engineering to withstand TC impacts. Coastal waves and surge under sea level rise require construction ‘setback’ and the refurbishment of beaches and access paths to limit erosion. State funding of these efforts should be underpinned by value-based property taxes. Shortening disaster recovery times from months to weeks would help sustain domestic production in sensitive economic sectors.
Funding
This research received no external funding.
Data Availability Statement
A data analysis spreadsheet is available from the author.
Acknowledgments
Support from the South Africa Department of Higher Education and Training is appreciated. Most data analysis derives from websites: IRI Climate Library, KNMI Climate Explorer, University of Hawaii APDRC, and NOAA Ready ARL.
Conflicts of Interest
The authors declare no conflict of interest.
References
- Gu, D.; Philander, S. Secular changes of annual and interannual variability in the tropics during the past century. J. Clim. 1995, 8, 864–876. [Google Scholar] [CrossRef]
- Goldenberg, S.B.; Shapiro, L.J. Physical mechanisms for the association of El Niño and West African rainfall with Atlantic major hurricane activity. J. Clim. 1996, 9, 1169–1187. [Google Scholar] [CrossRef]
- Landsea, C.W. El Niño-Southern Oscillation and the seasonal predictability of tropical cyclones. In El Niño and the Southern Oscillation: Multiscale Variability and Global and Regional Impacts; Diaz, H.F., Markgraf, V., Eds.; Columbia University Press: New York, NY, USA, 2020; pp. 149–181. [Google Scholar]
- Jury, M.R.; Enfield, D.B. Environmental patterns associated with active and inactive Caribbean hurricane seasons. J. Clim. 2020, 23, 2146–2160. [Google Scholar] [CrossRef]
- Jury, M.R.; Santiago, M.J. Composite analysis of dust impacts on African easterly waves in the MODIS era. J. Geophys. Res. Atmos. 2010, 115, D16213. [Google Scholar] [CrossRef]
- Jones, J.J.; Bell, M.M.; Klotzbach, P.J. Tropical and subtropical North Atlantic vertical wind shear and seasonal tropical cyclone activity. J. Clim. 2020, 33, 5413–5426. [Google Scholar] [CrossRef]
- Chen, S.; Zhao, H.; Raga, G.B.; Klotzbach, P.J. Modulation of North Pacific and North Atlantic Tropical Cyclones by tropical transbasin variability and ENSO during May–October. J. Clim. 2021, 34, 2127–2144. [Google Scholar] [CrossRef]
- Jury, M.R.; Nieves-Jiménez, A.T. Tropical Atlantic dust and the zonal circulation. Theor. Appl. Climatol. 2021, 143, 901–913. [Google Scholar] [CrossRef]
- Gray, W.M.; Sheaffer, J.D.; Landsea, C.W. 1997: Climate trends associated with multi-decadal variability of intense Atlantic hurricane activity. In Hurricanes, Climatic Change and Socioeconomic Impacts: A Current Perspective; Diaz, H.F., Pulwarty, R.S., Eds.; Springer: New York, NY, USA, 1997; pp. 15–53. [Google Scholar]
- Knaff, J.A. Implications of summertime sea level pressure anomalies in the tropical Atlantic region. Mon. Wea. Rev. 1997, 10, 789–804. [Google Scholar] [CrossRef]
- Klotzbach, P.J. The influence of El Niño–Southern Oscillation and the Atlantic Multidecadal Oscillation on Caribbean tropical cyclone activity. J. Clim. 2011, 24, 721–731. [Google Scholar] [CrossRef]
- Landsea, C.W.; Gray, W.M. The strong association between western Sahel monsoon rainfall and intense Atlantic hurricanes. J. Clim. 1992, 5, 435–453. [Google Scholar] [CrossRef]
- Ffield, A. Amazon and Orinoco River Plumes and NBC rings: Bystanders or participants in hurricane events? J. Clim. 2007, 20, 316–333. [Google Scholar] [CrossRef]
- Klotzbach, P.J.; Oliver, E.C.J. Modulation of Atlantic basin tropical cyclone activity by the Madden–Julian Oscillation (MJO) from 1905 to 2011. J. Clim. 2015, 28, 204–217. [Google Scholar] [CrossRef]
- Jury, M.R. MJO influence in the Caribbean. Theor. Appl. Climatol. 2019, 138, 1–9. [Google Scholar] [CrossRef]
- Hersbach, H.; Bell, B.; Berrisford, P.; Hirahara, S.; Horányi, A.; Muñoz-Sabater, J.; Nicolas, J.; Peubey, C.; Radu, R.; Schepers, D.; et al. The ERA5 global reanalysis. Qtr. J. Roy Meteo. Soc. 2019, 146, 1999–2049. [Google Scholar] [CrossRef]
- Rayner, N.A.; Parker, D.E.; Horton, E.B.; Folland, C.K.; Alexander, L.V.; Rowell, D.P.; Kent, E.C.; Kaplan, A. Global analyses of sea surface temperature, sea ice, and night marine air temperature since the late nineteenth century. J. Geophys. Res. 2003, 108, 4407. [Google Scholar] [CrossRef]
- Lee, H.-T. Climate Algorithm Theoretical Basis Document: Outgoing Longwave Radiation (OLR); NOAA CDR Program, CDRP-ATBD-0526; National Oceanic and Atmospheric Administration: Washington, DC, USA, 2014; 46p. [Google Scholar]
- Wolter, K.; Timlin, M.S. El Niño/Southern Oscillation behaviour since 1871 as diagnosed in an extended multivariate ENSO index. Inter. J. Climatol. 2011, 31, 1074–1087. [Google Scholar] [CrossRef]
- Zhang, T.; Hoell, A.; Perlwitz, J.; Eischeid, J.; Murray, D.; Hoerling, M.; Hamill, T. Towards probabilistic multivariate ENSO monitoring. Geophys. Res. Lett. 2019, 46, 10532–10540. [Google Scholar] [CrossRef]
- Harrigan, S.; Zsoter, E.; Alfieri, L.; Prudhomme, C.; Salamon, P.; Wetterhall, F.; Barnard, C.; Cloke, H.; Pappenberger, F. GloFAS-ERA5 operational global river discharge reanalysis 1979–present. Earth Syst. Sci. Data 2020, 12, 2043–2060. [Google Scholar] [CrossRef]
- Maes, C.; Picaut, J.; Belamari, S. 2005: Importance of the salinity barrier layer for the buildup of El Nino. J. Clim. 2005, 18, 104–118. [Google Scholar] [CrossRef]
- Melnichenko, O.; Hacker, P.; Maximenko, N.; Lagerloef, G.; Potemra, J. Optimal interpolation of Aquarius sea surface salinity. J. Geophys. Res. Ocean. 2016, 121, 602–616. [Google Scholar] [CrossRef]
- Carton, J.A.; Chepurin, G.A.; Chen, L. SODA-3 a new ocean climate reanalysis. J. Climate. 2018, 31, 6967–6983. [Google Scholar] [CrossRef]
- Knaff, J.A.; DeMaria, M. A multi-platform satellite tropical cyclone wind analysis system. In Proceedings of the AMS 14th Conference on Satellite Meteorology and Oceanography, Atlanta, GA, USA, 29 January 2006. [Google Scholar]
- Stein, A.F.; Draxler, R.R.; Rolph, G.D.; Stunder, B.J.B.; Cohen, M.D.; Ngan, F. NOAA HYSPLIT atmospheric transport and dispersion modelling system. Bull. Amer. Meteo. Soc. 2015, 96, 2059–2077. [Google Scholar] [CrossRef]
- Reynolds, R.W.; Smith, T.M.; Liu, C.; Chelton, D.B.; Casey, K.S.; Schlax, M.G. Daily high-resolution blended analyses for sea surface temperature. J. Climate. 2007, 20, 5473–5496. [Google Scholar] [CrossRef]
- Chassignet, E.P.; Hurlburt, H.E.; Metzger, E.J.; Smedstad, O.M.; Cummings, J.A.; Halliwell, G.R.; Bleck, R.; Baraille, R.; Wallcraft, A.J.; Lozano, C.; et al. US GODAE: Global ocean prediction with the Hybrid coordinate ocean model (HYCOM). Oceanography 2009, 22, 64–75. [Google Scholar] [CrossRef]
- Broxton, P.D.; Zeng, X.; Scheftic, W.; Troch, P.A. A MODIS-based global 1-km maximum green vegetation fraction dataset. J. Appl. Meteo. Climatol. 2014, 53, 1996–2004. [Google Scholar] [CrossRef]
- Doyle, J.D.; Hodur, R.M.; Chen, S.; Jin, Y.; Moskaitis, J.R.; Wang, S.; Hendricks, E.A.; Jin, H.; Smith, T.A. Tropical cyclone prediction using COAMPS-TC. Oceanography 2014, 27, 104–115. [Google Scholar] [CrossRef]
- Joyce, R.J.; Janowiak, J.E.; Arkin, P.A.; Xie, P. CMORPH A method that produces global precipitation estimates from passive microwave and infrared data at high spatial and temporal resolution. J. Hydromet. 2004, 5, 487–503. [Google Scholar] [CrossRef]
- White, W.B. Tropical coupled Rossby waves in the Pacific ocean–atmosphere system. J. Phys. Oceanogr. 2000, 30, 1245–1264. [Google Scholar] [CrossRef]
- Gray, W.M. Strong association between West African Rainfall and U.S. landfall of intense hurricanes. Science 1990, 249, 1251–1256. [Google Scholar] [CrossRef]
- Fournier, S.; Vandemark, D.; Gautier, L.; Lee, T.; Jonsson, B.; Gierach, M.M. Interannual variation in offshore advection of Amazon-Orinoco plume waters: Observations, forcing mechanisms, and impacts. J. Geophys. Res. Oceans 2017, 122, 8966–8982. [Google Scholar] [CrossRef]
- Jury, M.R.; Rodriguez, E. Caribbean hurricanes: Interannual variability and prediction. Theor. Appl. Climatol. 2011, 106, 105–115. [Google Scholar] [CrossRef]
- Lyu, M.; Jiang, X.; Wu, Z.; Kim, D.; Adames, A.F. Zonal-scale of the Madden-Julian Oscillation and its propagation speed on the interannual time-scale. Geophys. Res. Lett. 2021, 48, e2020GL091239. [Google Scholar] [CrossRef]
- Vizy, E.K.; Cook, K.H. Influence of the Amazon/Orinoco Plume on the summertime Atlantic climate. J. Geophys. Res. 2010, 115, D21112. [Google Scholar] [CrossRef]
Figure 1.
Temporal analysis of Caribbean W•R index: (a) mean annual cycle of upper quintile with index area inset, (b,c) scatterplots of 3–7-day and 36–48-day band-filtered time series vs. daily W•R index in the Jul–Oct season N = 257, (d,e) W•R time series filtered to remove cycles <18 months, and its wavelet spectral energy shaded >95% confidence within the cone of validity.
Figure 2.
Simultaneous regression of July–October regional fields onto July–October Caribbean W•R index: (a) SST, (b) netOLR, and (c) 200 hPa zonal wind. All maps use the color bar below with values top–down in units of °C, W/m2, m/s per unit of W•R. Key features are labeled. Regression values below 95% confidence are unshaded.
Figure 3.
Preceding season regression of March–June regional fields onto July–October Caribbean W•R index: (
a) SST, (
b) netOLR, (
c) 200 hPa zonal wind. All maps use the color bar below with values top–down in units of °C, W/m
2, m/s per unit of W•R. Key features are labeled. Regression values below 95% confidence are unshaded, as in
Figure 2.
Figure 4.
Composite top-10
anomalies in Jul–Oct: (
a) near-surface wind vectors and net OLR (blue contour), (
b) height section on 0–5°N of zonal circulation vectors and humidity > 1 g/kg (green contour) with topographic profile, (
c) near-surface salinity and ocean currents with major rivers (grayscale inset), (
d) downward latent + sensible heat flux with SST > 0.2 °C (red contour); based on years listed in
Table 1. Vertical motions in (
b) are exaggerated 30-fold.
Figure 5.
Composite top-10
anomalies in precursor Mar–Jun: (
a) near-surface wind vectors and net OLR (blue contour), (
b) height section on 0–5°N of zonal circulation vectors and humidity > 1 g/kg (green contour) with topographic profile, (
c) near-surface salinity and ocean currents with major rivers; (
d) downward latent + sensible heat flux with SST > 0.2 °C (red contour); based on years listed in
Table 1, as in
Figure 4 but preceding season.
Figure 6.
Composite Jul–Oct
anomalies on a height section 80°W (dashed in c) of: (
a) zonal winds (m/s) with index box, and (
b) meridional circulation (vectors) green humidity contours >1.5 g/kg and topographic profile, based on years in
Table 1. (
c) Regression of 850 U-wind onto Jul–Oct fields of SLP (daily shaded, seasonal contour, hPa). (
d) Lag regression of 36–48-day band-filtered 850 hPa zonal wind time series and Jul–Oct Caribbean W•R, (
e) same but regressions per month at 5-day lag; green lines show inter-annual dispersion. Linear regression slope per month of: (
f) Caribbean SST (C/yr), and (
g) Caribbean W•R index 1970–2021 (fraction); dashed lines enclose Jul–Oct season.
Figure 7.
TC Fiona case study: (a) radar rainfall on 19 September 2022 (mm/day), (b) CIRA wind map 00UTC 19 September 2022 and 12 hourly track icons, (c) ensemble back-trajectory arriving at 18.2°N, 66.5°W, 500 m, 17–19 September 2022, white numbers on airflow = evaporation (mm/day), underlying SST > 29.5 °C red shaded. Location of maximum denoted by + in (a,b).
Figure 8.
Regional conditions in mid-September 2022: (a) 925 hPa wind anomalies (largest 5 m/s) and specific humidity (green contour > 0.5 g/kg), and (b) near-surface salinity (ppt) and vegetation > 70% green shaded, with TC icon and places. (c) Hovmoller plot of satellite maximum rainfall (shaded 2–20 mm/h) tracking easterly waves 15–20°N, TC Fiona circled, African coast dashed. (d) Jul–Oct 1970–2021 hurricane tracks passing through the index area, total of 26 > category 1.
Table 1.
July–October years with the highest Caribbean W•R index forming the composite analysis. W•R = seasonal sum of (daily maximum wind • standardized daily maximum rain) > 50 in the area 16–19°N, 63–69°W.
Table 1.
July–October years with the highest Caribbean W•R index forming the composite analysis. W•R = seasonal sum of (daily maximum wind • standardized daily maximum rain) > 50 in the area 16–19°N, 63–69°W.
| Jul–Oct | W•R |
|---|
| 2017 | 3098 |
| 1979 | 2013 |
| 2008 | 1891 |
| 1996 | 1795 |
| 1989 | 1675 |
| 1995 | 1490 |
| 1998 | 1378 |
| 2010 | 1036 |
| 2004 | 965 |
| 2011 | 900 |
Table 2.
Simultaneous cross-correlation of local climate variables with the Caribbean Jul–Oct W•R index, 1970–2021. Bold values are significant >95% confidence. Variables in top–down order are 850 hPa specific humidity, 500 hPa specific humidity, sea surface temp, evaporation, sensible heat flux, near-surface salinity, Orinoco discharge.
| Variable W•R |
|---|
| 850 q | 0.30 |
| 500 q | 0.32 |
| SST | 0.24 |
| Evap | −0.12 |
| SHF | 0.05 |
| Salt | −0.20 |
| Orin | 0.11 |
Table 3.
Mean annual cycle of Orinoco River discharge (m3/day), Caribbean salinity (‰) and Caribbean SST (°C). Bold values highlight seasonal features. Pairwise cross-correlations between Orinoco discharge and Caribbean SST exceed 0.70 at 2 month lag.
Table 3.
Mean annual cycle of Orinoco River discharge (m3/day), Caribbean salinity (‰) and Caribbean SST (°C). Bold values highlight seasonal features. Pairwise cross-correlations between Orinoco discharge and Caribbean SST exceed 0.70 at 2 month lag.
| | Orinoco | Salt | SST |
|---|
| J | 0.22 | 35.3 | 27.1 |
| F | 0.15 | 35.6 | 26.7 |
| M | 0.12 | 35.8 | 26.7 |
| A | 0.17 | 35.8 | 27.2 |
| M | 0.39 | 35.7 | 27.9 |
| J | 0.66 | 35.5 | 28.4 |
| J | 0.80 | 35.2 | 28.6 |
| A | 0.73 | 34.9 | 29.0 |
| S | 0.53 | 34.8 | 29.3 |
| O | 0.39 | 34.6 | 29.3 |
| N | 0.34 | 34.6 | 28.8 |
| D | 0.30 | 34.9 | 27.9 |
Table 4.
Pairwise lag correlation of detrended climate indices with Jul–Oct W•R index. Bold values significant > 95% confidence. MEI = multivariate ENSO index, SOI = Southern Oscillation Index, Nino3 = SST in the equatorial east Pacific, U-wind = 850 hPa zonal wind 80°W, 7–15°N, AMO = Atlantic Multidecadal Oscillation, NAO = North Atlantic Oscillation. Negative months refer to variable leading the Caribbean W•R index.
| Months | MEI | SOI | Nino3 | U-Wind | AMO | NAO |
|---|
| −6 | −0.15 | 0.13 | 0.00 | 0.08 | 0.17 | −0.13 |
| −5 | −0.16 | 0.19 | −0.02 | 0.16 | 0.20 | −0.21 |
| −4 | −0.22 | 0.23 | −0.07 | 0.17 | 0.28 | −0.28 |
| −3 | −0.29 | 0.31 | −0.10 | 0.26 | 0.33 | −0.19 |
| −2 | −0.37 | 0.34 | −0.13 | 0.30 | 0.30 | −0.11 |
| −1 | −0.43 | 0.36 | −0.17 | 0.28 | 0.27 | 0.04 |
| 0 | −0.44 | 0.39 | −0.21 | 0.27 | 0.22 | 0.15 |
| 1 | −0.42 | 0.35 | −0.25 | 0.24 | 0.26 | −0.03 |
| 2 | −0.40 | 0.33 | −0.28 | 0.16 | 0.31 | −0.02 |
| 3 | −0.39 | 0.35 | −0.30 | 0.23 | 0.35 | −0.04 |
| 4 | −0.38 | 0.27 | −0.31 | 0.16 | 0.33 | −0.02 |
| 5 | −0.36 | 0.27 | −0.32 | 0.05 | 0.27 | −0.04 |
| 6 | −0.36 | 0.28 | −0.30 | 0.00 | 0.24 | 0.06 |
Table 5.
Simultaneous (overlapping) 5-year running correlations of the MEI with Jul–Oct W•R index (N = 60); years represent the mid-point; bold values significant > 98% confidence.
Table 5.
Simultaneous (overlapping) 5-year running correlations of the MEI with Jul–Oct W•R index (N = 60); years represent the mid-point; bold values significant > 98% confidence.
| Year | r-Value | Year | r-Value |
|---|
| 1979 | −0.30 | 1999 | −0.44 |
| 1980 | −0.33 | 2000 | −0.44 |
| 1981 | −0.38 | 2001 | −0.02 |
| 1982 | −0.32 | 2002 | −0.41 |
| 1983 | −0.28 | 2003 | −0.45 |
| 1984 | −0.23 | 2004 | −0.52 |
| 1985 | −0.35 | 2005 | −0.48 |
| 1986 | −0.28 | 2006 | −0.49 |
| 1987 | −0.33 | 2007 | −0.69 |
| 1988 | −0.36 | 2008 | −0.62 |
| 1989 | −0.52 | 2009 | −0.56 |
| 1990 | −0.42 | 2010 | −0.68 |
| 1991 | −0.27 | 2011 | −0.67 |
| 1992 | −0.56 | 2012 | −0.41 |
| 1993 | −0.49 | 2013 | −0.47 |
| 1994 | −0.42 | 2014 | −0.50 |
| 1995 | −0.52 | 2015 | −0.43 |
| 1996 | −0.49 | 2016 | −0.46 |
| 1997 | −0.43 | 2017 | −0.58 |
| 1998 | −0.44 | 2018 | −0.51 |
| Disclaimer/Publisher’s Note: The statements, opinions and data contained in all publications are solely those of the individual author(s) and contributor(s) and not of MDPI and/or the editor(s). MDPI and/or the editor(s) disclaim responsibility for any injury to people or property resulting from any ideas, methods, instructions or products referred to in the content. |
© 2023 by the author. Licensee MDPI, Basel, Switzerland. This article is an open access article distributed under the terms and conditions of the Creative Commons Attribution (CC BY) license (https://creativecommons.org/licenses/by/4.0/).


