The Movement of GPS Positioning Discrepancy Clouds at a Mid-Latitude Region in March 2015
Abstract
1. Introduction
2. Data and Methodology
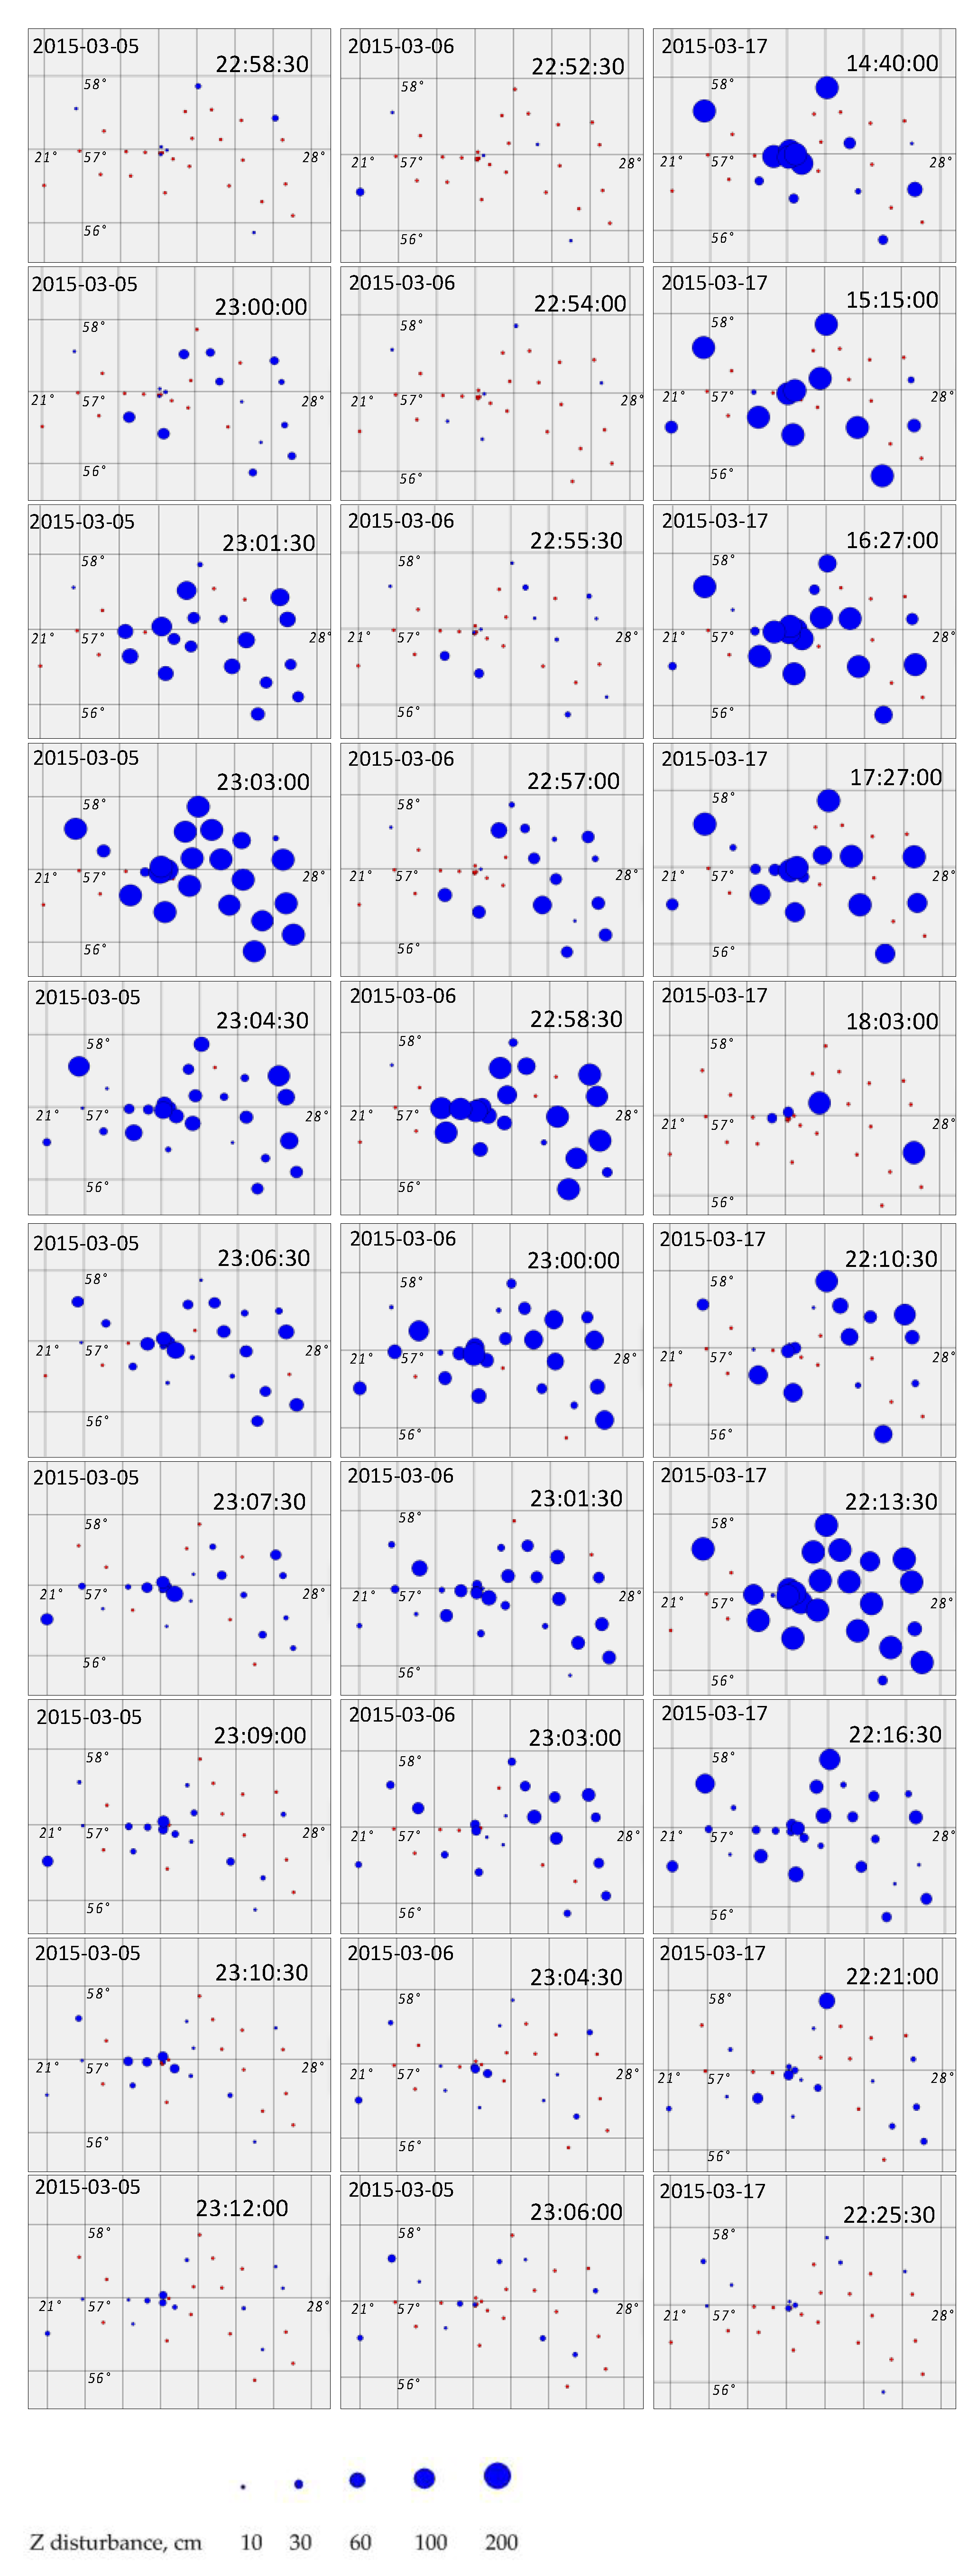
- For selected batches , the discrepancy scatter plots for Table S5’s sample subsets with a discrepancy size proportional to the logarithm of the Up component discrepancies were designed in order to validate the discrepancies’ distribution in adjacent 90 s (1.5 min) time events (Figure 3).
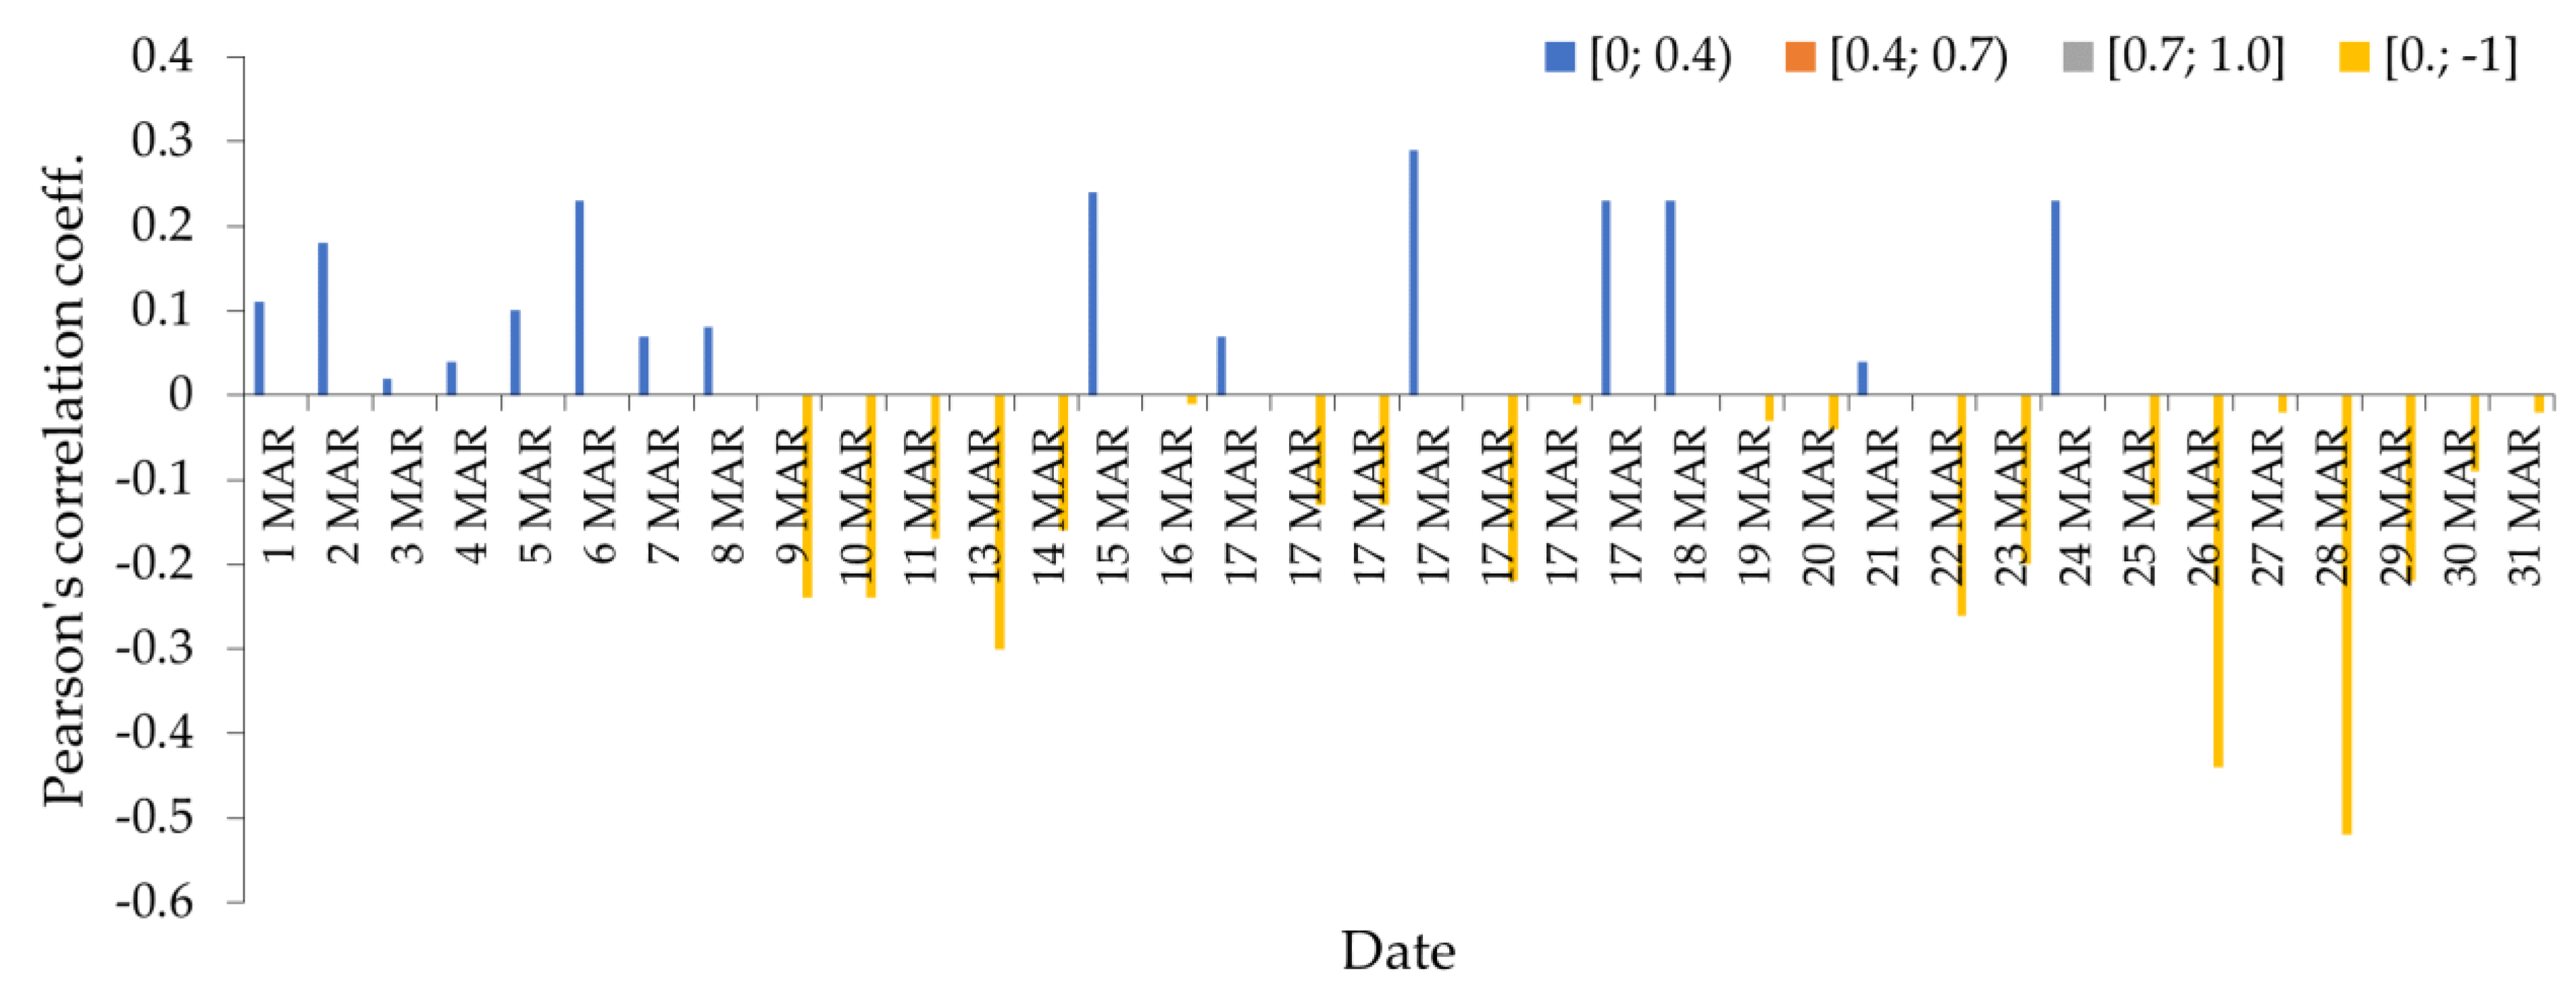
- For peak subsets , Pearson’s correlation coefficient was computed to find the relationship between discrepancies (subset ) and the ROTI (subset ) by using , instead of , in Equation (10) [34].
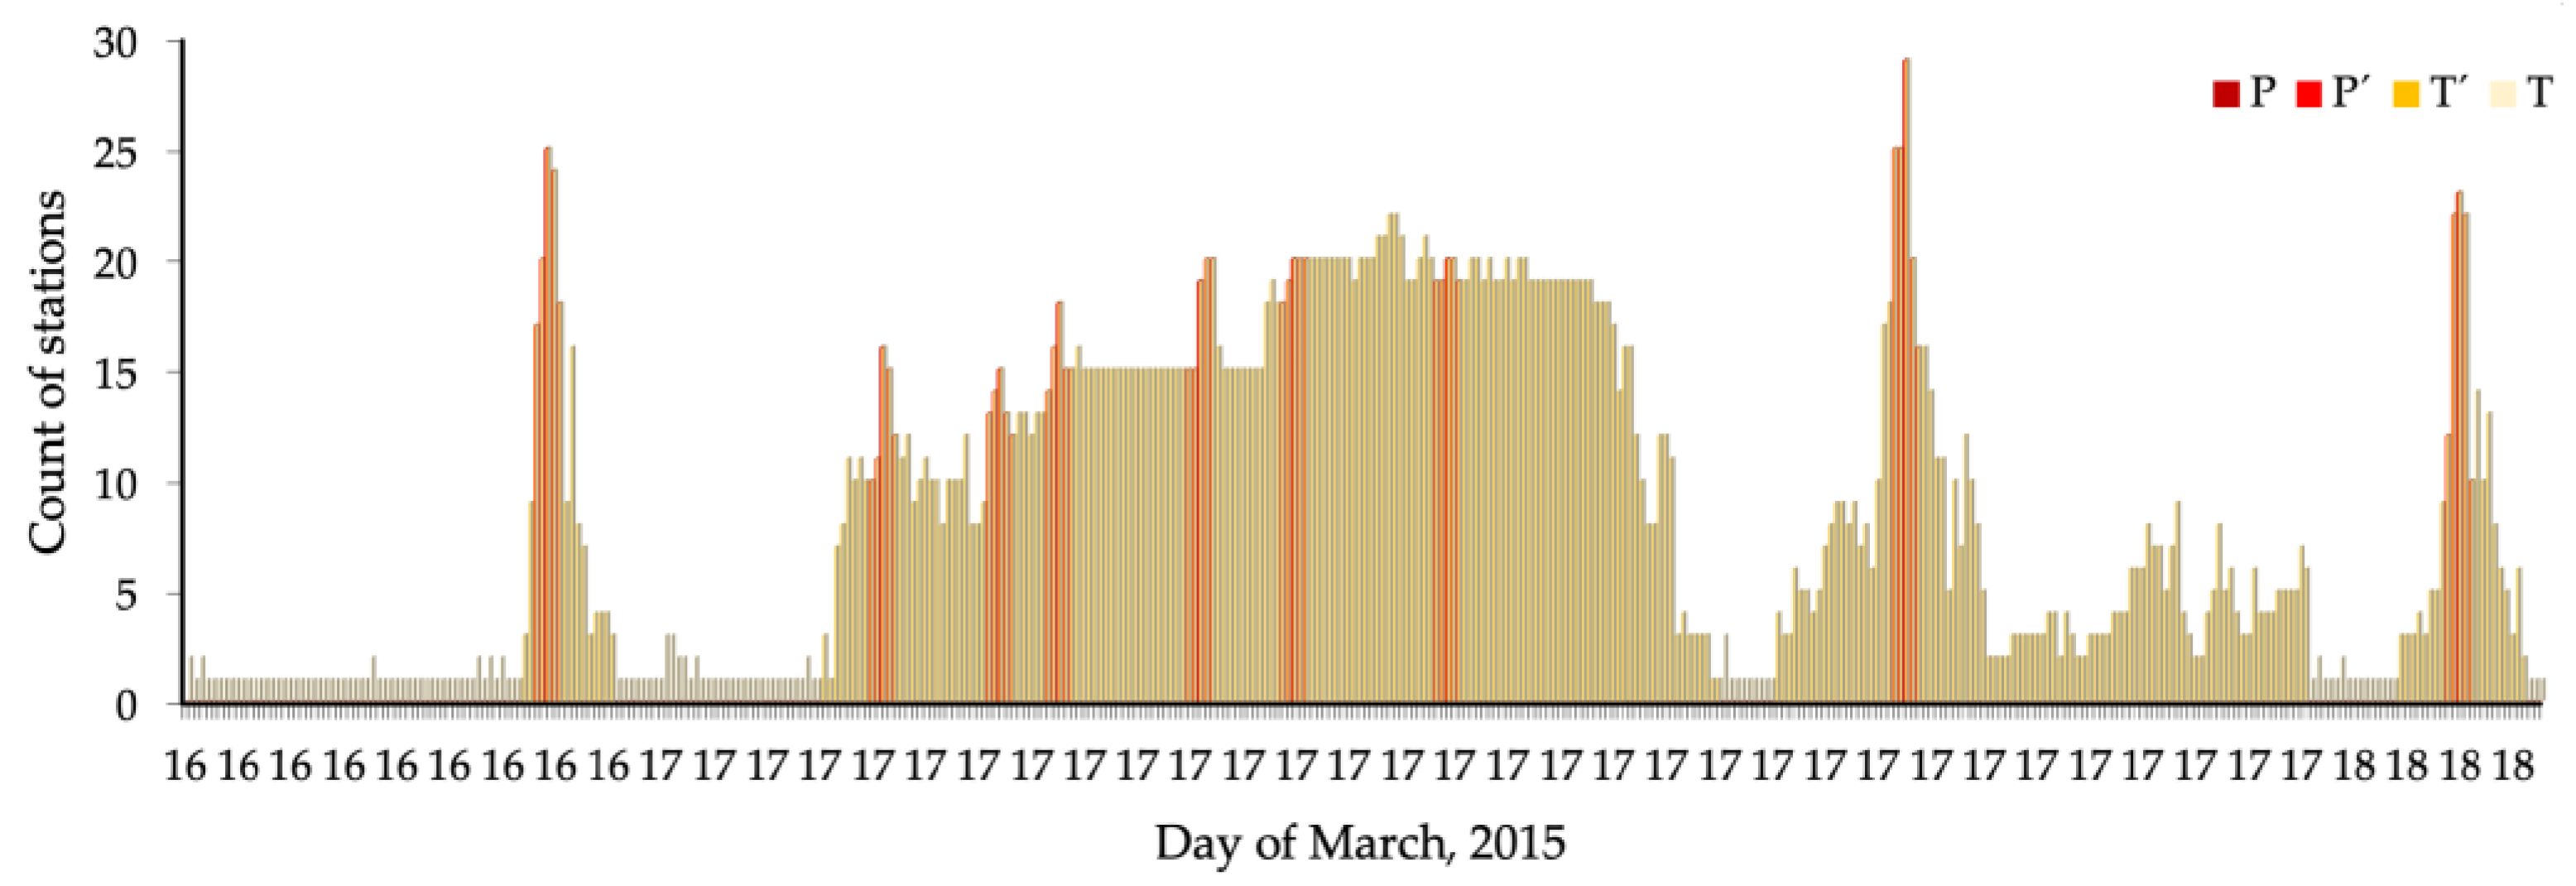
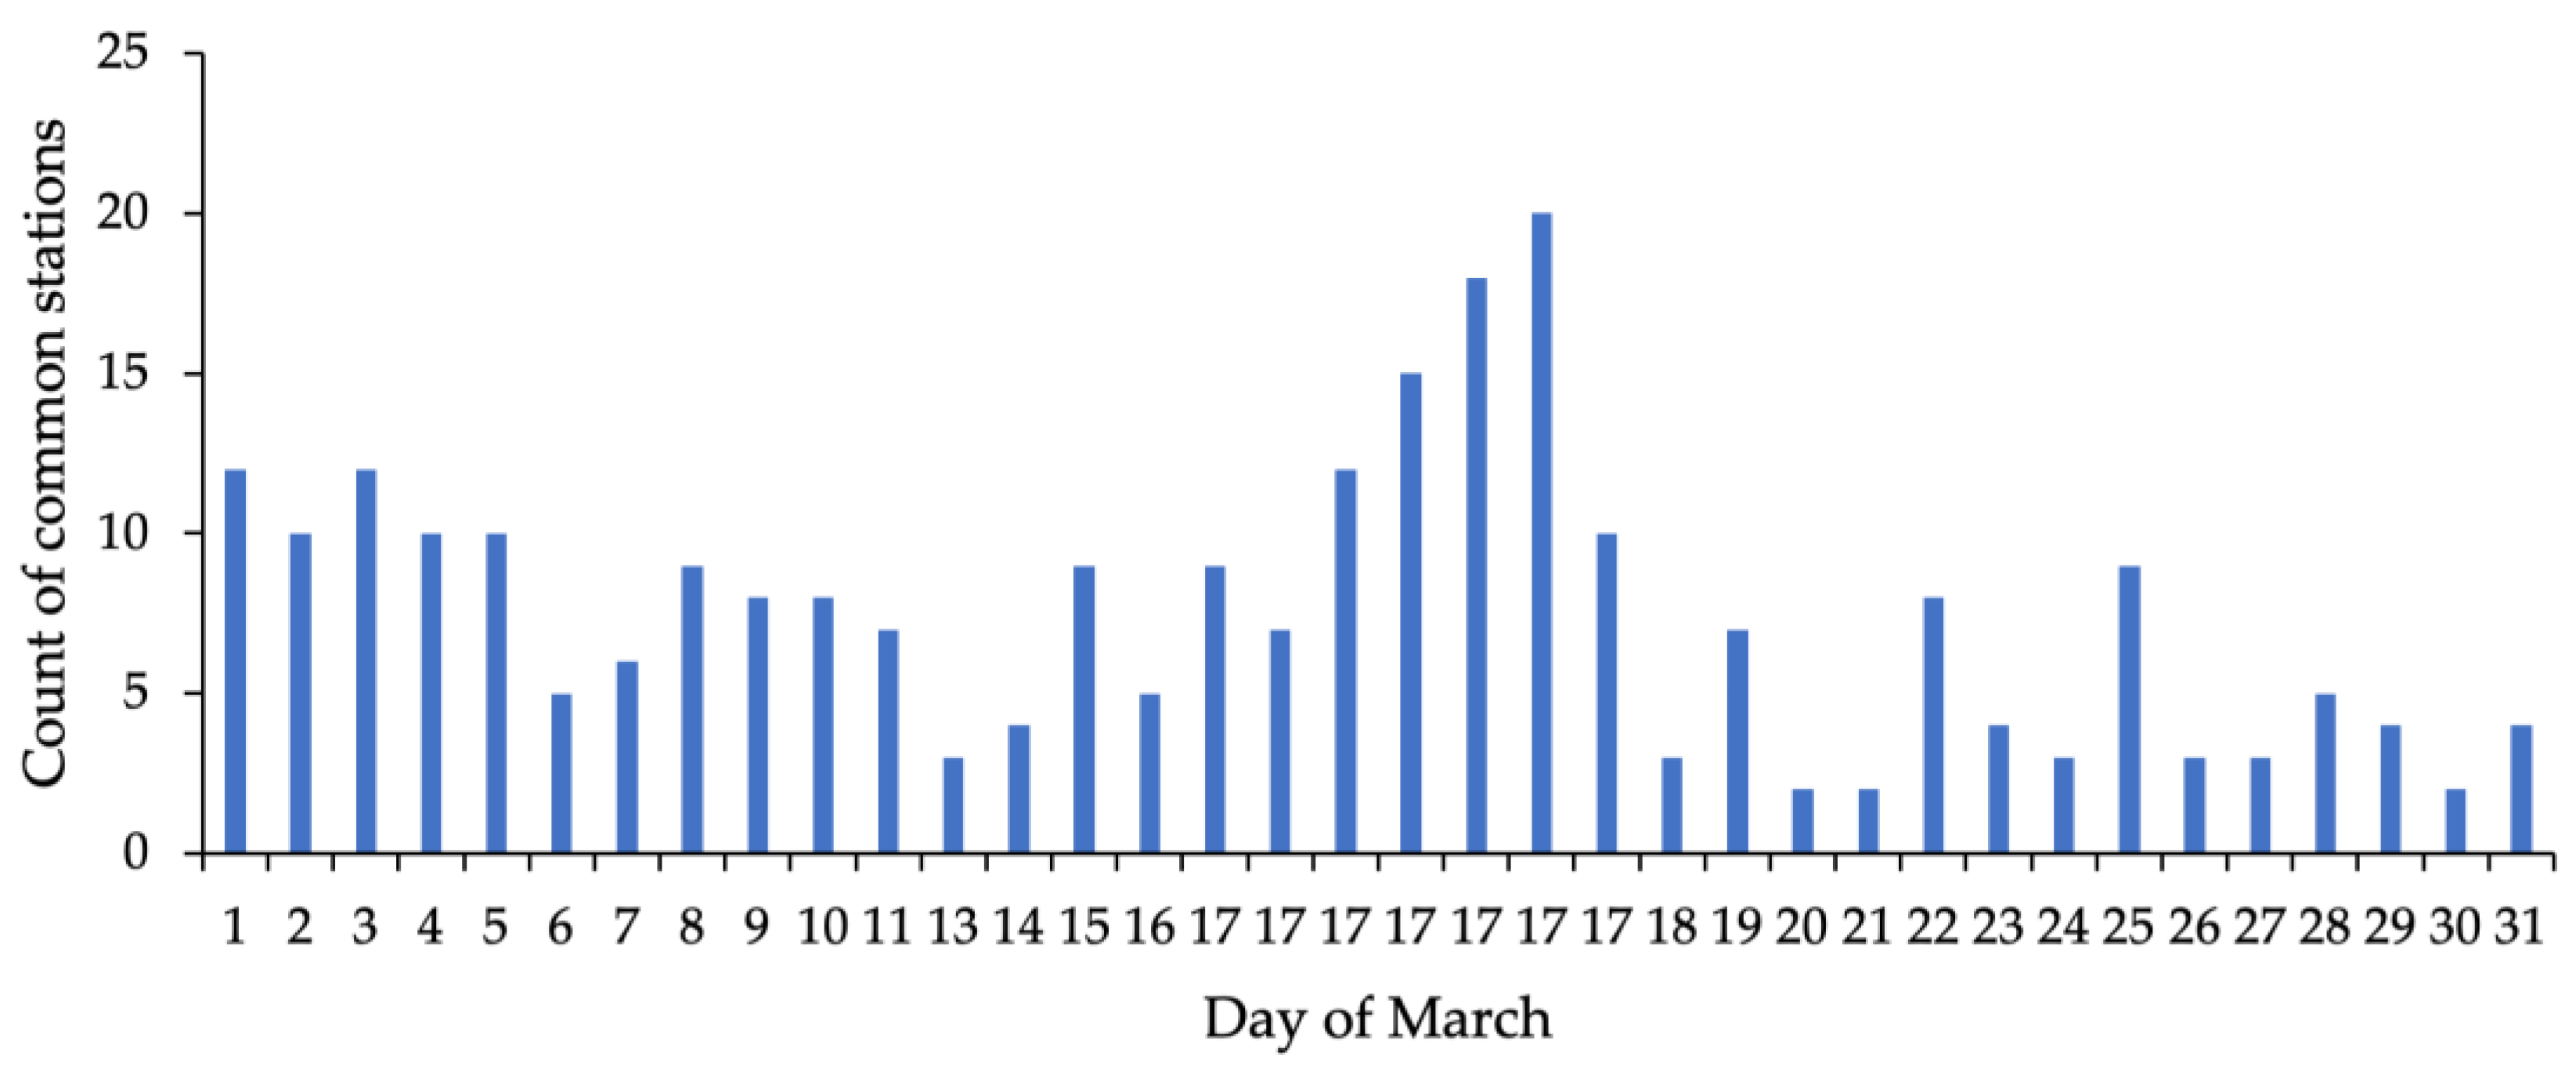
- For peak subsets of , the intersection of the peak on 1 March (subset ) with 35 other peaks was performed in order to find the commonly impacted stations. The intersection is described by Formula (11). The intersection result is shown in Table S8.
- From batch subsets , Pearson’s coefficients were computed (Equation (10)) for the relationship between and for subsets of all stations from Formula (11).
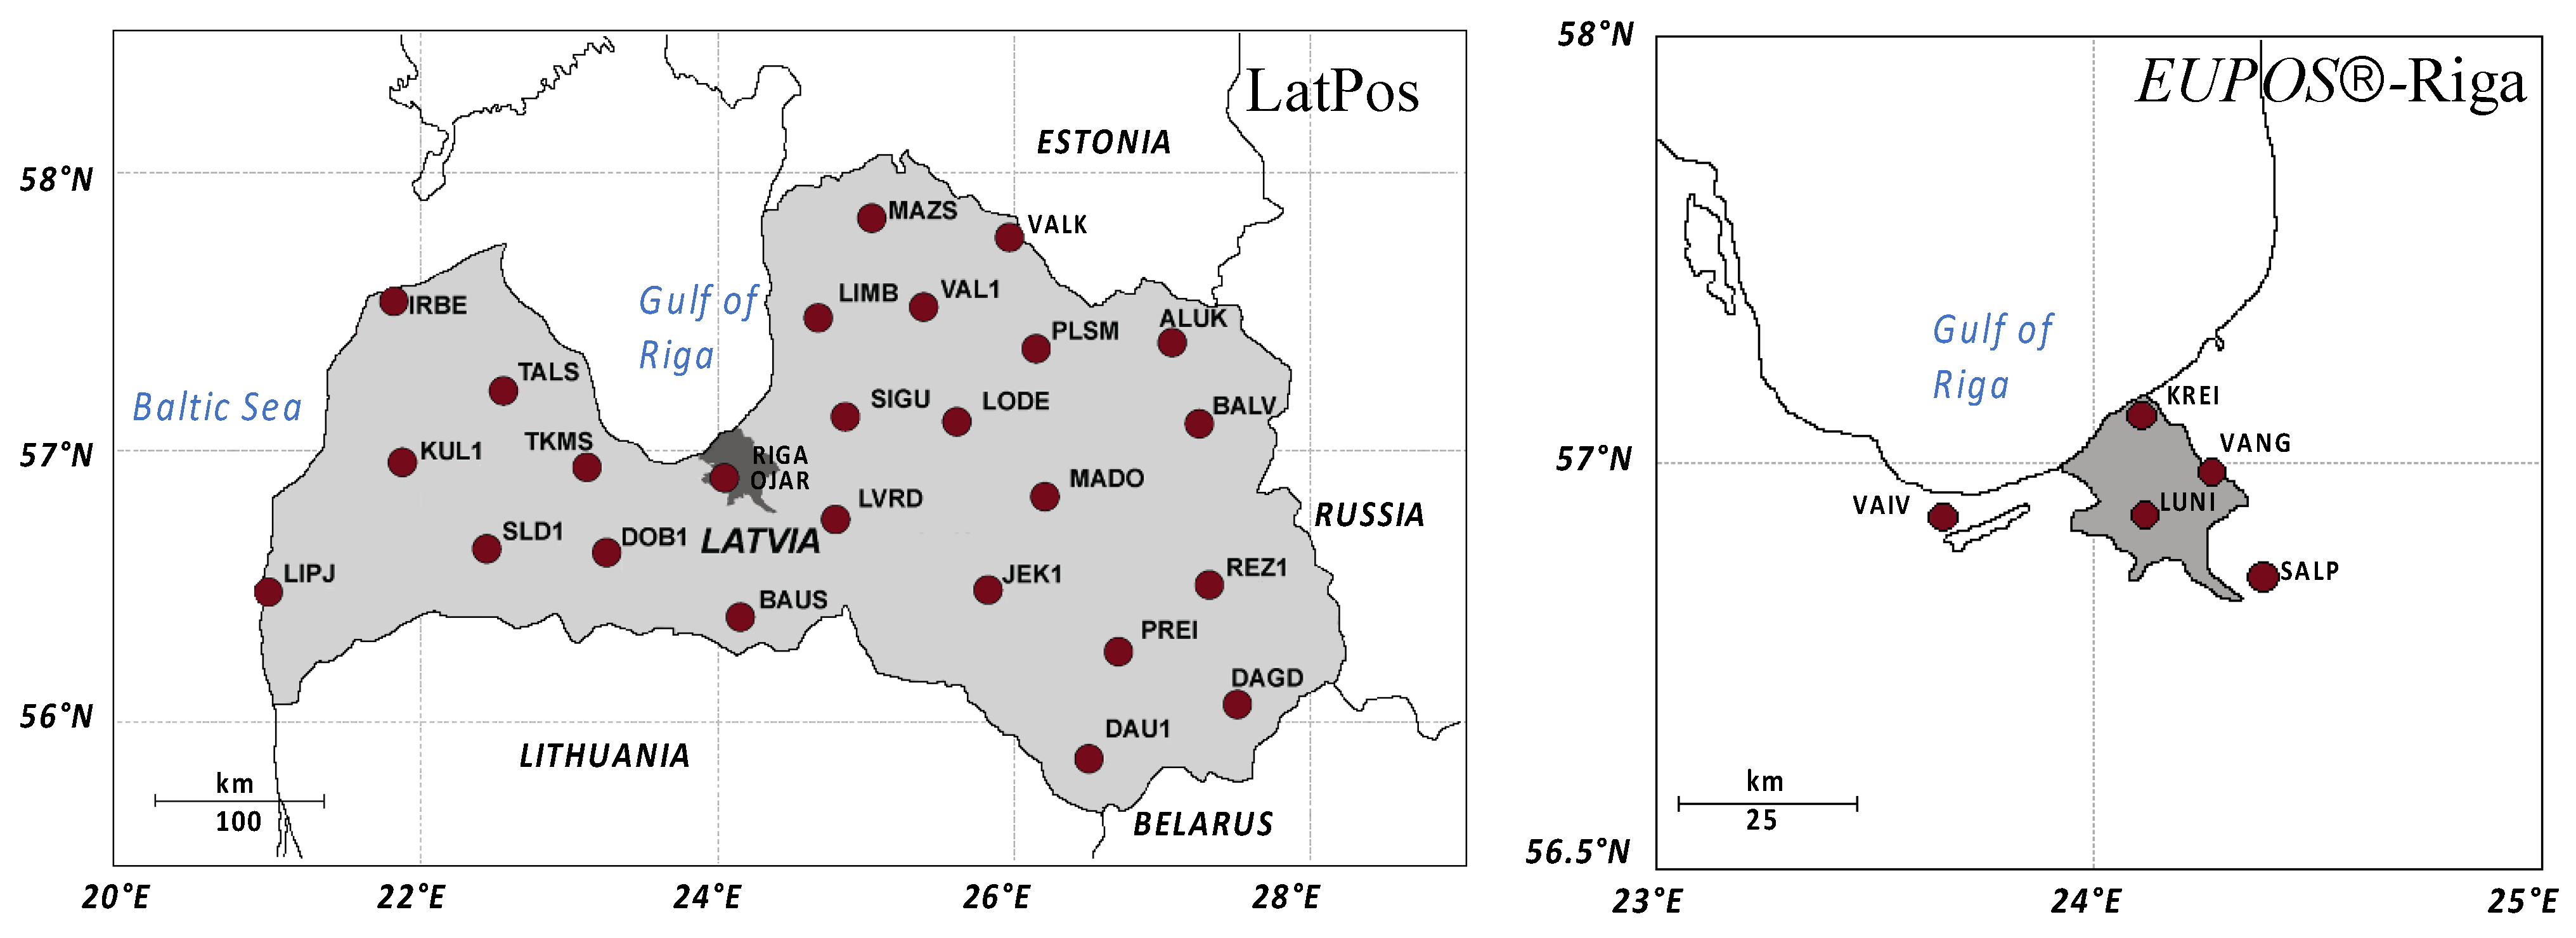
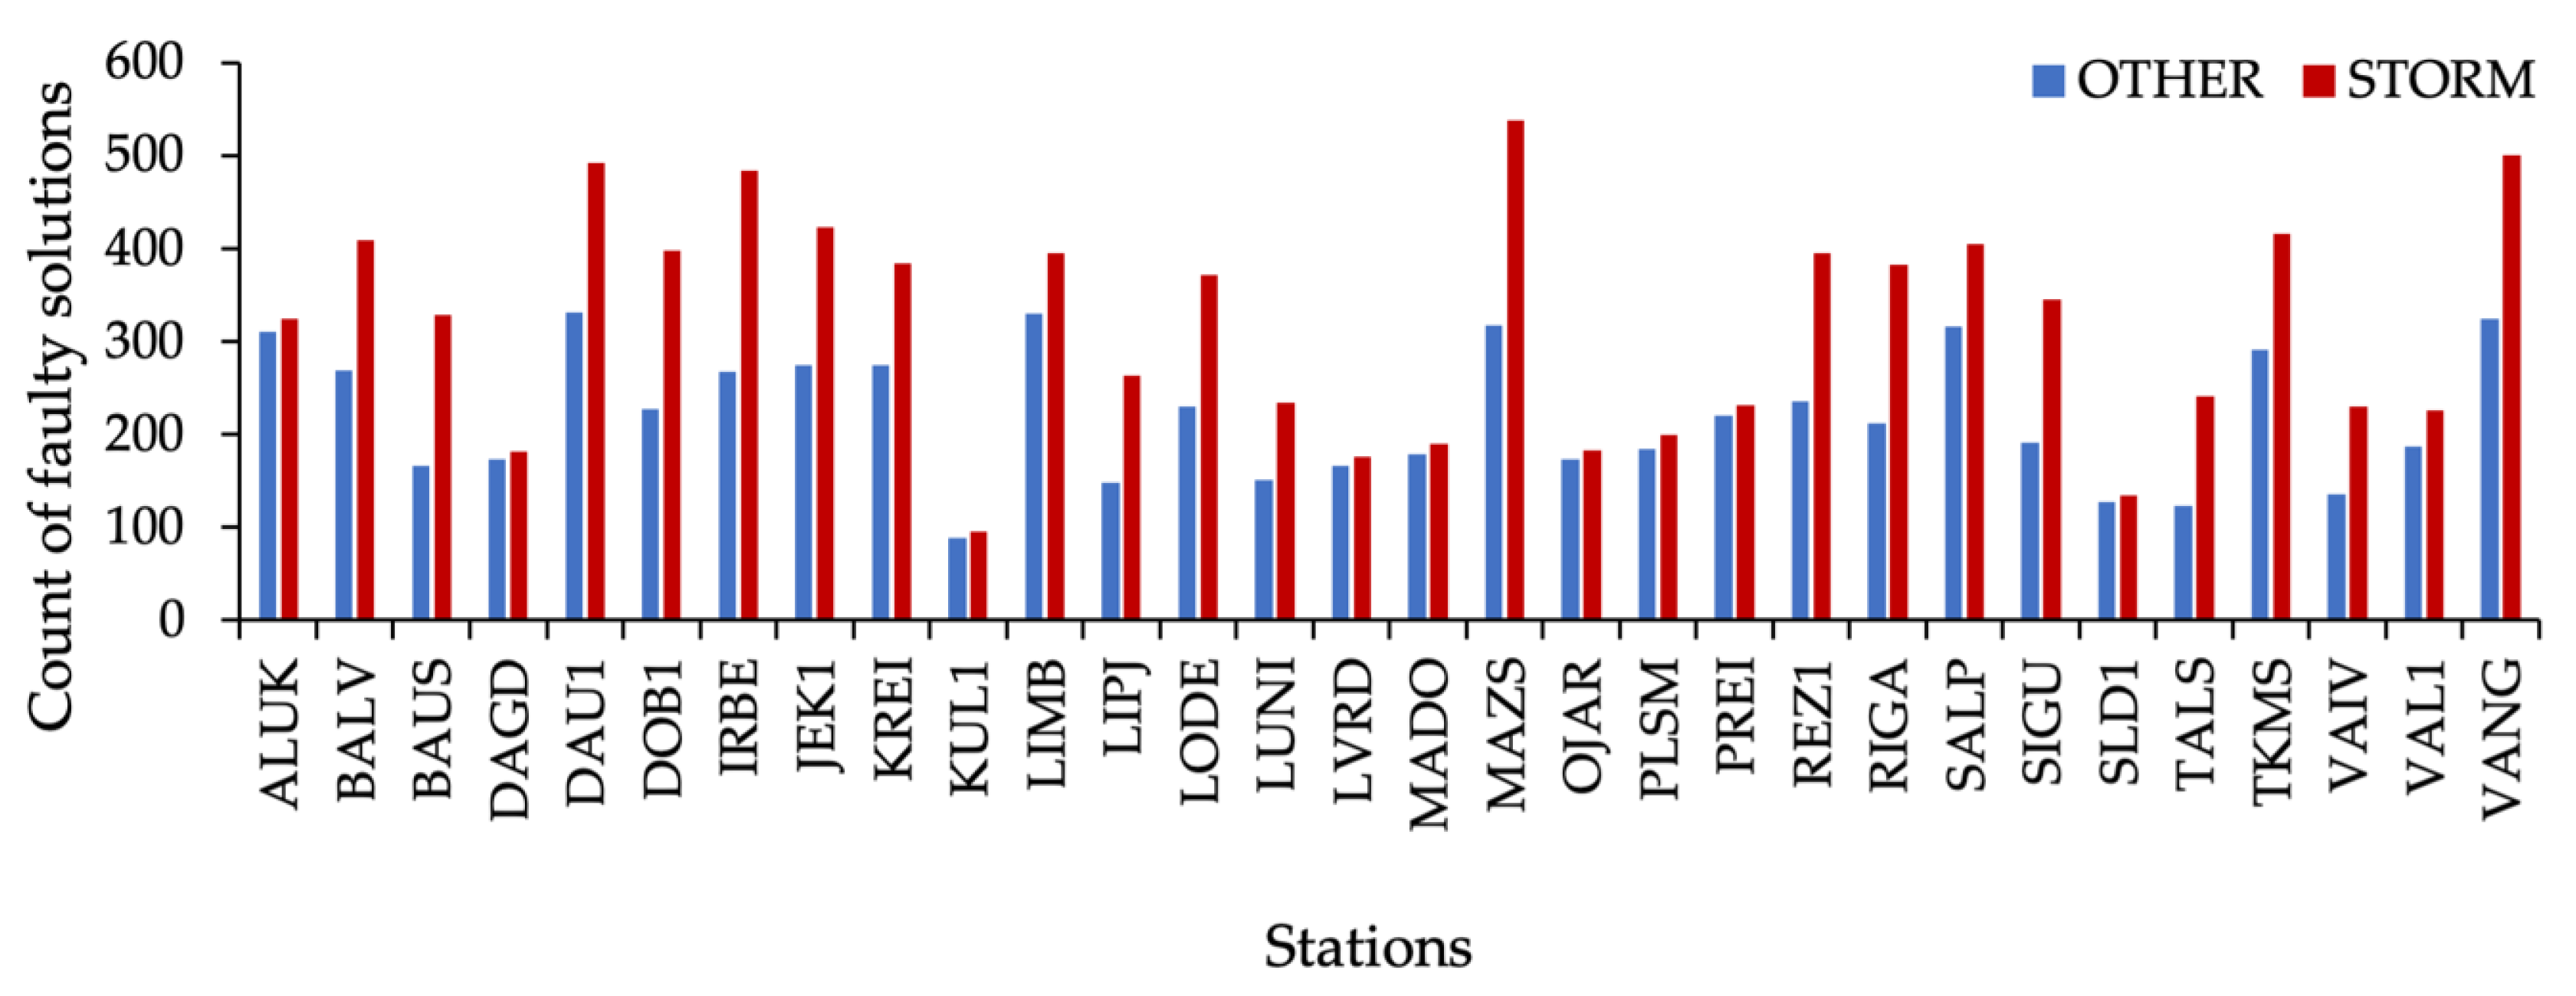
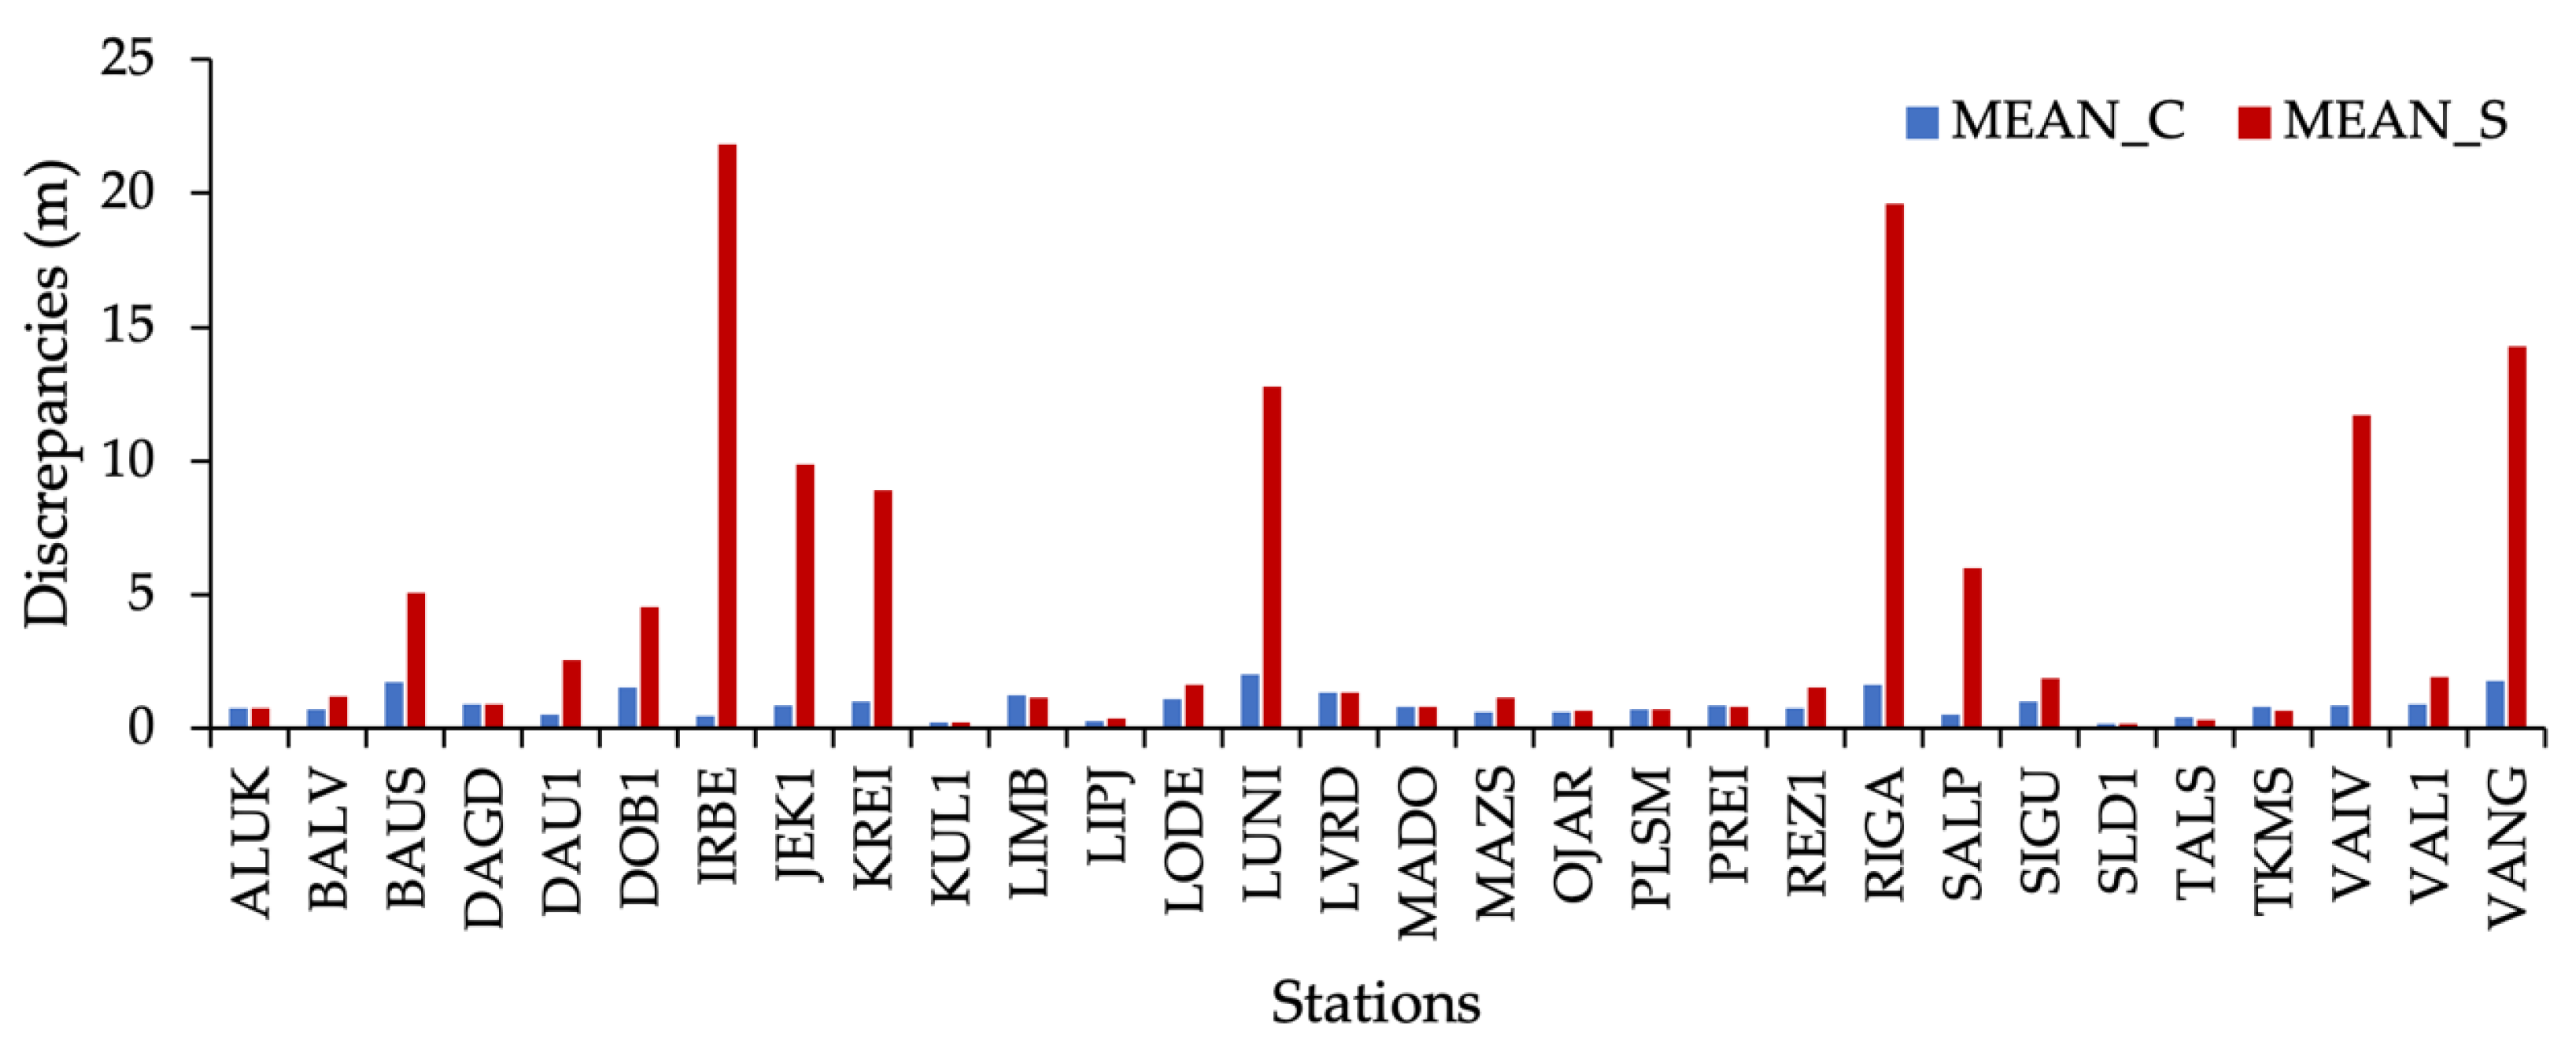
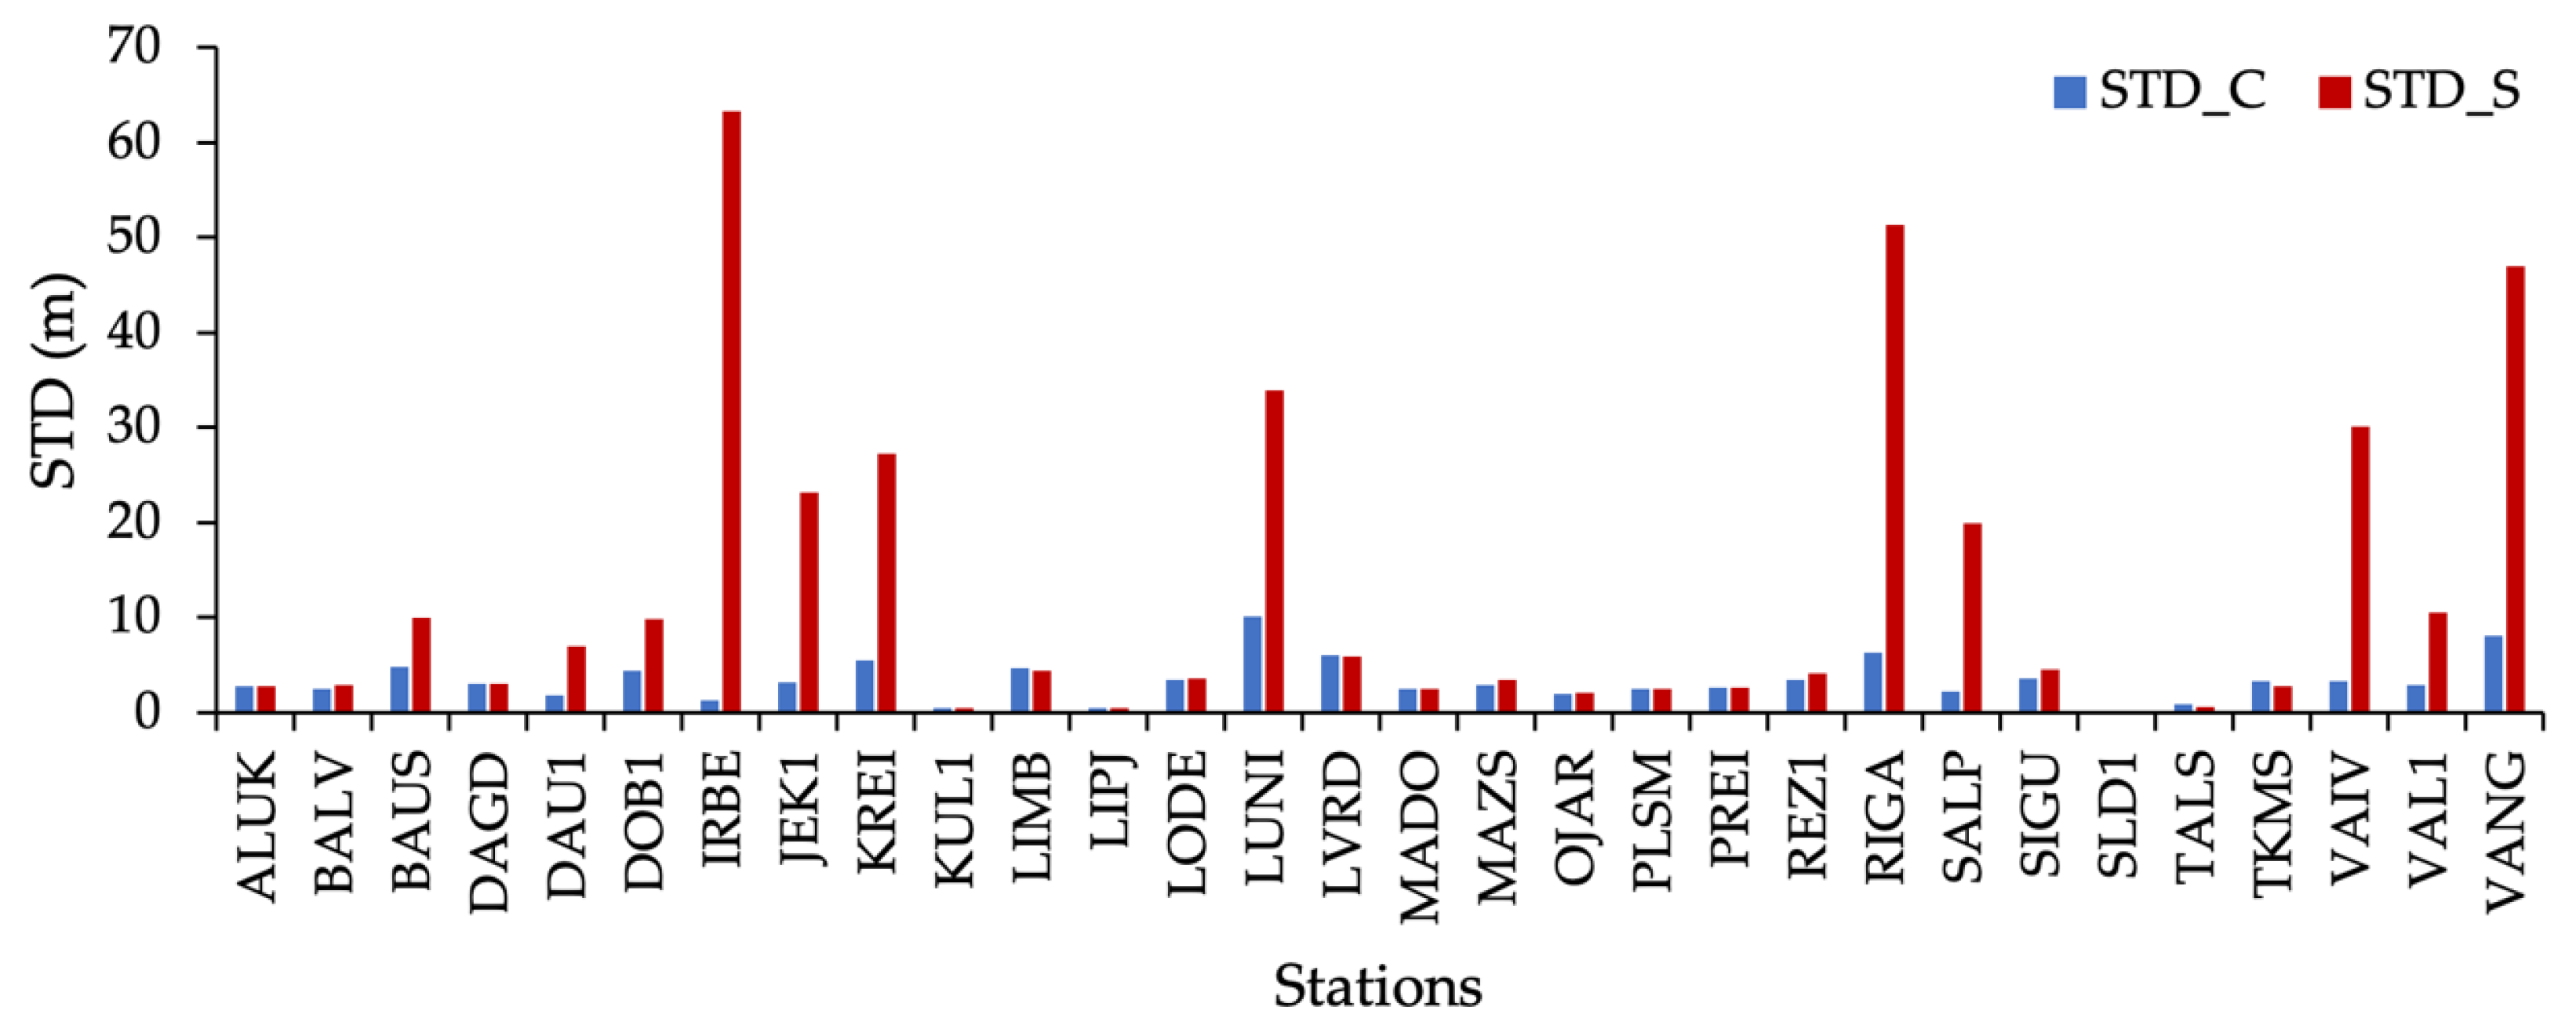
- For subset stations, the monthly mean discrepancies and standard deviations were computed for each station in two groups: (1) of all peak subsets on ‘calm’ days (C) and (2) ‘storm’ day (S), correspondingly. The count of faulty solutions for each station in both situations was performed.
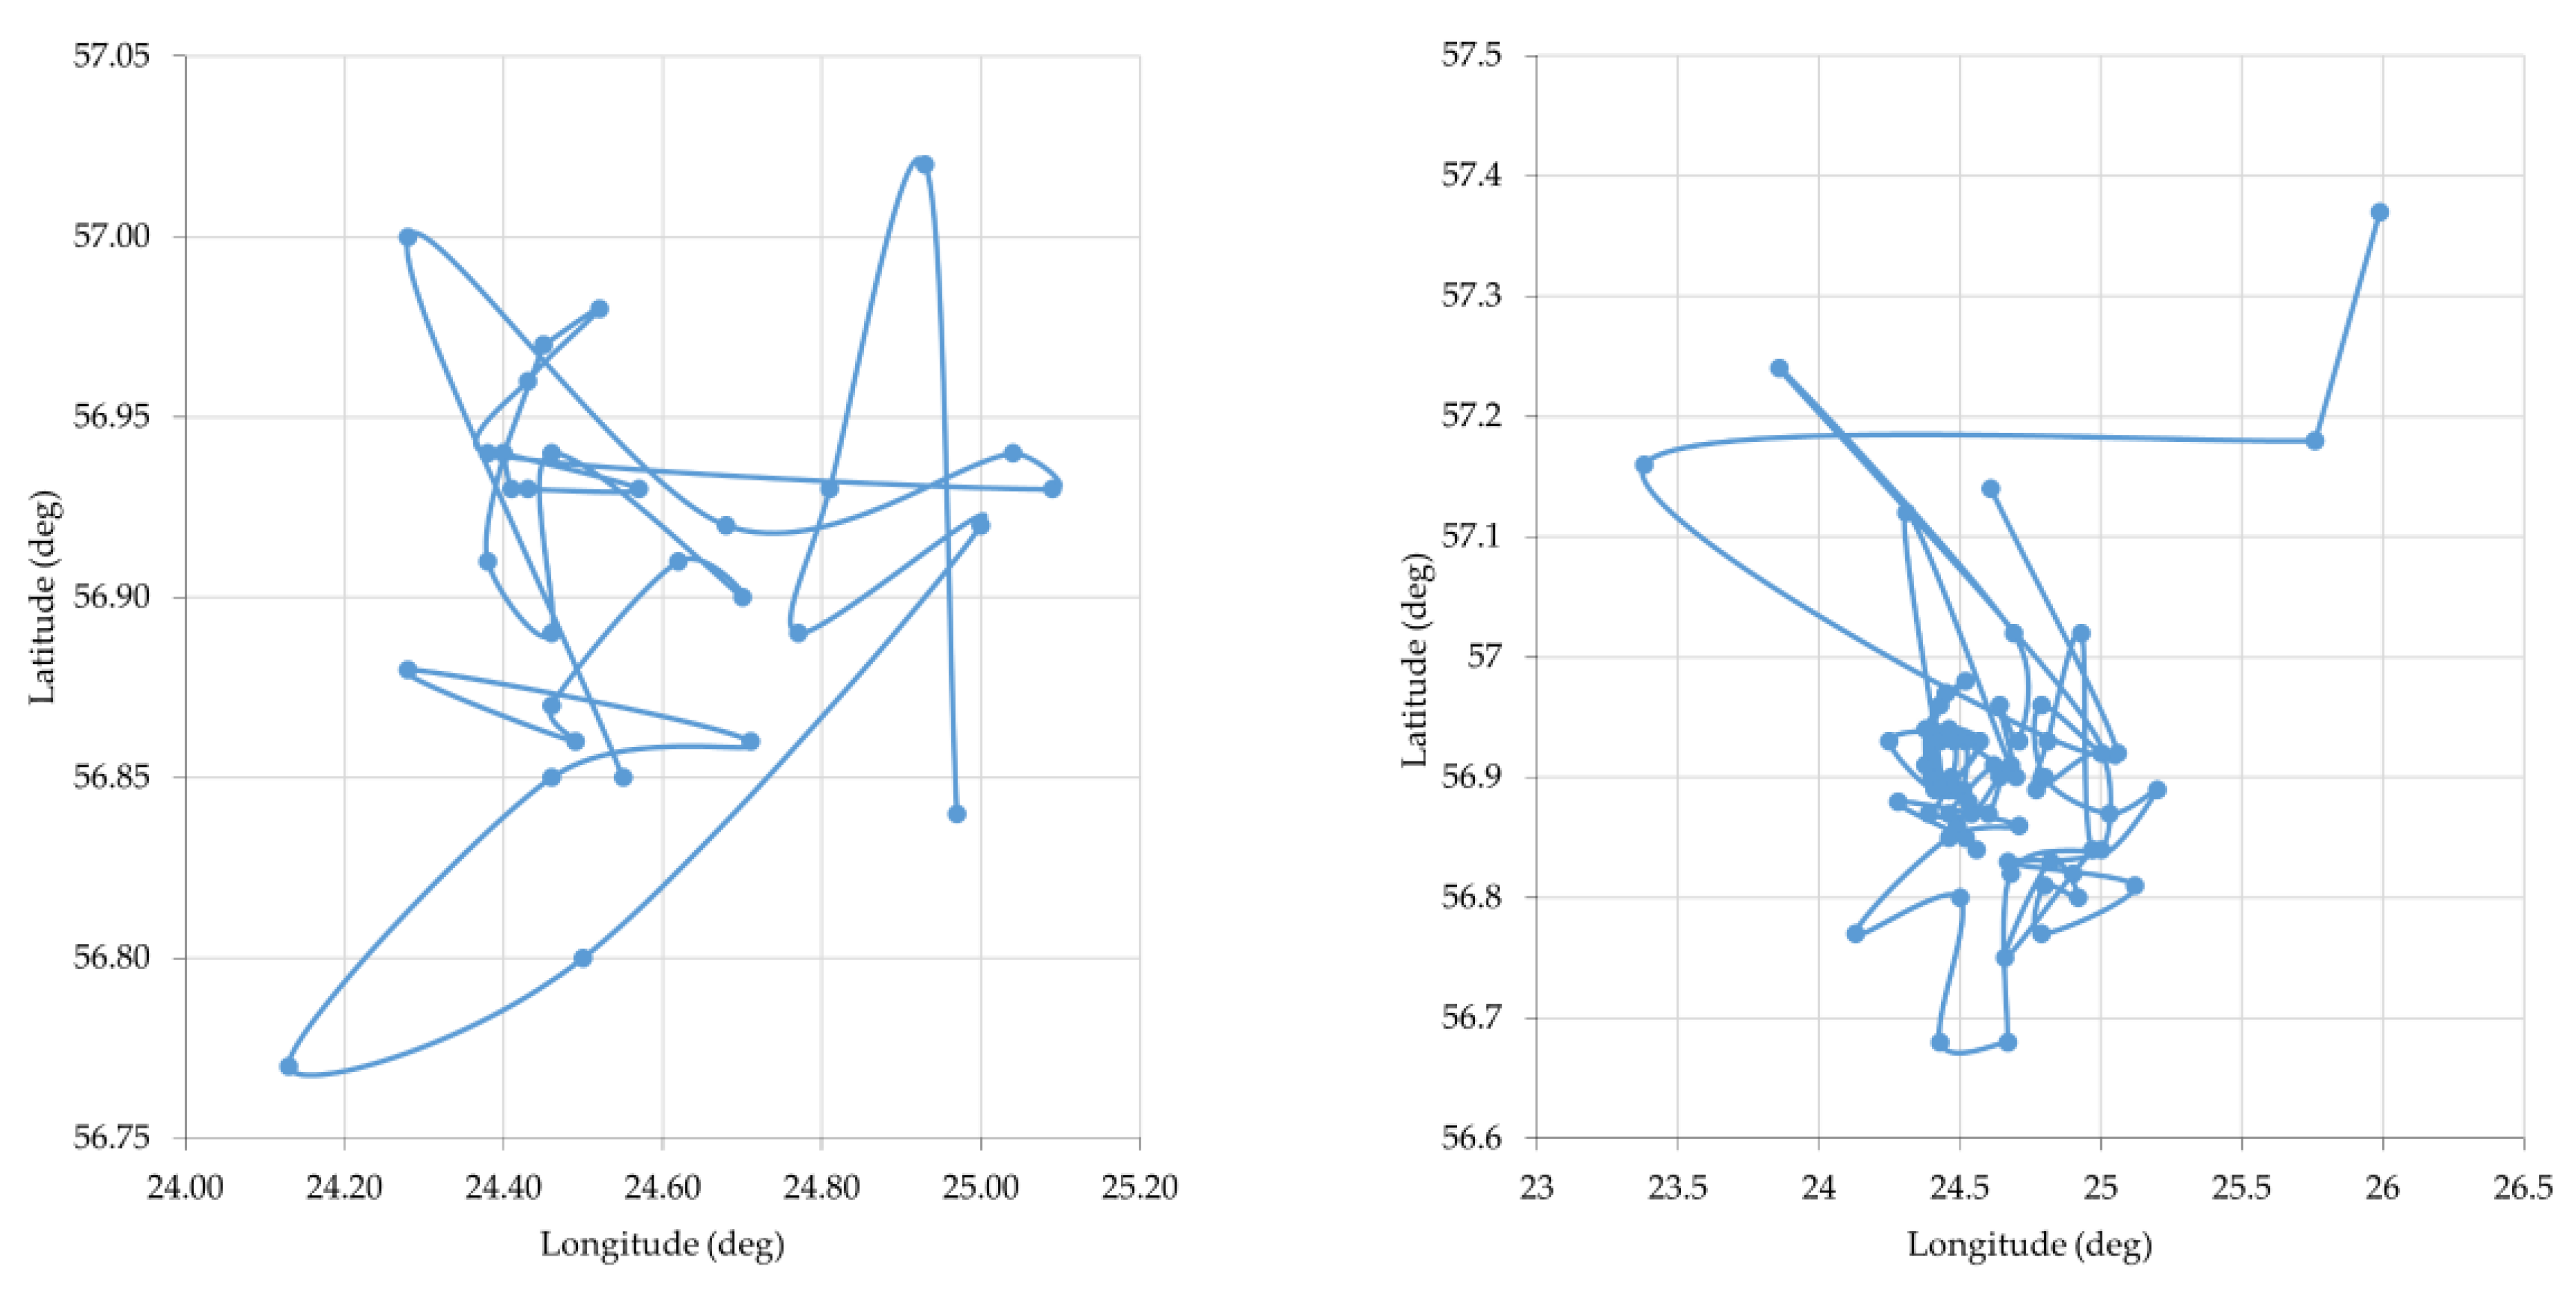
- For cloud groups of subset , the five adjacent clouds (Table S8), as a part of the daily cloud batches, were selected from the set . These were chosen as two subsets before the peak and two after the peak (in addition to the peak subset) to study the movement of adjacent discrepancy clouds within each day.
- For the group of subset , the intersection was performed for subsets of stations within each of group (Table S10).
- The cloud center coordinates were computed by computing the mean geographical coordinates for a subset of stations in various combinations.
3. Results and Discussion
3.1. Discrepancy Distribution inside Clouds
3.2. Discrepancy Coverage Parameters
3.3. Cloud Movement Analysis
3.4. Loss-of-Lock Situations
3.5. EGNOS Ground-Based RIMS Stations
4. Conclusions
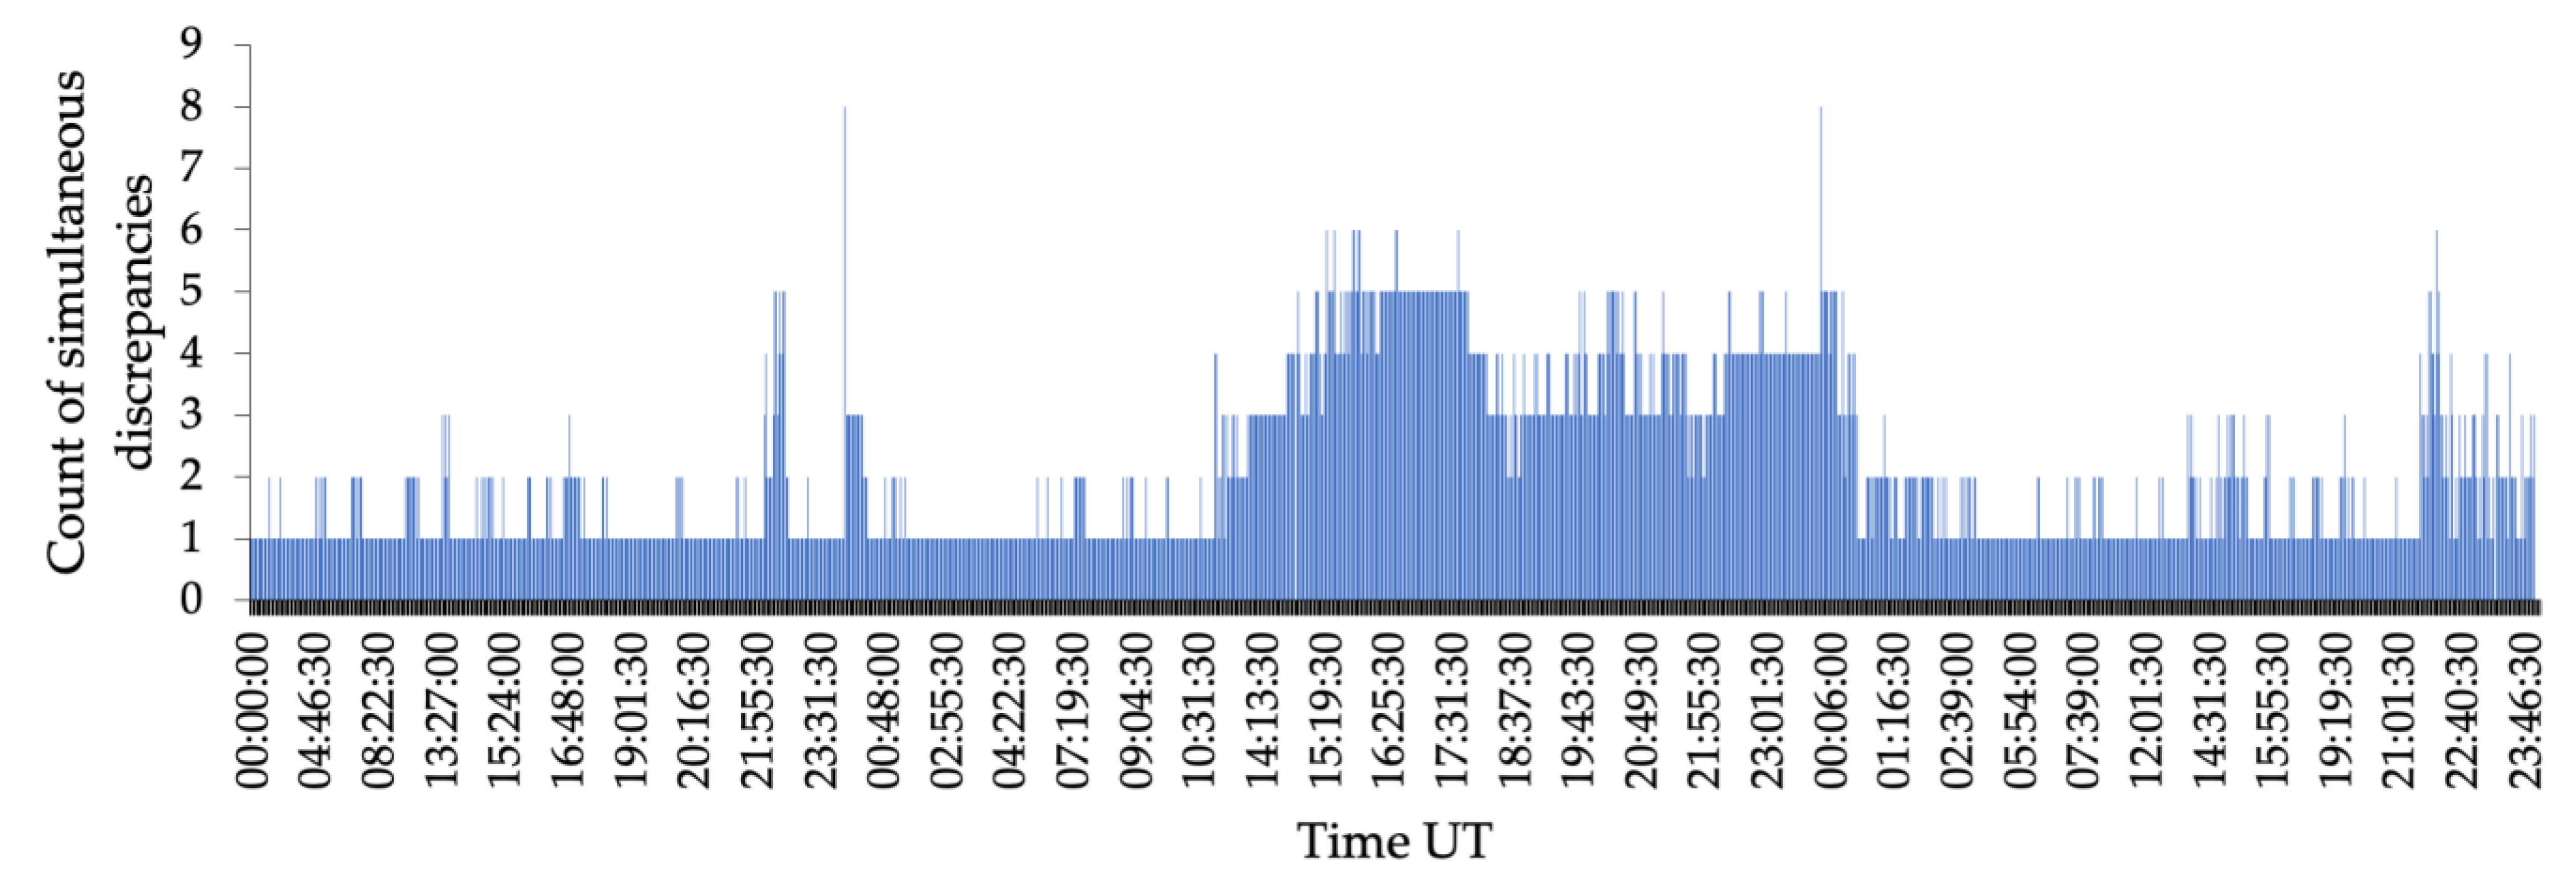
- In plots of time series of sequentially disturbed solutions, the discrepancy size distribution was irregular and could not be predicted;
- In the count of faulty solutions per station, the mean per month was 221 on 30 ‘calm’ days, and it was 319 per station on one day of the storm;
- The mean discrepancy for ‘calm’ days was 0.92 m, and it was 4.52 m for the day of the storm;
- The standard deviation of the discrepancy of ‘calm’ days was 3.39 m, and it was 12.75 m for the storm day;
- The fluctuation of discrepancies during the geomagnetic storm in meters for Northing was [−130.511; 106.922], Easting [−74.896; 120.517], and Up [−531.624; 154.625].
- Pearson’s correlation computed between discrepancies and ROTI values appeared weak;
- Pearson’s correlation computed between discrepancies of monthly peak subsets was moderate;
- The fluctuation of sites in discrepancy clouds was more intense on ‘calm’ days. During the storm, the boundaries of adjacent clouds were more stable;
- The centers of discrepancy clouds were more scattered on ‘calm’ days, and they were denser during the storm;
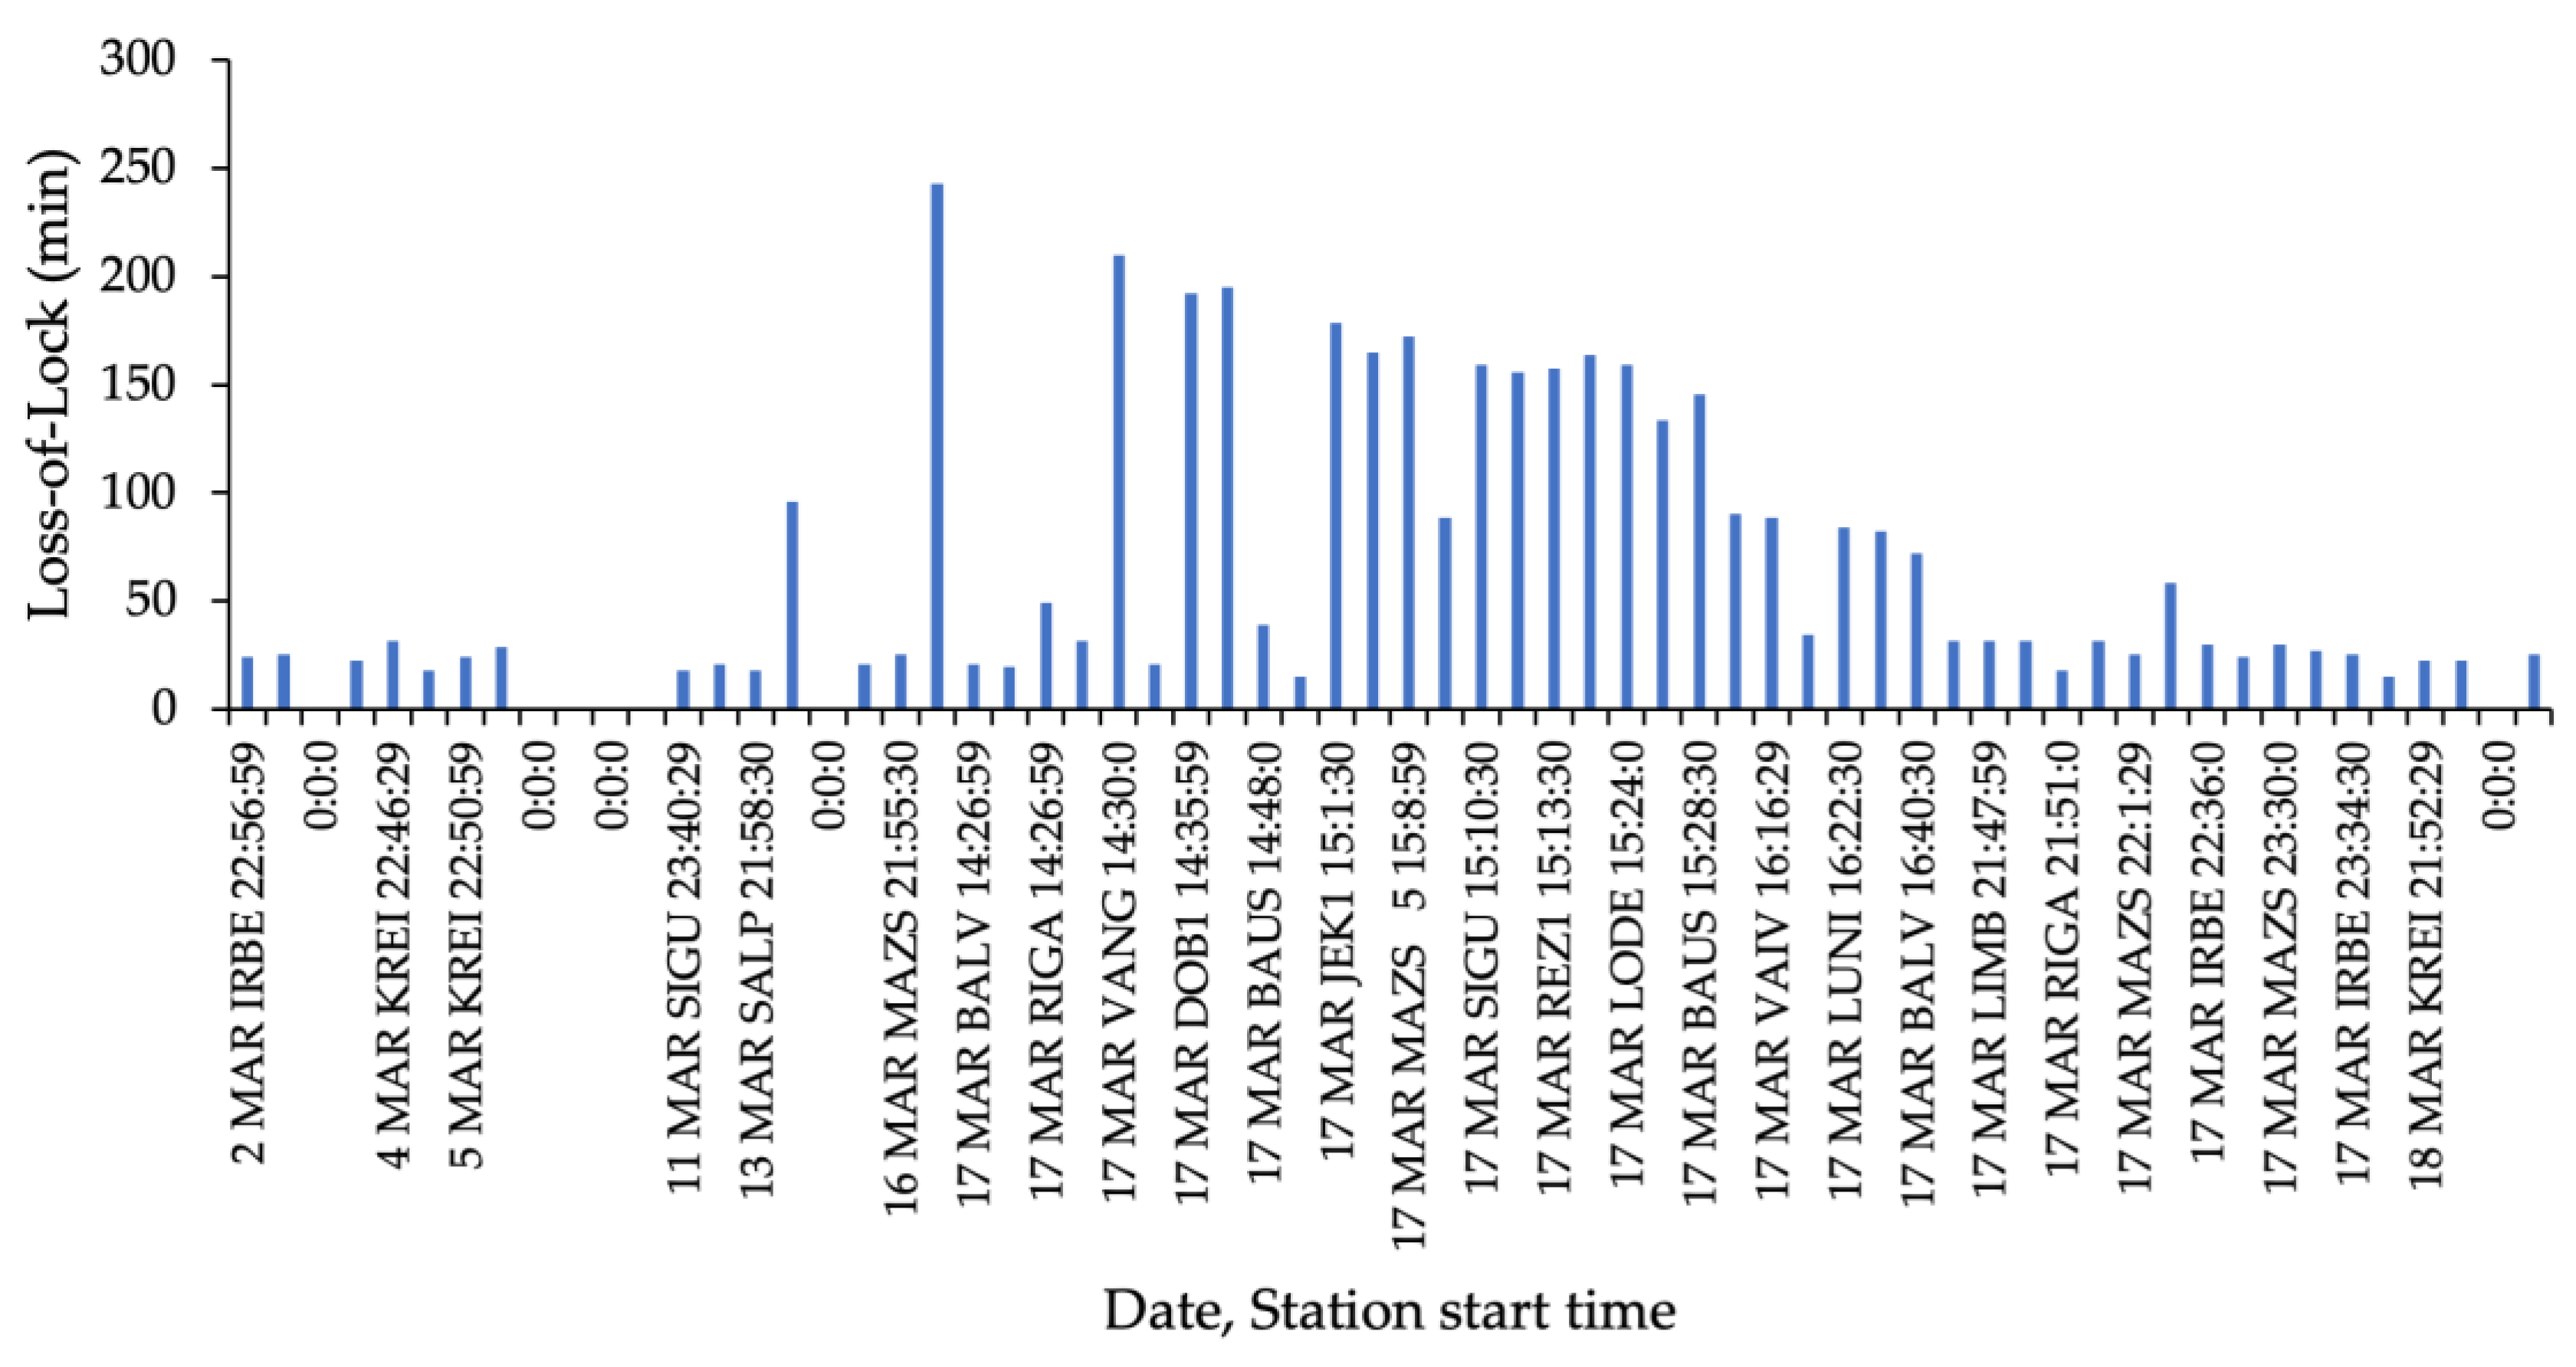
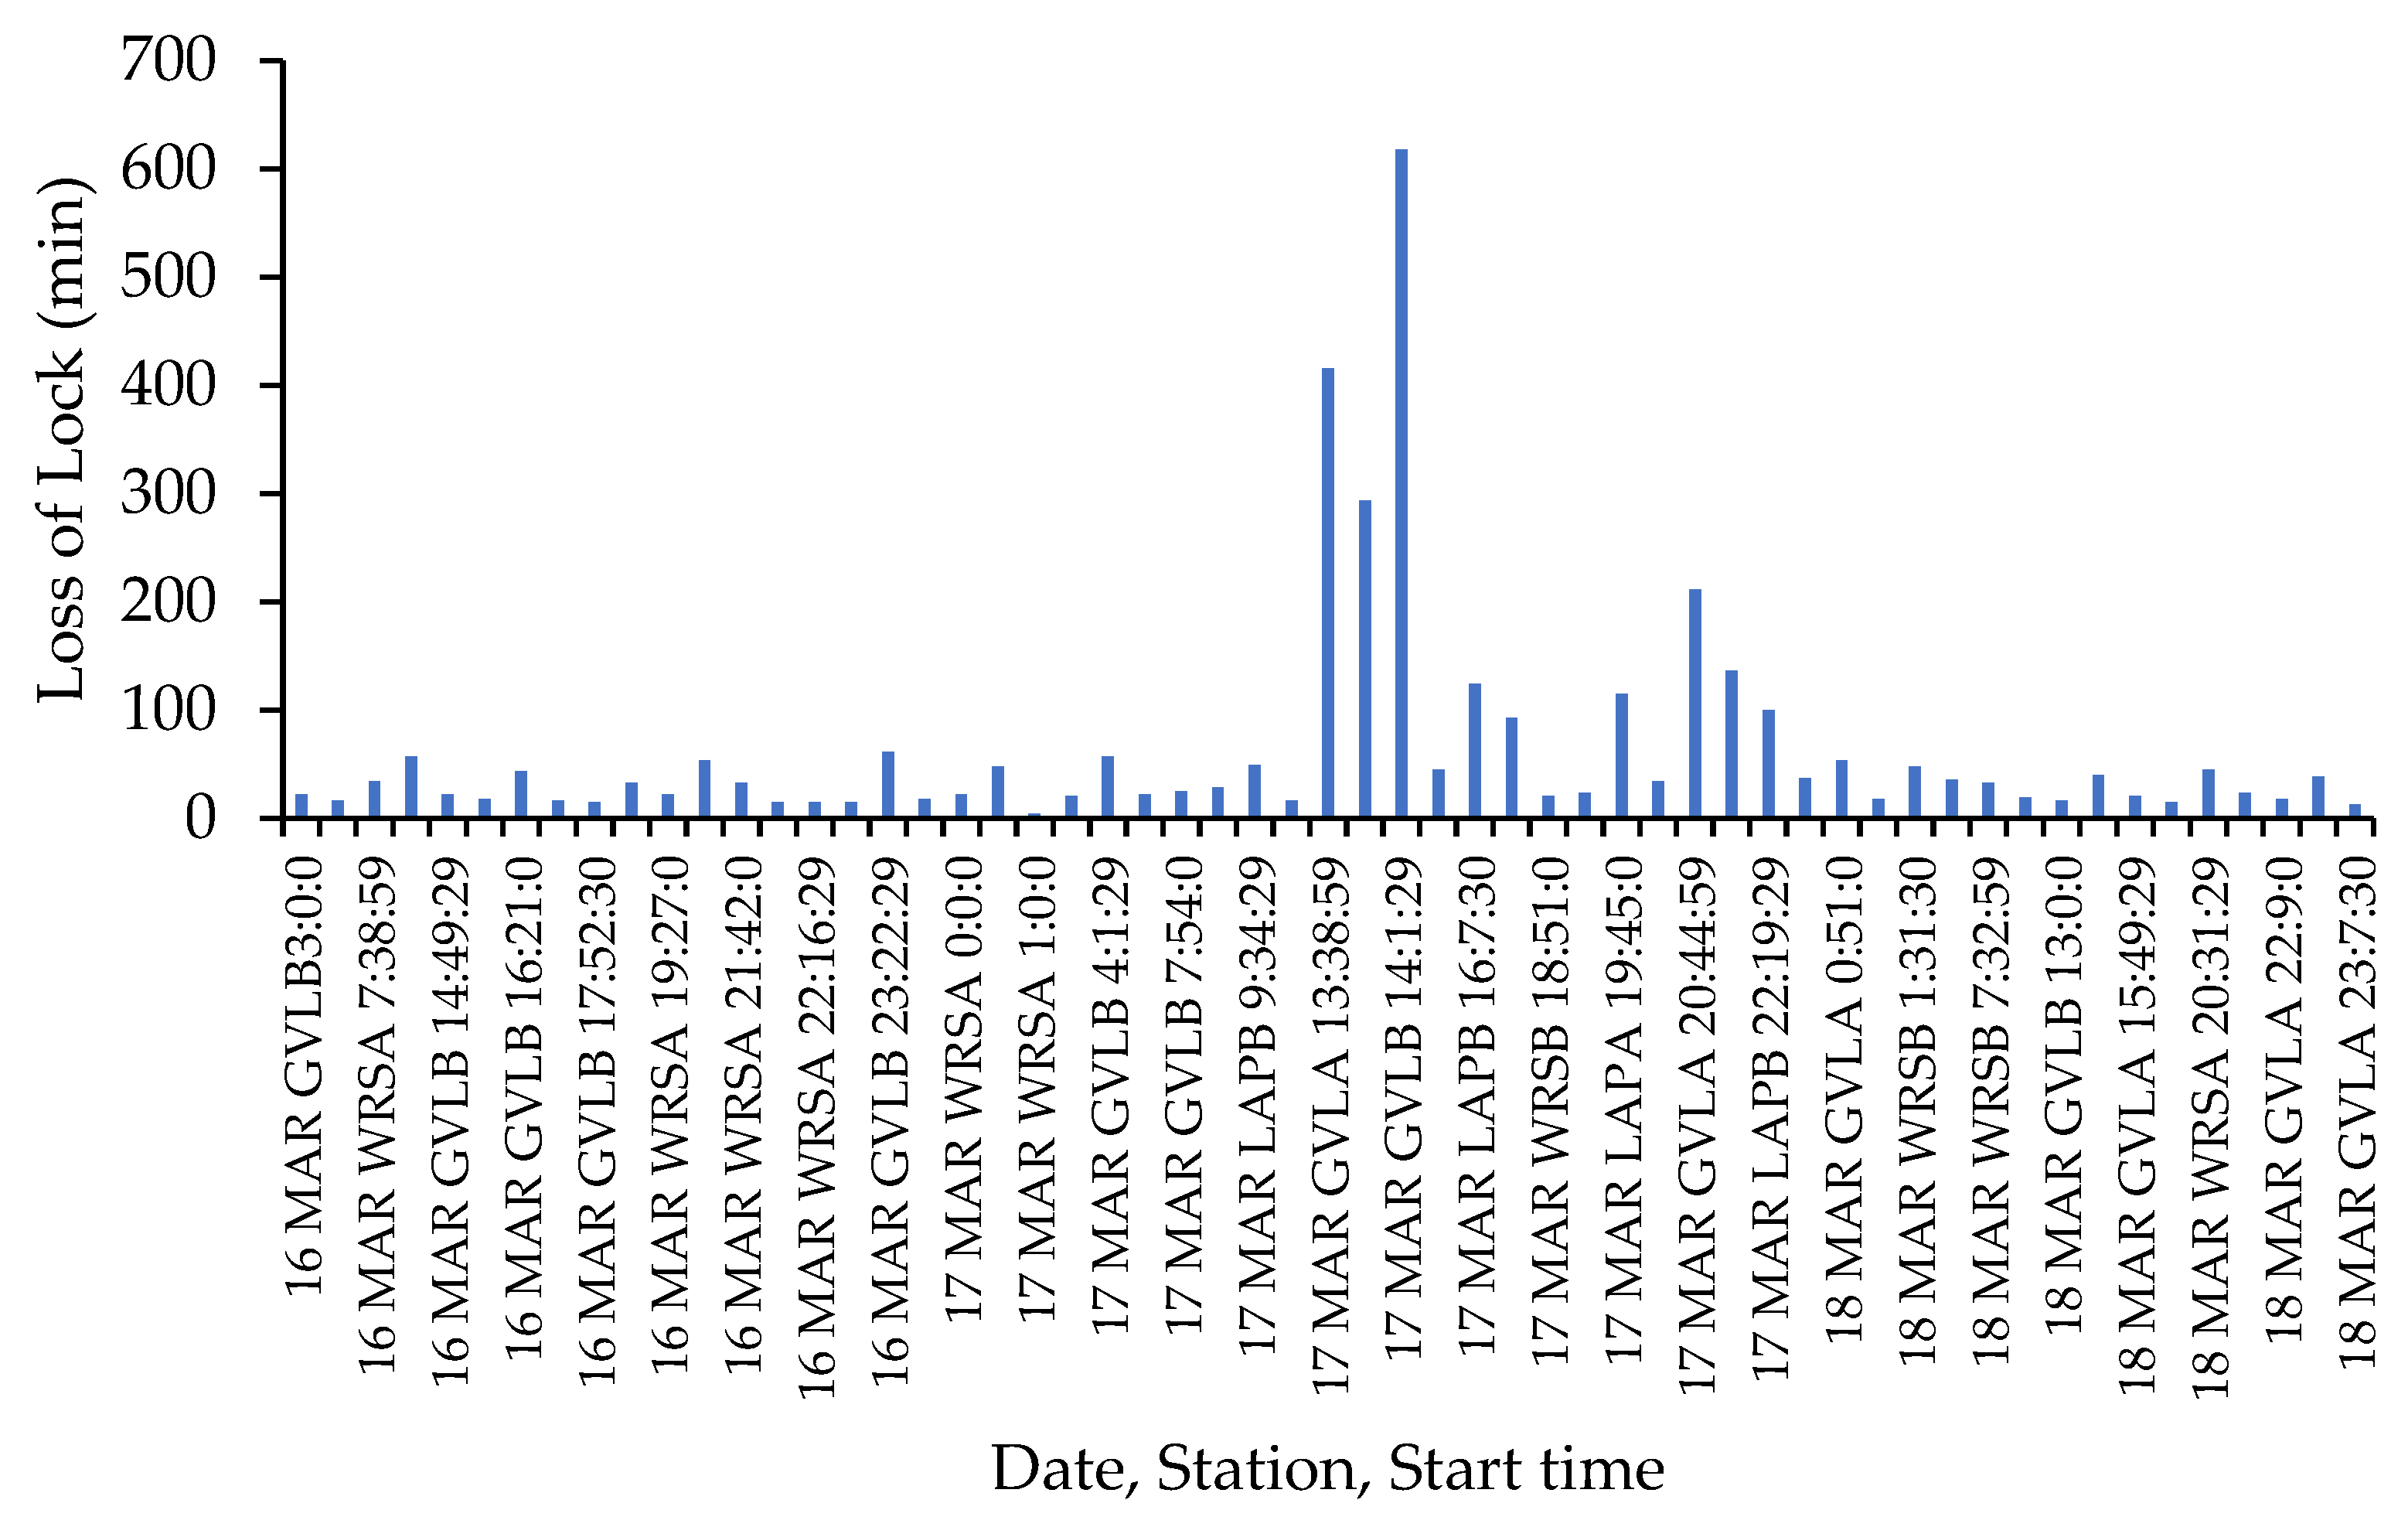
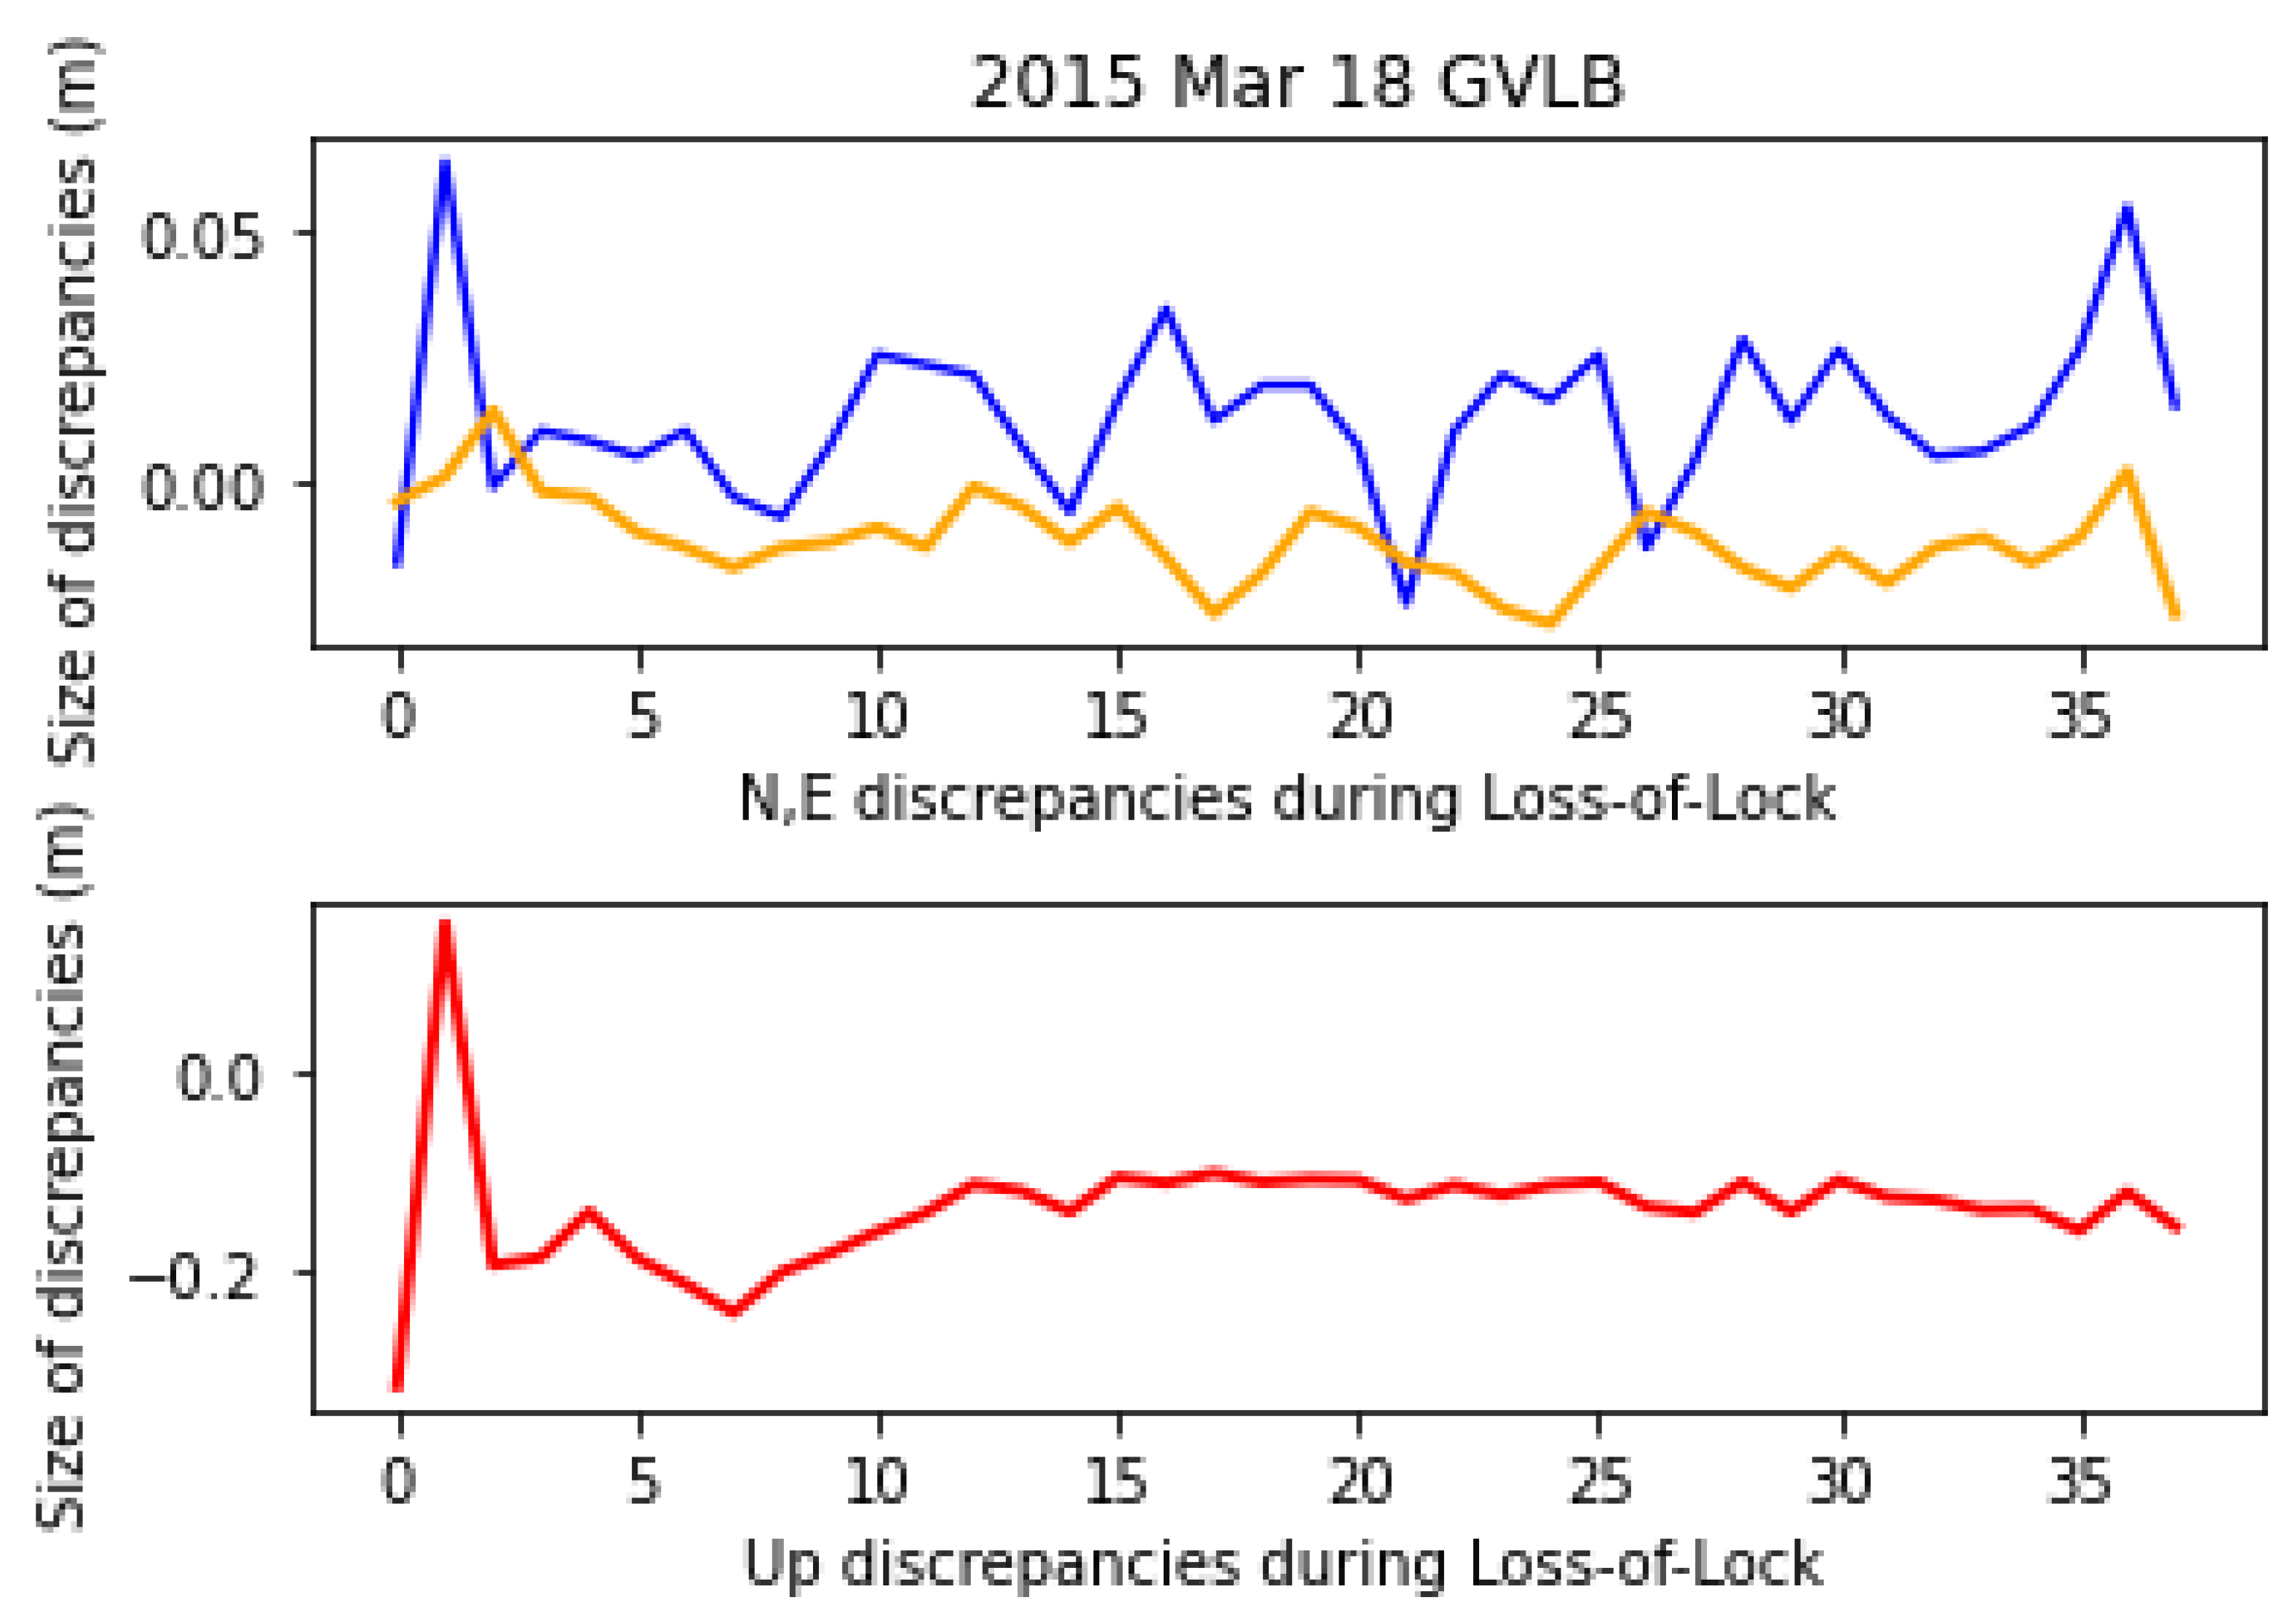
- The duration of loss of lock was long for Latvian CORS stations up to 4 thousand for EGNOS ground-based RIMS stations up to 10 h.
Supplementary Materials
Author Contributions
Funding
Data Availability Statement
Acknowledgments
Conflicts of Interest
References
- Dach, R.; Lutz, S.; Walser, P.; Fridez, P. Bernese GNSS Software, Version 5.2; Astronomical Institute, University of Bern, Bern Open Publishing: Bern, Switzerland, 2015. [CrossRef]
- Balodis, J.; Normand, M.; Varna, I. Extreme Solar Events’ Impact on GPS Positioning Results. Remote Sens. 2021, 13, 3624. [Google Scholar] [CrossRef]
- Guo, J.; Li, W.; Liu, X.; Kong, Q.; Zhao, C.; Guo, B. Temporal-Spatial Variation of Global GPS Derived Total Electron Content, 1999-2013. PLoS ONE 2015, 10, e0133378. [Google Scholar] [CrossRef] [PubMed]
- Coster, A.J. Space Weather and Its Effects on GNSS. Available online: http://cedar.openmadrigal.org/index.html/ (accessed on 27 March 2023).
- Hernández-Pajares, M.; Juan, J.M.; Sanz, J.; Orus, R.; Garcia-Rigo, A.; Feltens, J.; Komjathy, A.; Schaer, S.C.; Krankowski, A. The IGS VTEC Maps: A Reliable Source of Ionospheric Information since 1998. J. Geod. 2009, 83, 263–275. [Google Scholar] [CrossRef]
- Bergeot, N.; Chevalier, J.M.; Bruyninx, C.; Pottiaux, E.; Aerts, W.; Baire, Q.; Legrand, J.; Defraigne, P.; Huang, W. Near Real-Time Ionospheric Monitoring over Europe at the Royal Observatory of Belgium Using GNSS Data. J. Space Weather. Space Clim. 2014, 4, A31. [Google Scholar] [CrossRef]
- Coster, A.J. Madrigal Database. Available online: https://www.unoosa.org/documents/pdf/psa/activities/2022/ISWI2022/s8_07.pdf (accessed on 27 March 2023).
- Krypiak-Gregorczyk, A.; Wielgosz, P.; Borkowski, A. Ionosphere Model for European Region Based on Multi-GNSS Data and TPS Interpolation. Remote Sens. 2017, 9, 1221. [Google Scholar] [CrossRef]
- Psychas, D.; Verhagen, S.; Liu, X.; Memarzadeh, Y.; Visser, H. Assessment of Ionospheric Corrections for PPP-RTK Using Regional Ionosphere Modelling. Meas. Sci. Technol. 2019, 30, 014001. [Google Scholar] [CrossRef]
- Dobelis, D.; Zvirgzds, J.; Kaļinka, M. High Ionospheric Activity Effects on LatPos RTK Network Performance in Latvia. In IOP Conference Series: Materials Science and Engineering; Institute of Physics Publishing: Bristol, UK, 2017; Volume 251. [Google Scholar]
- Kaļinka, M.; Zvirgzds, J.; Dobelis, D.; Lazdāns, E.; Reiniks, M. The Near Real Time Ionospheric Model of Latvia. IOP Conf. Ser. Mater Sci. Eng. 2015, 96, 012042. [Google Scholar] [CrossRef]
- Guo, J.; Qi, L.; Liu, X.; Chang, X.; Ji, B.; Zhang, F. High-Order Ionospheric Delay Correction of GNSS Data for Precise Reduced-Dynamic Determination of LEO Satellite Orbits: Cases of GOCE, GRACE, and SWARM. GPS Solut. 2023, 27, 1–11. [Google Scholar] [CrossRef]
- Olwendo, J.O.; Cilliers, P.; Weimin, Z.; Ming, O.; Yu, X. Validation of ROTI for Ionospheric Amplitude Scintillation Measurements in a Low-Latitude Region Over Africa. Radio Sci. 2018, 53, 876–887. [Google Scholar] [CrossRef]
- Zakharenkova, I.; Cherniak, I.; Krankowski, A. Features of Storm-Induced Ionospheric Irregularities from Ground-Based and Spaceborne GPS Observations during the 2015 St. Patrick’s Day Storm. J. Geophys. Res. Space Phys. 2019, 124, 10728–10748. [Google Scholar] [CrossRef]
- Cherniak, I.; Zakharenkova, I.; Redmon, R.J. Dynamics of the High-Latitude Ionospheric Irregularities during the 17 March 2015 St. Patrick’s Day Storm: Ground-Based GPS Measurements. Space Weather 2015, 13, 585–597. [Google Scholar] [CrossRef]
- Morozova, A.L.; Barlyaeva, T.V.; Barata, T. Variations of TEC over Iberian Peninsula in 2015 Due to Geomagnetic Storms and Solar Flares. Space Weather 2020, 18, e2020SW002516. [Google Scholar] [CrossRef]
- Astafyeva, E.; Zakharenkova, I.; Förster, M. Ionospheric Response to the 2015 St. Patrick’s Day Storm: A Global Multi-Instrumental Overview. J. Geophys. Res. Space Phys. 2015, 120, 9023–9037. [Google Scholar] [CrossRef]
- Jacobsen, K.S.; Andalsvik, Y.L. Overview of the 2015 St. Patrick’s Day Storm and Its Consequences for RTK and PPP Positioning in Norway. J. Space Weather Space Clim. 2016, 6, A9. [Google Scholar] [CrossRef]
- Liu, J.; Wang, W.; Burns, A.; Yue, X.; Zhang, S.; Zhang, Y.; Huang, C. Profiles of Ionospheric Storm-enhanced Density during the 17 March 2015 Great Storm. J. Geophys. Res. Space Phys. 2016, 121, 727–744. [Google Scholar] [CrossRef]
- Balasis, G.; Papadimitriou, C.; Boutsi, A.Z. Ionospheric Response to Solar and Interplanetary Disturbances: A Swarm Perspective. Philos. Trans. R. Soc. A Math. Phys. Eng. Sci. 2019, 377, 20180098. [Google Scholar] [CrossRef] [PubMed]
- Yang, Z.; Morton, Y.T.J.; Zakharenkova, I.; Cherniak, I.; Song, S.; Li, W. Global View of Ionospheric Disturbance Impacts on Kinematic GPS Positioning Solutions During the 2015 St. Patrick’s Day Storm. J. Geophys. Res. Space Phys. 2020, 125, e2019JA027681. [Google Scholar] [CrossRef]
- Lu, Y.; Wang, Z.; Ji, S.; Chen, W. Assessing the Positioning Performance Under the Effects of Strong Ionospheric Anomalies with Multi-GNSS in Hong Kong. Radio Sci. 2020, 55, e2019RS007004. [Google Scholar] [CrossRef]
- Prikryl, P.; Ghoddousi-Fard, R.; Weygand, J.M.; Viljanen, A.; Connors, M.; Danskin, D.W.; Jayachandran, P.T.; Jacobsen, K.S.; Andalsvik, Y.L.; Thomas, E.G.; et al. GPS Phase Scintillation at High Latitudes during the Geomagnetic Storm of 17–18 March 2015. J. Geophys. Res. Space Phys. 2016, 121, 448–465. [Google Scholar] [CrossRef]
- Milanowska, B.; Wielgosz, P.; Krypiak-Gregorczyk, A.; Jarmołowski, W. Accuracy of Global Ionosphere Maps in Relation to Their Time Interval. Remote Sens. 2021, 13, 3552. [Google Scholar] [CrossRef]
- Magiera, W.; Vārna, I.; Mitrofanovs, I.; Silabrieds, G.; Krawczyk, A.; Skorupa, B.; Apollo, M.; Maciuk, K. Accuracy of Code GNSS Receivers under Various Conditions. Remote Sens. 2022, 14, 2615. [Google Scholar] [CrossRef]
- Zvirgzds, J. Rational System LatPos [in Latvian]; Riga Technical University: Riga, Latvia, 2012. [Google Scholar]
- Jivall, L.; Kaminskis, J.; Paršeliūnas, E. Improvement and Extension of ETRS 89 in Latvia and Lithuania Based on the NKG 2003 GPS Campaign. Geod. Ir Kartogr. 2007, 33, 13–20. [Google Scholar] [CrossRef]
- Lahtinen, S.; Jivall, L.; Häkli, P.; Kall, T.; Kollo, K.; Kosenko, K.; Galinauskas, K.; Prizginiene, D.; Tangen, O.; Weber, M.; et al. Densification of the ITRF2014 Position and Velocity Solution in the Nordic and Baltic Countries. GPS Solut. 2019, 23, 95. [Google Scholar] [CrossRef]
- CODE Data Archive. Available online: ftp://ftp.unibe.ch/aiub/BSWUSER50/ATM/ (accessed on 9 August 2021).
- Julien, O.; Selmi, I.; Pagot, J.-B.; Samson, J.; Fernandez, F.A. Extension of EWF Threat Model and Associated SQM. In Proceedings of the 2017 International Technical Meeting of The Institute of Navigation, Monterey, CA, USA, 30 January–2 February 2017. [Google Scholar]
- Baghmanyan, V.; Peron, G.; Casanova, S.; Aharonian, F.; Zanin, R. Evidence of Cosmic-Ray Excess from Local Giant Molecular Clouds. Astrophys. J. 2020, 901, L4. [Google Scholar] [CrossRef]
- Cīrulis, J. Mathematical logic and set theory. In Latvian: Matemātiskā Loģika Un Kopu Teorija; Zvaigzne ABC: Riga, Latvia, 2007. [Google Scholar]
- Cherniak, I.; Krankowski, A.; Zakharenkova, I. Observation of the Ionospheric Irregularities over the Northern Hemisphere: Methodology and Service. Radio Sci. 2014, 49, 653–662. [Google Scholar] [CrossRef]
- Douglas, A.; David, M.; Trevor, N.B.; Martin, J.G. (Eds.) Statistics with Confidence, 2nd ed.; British Medical Journal Books: London, UK, 2000; ISBN 0727913751. [Google Scholar]




| Intersection of Clouds on 1 March and 17 March | ||
|---|---|---|
| CLOUD CARDINALITY ON MARCH 1 | 18 24 28 28 25 | |
| CLOUD CARDINALITY ON MARCH 17 | 26 26 30 21 17 | |
| INTERSECTION CARDINALITY | 18 23 28 19 13 | 82.1% OF MARCH 1 STATIONS |
| Date | Peak No. | Time S | Time C |
|---|---|---|---|
| 16 March | 15th peak | 22:19:29 | |
| 17 March | 22nd peak | 22:16:29 | |
| 18 March | 23rd peak | 22:10:29 |
| Peak-Cloud Sets | 5-Cloud Sets 1–16 March | 5-Cloud Sets 17 March | 5-Cloud Sets 18–31 March | |||||
|---|---|---|---|---|---|---|---|---|
| Longitude | Latitude | Longitude | Latitude | Longitude | Latitude | Longitude | Latitude | |
| Mean | 24.85° | 56.93° | 24.94° | 56.93° | 24.55° | 56.91° | 25.15° | 56.95° |
| STD | 0.29° | 0.03° | 0.39° | 0.06° | 0.23° | 0.05° | 0.57° | 0.08° |
| MAX | 25.32° | 57.03° | 26.10° | 57.16° | 25.09° | 57.02° | 26.42° | 57.19° |
| MIN | 24.38° | 56.85° | 24.17° | 56.75° | 24.13° | 56.77° | 24.15° | 56.80° |
| MAX-MIN | 0.94° | 0.18° | 1.93° | 0.41° | 0.96° | 0.25° | 2.27° | 0.39° |
| Station No. | GVLA | GVLB | APA | LAPB | WRSA | WRSB | |
|---|---|---|---|---|---|---|---|
| 3269 | TOTAL FAULTS IN MARCH 2015 | 646 | 930 | 567 | 408 | 453 | 265 |
Disclaimer/Publisher’s Note: The statements, opinions and data contained in all publications are solely those of the individual author(s) and contributor(s) and not of MDPI and/or the editor(s). MDPI and/or the editor(s) disclaim responsibility for any injury to people or property resulting from any ideas, methods, instructions or products referred to in the content. |
© 2023 by the authors. Licensee MDPI, Basel, Switzerland. This article is an open access article distributed under the terms and conditions of the Creative Commons Attribution (CC BY) license (https://creativecommons.org/licenses/by/4.0/).
Share and Cite
Balodis, J.; Normand, M.; Zarins, A. The Movement of GPS Positioning Discrepancy Clouds at a Mid-Latitude Region in March 2015. Remote Sens. 2023, 15, 2032. https://doi.org/10.3390/rs15082032
Balodis J, Normand M, Zarins A. The Movement of GPS Positioning Discrepancy Clouds at a Mid-Latitude Region in March 2015. Remote Sensing. 2023; 15(8):2032. https://doi.org/10.3390/rs15082032
Chicago/Turabian StyleBalodis, Janis, Madara Normand, and Ansis Zarins. 2023. "The Movement of GPS Positioning Discrepancy Clouds at a Mid-Latitude Region in March 2015" Remote Sensing 15, no. 8: 2032. https://doi.org/10.3390/rs15082032
APA StyleBalodis, J., Normand, M., & Zarins, A. (2023). The Movement of GPS Positioning Discrepancy Clouds at a Mid-Latitude Region in March 2015. Remote Sensing, 15(8), 2032. https://doi.org/10.3390/rs15082032


