Article

LASSO (L1) Regularization for Development of Sparse Remote-Sensing Models with Applications in Optically Complex Waters Using GEE Tools

by
Anna Catherine Cardall
1,
Riley Chad Hales
2,
Kaylee Brooke Tanner
2,
Gustavious Paul Williams
2,* and
Kel N. Markert
3
1
Department of Chemical Engineering, Brigham Young University, Provo, UT 84602, USA
2
Department of Civil and Construction Engineering, Brigham Young University, Provo, UT 84602, USA
3
Google LLC, Mountain View, CA 94043, USA
*
Author to whom correspondence should be addressed.
Remote Sens. 2023, 15(6), 1670; https://doi.org/10.3390/rs15061670
Submission received: 26 January 2023 / Revised: 14 March 2023 / Accepted: 17 March 2023 / Published: 20 March 2023

Abstract

:
Remote-sensing data are used extensively to monitor water quality parameters such as clarity, temperature, and chlorophyll-a (chl-a) content. This is generally achieved by collecting in situ data coincident with satellite data collections and then creating empirical water quality models using approaches such as multi-linear regression or step-wise linear regression. These approaches, which require modelers to select model parameters, may not be well suited for optically complex waters, where interference from suspended solids, dissolved organic matter, or other constituents may act as “confusers”. For these waters, it may be useful to include non-standard terms, which might not be considered when using traditional methods. Recent machine-learning work has demonstrated an ability to explore large feature spaces and generate accurate empirical models that do not require parameter selection. However, these methods, because of the large number of included terms involved, result in models that are not explainable and cannot be analyzed. We explore the use of Least Absolute Shrinkage and Select Operator (LASSO), or L1, regularization to fit linear regression models and produce parsimonious models with limited terms to enable interpretation and explainability. We demonstrate this approach with a case study in which chl-a models are developed for Utah Lake, Utah, USA., an optically complex freshwater body, and compare the resulting model terms to model terms from the literature. We discuss trade-offs between interpretability and model performance while using L1 regularization as a tool. The resulting model terms are both similar to and distinct from those in the literature, thereby suggesting that this approach is useful for the development of models for optically complex water bodies where standard model terms may not be optimal. We investigate the effect of non-coincident data, that is, the length of time between satellite image collection and in situ sampling, on model performance. We find that, for Utah Lake (for which there are extensive data available), three days is the limit, but 12 h provides the best trade-off. This value is site-dependent, and researchers should use site-specific numbers. To document and explain our approach, we provide Colab notebooks for compiling near-coincident data pairs of remote-sensing and in situ data using Google Earth Engine (GEE) and a second notebook implementing L1 model creation using scikitlearn. The second notebook includes data-engineering routines with which to generate band ratios, logs, and other combinations. The notebooks can be easily modified to adapt them to other locations, sensors, or parameters.

1. Introduction

1.1. Remote Sensing of Water Quality

Remote-sensing data are used to monitor water quality [1] by estimating water quality parameters such as clarity, temperature, and chlorophyll-a (chl-a) content [2,3,4]. Landsat data are often used to estimate chl-a concentrations, which are a common index of water quality [5,6,7,8,9,10], because their high spatial resolution (approximately 30 m per pixel), high temporal collection rate (every 16 days), large coverage time (~37 years of data), and spectral bands designed for vegetation studies are well suited to the estimation of chl-a concentrations for use in long-term studies [11]. We selected Landsat data as an example dataset for this study because of the long time periods and appropriate spectral information contained in the dataset. These long time periods overlap with more field data, so there are more observations available to create and validate models. Other missions, such as MODIS or Sentinel 1, or multi-spectral images from aircraft or drones could also be used with these methods.
Water quality characterization using earth observation data relies on regression models that estimate the selected water quality parameters based on correlations with measured spectral data. These models are created using spectral data collected coincidentally or near coincidentally with the in situ measurements, so they measure the same conditions. The spectral data are regressed on the in situ measurements, and the resulting regression model is applied to estimate concentrations of interest [12,13,14,15]. In addition to regression models, semi-analytical methods are also used and rely on spectral signatures of the parameters of interest, such as chl-a levels, and use equations based on these expected spectral peaks to compute the expected reflectance values from the sensor [16,17]. More recently, studies have reported various machine-learning methods for fitting models, with many of the papers comparing different methods, algorithms, and approaches [18,19,20,21]. These methods have proven successful, but the resulting models are complex, and it is not always possible to explain the model terms and their physical meaning. Typically, the regression models used to estimate chl-a and other water quality parameters are created by selecting model parameters based on our understanding of the spectra of the water quality parameter of interest. After the potential model terms are selected, the models are created by either directly fitting the models using multilinear regression methods with a limited set of preselected terms or by pre-selecting a slightly larger number of terms according to the order of the expected correlations and then using step-wise linear regression to limit the number of terms in the final model [15,22,23]. Efron et al. [24] discuss a number of parameter selection methods or automatic parameter selection techniques for multilinear regression models, noting that “good” models are generally categorized based on their prediction accuracy but stressing that parsimony is an important criterion.
Since water quality models are generally developed using in situ data collected coincidentally with satellite data collections, the resulting models were often only applied to images from the same collection [25,26]. In situ data are rarely collected at the same time as satellite acquisitions, unless they are collected specifically for a remote-sensing study, which limits the applicability of these approaches. Recent research has shown that non-coincident data can be used to develop accurate chl-a models and that these models can be applied to all the historical Landsat images of a given water body [22,23,27]. This significantly increases the number of data available for model development and data analysis, thus supporting the use of remote-sensing data to evaluate long-term trends. This finding potentially supports the use of available in situ data collected through a larger range of conditions for model development, resulting in more robust models. For example, Hansen and Williams [15] used near-coincident data to develop sub-seasonal models that leveraged different spectral signatures based on the seasonal succession of algal species and used these models to analyze conditions over a nearly 40-year period. Tanner et al. [28] applied one of these models developed for Utah Lake to all historic Landsat observations to analyze long-term trends in chl-a concentrations.

1.2. Water Quality Models for Optically Complex Waters

Using remote-sensing data to study water quality in optically complex waters is complicated by factors such as complex optical properties (especially in turbid water bodies such as Utah Lake [25,26,29]), high suspended sediment volumes, shallow depths, and the challenge of differentiating between dense algae blooms and land vegetation in shallow, near-shore areas [8,30]. Multi-linear and step-wise regression result in parsimonious models with only a few terms, where the behavior or correlation of each term can be analyzed. However, the model terms for multi-linear regression, or the model terms and order of the terms for step-wise linear regression, must be selected a priori. Such terms are generally selected based on a spectral understanding of the parameter of interest and may not be optimal for optically complex water.
In this study, we focus on two challenges that impact empirical model development: the first is obtaining sufficient data with which to develop a regression model, and the second is determining the terms to include in the model, especially with regard to optically complex waters where a model may need to account for confounding factors and their resulting spectra. The first challenge can be addressed by using near-coincident data for model development rather than only coincident data and applying the resulting models to historic remote-sensing data. The second can be addressed using machine-learning methods, for which the limitation is that it is difficult to examine and explain individual terms in the model; consequently, the resulting models lack explainability. Our method addresses this latter issue.
Figure 1 shows an image of Utah Lake, our case study area. Utah Lake is optically complex with very high concentrations of suspended sediments, organic matter, and carbonate precipitates (Figure 1). Utah Lake characteristically exhibits the effects these various confusing substances have on the spectral chl-a signal as it has high concentrations of suspended solids, high levels of dissolved organic matter, a significant number of precipitates, and is shallow, thus posing a potential for bottom reflectance, although the water is so turbid the bottom is rarely visible [31].
Recent work demonstrating machine-learning methods has addressed the problem of developing models for optically complex scenarios, as model development can be used to explore a large feature space of non-standard terms. However, because of the large number of parameters and non-linear combinations inherent in most machine-learning methods, it can be difficult to determine the ultimate weight and physical relevance of various parameters and under what circumstances a model might be applicable based on a spectral understanding. Additionally, in most water quality applications, there are a limited number of measured or observed data, and machine-learning methods with a large number of features compared to the number of target data can result in the overfitting of a model, a term used to describe models that fit a training dataset very well but cannot be generalized to other data (even from the same population). This is certainly a concern for water quality applications as in situ water quality datasets are generally small.
Due to the potentially large number of parameters and non-linear combinations inherent in most machine-learning methods, it can be difficult to evaluate a trained machine-learning model to determine the ultimate weight and importance of the various parameters and their physical relevance as well as under what circumstances the model might be applicable based on a spectral understanding.
Our goal is to use machine-learning approaches to develop models with explainable spectral terms for complex waters rather than solely a model with a minimal error metric.

1.3. Approach

In this study, we explore regression models created using Least Absolute Shrinkage and Selection Operator (LASSO) regularization, which is more commonly known as L1 regularization. This results in a familiar multi-term regression model with a limited number of terms that can be evaluated to understand statistical correlations between the spectral terms and in situ data. Using L1 regularization allows us to explore a very large feature space as it does not require the a priori selection of specific model terms or the relatively expected importance or order of those terms. We present a case study wherein the number of features is similar in order or magnitude to the number of measurements used to fit the model. With L1 regularization, the user can trade model accuracy and parsimony using a weighting term. Stine (as summarized in [19]) notes that L1 provides more robust parameter selection than stepwise regression, which is sensitive to user-provided feature selection and order, especially in cases where the number of features is similar to the number of observations.
Ishwaran, in the discussion provided in [24], notes that while we good prediction error performance is desirable, simpler models are also prudent. These goals can be “diametrically” opposed. In theory, lower prediction error should result in more parsimonious models, but in practice, small improvements in prediction often result in larger models [24]. We use L1 regularization to develop a more general model by “shrinking” (i.e., regularizing or constraining) many model coefficients such that they approach zero. This results in models that are less complex and avoid overfitting. For our purposes, this also results in simplified models wherein terms can be examined and explained easily.
There are two related regularization approaches that are commonly used: Ridge (L2) and L1 regularization. Both add a penalty term to the loss function, which is typically the sum of the squared error. The added penalty term is the sum of the coefficients squared for L1 or the sum of the absolute values of the coefficients for L2 regularization. Both approaches minimize the coefficient values in the model as both the number and magnitude of the coefficients increase this term. L2 regularization shrinks the model coefficients such that they approach zero, which results in many terms having small coefficients, but the coefficients do not generally reach zero. Conversely, L1 regularization tends to set coefficient values to zero rather than a small number. L1 regularization can encounter convergent issues because of the step-function that occurs when coefficients are set to zero and, consequently, is used less than L2 regularization. Knight, in the discussion provided in [24], notes that L1 regularization is special in that it usually produces exactly 0 estimates for model coefficients when they are dropped, and that it is robust with respect to the tuning parameter. Loubes and Massart, in the discussion provided in [24], note that parameter selection methods such as L1 allow for the fitting of linear models to noisy data with only a few parameters.
L1 regularization minimizes cost functions, which constitute the prediction error plus the sum of the absolute values of the coefficients, as shown in Equation (1). We implemented a multi-linear regression model with L1 regularization using the Lasso model from scikit-learn (sklearn.linear_model.Lasso) [32]. The scikit-learn Lasso model minimizes the cost function, which, in this case, is the L2 norm of the error term squared (i.e., the mean squared error) and the L1 norm of the model coefficients (i.e., the sum of the absolute values of the model coefficients):
min 2 1 2 n X · w y 2 2 + α w 1
where X denotes the model features, n denotes the number of features; w represents the feature coefficients; y is the target value or measured chl-a concentration; x 2 2 is the squared L2-norm or the square of the sum of x, which, in this case, is the squared error given as ( ( X · w y ) 2 ) 2 ; X∙w are the predicted values (i.e., the dot product of the model coefficients and parameters); and w 1 is the L1-norm or sum of the absolute value of the coefficients | w | . This results in a function with a weighted combination of the fitting error and the sum of the absolute value of the model coefficients with alpha (α) as the LASSO weighting parameter.
Minimizing this cost function (Equation (1)) using L1 regularization facilitates the sections of a subset of features for regression analysis. This enhances prediction accuracy by reducing overfitting and facilitates interpretability by limiting the number of resulting model parameters.
L1 regularization can be thought of as an approach used to obtain the best predictive performance with the smallest number of features. However, in some cases, L1 selects parameters based on their interaction with the target value and does not attempt to select the parameters that have the most dominant effect on prediction. L1 does not necessarily approximate a physical model. For example, if multiple features are correlated, L1 tends to choose only one of those features and assigns a weight of 0 to the others. This can cause a model to omit a significant proportion of informative features. Generally, L1 will choose more variables than a traditional model, even with optimal α selection. Due to these issues, a different dataset can cause L1 regularization to select different variables; however, in this study, we found the variable selection process to be very stable. We explore this effect in Section 3.2, where we evaluate a range of α values and datasets using k-fold validations and compute what percentage of the models select various parameters [33,34].
Based on these caveats, we caution other researchers against blindly using models generated via L1 in cases where the number of parameters is of a similar order to the number of training samples, which is typical for most remote-sensing applications where a few hundred samples is considered large. We submit L1 regularization as a means to explore a large parameter space and identify potential model features for optically complex water bodies that would not traditionally be considered.
To demonstrate our approach, we fit a multi-linear regression model using several parameters generated from Landsat band values that were, in turn, generated using feature-engineering options. We then fit a model on the target value (chl-a concentration), using L1 regularization to reduce the number of terms used in the model. We use a very large number of features as we cannot be certain which features might be important for estimating chl-a concentrations in optically complex waters. This approach is a repeatable, quantitative method for the selection of the appropriate features for a given water body, and it allows a model to use terms to address confounding factors present in optically complex waters that may not be obvious.

1.4. Study Area

To demonstrate and explain our approach, we use chl-a data from Utah Lake along with remote-sensing data from the Landsat series; notably, this approach is general and could be applied to other water quality parameters, sensors, or locations. We selected Utah Lake (Figure 1) because it is optically complex with very high concentrations of suspended sediments, organic matter, and carbonate precipitates. Remote-sensing methods are often complicated by the effects of these various confounding factors, including suspended solids and organic matter, dissolved organic matter, precipitates, and bottom reflectance on the expected spectral signal for different water quality parameters [31].
Utah Lake is unique in that it is a very optically complex body of water, has been documented in a number of published remote-sensing and water quality studies, and has been scrutinized through a large dataset of in situ measurements [4,35]. This provides us with a large dataset with which to engage and the ability to compare our models to published models. In this study, we used in situ data from the Utah Ambient Water Quality Monitoring System (AWQMS) database managed by the Utah Department of Water Quality (DWQ).
Utah Lake is a major physical feature in the Utah Valley and a valuable natural resource. It is a shallow, turbid, slightly saline, eutrophic lake in a semi-arid area. It has good pollution degradation and stabilization capacity because of its shallow, well-oxygenated, high-pH waters. It supports and harbors abundant wildlife that forms part of a productive ecosystem. The lake provides and supports a wide range of beneficial applications, including ecological habitats, water storage, and recreation (e.g., boating, sailing, fishing, and hunting). Abundant wildlife and ecological richness are some of its more significant assets [36].
Figure 1 is an example Landsat image of Utah Lake that clearly shows sediment plumes in the south stemming from Goshen Bay, with the “grey” color of much of the lake indicating carbonate precipitation and suspended clays. Optically clearer, less turbid water can be seen entering the lake from Provo Bay on the East side of the lake. Provo Bay receives relatively clear water from Hobble Creek and several smaller tributaries. Examples of sediment resuspension can be seen in boat “tracks”; in Figure 1 a boat and its associated tracks are evident west and a little south of Provo Bay, which is located in the middle of the eastern shoreline. Landsat data have been previously used to evaluate Utah Lake, and this research includes published models for estimating chl-a concentrations [22,27,30].
Table 1 presents data and summary statistics for pertinent Utah Lake parameters. These data were downloaded in August of 2020 from AWQMS based on a search query applied to the period from 1901 through 2019. Utah Lake has Secchi depth measurements of only 0.27 and 0.25 m for its mean and median values, respectively, and a level of total dissolved solids of over 1000 mg/L. These very shallow Secchi depths and the high level of total dissolved solids indicate that Utah Lake is optically complex. Other parameters, which are presented in Table 1, support this conclusion. While the geochemistry of Utah Lake, including its dissolved and suspended solids, is eutrophic, studies have shown that water quality, as measured by chl-a, has been improving over the last 40 years [28].
Utah Lake, like most water bodies, does not have water sampling data with the spatial and temporal scope required to evaluate long-term trends and spatial patterns; however, it does have more in situ data available than many reservoirs. This reason, combined with its optically complex nature, is why we selected Utah Lake to demonstrate L1 regularization for model selection.

2. Data and Methods

2.1. Overview

We obtained in situ measurements that included the measurement date, sample collection time, measurement location (latitude and longitude), and chl-a concentrations from AQWMS (Table 1). We uploaded these data and used Google Earth Engine (GEE) to acquire all available Landsat pixel data from the in situ data locations along with the time difference between the satellite and field collections. The satellite data included the values for each Landsat band and the image timestamps.
We used a 5-day offset for the initial data extraction process, that is, any data within 5 days of either side of a field collection; however, we performed most computations using a smaller offset and both 30 and 90 m resolution datasets. The 30 m resolution data correspond to a single pixel at the native Landsat resolution, and the 90 m resolution data represent a 3 × 3 grid averaged to mitigate noise and spatial variation. We extracted the band data using GEE, which identified images within the offset window, selected the pixel(s) associated with the in situ measurement location, and computed the 90 m average. These data were exported as a table. The table has one row for each in situ measurement and includes the in situ date/times, locations, offsets to remote-sensing data (in hours), in situ parameter values, and remote-sensing band values. For the Landsat missions, there are 8 additional columns. We generated separate tables for the 30 m and 90 m data. These data can be used to develop models using our approach or any other method. Details and working code used to create this table are provided in a Google Colab Notebook called DataCollectionNotebook (Notebook1).
The remainder of Section 2 outlines the model generation process, providing details and discussion for each step. We use the data generated by Notebook1 in this study (Section 2.2) and select an offset and the features to be considered in model creation, such as bands or band combinations, and generate these features (Section 2.3). We discuss some data issues caused by negative reflectance values (Section 2.4); then, we discuss α value selection (Section 2.5). Subsequently, we present model-fitting and error estimation processes performed (Section 2.6). Details of and working code used to perform model fitting are included in the ModelFitNotebook (Notebook2). We provide a brief description of the two notebooks that contain the example code to perform the feature-engineering and model-fitting steps (Section 2.7). Notebook1 generates the data used to create using the methods provided in Notebook2.
In Section 3, we demonstrate the impacts of resolution, offset, and α selection on model accuracy and discuss best approaches for selecting these parameters. This includes the impacts of the time offset between in situ and remote-sensing data and how the resolution of remote-sensing data impacts model error.

2.2. Study Data

We used AQWMS data collected from 42 Utah Lake locations (Figure 2). We selected “chlorophyll a, uncorrected for pheophytin” surface measurements as the water quality parameter. The data were downloaded in July 2022 and contained 1024 samples from 11 July 1989 through 15 September 2021. We only performed minimal data cleaning and quality assurance with respect to these data. Results presented in later sections indicate that we may have included some outliers, and several duplicate samples, which affected model’s results. Since this paper focuses on the model creation methods and not on models’ results, we did not expend any additional efforts on data cleaning.
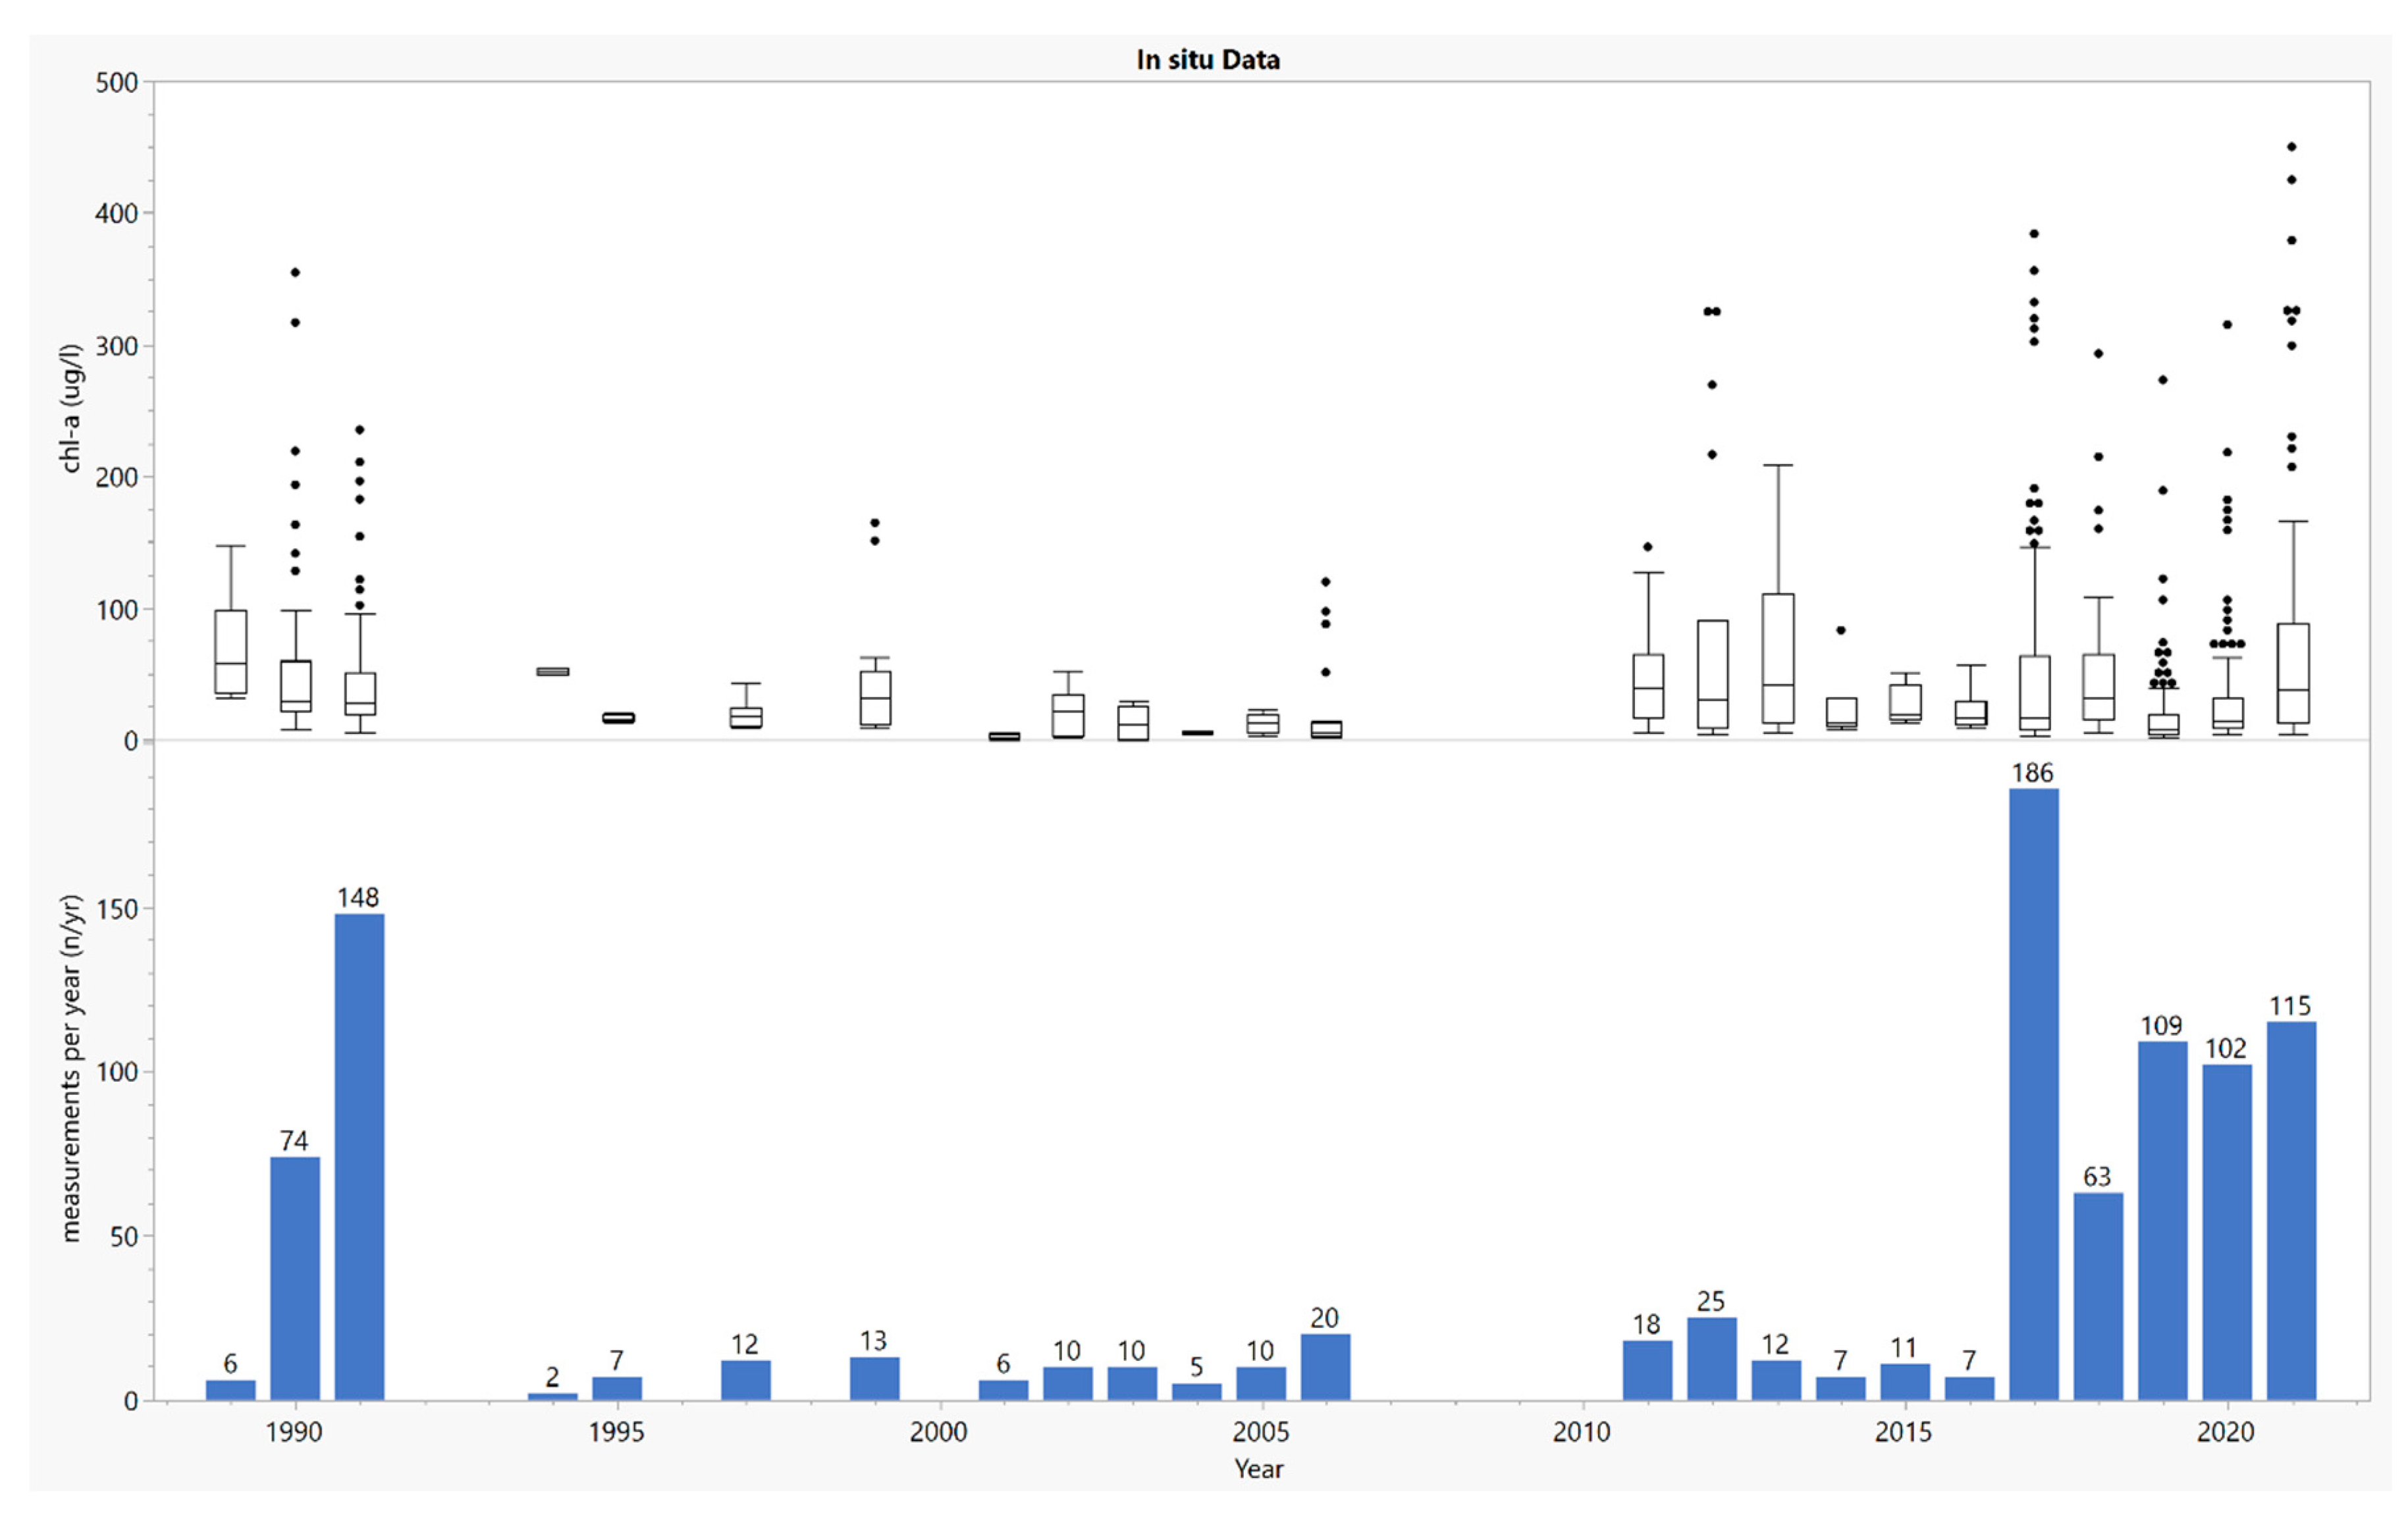
Figure 3 shows that most of these data were collected since 2017. Two outliers with values of 503 and 905 µg/L were excluded in the plot to preserve readability. The 99.5% quantile for these data is 427.63 µg/L. The boxplots (top panel) suggest that the concentration of chl-a is increasing over time, with larger interquartile ranges on the boxplots and large outliers indicating increased variability. However, there is sampling bias in these measurements. Later samples focus on areas prone to algal blooms and higher chl-a concentrations, such as Provo Bay. Recent studies show that chl-a concentrations in the lake, with the exception of small areas of Provo Bay, are decreasing over time [28,30].
Figure 4 shows the distribution of chl-a concentrations and statistics for measured values that have near-coincident satellite pixels. These data have a usable Landsat pixel available within the 5-day (120 h) offset (Figure 4). This resulted in a dataset with 531 samples, amounting to about half of the original dataset. These data have a maximum value of 503.3 µg/L and mean and median values of 36.9 and 17.75 µg/L, respectively. The quantile plot and information (Figure 4) show that 99.5% of the data are below 337 µg/L. The data are right-skewed. Most sample concentrations are relatively low, with rare episodic events exhibiting high concentrations (i.e., blooms). The 75th percentile concentration is only 42 µg/L, which is less than 10% of the maximum. The episodic nature of the high concentration data is shown in the relatively large skew and kurtosis values, which match our expectations for algal blooms.
Figure 5 depicts the in situ measurements plotted against the absolute value of the offset (in hours) between the in situ measurements and their nearest Landsat image. The absolute offset value includes in situ data collected either before or after the satellite passed over. The dividing lines occur at 12 h increments until 72 h (3 days); then, they occur at 24 h increments to 120 h (5 days). In between each line is a number indicating the number of pairs that occurred in that interval. Figure 5 highlights the relationship between Landsat collections and field work. Landsat collections occurred at 10:30 am local time. The plots show that field data are often collected in the mornings, with data clustered around 24 h (1-day) offsets. This plot shows that our in situ data were generally collected within a few hours of 10:30 local solar time. The clusters show that the data from the “morning” sampling trips were collected about two and a half hours before and after the satellite’s overpass, or from about 8:00 am to about 1:00 pm, a pattern we followed in our own water-sampling campaigns. This morning sampling pattern is clearly presented in Figure 5 with sample clusters at 24, 48, and 72 h, wherein the dividing line represents the time splitting the data clusters. While in this study we maintained multiples of 12 for our offset, we recommend that each researcher should carefully examine examine their data, and potentially use offsets other than 12 h intervals. For example, the 30 h window includes data within a cluster of samples that would otherwise be excluded by 24 h window (Figure 5). These samples were only a few hours beyond the 24 h mark, and the inclusion of these samples significantly increased the size of the available data. In other words, in Figure 5, a cutoff of 30 h keeps the entire cluster of pairs around the 24 h mark rather than only the pairs to the left of it. In subsequent computations, we limited data to an offset of 3 days, or 72 h, for model development; however, we also present models with smaller offsets.
Table 2 provides the number of pairs in an offset period and the mean, median, and standard deviation of the values in the period. It also provides the cumulative number of data pairs that were used for model development, along with the cumulative statistics. The last line presents the statistics for all the data, which is a subset of the information provided in Figure 4. The cumulative mean matches the mean of all the data, while the cumulative standard deviation is slightly different due to rounding errors. The data in the different time slices along with the cumulative datasets show variation, wherein mean, median, and standard deviation values clustered around the values for the entire dataset. We compared the data in each 6 h offset bin using both a Student’s T test and the Tukey–Kramer test for unequal size groups. The resulting comparison shows that there was no significant difference among any of the bins at an α level of 0.01.
We acquired the near-coincident remote-sensing data used in this study using GEE [37] from the Landsat 5, 7, 8, and 9 missions included in the Collection 2 data generated by the USGS. These datasets have the following GEE image collection identifiers: LANDSAT/LT05/C02/T1_L2, L2LANDSAT/LE07/C02/T1_L2, LANDSAT/LC08/C02/T1_L2, and LANDSAT/LC09/C02/T1_L2, respectively. The collection identifiers include the overall mission (LANDSAT), the satellite (LT05–LC09), the collection (CO2), and the processing level (T1_L2). While Landsat 5 and Landsat 7 have the same band designations [11], Landsat 8 has different band designations (Table 3). We mapped the bands to a common set of names (Table 3) and combined the Landsat datasets into a single image collection using GEE.
We used the calibrated surface reflectance data from the USGS Level 2 Collection 2 Tier 1 data [38,39], thereby eliminating the need to perform atmospheric corrections. The USGS produces three data tiers; for this dataset, tier 1 (T1) meets geometric and radiometric quality standards, and Level 2 data correspond to data that are calibrated and ready for analysis.
Using GEE, we generated an image collection from all the images from Landsat missions 5, 7, 8, and 9 that included Utah Lake. However, since the coverage period of our in situ data ended in September 2021, we did not use any Landsat 9 images in this study. Data in the GEE image collections were stored as integers; we converted the integers to surface reflectance floating-point values using the USGS-supplied multipliers before analysis.
We used the quality assessment (QA) band to eliminate pixels that were clouded, had cloud shadows, or were otherwise contaminated and to identify water pixels [38]. For 30 m data, the pixels that contained the in situ measurement points needed to pass the quality-screening test. For the 90 m data, either all 9 or any of the 9 pixels in the 3 × 3 group nearest the in situ point needed to pass the quality-screening procedure to be selected. This method is similar to those described by Cardall, Tanner, and Williams [37].
The result of this process was a dataset containing the in situ measurement value, the offset in hours between the measurement and the pixel value, and the band values of the corresponding Landsat image pixels. We recommend collecting data at a large offset and filtering the data at the model-fitting stage to avoid incrementally collecting more data for larger time offsets.
We have provided Notebook1, which contains working code, to better describe and demonstrate the method. Notebook1 accepts a CSV file with date, location (in latitude and longitude), and a measurement value of any in situ data as input. It outputs a CSV file that echoes this input and adds columns with the offset information and the reflectance value for each of the satellite bands. Notebook1 is designed to select Landsat data but could be modified for other sensors.

2.3. Model Parameters

We used 6 Landsat bands (Table 3) corresponding to the blue, green, red, near-infrared (NIR), shortwave infrared-1 (SWIR1), and shortwave infrared-2 (SWIR2) regions. We did not use the surface temperature band as a potential model feature. Since we expected high chl-a values to be strongly correlated with warm temperatures, we excluded temperature from the model to avoid an overfit and poor model performance in non-summer months. Surface temperature may be an appropriate feature for some models, such as a seasonal model trained for summer months.
We generated potential features for the linear regression model that include: the Landsat bands (6), the inverse of the natural log of each band ( 1 / ln x ) (6), the natural logs of each band ( ln x ) (6), the inverse of each band ( 1 / x ) (6), the square of each band ( x 2 )   ( 6 ) , band ratios ( x 1 / x 2 ) (30), normalized band differences ( [ x 1 x 2 ] / [ x 1 + x 2 ] ) (15), and band pair multiplications ( x 1 * x 2 ) (15). We included the inverse and squared terms for the bands so that we could consider non-linear model relationships in a LASSO multi-linear regression. The inclusion of the 6 bands and all the engineered features resulted in 90 different potential features in the model. The use of other sensors, such as MODIS or Sentinel II, would result in a different number bands, band spectral range, and features.
Initially, we generated all the features for SWIR1 and SWIR2 bands. The resulting models preferably selected the inverse of these two bands as features. However, while the number of errors was relatively low, these bands are noisy and correlated with water temperature, which we intentionally did not include as a potential feature; therefore, these features will likely be excluded in models designed to achieve maximum performance. In the work reported below, we retained the SWIR1 and SWIR2 band features but did not include any engineered features using these bands, e.g., band inverses, band ratios, squares, or other features. We retained SWIR1 because some of the published Utah Lake models use SWIR1.

2.4. Negative and Small Reflectance Values

The USGS calibration process for surface reflectance data can result in the acquirement of negative values for the blue and SWIR bands over water, as water has low reflectance in these wavelengths. These negative values are not physically possible but are artifacts of data processing. In the coincident data pairs, with a coincidence window of 5 days, there were 16, 2, 37, 40, and 40 negative values for the blue, red, NIR, SWIR1, and SWIR2 bands, respectively. The values, while negative, have small absolute values. This occurs because water is highly light-absorbent in the SWIR range. Due to the high concentrations of suspended solids in Utah Lake, it is possible that light in the SWIR range can scatter back from suspended material if the scatterers are shallow enough, thereby providing the small values observed in the data. For instance, at 1640 nm (~SWIR1), the absorption coefficient for water is 6.35/cm [40]; thus, if light scatters back from 1 cm depth, only e−12.70 ~3 × 10⁻⁶ of the light that reaches that far will be reflected from the surface. Likewise, the SWIR2 band has an absorption coefficient of about 20/cm, which is generally higher throughout the bandpass [40]. Due to this high level of light absorption, the SWIR bands are very sensitive to any unremoved glint (from skylight or sunlight). Landsat level 2 reflectance data are highly optimized for land and are not corrected for glint from water surfaces.
Most physically based models (i.e., based on response of chlorophyll and accounting for other constituents in the water) use visible and near-infrared wavelengths (see, for example, [41]). For Utah Lake, suspended calcium carbonate and sediments are currently present in the upper portion of the water column, and these allow for the return of light; additionally, as noted, we retained the SWIR1 band because published Utah Lake models used this band.
We found that if we fit a model with these small, negative values (with bands set to a minimal positive value before computing inverses or logs), a few predicted chl-a values (fewer than 10 of the approximately 500-member dataset) consequently corresponded to large, negative values. We used an ad hoc approach to evaluate different methods to address this issue. For this study, we replaced extremely small or negative values reflectance for the blue, red, NIR, and SWIR1 bands with values of 0.01, 0.01, 0.001, and 0.001, respectively. Offset methods may be more appropriate in order to maintain original, small band values distinct from these changes. Data-cleaning operations are required and are specific to any given dataset. We recommend more advanced methods, such as an offset approach, but did not evaluate other methods for this study.

2.5. Alpha

The degree to which L1 reduces the number of model parameters is tuned using the α parameter, which computes the penalty function with a weighted combination of the fitting error and the sum of the absolute value of the model coefficients (Equation (1)). A larger α value increases the weight of the coefficient sum and results in fewer parameters in the final model, while a lower α value results in more terms as it favors a small error with less weight assigned to the number of features. At the extremes, an α value of zero retains all the potential model parameters, while a large α value results in a linear model that is a single constant, i.e., all coefficients are set to zero and the model is just a constant. In the latter case, the model error, which is the first term in the loss function (Equation (1)), constitutes the variance of the data (square of the standard deviation). This extremely large α value results in a model of the form of y ^ = c or causes the prediction to be a constant that is equal to the mean of the dataset.
We explore α selection in detail in the case study provided in Section 3.1. We suggest that practitioners compute the variance of their dataset and evaluate their coefficients’ magnitude for a full model (i.e., α = 0). This will provide some insight into the expected range of the α value. Conversely, using the scikit-learn library, one can quickly select different values of α and evaluate the results, thus enabling the simple identification of the range of α values that provides a model with the preferred number of terms.
This approach facilitates the exploration of a wide feature space. For example, a priori, we do not know if the best model is linear or non-linear. By including band inverses, logs of bands, and squared band values, we can use linear regression methods to fit non-linear models and allow the algorithm to determine which is the best method to model the data. We allow L1 regression to determine whether linear, non-linear, or a combination of both types of terms provides higher predictive capabilities while providing a parsimonious model where parameter contributions can be explored and explained. However, L1 regularization will generally discard correlated features, while the most informative model may include these correlated features. This is discussed in Section 4.

2.6. Model Training, Error Estimation, and Evaluation

For the case study, we used the default values to fit the scikit-learn Lasso model (with the exception of α, which we adjusted). We explicitly set the maximum interactions to 1000; this is also the default value. The Lasso model uses coordinate descent to minimize the cost function and fit the model [32]. We used k-fold cross-validation to determine model’s performance. Unless otherwise stated, we used 10 folds and 20 repeats. For each fold, 10% of the data were reserved as the test set, and the model was fit to the remaining 90% of the data; then, the accuracy was computed using the test data. This was repeated 20 times, with the data stochastically sampled for each fold. This resulted in 200 model realizations that were used to estimate the error for any given model. While it is common to use train–test–validate splits to develop and evaluate models, in this case, since the number of parameters and number of samples are similar, we used the k-fold approach as there was not a sufficient number of data to render the train–test–validate approach viable. For example, for a time offset of 12 h, there are 91 data pairs, which almost matches the number of potential features (90). In this case, 90% of the dataset equates to approximately 80 values, that is, the number in each fold, which is less than the number of total potential parameters.
We computed several error metrics, including the root-mean-squared error (RMSE), which we will generally use for reporting in subsequent sections. After evaluating model accuracy using k-fold cross validation, we generated the final model using the full dataset with no data reserved. We used k-fold analysis to select the model parameters and estimate error; then, we used the resulting parameters with all the data to develop an accurate but parsimonious model that could be used and explained.
We evaluated feature selection over a range of α values to determine if the features selected by the L1 algorithm were robust or if the selected features changed significantly with different α values or over the duration of the stochastic realizations. We evaluated feature stability by counting how many times each feature was selected for a model with a given number of parameters, wherein any of the models had at least 200 realizations. We present details of this analysis in Section 3.
After selecting the appropriate model parameters, such as α, and estimating the error, we then used the model, trained with respect to all the data, to evaluate the impact of coincidence time offsets on model accuracy. This analysis, presented in Section 3.3 and Section 3.4, provides practitioners with guidelines and methods for evaluating the trade-offs between data quantity and variation with time.

2.7. Code and Notebooks

We have provided example code in two separate Google Colab notebooks to help communicate the details of the methods we developed and provide readers with a starting point if they should choose to evaluate these techniques.
Notebook1 takes a CSV file of in situ measurements, including the measurement date, latitude, longitude, measured value, and maximum offset window, as an input. It outputs a CSV file that includes the original data, the measured satellite band values (currently, the Landsat series), and the offset time from the in situ sample to the satellite collection. Notebook1 uses the complete Landsat image collection (Landsat 5, 7, 8, and 9) with data from the early 1980s to the present. Notebook1 can be easily modified to obtain data from other collections such as MODIS or Sentinel 2.
Notebook2 reads in the data file generated by Notebook1, performs minimal data cleaning, and conducts feature engineering; then, it uses L1 regularization to generate a multi-linear regression model in either normal or log-space. The level of data cleaning is minimal, consisting of the removal of blank rows or rows where there are NaN values. Notebook2 performs a feature-engineering task that generates additional model features. The features are selectable by checkboxes, and choices include the following bands: log(band), inverse log(band), inverse bands, band ratios, normalized band differences, square of bands, and band products. Notebook2 can save a CSV file with all the measurements and features to allow a practitioner to use their own software or methods for model fitting. For accurate model development, we recommend a more in-depth data-cleaning step that is data-specific and not algorithmic.
Notebook2 generates a multi-linear regression model by regressing the features on the measured in situ data using L1 regularization. Both the offset amount (i.e., time window for coincident samples) and the L1 α value are selectable. Notebook2 also allows the features to be normalized or scaled using either min–max scaling or normal (z-score) scaling. We did not scale data or evaluate data scaling for this study.
Notebook2 provides some simple visualizations to aid model fitting and estimates model error using repeated k-fold validation with 10 folds and 20 repeats, which is easily changeable. It outputs a CSV file with the selected offset, pixel scaling (i.e., 3 × 3 or 9 × 9), number of data points used in the model, list of all the features used in fitting, parameter coefficients, and error estimates.

3. Case Study and Results

3.1. Impact of Alpha Selection

Figure 6 presents the parameter coefficients for the models created with α values (displayed on the x-axis) ranging from 1000 to 1 and from 100 to 1 × 10⁻² for the chl-a model (top panel) and log(chl-a) model (bottom panel), respectively. In Figure 6, each line represents the value of a coefficient for a model feature that has been selected by the algorithm. At large α values, most coefficients are zero, with the number and size of the parameter coefficients increasing with decreasing α values. Small α values weight error higher than feature count, resulting in more of the features being included in the model. These plots were made with 90 potential features and a 72 h (3 day) time window, thereby providing 402 measurements.
At large α values, which are displayed on the left side of both the top and bottom panels (Figure 6, top), most of the parameter coefficients are zero or low, as expected. As the α value decreases, both the number and value of the parameter coefficients increase.
The parameter coefficients for 1/NIR and 1/blue bands are the first parameters selected and do not reach zero until they are near larger α values. None of the other features are selected (i.e., the parameter coefficients become non-zero) until an α value below about 0.8 or 1 for the chl-a model or log(chl-a) model, respectively, when the coefficient for the 1/red and blue/NIR feature becomes non-zero for the chl-a model and log(chl-a) model, respectively. Additional features are added to the selections (i.e., the parameters are assigned non-zero coefficients) as the α value continues to decrease.
Figure 6 does not reach extreme α values allowing it to show models with all 90 features; this occurs at α values near 1 × 10⁻⁸, and such models are not realistic for a dataset of only 400 measurements. In this region, some of the features have large positive and negative offsetting coefficients, which are also unreasonable.
The bottom panel of Figure 6 shows the behavior of L1 regularization for a model that predicts the log of chl-a (log(chl-a)) content rather than chl-a content directly. Figure 6 shows that various features are added to the model at significantly lower α values compared to the direct chl-a model. This is in part because the absolute value of the error is lower in the L1 algorithm because the log of the values is significantly smaller than the values themselves.
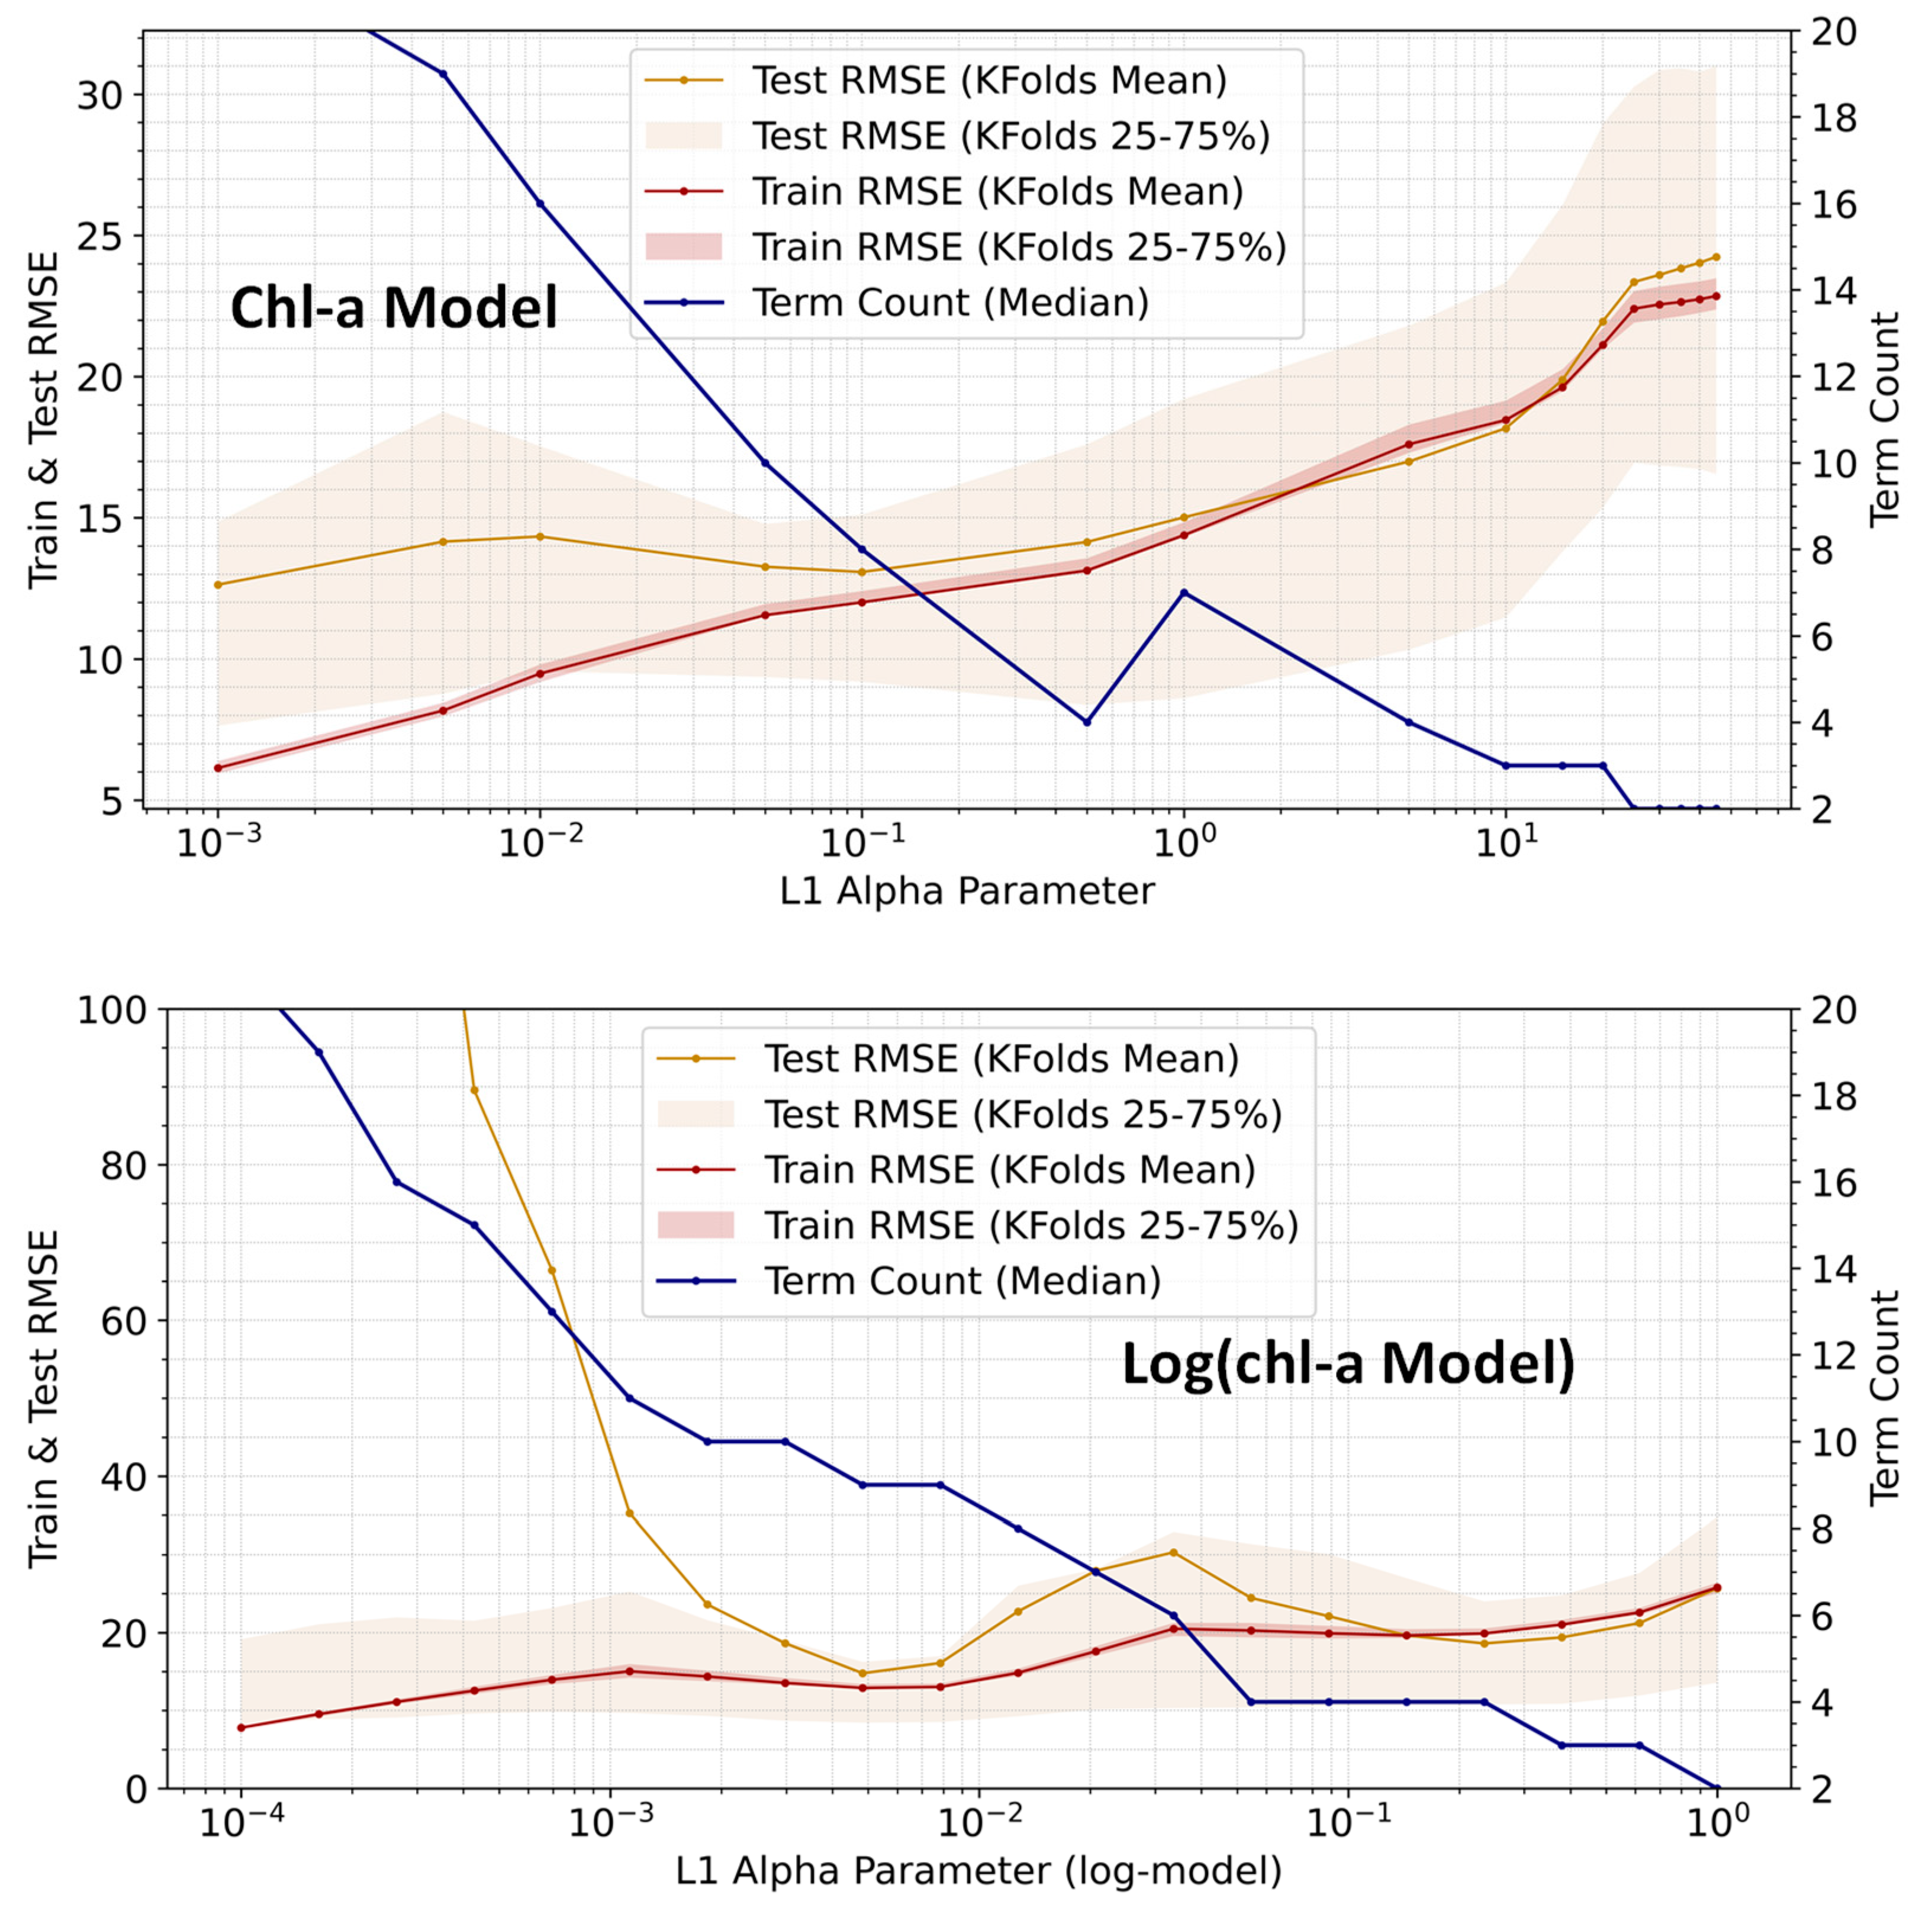
We evaluated the accuracy of the models with different α values and used k-fold validation to estimate errors (Figure 7). For this analysis, we used data with an offset or time window of 12 h. We used ten folds with 20 repeats to compute error metrics for different values of α, which are shown as points on the graph; thus, the error estimates for each α value, or graph point, are based on 200 realizations. We evaluated both the direct chl-a model and the log(chl-a) model, which are presented in the top and bottom panels of Figure 7, respectively.
Figure 7 graphically presents the results and trade-offs of different α values for the chl-a and log(chl-a) models in the top and bottom panels, respectively. These figures show the mean RMSE of the training and test datasets and the mode of the number of model terms vs. α. The standard model uses α values from 0.001 to 50, while the log(chl-a) model uses α values from 0.0001 to 1. There are 200 stochastic realizations for each data point. The shaded area in the plot represents the 25th and 75th quartiles and shows the variability of the test error metric over the 200 realizations. For small α values, the mean of the error is well outside the 75th percentile. This is because a few of the 200 realizations have very large errors and skew the dataset. Both models behave as expected, where the test data error is initially very high—indicating overfitting—and then reduces to a value similar to the training error (Figure 7). The training error has significantly less variation for all the realizations compared to the test error, as shown by the width of the shaded area.
For both models, chl-a and log(chl-a), the variance in the test error increases with an increasing α. A great deal of this behavior can be attributed to the small size of our dataset. For a time offset of 12 h, there are only 82 measurements. With 10 folds, that means that the test dataset has only 7 or 8 values, leaving the training datasets with about 70 values. These data have a mean of about 30 and a standard deviation of about 60 (Table 2); therefore, there was significant variation in the test data for any given realization. These plots show general trends, but the variation in the test error for any given realization is large, with the shaded portion, itself large, containing only half (~100) of the 200 realizations for each data point on the graph. However, the variation in the error computed for the training data is relatively small, indicating little variation over the 200 realizations.
The chl-a model plot indicates overfitting until about the middle of the plots; then, both the training and test errors become similar and increase with decreasing α values. Figure 7 shows that as α increases, the number of retained features (blue line) decreases, as the former places a higher penalty on the sum of the coefficients. The model with the fewest terms has the highest RMSE as the model moves towards predicting a constant.
For the chl-a model, the difference between training and testing also decreases until an α value of about 1.0, at which point they become similar, and there are four to six terms retained for the model. At this point the errors are similar and increase with increasing α values as the model essentially only predicts the mean of the test or training dataset.
The bottom panel of Figure 7 shows the results of the log(chl-a) model, which has similar trends but presents a larger gap between the testing and training datasets at low α values. For this dataset, the log(chl-a)-model indicates clear overfitting at small α values, with less overfitting as α increases. One interesting aspect of this plot is that at low α values, the mean RMSE is well outside the 75th percentile (even more so than in the top panel). This occurs because the dataset includes three large values; if these three values all appear in the testing data, the resulting model can be severely overfit with respect to the low values. The 200 realizations produced a few models with very large, unrealistic values for these few cases, which resulted in a very large mean value, though only for a few realizations; over 50 % of the realizations (between the 25th and 75th percentiles) are close to the test dataset error.
Table 4 summarizes the impact of α values on the number of terms in the model. This table was generated using all the data with a 72 h offset rather than the 12 h offset used in the plots. The RMSE was also computed using all the data (i.e., the training data). The number of terms in the model drops to five when α is equal to twelve and does not drop to four until α is five for the chl-a model. While not shown in Figure 7, the variation in the number of coefficients is small.
We have not provided a suggested range or value for α because the correct value depends on the variation in the target data, the range of the parameters, and the number of parameters in the final model. However, the mean value of the dataset can provide insight into the ranges to explore for determining the value of α. Evaluating the dataset’s mean and variation through Equation (1) can provide some guidance. For example, if the dataset variation is in the 10s of units, e.g., 50 µg/L, and the expected features have coefficient values in the range of 0–1 and we want five parameters in the model, then the sum of the five coefficients needs to be in the same order of magnitude as the variation in the dataset. In this case, an α of 1 would assign approximately equal weight to the prediction error and the coefficients, while an α value of 500 would probably result in a model with only a single constant. However, depending on the range of feature values, coefficient values are frequently less than 1, which would require a larger α value to generate a model with five features. For this example, you could use an iterative approach with α values in the range of 1 to 100 to determine which α values result in a five-term model.

3.2. Model Terms and Stability

We evaluated the stability of the terms selected by L1 regularization. Specifically, we were interested in whether the realizations generated for the stochastic k-fold analysis would select the same equation terms with different coefficients or if each realization would select different terms. We found that the features selected by L1 regularization remained relatively constant with very little variation, for which old features were retained and new terms were selected as α decreased.
Figure 8 presents heatmaps for the chl-a (top panel) and log(chl-a) models (bottom panel), displaying the number of model terms selected (y-axis) versus the selected features (x-axis). We used k-fold realizations to generate this plot, for which there were 200 realizations per α value. The values for any given feature number are based on several hundred to a few thousand realizations, as a range of α values may result in the same number of features. The features in each panel are ordered by the percentage of time, or probability, that the feature was selected in any model, with the most-selected features depicted on the left. The color and number in the box reflect the probability that a feature was selected in the realizations. For each realization, we determined the number of features in the resulting model and which features were selected. We then computed, for any given feature count, the probability that a given feature was selected. The number of features is somewhat variable for a given α, and a range of α values can result in models with the same number of terms, which means that for any given feature count, there were at least 400, usually significantly more, realizations. Figure 8 shows that while there is some variability in the terms that were selected, in general, once a term was selected at a low feature count, it was retained in models with higher feature counts. For a given feature count, the selected terms remained consistent.
In the first row of the heatmap for the chl-a model (with a median feature count of 25), 25 of the most probable features (columns) were selected 100% of the time. For the next row, consisting of 24 features, 17 features were selected over 90% of the time, while 7 other features were selected over 80% of the time. As the number of terms in the model decreases (increasing α), so does the number of features, and the features that are selected are selected over 90 to 100% of the time, while other features are rarely chosen.
Figure 8 shows that the first two features, 1 ρ N I R and 1 ρ b l u e , for either model are selected over 80% and 90% of the time in any model for the chl-a and log(chl-a) models, respectively, with either feature being selected 100% of the time for most feature counts. Other features are similar, with the next two features for either model being selected 100% of the time for the log(chl-a) model, while there is slightly more variation for the chl-a model.
For actual model development, this type of analysis should be performed, and modelers should consider which parameters should be included in the final model.

3.3. Impact of Time Coincidence

We used both the chl-a and log(chl-a) models with α values of 0.5 and 0.04, respectively, to analyze the impact of coincidence measurements or the offset between when satellite and in situ data were collected. We used k-fold validation with 10 splits and 20 repeats to compute the RMSE error (Table 5). A time offset impacts a model in two different ways. For samples taken later in time, it is likely that conditions have changed, which generally tends to decrease the accuracy of the models, but with an increasing time window there are more in situ–satellite measurement pairs, which generally increases model accuracy, and the tradeoffs between these two processes are not obvious. Accordingly, it is often unclear which offset should be used to develop the best model; is it better to have more representative data (i.e., small offset) or more data (i.e., large offset)? We present the results of different offsets to provide insight into how our dataset behaved. Care should be taken when interpreting these results, as different datasets will behave differently from our example.
We obtained an extensive dataset that contains over 500 in situ measurements. Table 5 shows that as the window size decreases, the number of data pairs also decreases, changing from 388 to 55 data pairs for time windows of 72 to 6 h, respectively. Even with a short window of 6 h, we have 55 data points, which is more than many published studies.
For our data, the RMSE decreases from about 28 to about 12 and about 35 to about 11 for the chl-a and log(chl-a) models, respectively, as the time window decreases from 72 to 6 h, i.e., 388 to 55 data pairs. The largest time window, 72 h, has an RMSE larger than the RMSE of the smallest offset, 6 h, by factor of about 2 to 3 for the chl-a and log(chl-a) models, respectively.
Table 5 has implications for model developers. It shows that the tradeoffs between the data collected coincidentally or near-coincidentally and the number of data points available for model fitting can significantly affect the error. In our case study, we have a very large number of available in situ measurements, over 500, which means that we have sufficient data for the models (even with small time offsets). For many locations, this may not be the case. Many published studies use 10 measurements or fewer for model development but generally have measurements taken within a few hours of the satellite collection.
Our results imply that the use of a 12 h offset for our dataset resulted in the best model. This model is slightly better than the model created with data pairs from a 6 h offset. In addition, since we used a k-fold validation with 10 folds, we computed errors using models trained on only 90% of the available data. Utah Lake is large and subject to wind disturbance, which can rapidly change algae distribution, so a shorter window may be more important for Utah Lake than for other locations. For lakes that are more protected or smaller, a larger time window might be appropriate, especially if data are limited, and a larger offset allows more data. Rather than making a recommendation on an appropriate time window, we see this work as a guide that practitioners can use to conduct similar evaluations.

3.4. Pixel Resolution

We evaluated the impact of satellite data resolution on the development of a model used to examine Utah Lake. In prior sections, we used data with 30 m resolution, which is the default resolution of Landsat data. However, when evaluating non-coincident data, others [15] used 90 m pixels computed by the spatial averaging of the Landsat data to reduce variation or noise. They reasoned that since the data were not acquired coincidentally with satellite collection, using spatially averaged data may help reduce the impact of local variations. To evaluate the impact of 90 m data, we averaged a 3 × 3 Landsat pixel array around each in situ measurement location. Our algorithm provides averages even if all the pixels were unusable because they were occluded by clouds, cloud shadows, or other data quality issues. For example, some computed averages may consist of fewer than nine measurements. In general, this 90 m dataset presented a small increase in the number of data pairs for any given time window, as some of the in situ measurements had low quality pixels at the measurement location but usable pixels within the 90 m area.
Table 6 shows the impact of using averaged data for the chl-a models developed with offsets from 6 to 72 h and an α value of 0.50. We used k-fold validation with 10 folds and 20 repeats to compute RMSE from the testing data. For most offsets, there are a few more data pairs in the 90 m dataset. For most time windows, the 90 m dataset produces a slightly smaller error, although this is not the case for all of them. In general, the errors are essentially the same, except for time windows greater than 42 h, where the error for the 90 m dataset is slightly larger.
Table 7 and Table 8 show the impact of the α values on the number of terms and RMSE values for the 30 m and 90 m datasets, respectively. We did not use k-fold validation on these data but computed the error for the entire dataset. This resulted in slightly different values than those shown in Table 6. The 90 m data consistently resulted in models with fewer terms than the 30 m models, for which slightly different RMSE values, both higher and lower, were obtained for the chl-a and log(chl-a) models, respectively. While the number of terms may be significant, the difference in RMSE is within the expected variation of the data.
The use of the 90 m data rather than the 30 m data resulted in slightly better models, for which there were fewer terms for a given α value and similar RMSE values. We attribute this finding to the fact that in situ measurements are point values that may differ from the average value over a pixel measured by a satellite. In addition, due to winds and currents, algal blooms can move between the time the sample was taken and that of the satellite overpass. In both cases, the 90 m data capture a greater degree of variation, though with less precision. Hansen and Williams [15] suggested using 90 m data; while our results agree with this suggestion, they also show that users need to evaluate their data to determine the impact of using average pixel values versus single pixel values for model development.

3.5. Model Comparisons

For this analysis, we generated both chl-a (Equation (2)) and log(chl-a) (Equation (3)) models using a time window of 12 h, which provided 24 h of data. These models were generated using all the data, with no data reserved for error analysis. Errors were computed for all the data (i.e., training data). We used α values of 0.5 and 0.04 for the chl-a and log(chl-a) models, respectively, which yielded four or five model terms plus the intercepts for the chl-a and log(chl-a) models, respectively. For all these models, chl-a concentrations are provided in µg/L. As these are regression equations, the coefficients for each term in the model have the correct units with which to be converted to µg/L; however, for conciseness, we did not assign units to the model coefficients.
The chl-a model that uses an α value of 0.5 and the data within 12 h of the satellite collection is defined as follows:
c h l a = 3.03 + 2.10 1 ρ b l u e 3.731 1 ρ g r e e n 0.0139 1 ρ N I R + 0.016 ρ b l u e ρ N I R
where chla is the chl-a concentration in µg/L and ρ x represents the mean Landsat Level 2 reflectance from band x.
The log(chl-a) model generated using an α value of 0.04 and incorporating the data within 12 h of the satellite collection is defined as follows:
ln ( c h l a ) = 3.66 + 0.84 ln ( ρ N I R ) + 0.052 1 ρ b l u e 0.0438 1 ρ r e d + 0.005 1 ρ N I R 0.257 ρ b l u e ρ N I R
where chla is the chl-a concentration in µg/L and ρ x represents the mean Landsat Level 2 reflectance from band x.
The models have three shared terms that appear in both models. The three shared terms include two band inverse values, 1 ρ b l u e and 1 ρ N I R , and a band ratio, ρ b l u e ρ N I R . The chl-a and log(chl-a) models have unique band inverse terms of 1 ρ g r e e n and 1 ρ r e d , respectively, while the log(chl-a) model also has an ln ( ρ N I R ) term.
Matthews [42] conducted an exhaustive literature search of water quality models. The models he selected were not explicitly developed for optically complex waters, though a few might have been. He reported 18 different models for estimating chl-a concentrations and these models included 14 different terms, with half of the terms (7) being used only by a single model and not by any of the other models. The most common terms, which were used in more than one model, were blue, green, red, and NIR bands, which were used in nine, six, four, and three models, respectively. The SWIR1 and SWIR2 bands, along with the ratio of the blue and red bands ( ρ b l u e ρ r e d ), were used in two different models. Matthews [42] only specified if a band, band ratio, or a log of a band or band ratio was included in the models. Therefore, the reported bands could have been band inverses (i.e., 1/band). If this is the case, then the band ratio terms and the ρ b l u e ρ N I R terms from our models match the reported bands, with only the ln ( ρ N I R ) term not reported in this study.
Hansen and Williams [15] published three seasonal models specifically for Utah Lake. These models were developed either using all available data or data from specific seasons. The investigated hypothesis was that phytoplankton populations change with seasons and present different spectral signatures. These models consisted of a whole-season (Equation (4)), an early-season (Equation (5)), and a late-season (Equation (6)) model. All three models estimated ln(chl-a):
ln ( c h l ) = 1.53 + 2.55 ρ N I R ρ b l u e 1.15 ln ( ρ b l u e )
ln ( c h l ) = 14.23 + 9.33 ρ g r e e n ρ b l u e + 0.003 ρ b l u e 0.004 ρ S W I R 1
ln ( c h l ) = 7.33 0.004 ρ b l u e 0.05 ρ g r e e n ρ S W I R 2 + 0.01 ρ r e d ρ S W I R 1
where chla is the chl-a concentration in µg/L and ρ x represents the mean Landsat Level 2 reflectance from band x.
In these three models there are nine unique terms, with only the blue band shared between all three models; none of the other terms are shared. The ρ N I R ρ b l u e ratio term is in both our models and in the whole season model [15]. Our models both include a 1 ρ b l u e term, while their models include ρ b l u e or ln ( ρ b l u e ) terms, which are similar. These Utah Lake models share the blue and SWIR bands with those reported by [42] but share none of the other terms.
These comparisons show that the terms selected by L1 regularization are commonly used in published chl-a models. However, our approach allows the model to select terms that are generally not considered for model development, such as the log of band values.
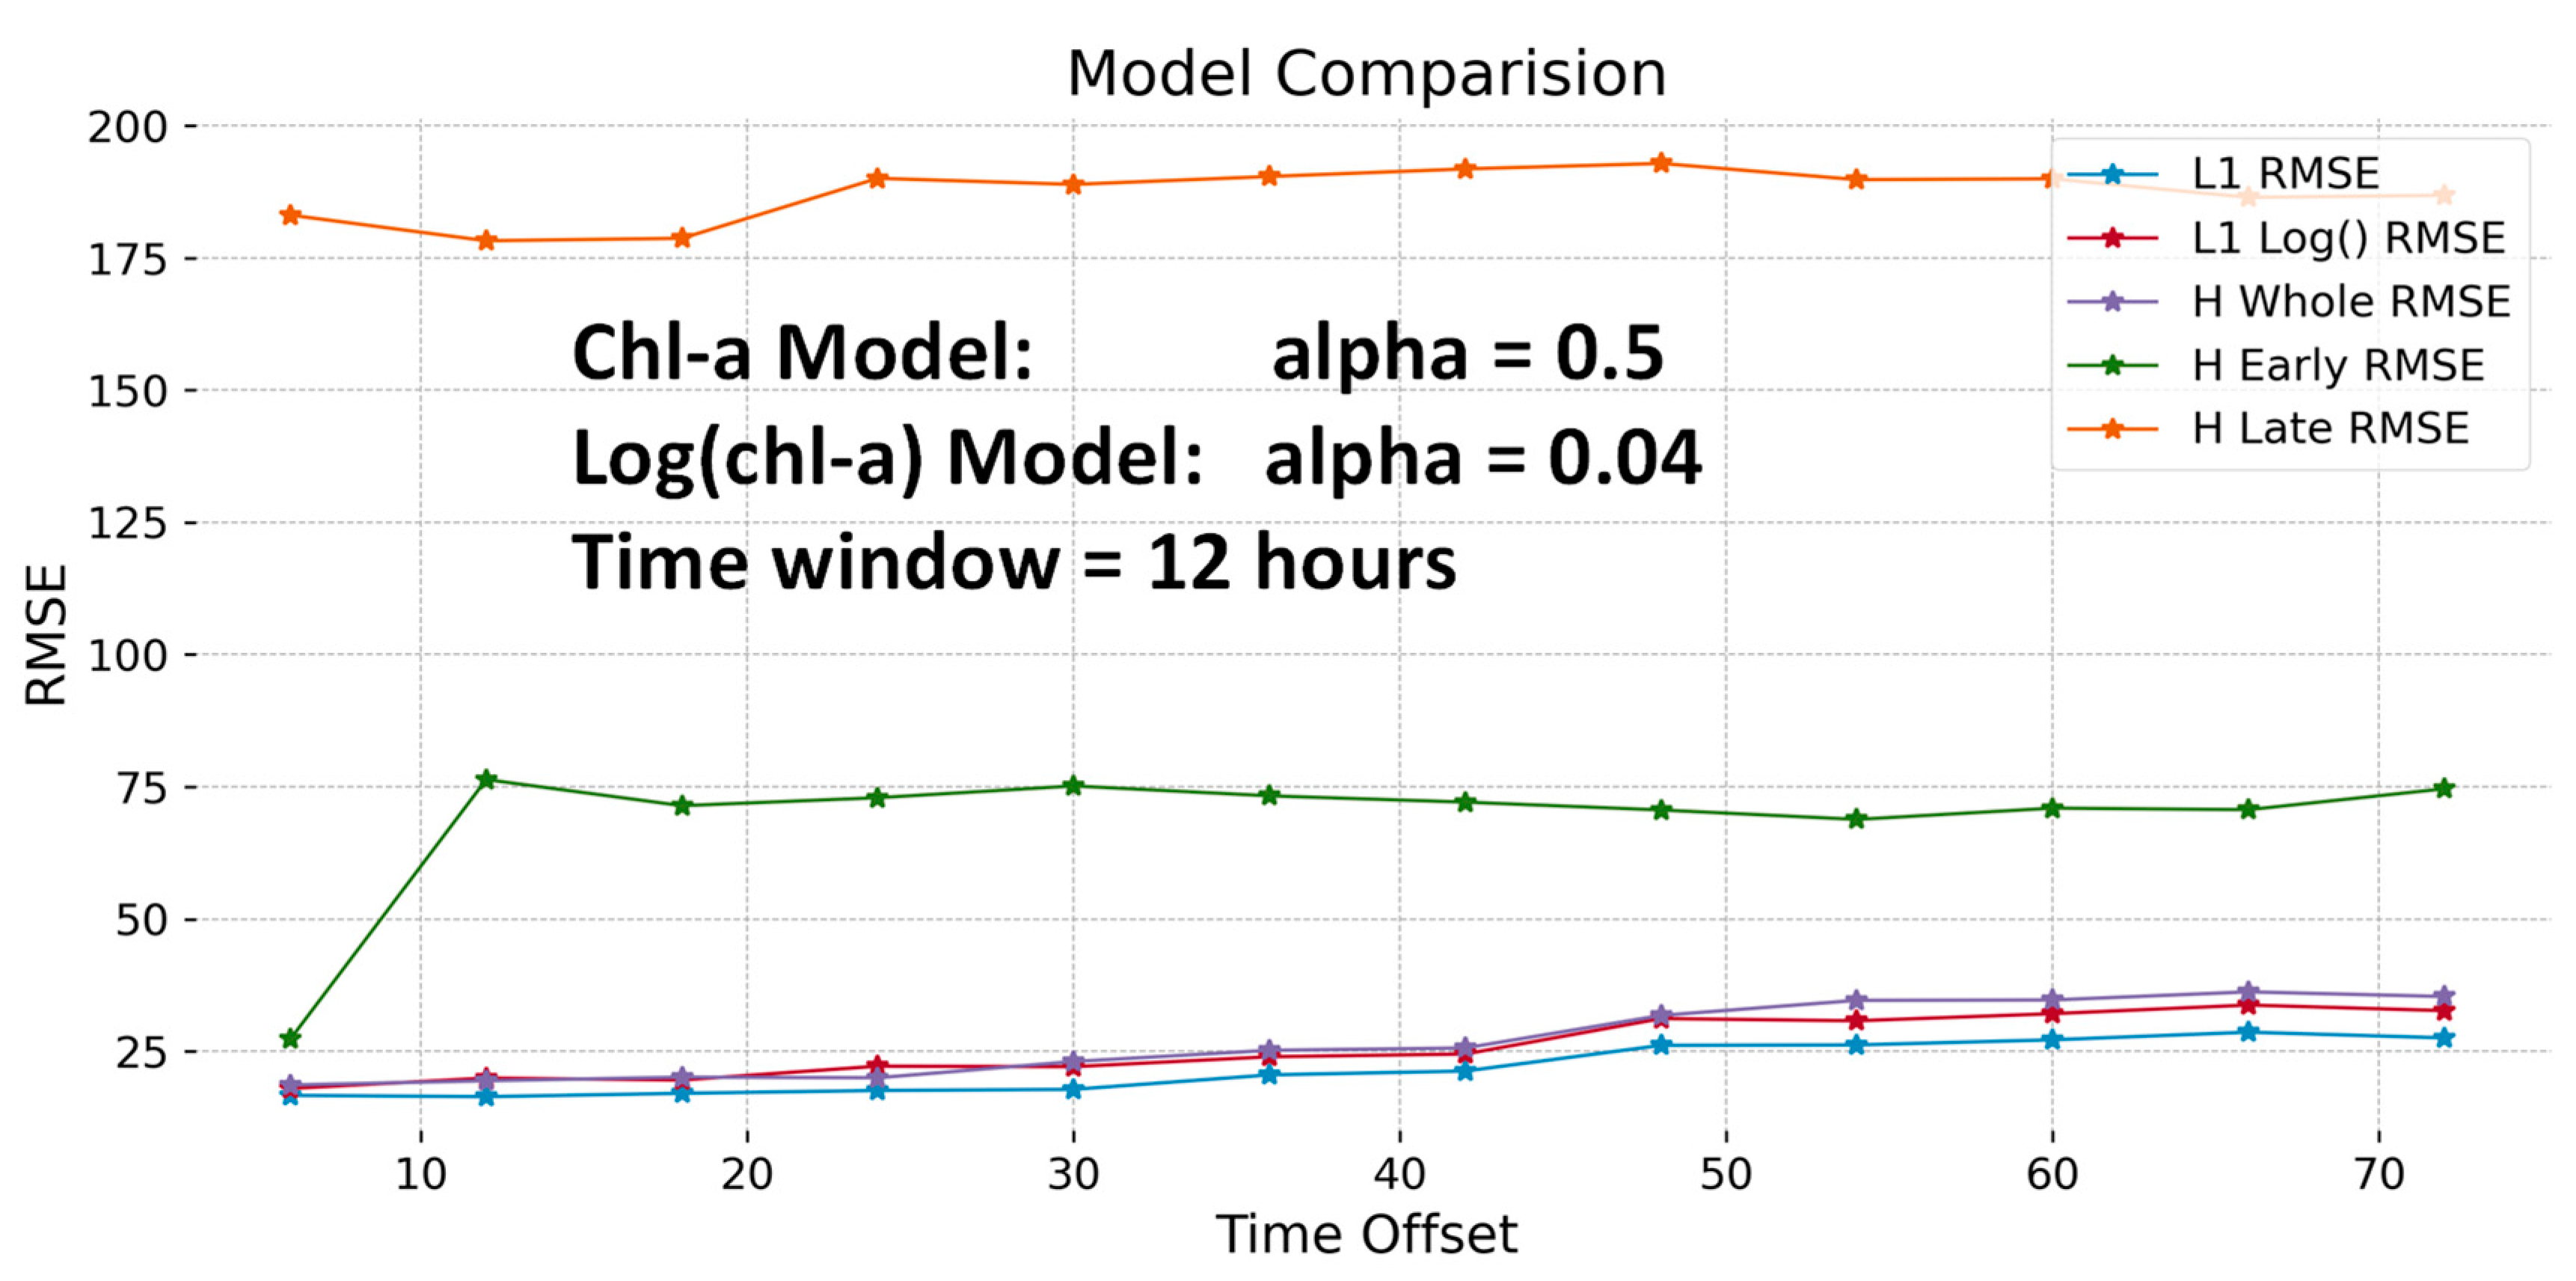
Figure 9 compares the errors of our L1-created models and the models developed by Hansen and Williams [15]. Figure 9 shows the results from the L1 models that were trained using the data with a 12 h offset and α values of 0.5 and 0.04 for the chl-a and log(chl-a) models, respectively. We applied the L1-created Hansen and Williams [15] models to data with a time offset of 6 to 72 h. For the L1 models, this means that any data with time offsets of greater than 12 h had not been used in training and constitute a test set.
Figure 9 shows that both the L1 and L1-log models closely match, and are slightly superior to, Hansen and Williams’ [15] whole-season model and are better than the seasonal models. We did not fit L1 seasonal models for this paper nor did we compute errors for the Hansen models only concerning seasonal data, but we expect that the results would be similar. Hansen and Williams [15] showed that the seasonal models adequately corresponded to the seasonal data and outperformed the models generated on all the data; however, seasonal models are limited by the fact that there are often only very limited datasets for any given season. The L1 models trained on any given dataset generally perform worse than the whole-lake model on data from larger time offsets, though not always. As shown in Figure 9, if the L1 models are trained on the same data, they perform essentially the same as the whole-season model.

3.6. Optically Complex Water and SWIR1

Our goal in exploring the use of L1 regularization for the creation of remote-sensing models was to determine if this approach would be useful for optically complex waters where non-standard bands may be useful. Specifically, we sought to determine whether it would choose bands or other features that would not be selected based on the expected physics of the problem. Figure 10 demonstrates an example of where this might occur. For the following discussion, we have no ground truth, but the image supports our hypothesis.
Water has very high absorbance in the SWIR wavelength; therefore, its atmospherically corrected surface reflectance values are low. For example, at a wavelength of 1640 nanometers, which is about equal to that of the SWIR1 band for Landsat images, the absorption coefficient is 6.35/cm; thus, only about 0.01 (1%) of the light is reflected from a depth of ~0.36 cm below the water surface [40]. SWIR2 is similar but with a higher level of absorbance. This means that SWIR1 or SWIR2 can only interrogate a few millimeters of the top of a body of water. For this reason, these bands are not included in remote-sensing models for the chl-a concentrations in water. While our final model did not include either SWIR1 or SWIR2 bands, Figure 8 shows that the SWIR1 band is selected as the 17th and 12th most common parameter for all models for the chl-a and log(chl-a) models, respectively. The SWIR2 band is selected as the 14th and 11th most common parameter for all models for the chl-a and log(chl-a) models, respectively.
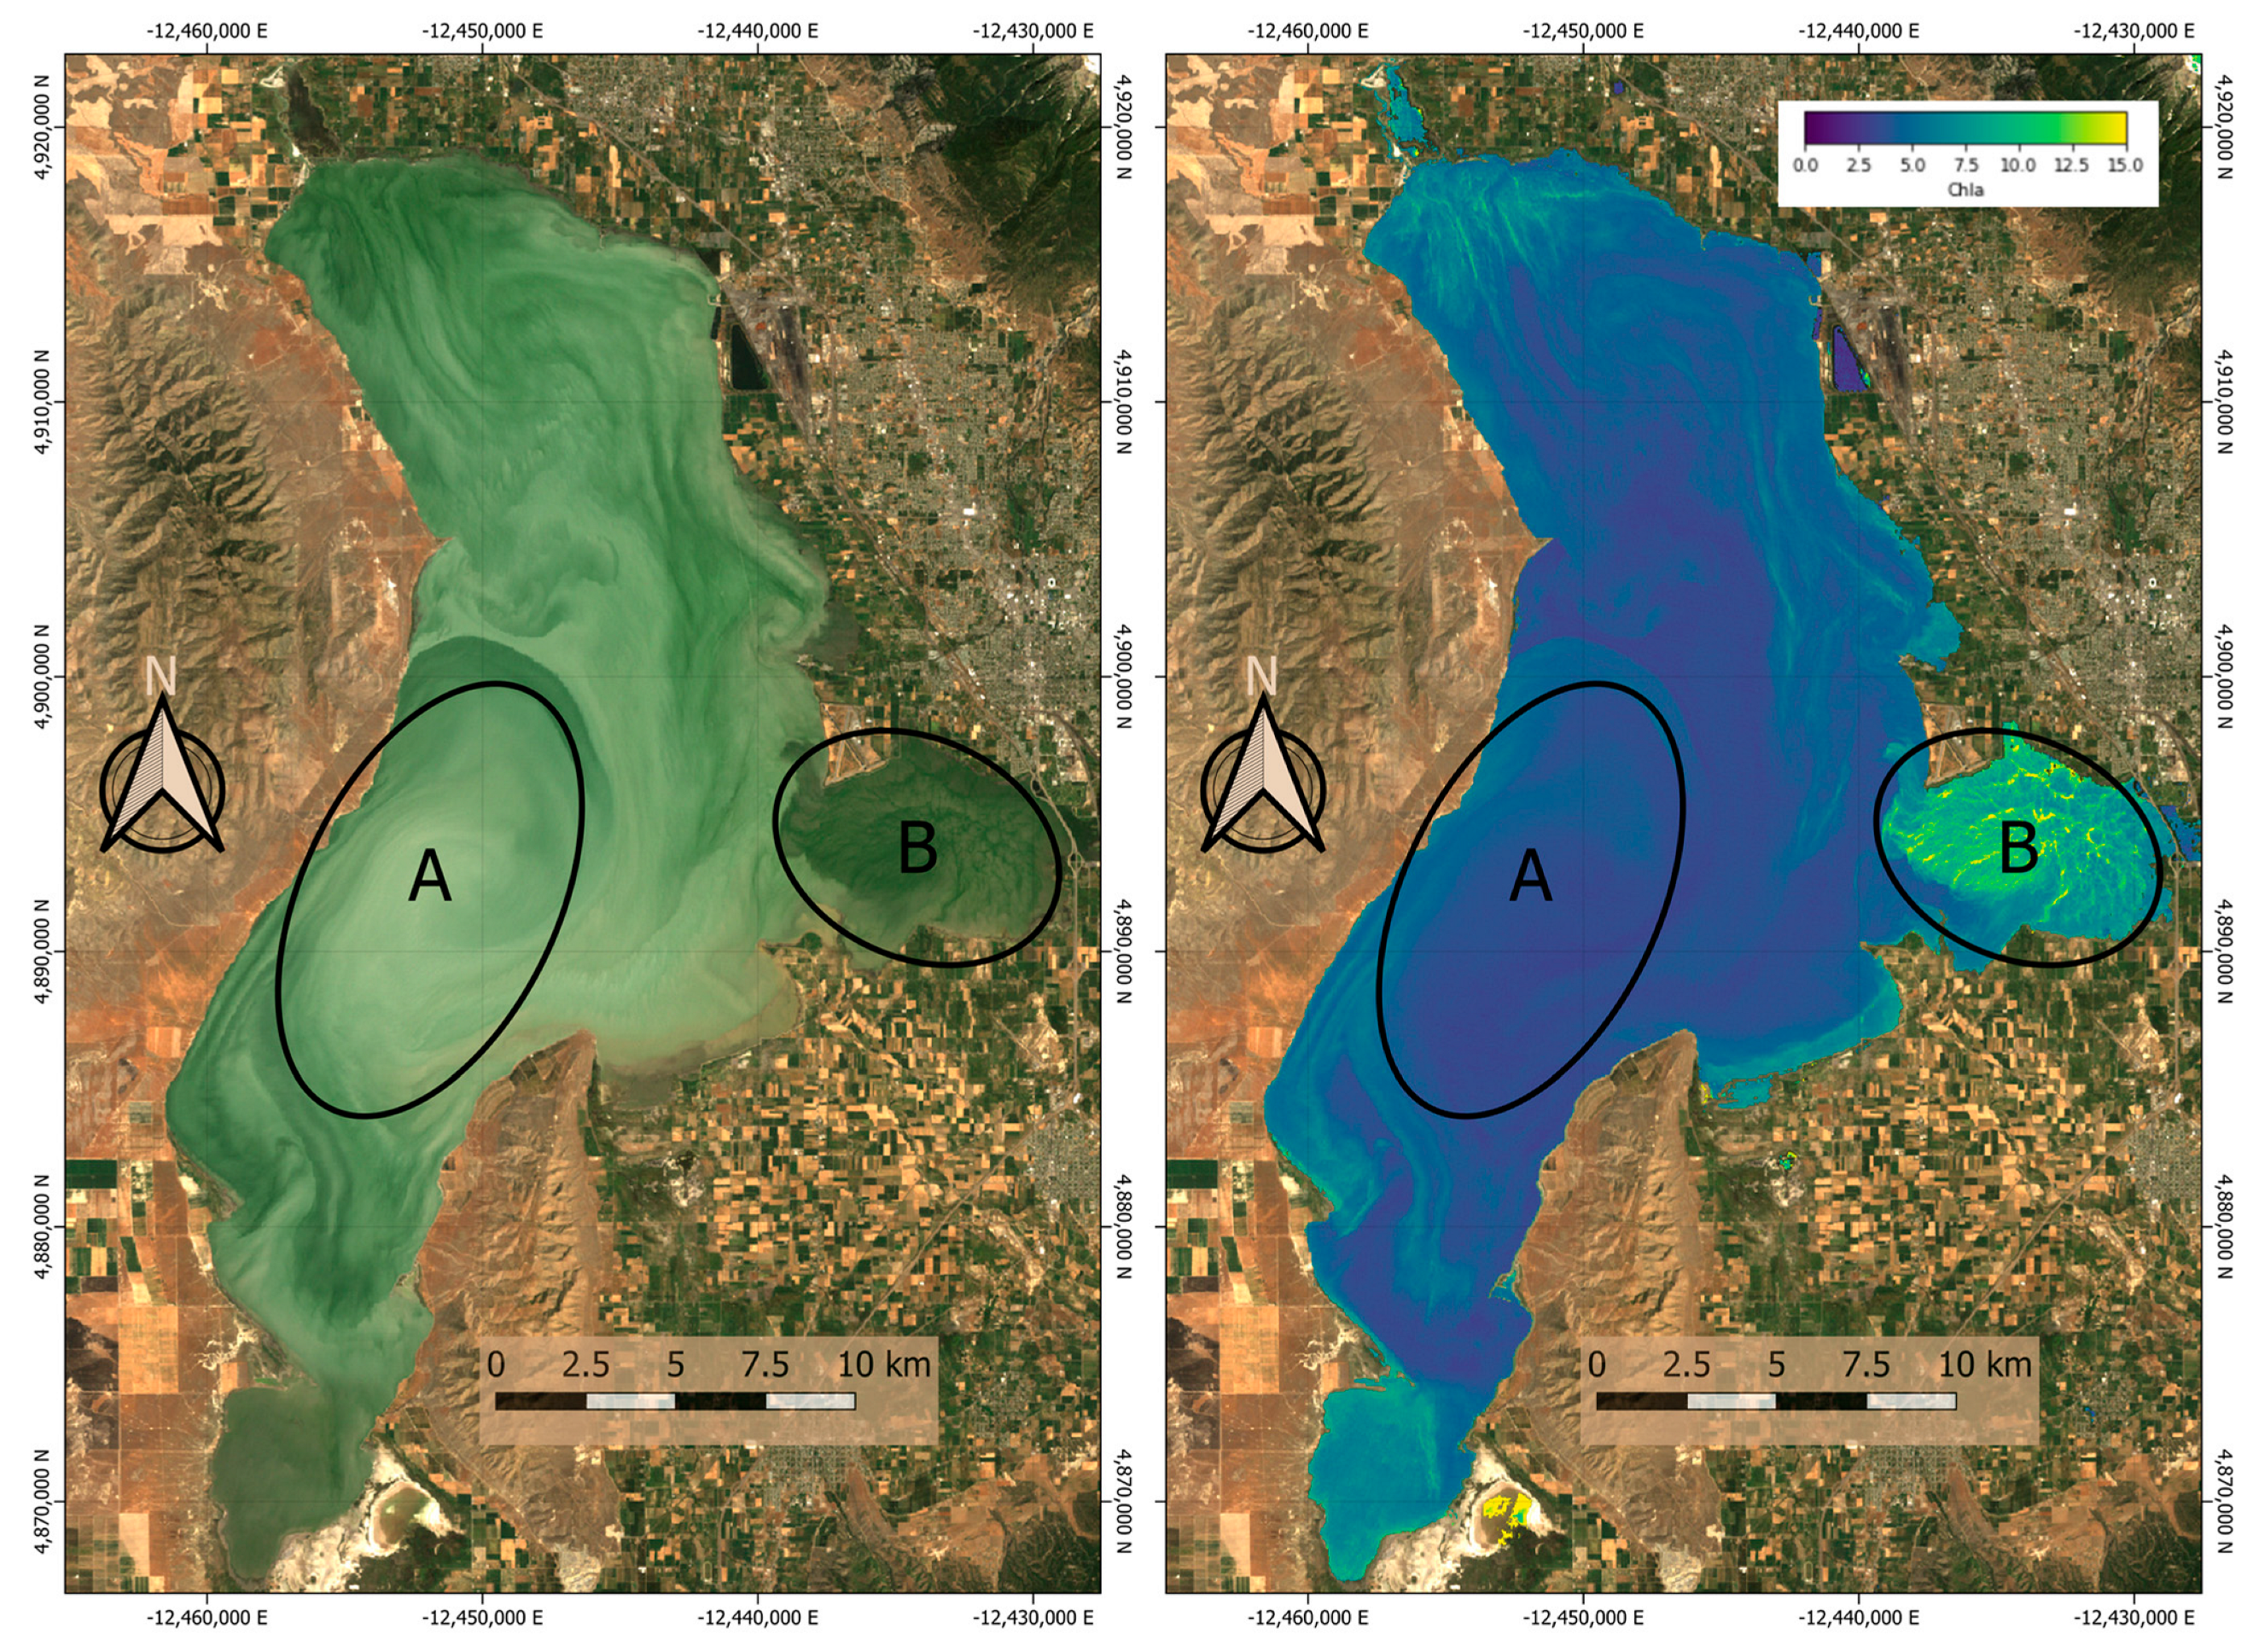
Figure 10 is an image based on the RGB Landsat bands from July 17, 1989, that demonstrates why a model created with L1 regularization might include the SWIR1 or SWIR2 bands. The left panel is a real-color image of Utah Lake. Area A contains a large silt plume precipitated by a recent storm. Utah Lake is shallow, with depths less than 3 m, and has a long fetch and reach on the order of 40 and 15 km, respectively. Accordingly, wind generates very large waves that suspend significant amounts of sediment (Area A). Area B is where Hobble Creek, a larger tributary, flows into Provo Bay. The water in Area B is relatively clear, as indicated by the darker color, as light is reflecting from the bottom of the bay. The right panel of Figure 10 shows the estimated chl-a concentration on the same date using the model given in Equation (3). This panel shows that Area A has a chl-a concentration of approximately 0, while Area B has a relatively high concentration, up to 15 µg/L. While we have no ground truth, the sediment concentration in Area A is high enough to reflect light in the SWIR1 and SWIR2 bands, while the relatively clear water in Area B does not reflect light in these bands. We have obtained field data with Secchi disc readings of less than 10 cm that support this idea that suspended sediments significantly affect the refection and absorption normally associated with water.
The model generated using L1 regularization may have selected SWIR1 and SWIR2 to differentiate between sediment plumes and algae plumes. In the left panel, Area A does have a “green” color that could be an algal bloom; however, the model clearly shows that there are no algae present in this area. In contrast, Area B appears to have relatively clear water in the image, but the model shows that its chl-a concentrations are significantly higher than those in the lake. This is an example of why models created with L1 regularization might select either the SWIR1 or SWIR2 bands, though we know that reflectance from water in these bands should essentially be zero.
Due to the high absorption of water in the SWIR1 and SWIR2 bands, it is easy to use this image as an example. We have surmised that similar issues are involved in the feature selection process for models with only a few parameters. As discussed above, the features selected by the L1 algorithm are similar to, but not the same as, most published chl-a models. We have surmised that this is because of the very optically complex nature of Utah Lake, where water does not look like water, as demonstrated in the left panel of Figure 10.
As an aside, Tanner, Cardall, and Williams [28] hypothesize that algal growth in Utah Lake is light-limited and that blooms do not start in the turbid mid-lake waters. Rather, they postulate that blooms generally start in the bays, where water is clearer and warmer, and then move out into the lake.

4. Discussion

4.1. L1 Regularization

Our goal was to evaluate L1 regularization to determine if it is an appropriate method for use in the exploration of a large parameter space. This is especially important in cases where the number of features or predictors (p) is similar to, or larger than, the number of observations (n). In many remote-sensing applications, there are a limited number of in situ observations, and features or predictors are typically chosen using prior understanding of the spectral behavior of the target features, such as chl-a concentrations. Other constituents in optically complex water can interfere with the spectral signatures of chl-a, so non-traditional terms might be useful for predictions.
Prior to performing this research, it was not clear if L1 regularization could be used for models wherein the number of potential features and the number of measurements were of similar magnitudes. Our model runs showed that an L1 model converges to the same set of features, even over a large number of realizations. This allows the model to explore the entire feature space. This is different than step-wise regression, where the order in which the terms are presented to the algorithm is important and the modeler is required to determine the order of importance of the selected terms.
L1 regularization evaluated model terms not commonly found in published models, though most of the selected terms were similar. In the beginning of our study, we noted that our initial search space included various engineered terms corresponding to the SWIR1 and SWIR2 bands. We found that despite these models’ low error metrics, they demonstrated significant noise when they were applied to the lake. Subsequently, we re-explored the parameter space without these features and generated better models. Based on this experience, we recommend L1 regularization for exploring large parameter spaces, followed by the performance of an additional exploration of the selected features. One of the strengths and weaknesses of L1 is that it selects features that are informative and excludes other correlated features that may be useful in a model. In this study, L1 selected the smallest number of features to achieve the highest predictive performance. This can result in an acceptable model but may also result in a less robust or efficient model. In general, L1 can be thought of as selecting features based on their interaction and main effects on the target variable. This can occur because the main effects are not as informative as the interactions. This can result in L1’s failure to select some useful variables. We evaluated our L1 models on multiple samples from the same dataset using the k-fold method and found that the sets of predictor variables that were returned were stable.

4.2. Significance of Temporal Coincidence and Spatial Resolution

We explored the impact of time coincidence and pixel resolution on model development using L1 regularization. Accuracy decreased and variability increased with increasing time offsets. We attribute this to the fact that the in situ data and the satellite collection data were measured at slightly different times, as conditions can rapidly change over a three-day period. We performed an evaluation using the average of a 3 × 3 (9) pixel grid to help mitigate issues associated with both spatial and temporal variances in algal distribution. We found that the 3 × 3 grid slightly increased accuracy but to an extent well within the variation computed using 200 k-fold realizations. For much of this paper, we used the closest single pixel and varying offsets. For modelers using this approach, both time offset and pixel average methods should be explored. Especially with regard to a time offset, there are direct tradeoffs with respect to the number of data pairs available for model development.

4.3. Data Engineering and Feature Selection

The L1 models selected features that have been reported in the published literature and performed very well, even with respect to the optically complex water of Utah Lake. For actual model development, the normalization of some or all of the engineered features may result in a more robust model. We minimally explored normalization with min–max and z-scores (both of which are available in the notebook), but we did not examine this in-depth because our research goal was to demonstrate the use of L1 regularization to explore large feature spaces for optically complex models and not to generate the best model for Utah Lake. Evaluating different normalization methods and determining which variables to normalize would have added significant complexity to this paper without adding any useful information, as most model builders are familiar with normalization and each application would be data- and site-specific. Another potential approach, which we did not explore, would be the use of offsets rather than minimum values for negative band values. This would retain relative quantities, while setting these low values to a minimum would not. We did not evaluate methods for addressing negative band values; as discussed in Section 2.4, we simply replaced the negative values of the blue, red, NIR, and SWIR1 bands with values of 0.01, 0.01, 0.001, and 0.001, respectively. This probably affected the models’ accuracy for low concentrations. Aside from normalization, another approach that modelers should consider is the offsetting of all the values by a amount. This would result in all positive values but have little impact on values above the median. This would also allow the L1 models to include features in these bands to help address complexity caused by the high concentrations of suspended solids, clays, calcite, and silts present in Utah Lake (Figure 10).

4.4. Model Creation

We have shown that L1 regularization can be used for remote-sensing models and to explore a feature space with a size similar to the data space, that is, where the number of features and number of observations are similar. It is an efficient model development approach, which is capable of generating hundreds of models on a desktop machine in just a few minutes. This facilitates approaches such as the use/development of seasonal models [15,43] and site-specific models that consider changing or complex optical characteristics. However, we believe that modelers should be careful when accepting the first model generated by the L1 methods. They should carefully evaluate input data and features. Techniques such as normalization or other data-cleaning methods may aid model development. After an performing an initial model evaluation in a very large feature space, it may prove beneficial to explore a smaller feature space. For example, one could eliminate the top features and determine if the model selects existing model features and a correlated feature that had previously been excluded. A single model can be generated almost immediately, so this type of exploration should be considered.
L1 regularization with data that have correlated informative features tends to select one feature and push the others toward 0. This results in a model that can omit significant informative features. L1 regularization will often choose more features than are required because of this issue. This can be gleaned by comparing the L1 model to the published models. Our L1 models have four or five features, while the published models have only two or three features.

5. Conclusions

The goal of this numerical experiment was to evaluate the ability of using L1 regularization to generate remote-sensing models using a large feature space. This is important because for most remote-sensing models, the availability of in situ observations is limited, often amounting to only a few tens of measurements. We also briefly explored the impact of non-coincident measurements and pixel resolution on model accuracy. We found that L1 regularization is a useful technique and can be used to explore large feature spaces. L1 selects features based on which features have significant interaction effects, and generally will not select two features that are highly correlated. This means that features that are directly correlated with the target variable may not be selected. The evaluation of this behavior is beyond the scope of this article, but it has been given an in-depth treatment in [44].
In addition to demonstrating the application of L1 regularization to feature selection, we provided an in-depth example of which types of analysis, visualizations, and other approaches modelers should use if they adopt this method.
In addition to the manuscript, we have provided two Google Earth Engine Colab notebooks. The first (Notebook1) demonstrates and provides tools for obtaining non-coincident remote-sensing data, provided that a list of sample dates, values, and locations is available. It provides computations for feature engineering, generating 90 features from the 6 Landsat bands we used. Currently, the notebook retrieves Landsat data, but it can be easily modified to operate with other sensors. The second notebook (Notebook2) applies L1 regularization and generates a model that can be used to estimate target measurements.
Our explorations showed that L1 regularization is useful for exploring large feature spaces and identifying features not traditionally used. This is especially useful for optically complex waters. However, while L1 regularization is useful, the final model may not be the best model that can be developed. We recommend evaluating the features L1 selects along with traditional features and performing an analysis to create a final model.
Colab notebooks that implement and describe this approach are available on GitHub at https://github.com/BYU-Hydroinformatics/ee-wq-lasso (5 March 2023). Occasionally, these notebooks may be updated.

Author Contributions

Conceptualization, G.P.W. and A.C.C.; methodology, A.C.C., R.C.H., K.N.M. and G.P.W.; software, A.C.C., R.C.H., K.N.M. and G.P.W.; writing—original draft preparation, G.P.W., A.C.C., R.C.H. and K.B.T.; writing—review and editing, R.C.H., K.N.M., G.P.W., K.B.T. and A.C.C.; supervision, G.P.W.; project administration, G.P.W.; funding acquisition, A.C.C., K.B.T. and G.P.W. All authors have read and agreed to the published version of the manuscript.

Funding

This research received no external funding. Students were supported in their studies by the Utah NASA Space Grant Consortium student fellowship program.

Data Availability Statement

We used Google Earth Engine (GEE) to access and process the data. Within GEE, we used Landsat 5, 7, 8, and 9 missions Collection 2 data generated by the USGS. These datasets have the following GEE image collection identifiers: LANDSAT/LT05/C02/T1_L2, L2LANDSAT/LE07/C02/T1_L2, LANDSAT/LC08/C02/T1_L2, and LANDSAT/LC09/C02/T1_L2, respectively. We provide Google Colab notebook at https://github.com/BYU-Hydroinformatics/ee-wq-lasso (5 March 2023) to grant access to the tools we used to acquire and process these data. The observed water quality data originated from the Utah AQWMS database. Access was granted through the State of Utah.

Acknowledgments

We would like to acknowledge the BYU College of Engineering, the BYU Department of Civil and Construction Engineering, and the NASA Utah Space Grant program for their support.

Conflicts of Interest

The authors declare no conflict of interest.

References

  1. Sellner, K.G.; Doucette, G.J.; Kirkpatrick, G.J. Harmful algal blooms: Causes, impacts and detection. J. Ind. Microbiol. Biotechnol. 2003, 30, 383–406. [Google Scholar] [CrossRef]
  2. Kloiber, S.M.; Brezonik, P.L.; Olmanson, L.G.; Bauer, M.E. A procedure for regional lake water clarity assessment using Landsat multispectral data. Remote Sens. Environ. 2002, 82, 38–47. [Google Scholar] [CrossRef]
  3. Fuller, L.M.; Aichele, S.S.; Minnerick, R.J. Predicting Water Quality by Relating Secchi-Disk Transparency and CHLORophyll a Measurements to Satellite Imagery for Michigan Inland Lakes, August 2002; U.S. Geological Survey: Reston, VA, USA, 2004; pp. 2004–5086. [Google Scholar]
  4. Olmanson, L.G.; Bauer, M.E.; Brezonik, P.L. A 20-year Landsat water clarity census of Minnesota’s 10,000 lakes. Remote Sens. Environ. 2008, 112, 4086–4097. [Google Scholar] [CrossRef]
  5. Allan, M.G.; Hamilton, D.P.; Hicks, B.; Brabyn, L. Empirical and semi-analytical chlorophyll a algorithms for multi-temporal monitoring of New Zealand lakes using Landsat. Environ. Monit. Assess. 2015, 187, 1–24. [Google Scholar] [CrossRef]
  6. Brezonik, P.; Menken, K.D.; Bauer, M. Landsat-Based Remote Sensing of Lake Water Quality Characteristics, Including Chlorophyll and Colored Dissolved Organic Matter (CDOM). Lake Reserv. Manag. 2005, 21, 373–382. [Google Scholar] [CrossRef]
  7. Brivio, P.A.; Giardino, C.; Zilioli, E. Determination of chlorophyll concentration changes in Lake Garda using an image-based radiative transfer code for Landsat TM images. Int. J. Remote Sens. 2001, 22, 487–502. [Google Scholar] [CrossRef]
  8. Kutser, T. Quantitative detection of chlorophyll in cyanobacterial blooms by satellite remote sensing. Limnol. Oceanogr. 2004, 49, 2179–2189. [Google Scholar] [CrossRef]
  9. Mayo, M.; Gitelson, A.; Yacobi, Y.; Ben-Avraham, Z. Chlorophyll distribution in lake Kinneret determined from Landsat Thematic Mapper data. Remote Sens. 1995, 16, 175–182. [Google Scholar] [CrossRef]
  10. Yip, H.; Johansson, J.; Hudson, J. A 29-year assessment of the water clarity and chlorophyll-a concentration of a large reservoir: Investigating spatial and temporal changes using Landsat imagery. J. Great Lakes Res. 2015, 41, 34–44. [Google Scholar] [CrossRef]
  11. NASA. Landsat—Earth Observation Satellites; 2015–3081; National Aeronautics and Space Administration: Reston, VA, USA, 2016; p. 4. [Google Scholar]
  12. Potes, M.; Rodrigues, G.; Penha, A.M.; Novais, M.H.; Costa, M.J.; Salgado, R.; Morais, M.M. Use of Sentinel 2–MSI for water quality monitoring at Alqueva reservoir, Portugal. Proc. IAHS 2018, 380, 73–79. [Google Scholar] [CrossRef]
  13. Vargas-Lopez, I.A.; Rivera-Monroy, V.H.; Day, J.W.; Whitbeck, J.; Maiti, K.; Madden, C.J.; Trasviña-Castro, A. Assessing chlorophyll a spatiotemporal patterns combining in situ continuous fluorometry measurements and Landsat 8/OLI data across the Barataria Basin (Louisiana, USA). Water 2021, 13, 512. [Google Scholar] [CrossRef]
  14. Hansen, C.H.; Burian, S.J.; Dennison, P.E.; Williams, G.P. Spatiotemporal variability of lake water quality in the context of remote sensing models. Remote Sens. 2017, 9, 409. [Google Scholar] [CrossRef] [Green Version]
  15. Hansen, C.H.; Williams, G.P. Evaluating remote sensing model specification methods for estimating water quality in optically diverse lakes throughout the growing season. Hydrology 2018, 5, 62. [Google Scholar] [CrossRef] [Green Version]
  16. Carder, K.L.; Chen, F.; Lee, Z.; Hawes, S.; Kamykowski, D. Semianalytic Moderate-Resolution Imaging Spectrometer algorithms for chlorophyll a and absorption with bio-optical domains based on nitrate-depletion temperatures. J. Geophys. Res. Ocean. 1999, 104, 5403–5421. [Google Scholar] [CrossRef]
  17. Garver, S.A.; Siegel, D.A. Inherent optical property inversion of ocean color spectra and its biogeochemical interpretation: 1. Time series from the Sargasso Sea. J. Geophys. Res. Ocean. 1997, 102, 18607–18625. [Google Scholar] [CrossRef]
  18. Peterson, K.T.; Sagan, V.; Sloan, J.J. Deep learning-based water quality estimation and anomaly detection using Landsat-8/Sentinel-2 virtual constellation and cloud computing. GIScience Remote Sens. 2020, 57, 510–525. [Google Scholar] [CrossRef]
  19. Sagan, V.; Peterson, K.T.; Maimaitijiang, M.; Sidike, P.; Sloan, J.; Greeling, B.A.; Maalouf, S.; Adams, C. Monitoring inland water quality using remote sensing: Potential and limitations of spectral indices, bio-optical simulations, machine learning, and cloud computing. Earth-Sci. Rev. 2020, 205, 103187. [Google Scholar] [CrossRef]
  20. Hafeez, S.; Wong, M.S.; Ho, H.C.; Nazeer, M.; Nichol, J.; Abbas, S.; Tang, D.; Lee, K.H.; Pun, L. Comparison of machine learning algorithms for retrieval of water quality indicators in case-II waters: A case study of Hong Kong. Remote Sens. 2019, 11, 617. [Google Scholar] [CrossRef] [Green Version]
  21. Cao, Z.; Ma, R.; Duan, H.; Pahlevan, N.; Melack, J.; Shen, M.; Xue, K. A machine learning approach to estimate chlorophyll-a from Landsat-8 measurements in inland lakes. Remote Sens. Environ. 2020, 248, 111974. [Google Scholar] [CrossRef]
  22. Hansen, C.H.; Burian, S.J.; Dennison, P.E.; Williams, G.P. Evaluating historical trends and influences of meteorological and seasonal climate conditions on lake chlorophyll a using remote sensing. Lake Reserv. Manag. 2019, 36, 45–63. [Google Scholar] [CrossRef]
  23. Hansen, C.H.; Williams, G.P.; Adjei, Z.; Barlow, A.; Nelson, E.J.; Miller, A.W. Reservoir water quality monitoring using remote sensing with seasonal models: Case study of five central-Utah reservoirs. Lake Reserv. Manag. 2015, 31, 225–240. [Google Scholar] [CrossRef]
  24. Efron, B.; Hastie, T.; Johnstone, I.; Tibshirani, R. Least angle regression. Ann. Stat. 2004, 32, 407–499. [Google Scholar] [CrossRef] [Green Version]
  25. Le, C.; Li, Y.; Zha, Y.; Wang, Q.; Zhang, H.; Yin, B. Remote sensing of phycocyanin pigment in highly turbid inland waters in Lake Taihu, China. Int. J. Remote Sens. 2011, 32, 8253–8269. [Google Scholar] [CrossRef]
  26. Gons, H.J. Optical Teledetection of Chlorophyllain Turbid Inland Waters. Environ. Sci. Technol. 1999, 33, 1127–1132. [Google Scholar] [CrossRef]
  27. Hansen, C.H.; Williams, G.P.; Adjei, Z. Long-Term Application of Remote Sensing Chlorophyll Detection Models: Jordanelle Reservoir Case Study. Nat. Resour. 2015, 06, 123–129. [Google Scholar] [CrossRef] [Green Version]
  28. Tanner, K.B.; Cardall, A.C.; Williams, G.P. A Spatial Long-Term Trend Analysis of Estimated Chlorophyll-a Concentrations in Utah Lake Using Earth Observation Data. Remote Sens. 2022, 14, 3664. [Google Scholar] [CrossRef]
  29. Bertani, I.; Steger, C.E.; Obenour, D.R.; Fahnenstiel, G.L.; Bridgeman, T.B.; Johengen, T.H.; Sayers, M.J.; Shuchman, R.A.; Scavia, D. Tracking cyanobacteria blooms: Do different monitoring approaches tell the same story? Sci. Total Environ. 2017, 575, 294–308. [Google Scholar] [CrossRef] [Green Version]
  30. Tate, R.S. Landsat Collections Reveal Long-Term Algal Bloom Hot Spots of Utah Lake. Master’s Thesis, Brigham Young University, Provo, UT, USA, 2019. [Google Scholar]
  31. Pettersson, L.H.; Pozdnyakov, D. Potential of remote sensing for identification, delineation, and monitoring of harmful algal blooms. In Monitoring of Harmful Algal Blooms; Springer: New York, NY, USA, 2013; pp. 49–111. [Google Scholar]
  32. Buitinck, L.; Louppe, G.; Blondel, M.; Pedregosa, F.; Mueller, A.; Grisel, O.; Niculae, V.; Prettenhofer, P.; Gramfort, A.; Grobler, J. API design for machine learning software: Experiences from the scikit-learn project. arXiv 2013, arXiv:1309.0238. [Google Scholar]
  33. Meinshausen, N.; Bühlmann, P. Stability selection. J. R. Stat. Soc. Ser. B Stat. Methodol. 2010, 72, 417–473. [Google Scholar] [CrossRef]
  34. Bühlmann, P.; Van De Geer, S. Statistics for High-Dimensional Data: Methods, Theory and Applications; Springer Science & Business Media: New York, NY, USA, 2011. [Google Scholar]
  35. Nelson, S.A.C.; Soranno, P.A.; Cheruvelil, K.S.; Batzli, S.A.; Skole, D.L. Regional assessment of lake water clarity using satellite remote sensing. J. Limnol. 2003, 62, 27. [Google Scholar] [CrossRef] [Green Version]
  36. Merritt, L.B.; Miller, A.W. Interim Report on Nutrient Loadings to Utah Lake: 2016; Jordan River, Farmington Bay & Utah Lake Water Quality Council: Provo, UT, USA, 2016. [Google Scholar]
  37. Cardall, A.; Tanner, K.B.; Williams, G.P. Google Earth Engine Tools for Long-Term Spatiotemporal Monitoring of Chlorophyll-a Concentrations. Open Water J. 2021, 7, 4. [Google Scholar]
  38. Masek, J.G.; Vermote, E.F.; Saleous, N.E.; Wolfe, R.; Hall, F.G.; Huemmrich, K.F.; Feng, G.; Kutler, J.; Teng-Kui, L. A Landsat surface reflectance dataset for North America, 1990–2000. IEEE Geosci. Remote Sens. Lett. 2006, 3, 68–72. [Google Scholar] [CrossRef]
  39. Vermote, E.; Justice, C.; Claverie, M.; Franch, B. Preliminary analysis of the performance of the Landsat 8/OLI land surface reflectance product. Remote Sens. Environ. 2016, 185, 46–56. [Google Scholar] [CrossRef] [PubMed]
  40. Kou, L.; Labrie, D.; Chylek, P. Refractive indices of water and ice in the 0.65-to 2.5-μm spectral range. Appl. Opt. 1993, 32, 3531–3540. [Google Scholar] [CrossRef] [PubMed] [Green Version]
  41. Smith, B.; Pahlevan, N.; Schalles, J.; Ruberg, S.; Errera, R.; Ma, R.; Giardino, C.; Bresciani, M.; Barbosa, C.; Moore, T.; et al. A Chlorophyll-a Algorithm for Landsat-8 Based on Mixture Density Networks. Front. Remote Sens. 2021, 1, 623678. [Google Scholar] [CrossRef]
  42. Matthews, M.W. A current review of empirical procedures of remote sensing in inland and near-coastal transitional waters. Int. J. Remote Sens. 2011, 32, 6855–6899. [Google Scholar] [CrossRef]
  43. Hansen, C.; Swain, N.; Munson, K.; Adjei, Z.; Williams, G.P.; Miller, W. Development of sub-seasonal remote sensing chlorophyll-a detection models. Am. J. Plant Sci. 2013, 4, 21–26. [Google Scholar] [CrossRef] [Green Version]
  44. Hastie, T.; Tibshirani, R.; Wainwright, M. Statistical Learning with Sparsity; CRC Press; Taylor and Francis Group: Boca Raton, FL, USA, 2015; Volume 143. [Google Scholar]
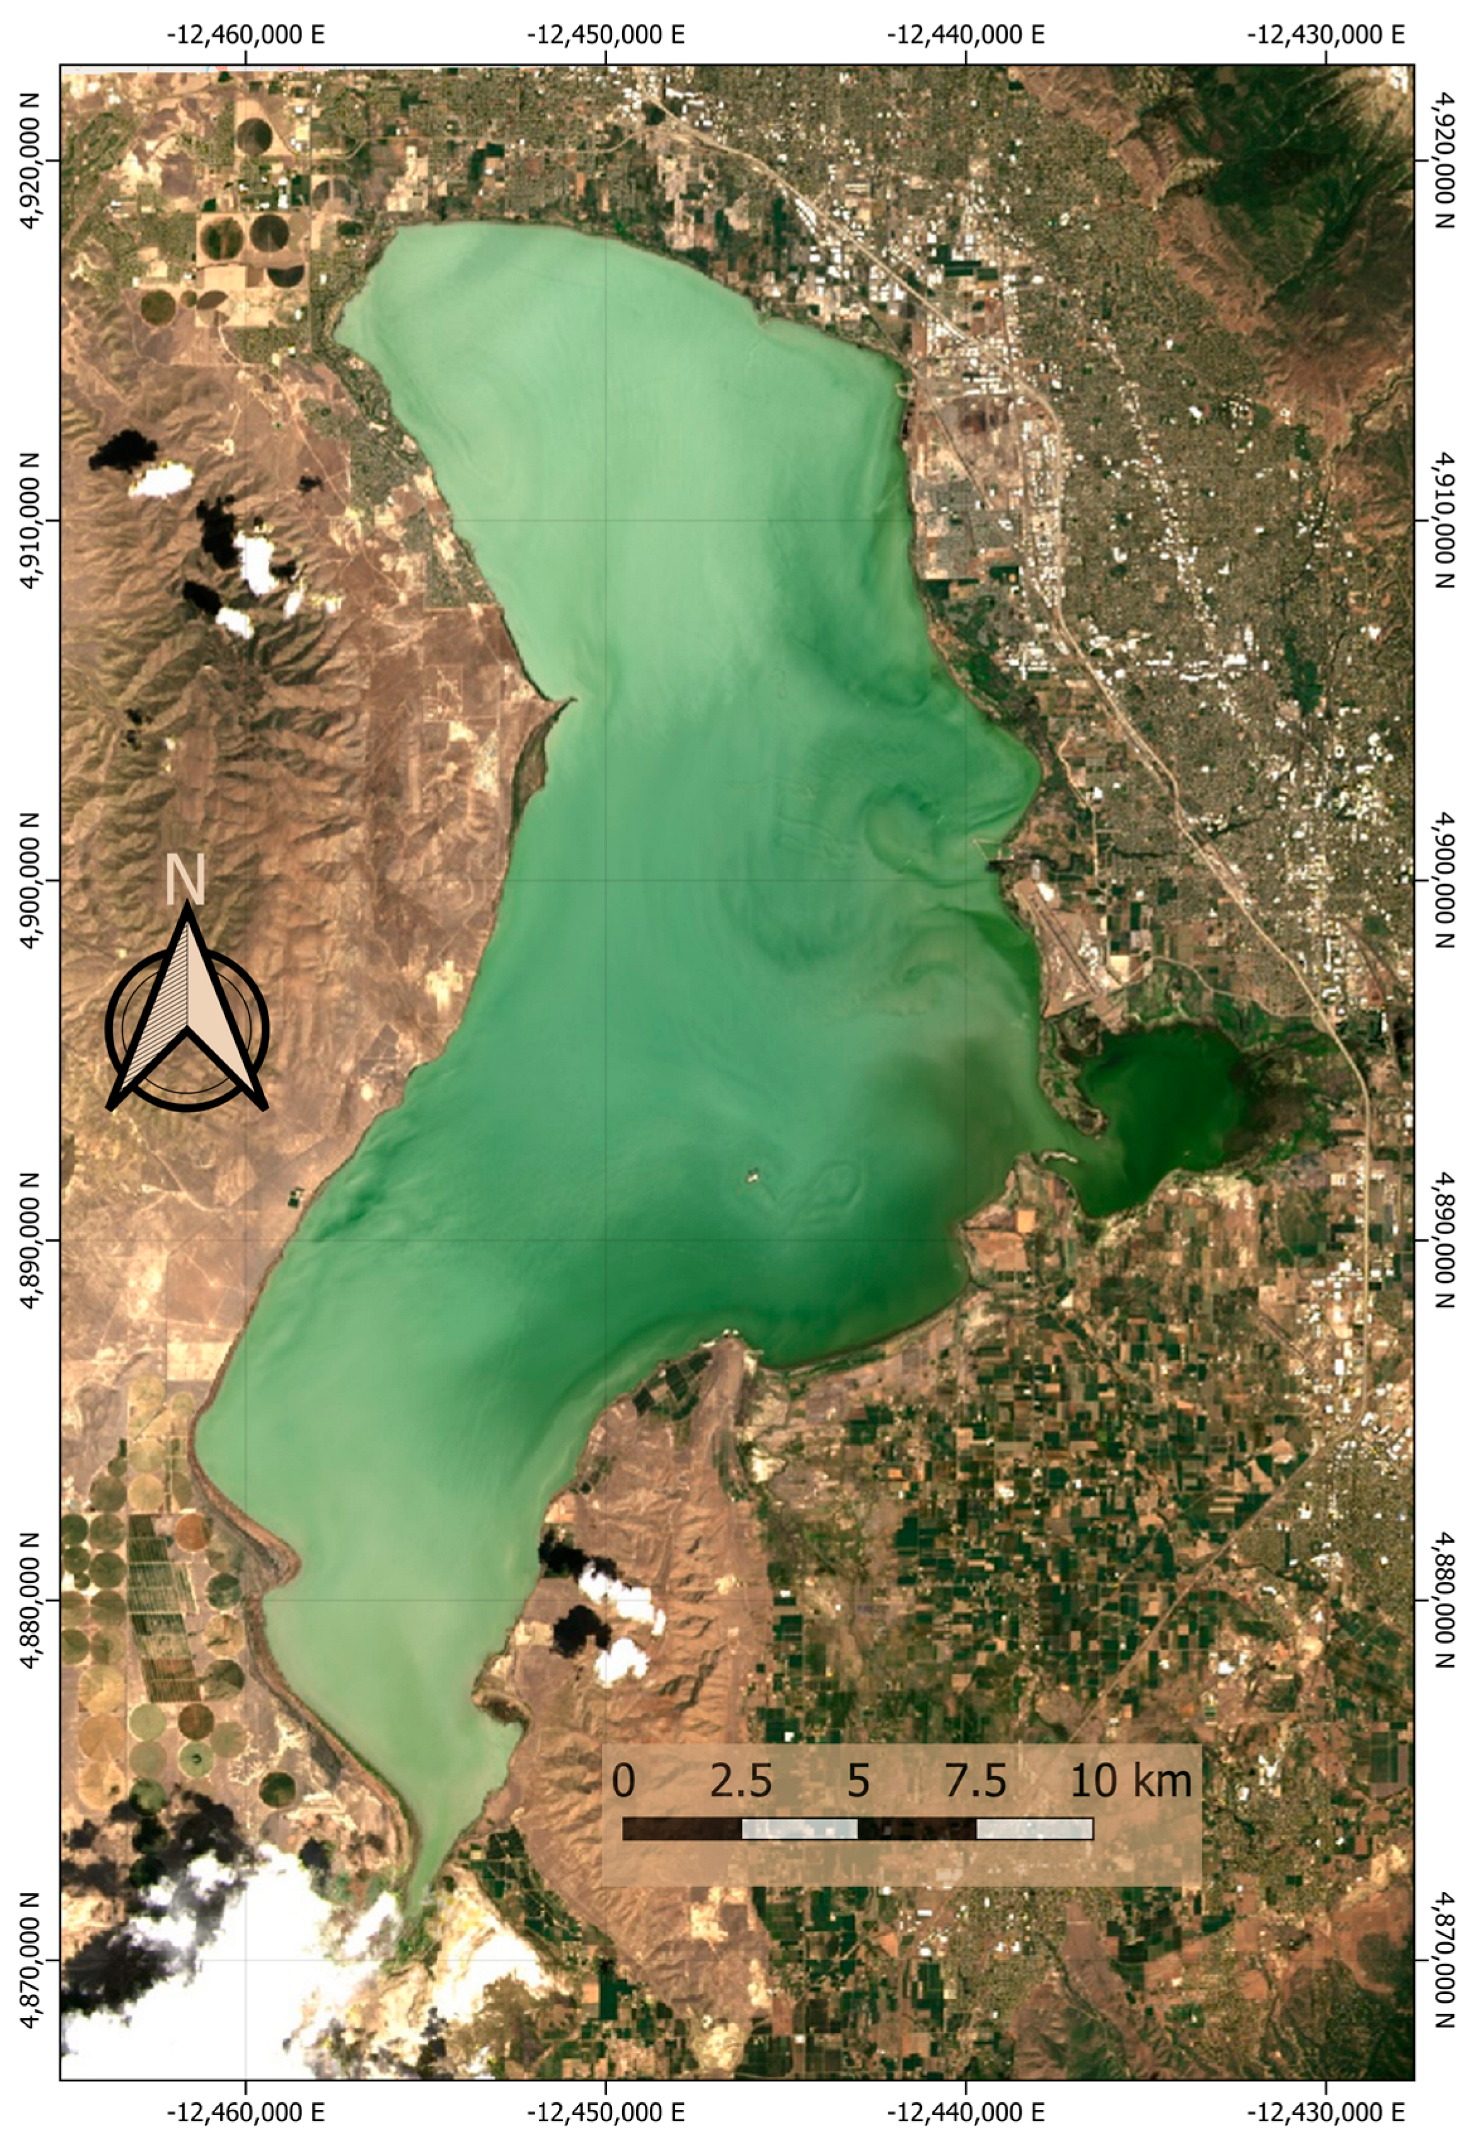
Figure 1. A Landsat image showing sediment plumes and carbonate precipitation in the northern and southern ends of Utah Lake, with less turbid waters entering the lake through Provo Bay on the right center of the image. Sediment resuspension from boats and other activities can be seen as “tracks”, with a boat and its associated tracks evident just west and a little south of Provo Bay.
Remotesensing 15 01670 g001
Figure 2. Utah Lake sample locations from the DWQ AQWMS database.
Remotesensing 15 01670 g002
Figure 3. Box plots of chl-a concentrations over time (top panel), with the number of samples collected per year presented in a bar chart (bottom panel). These data were downloaded from the AQWMS database and contain data collected from 11 July 1989 through 15 September 2021, constituting 1024 measurements in total. Outliers in the top plot were clipped to 500 µg/L for visualization purposes.
Remotesensing 15 01670 g003
Figure 4. Whisker, quantile, and histogram plots (left) and summary statistics for chl-a values (µg/L) that have a near-coincident Landsat pixel data pair. For these data, we selected a 5-day offset and a 30 m resolution. The quantile values in the second panel match the tick marks in the quantile plot in the left panel (second from the top).
Remotesensing 15 01670 g004
Figure 5. Satellite collection and in situ data pairs shown as the absolute offset in hours from the satellite collection.
Remotesensing 15 01670 g005
Figure 6. The model coefficient values with a 72 h (3 day) time window for the chl-a (top) and log(chl-a) (bottom) models whose α values vary from 1000 to 1 and 100 to 1 × 10⁻², respectively (x-axis is log scale) plotted on a log scale. This plot shows the number and size of the parameter coefficients, where each line represents the coefficient for a model feature. The number of coefficients (parameters) increases with decreasing α values (i.e., more lines), with absolute coefficient values also increasing (i.e., line magnitude).
Remotesensing 15 01670 g006aRemotesensing 15 01670 g006b
Figure 7. Test and training error versus α value computed using 200 k-fold realizations for each α value, where number of model coefficients for the chl-a and log(chl-a) models is depicted in the top and bottom panels, respectively. These plots used data with a 12 h (1 day) time window. The blue line shows the number of terms in the model versus α or the L1 regularization weight.
Remotesensing 15 01670 g007
Figure 8. Heatmap of feature selection probability in the trained L1 model vs. feature names for the chl-a model (top panel) and the log(chl-a) model (bottom panel), respectively. This shows that for a given feature count, the selected features are consistent over hundreds of realizations. The standard model uses α values from 0.001 to 50, while the log(chl-a) model uses α values from 0.0001 to 1.
Remotesensing 15 01670 g008
Figure 9. A comparison of errors for the L1 and Hansen models. The errors were computed using the entire dataset. The L1 models were fitted with the data with a time offset of 12 h.
Remotesensing 15 01670 g009
Figure 10. A Landsat image from 17 July 1986, with visual imagery from the RBG Landsat bands and estimated chl-a concentration maps on the right and left panels, respectively. Water from Hobble Creek flows into area B, resulting in relatively clear water in Provo Bay, which is shown in the ellipse labeled “B”; the remainder of the lake exhibits significant amounts of sediment from a recent storm, especially the area in the ellipse labeled “A”. The clear water in “B” has a significant estimated chl-a concentration, while the water in “A” has a very low, ~0, chl-a concentration.
Remotesensing 15 01670 g010
Table 1. Utah Lake data from the Utah Ambient Water Quality Monitoring System (AWQMS), managed by the Utah Department of Water Quality (DWQ) (downloaded 1 August 2020), for the 2019 period.
Characteristic NameNMeanMedianMax.Min.Std. DevSkewKurt.
Depth, Secchi disk (m)30830.270.257.000.000.2115.29402.48
Turbidity (NTU)68362.3041.60790.000.1089.125.3133.68
Total suspended solids (mg/L)128163.2645.00900.001.0075.465.2038.85
Total dissolved solids (mg/L)10611016.941000.002340.00106.00281.450.260.78
Total volatile solids (mg/L)71612.309.00110.002.0011.093.4018.40
Specific conductance (µmho/cm)66141758.351772.1520,980.00.00501.4014.41539.50
Calcium (mg/L)105862.5959.00213.0024.5021.933.3513.98
Hardness, Ca, Mg (mg/L)715413.27406.40898.50137.2094.671.705.04
Carbonate (mg/L)6902.89N/A123.000.006.2610.70195.91
Chlorophyll a, (µg/L)82140.5121.30597.500.2058.843.9221.76
Table 2. Number of in situ/satellite image pairs for different outsets, with descriptive statistics provided for the in situ chl-a data.
Offset (Hours)NMeanMedianStd DevCumulative
N
Cum. MeanCum. Std Dev
0–129132.8416.660.379132.8460.37
12–244831.0611.3573.1213932.2365.03
24–367532.9415.1646.4221432.4859.17
36–486044.2431.7548.3327435.0556.98
48–605728.8711.537.2133133.9954.10
60–729233.6223.3535.2842333.9150.59
72–966344.7421.3057.5748635.3151.55
96–1207048.0021.6269.7255636.9154.17
All55636.9117.7554.25N/A36.9154.25
Table 3. Mapping of band names to satellite bands for the three Landsat missions used in this paper.
Band NameSatellite Bands
Landsat 8Landsat 7Landsat 5
BlueSR_B2SR_B1SR_B1
greenSR_B3SR_B2SR_B2
redSR_B4SR_B3SR_B3
NIR 1SR_B5SR_B4SR_B4
SWIR1 2SR_B6SR_B5SR_B5
SWIR2 2SR_B7SR_B7SR_B7
SurfTempK 3ST_B10ST_B6ST_B6
1 Near-infrared (NIR); 2 shortwave infrared (SWIR); 3 surface temperature (Kelvin).
Table 4. The number of terms included in calibrated chl-a and log(chl-a) models and the corresponding range of α values with a 72 h (3-day) time window using all the data.
Chl-a
Model
Chl-a
Model
Chl-a
Model
Log(chl-a) ModelLog(chl-a) ModelLog(chl-a) Model
Alpha (α)Number of TermsRMSEAlpha (α)Number of TermsRMSE
0.0052225.460.00012336.89
0.012025.820.00022036.35
0.051626.690.00051935.69
0.11227.240.00101435.96
0.5827.520.00221135.81
1827.890.00461035.73
5431.100.01001037.31
10331.320.0215942.32
25331.940.0464853.91
50232.610.1000764.34
Table 5. Impact of the time window size for near-coincident measures on the median RMSE for models with an α of 0.5 (chl-a) and 0.04 (log(chl-a)).
Window Size (Hours)# of Data PairsRMSE (chla)RMSE (log(chla))
65511.6711.09
128510.7816.99
189912.1216.52
2412315.8020.54
3016817.4423.12
3619319.5522.98
4220220.9825.24
4824926.0433.53
5429026.0733.37
6030026.2233.63
6632828.3835.87
7238827.4034.45
Table 6. Impact of pixel resolution with near-coincident measures on the median RMSE for models with an α of 0.5 (chl-a).
Window Size (Hours)30 m
# Data Pairs
30 m
Test RMSE
90 m
# Data Pairs
90 m
Test RMSE
65511.675512.45
128510.788615.82
189912.129915.76
2412315.8012620.23
3016817.4417325.46
3619319.5519821.94
4220220.9820924.23
4824926.0425832.71
5429026.0730432.58
6030026.2231833.33
6632828.3834936.56
7238827.4041135.14
Table 7. A comparison of 30 m and 90 m versus α in calibrated chl-a models with a 12 h (3-day) time window and using all the data.
Alpha30 m Chl-a30 m Chl-a90 m Chl-a90 m Chl-a
Values (α)Number of TermsRMSENumber of TermsRMSE
0.005208.45179.44
0.01189.731510.90
0.051111.721012.25
0.1812.15812.53
0.5413.15613.54
1714.61513.74
5417.68415.21
10318.50316.44
25222.54321.39
50223.01222.74
Table 8. A comparison of 30 m and 90 m data versus α in calibrated log(chl-a) models with a 12 h (3-day) time window and using all the data.
Alpha (α)30 m
Log(chl-a)
30 m
Log(chl-a)
90 m
Log(chl-a)
90 m
Log(chl-a)
ValuesNumber of TermsRMSENumber of TermsRMSE
0.00012255.762053.47
0.00021854.961852.83
0.00051554.391451.88
0.00101054.521151.17
0.00221054.48750.87
0.00461054.73851.58
0.0100956.04752.86
0.0215759.74555.55
0.0464459.87460.24
0.1000457.41456.61
Disclaimer/Publisher’s Note: The statements, opinions and data contained in all publications are solely those of the individual author(s) and contributor(s) and not of MDPI and/or the editor(s). MDPI and/or the editor(s) disclaim responsibility for any injury to people or property resulting from any ideas, methods, instructions or products referred to in the content.