Article

Assessing Progress and Interactions toward SDG 11 Indicators Based on Geospatial Big Data at Prefecture-Level Cities in the Yellow River Basin between 2015 and 2020

1
International Research Center of Big Data for Sustainable Development Goals, Beijing 100094, China
2
Key Laboratory of Remote Sensing of Gansu Province, Heihe Remote Sensing Experimental Research Station, Northwest Institute of Eco-Environment and Resources, Chinese Academy of Sciences, Lanzhou 730000, China
3
University of Chinese Academy of Sciences, Beijing 100094, China
4
Scientific Information Center, Northwest Institute of Eco-Environment and Resources, Chinese Academy of Sciences, Lanzhou 730000, China
5
Key Laboratory of Western China’s Environmental Systems, Ministry of Education, Lanzhou University, Lanzhou 730000, China
*
Author to whom correspondence should be addressed.
Remote Sens. 2023, 15(6), 1668; https://doi.org/10.3390/rs15061668
Submission received: 13 January 2023 / Revised: 15 March 2023 / Accepted: 15 March 2023 / Published: 20 March 2023

Abstract

:
Rapid urbanization brings a series of dilemmas to the development of human society. To address urban sustainability, Sustainable Development Goal 11 (SDG 11) is formulated by the United Nations (UN). Quantifying progress and interactions toward SDG 11 indicators is essential to achieving Sustainable Development Goals (SDGs). However, it is limited by a lack of data in many countries, particularly at small scales. To address the gap, this study used systematic methods to calculate the integrated index of SDG 11 at prefecture-level cities with different economic groups in the Yellow River Basin based on Big Earth Data and statistical data, analyzed its spatial aggregation characteristics using spatial statistical analysis methods, and quantified synergies and trade-offs among indicators under SDG 11. We found the following results: (1) except for SDG 11.1.1, the performance of the integrated index and seven indicators improved from 2015 to 2020. (2) In GDP and disposable income groups, the top 10 cities had higher values, whereas the bottom 10 cities experienced greater growth rates in the integrated index. However, the indicators’ values and growth rates varied between the two groups. (3) There were four pairs of indicators with trade-offs that were required to overcome and eight pairs with synergies that were crucial to be reinforced and cross-leveraged in the future within SDG 11 at a 0.05 significance level. Our study identified indicators that urgently paid attention to the urban development of the Yellow River Basin and laid the foundation for local decision-makers to more effectively implement the 2030 Agenda for Sustainable Development (the 2030 Agenda).

Graphical Abstract

1. Introduction

Cities are closely related to human and social development. Rapid urbanization makes use of less than 1% of the global land area, yet contribute more than 75% of the global GDP while consuming most of the energy and creating most of the carbon emissions, resulting in serious environmental pollution, inadequate infrastructures and services, and disorderly land expansion [1,2,3]. Urban sustainable development is vital to national security and prosperity. Establishing evaluation indicators and methods of urban sustainability, comparing the sustainable status and trends at home and abroad, and diagnosing the problems existing in resources, environment, and social economy are important ways to achieve the SDGs [4]. Therefore, the UN signed the 2030 Agenda for Sustainable Development (the 2030 Agenda) in 2015 [5,6], in which SDG 11 is devoted to urban sustainability. It aimed to make cities and human settlements inclusive, safe, resilient, and sustainable, including 11 indicators such as housing, transportation, construction, culture, disasters, environment, and public space [7,8]. These indicators involved almost all aspects of urban development and intricately interweaved them with each other [9]. However, monitoring the achievement of SDGs is limited by missing data in many countries [10], particularly at small scales. Therefore, an integrated assessment of SDG 11 progress and interactions within its indicators using geospatial big data is crucial to achieving urban sustainable development.
In recent years, there have been an increasing number of studies assessing countries’ status and progress in implementing the 2030 Agenda (Table 1). For example, Bertelsmann Stiftung and Sustainable Development Solutions Network (SDSN) used an equal weight method to assess the SDG index and dashboards of the 17 SDGs for every country in the world [11,12,13]. Xu et al. [14] used the same approach to calculate the index for the national scale and provincial-level administrative division of China. Fu et al. [15] proposed a systematic approach to promote the SDGs’ achievement based on 3C (classification–coordination–collaboration). Friedman et al. [16] measured educational inequality since 1970 and forecast progress toward the education-related 2030 SDG targets. Sciarra et al. [17] used network science to calculate the SDG index and then ranked countries for their achievements. Some scholars also evaluated the countries’ progress on the SDGs from the perspectives of society, economy, and environment. For example, Huan et al. [18] assessed the SDGs scores and used the Chow Test to analyze the SDGs performance of Kazakhstan and Kyrgyzstan. D’Adamo et al. [19] discussed the progress of SDGs in Italy under two scenarios of equal weight for indicators and goals in these three dimensions. Huan et al. [20] developed a systematic method to assess the progress of achieving SDGs in 15 countries along the “Belt and Road”. Meanwhile, some scholars assessed SDGs’ achievement from the perspective of cities’ sustainability. At the earliest, taking five diverse secondary and intermediate cities in India as examples, Simon et al. [21] put forward 10 principles for the evaluation of international cities’ sustainable development based on SDG 11. Akuraju et al. [22] explored the relationships between countrywide SDG11 indicators and urban scaling exponents. Combined with the global SDGs indicator framework, Steiniger et al. [23] established a set of 29 indicators for assessing urban sustainable development and applied it to six cities in Chile. Wang et al. [8] evaluated urbanization sustainability by monitoring SDG 11.3.1 (ratio of land consumption rate to the population growth rate (LCRPGR)) between 1990 and 2010 in mainland China. Based on the SDGs framework, Chen et al. [4] put forward the methodology of constructing the sustainable development index of cities and urban agglomerations and the idea of establishing the “dashboard” of urban development. Huang et al. [24] monitored the progress of SDG 11 indicators and proposed some challenges that currently exist. Zhang et al. [25] localized the SDG 11 indicators and integrated the assessment of SDG 11 indicators in Hainan Province. Jiang et al. [7] assessed urbanization sustainability in China by comparing the relationship between land, population, and economic urbanization, and projected urbanization sustainability in 2020–2030 under the Shared Socioeconomic Pathways (SSPs) [26].
Similarly, research on the interrelationships among or within SDGs is increasing. Methods evolved from qualitative description to a combination of qualitative and quantitative approaches, and finally to quantitative methods. For example, UN-Water described the links between SDG 6 and other SDGs, aiming to highlight the importance of mainstreaming water and sanitation in the policies and plans of other sectors [27]. Bleischwitz et al. [28] put forward the seven-point scale and discussed the relationship between the nexus concept and SDGs. Fuso Nerini et al. [29] identified targets that interacted with energy and pointed out trade-offs and synergies about SDG 7 that mainly existed in three aspects. Meanwhile, they considered that climate change and sustainable development governance should be better connected to maximize the effectiveness of action in both domains [30]. In terms of research about the combination of qualitative and quantitative, Nilsson et al. [31] used the seven points to map the interactions between SDGs. The International Council for Science (ICSU) [32] discussed the nature of interlinkages between SDGs and found the four SDGs were mostly synergistic with the other SDGs. Mainali et al. [33] developed an analytical framework to evaluate sectoral linkages and examine potential synergies and trade-offs among SDGs by combing literature review and network analysis. Quantitative analysis methods mainly include social network analysis [9,34], questionnaires [35], correlation analysis [36], and mathematical techniques [37]. The research objective of the literature is based on all SDG pairs, but some studies focus on one SDG and quantify interactions between other SDGs and it. For example, Thacker et al. [38] concluded that infrastructure improvements had both synergistic and trade-off effects on the achievement of SDGs. Hinz et al. [39] conducted a multi-scenario analysis of the trade-offs between SDGs from the perspective of agricultural development and land use change in India. Bisaga et al. [40] categorized synergies and trade-offs between energy and SDGs and concluded that 47% of the SDG targets had synergies with off-grid solar energy in Rwanda. Wang et al. [41] assessed the interactions between SDGs from the perspective of water pollution by nutrients in China and found that effective pollution control required accounting for the interactions between SDGs.
However, there are some gaps in the current literature about assessing the progress of SDGs and quantifying interactions. First, the integrated assessments of SDGs are mostly at the global or national scale, and there are relatively few studies on the prefecture-level city scale. Secondly, in the existing knowledge of the interactions among SDGs, there is no specific quantification of interactions among indicators within the SDGs. Finally, most research has a single data source, mainly based on statistical information. Therefore, to supplement those knowledge gaps, our research objectives are to assess progress and interactions toward SDG 11 based on geospatial big data at prefecture-level cities in the Yellow River Basin between 2015 and 2020. We attempt to carry out (1) calculation of the integrated index of SDG 11 at the municipal scale by utilizing Big Earth Data and statistical data in the Yellow River Basin; (2) analysis of the spatial aggregation characteristics of SDG 11 integrated index using spatial statistical analysis methods; and (3) completely quantifying synergies and trade-offs among indicators under SDG 11. By doing so, we highlight trade-offs that are required to overcome and identify current synergies that are crucial to be reinforced and cross-leveraged in the future. Our study can provide a reference for local measurement and assessment in the attainment of the 2030 Agenda.

2. Materials and Methods
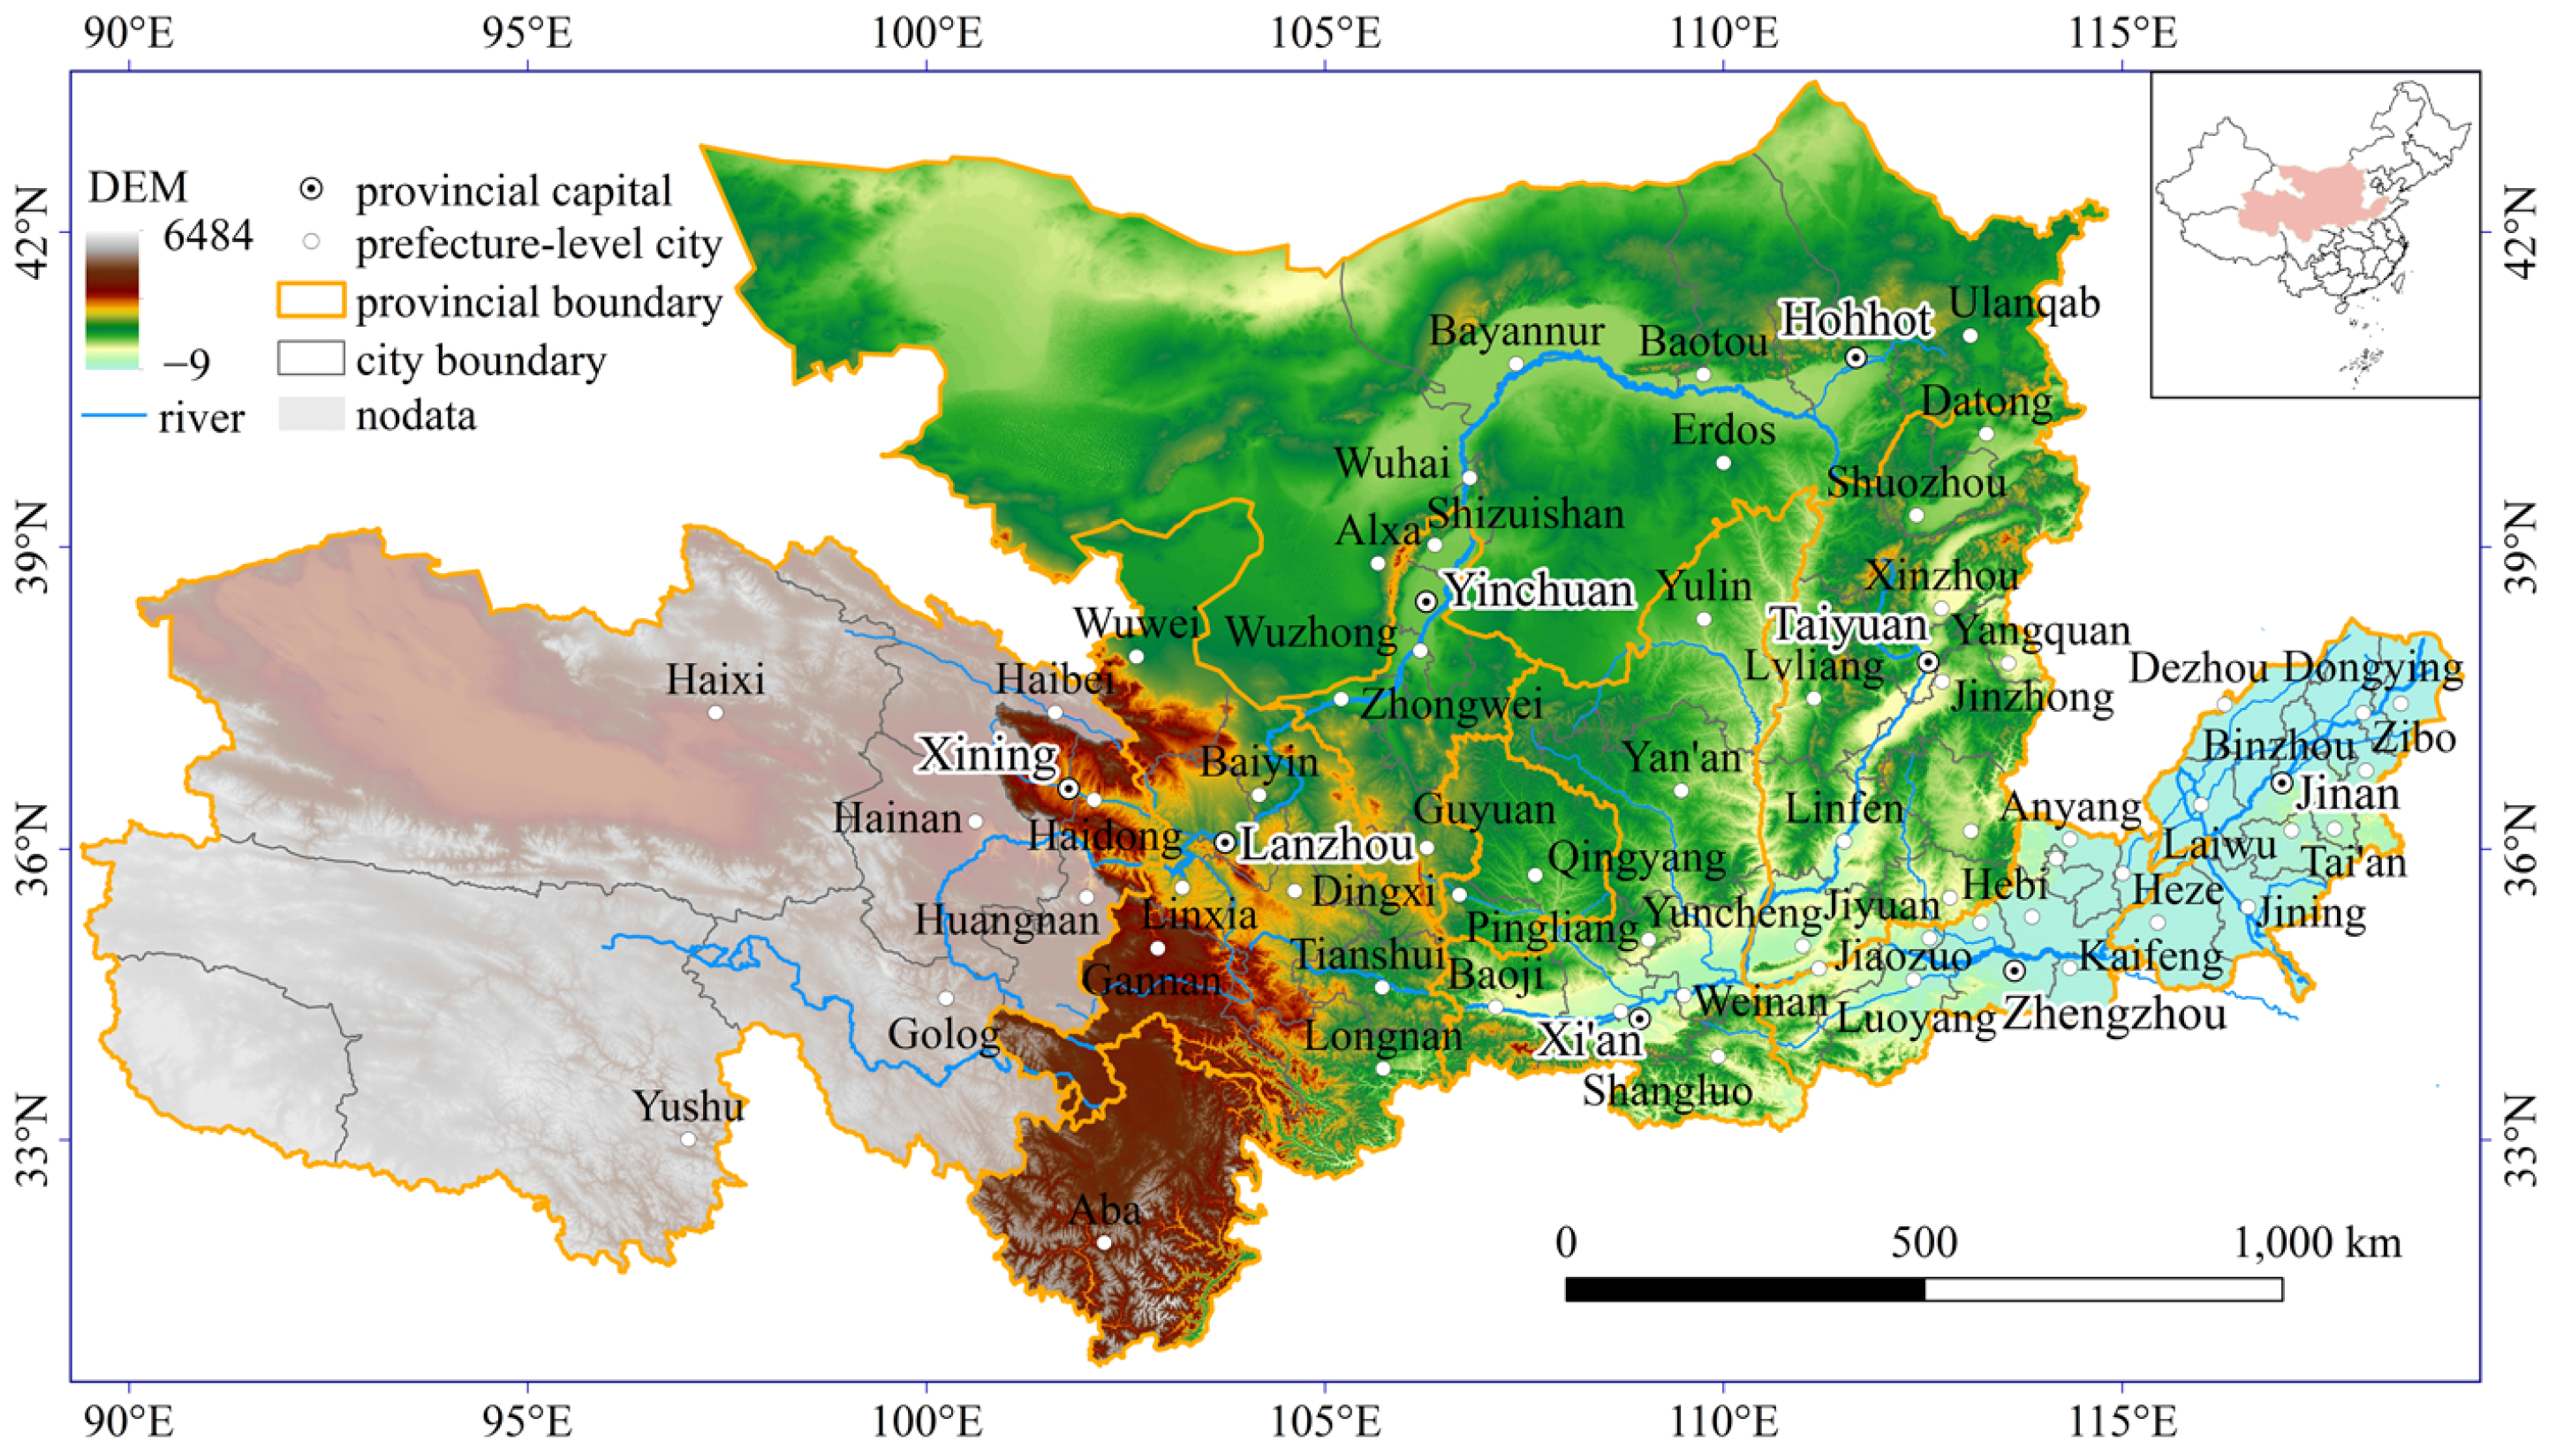
2.1. Study Area

The Yellow River originates from the Yogu Zonglie Basin at the northern foot of the Bayan Har Mountains on the Tibet Plateau and flows through 70 prefecture-level administrative regions in nine provinces [42] (Figure 1). The total length of the main river is 5464 km, and the watershed area is 79.5 × 10⁴ km2 (including the inner flow area), accounting for 8.3% of China’s land area. It belongs to the continental climate. The annual average temperature is 6.4 °C, and precipitation is 462 mm in the basin, whereas the evaporation of the water surface varies greatly with temperature, terrain, and geographical location. GDP and grain yield of the Yellow River Basin respectively account for about 25% and 30% of the total amount of China by 2020, which plays a very important role in the country’s economic and social development [43]. However, most of the prefecture-level administrative regions in Qinghai Province are limited by the data availability, and the number of cities in this study is 64. The following spatial distribution maps no longer show cities with no data.

2.2. Data Sources

According to the data availability, we picked six targets and eight indicators under SDG 11 to calculate the integrated index (Table 2). SDG 11.1.1 was denoted by the housing affordability index (HAI) based on the housing price-to-income ratio (PIR) and the housing rent-to-income ratio (RIR) from the perspective of residential housing affordability. SDG 11.2.1 meant whether urban residents had convenient access to public transportation based on high-resolution gridded population data and public transportation network data. SDG 11.3.1 was expressed by the ratio of land consumption rate to the population growth rate. SDG 11.5.1 and SDG 11.5.2 were presented based on disaster losses and socioeconomic statistics of cities. SDG 11.6.1 was denoted by the rate of domestic garbage harmless treatment. SDG 11.6.2 was the population-weighted average concentration of PM2.5. SDG 11.7.1 was represented by the ratio of roads, streets, transportation, green space, and square acreages to the area of urban construction land. Among them, the HAI, public transportation information data, natural hazard data, and annual average PM2.5 used in the study were obtained from the International Research Center of Big Data for Sustainable Development Goals (http://www.cbas.ac.cn/ (accessed on 11 June 2021)). Land consumption rate, population growth rate, rate of domestic garbage harmless treatment, and public space data were obtained from the China Urban Construction Statistical Yearbook (https://data.cnki.net/ (accessed on 26 May 2021)). The study period is between 2015 and 2020.

2.3. Methods

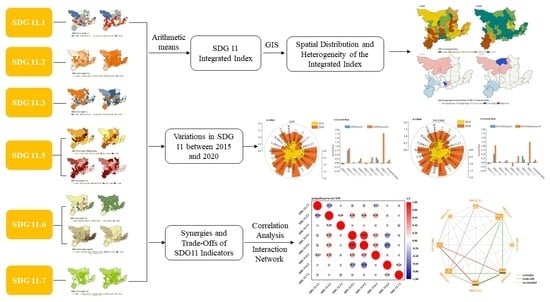
2.3.1. Calculation of the Integrated Index

First, to eliminate residuals caused by different dimensions, self-variation or extreme values of indicators, it is necessary to standardize the original indicators between 0 and 1 with the following equation:
Forward   indicator :   x f = x min ( x ) max ( x ) min ( x ) Backward   indicator :   x b = max ( x ) x max ( x ) min ( x )
A value of the normalized indicators closer to 0 indicates worse performance, whereas a value closer to 1 indicates better performance. To remove the effects of extreme values, data at the bottom 2.5th percentile were selected as the lower bound for normalization, as proposed by OECD et al. [44]. The selection of the upper bound drew on the method from the Sustainable Development Report 2019 [11] and Xu et al. [14].
Then, the following equation was used to calculate the integrated index according to the method in the 2019 Sustainable Development Report [11].
I SDG 11 = 1 N k = 1 N I k
where I SDG 11 denotes the SDG 11 integrated index; N indicates the number of indicators; I k denotes the value of indicators.

2.3.2. Spatial Autocorrelation Analysis

According to the First Law of Geography, “Everything is related to everything else, but near things are more related than distant things” [45,46]. Moran’s I is one of the most commonly used statistics for spatial autocorrelation analysis. The purpose of using it in this paper is to analyze the spatial aggregation and heterogeneity characteristics of the SDG 11 integrated index.
(1)
Global Moran’s I
The global Moran’s I measures spatial autocorrelation based on both cities’ locations and the integrated index values simultaneously. It evaluates whether the pattern expressed is clustered, dispersed, or random. The formula is as follows [47]:
I = n i = 1 n j = 1 n w i , j z i z j i = 1 n j = 1 n w i , j i = 1 n z i 2
where I is the Global Moran’s I, z i , and z j are respectively the deviation of the integrated index of city i and city j from its mean, n is the number of cities, and w i , j is the spatial weight between city i and city j .
(2)
Local Moran’s I
The local Moran’s I identifies spatial clusters of cities with high or low integrated index values. While it also identifies spatial outliers. The formula is as follows [47]:
I i = z i i = n , j i n w i , j z j

2.3.3. Correlation Analysis

Correlation analysis is used to analyze the degree of correlation among variables. Among them, Pearson’s and Spearman’s correlation analyses are widely used to calculate correlation among variables, usually represented by the correlation coefficient r, ranging from −1 to 1. But there are also differences between them. Pearson’s correlation analysis is more suitable for linear relationships between continuous and normally distributed variables [48]. If the data does not meet the previous characteristics, Spearman’s correlation analysis should be used, and the nonlinear relationship among variables can be measured [49]. Meanwhile, it’s also mostly used for correlation analysis among rank variables.

3. Results

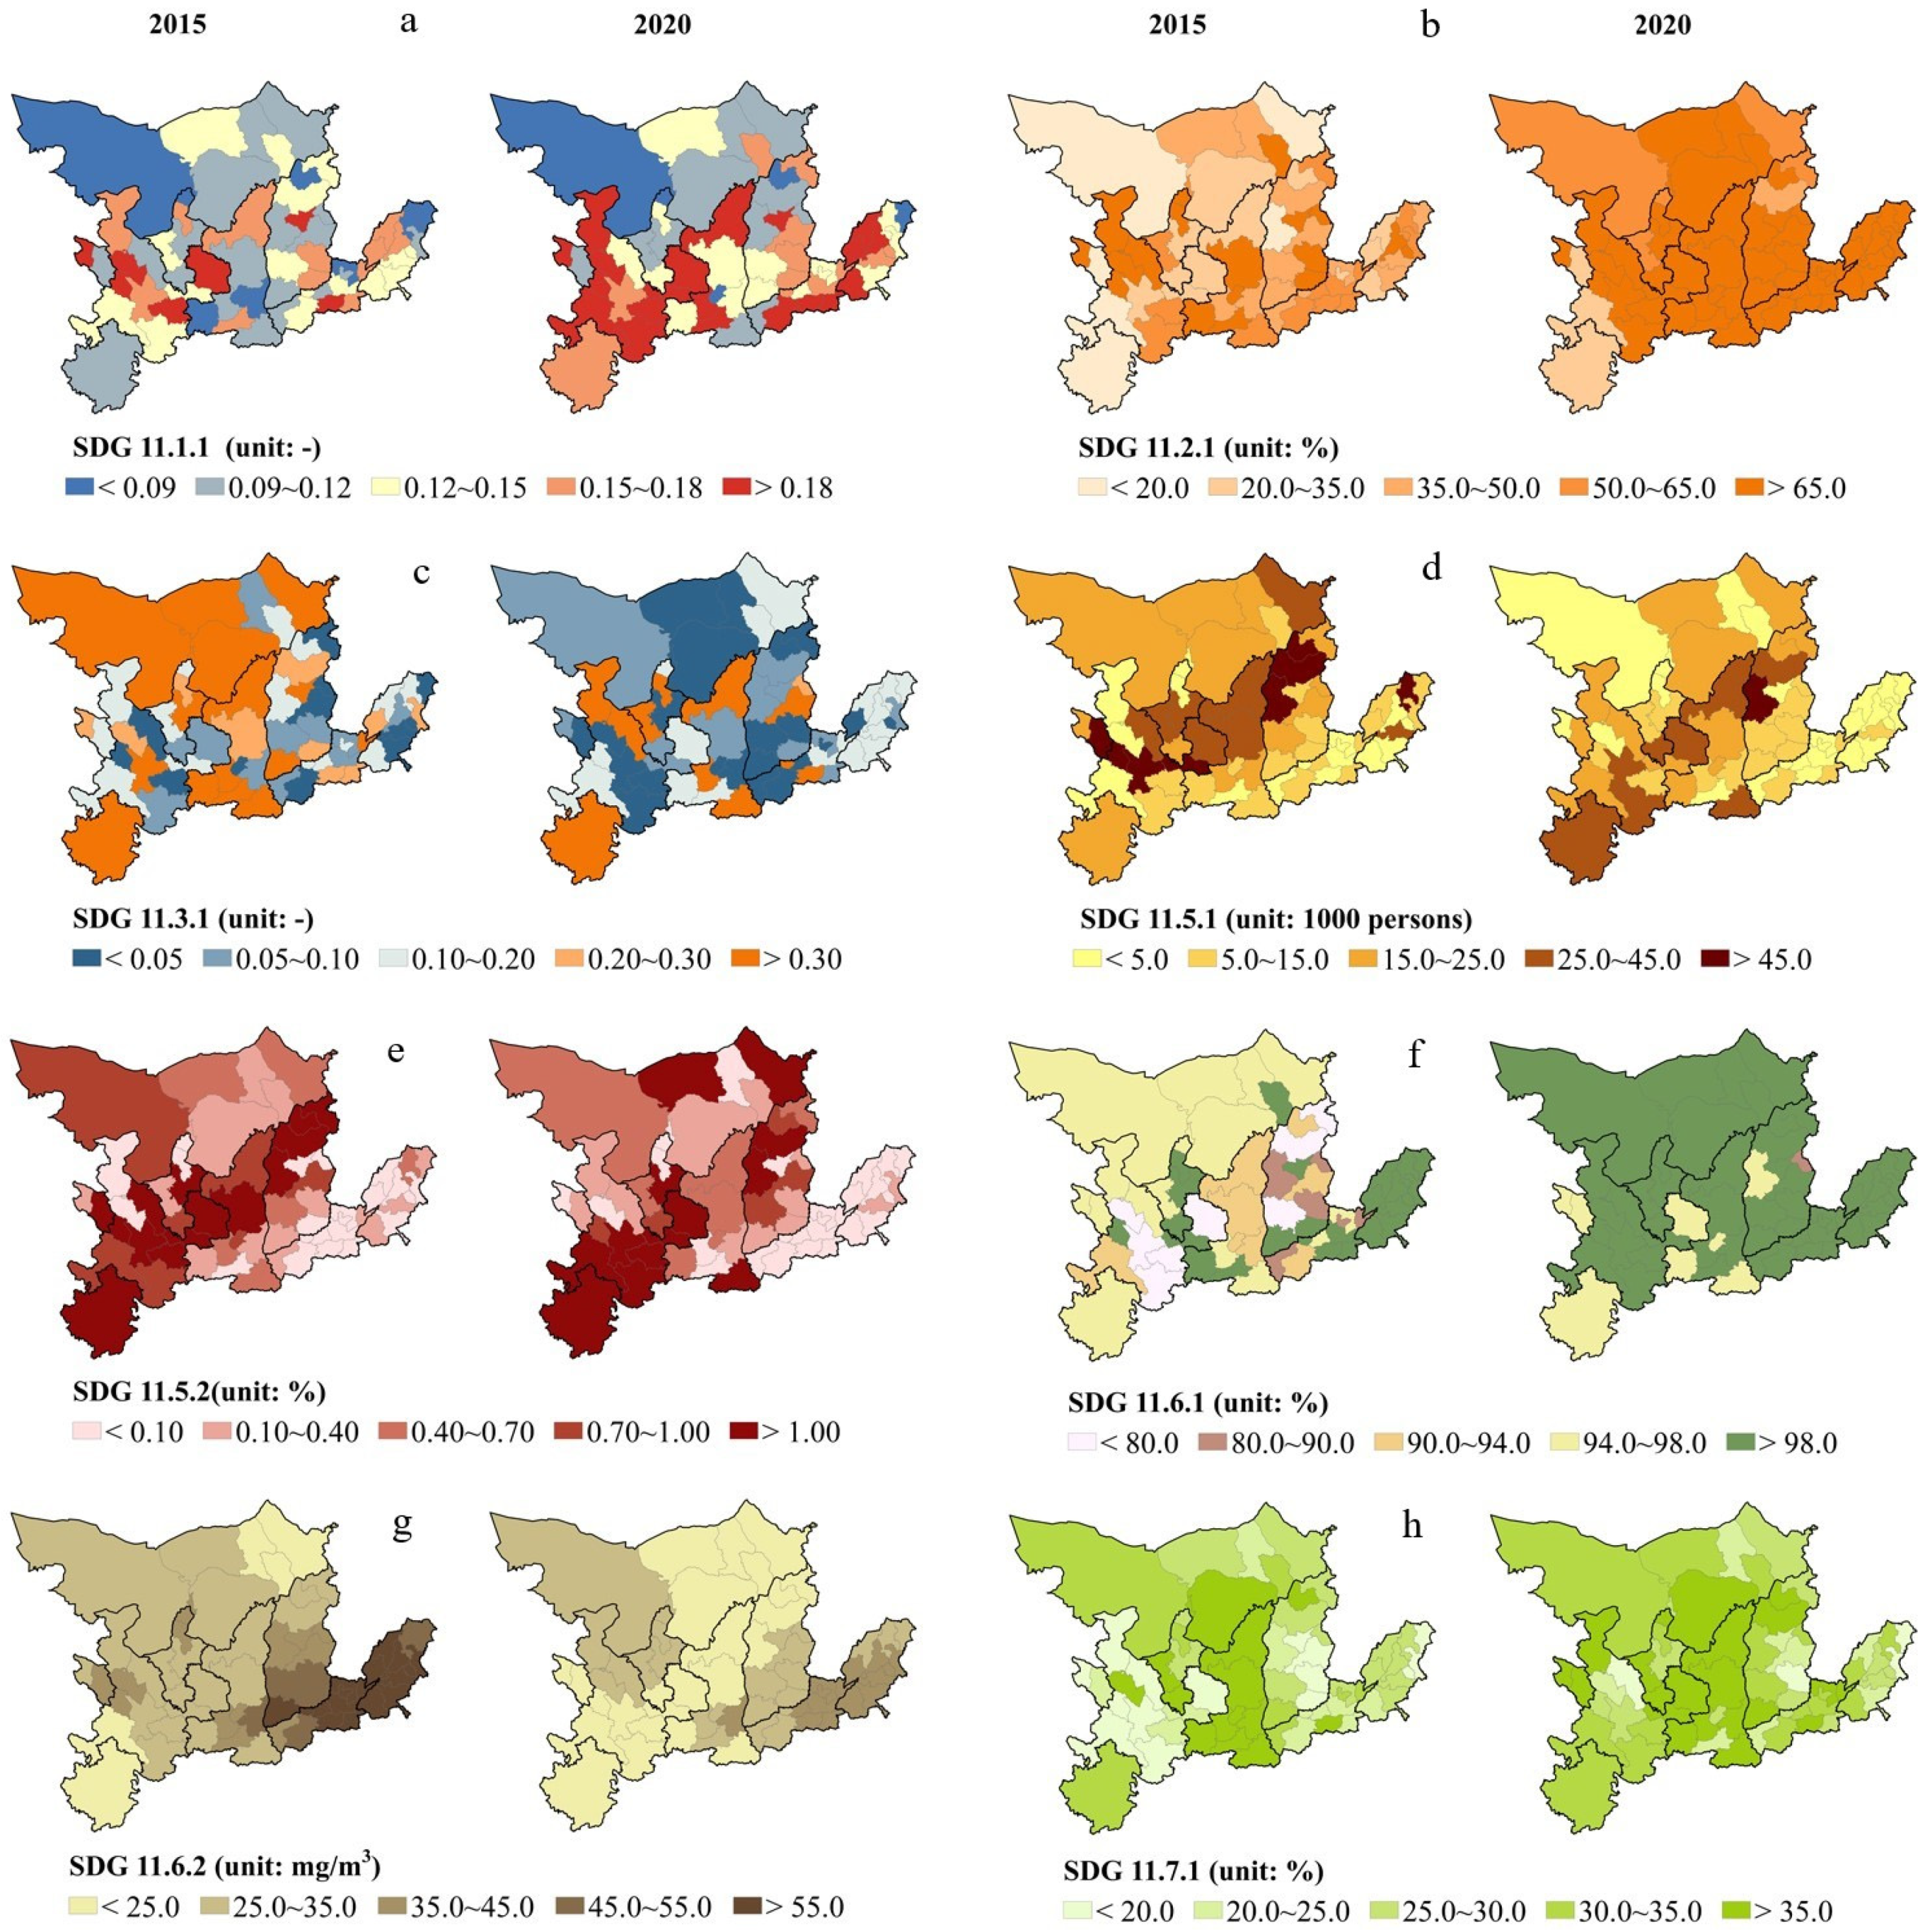
3.1. Spatial Distribution Patterns of Indicators

We analyzed the spatiotemporal distribution characteristics of eight indicators under SDG 11, which covered housing, transportation, urbanization, urban disasters, environmental impact, and public space. On the whole, the performance of the seven indicators has improved from 2015 to 2020. Details are as follows:
(1)
Housing Affordability Index (SDG 11.1.1)
Figure 2a denotes the spatial distribution of the HAI. The larger the value, the greater the housing pressure, and the less conducive to the sustainable development of cities. Overall speaking, compared with 2015, HAI went up in 52 cities and down in 12 in 2020, with its average value increasing from 0.14 to 0.16. The cities that went up were mainly located in southeastern Gansu province, except for provincial capitals such as Taiyuan, Jinan, Zhengzhou, Xi’an, Lanzhou, and Xining. Meanwhile, as far as provincial capitals were concerned, the largest HAI value in 2015 was Lanzhou (0.30), and the smallest was Hohhot (0.13). In 2020, there were three cities with the largest HAI, namely Taiyuan, Zhengzhou, and Lanzhou (0.31), and the smallest was Yinchuan (0.14). In addition, except for Yinchuan, which slightly decreased, the HAI value of the remaining seven capital cities showed an increasing trend from 2015 to 2020. Among them, Xi’an had a larger increase in the HAI from 0.18 in 2015 to 0.30 in 2020. Lanzhou and Xining had a smaller increase, respectively, from 0.30 to 0.31 and from 0.24 to 0.25 (Figure 3a).
(2)
Proportion of the population that has convenient access to public transport (SDG 11.2.1)
The spatial distribution of the population with convenient access to public transportation in the Yellow River Basin is shown in Figure 2b. The higher the value, the more population with convenient access to public transport in cities. On average, 81.94% of people in urban built-up areas had convenient access to public transportation in 2020, 30.5% higher than in 2015 (51.04%). Meanwhile, in terms of provincial capitals, the largest proportion in 2015 was Taiyuan (93.11%), and the smallest was Zhengzhou (64.38%). In 2020, the largest and smallest were, respectively, Yinchuan (94.82%) and Xining (89.58%). In addition, except for Xining, which slightly decreased, the proportions of the remaining seven capital cities showed an increasing trend from 2015 to 2020. Among them, Zhengzhou had a larger increase, with the proportion going from 64.38% in 2015 to 93.24% in 2020. Taiyuan had a smaller increase from 93.11% to 93.14% (Figure 3b).
(3)
Ratio of land consumption rate to the population growth rate (SDG 11.3.1)
LCRPGR quantified the relationship between spatial urban expansion and population growth. The closer it is to 1, the better-coordinated development between them. To show its spatial distribution more clearly, we calculated the distance between LCRPGR and 1. We used |LCRPGR-1| to represent it. The smaller the value, the more synergy between land expansion and population growth in cities (Figure 2c). The average value decreased from 0.30 in 2015 to 0.17 in 2020. The number of cities with a value below 0.1 increased from 24 in 2015 to 36 in 2020, and the proportion of the total number of cities increased from 37.50% to 56.25%. In general, the efficiency of land use in the Yellow River Basin improved from 2015 to 2020. However, this is not the case for each city. For example, Yinchuan, Zhengzhou, and Jinan were exactly in opposite situations, especially Yinchuan, whose value increased sharply from 0.23 to 0.70 (Figure 3c).
(4)
Urban disasters (SDG 11.5)
Building the ability to withstand natural disasters is also an important aspect of sustainable urban development. The United Nations measured it in terms of dead, missing, directly affected persons, and direct economic losses caused by natural disasters. Thus, we used the number of deaths, missing persons, and directly affected persons attributed to disasters per 100,000 population (SDG 11.5.1) and the direct economic losses attributed to disasters in relation to regional GDP (SDG 11.5.2) to express the ability to withstand natural disasters of cities in the Yellow River Basin. The smaller the value of the two indicators, the less affected it is by natural disasters. Their spatiotemporal distribution characteristics are shown in Figure 2d,e. The disaster-prone areas in the Yellow River Basin were mainly located in the cities at the junction of Ningxia and Shaanxi, northern Shaanxi, Shanxi, and southeastern Gansu. The average value of SDG 11.5.1 decreased from 20,159 in 2015 to 12,291 in 2020, whereas SDG 11.5.2 remained at 0.71%. For provincial capitals, except for Yinchuan, the ability to resist the natural disasters of others improved by and large, especially in Xining, Hohhot, and Taiyuan (Figure 3d,e).
(5)
Urban environmental impact (SDG 11.6)
The United Nations defines urban environmental impact in terms of two aspects: air quality and solid waste management. Correspondingly, we used the harmless treatment rate of domestic garbage (SDG 11.6.1) and annual average PM2.5 (SDG 11.6.2) to express the environmental conditions of cities in the Yellow River Basin. The higher the value of SDG 11.6.1, the better, whereas SDG 11.6.2 is the opposite. The average value of SDG 11.6.1 increased from 92.04% in 2015 to 99.07% in 2020, and SDG 11.6.2 decreased from 44.23 mg/m3 to 27.65 mg/m3 (Figure 2f,g). In 2020, there are 55 cities with a value of SDG 11.6.1 greater than 98% and 24 cities with a value of SDG 11.6.2 less than 25 mg/m3, accounting for 85.94% and 37.5% of all cities in the Yellow River Basin, respectively. Moreover, cities with a value of SDG 11.6.2 greater than 25 mg/m3 were mainly spatially distributed in the northern and eastern Yellow River Basin. In terms of provincial capitals, except for Lanzhou, the treatment rate of domestic solid waste in others remained unchanged (Figure 3f). However, air quality improved in all provincial capitals, especially Zhengzhou and Jinan (Figure 3g).
(6)
Average share of the built-up area of cities that is open space for public use for all (SDG 11.7.1)
Public space is defined as all places of public use and accessible to all, including open public spaces and streets [50]. Open public space is any undeveloped or open land without buildings (or other architectural structures) that is available for free use by the public to provide recreation for residents and contribute to the aesthetic and environmental quality of the community [50]. Therefore, we calculated the percentage of areas where roads, parks, and squares account for urban construction (SDG 11.7.1). The larger the value, the more conducive it is to the sustainable development of the city. The open public space areas increased from 28.10% in 2015 to 32.70% in 2020 (Figure 2h). Cities with SDG 11.7.1 value greater than 35% were mainly located in southeastern Gansu, Shaanxi as well as in scattered cities, such as Ordos, Jinchang, Xining, and Haidong. From the perspective of provincial capitals, the value of SDG 11.7.1 in Lanzhou, Xi’an, and Hohhot decreased, whereas others increased, especially in Xining (Figure 3h).

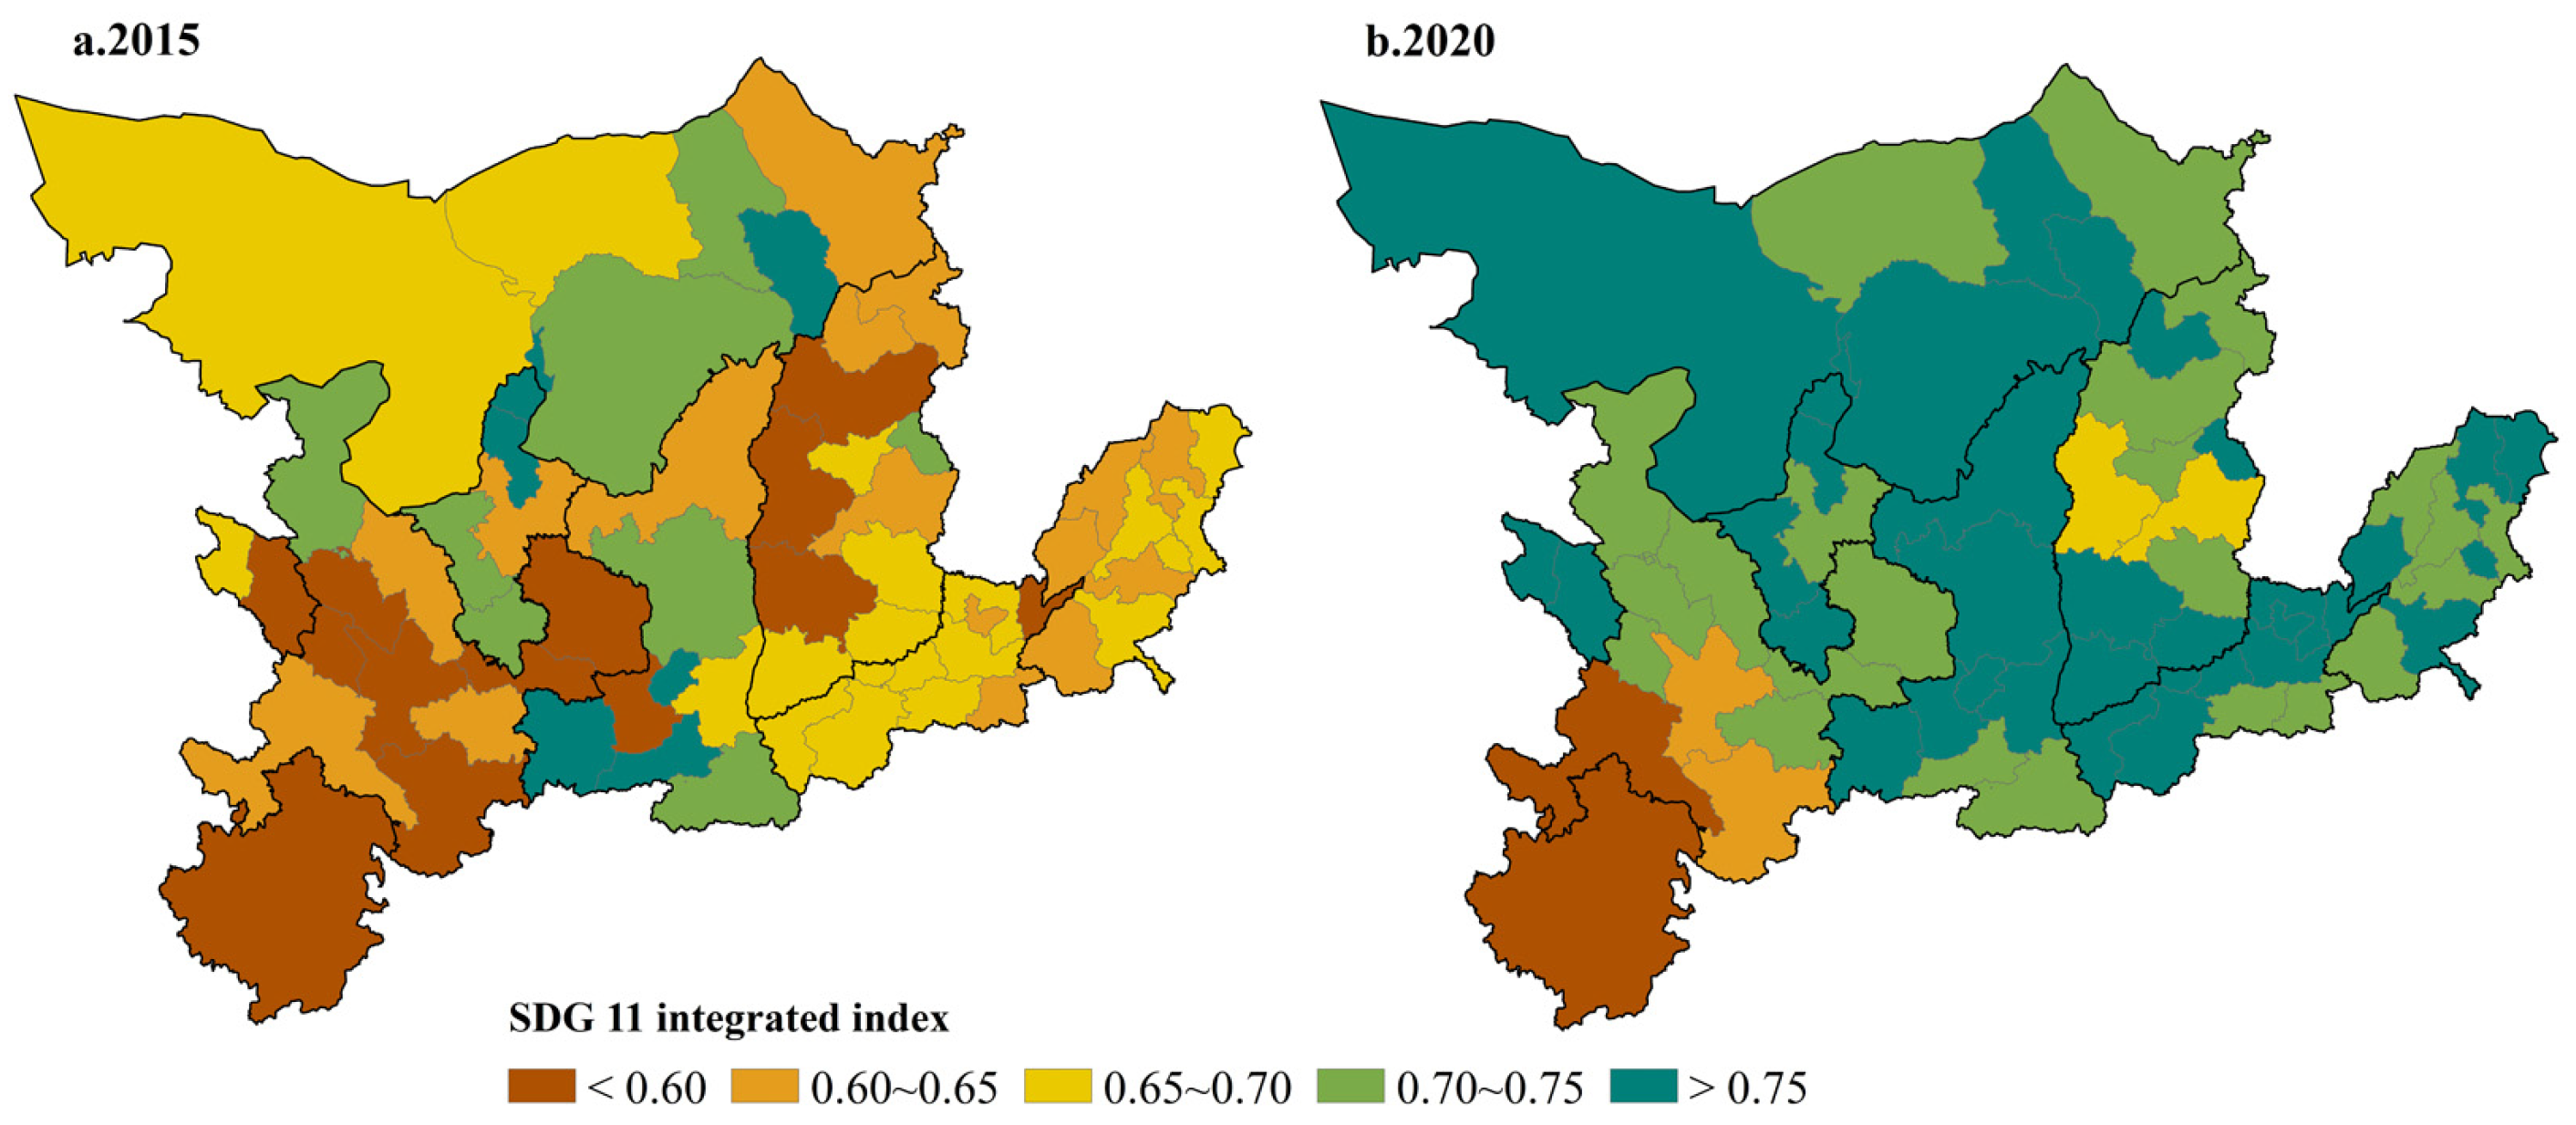
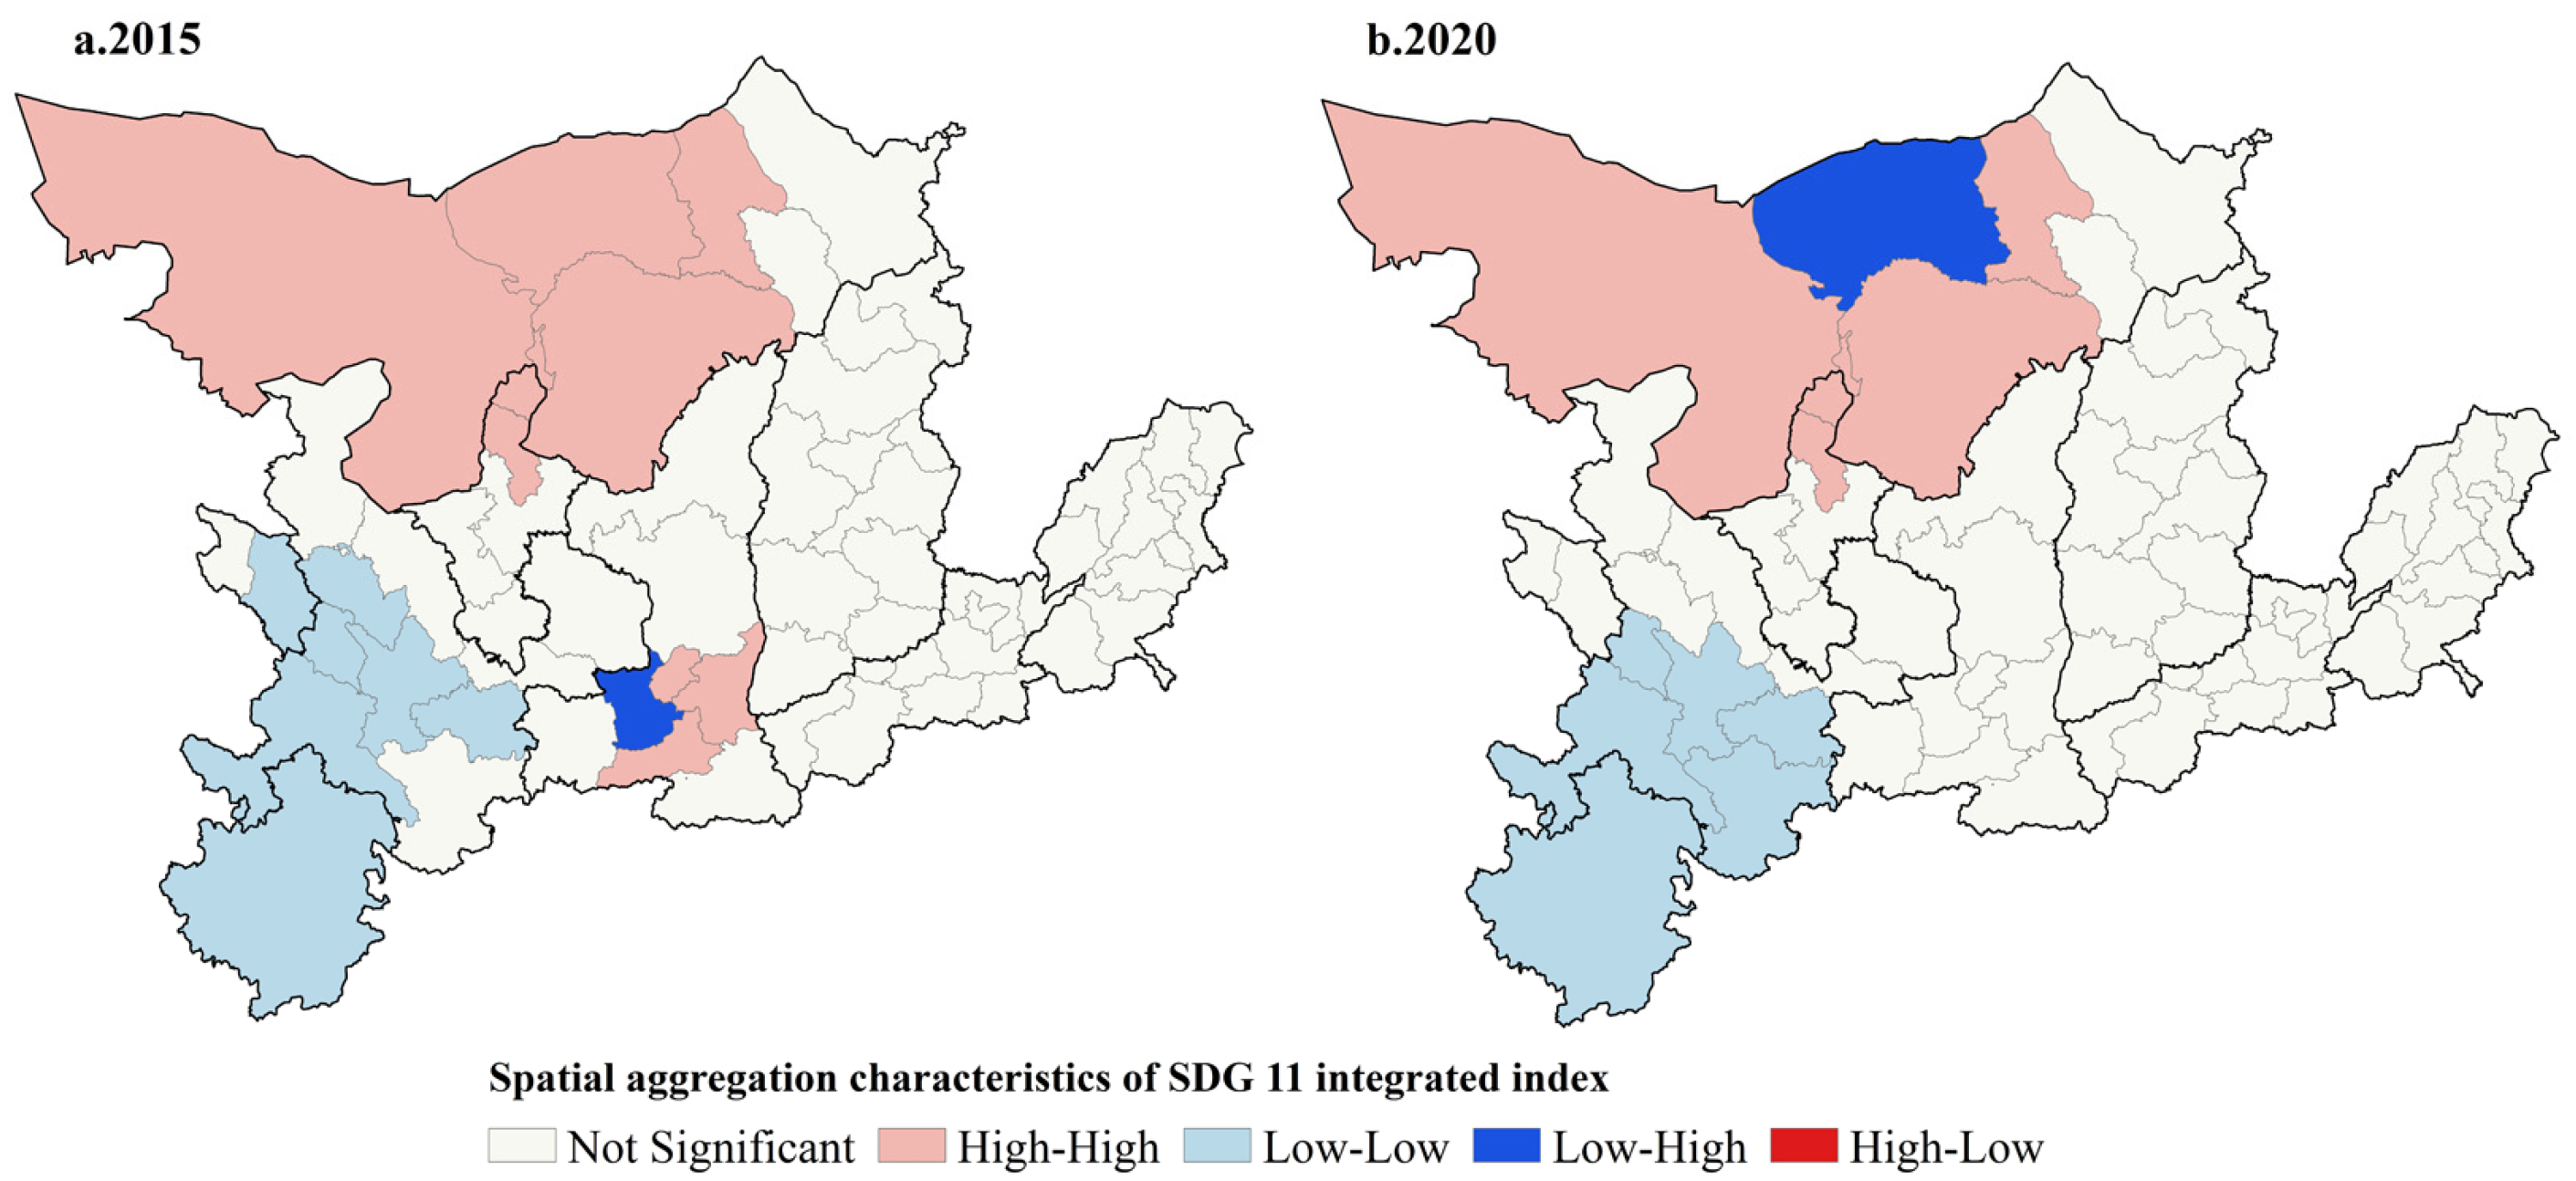
3.2. Spatial Distribution and Heterogeneity of the Integrated Index

We calculated the integrated index based on the above indicators. Figure 4 shows the spatial distribution of the SDG 11 integrated index in the Yellow River Basin. In general, the integrated index was significantly higher in Inner Mongolia, Ningxia, Central and Eastern Gansu, Shaanxi, southern Shanxi, Henan, and Shandong than in others. It went up in 59 cities and down in 5 in 2020 compared with 2015, with its average value increasing from 0.65 to 0.75. The number of cities with an integrated index value below 0.6 decreased from 13 to 3, whereas the number of those above 0.75 increased from 7 to 35. Moreover, except for Xi’an, which decreased from 0.76 to 0.73, the integrated index of other provincial capitals improved.
We used the adaptive kernel method to construct the spatial weight matrix and calculated the global Moran’s I value of the SDG 11 integrated index at prefecture-level cities in the Yellow River Basin between 2015 and 2020 with the support of GeoDa software, which was 0.41 and 0.49, respectively, at a 0.05 significance level. It indicated that the integrated index had a strong spatial aggregation effect. Cities with a higher integrated index simultaneously had higher index values for their neighbors, and vice versa. According to the spatial relationship between each city and its neighbors, the spatial distribution of cities in the Yellow River Basin was divided into four types (Figure 5) at a 0.05 significance level: High–High clusters (HH), Low–Low clusters (LL), Low–High clusters (LH), and High–Low clusters (HL). It can be seen from Figure 5 that in 2015, there were 10 cities clustered with HH, mainly distributed in Inner Mongolia, northern Ningxia, and southern Shaanxi, and seven cities clustered with LL, mainly distributed in southern Gansu and Aba Tibetan Autonomous Prefecture of Sichuan, and Xianyang clustered with LH. While, in 2020, there were six cities clustered with HH, mainly located in Inner Mongolia and northern Ningxia, and six cities clustered with LL, mainly located in southern Gansu and Aba Tibetan Autonomous Prefecture of Sichuan and Bayannur clustered with LH.

3.3. Variations in SDG 11 between 2015 and 2020

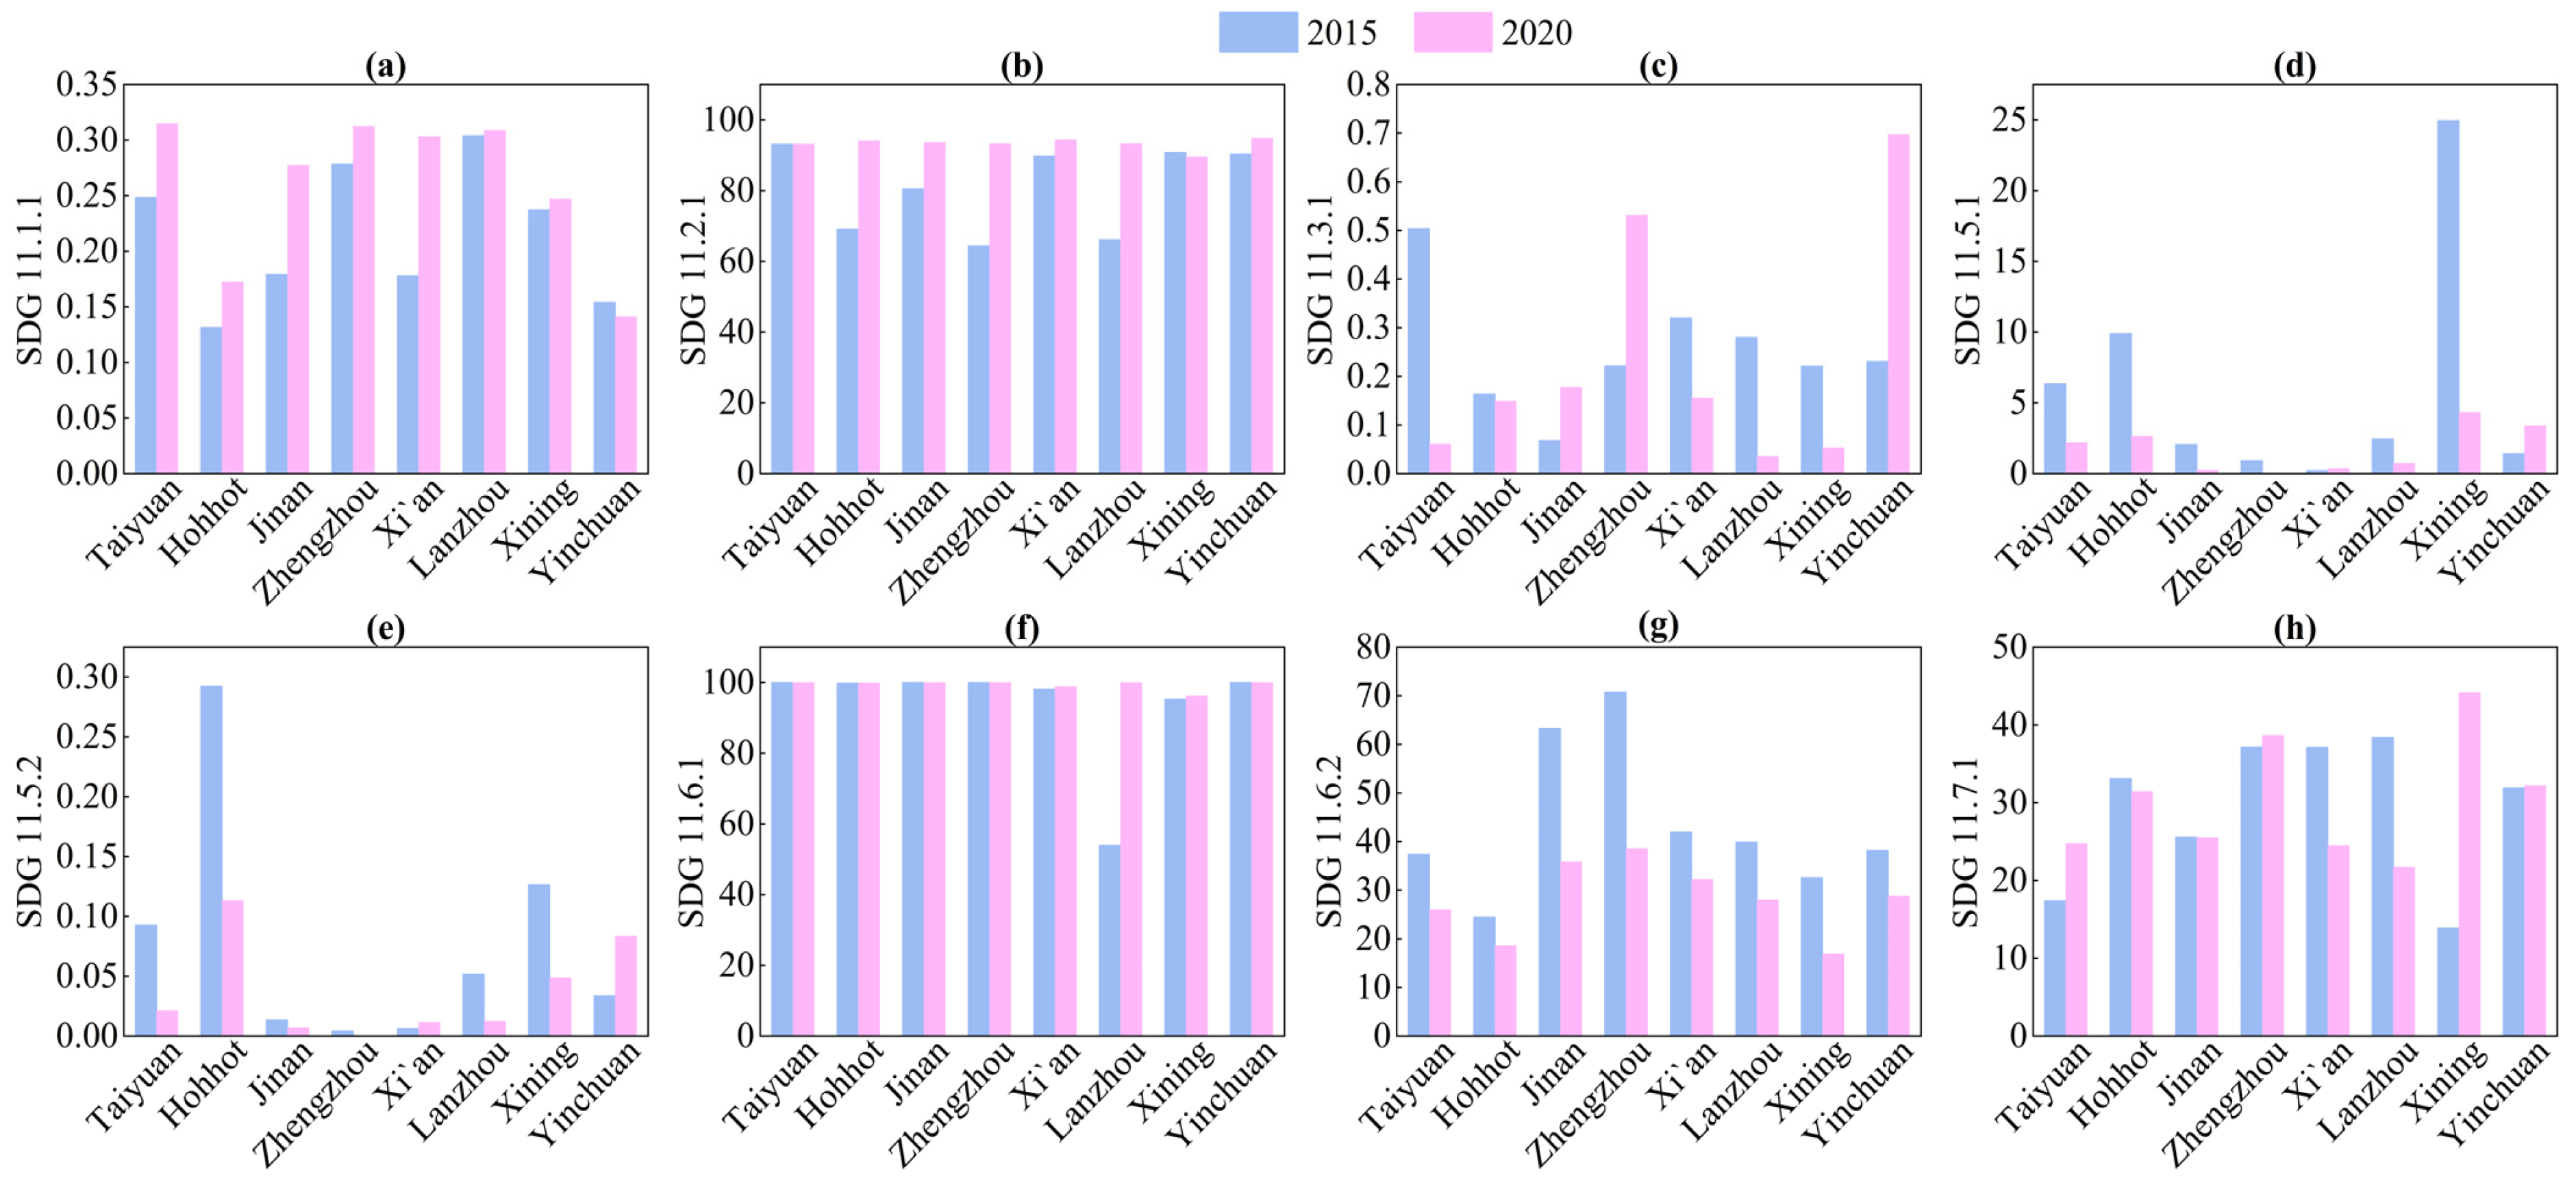
3.3.1. Differences in SDG 11 for GDP and Disposable Income Groups

We ranked the 64 prefecture-level cities in descending order by per capita GDP and took the top 10 cities with the highest per capita GDP and bottom 10 cities with the lowest per capita GDP as the top 10 cities group (referred to as “T”) and the bottom 10 cities group (referred to as “B”), respectively (Figure 6a). For example, T.SDG 11.1.1 means the average value of SDG 11.1.1 for the top 10 cities group, B.SDG 11.1.1 for the bottom 10 cities group, and the rest by parity of reasoning. Overall, the top 10 cities had a higher SDG 11 integrated index than the bottom 10 cities throughout our study period (Figure 6a), whereas the bottom 10 cities experienced a greater growth rate in that index than did the top 10 cities (Figure 6b). These dynamics were also observed in SDG 11.2.1, SDG 11.5.1, and SDG 11.6.1. On the contrary, the average value of the top 10 cities lagged behind the bottom 10 cities, but the top 10 cities had a higher growth rate than the bottom 10 cities between SDG 11.3.1 and SDG 11.6.2. Although the average value of SDG 11.1.1 in the top 10 cities was greater than the bottom 10 cities, the growth rate was negative, which meant the average value of SDG 11.1.1 decreased from 2015 to 2020 in both the top 10 and the bottom 10 cities. The top 10 cities of SDG 11.5.2 and SDG 11.7.1 had higher values than the bottom 10 cities, but the growth rate of SDG 11.5.2 was positive in the top 10 cities and negative in the bottom 10 cities. However, the growth rate of SDG 11.7.1 was opposite that of SDG 11.5.2.
Similarly, we sorted 64 cities in the Yellow River Basin in descending order by per capita disposable income level and took the top 10 cities with the highest per capita disposable income and the bottom 10 cities with the lowest per capita disposable income as the top 10 cities group (referred to as “T”) and the bottom 10 cities group (referred to as “B”) respectively (Figure 7a). For example, T.SDG 11.1.1 means the average value of SDG 11.1.1 for the top 10 cities group, B.SDG11.1.1 for the bottom 10 cities group, and so on. Notably, the top 10 and the bottom 10 groups had almost equal values of the integrated index, SDG 11.1.1, SDG 11.3.1, and SDG 11.7.1 (Figure 7a), whereas their growth rates were not the same case (Figure 7b). The top 10 cities group had lower growth rates than the bottom 10 in the integrated index and SDG 11.7.1, and the latter had a negative growth rate for the top 10 cities group. However, the case of SDG 11.3.1 is contrary to them. The growth rate of SDG 11.1.1 was negative in both groups and higher absolute value in the top 10 cities group. Then, the top 10 had higher values than the bottom 10 in SDG 11.2.1, SDG 11.5.1, and SDG 11.6.1, whereas their growth rates are just the opposite. The values’ sequence in SDG 11.5.2 for both groups was the same as before, but the growth rates for them were negative, and the bottom 10 had a higher absolute value. In addition, the value of the top 10 lagged behind the bottom 10, but the former had a higher growth rate than the latter in SDG11.6.2.

3.3.2. SDG 11 Progress between 2015 and 2020

At the Yellow River Basin level, the average values of the integrated index and seven indicators all improved except for SDG 11.1.1 which had decreased trends from 2015 to 2020 (Figure 8a). The seven indicators and integrated index that improved in order of greatest to least were SDG 11.6.2, SDG 11.2.1, SDG 11.6.1, integrated index, SDG 11.5.1, SDG 11.7.1, SDG 11.3.1, and SDG 11.5.2. Specifically, the changes in SDG 11 indicators and integrated index at the prefecture-level cities showed similar dynamics as those at the watershed scale. In terms of absolute differences in indicators and integrated index of all cities, the top five values that improved the most were Xinzhou, Lanzhou, Qingyang, and Longnan in SDG 11.6.1, and Linxia in SDG 11.5.1. While the bottom five values that decreased the most were Gannan, Longnan, and Shangluo in SDG 11.5.2, and Wuhai and Tongchuan in SDG 11.7.1 (Figure 8b).

3.4. Synergies and Trade-Offs of SDG11 Indicators

We performed Spearman’s correlation analysis of eight SDG 11 indicators in 2015 and 2020 and obtained the correlation coefficient matrix (Figure 9). The blue tones denote negative correlation coefficients, and the red tones represent positive correlation coefficients. The larger circles and brighter colors represent the larger absolute values of correlation coefficients in Figure 9. At a 0.05 significance level, there was the strongest positive relationship with a 0.87 correlation coefficient between SDG 11.5.1 and SDG 11.5.2, whereas SDG 11.2.1 and SDG 11.3.1 had the weakest positive relationship with 0.18. On the contrary, SDG 11.5.2 and SDG 11.6.2 had the strongest negative relationship with −0.51, and SDG 11.1.1 and SDG 11.6.1 had the weakest negative relationship with −0.23.
Then, we plotted the interaction network of SDG 11 indicators based on the correlation coefficients matrix (Figure 10). If the correlation coefficients are negative, it denotes trade-offs (red lines) between SDG 11 indicator pairs, and if they are positive, it denotes synergies (green lines) between indicator pairs. The thicker lines show larger absolute values of correlation coefficients and stronger correlations. The larger nodes (circles) show a greater number of indicators related to them. We found eight indicator pairs with synergies and four pairs with trade-offs. In general, SDG 11.2.1 had the most positive effects on other indicators, whereas the trade-offs were mainly manifested in SDG 11.1.1 and SDG 11.6.2. To be specific, SDG 11.1.1 was negatively correlated with SDG 11.2.1 and SDG 11.6.1. This suggested that cities with greater housing pressure had more convenient public transportation and a higher rate of domestic garbage harmless treatment. SDG 11.6.2 was a trade-off between SDG 11.5.1 and SDG 11.5.2. It meant that cities with few natural disasters had high PM2.5 concentrations.
Meanwhile, synergies also exist among indicator pairs. SDG 11.2.1 was simultaneously synergetic with SDG 11.3.1, SDG 11.5.1, SDG 11.5.2, and SDG 11.6.1, which meant that cities with more convenient public transportation had efficient urban land utilization, were less susceptible to natural disasters, and had a high rate of domestic garbage harmless treatment. SDG 11.5.1 had a stronger positive relationship with SDG 11.5.2. It was reasonable that human casualties and economic losses from natural disasters had a high positive correlation. SDG 11.6.1 was positively correlated with both SDG 11.5.1 and SDG 11.5.2. It can be seen that cities with advanced domestic waste disposal capacity were not easily affected by natural disasters. Finally, there was a synergy between SDG 11.6.2 and SDG 11.7.1, which meant that cities with good air quality had high public space rates.

4. Discussion

4.1. Policy Suggestions for Promoting Urban Sustainable Development

The results show that among SDG 11 indicators in the Yellow River Basin, the synergies were greater than the trade-offs. The most positive effects are embodied in SDG 11.2.1, whereas the trade-offs are mainly manifested in SDG 11.1.1 and SDG 11.6.2. This is basically in line with the current development status. Cities with developed economic levels have complete infrastructures, high public services coverage, and a strong ability to defend against natural disasters, but at the same time, there are also some problems, such as poor air quality and high housing pressure. Economic development and eco-environmental protection are mutually reinforcing. Therefore, in the future, it will be necessary to properly handle the relationship between them and make it a benign development. Specifically, it can be expanded from the following two aspects:
On one hand, the government should positively commit to building a green, low-carbon, and circular economic system. First, it is necessary to promote high-quality development of the manufacturing industry and transformation of resource-based industries and build a modern industrial system with its characteristics and advantages [51]. For example, giving full play to the advantages of agriculture and animal husbandry to create an efficient production and supply chain, strengthening investment in infrastructure and talent, vigorously supporting the development of emerging industries, etc. Second, developing the rural economy according to local conditions is an essential way for rural revitalization to construct beautiful villages. Finally, relying on the major strategic opportunities of the “Belt and Road” initiative, we will speed up the development of opening-up [51]. We should play up the comprehensive advantages, such as important channels, nodes, economic, and cultural histories of the Silk Road Economic Belt in its upper and middle reaches to strengthen foreign communication and cooperation and improve the level of opening up. On the other hand, it is necessary to strengthen environmental governance to provide more space for high-quality economic development. First, policymakers should increase investments in science and technology and environmental protection, improve the clean production capacity of enterprises, urge them to reduce pollution emissions from the source, reduce environmental pollution, and improve the high-quality development level of the Yellow River Basin [52]. Secondly, improving the efficiency of traditional energy utilization while vigorously developing clean energy such as hydropower, wind power, and solar energy is needed [51].

4.2. Future Research Directions

Although this study supplements the gaps in the assessment progress of SDGs at the prefecture level based on geospatial big data, there are shortcomings in the data selection. As the growth rates of indicators were calculated through the comparison of data from 2015 and 2020 (not the continuous multi-year average), and given the unexpectedness of disasters, negative progress toward indicators SDG 11.5.1/SDG 11.5.2 in some cities can only indicate that they suffered more serious disaster losses in 2020 than in 2015 and cannot reflect the overall performance during the five years between 2015 and 2020. In addition, urban sustainable development is just one of the aspects of achieving SDGs. The 17 SDGs and their indicators are closely interweaved with each other, and interactions experience a decoupling followed by a recoupling process as the sustainable development levels increase [53]. In the future, we will use long-term data to analyze the interactions between SDG 11 and other goals in the Yellow River Basin and make a contribution to the achievement of the 2030 Agenda.

5. Conclusions

This research analyzes the spatiotemporal distribution of SDG 11 indicators and integrated index, expounds on their variations in different economic groups of cities, and quantitatively identifies synergies and trade-offs among indicators in the Yellow River Basin between 2015 and 2020 based on geospatial big data. There are four points in the conclusion:
(1)
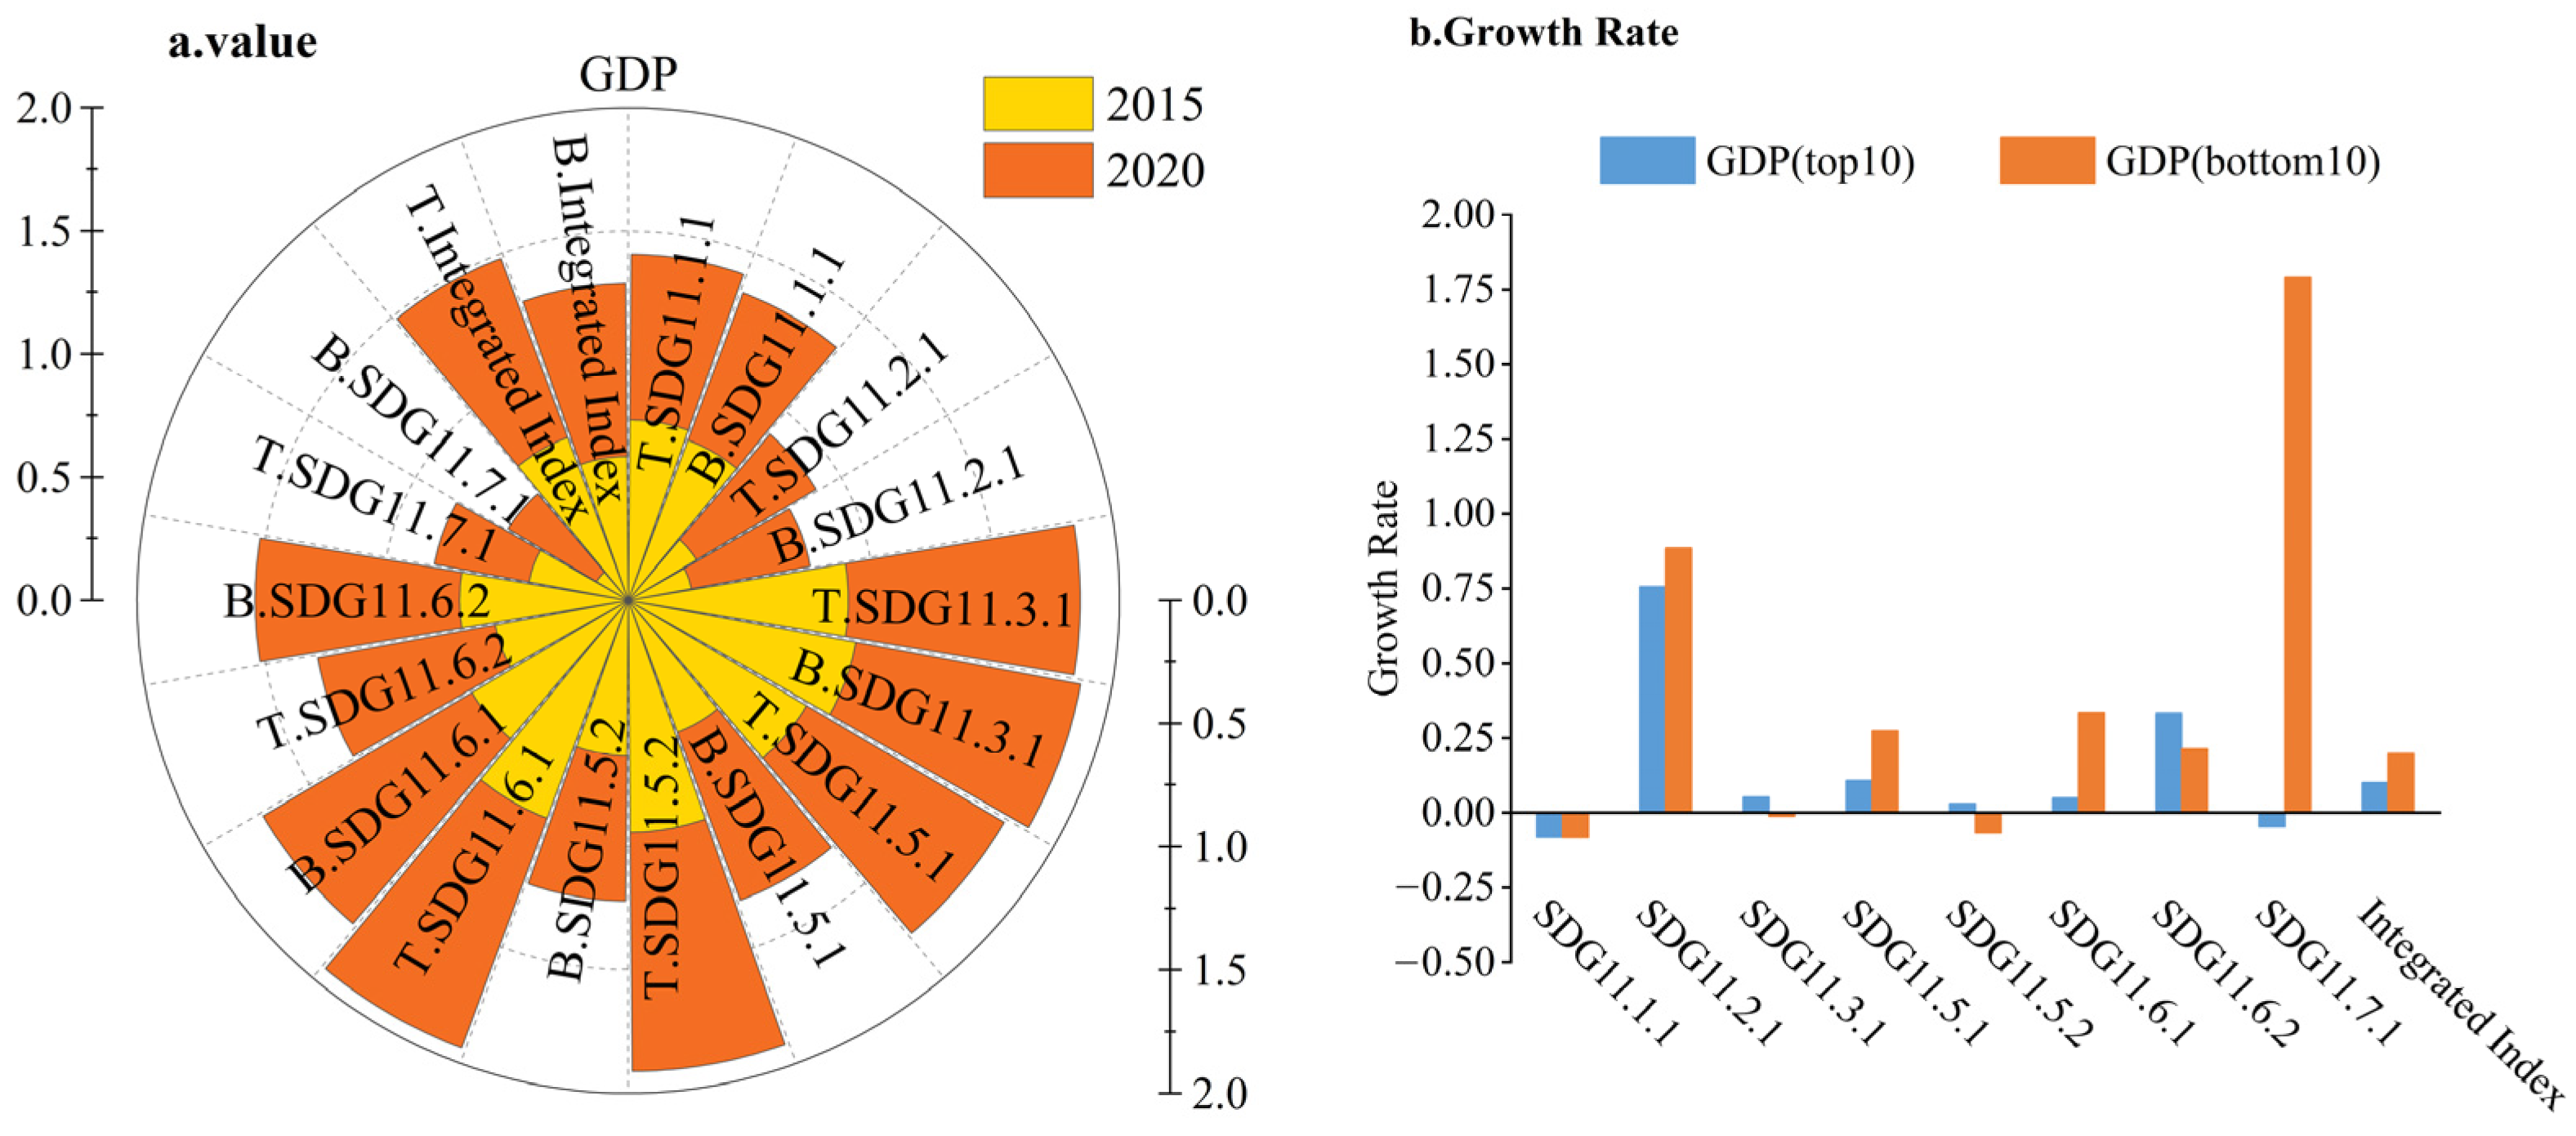
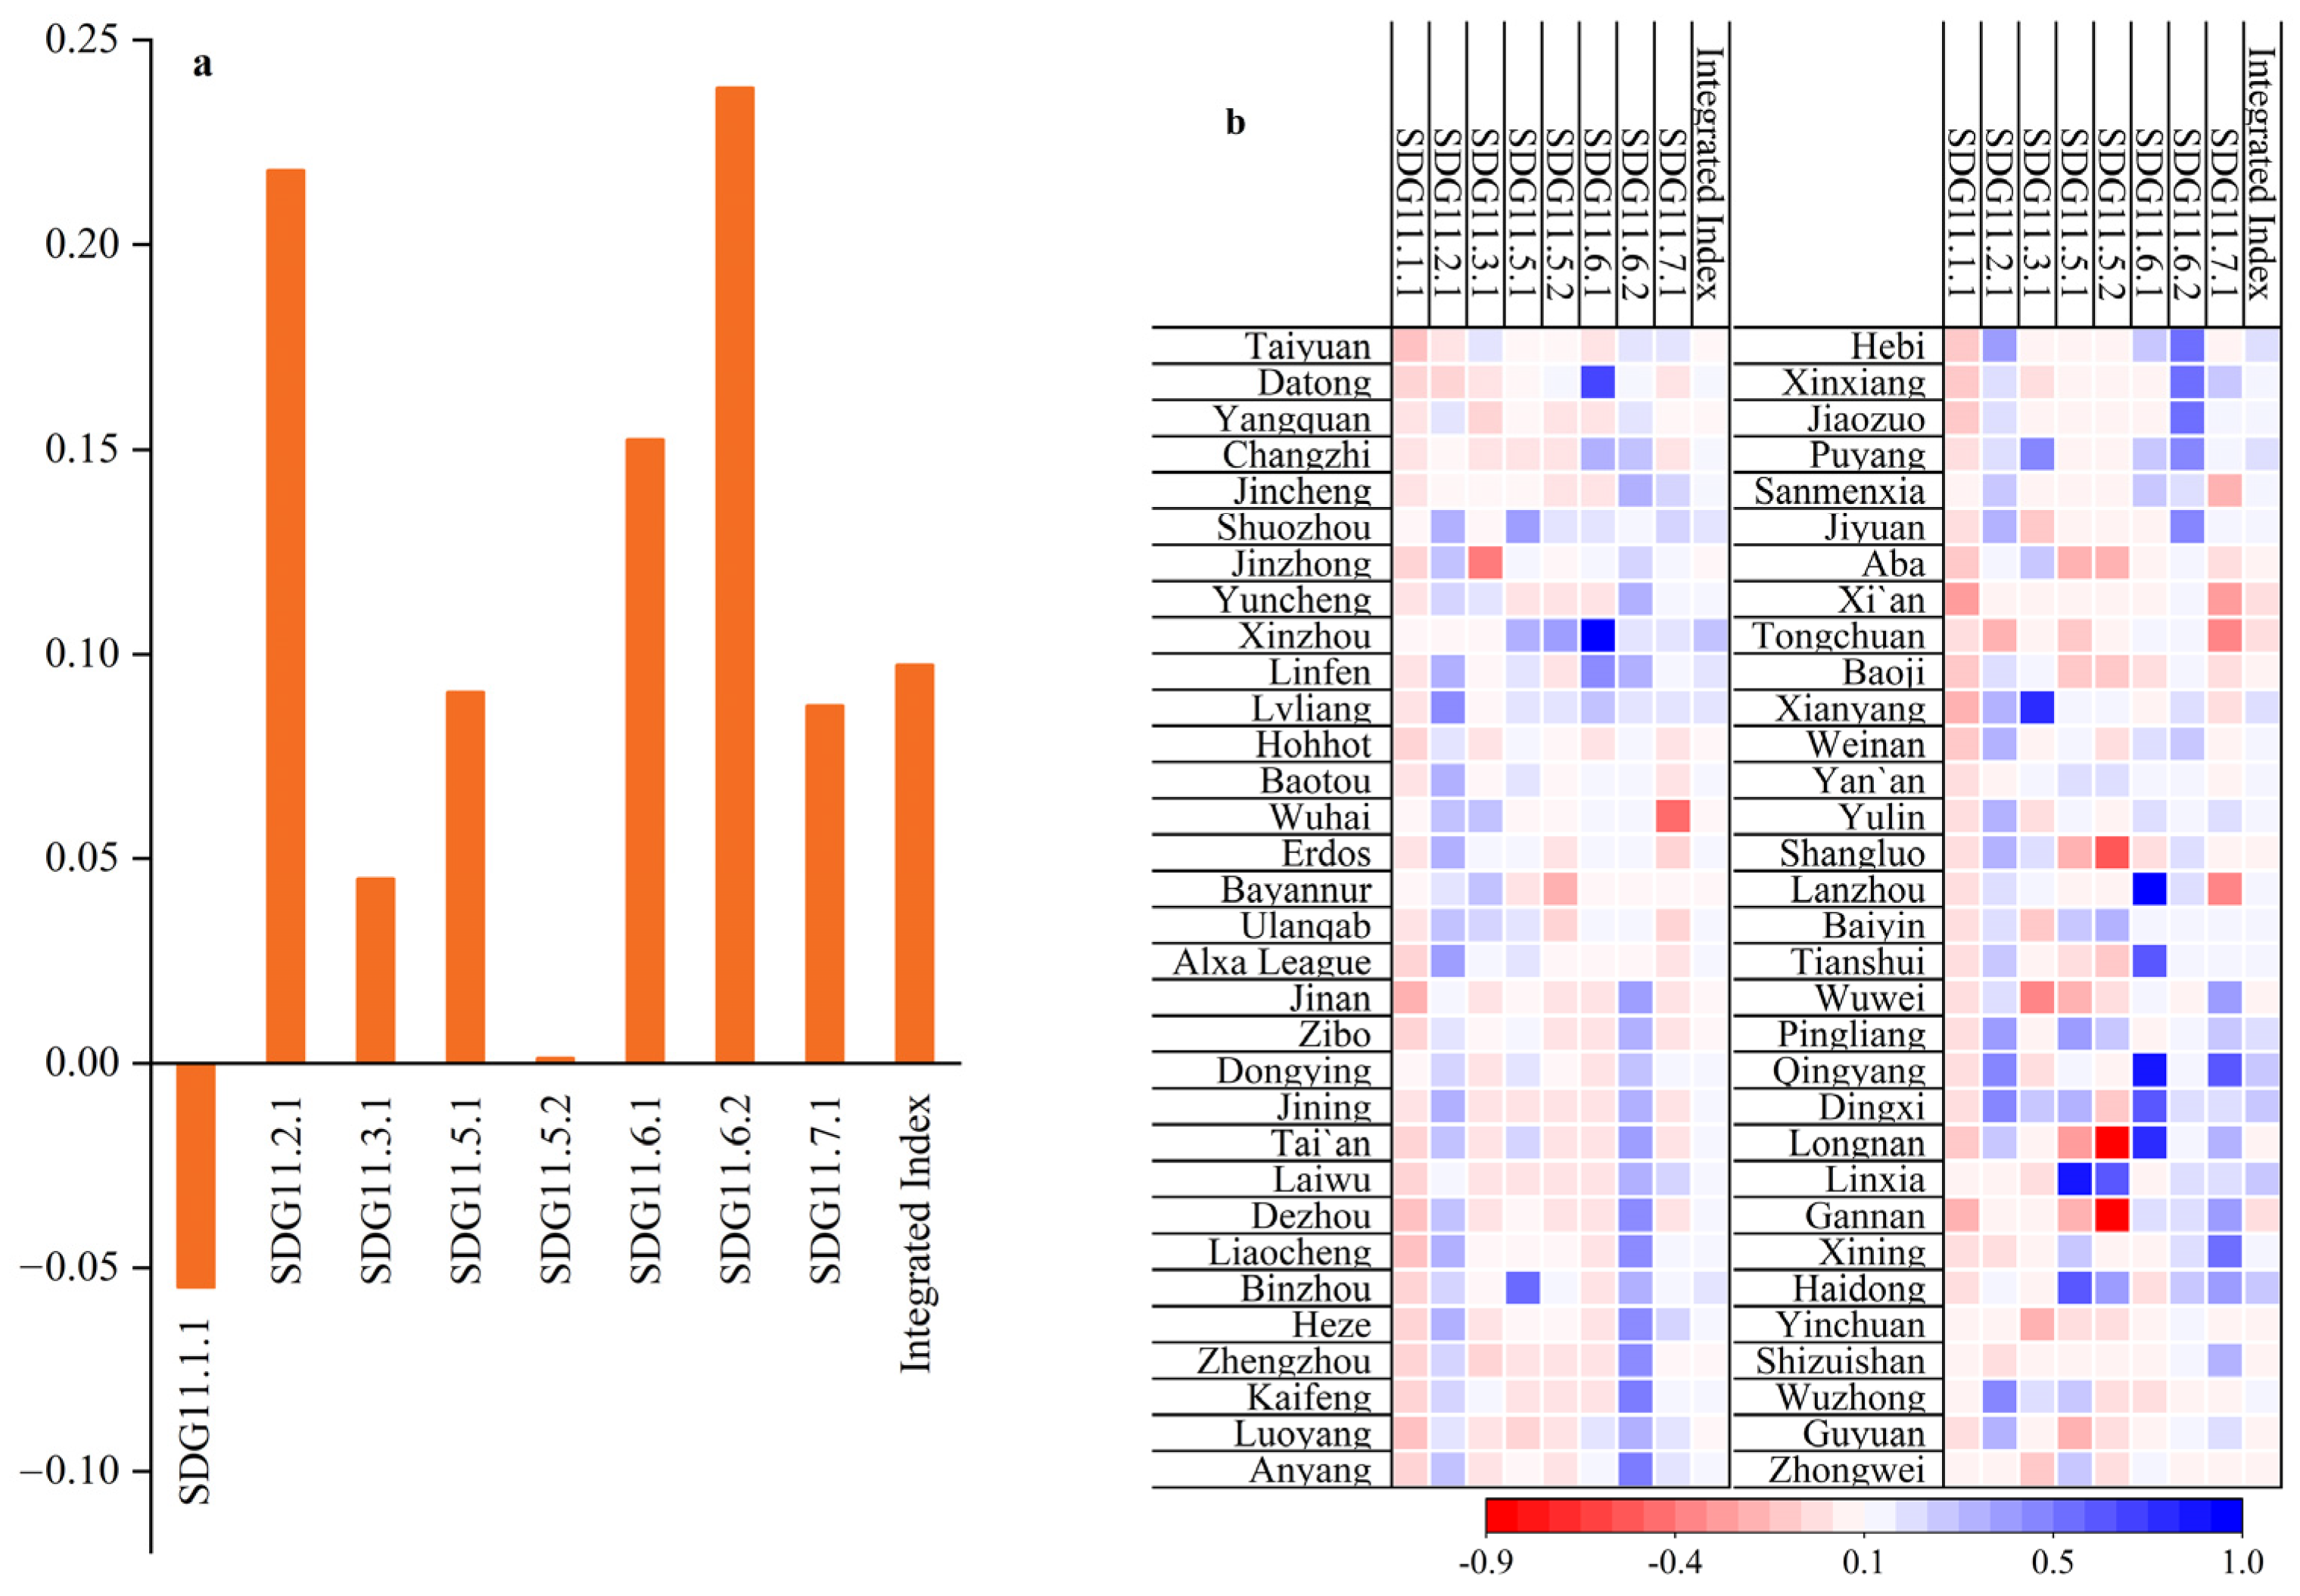
At the watershed scale, except for SDG 11.1.1, the performance of the integrated index and seven indicators improved from 2015 to 2020. The seven indicators and integrated index that improved in order of greatest to least were SDG 11.6.2, SDG 11.2.1, SDG 11.6.1, integrated index, SDG 11.5.1, SDG 11.7.1, SDG 11.3.1, and SDG 11.5.2. Specifically, the changes in SDG 11 indicators and integrated index at the prefecture-level cities showed similar dynamics as those at the watershed level;
(2)
In terms of GDP groups, the top 10 cities had higher values, whereas the bottom 10 cities experienced greater growth rates in the integrated index, SDG 11.2.1, SDG 11.5.1, and SDG 11.6.1. However, SDG 11.3.1 and SDG 11.6.2 are the opposite. Although the average value of SDG 11.1.1 in the top 10 cities was greater than in the bottom 10 cities, their growth rates were negative. Finally, SDG 11.5.2 and SDG 11.7.1 had higher values in the top 10 cities, but the growth rates of the two groups were the opposite;
(3)
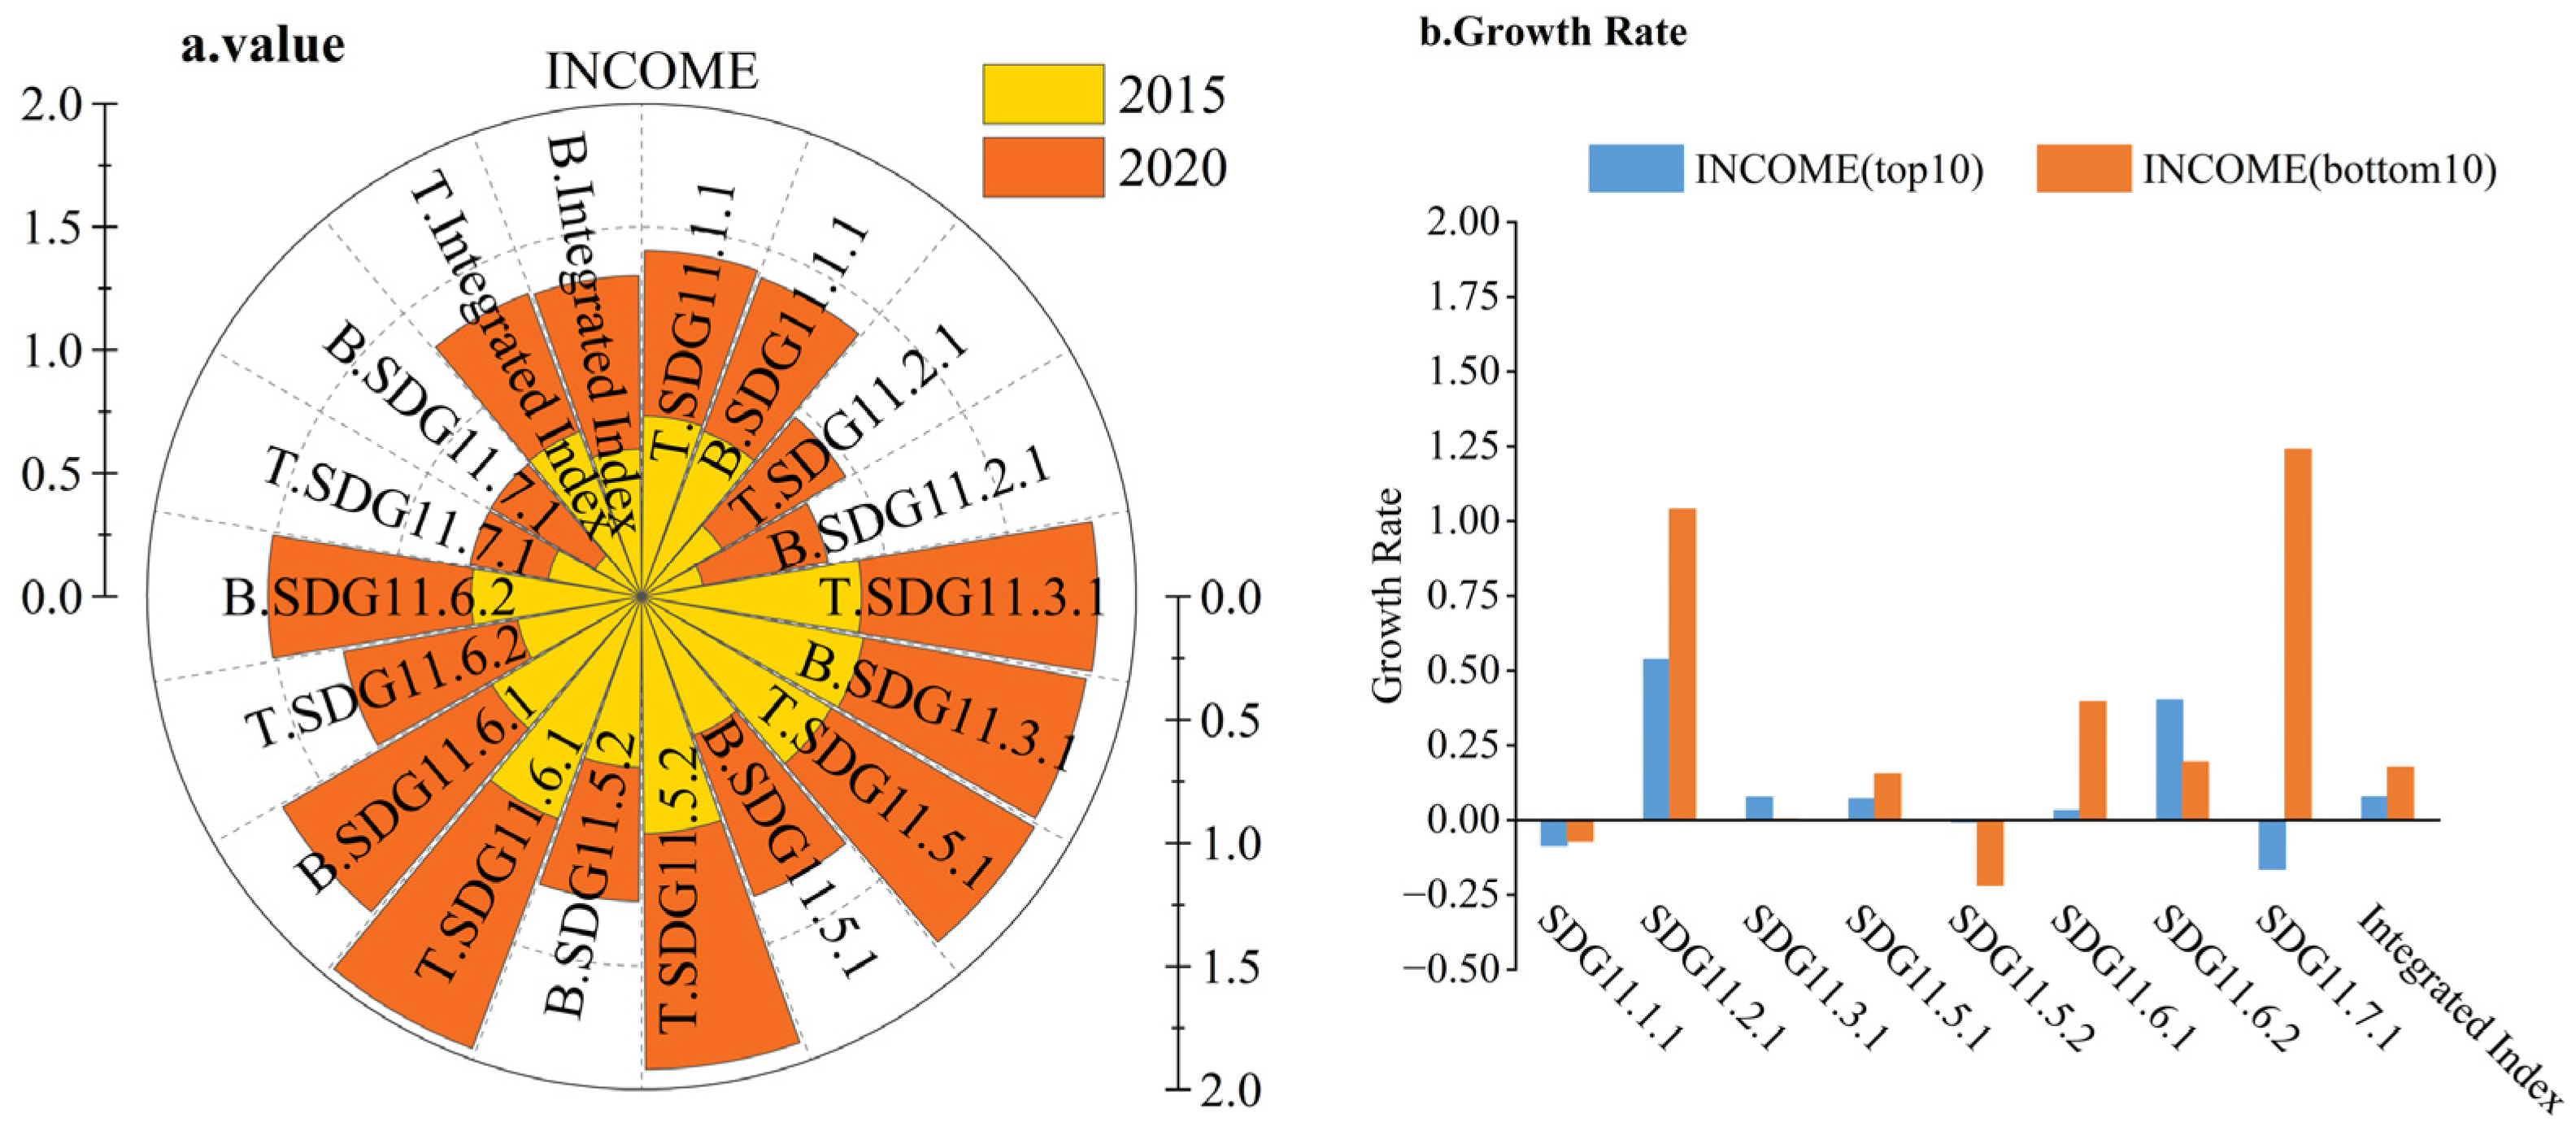
In the matter of income levels, the top 10 and the bottom 10 groups had almost equal values of the integrated index, SDG 11.1.1, SDG 11.3.1, and SDG 11.7.1, whereas their growth rates were not the same case. Then, the top 10 cities group had higher values than the bottom 10 ones in SDG 11.2.1, SDG 11.5.1, and SDG 11.6.1, whereas the case of their growth rates was just the opposite. The values’ sequence in SDG 11.5.2 for both groups was the same as before, but the growth rates for them were negative. In addition, the value of the top 10 cities group lagged behind the bottom 10 but the former had a higher growth rate than the latter in SDG 11.6.2;
(4)
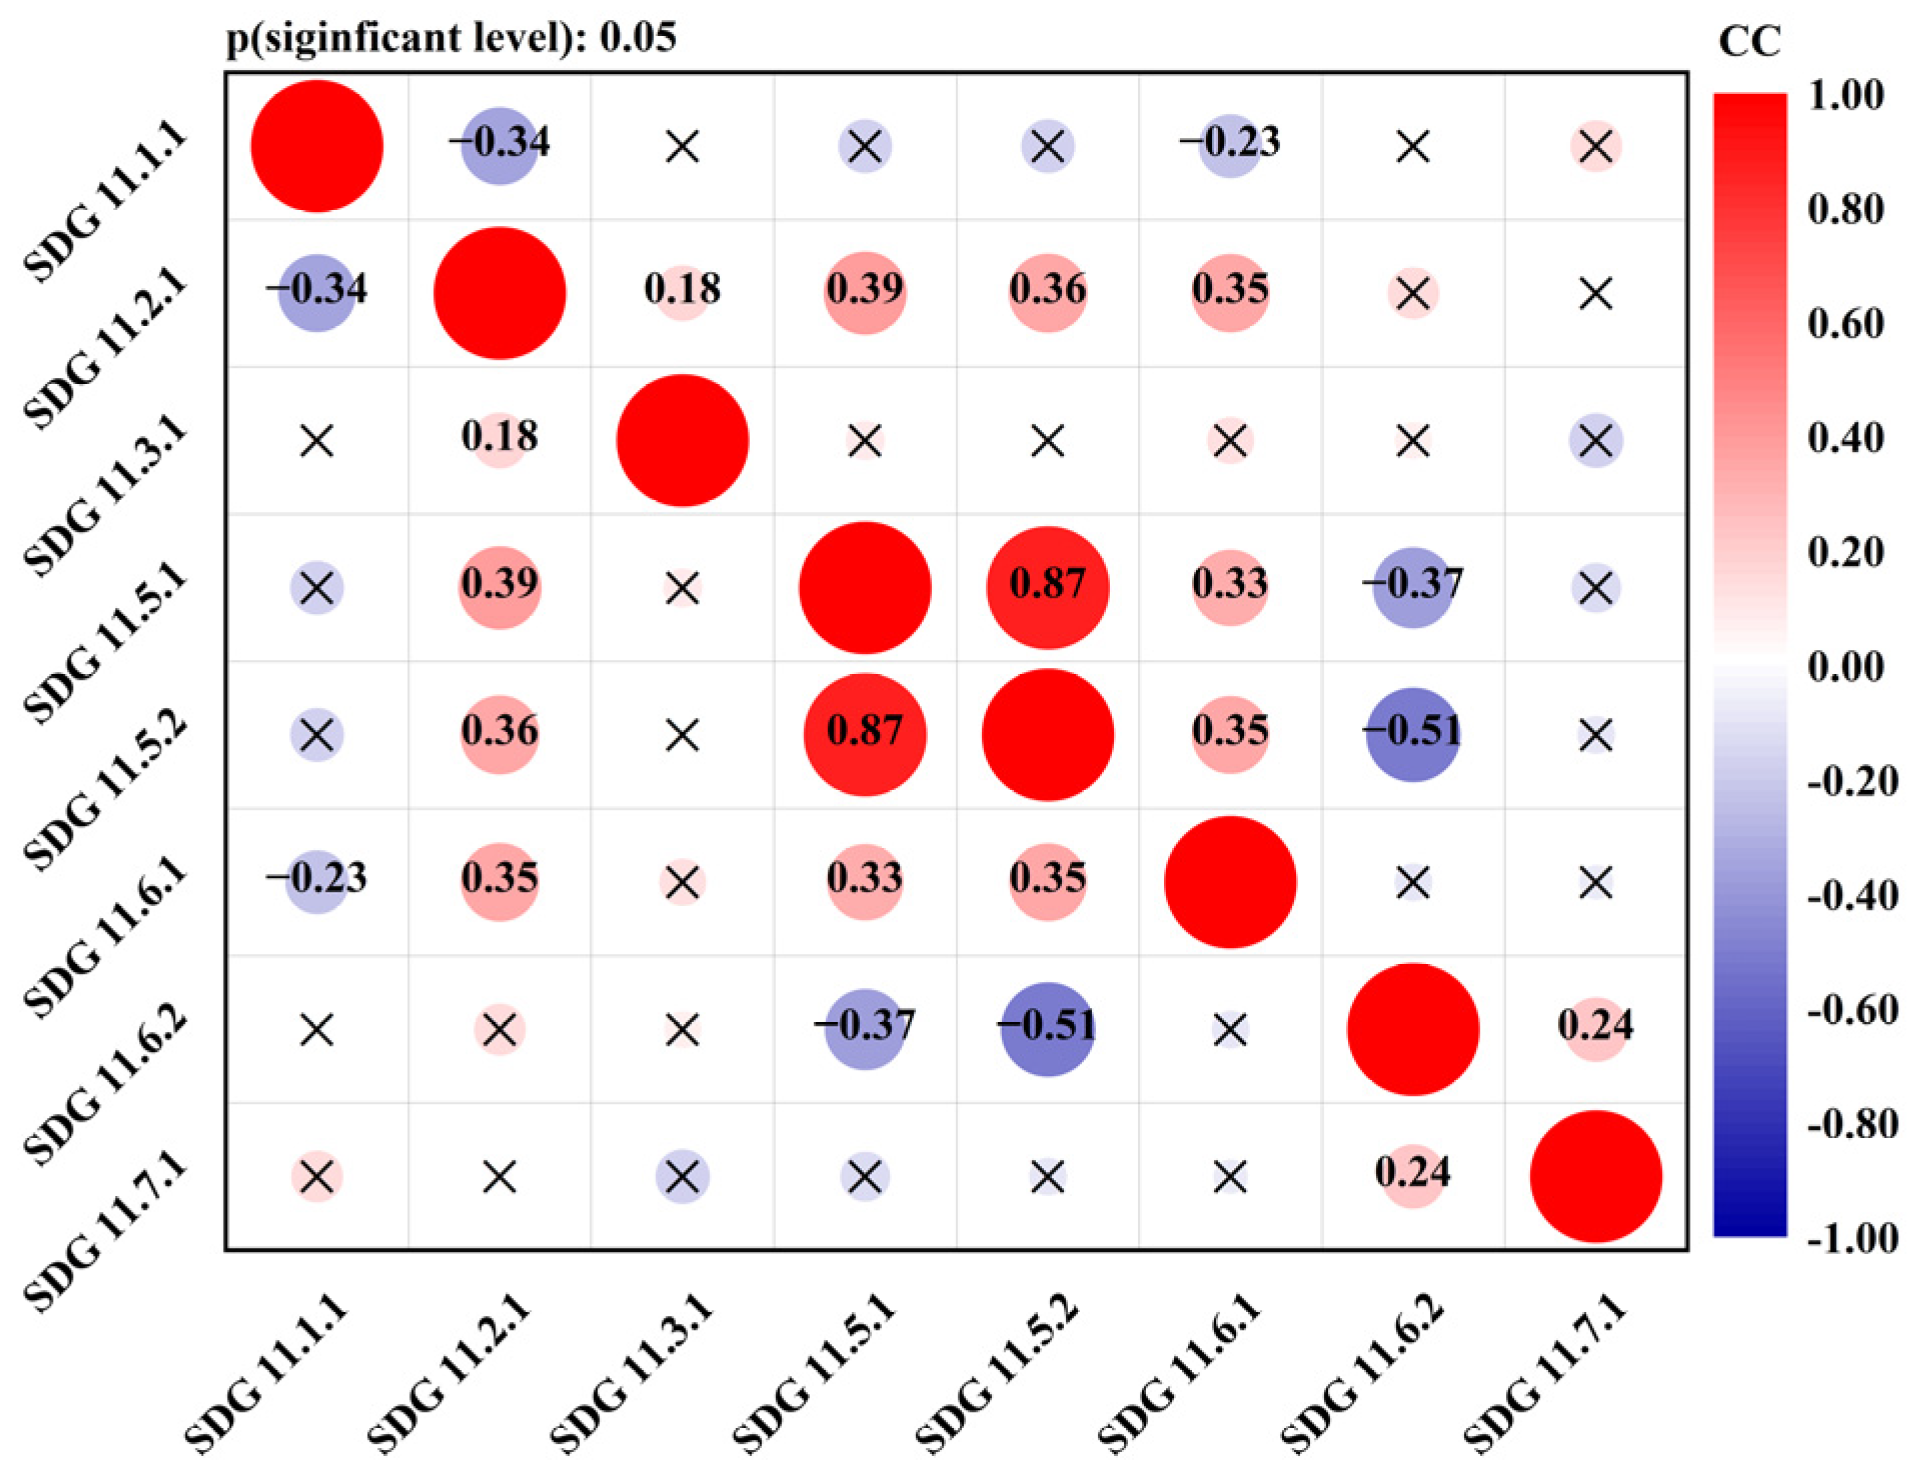
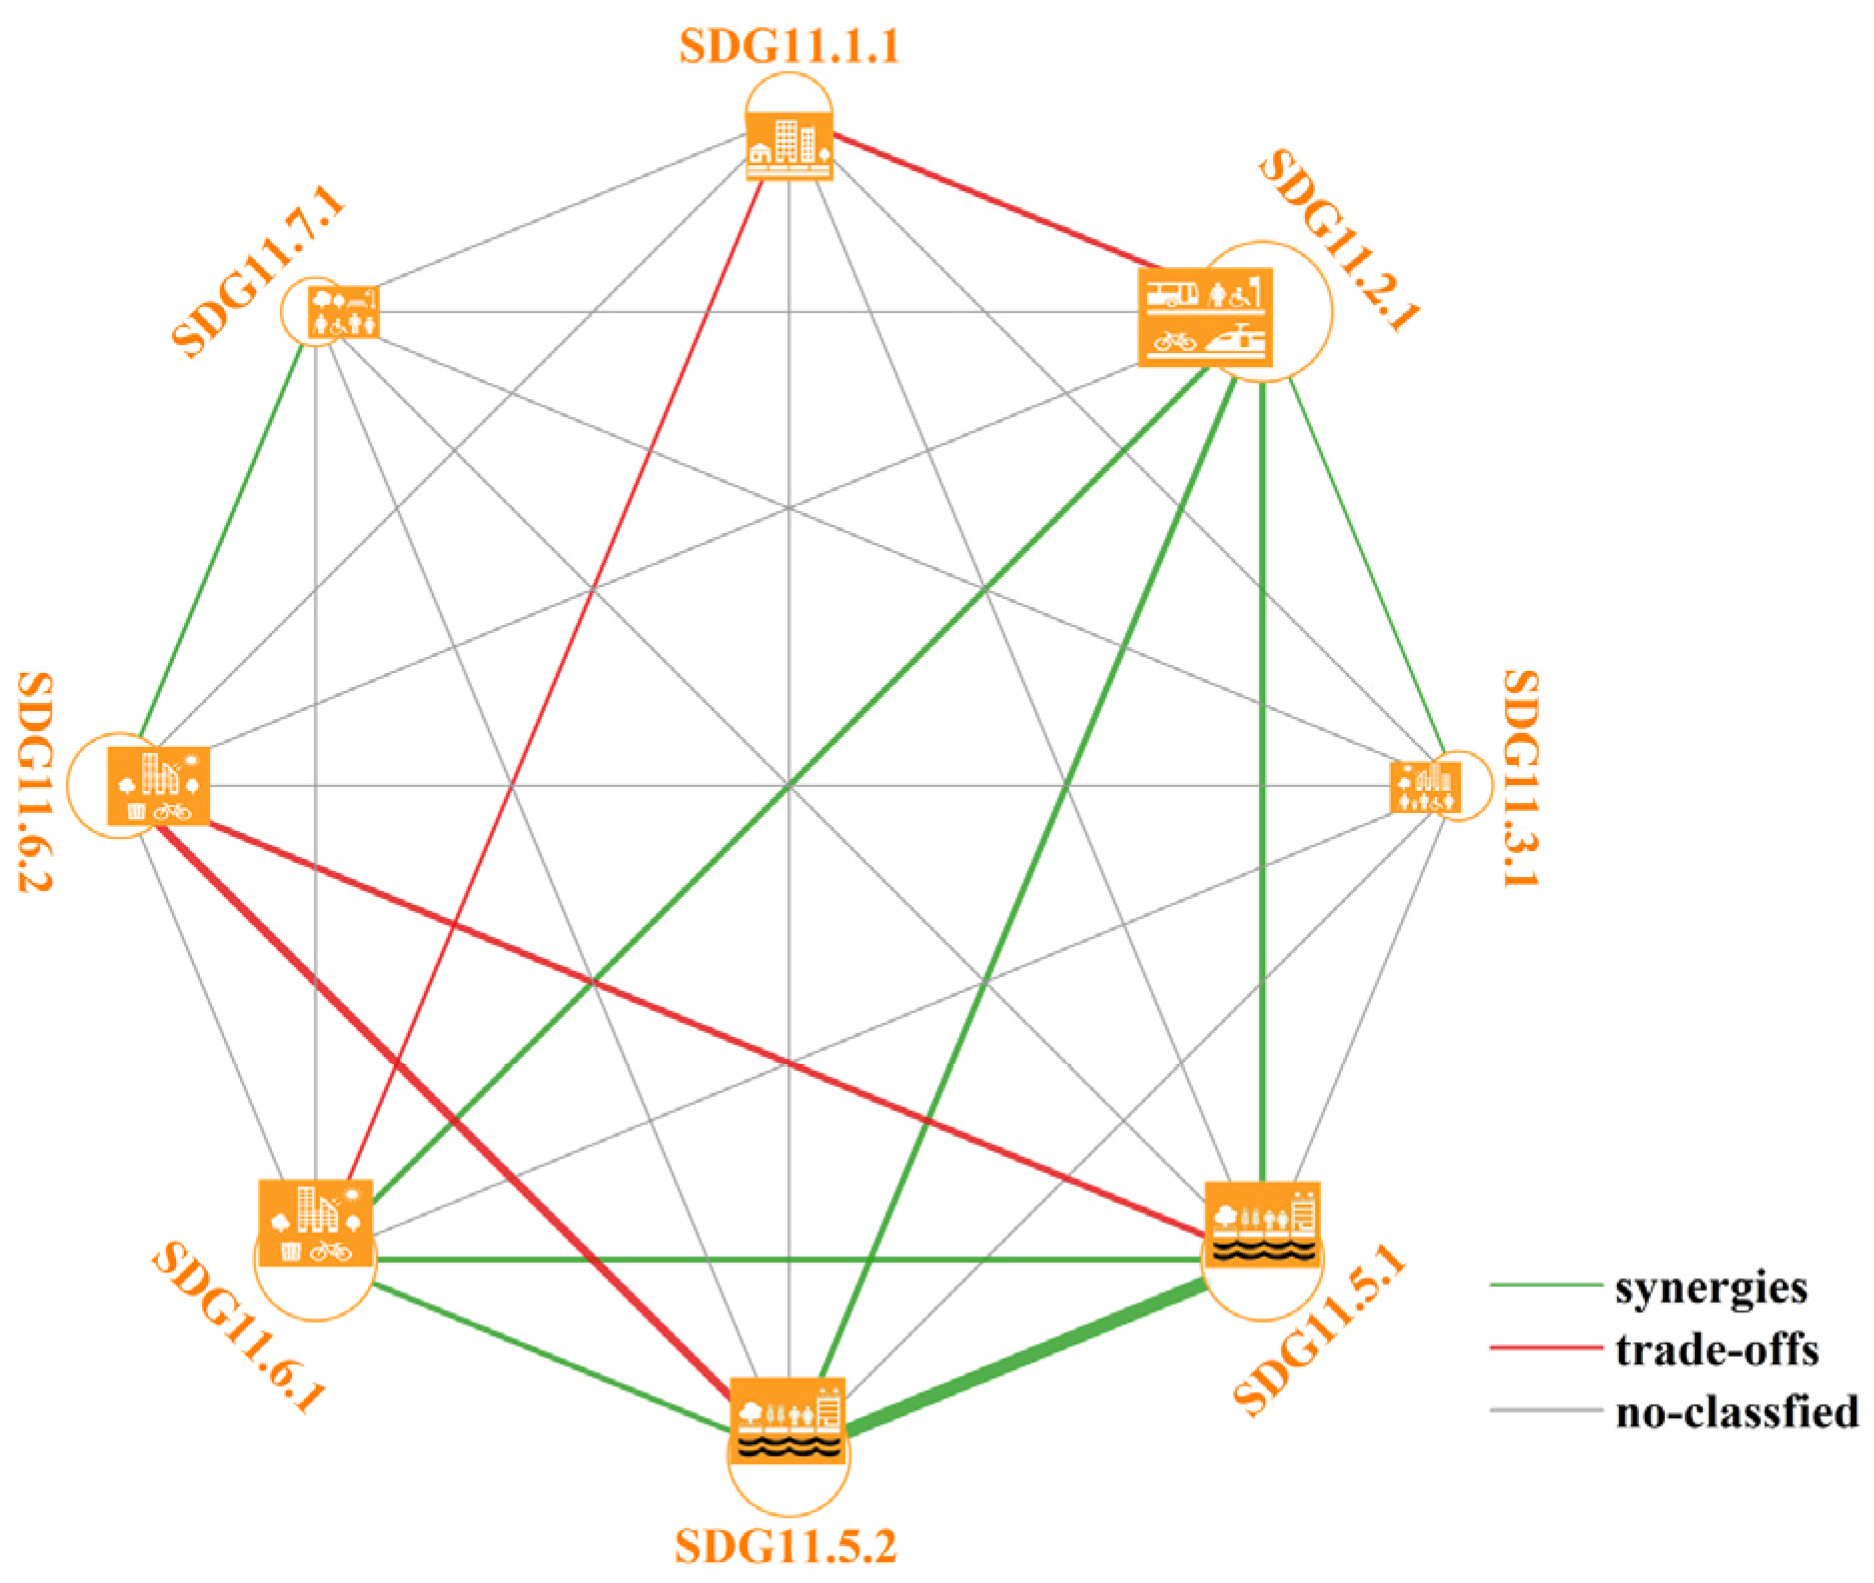
In general, among SDG 11 indicators in the Yellow River Basin, the synergies were greater than the trade-offs. To be specific, at a 0.05 significance level, there were eight pairs of indicators with synergies and four pairs with trade-offs. In addition, the most positive effects were embodied in SDG 11.2.1, whereas the trade-offs were mainly manifested in SDG 11.1.1 and SDG 11.6.2.

Author Contributions

Conceptualization, C.H., Y.F., J.G. and X.S.; methodology, Y.F. and X.S.; software, Y.F. and X.S.; writing—original draft preparation, Y.F. and X.S.; writing—review and editing, C.H., Y.F., J.G. and X.S.; visualization, Y.F.; supervision, C.H.; project administration, C.H.; funding acquisition, C.H. All authors have read and agreed to the published version of the manuscript.

Funding

This research is supported by the Open Research Program of the International Research Center of Big Data for Sustainable Development Goals (Grant No. CBAS2023ORP04), the National Natural Science Foundation of China (Grant No. 42130113), and the Gansu Science and Technology Program (Project No. 22JR5RA090).

Acknowledgments

We are grateful to anonymous reviewers for the helpful comments that improved this manuscript. and the use of data in this study. We would also like to thank Haimeng Liu, Jianghao Wang, Peng Zhang and Jinhua Tao for sharing their research data.

Conflicts of Interest

The authors declare no conflict of interest.

Nomenclature

HAIHousing affordability index
ICSUInternational Council for Science
LCRPGRRatio of land consumption rate to population growth rate
PIRPrice-to-income ratio
RIRRent-to-income ratio
SDG 11Sustainable Development Goal 11
SDGsSustainable Development Goals
SDSNSustainable Development Solutions Network
the 2030 AgendaThe 2030 Agenda for Sustainable Development
UNUnited Nations

References

  1. Elmqvist, T.; Andersson, E.; Frantzeskaki, N.; McPhearson, T.; Olsson, P.; Gaffney, O.; Takeuchi, K.; Folke, C. Sustainability and resilience for transformation in the urban century. Nat. Sustain. 2019, 2, 267–273. [Google Scholar] [CrossRef]
  2. United Nations. The Sustainable Development Goals Report 2020. 2020. Available online: https://unstats.un.org/sdgs/report/2020/ (accessed on 31 May 2021).
  3. Chinese Academy of Sciences. Big Earth Data in Support of the Sustainable Development Goals 2021. 2021. Available online: http://www.cbas.ac.cn/yjcg/yjbg/202109/P020210928347353712595.pdf (accessed on 8 January 2022).
  4. Chen, R.; Zhao, Z.; Xu, D.; Chen, Y. Progress of research on sustainable development index for cities and urban agglomerations. Prog. Geogr. 2021, 40, 61–72. [Google Scholar] [CrossRef]
  5. United Nations General Assembly. Transforming Our World: The 2030 Agenda for Sustainable Development. 2015. Available online: https://undocs.org/en/A/RES/70/1 (accessed on 16 April 2022).
  6. Pradhan, P.; Costa, L.; Rybski, D.; Lucht, W.; Kropp, J.P. A Systematic Study of Sustainable Development Goal (SDG) Interactions. Earth’s Future 2017, 5, 1169–1179. [Google Scholar] [CrossRef] [Green Version]
  7. Jiang, H.; Sun, Z.; Guo, H.; Weng, Q.; Du, W.; Xing, Q.; Cai, G. An assessment of urbanization sustainability in China between 1990 and 2015 using land use efficiency indicators. npj Urban Sustain. 2021, 1, 1–13. [Google Scholar] [CrossRef]
  8. Wang, Y.; Huang, C.; Feng, Y.; Zhao, M.; Gu, J. Using Earth Observation for Monitoring SDG 11.3.1-Ratio of Land Consumption Rate to Population Growth Rate in Mainland China. Remote. Sens. 2020, 12, 357. [Google Scholar] [CrossRef] [Green Version]
  9. Lusseau, D.; Mancini, F. Income-based variation in Sustainable Development Goal interaction networks. Nat. Sustain. 2019, 2, 242–247. [Google Scholar] [CrossRef] [Green Version]
  10. Guo, H.; Liang, D.; Sun, Z.; Chen, F.; Wang, X.; Li, J.; Zhu, L.; Bian, J.; Wei, Y.; Huang, L.; et al. Measuring and evaluating SDG indicators with Big Earth Data. Sci. Bull. 2022, 67, 1792–1801. [Google Scholar] [CrossRef]
  11. Sachs, J.; Schmidt-Traub, G.; Kroll, C.; Lafortune, G.; Fuller, G. Sustainable Development Report 2019. 2019. Available online: https://www.sdgindex.org/reports/sustainable-development-report-2019/ (accessed on 28 March 2020).
  12. Sachs, J.; Schmidt-Traub, G.; Kroll, C.; Lafortune, G.; Fuller, G.; Woelm, F. The Sustainable Development Goals and COVID-19: Sustainable Development Report 2020. 2020. Available online: https://www.sdgindex.org/reports/sustainable-development-report-2020/ (accessed on 22 February 2022).
  13. Sachs, J.; Kroll, C.; Lafortune, G.; Fuller, G.; Woelm, F. The Decade of Action for the Sustainable Development Goals: Sustainable Development Report 2021. 2021. Available online: https://www.sdgindex.org/ (accessed on 22 February 2022).
  14. Xu, Z.; Chau, S.N.; Chen, X.; Zhang, J.; Li, Y.; Dietz, T.; Wang, J.; Winkler, J.A.; Fan, F.; Huang, B.; et al. Assessing progress towards sustainable development over space and time. Nature 2020, 577, 74–78. [Google Scholar] [CrossRef]
  15. Fu, B.; Zhang, J.; Wang, S.; Zhao, W. Classification–coordination–collaboration: A systems approach for advancing Sustainable Development Goals. Natl. Sci. Rev. 2020, 7, 838–840. [Google Scholar] [CrossRef] [Green Version]
  16. Friedman, J.; York, H.; Graetz, N.; Woyczynski, L.; Whisnant, J.; Hay, S.I.; Gakidou, E. Measuring and forecasting progress towards the education-related SDG targets. Nature 2020, 580, 636–639. [Google Scholar] [CrossRef] [Green Version]
  17. Sciarra, C.; Chiarotti, G.; Ridolfi, L.; Laio, F. A network approach to rank countries chasing sustainable development. Sci. Rep. 2021, 11, 15441. [Google Scholar] [CrossRef] [PubMed]
  18. Huan, Y.; Li, H.; Liang, T. A New Method for the Quantitative Assessment of Sustainable Development Goals (SDGs) and a Case Study on Central Asia. Sustainability 2019, 11, 3504. [Google Scholar] [CrossRef] [Green Version]
  19. D’Adamo, I.; Gastaldi, M.; Imbriani, C.; Morone, P. Assessing regional performance for the Sustainable Development Goals in Italy. Sci. Rep. 2021, 11, 24117. [Google Scholar] [CrossRef] [PubMed]
  20. Huan, Y.; Liang, T.; Li, H.; Zhang, C. A systematic method for assessing progress of achieving sustainable development goals: A case study of 15 countries. Sci. Total Environ. 2021, 752, 141875. [Google Scholar] [CrossRef] [PubMed]
  21. Simon, D.; Arfvidsson, H.; Anand, G.; Bazaz, A.; Fenna, G.; Foster, K.; Jain, G.; Hansson, S.; Evans, L.M.; Moodley, N.; et al. Developing and testing the Urban Sustainable Development Goal’s targets and indicators—A five-city study. Environ. Urban. 2016, 28, 49–63. [Google Scholar] [CrossRef]
  22. Akuraju, V.; Pradhan, P.; Haase, D.; Kropp, J.P.; Rybski, D. Relating SDG11 indicators and urban scaling—An exploratory study. Sustain. Cities Soc. 2020, 52, 101853. [Google Scholar] [CrossRef]
  23. Steiniger, S.; Wagemann, E.; de la Barrera, F.; Molinos-Senante, M.; Villegas, R.; de la Fuente, H.; Vives, A.; Arce, G.; Herrera, J.-C.; Carrasco, J.-A.; et al. Localising urban sustainability indicators: The CEDEUS indicator set, and lessons from an expert-driven process. Cities 2020, 101, 102683. [Google Scholar] [CrossRef]
  24. Huang, C.; Sun, Z.; Jiang, H.; Wang, J.; Wang, P.; Tao, J.; Liu, H.; Liu, N. Big Earth Data Supports Sustainable Cities and Communities: Progress and Challenges. Bull. Chin. Acad. Sci. 2021, 36, 9. [Google Scholar] [CrossRef]
  25. Zhang, C.; Sun, Z.; Xing, Q.; Sun, J.; Xia, T.; Yu, H. Localizing Indicators of SDG11 for an Integrated Assessment of Urban Sustainability—A Case Study of Hainan Province. Sustainability 2021, 13, 11092. [Google Scholar] [CrossRef]
  26. Jiang, H.; Guo, H.; Sun, Z.; Xing, Q.; Zhang, H.; Ma, Y.; Li, S. Projections of urban built-up area expansion and urbanization sustainability in China’s cities through 2030. J. Clean. Prod. 2022, 367, 133086. [Google Scholar] [CrossRef]
  27. UN-Water. Water and Sanitation Interlinkages across the 2030 Agenda for Sustainable Development. 2016. Available online: https://www.unwater.org/publications/water-sanitation-interlinkages-across-2030-agenda-sustainable-development/ (accessed on 10 April 2020).
  28. Bleischwitz, R.; Spataru, C.; VanDeveer, S.D.; Obersteiner, M.; van der Voet, E.; Johnson, C.; Andrews-Speed, P.; Boersma, T.; Hoff, H.; van Vuuren, D.P. Resource nexus perspectives towards the United Nations Sustainable Development Goals. Nat. Sustain. 2018, 1, 737–743. [Google Scholar] [CrossRef] [Green Version]
  29. Fuso Nerini, F.; Tomei, J.; To, L.S.; Bisaga, I.; Parikh, P.; Black, M.; Borrion, A.; Spataru, C.; Castán Broto, V.; Anandarajah, G.; et al. Mapping synergies and trade-offs between energy and the Sustainable Development Goals. Nat. Energy 2018, 3, 10–15. [Google Scholar] [CrossRef] [Green Version]
  30. Fuso Nerini, F.; Sovacool, B.; Hughes, N.; Cozzi, L.; Cosgrave, E.; Howells, M.; Tavoni, M.; Tomei, J.; Zerriffi, H.; Milligan, B. Connecting climate action with other Sustainable Development Goals. Nat. Sustain. 2019, 2, 674–680. [Google Scholar] [CrossRef]
  31. Nilsson, M.; Griggs, D.; Visbeck, M. Policy: Map the interactions between Sustainable Development Goals. Nature 2016, 534, 320–322. [Google Scholar] [CrossRef] [PubMed] [Green Version]
  32. International Council for Science (ICSU). A Guide to SDG Interactions: From Science to Implementation; Griggs, D.J., Nilsson, M., Stevance, A., McCollum, S., Eds.; International Council for Science: Paris, France, 2017. [Google Scholar]
  33. Mainali, B.; Luukkanen, J.; Silveira, S.; Kaivo-oja, J. Evaluating Synergies and Trade-Offs among Sustainable Development Goals (SDGs): Explorative Analyses of Development Paths in South Asia and Sub-Saharan Africa. Sustainability 2018, 10, 815. [Google Scholar] [CrossRef] [Green Version]
  34. Zhou, X.; Moinuddin, M.; Xu, M. Sustainable Development Goals Interlinkages and Network Analysis: A Practical Tool for SDG Integration and Policy Coherence. 2017. Available online: https://www.iges.or.jp/en/pub/sustainable-development-goals-interlinkages/en (accessed on 10 April 2020).
  35. Bain, P.G.; Kroonenberg, P.M.; Johansson, L.-O.; Milfont, T.L.; Crimston, C.R.; Kurz, T.; Bushina, E.; Calligaro, C.; Demarque, C.; Guan, Y.; et al. Public views of the Sustainable Development Goals across countries. Nat. Sustain. 2019, 2, 819–825. [Google Scholar] [CrossRef] [Green Version]
  36. de Miguel Ramos, C.; Laurenti, R. Synergies and Trade-offs among Sustainable Development Goals: The Case of Spain. Sustainability 2020, 12, 10506. [Google Scholar] [CrossRef]
  37. Dawes, J.H.P. SDG interlinkage networks: Analysis, robustness, sensitivities, and hierarchies. World Dev. 2022, 149, 105693. [Google Scholar] [CrossRef]
  38. Thacker, S.; Adshead, D.; Fay, M.; Hallegatte, S.; Harvey, M.; Meller, H.; O’Regan, N.; Rozenberg, J.; Watkins, G.; Hall, J.W. Infrastructure for sustainable development. Nat. Sustain. 2019, 2, 324–331. [Google Scholar] [CrossRef]
  39. Hinz, R.; Sulser, T.B.; Huefner, R.; Mason-D’Croz, D.; Dunston, S.; Nautiyal, S.; Ringler, C.; Schuengel, J.; Tikhile, P.; Wimmer, F.; et al. Agricultural Development and Land Use Change in India: A Scenario Analysis of Trade-Offs Between UN Sustainable Development Goals (SDGs). Earth’s Future 2020, 8, e2019EF001287. [Google Scholar] [CrossRef] [Green Version]
  40. Bisaga, I.; Parikh, P.; Tomei, J.; To, L.S. Mapping synergies and trade-offs between energy and the sustainable development goals: A case study of off-grid solar energy in Rwanda. Energy Policy 2021, 149, 112028. [Google Scholar] [CrossRef]
  41. Wang, M.; Janssen, A.B.G.; Bazin, J.; Strokal, M.; Ma, L.; Kroeze, C. Accounting for interactions between Sustainable Development Goals is essential for water pollution control in China. Nat. Commun. 2022, 13, 730. [Google Scholar] [CrossRef]
  42. Yellow River Conservancy Commission. Huanghe Nianjian; Yellow River Yearbook Press: Zhengzhou, China, 2021. [Google Scholar] [CrossRef]
  43. Zhai, T.; Zhang, D.; Zhao, C. How to optimize ecological compensation to alleviate environmental injustice in different cities in the Yellow River Basin? A case of integrating ecosystem service supply, demand and flow. Sustain. Cities Soc. 2021, 75, 103341. [Google Scholar] [CrossRef]
  44. OECD; European Commission; JRC. Handbook on Constructing Composite Indicators_Methodology and User Guide; OECD Publishing: Paris, France, 2008. [Google Scholar] [CrossRef]
  45. Li, X.; Cao, C.; Chang, C. The First Law of Geography and Spatial-Temporal Proximity. Chin. J. Nat. 2007, 29, 69–71. [Google Scholar]
  46. Tobler, W.R. A Computer Movie Simulating Urban Growth in the Detroit Region. Econ. Geogr. 1970, 46, 234–240. [Google Scholar] [CrossRef]
  47. Anselin, L. Local Indicators of Spatial Association-LISA. Geogr. Anal. 1995, 27, 93–115. [Google Scholar] [CrossRef]
  48. De Winter, J.C.; Gosling, S.D.; Potter, J. Comparing the Pearson and Spearman correlation coefficients across distributions and sample sizes: A tutorial using simulations and empirical data. Psychol. Methods 2016, 21, 273–290. [Google Scholar] [CrossRef] [PubMed]
  49. Hauke, J.; Kossowski, T. Comparison of Values of Pearson’s and Spearman’s Correlation Coefficients on the Same Sets of Data. Quageo 2011, 30, 87–93. [Google Scholar] [CrossRef] [Green Version]
  50. United Nations Statistics Division. SDG Indicator Metadata-11.7.1. 2021. Available online: https://unstats.un.org/sdgs/metadata/ (accessed on 28 April 2022).
  51. Jiang, H. Study on the Coupling Coordination between Economic Development and Ecological Environment Protection in Cities along the Yellow River Basin; Zhengzhou University of Light Industry: Zhengzhou, China, 2022. [Google Scholar]
  52. Zhou, Q. Impact Mechanism of Environmental Regulation on High-Quality Development of the Yellow River Basin; Northwest University: Xi’an, China, 2021. [Google Scholar]
  53. Wu, X.; Fu, B.; Wang, S.; Song, S.; Li, Y.; Xu, Z.; Wei, Y.; Liu, J. Decoupling of SDGs followed by re-coupling as sustainable development progresses. Nat. Sustain. 2022, 5, 452–459. [Google Scholar] [CrossRef]
Figure 1. Sketch map of prefecture-level cities in the Yellow River Basin.
Remotesensing 15 01668 g001
Figure 2. Spatial distribution of SDG 11 indicators between 2015 and 2020. (a) housing affordability index; (b) the proportion of the population that has convenient access to public transport; (c) the ratio of land consumption rate to population growth rate; (d) the number of deaths, missing persons, and directly affected persons attributed to disasters per 100,000 population; (e) direct economic loss in relation to regional GDP attributed to disasters; (f) rate of domestic garbage harmless treatment; (g) annual average PM2.5; (h) average share of the built-up area of cities that is open space for public use for all. (a,c,d,e,g) are negative indicators, and the smaller their values, the more sustainability. (b,f,h) are positive indicators, and the larger their values, the more sustainability.
Remotesensing 15 01668 g002
Figure 3. Comparison of SDG 11 indicators for provincial capitals in the Yellow River Basin between 2015 and 2020. (a) housing affordability index; (b) the proportion of the population that has convenient access to public transport; (c) the ratio of land consumption rate to population growth rate; (d) the number of deaths, missing persons, and directly affected persons attributed to disasters per 100,000 population; (e) direct economic loss in relation to regional GDP attributed to disasters; (f) rate of domestic garbage harmless treatment; (g) annual average PM2.5; (h) average share of the built-up area of cities that is open space for public use for all. (a,c,d,e,g) are negative indicators, and the smaller their values, the more sustainability. (b,f,h) are positive indicators, and the larger their values, the more sustainability.
Remotesensing 15 01668 g003
Figure 4. Spatial distribution of the SDG 11 integrated index between 2015 and 2020. The higher the values, the more sustainable they are. (a) SDG 11 integrated index in 2015; (b) SDG 11 integrated index in 2020.
Remotesensing 15 01668 g004
Figure 5. Spatial heterogeneity analysis of the integrated index between 2015 and 2020. (a) spatial aggregation characteristics of SDG 11 integrated index in 2015; (b) spatial aggregation characteristics of SDG 11 integrated index in 2020. High–High clusters (HH) indicate that a city has a high integrated index value and is surrounded by cities with high values; Low–Low clusters (LL) indicate that a city has a low integrated index value and is surrounded by cities with low values; Low–High clusters (LH) indicate that a city has a low integrated index value and is surrounded by cities with high values; High–Low clusters (HL) indicate that a city has a high integrated index value and is surrounded by cities with low values.
Remotesensing 15 01668 g005
Figure 6. The average value and growth rate of indicators and an integrated index for the per capita GDP group. (a) average value. T.SDG 11.1.1 means the average value of SDG 11.1.1 for the top 10 cities group, B.SDG 11.1.1 for the bottom 10 cities group, and the rest by parity of reasoning; (b) growth rate of average value between the top 10 cities group and the bottom 10 cities group from 2015 to 2020.
Remotesensing 15 01668 g006
Figure 7. The average value and growth rate of indicators and an integrated index for the per capita disposable income group. (a) average value. T.SDG 11.1.1 means the average value of SDG 11.1.1 for the top 10 cities group, B.SDG 11.1.1 for the bottom 10 cities group, and so on; (b) growth rate of average value between top10 group and bottom10 group from 2015 to 2020.
Remotesensing 15 01668 g007
Figure 8. Progress in indicators and integrated index between 2015 and 2020. (a) progress in average values of all cities between 2015 and 2020 in the Yellow River Basin; (b) progress in each city between 2015 and 2020 in the Yellow River Basin.
Remotesensing 15 01668 g008
Figure 9. Correlation coefficients matrix of indicator pairs (×denotes the insignificant sign, values in the circle denote correlation coefficients of indicator pairs at the 0.05 significance level).
Remotesensing 15 01668 g009
Figure 10. Interaction network (thickness of red and green lines means the magnitude of trade-offs and synergies between indicator pairs, and the larger absolute values, the thicker the lines. The size of nodes indicates the number of indicators that are related to the current node, and the greater number of indicators, the larger the size of the nodes).
Remotesensing 15 01668 g010
Table 1. Summary of integrated assessment of SDGs methods and their applications.
AuthorsTimeResearch PrioritiesMethodsRegion
(1)
Integrated assessment of the 17 SDGs index
SDSN [11,12,13]2019–2021Assessed the SDG index and dashboards of the 17 SDGs for every country in the world.Arithmetic meansWorld
Xu et al. [14]2020Calculated the SDG index for the national scale and provincial-level administrative division of China.Arithmetic meansCountry, Province
Sciarra et al. [17]2021Calculated the SDG index to rank countries for their achievements.Network scienceWorld
(2)
Assessment of SDGs’ progress from society, economy, and environmental dimensions
Huan et al. [18]2019Assessed the SDGs scores and analyzed the SDGs performance of Kazakhstan and Kyrgyzstan.Arithmetic means, Chow TestCountry
D’Adamo et al. [19]2021Discussed the progress of SDGs in Italy under two scenarios of equal weight for indicators and goals, respectively.Arithmetic means, MCDACountry
Region
Huan et al. [20]2021Assessed the progress of achieving SDGs in 15 countries along the “Belt and Road”.Composite SDG indexCountry
(3)
Assessment of SDGs’ achievement from the perspective of cities’ sustainability
Simon et al. [21]2016Put forward 10 principles for the evaluation of international cities’ sustainable development based on SDG11.Qualitative researchCity
Akuraju et al. [22]2020Explored the relationships between countrywide SDG11 indicators and urban scaling exponents.Linear regressionCity
Wang et al. [8]2020Evaluated urbanization sustainability by monitoring SDG 11.3.1 between 1990 and 2010 in mainland China.Spatial analysisCity
Chen et al. [4]2021Put forward the methodology of constructing the sustainable development index of cities and urban agglomerations and the idea of establishing the “dashboard” of urban development.Qualitative researchCity
Huang et al. [24]2021Monitoring the progress of SDG 11 indicators and proposing some challenges that currently exist.Arithmetic meansCountry
Zhang et al. [25]2021Localized the SDG 11 indicators and integrated assessment of SDG 11 indicators in Hainan Province.Arithmetic meansCity
County
Jiang et al. [7]2021Assessing urbanization sustainability in China by comparing the relationship between land, population, and economic urbanization.Spatial analysisCity
Jiang et al. [26]2022Projected urbanization sustainability in 2020–2030 under the Shared Socioeconomic Pathways (SSPs).An integrated downscaling approach of trend extrapolation and regression analysisProvince
Table 2. The description of SDG 11 indicators.
TargetIndicatorData Sources
11.1 Housing11.1.1 Proportion of urban population living in slums, informal settlements, or inadequate housingHousing Affordability Index
11.2 Convenient access to public transport11.2.1 Proportion of the population that has convenient access to public transport, by sex, age and persons with disabilitiesPublic transportation information data
11.3 Urbanization11.3.1 Ratio of land consumption rate to the population growth rateLand consumption rate;
Population growth rate
11.5 Urban disasters11.5.1 Number of deaths, missing persons, and directly affected persons attributed to disasters per 100,000 populationHazard data
11.5.2 Direct economic loss in relation to global GDP, damage to critical infrastructure, and number of disruptions to basic services, attributed to disastersHazard data
11.6 Environmental impact11.6.1 Proportion of urban solid waste regularly collected and with adequate final discharge out of total urban solid waste generated, by citiesRate of domestic garbage harmless treatment
11.6.2 Annual mean levels of fine particulate matter (e.g., PM2.5 and PM10) in cities (population weighted)Annual average PM2.5
11.7 Open public space11.7.1 Average share of the built-up area of cities that is open space for public use for all, by sex, age, and persons with disabilitiesPublic space data
Disclaimer/Publisher’s Note: The statements, opinions and data contained in all publications are solely those of the individual author(s) and contributor(s) and not of MDPI and/or the editor(s). MDPI and/or the editor(s) disclaim responsibility for any injury to people or property resulting from any ideas, methods, instructions or products referred to in the content.

