
Insights into the Movement and Diffusion Accumulation Characteristics of a Catastrophic Rock Avalanche Debris—A Case Study

 ,
,  ,
, 
 and
and
Abstract
:1. Introduction
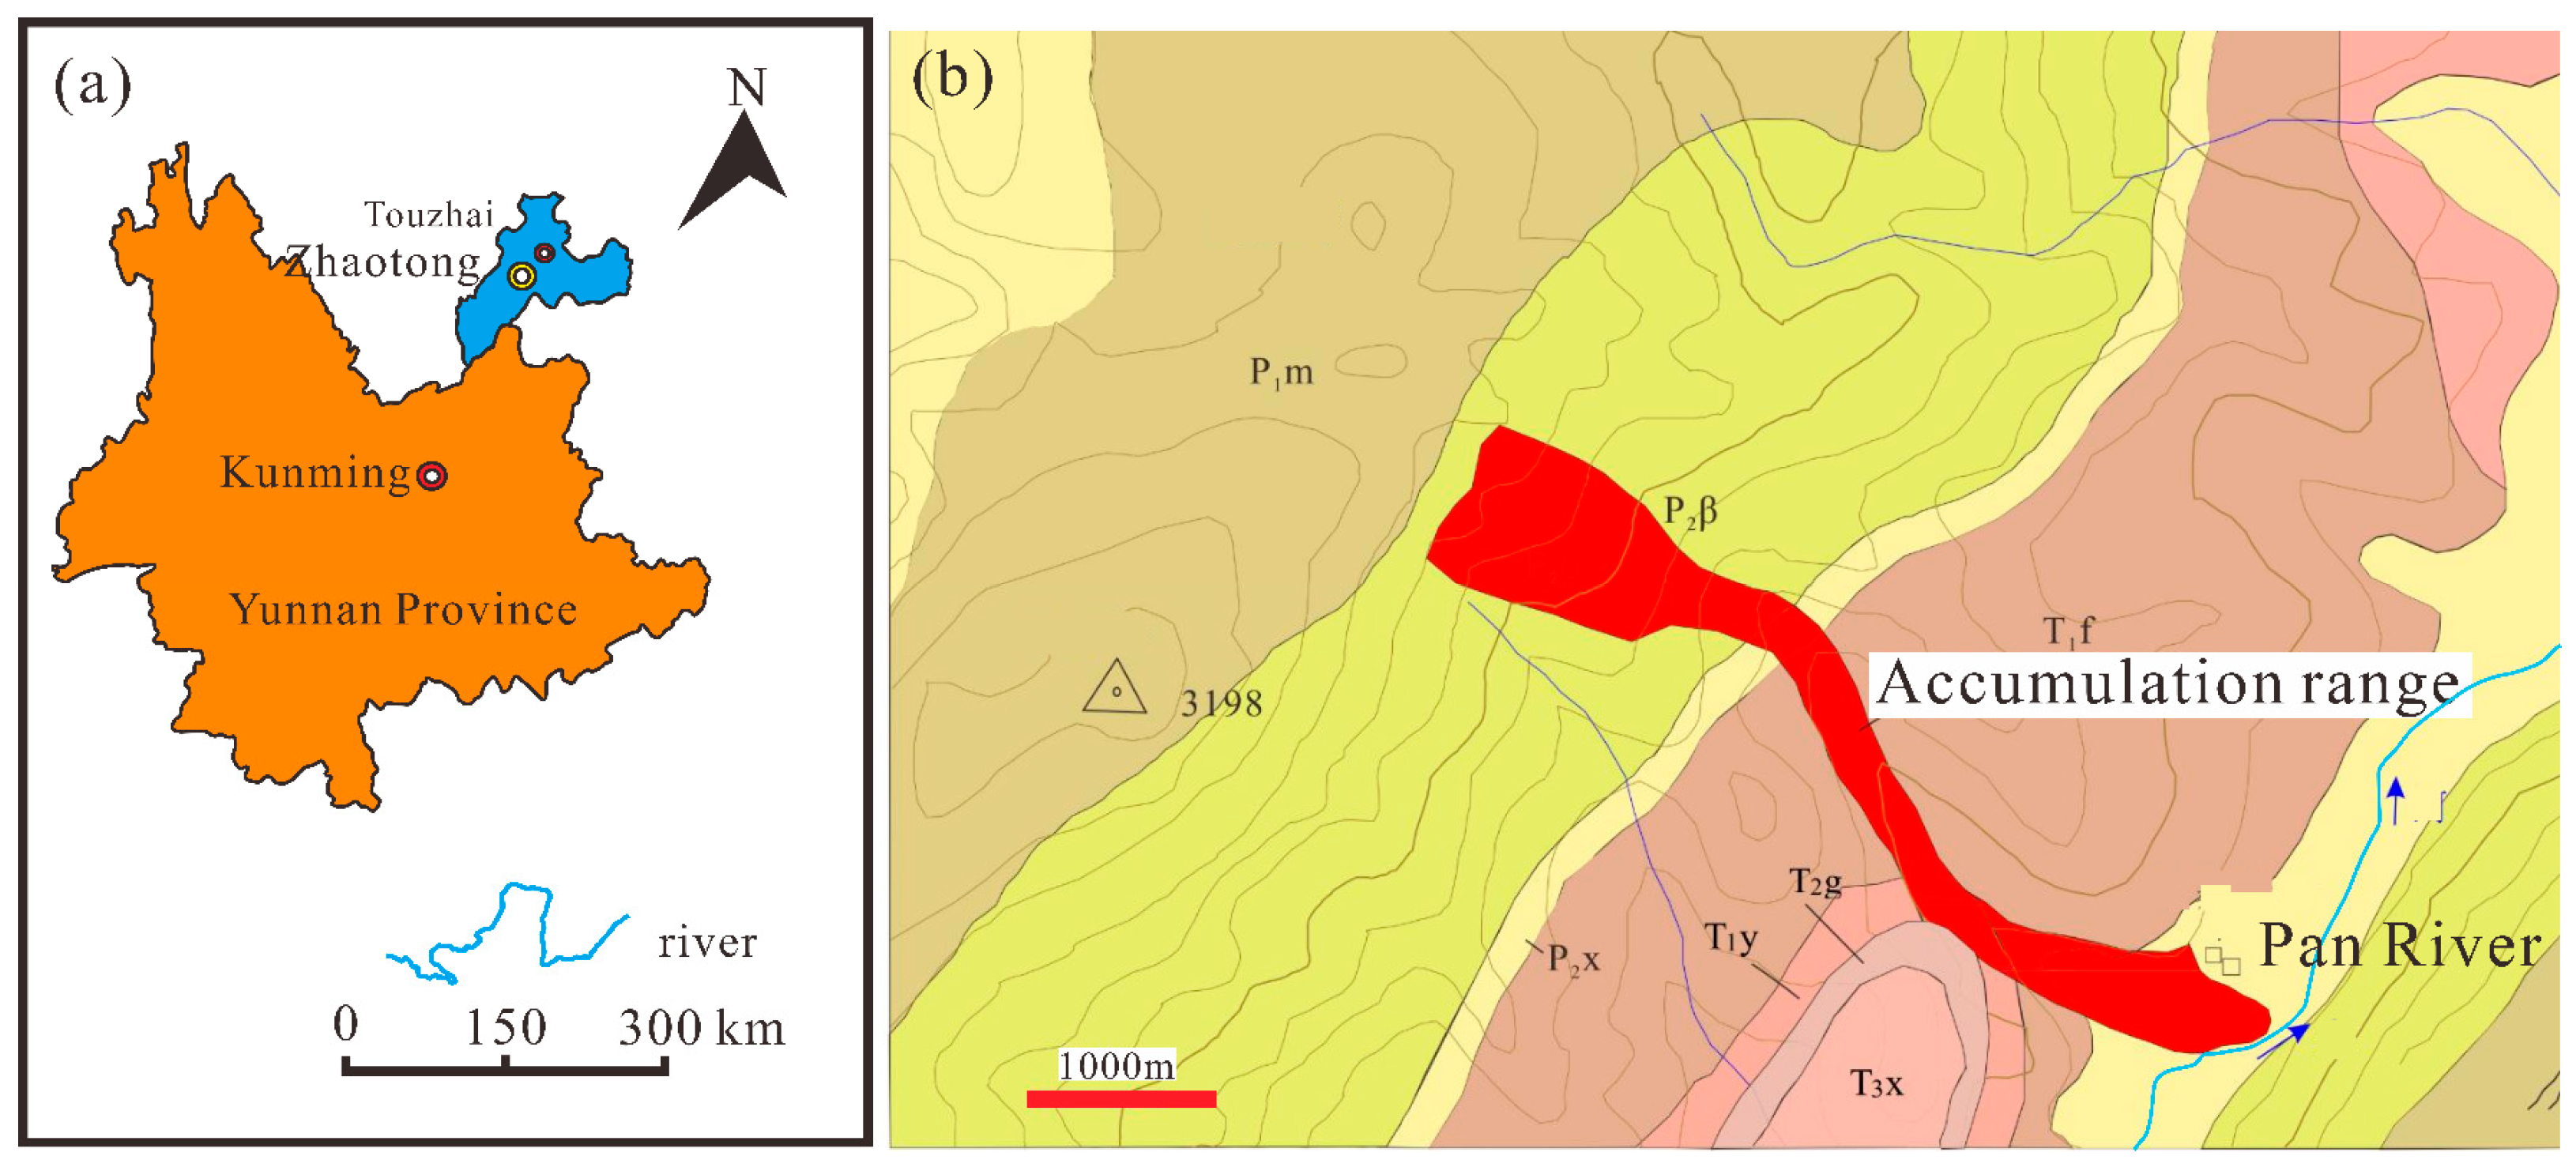
2. Study Area
2.1. Geological Background
2.2. Climate
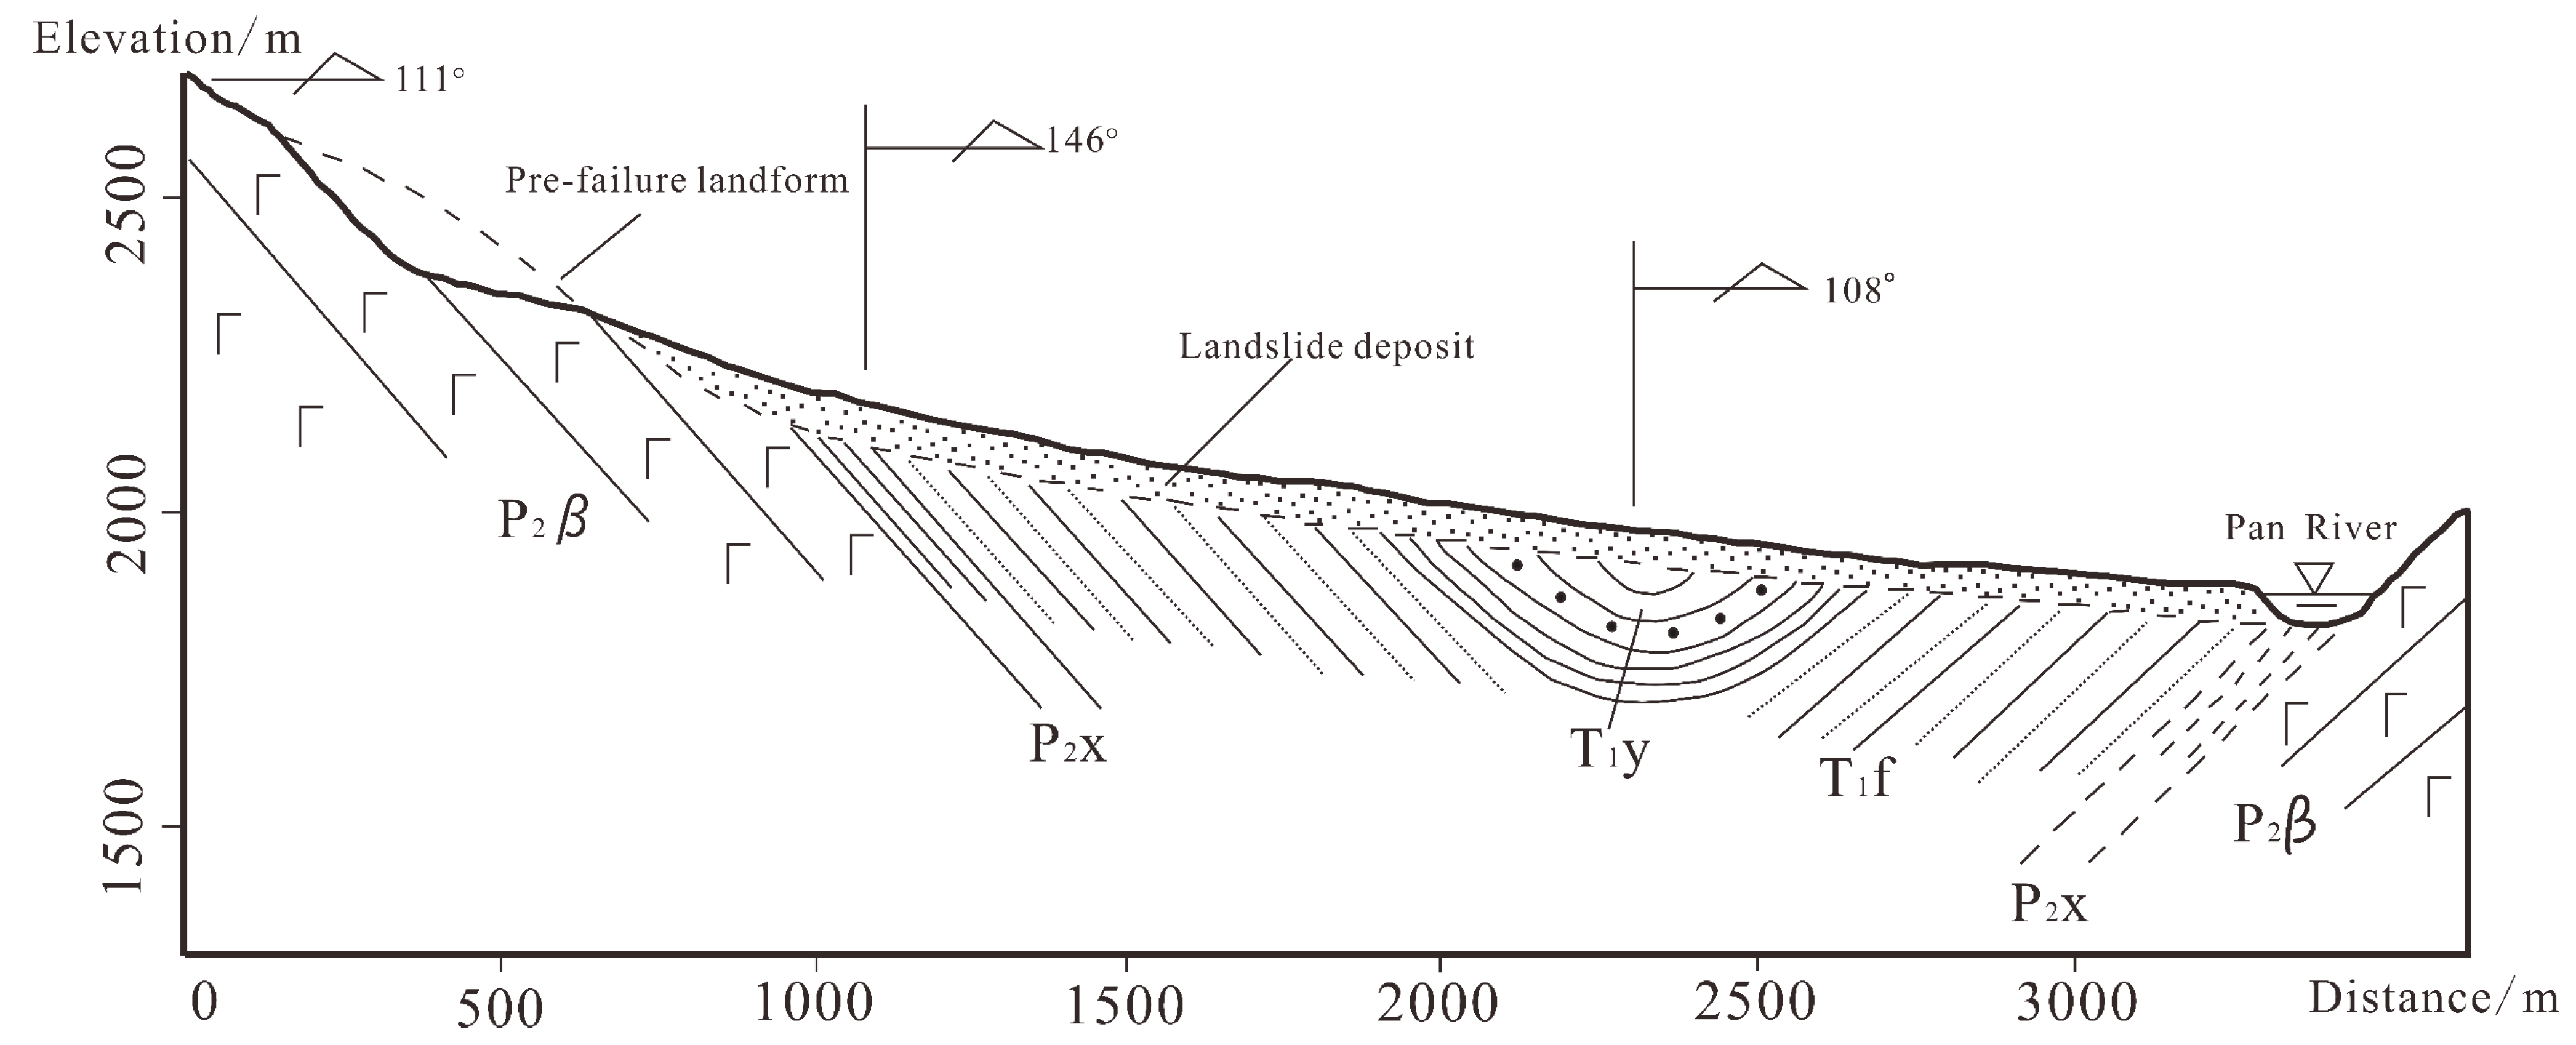
2.3. Landslide Description
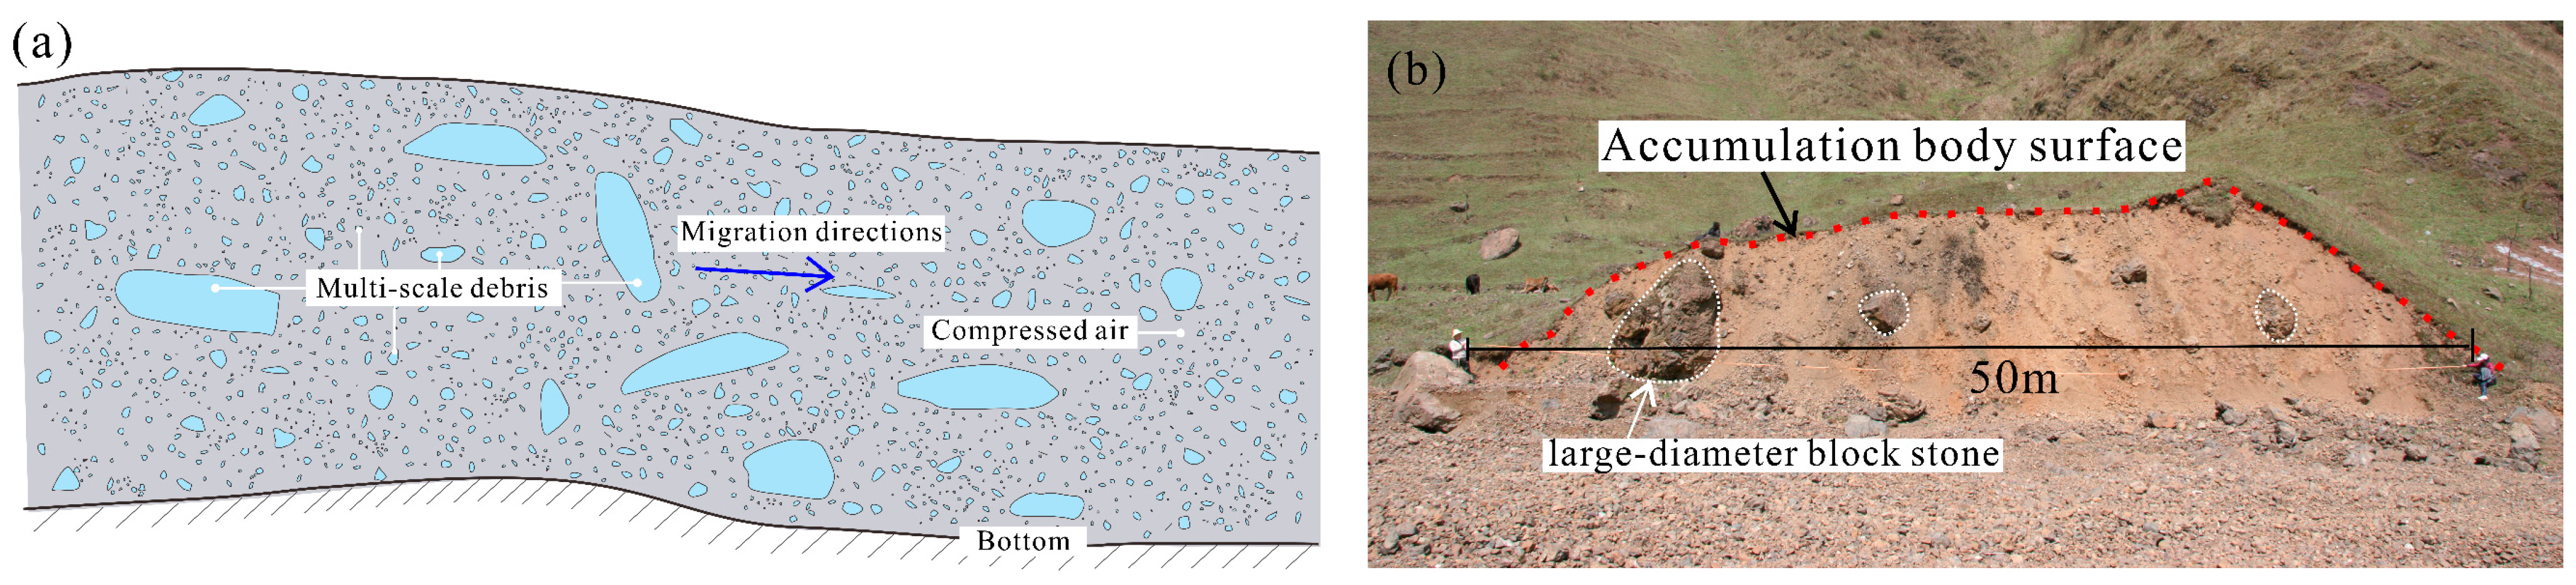
2.4. Deposit Features
3. Methodology
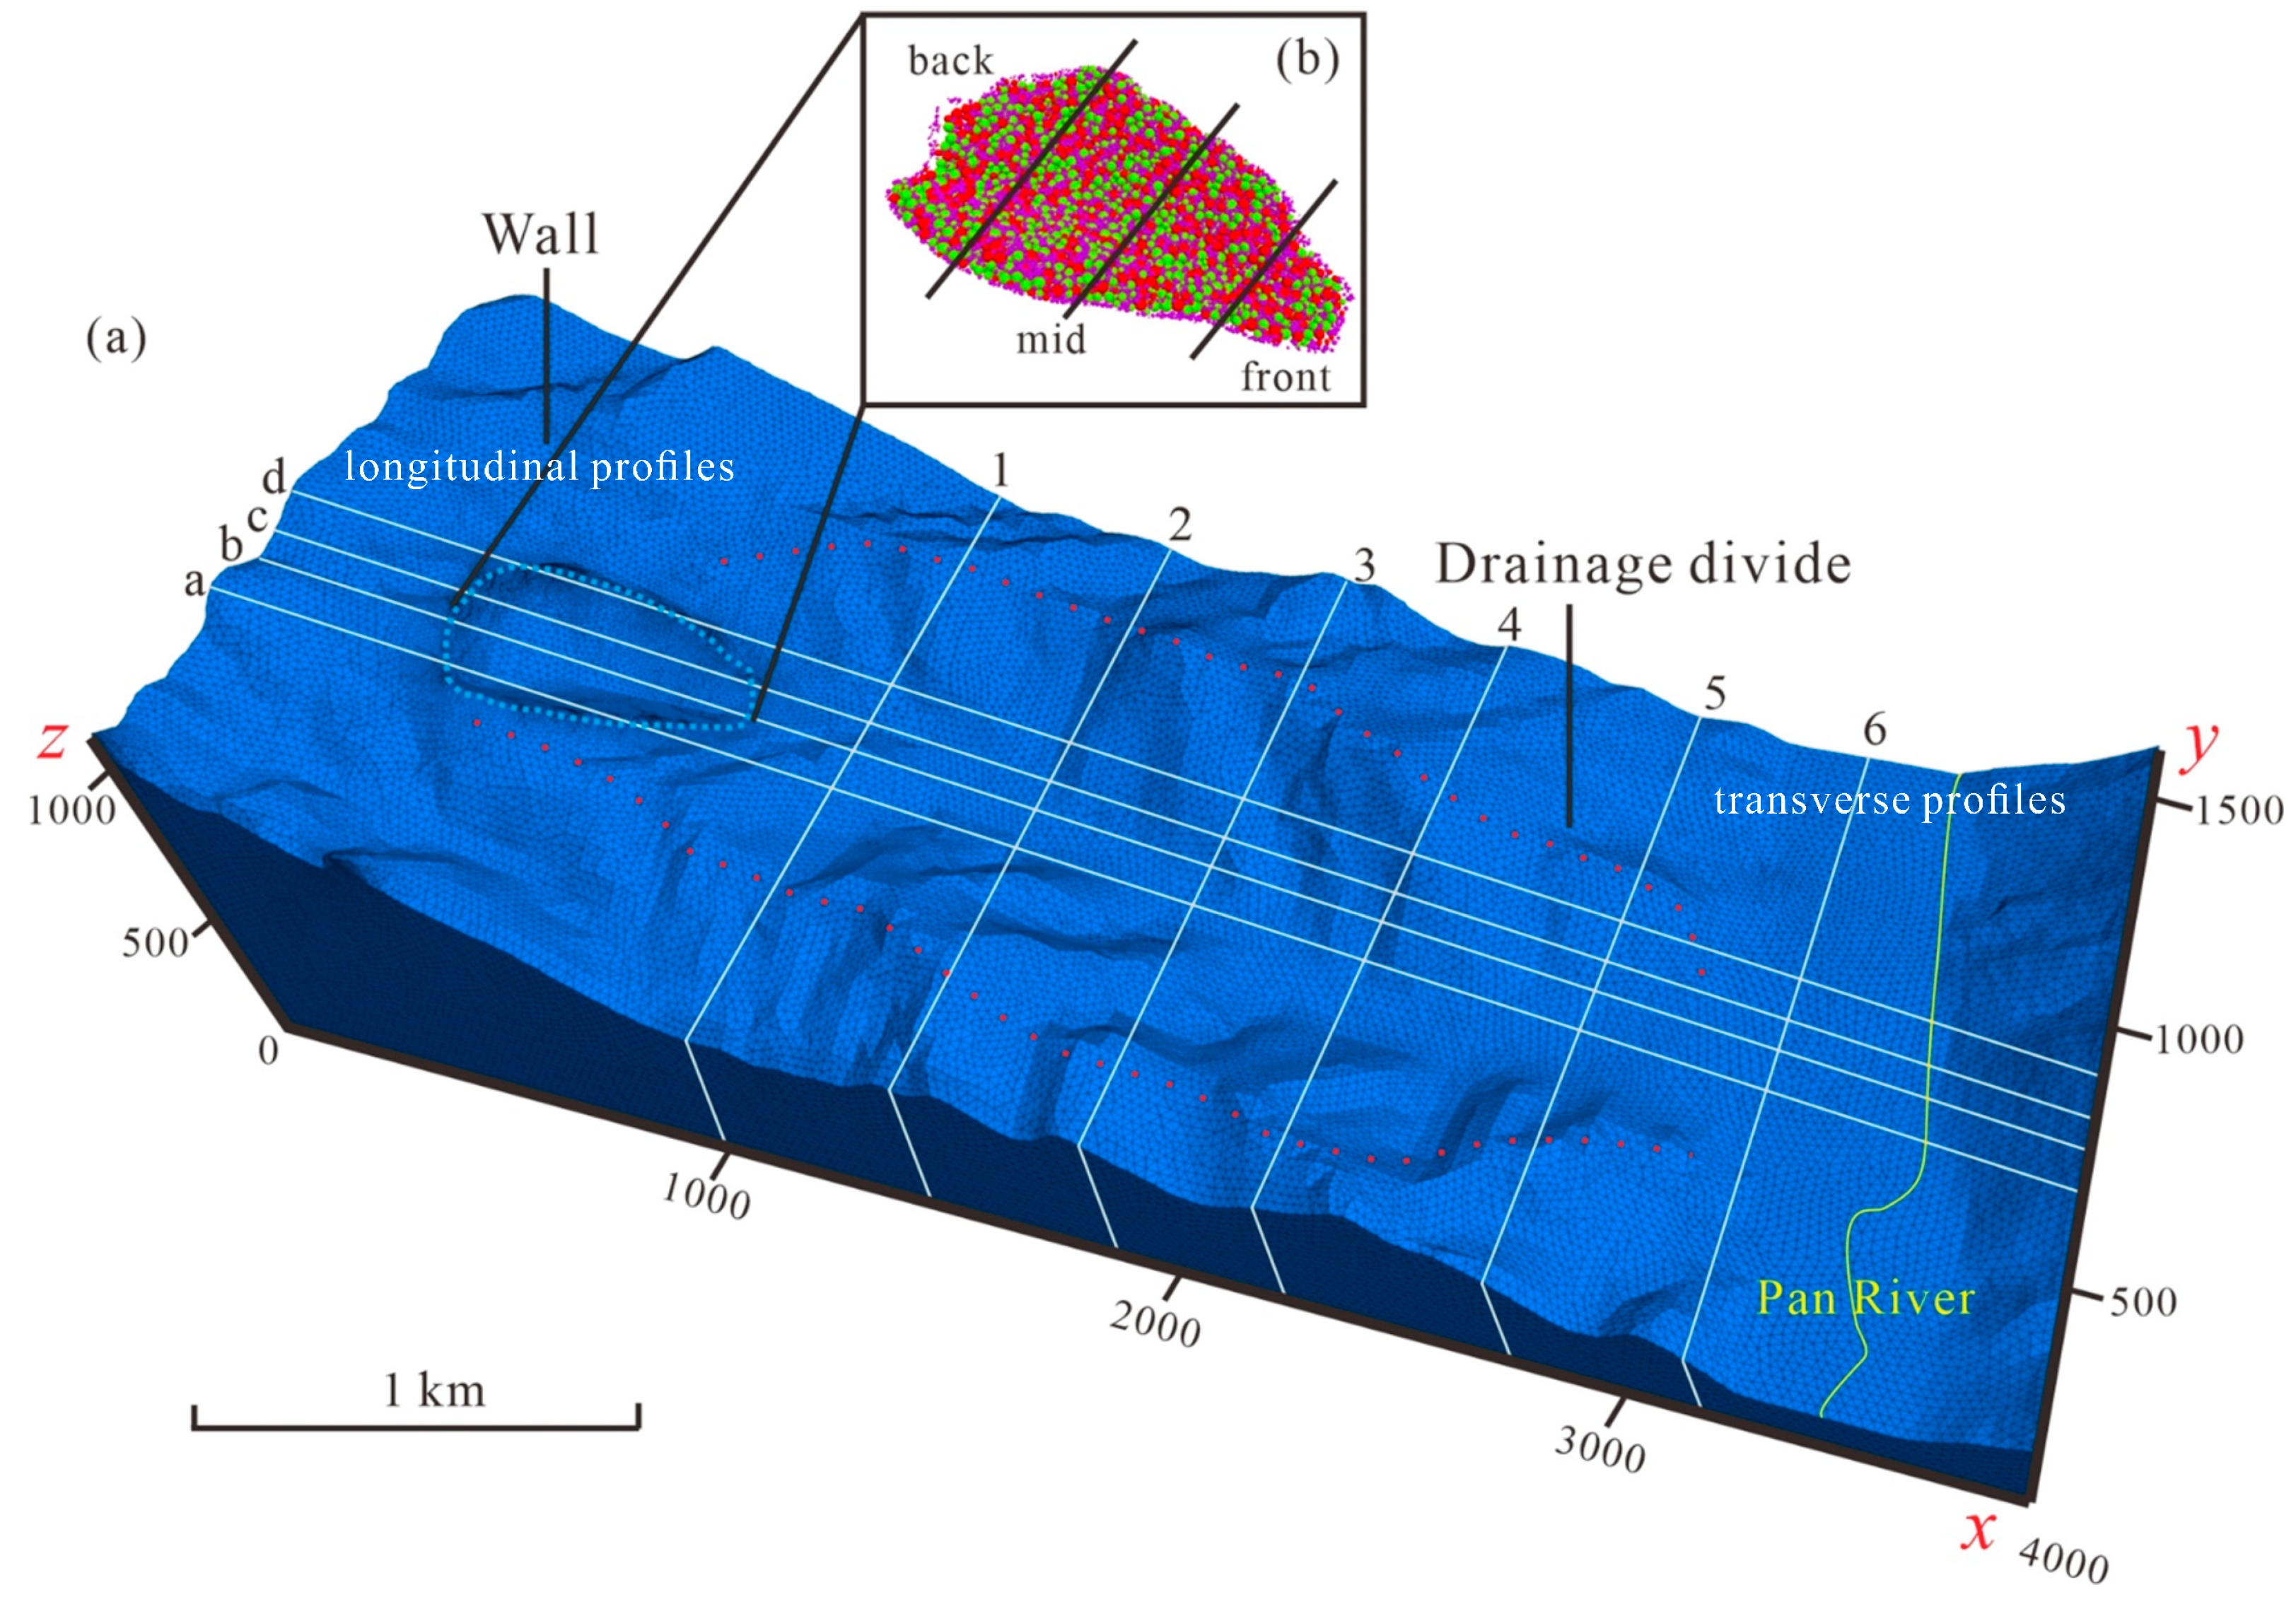
3.1. Discrete Element Modelling
3.2. Parameter Setting
4. Simulation Results
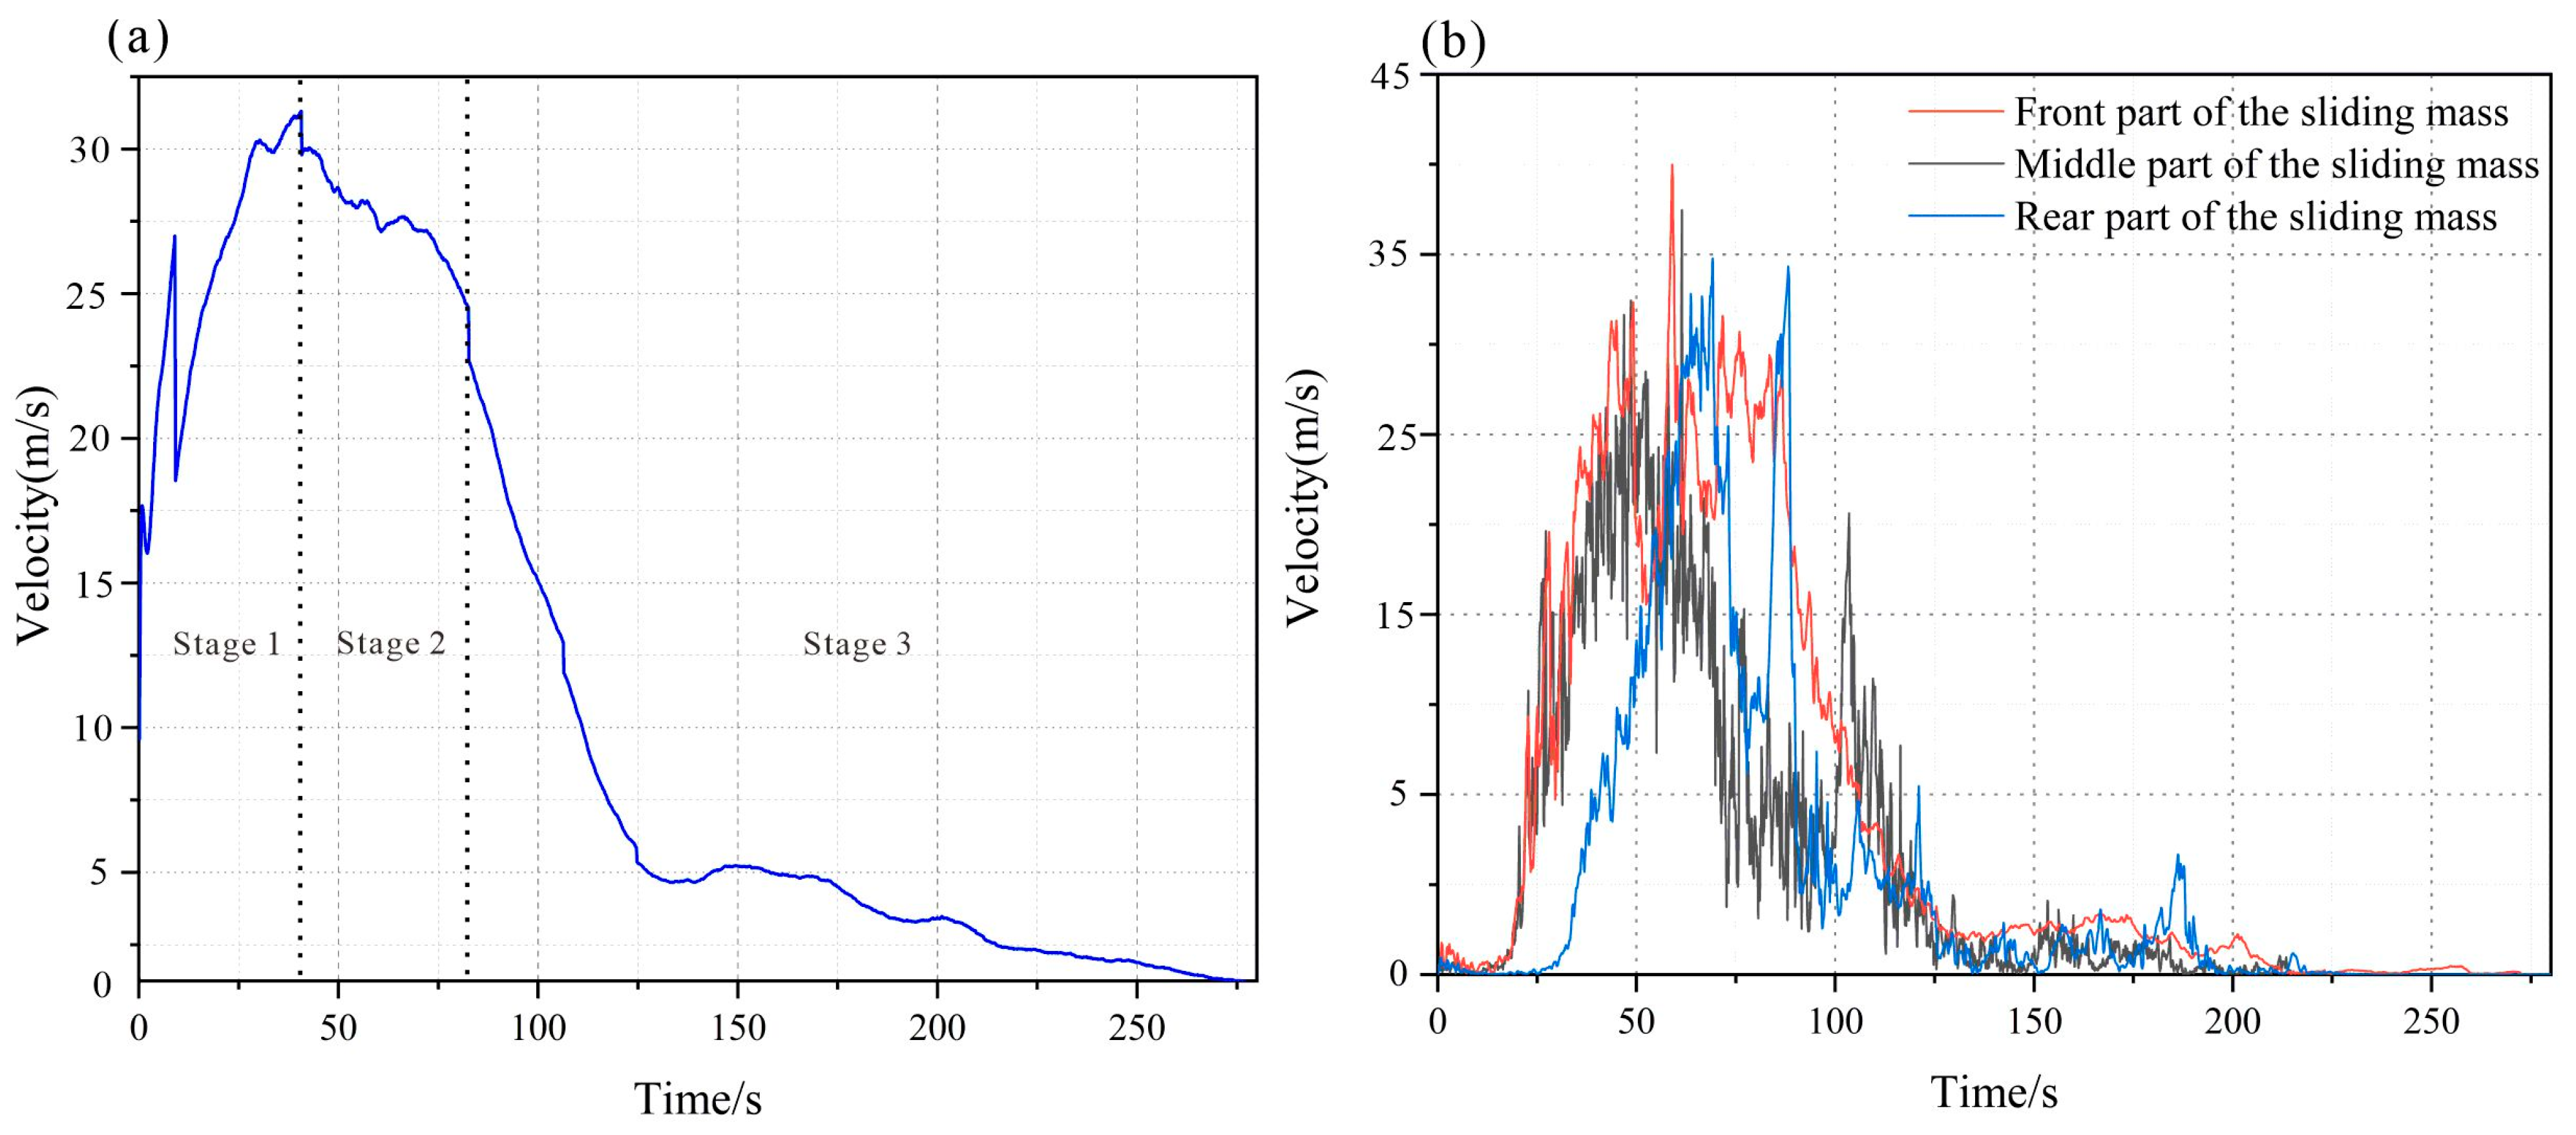
4.1. Simulation of Velocity Variations
- (1)
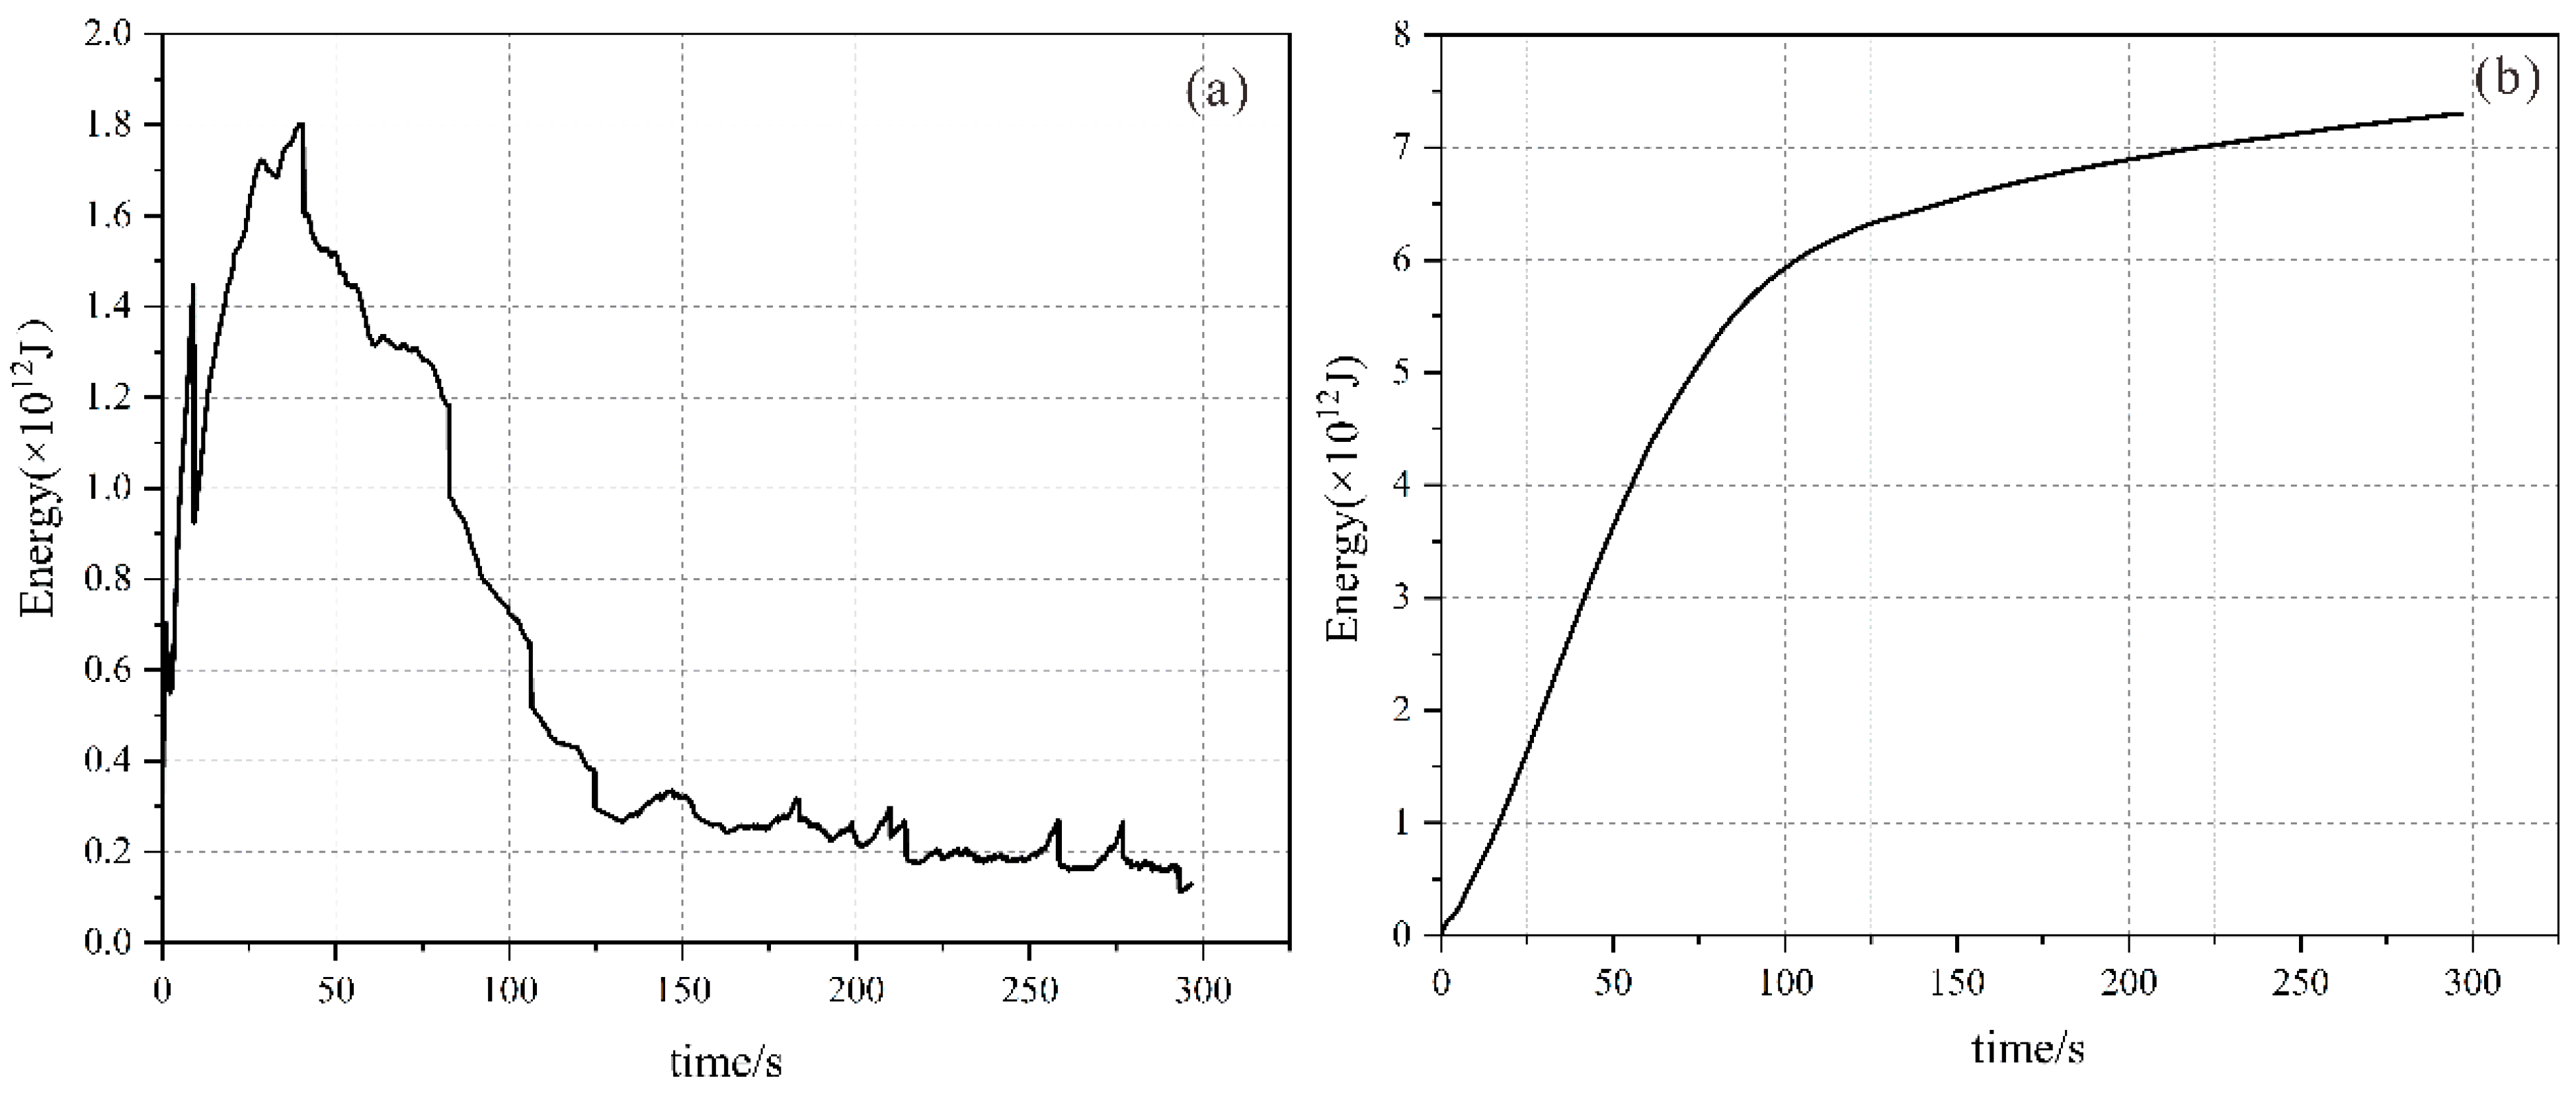
- Stage 1: Rapid acceleration Figure 8b: According to the average velocity curve drawn from the data of the monitoring points set at the leading and trailing edges of the landslide (shown in Figure 9), the duration of the rapid acceleration phase of the avalanche debris was 40 s. The average velocity was 32 m/s at the leading edge of the sliding mass, which was greater than that of 35 m/s at the trailing edge of the sliding mass (Figure 9a). The leading edge of the sliding mass was more influenced by the topography, where two abrupt velocity changes were experienced, mainly due to the deflection area on the three-dimensional topography.
- (2)
- Stage 2: High-speed long-runout Figure 8c: The duration of the high-speed long-runout phase of the avalanche debris was 45–80 s, where the leading edge of the sliding mass lasted for 20s. The avalanche debris is subject to friction and collision, which results in a decrease in velocity. In this stage, the avalanche debris acceleration curve grew slowly due to the continuous collisional disintegration of rock mass and terrain to form avalanche debris that maintained a high speed in the gully.
- (3)
- Stage 3: Final low-speed deposition (Figure 8d): After passing through the last deflection zone, the terrain was flat, and the movement of the particle flow was no longer constrained by the valley. The movement of the particle flow no longer appeared in the middle of the particles due to being wrapped by the friction and collision of the smaller energy consumption and thus maintaining a higher speed. The influence of friction and collision gradually decelerated the particle flow until it stopped at the accumulation. When the TZRA moved to the accumulation area, it entered the slow deceleration stage, and the avalanche debris moved to an open area altogether, tending the velocity of each part of the geotechnical body toward zero.
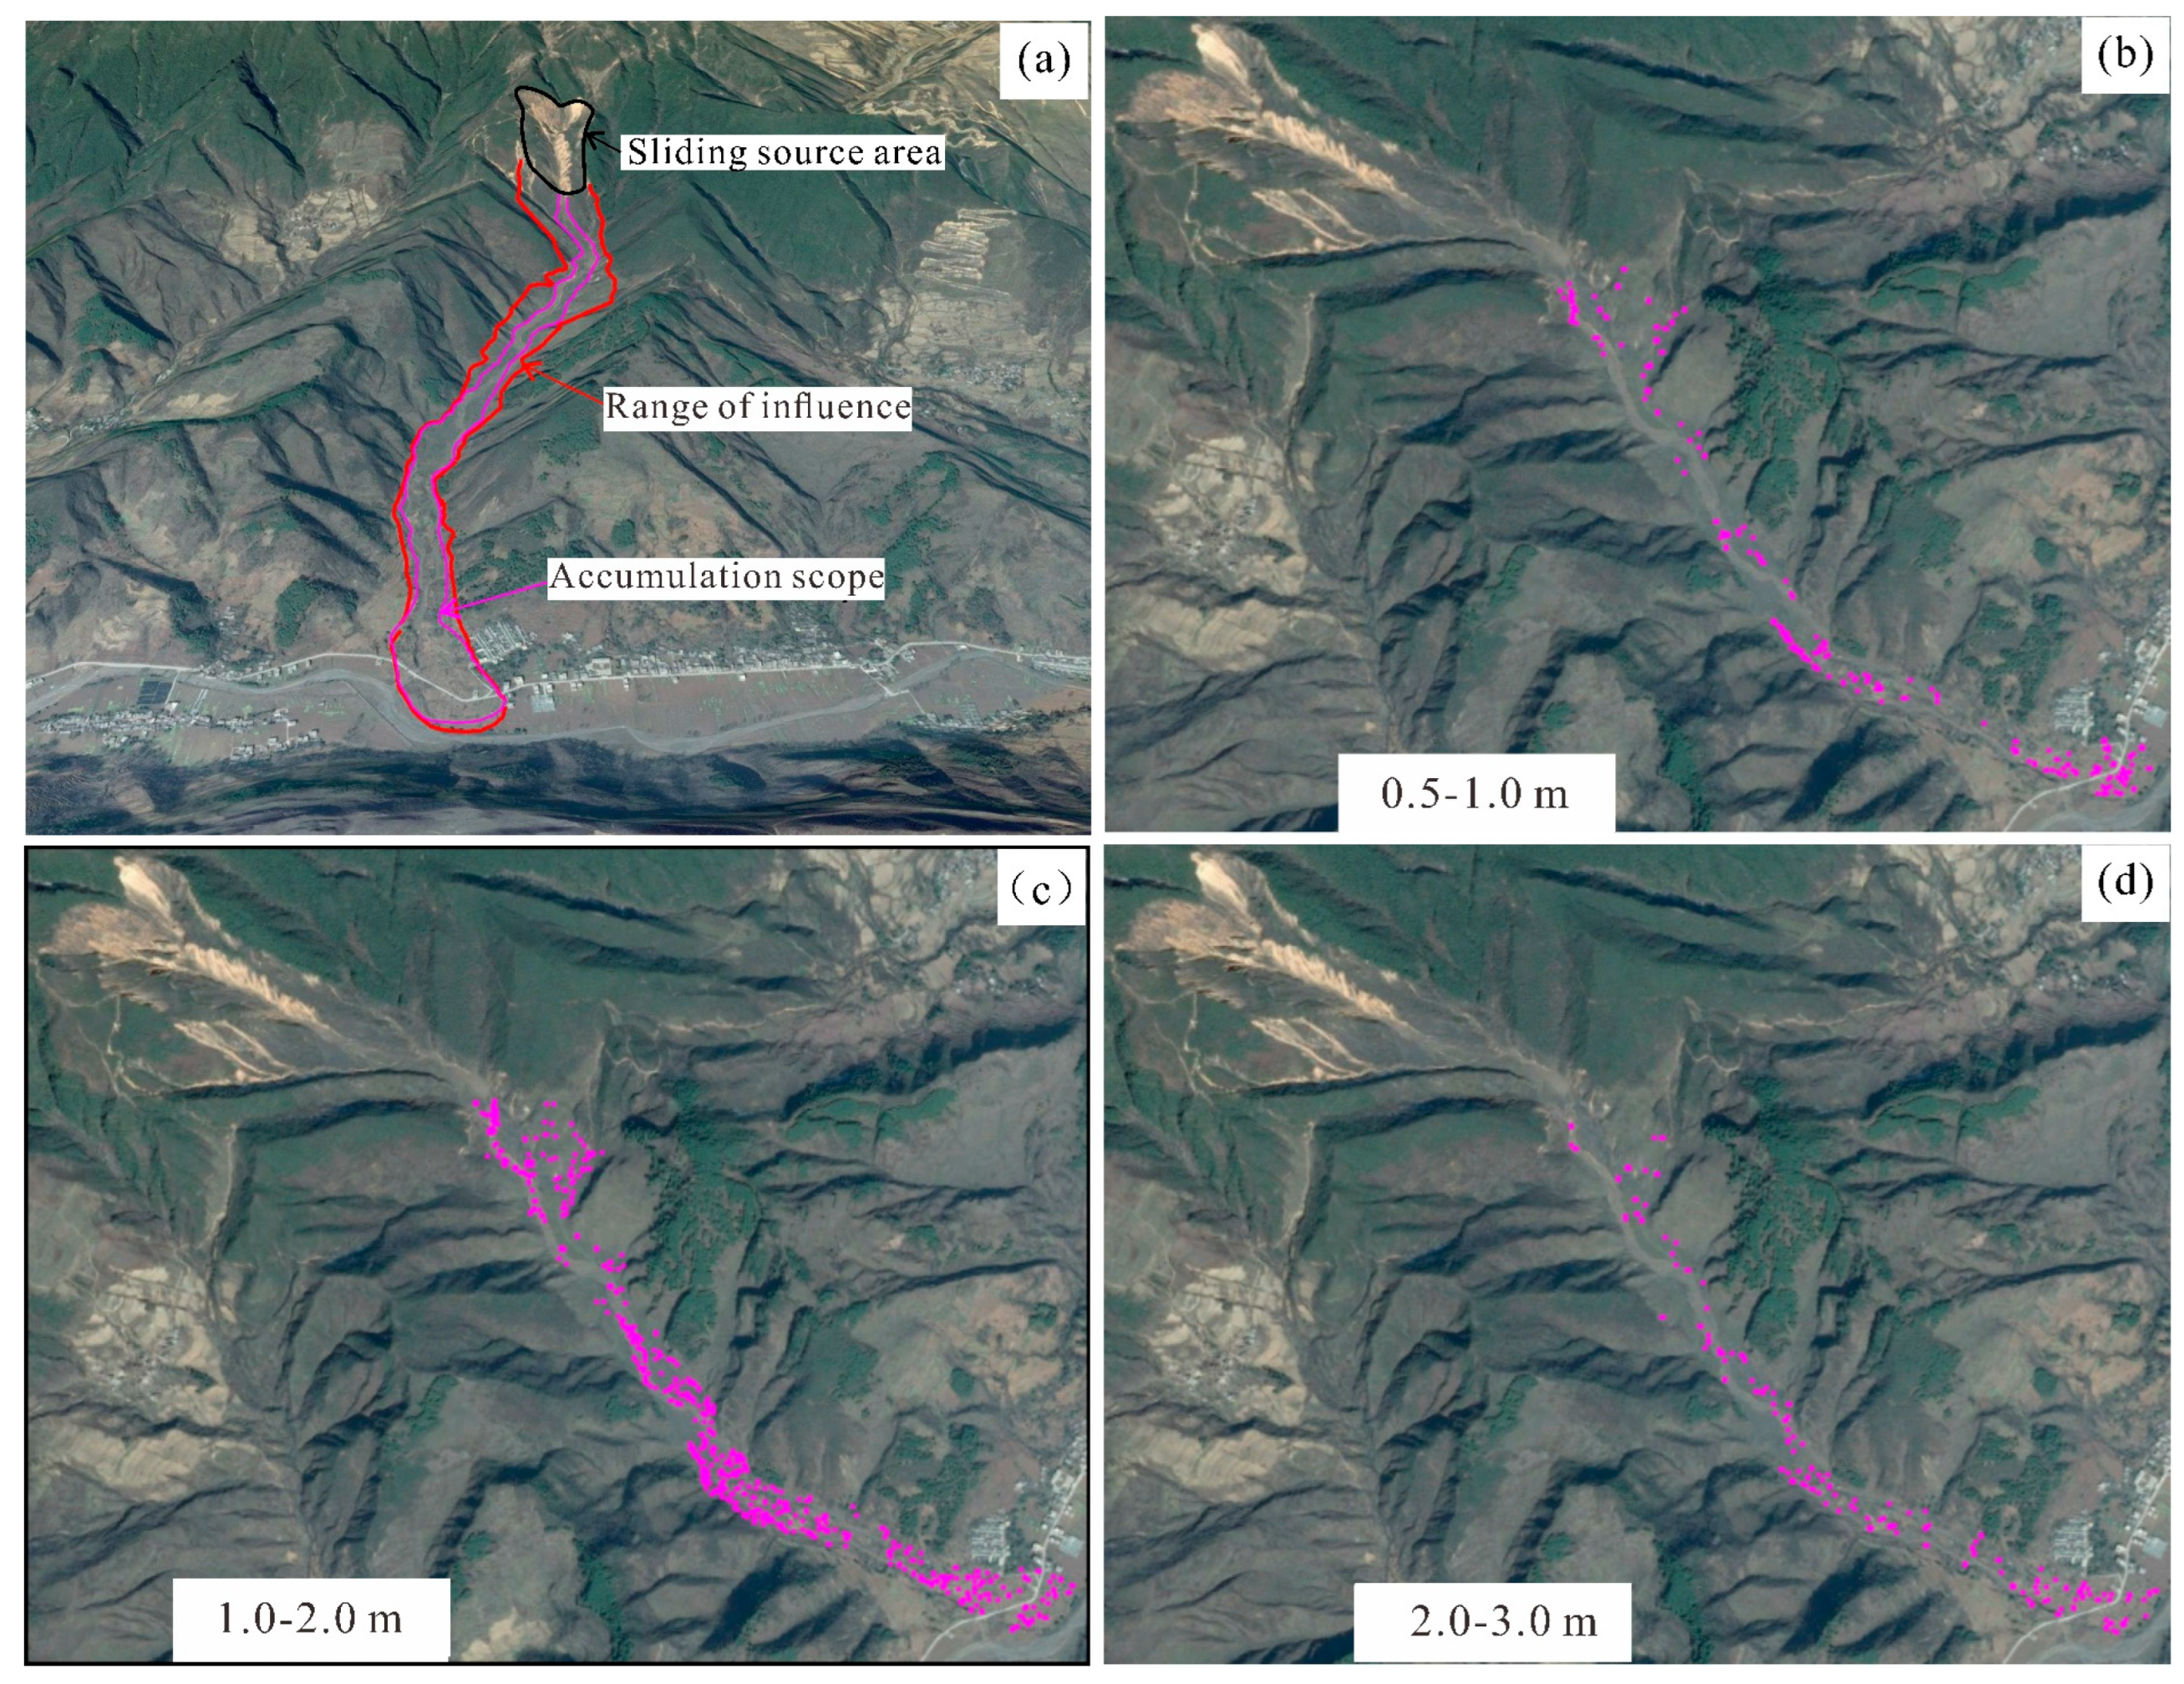
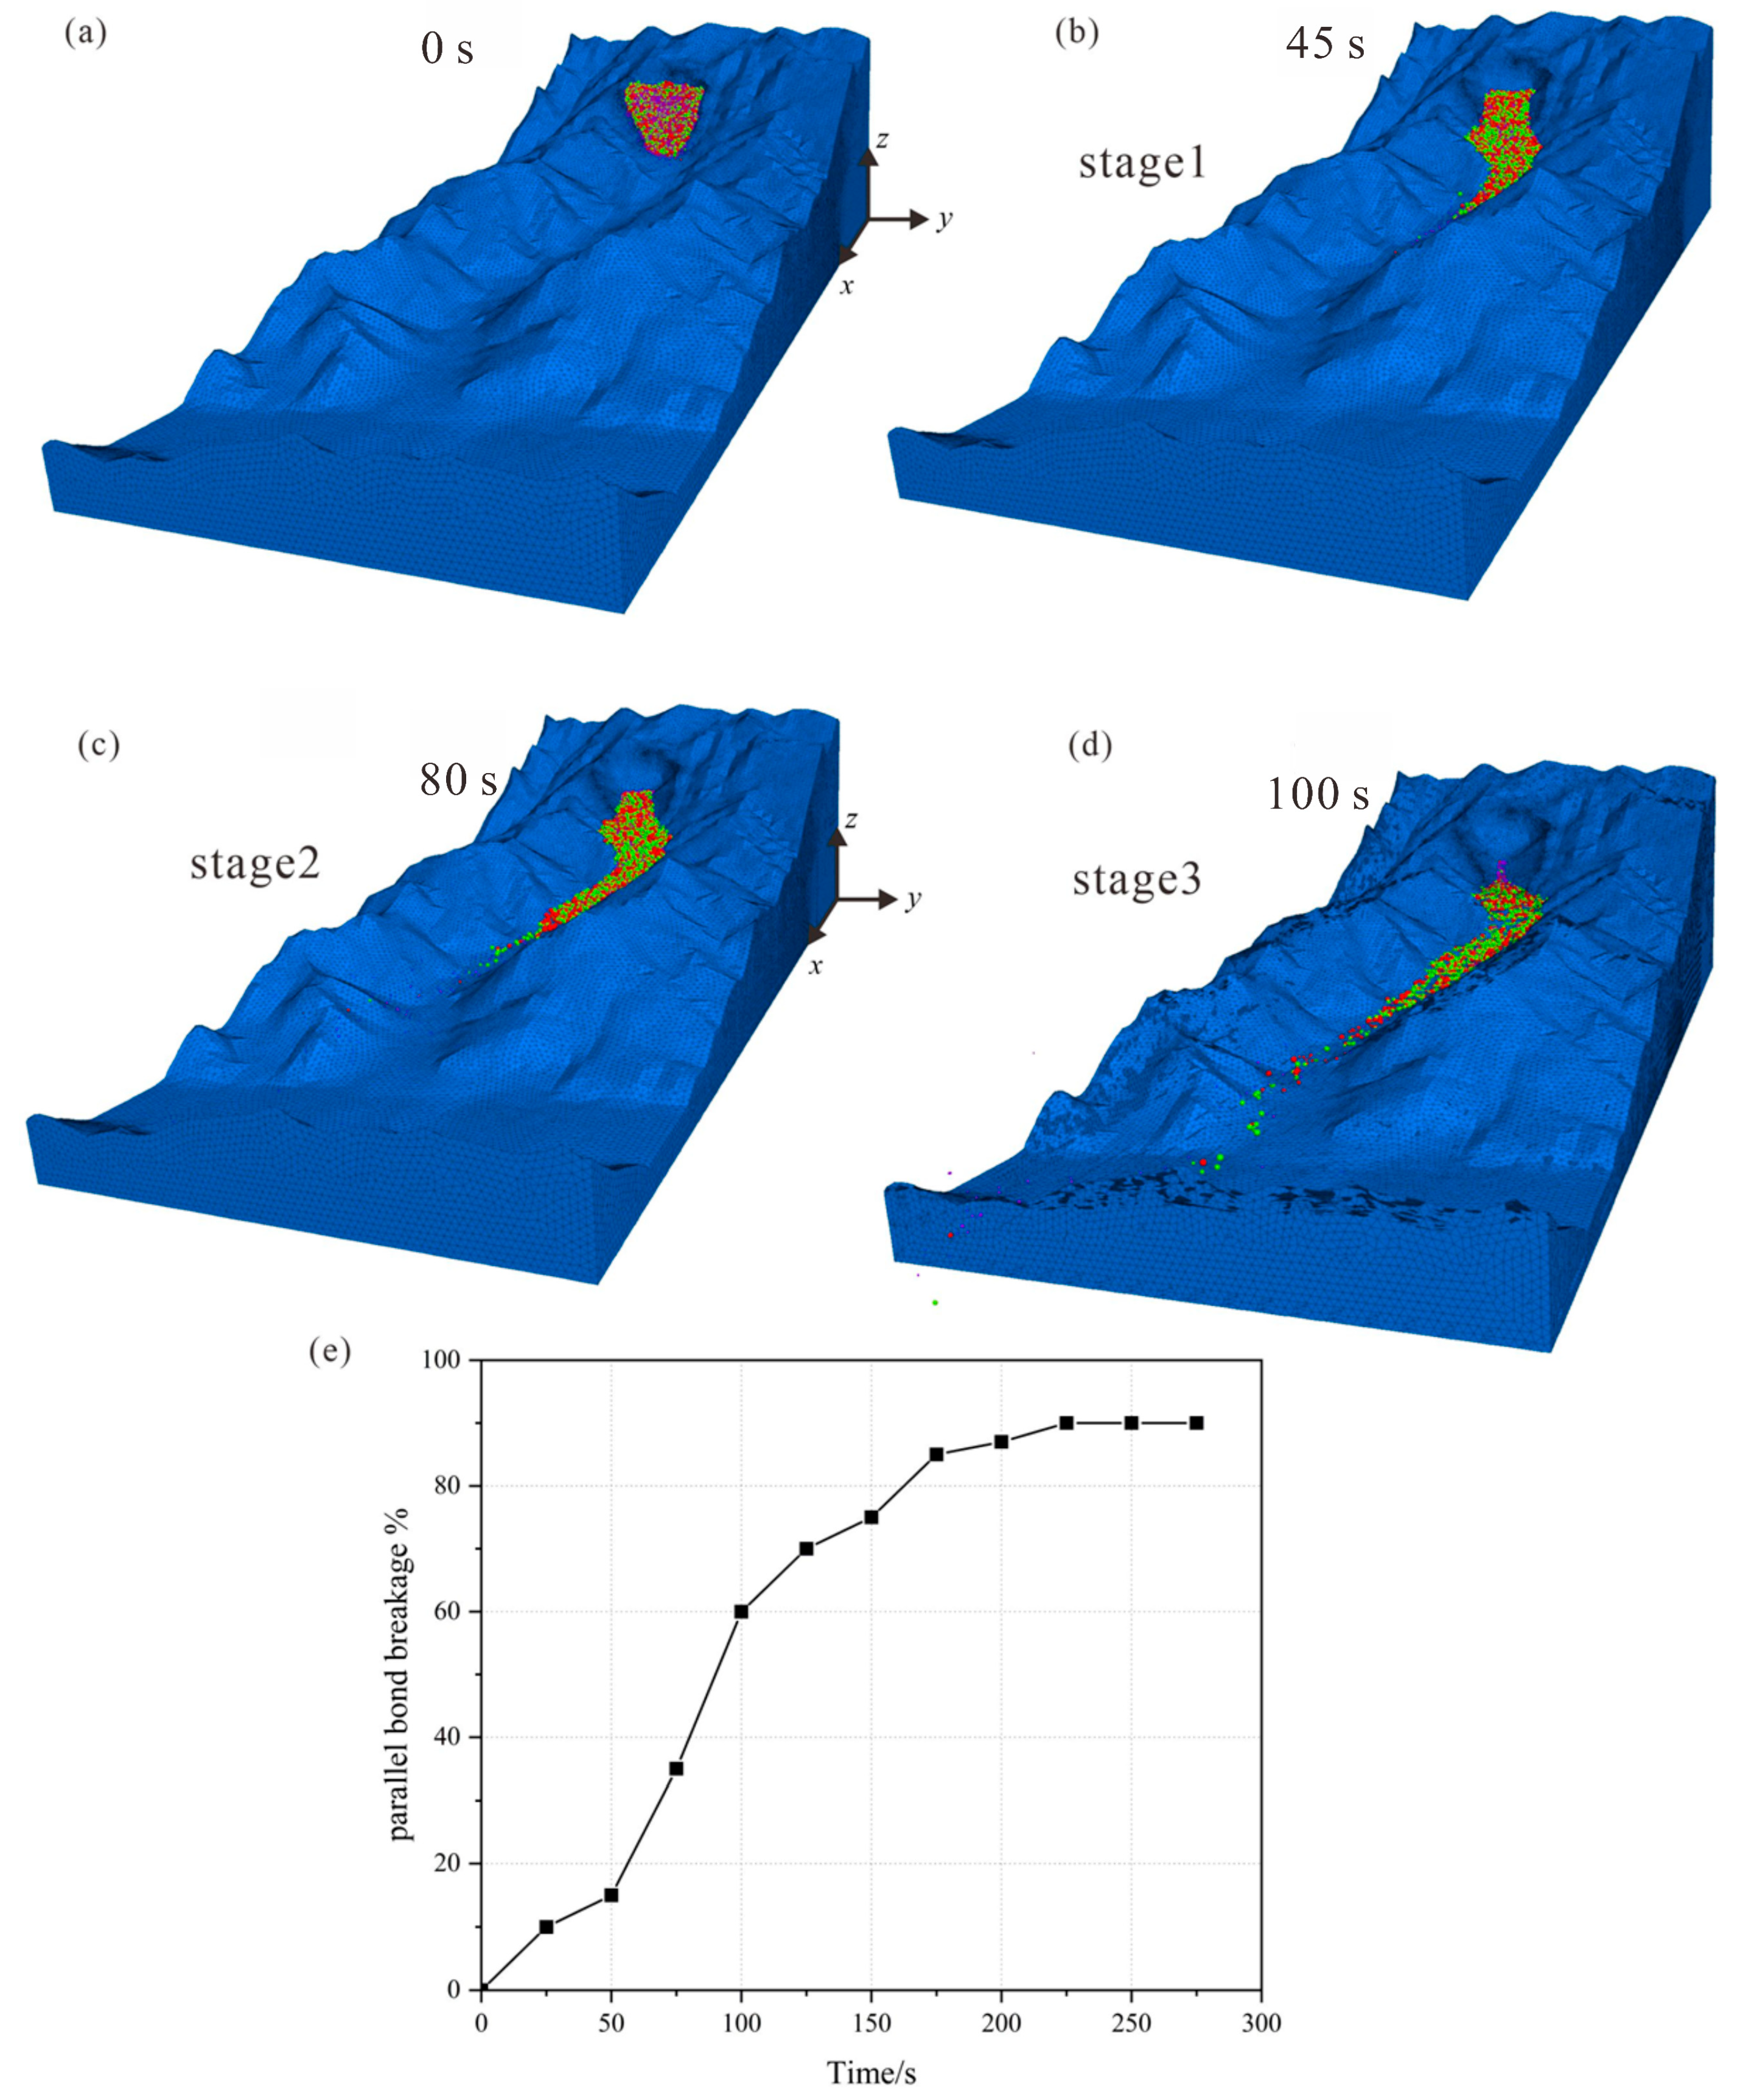
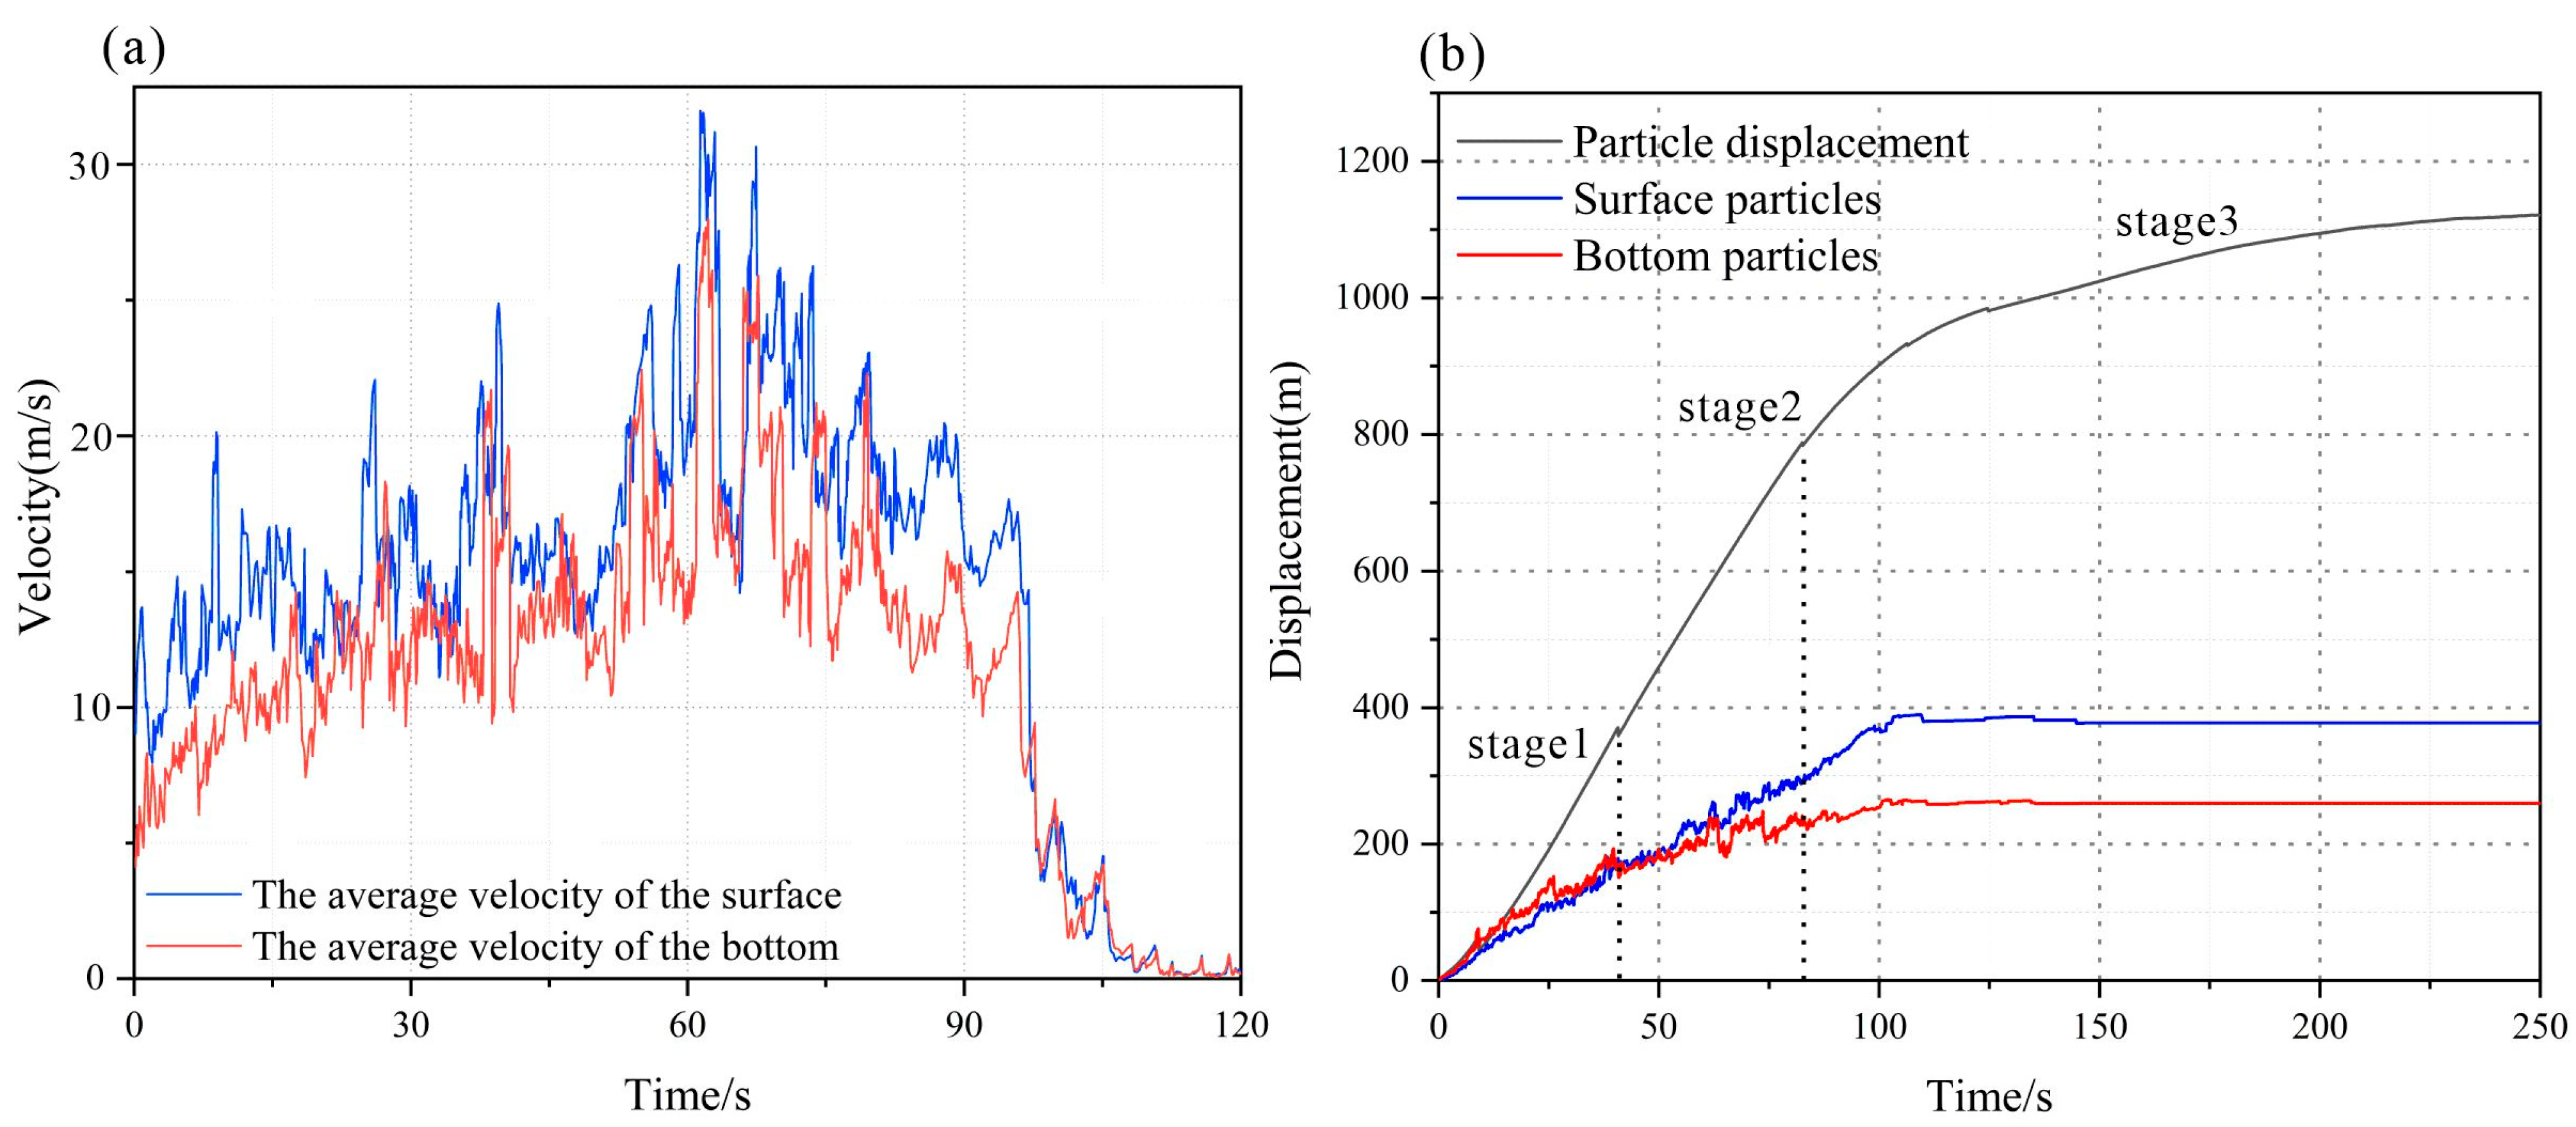
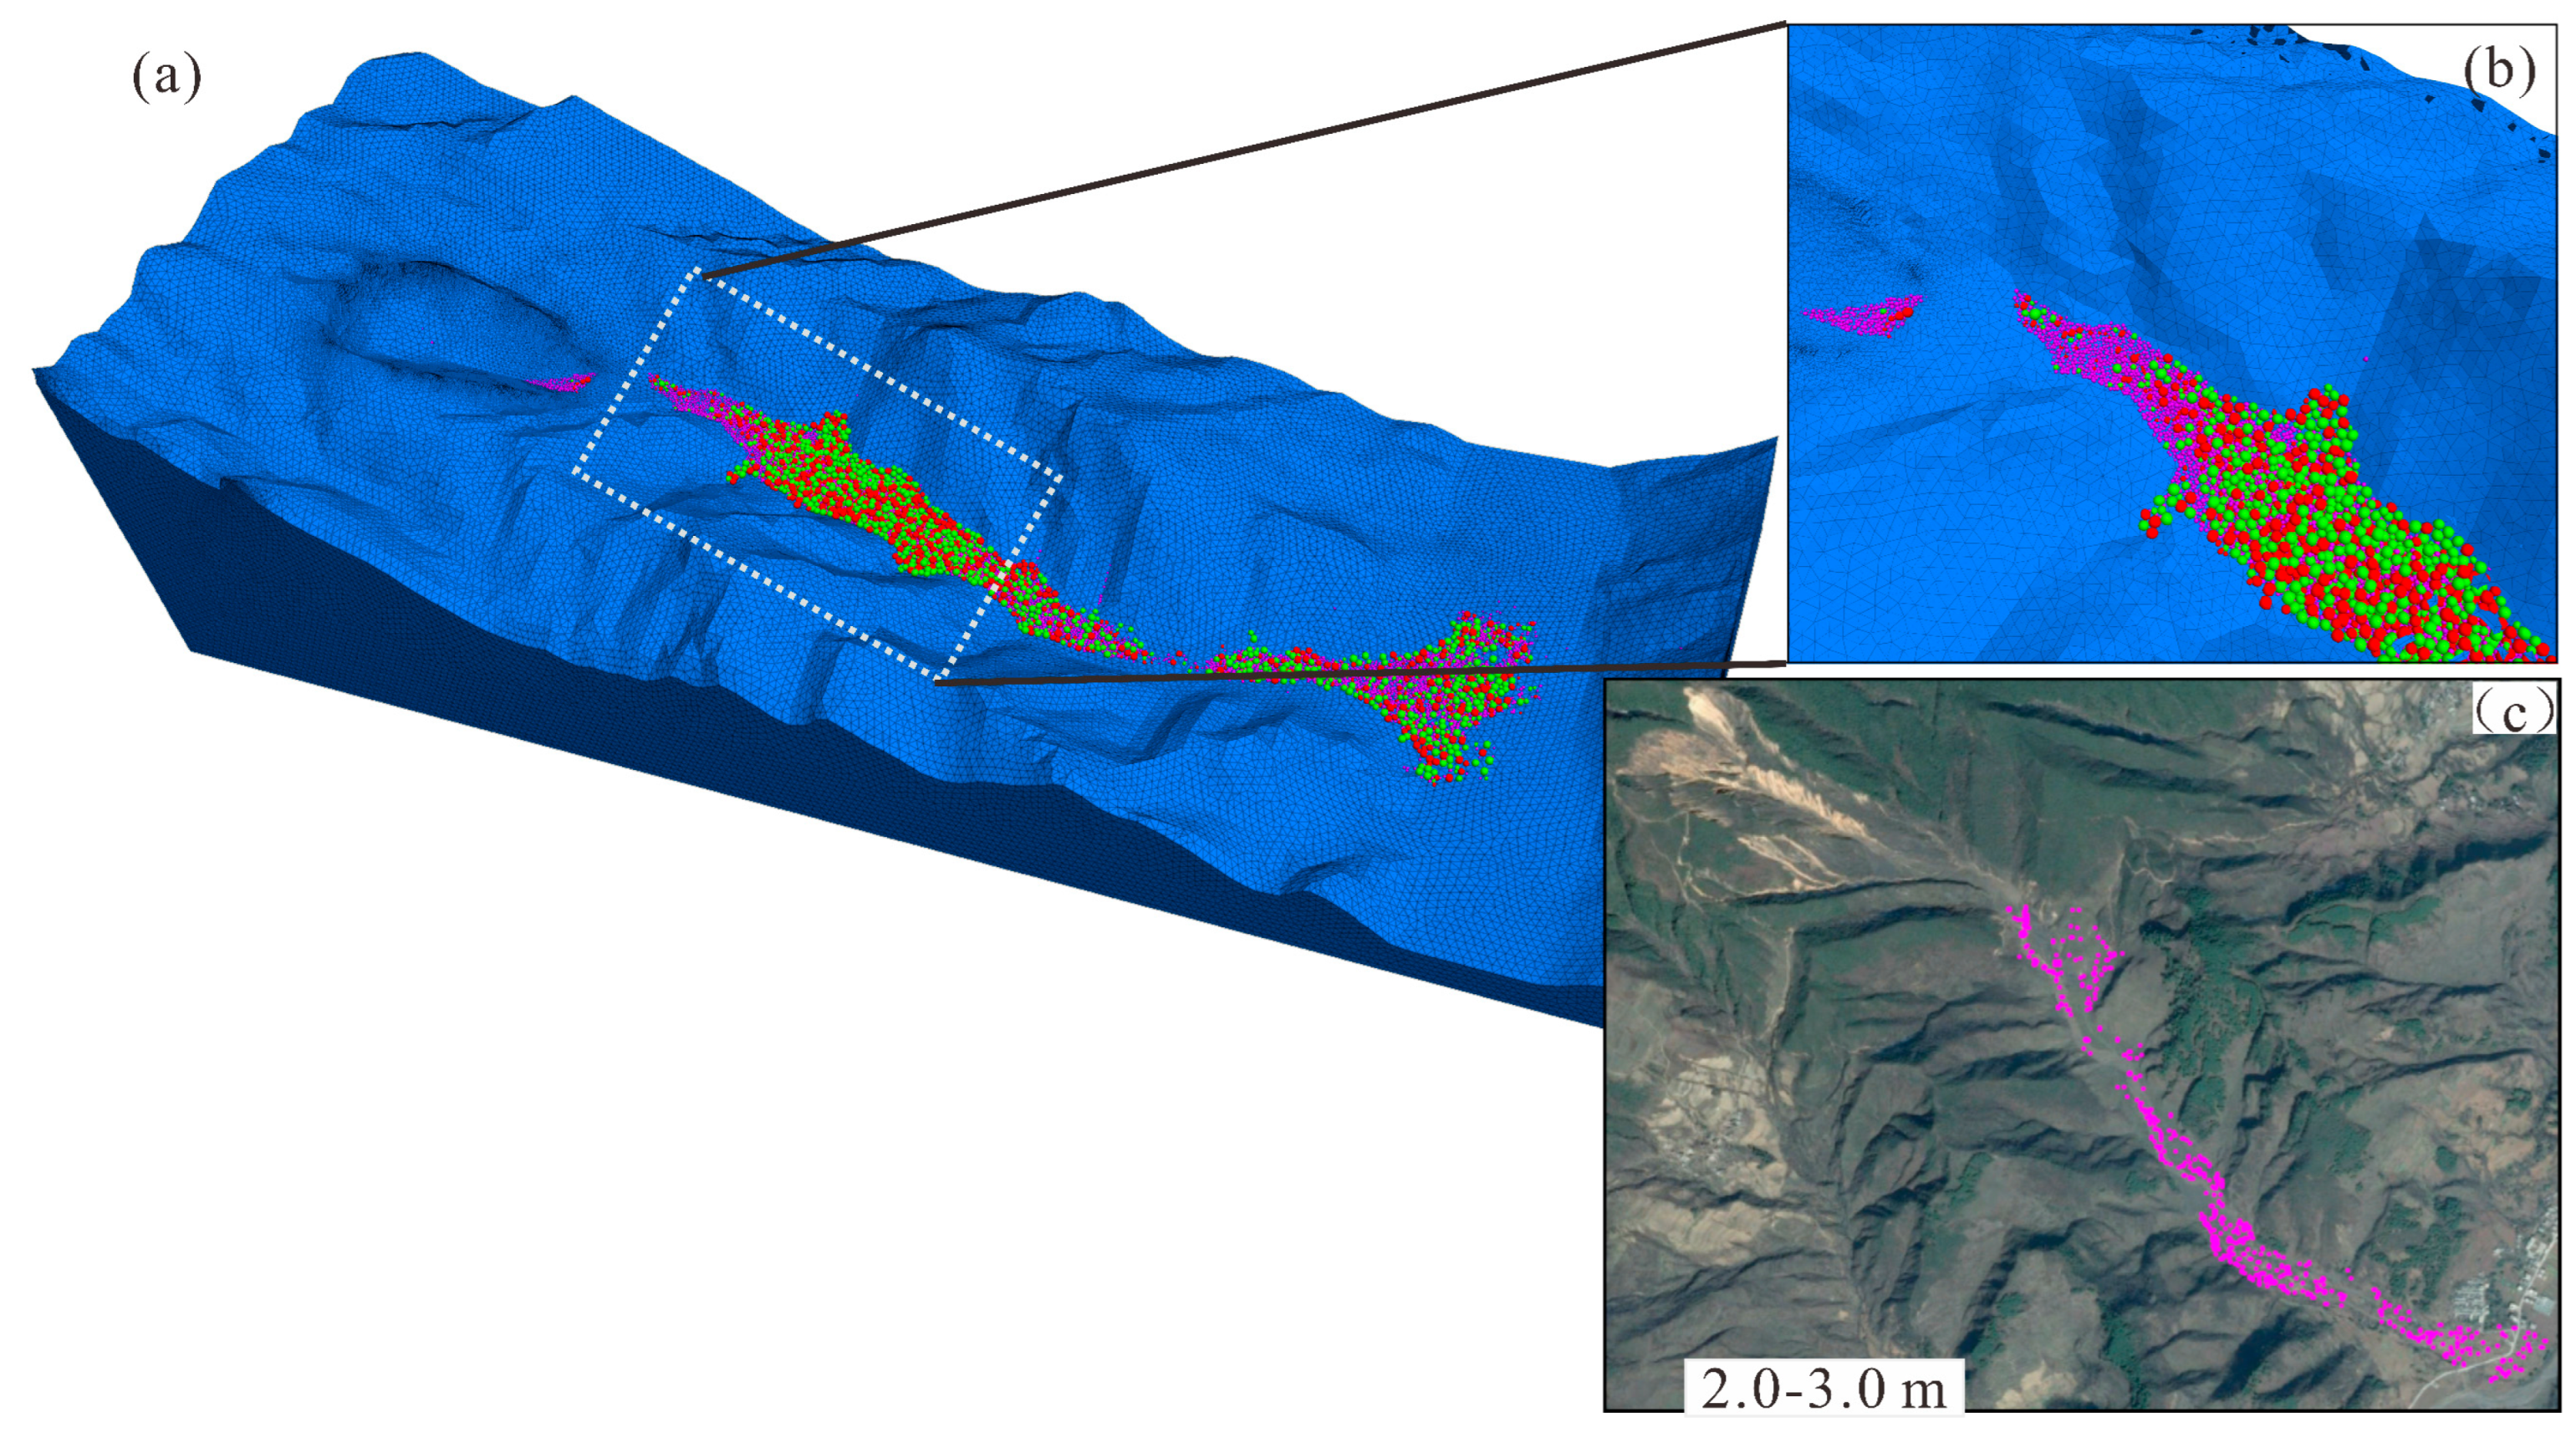
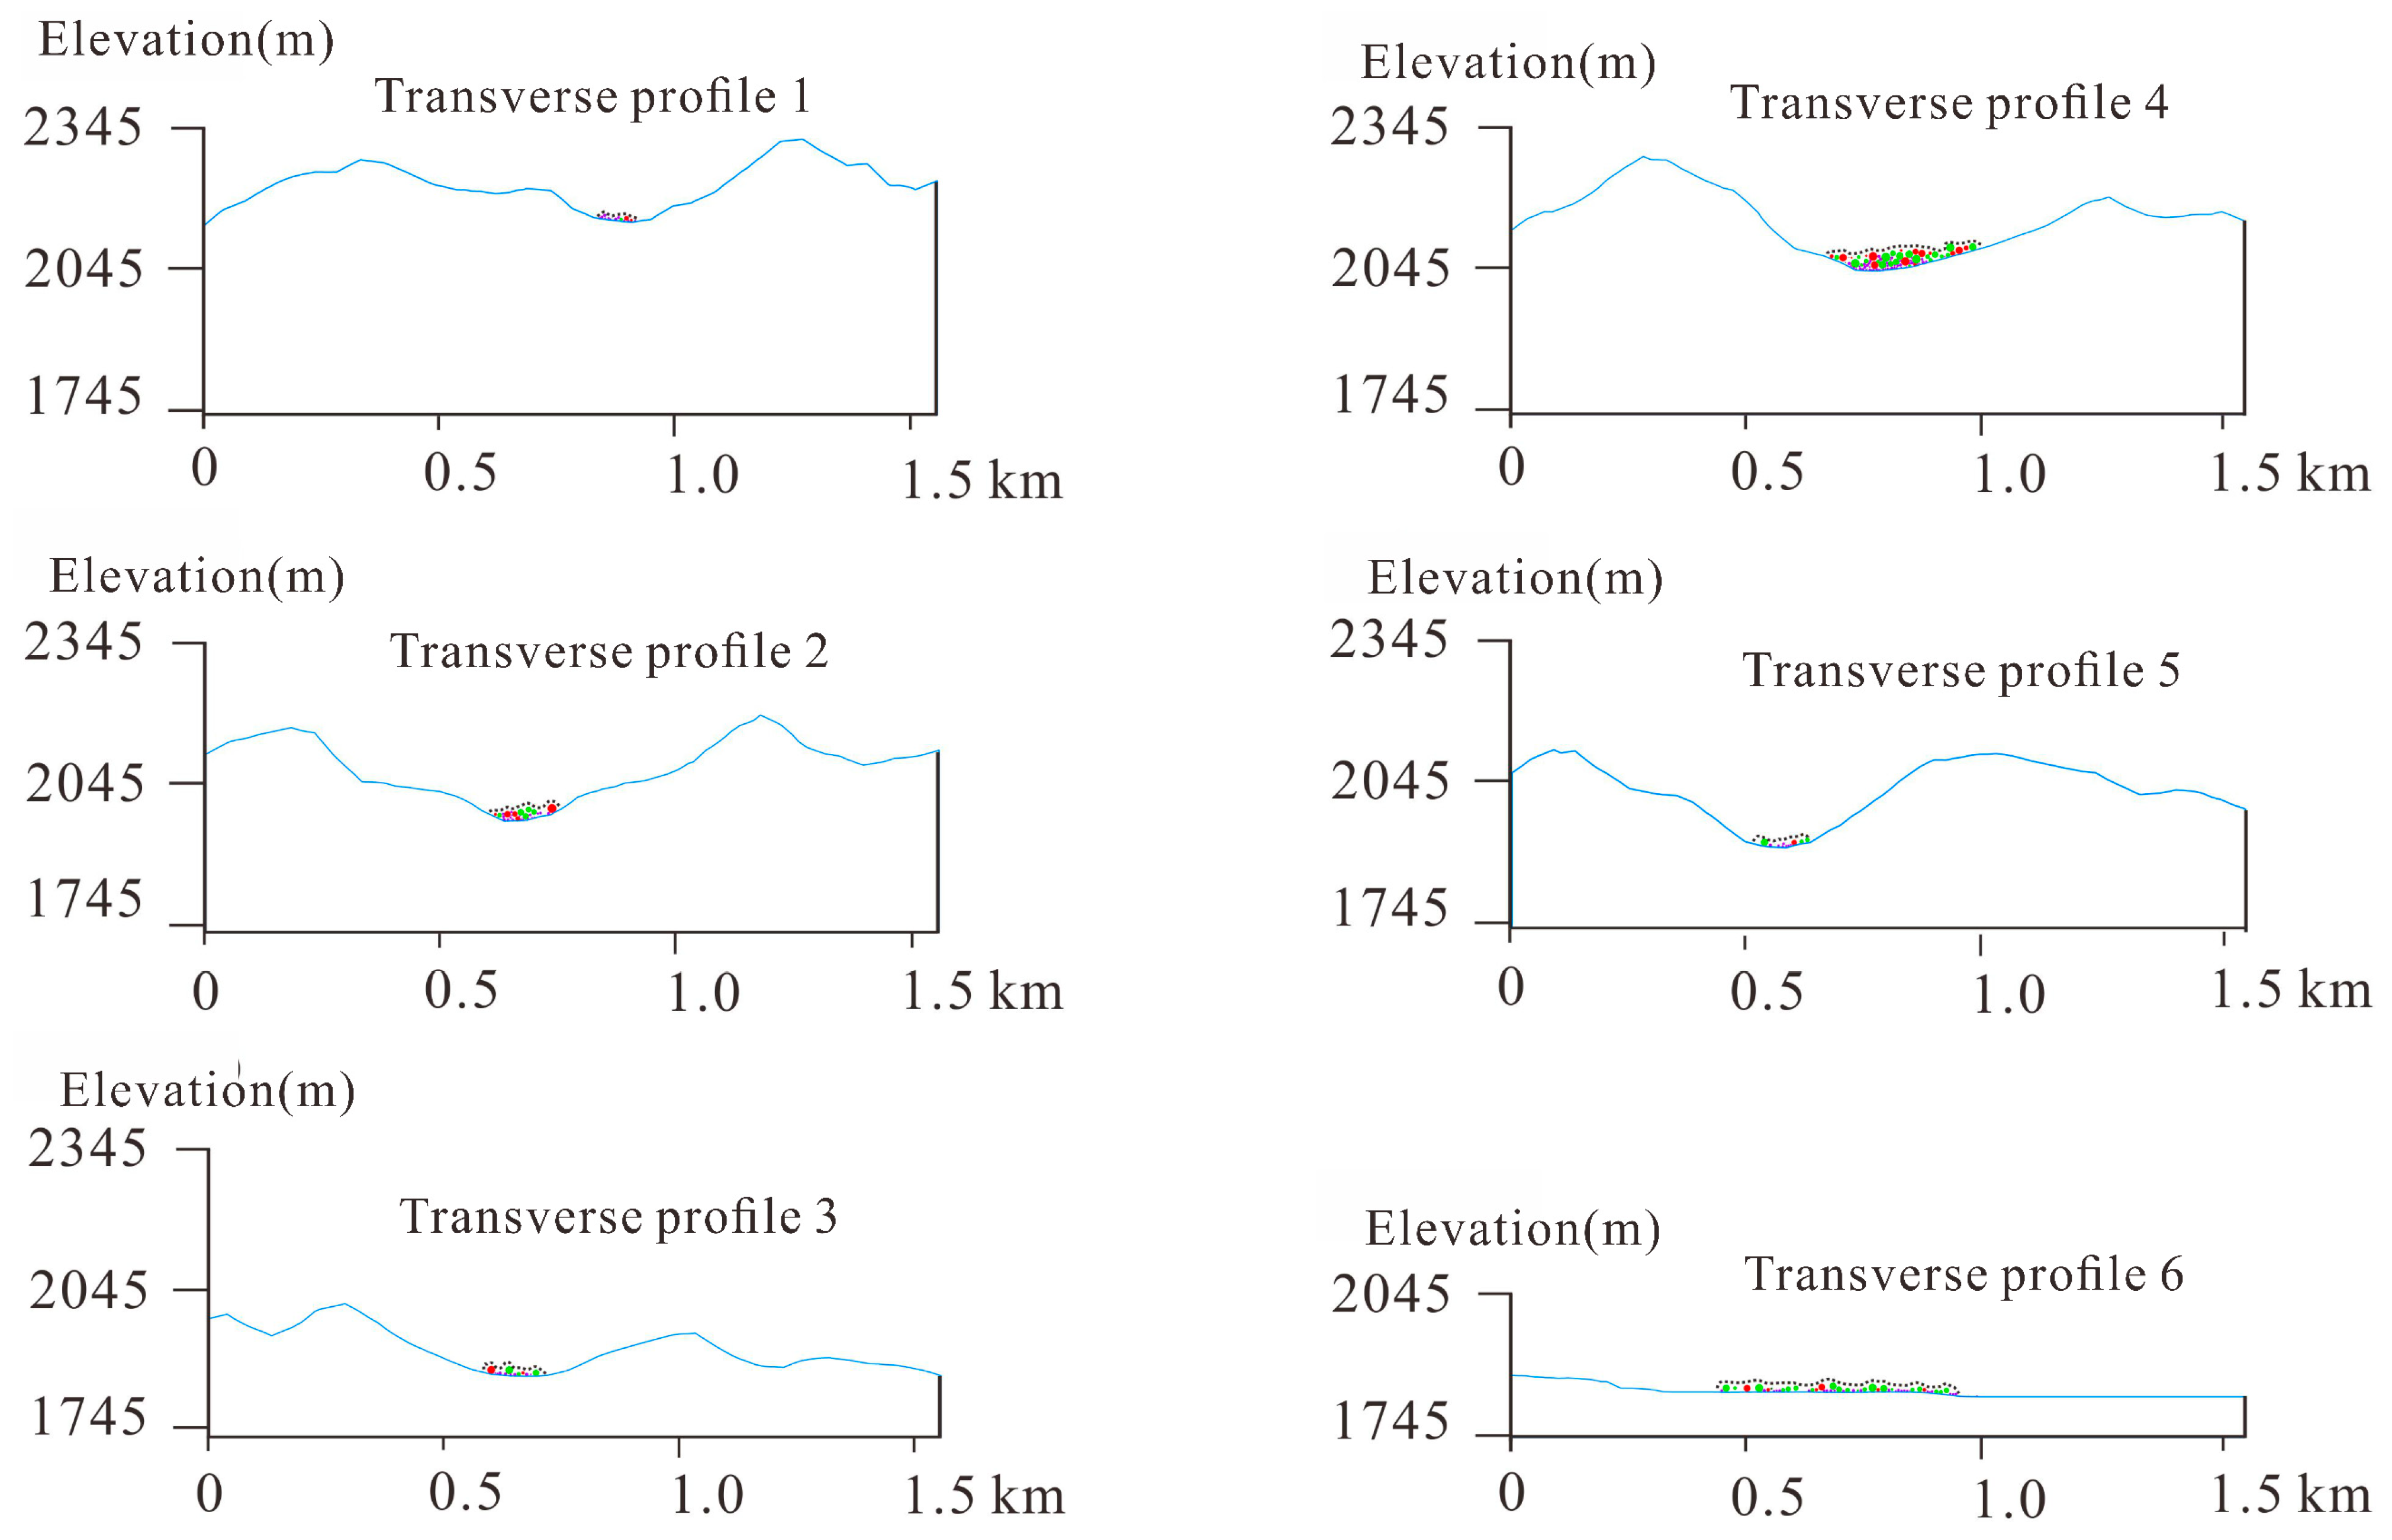
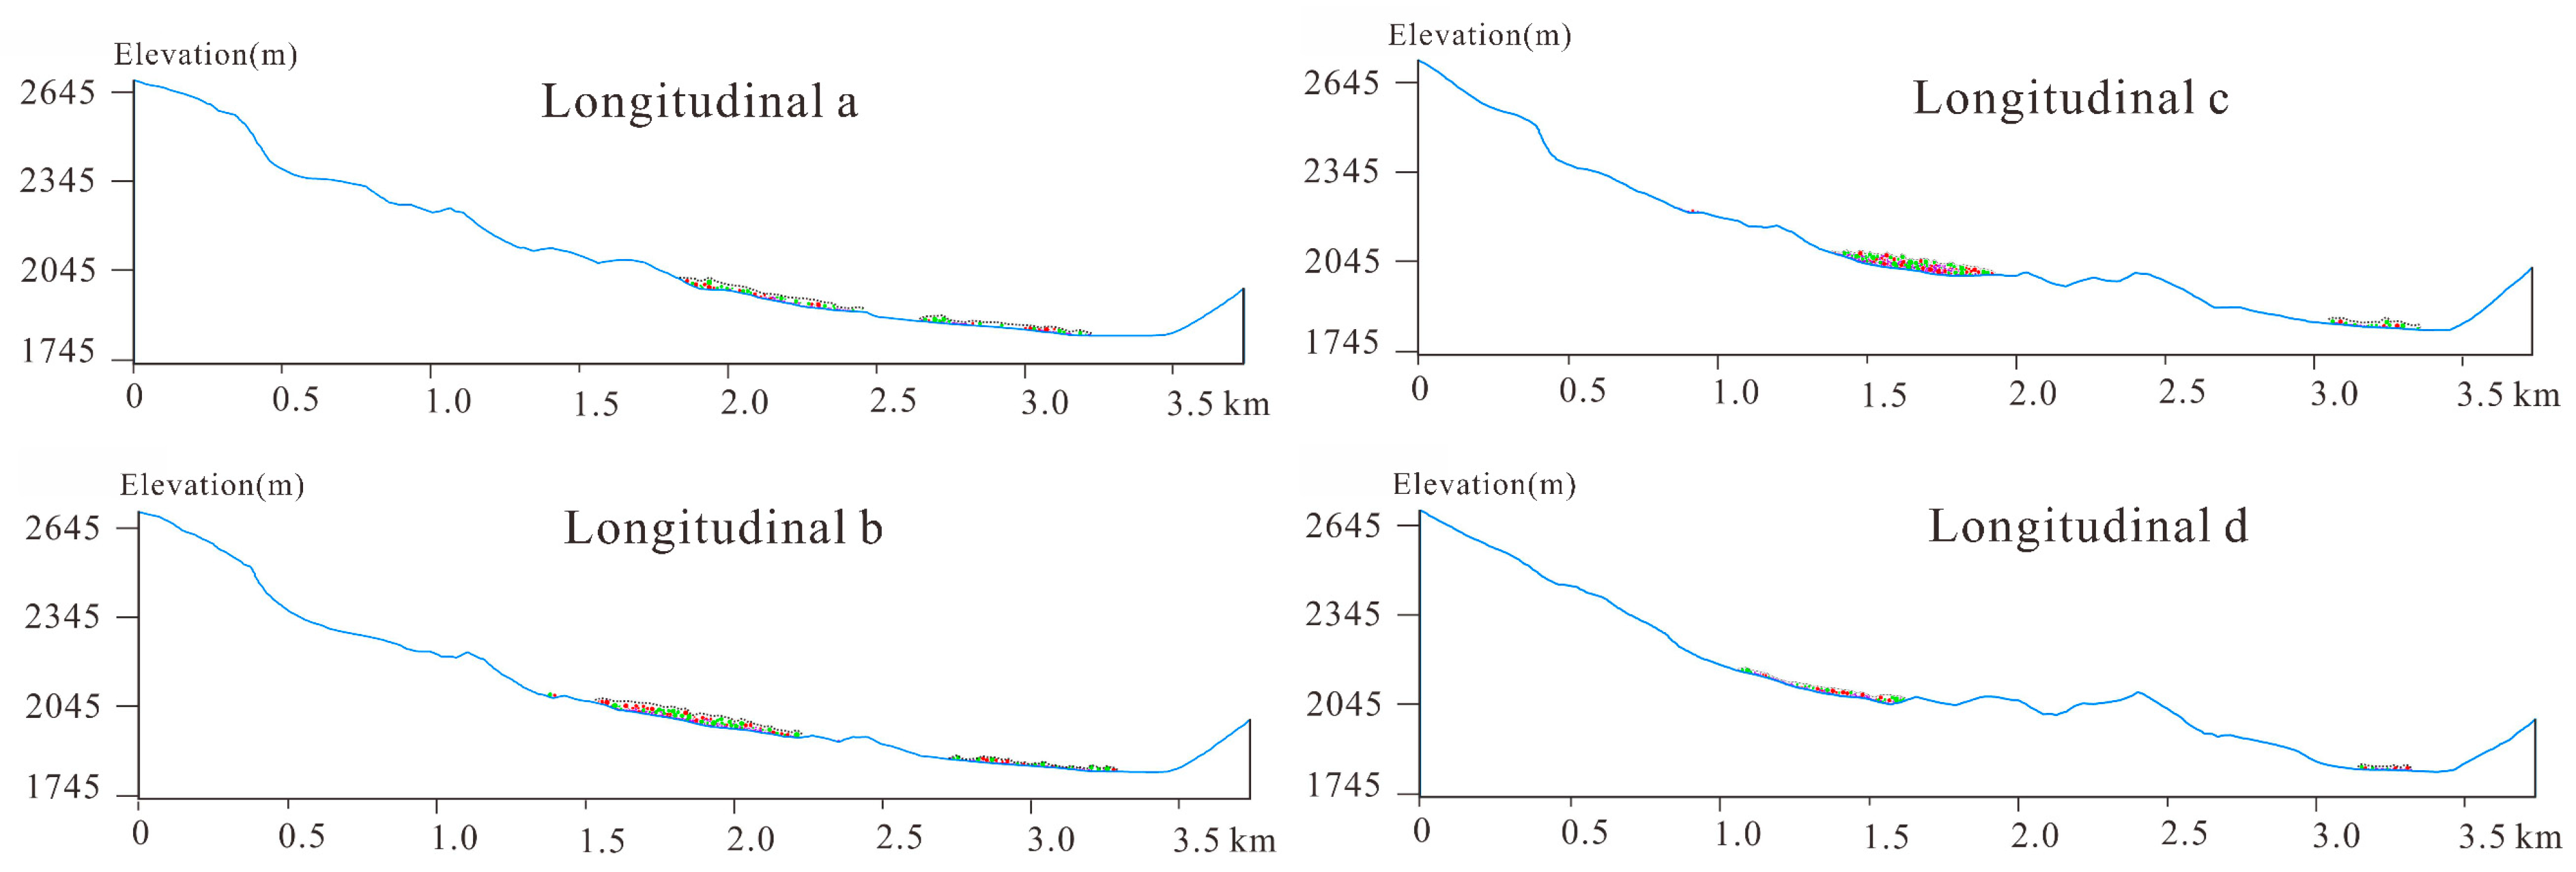
4.2. Simulation of Accumulation Characteristics
4.3. Simulation of Kinematic Process
5. Discussion
5.1. Mechanisms for the Occurrence of Rock Avalanche
5.2. Effect of the Topography
5.3. Integration of Multi-Source Analysis Techniques
6. Conclusions
- (1)
- The kinetic phase of the TZRA probably lasted for 3 min and can be further divided into three phases: the rapid acceleration (<45 s) phase; the high-speed long-runout (45–120 s) phase and the final low-speed deposition (>2 min) phase.
- (2)
- Analysis of the accumulation pattern of the TZRA indicated that during the movement of the landslide-avalanche debris, a climbing phenomenon and scraping effect co-existed on both sides of the mountain. When the TZRA reached the mouth of the gully, the avalanche debris spread to both sides because it was no longer restrained by the mountain bodies on both sides of the narrow gully, forming a “trumpet”-shaped accumulation pattern that is roughly consistent with the results of the large-size boulder survey.
- (3)
- Numerical results show that the debris accumulation tends to be distributed downstream, and the accumulation thickness gradually thins at the profile, similar to the “planar elongation movement” of debris in the source area; therefore, accumulation does not show evident particle sorting from above and below.
Author Contributions
Funding
Data Availability Statement
Conflicts of Interest
References
- Heim, A. Ueber den Bergsturz von Elm. Z. Der Dtsch. Geol. Ges. 1882, 435–438. (In German) [Google Scholar]
- Goguel, J. Scale-Dependent Rockslide Mechanisms, with Emphasis on the Role of Pore Fluid Vaporization. Dev. Geotech. Eng. 1978, 14, 693–705. [Google Scholar]
- Crosta, G.B.; Chen, H.; Lee, C.F. Replay of the 1987 Val Pola Landslide, Italian Alps. Geomorphology 2004, 60, 127–146. [Google Scholar] [CrossRef]
- Yan, Y.Z.; Liu, G.; Yang, X.Y.; Huang, D. Process simulation of the Sale Mountain landslide based on continuum-based discrete element method. J. Lanzhou Univ. (Nat. Sci.) 2018, 54, 6. [Google Scholar]
- Zhou, G.G.D.; Roque, P.J.C.; Xie, Y.X.; Song, D.R.; Zou, Q.; Chen, H.Y. Numerical study on the evolution process of a geohazards chain resulting from the Yigong landslide. Landslides 2020, 17, 2563–2576. [Google Scholar] [CrossRef]
- Delaney, K.B.; Evans, S.G. The 2000 Yigong landslide (Tibetan Plateau), rockslide dammed lake and outburst flood: Review, remote sensing analysis, and process modelling. Geomorphology 2015, 246, 377–393. [Google Scholar] [CrossRef]
- Tang, H.M.; Zou, Z.X.; Xiong, C.R.; Wu, Y.P.; Hu, X.L.; Wang, L.Q.; Lu, S.; Criss, R.E.; Li, C.D. An evolution model of large consequent bedding rockslides, with particular reference to the Jiweishan rockslide in Southwest China. Eng. Geol. 2015, 186, 17–27. [Google Scholar] [CrossRef]
- Yin, Y.P.; Sun, P.; Zhang, M.; Li, B. Mechanism on apparent dip sliding of oblique inclined bedding rockslide at Jiweishan, Chongqing, China. Landslides 2011, 8, 49–65. [Google Scholar] [CrossRef]
- Xu, Q.; Fan, X.M.; Huang, R.Q.; Yin, Y.P.; Hou, S.S.; Dong, X.J.; Tang, M.G. A catastrophic rockslide-debris flow in Wulong, Chongqing, China in 2009: Background, characterization, and causes. Landslides 2010, 7, 75–87. [Google Scholar] [CrossRef]
- Xing, A.G.; Wang, G.; Yin, Y.P.; Jiang, Y.; Wang, G.Z.; Yang, S.Y.; Dai, D.R.; Zhu, Y.Q.; Dai, J.A. Dynamic analysis and field investigation of a fluidized landslide in Guanling, Guizhou, China. Eng. Geol. 2014, 181, 1–14. [Google Scholar] [CrossRef]
- Yin, Y.; Sun, P.; Zhu, J.; Yang, S. Research on catastrophic rock avalanche at Guanling, Guizhou, China. Landslides 2011, 8, 517–525. [Google Scholar] [CrossRef]
- Yin, Y.; Xing, A.; Wang, G.; Feng, Z.; Li, B.; Jiang, Y. Experimental and numerical investigations of a catastrophic long-runout landslide in Zhenxiong, Yunnan, southwestern China. Landslides 2016, 14, 649–659. [Google Scholar] [CrossRef]
- Kent, P.E. The transport mechanism in catastrophic rock falls. J. Geol. 1966, 74, 79–83. [Google Scholar] [CrossRef]
- Shreve, R.L. The Blackhawk Landslide; Geological Society of America Special Paper; Geological Society of America: Boulder, CO, USA, 1968; Volume 108, pp. 1–47. [Google Scholar]
- Collins, G.S.; Melosh, H.J. Acoustic fluidization and the extradinary mobility of sturzstroms. J. Geophys. Res. 2003, 108, 1–14. [Google Scholar]
- Erismann, T.H. Mechanisms of large landslides. Rock Mech. 1979, 12, 15–46. [Google Scholar] [CrossRef]
- Davies, T.R.; McSaveney, M.J. Dynamic simulation of the motion of fragmenting rock avalanches. Can. Geotech. J. 2002, 39, 789–798. [Google Scholar] [CrossRef]
- Davies, T.R.; McSaveney, M.J.; Hodgson, K.A. A fragmentation-spreading model for long-runout rock avalanches. Can. Geotech. J. 1999, 36, 1096–1110. [Google Scholar] [CrossRef]
- Branney, M.J.; Kokelaar, P. A reappraisal of ignimbrite emplacement: Progressive aggradation and changes from particulate to non-particulate flow during emplacement of high-grade ignimbrite. Bull. Volcanol. 1992, 54, 504–520. [Google Scholar] [CrossRef]
- Gray, J.M.N.T.; Ancey, C. Segregation, recirculation and deposition of coarse particles near two-dimensional avalanche fronts. J. Fluid Mech. 2009, 629, 87–423. [Google Scholar] [CrossRef]
- Cruden, D.M.; Hungr, O. The debris of the Frank Slide and theories of rockslide-avalanche mobility. Can. J. Earth Sci. 1986, 23, 425–432. [Google Scholar] [CrossRef]
- Vallance, J.W.; Savage, S.B. Particle segregation in granular flows down chutes. In Segregation in Granular Flows (International Union of Theoretical and Applied Mechanics Symposium); Rosato, A., Blackmore, D., Eds.; Kluwer: Dordrecht, The Netherlands, 2005; pp. 31–51. [Google Scholar]
- Pudasaini, S.P. A general two-phase avalanche debris model. J. Geophys. Res. 2012, 117, 1–28. [Google Scholar]
- Wang, Y.F.; Xu, Q.; Cheng, Q.G.; Li, Y.; Luo, Z.X. Spreading and Deposit Characteristics of a Rapid Dry Granular Avalanche across 3D Topography: Experimental Study. Rock Mech. Rock Eng. 2016, 49, 4349–4370. [Google Scholar] [CrossRef]
- Ge, Y.F.; Zhou, T.; Huo, S.L.; Xia, D.; Hu, Y.; Zhong, P.; Zhang, L. Energy Transfer Mechanism during Movement and Accumulation of Rockslide Avalanche. Earth Sci. 2019, 44, 3939–3949. (In Chinese) [Google Scholar]
- Cundall, P.A.; Strack, O.D.L. A Discrete Numerical Model for Granular Assemblies. Géotechnique 1979, 29, 47–65. [Google Scholar] [CrossRef]
- Tang, C.L.; Yuan, R.M.; Hu, J.C.; Zheng, Q.Q. 3-D Distinct Element Modeling of Sliding Process and Depositing Behavior in Jiufengershan Landslide induced by 1999 Taiwan Chi-Chi Earthquake. J. Eng. Geol. 2012, 20, 940–953. (In Chinese) [Google Scholar]
- Ge, Y.F.; Tang, H.M.; Li, W.; Wang, L.Q.; Wu, Y.P.; Yi, X.L.; Xiong, C.R. Evaluationfor Deposit Areas of Rock Avalanche Based on Features of Rock Mass Structure. Earth Sci. 2016, 41, 1583–1592. (In Chinese) [Google Scholar]
- Liu, C.; Fan, X.M.; Zhu, C.G.; Shi, B. Discrete Element Modeling and Simulation of 3-Dimensional Large-Scale Landslide-Taking Xinmocun Landslide as an Example. J. Eng. Geol. 2019, 27, 1362–1370. (In Chinese) [Google Scholar]
- Yan, J.; Chen, J.; Tan, C.; Zhang, Y.; Liu, Y.; Zhao, X.; Wang, Q. Rockfall source areas identification at local scale by integrating discontinuity-based threshold slope angle and rockfall trajectory analyses. Eng. Geol. 2023, 313, 106993. [Google Scholar] [CrossRef]
- Yan, J.; Chen, J.; Zhou, F.; Li, Y.; Zhang, Y.; Gu, F.; Zhang, Y.; Li, Y.; Li, Z.; Bao, Y. Numerical simulation of the Rongcharong paleolandslide river-blocking event: Implication for the longevity of the landslide dam. Landslides 2022, 19, 1339–1356. [Google Scholar] [CrossRef]
- Sheng, K.; Liu, X.; Shan, H.; Qian, X.; Wang, G.; Hong, B. A Novel Method for Stability Analysis of Weakly Inclined Subgrade by Centrifuge Model Test and the Finite-Element Method. Int. J. Geomech. 2022, 22, 4. [Google Scholar] [CrossRef]
- Li, X.S.; Li, Q.; Wang, Y.M.; Liu, W.; Di, H.; Zheng, W.B.; Zhang, X. Experimental study on instability mechanism and critical intensity of rainfall of high-steep rock slopes under unsaturated conditions. Int. J. Min. Sci. Technol. 2023, in press. [Google Scholar] [CrossRef]
- Luo, J.Y.; Xu, Z.M.; Ren, Z.; Wang, K.; Yang, K.; Tang, Y.J.; Gao, H.Y.; Tian, L. Rock avalanche-debris geometry and implications for rock-avalanche genesis. Geomorphology 2019, S334, 60–75. [Google Scholar] [CrossRef]
- Ren, Z.; Wang, K.; Yang, K.; Zhou, Z.H.; Tang, Y.J.; Tian, L.; Xu, Z.M. The grain size distribution and composition of the Touzhai rock avalanche deposit in Yunnan, China. Eng. Geol. 2019, 234, 97–111. [Google Scholar] [CrossRef]
- Wang, K.; Xu, Z.M.; Tian, L.; Ren, Z.; Yang, K.; Tang, Y.J.; Gao, H.Y.; Luo, J.Y. Estimating the dynamics of the groundwater in vegetated slopes based on the monitoring of streams. Eng. Geol. 2019, 259, 105160. [Google Scholar] [CrossRef]
- Tang, S.B.; Wang, J.X.; Chen, P.Z. Theoretical and numerical studies of cryogenic fracturing induced by thermal shock for reservoir stimulation. Int. J. Rock Mech. Min. Sci. 2020, 125, 104160. [Google Scholar] [CrossRef]
- Tang, S.B.; Huang, R.Q.; Wang, S.Y.; Bao, C.Y.; Tang, C.A. Study of the fracture process in heterogeneous materials around boreholes filled with expansion cement. Int. J. Solids Struct. 2017, 112, 1–15. [Google Scholar] [CrossRef]
- Tang, S.B.; Zhang, H.; Tang, C.A.; Liu, H.Y. Numerical model for the cracking behavior of heterogeneous brittle solids subjected to thermal shock. Int. J. Solids Struct. 2016, 80, 520–531. [Google Scholar] [CrossRef]
- Tang, S.B.; Tang, C.A. Crack propagation and coalescence in quasi-brittle materials at high temperatures. Eng. Fract. Mech. 2015, 134, 404–432. [Google Scholar] [CrossRef]
- Yin, Q.; Liu, R.C.; Jing, H.W.; Su, H.J.; Yu, L.Y.; He, L.X. Experimental study of nonlinear flow behaviors through fractured rock samples after high-temperature exposure. Rock Mech. Rock Eng. 2019, 52, 2963–2983. [Google Scholar] [CrossRef]
- Zhu, Y.; Dai, F. Insights into the kinetic and fragmentation characteristics of a ridge-top rock avalanche based on field investigation and discrete element simulation. Bull. Eng. Geol. Environ. 2021, 80, 2085–2099. [Google Scholar] [CrossRef]
- Hoek, E.; Brown, E.T. Practical estimates of rock mass strength. Int. J. Rock Mech. Min. Sci. 1997, 34, 1165–1186. [Google Scholar] [CrossRef]
- Hoek, E.; Kaiser, P.K.; Bawden, W.F. Support of Underground Excavations in Hard Rock; CRC Press: Boca Raton, FL, USA, 1995. [Google Scholar]
- Tang, C.L.; Hu, J.C.; Lin, M.L.; Angelier, J.; Lu, C.Y.; Chan, Y.C.; Chu, H.T. The Tsaoling Landslide Triggered by the Chi-Chi Earthquake, Taiwan: Insights from a Discrete Element Simulation. Eng. Geol. 2009, 106, 1–19. [Google Scholar] [CrossRef]
- Li, X.P.; He, S.M.; Luo, Y.; Wu, Y. Simulation of the Sliding Process of Donghekou Landslide Triggered by the Wenchuan Earthquake Using a Distinct Element Method. Environ. Earth Sci. 2012, 65, 1049–1054. [Google Scholar] [CrossRef]
- Li, Y.Y.; Feng, X.Y.; Yao, A.J.; Zhang, Z.H.; Li, K.; Wang, Q.S.; Song, S.Y. Progressive evolution and failure behavior of a Holocene river-damming landslide in the SE Tibetan Plateau, China. Landslides 2022, 19, 1069–1086. [Google Scholar] [CrossRef]
- Ren, F.Q.; Zhu, C.; He, M.C.; Shang, J.L.; Feng, G.L.; Bai, J.W. Characteristics and precursor of static and dynamic triggered rock burst: Insight from multifractal. Rock Mech. Rock Eng. 2023, 56, 1945–1967. [Google Scholar] [CrossRef]
- Yuan, R.M.; Tang, C.L.; Hu, J.C.; Xu, X.W. Mechanism of the Donghekou Landslide Triggered by the 2008 Wenchuan Earthquake Revealed by Discrete Element Modeling. Nat. Hazards Earth Syst. Sci. 2014, 14, 1195–1205. [Google Scholar] [CrossRef]
- Dai, F.C.; Tu, X.B.; Xu, C.; Gong, Q.M.; Yao, X. Rock avalanches triggered by oblique-thrusting during the 12 May 2008 Ms 8.0 Wenchuan earthquake, China. Geomorphology 2011, 132, 300–318. [Google Scholar] [CrossRef]
- Deng, Q.H.; Gong, L.X.; Zhang, L.P.; Yuan, R.M.; Xue, Y.Q.; Geng, X.K.; Hu, S.X. Simulating Dynamic Processes and Hypermobility Mechanisms of the Wenjiagou Rock Avalanche Triggered by the 2008 Wenchuan Earthquake Using Discrete Element Modelling. Bull. Eng. Geol. Environ. 2017, 76, 923–936. [Google Scholar] [CrossRef]
- Gorum, T.; Fan, X.; van Westen, C.J.; Huang, R.Q.; Xu, Q.; Tang, C.; Wang, G. Distribution pattern of earthquake-induced landslides triggered by the 12 May 2008 Wenchuan earthquake. Geomorphology 2011, 133, 152–167. [Google Scholar] [CrossRef]
- Hussain, Y.; Schlögel, R.; Innocenti, A.; Hamza, O.; Iannucci, R.; Martino, S.; Havenith, H.-B. Review on the Geophysical and UAV-Based Methods Applied to Landslides. Remote Sens. 2022, 14, 4564. [Google Scholar] [CrossRef]
- Bhattacharya, A.; Mukherjee, K. Review on InSAR based displacement monitoring of Indian Himalayas: Issues, challenges and possible advanced alternatives. Geocarto Int. 2017, 32, 298–321. [Google Scholar] [CrossRef]
- Rau, J.Y.; Jhan, J.P.; Rau, R.J. Semiautomatic Object-oriented landslide recognition scheme from multisensor optical imagery and DEM. IEEE Trans. Geosci. Remote Sens. 2014, 52, 1336–1349. [Google Scholar] [CrossRef]
- Raspini, F.; Bardi, F.; Bianchini, S.; Ciampalini, A.; Del Ventisette, C.; Farina, P.; Ferrigno, F.; Solari, L.; Casagli, N. The contribution of satellite SAR-derived displacement measurements in landslide risk management practices. Nat. Hazards 2017, 86, 327–351. [Google Scholar] [CrossRef]


| Basin Area (km2) | Highest Elevation (m) | Minimum Elevation (m) | Slope on Both Sides of the Valley (°) | Main Ditch Length (km) | Main Gully Channel Slope (°) |
|---|---|---|---|---|---|
| 3.2 | 2940 | 1820 | 40.65–52.00 | 4.0 | 12.4 |
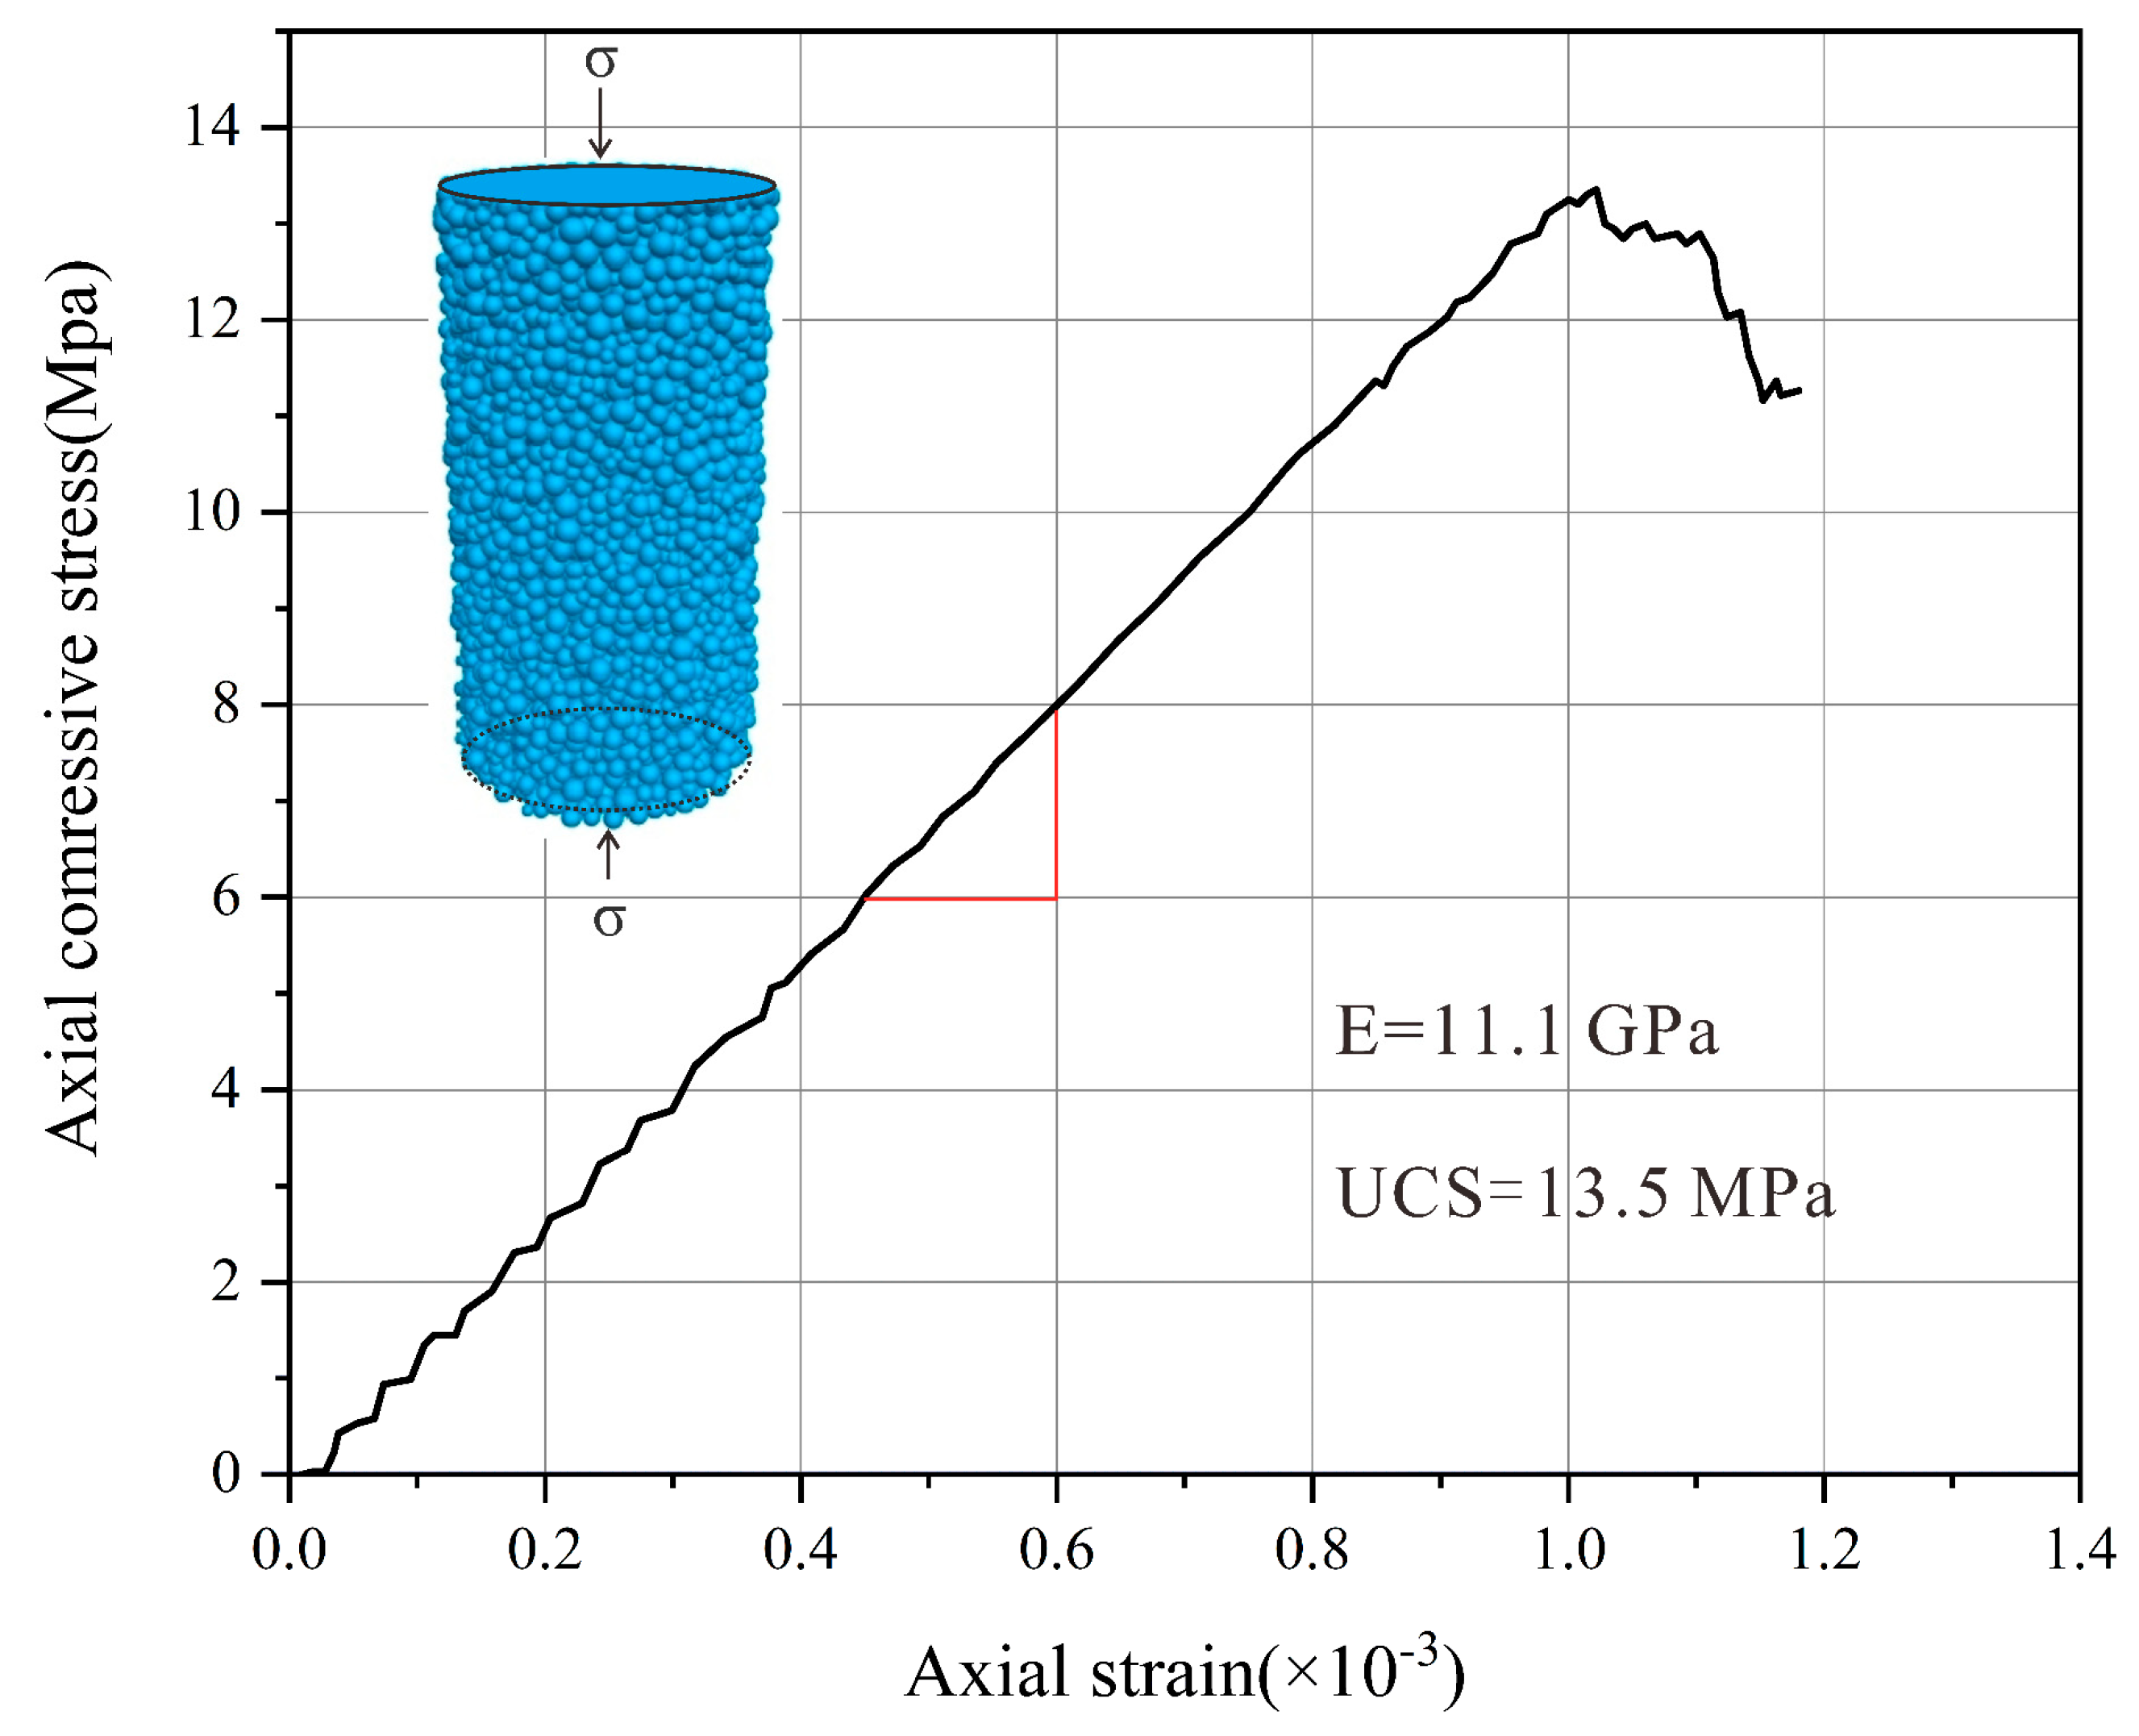
| Rock Mass | Density ρ (g/cm3) | UCS (MPa) | Young’s Modulus (GPa) | Poisson’s Ratio μ |
|---|---|---|---|---|
| Basalt | 2100 | 200 | 11 | 0.14 |
| Parameter | Micro Parameter Type | Values |
|---|---|---|
| Rmax/Rmin | Particle radius | 2 |
| N | Number of particles | 87,000 |
| ρ | Particle density (kg/m3) | 2600 |
| Ec | Ball-ball contact modulus (GPa) | 1.49 |
| K | Normal-to-shear stiffness ratio (kn/ks) | 1.0 |
| E′c | Bond effective modulus (GPa) | 4.8 |
| K′ | Bond normal-to-shear Stiffness ratio | 1.2 |
| σc | Contact-bond normal strength (MPa) | 5 × 10⁶ |
| τc | Contact-bond shear strength (MPa) | 2 × 10⁶ |
| μ1 | Friction coefficient (ball friction coefficient) | 0.3 |
| μ2 | Friction coefficient (wall friction coefficient) | 1.0 |
Disclaimer/Publisher’s Note: The statements, opinions and data contained in all publications are solely those of the individual author(s) and contributor(s) and not of MDPI and/or the editor(s). MDPI and/or the editor(s) disclaim responsibility for any injury to people or property resulting from any ideas, methods, instructions or products referred to in the content. |
© 2023 by the authors. Licensee MDPI, Basel, Switzerland. This article is an open access article distributed under the terms and conditions of the Creative Commons Attribution (CC BY) license (https://creativecommons.org/licenses/by/4.0/).
Share and Cite
Gong, Y.; Xing, X.; Li, Y.; Zhu, C.; Li, Y.; Yan, J.; Le, H.; Li, X. Insights into the Movement and Diffusion Accumulation Characteristics of a Catastrophic Rock Avalanche Debris—A Case Study. Remote Sens. 2023, 15, 5154. https://doi.org/10.3390/rs15215154
Gong Y, Xing X, Li Y, Zhu C, Li Y, Yan J, Le H, Li X. Insights into the Movement and Diffusion Accumulation Characteristics of a Catastrophic Rock Avalanche Debris—A Case Study. Remote Sensing. 2023; 15(21):5154. https://doi.org/10.3390/rs15215154
Chicago/Turabian StyleGong, Yifei, Xiansen Xing, Yanan Li, Chun Zhu, Yanlin Li, Jianhua Yan, Huilin Le, and Xiaoshuang Li. 2023. "Insights into the Movement and Diffusion Accumulation Characteristics of a Catastrophic Rock Avalanche Debris—A Case Study" Remote Sensing 15, no. 21: 5154. https://doi.org/10.3390/rs15215154
APA StyleGong, Y., Xing, X., Li, Y., Zhu, C., Li, Y., Yan, J., Le, H., & Li, X. (2023). Insights into the Movement and Diffusion Accumulation Characteristics of a Catastrophic Rock Avalanche Debris—A Case Study. Remote Sensing, 15(21), 5154. https://doi.org/10.3390/rs15215154