Article

Analysis of the Spatiotemporal Characteristics and Influencing Factors of the NDVI Based on the GEE Cloud Platform and Landsat Images

1
School of Information Engineering, Zhejiang Ocean University, Zhoushan 316022, China
2
School of Geography Science and Geomatics Engineering, Suzhou University of Science and Technology, Suzhou 215009, China
*
Author to whom correspondence should be addressed.
Remote Sens. 2023, 15(20), 4980; https://doi.org/10.3390/rs15204980
Submission received: 22 August 2023 / Revised: 12 October 2023 / Accepted: 14 October 2023 / Published: 16 October 2023
(This article belongs to the Special Issue Remote Sensing for Wetland Restoration)

Abstract

:
Vegetation is an important type of land cover. Long-term, large-scale, and high-precision vegetation monitoring is of great significance for ecological environment investigation and regional sustainable development in protected areas. This paper develops a long-term remote sensing monitoring method for vegetation by calculating the normalized difference vegetation index (NDVI) based on the Google Earth Engine (GEE) cloud platform and Landsat satellite remote sensing images. First, based on Landsat long-term satellite images and GEE, the spatiotemporal distribution map of the NDVI is accurately drawn. Subsequently, the NDVI is accurately classified, and the time trend analysis of the NDVI is conducted based on the NDVI mean trend graphs, transition matrices, etc. Then, combined with Moran’s I, high/low clusters, and other methods, the spatial pattern characteristics of the NDVI are analyzed. Finally, climate factors, terrain factors, and anthropologic factors are considered comprehensively. An analysis of the factors affecting the evolution of the NDVI is performed. Taking Zhoushan Island, China, as an example, an experiment is conducted, and the results reveal that (1) the average NDVI exhibits a decreasing trend from 1985 to 2022, decreasing from 0.53 in 1985 to 0.46 in 2022. (2) Regarding vegetation index transitions, the high NDVI areas (0.6–1) exhibit the most substantial shift toward moderately high NDVI values (0.4–0.6), covering an area of 83.10 km2. (3) There is an obvious spatial agglomeration phenomenon in the NDVI on Zhoushan Island. The high-high NDVI clusters and the significant hot spots are predominantly concentrated in the island’s interior regions, while the low-low NDVI clusters and the significant cold spots are mainly situated along the coastal areas. (4) The DEM, slope, and temperature have a greater influence among the single factors on the spatial pattern distribution of the NDVI in 2015. There are significant differences in the spatial pattern distribution of the NDVI between the temperature and DEM, temperature and slope, DEM and precipitation, slope and precipitation, aspect and population, and aspect and gross domestic product (GDP). The DEM and slope, DEM and temperature, and DEM and population are three sets of factors with a strong influence on spatial pattern interaction. This study provides data support for the scientific management of vegetation resources on Zhoushan Island and is of great significance to the sustainable development of the island region.

Graphical Abstract

1. Introduction

In recent years, as global climate change and human activities have continued to intensify, research on and protection of natural ecosystems have become increasingly important. Vegetation is an important indicator for evaluating and monitoring the health of ecosystems and is an important indicator of global climate change [1]. Vegetation maintains the ecological balance and species diversity by fixing carbon dioxide, releasing oxygen, maintaining water circulation, and preventing soil erosion [2]. In addition, vegetation can absorb a large amount of greenhouse gases, effectively slowing down the rate of global climate change, and it plays an important buffering and regulating role [3,4]. Vegetation also provides humans with important resources such as food, medicine, and timber, ensuring the sustainable development and well-being of humans.
Vegetation monitoring usually includes the on-the-spot survey method, model simulation method, and remote sensing monitoring method. Among these methods, the field survey method uses on-site sampling and laboratory investigation of the environment. Although the results are relatively accurate, it is time-consuming and laborious, and the cost is high [5]. The model simulation method uses vegetation ecological models and climate models, combined with environmental factors and vegetation parameters, to simulate and predict the growth, distribution, and response of vegetation. It can comprehensively consider the effects of multiple factors, including climate, soil, and topography, on vegetation. However, its accuracy is limited by the structure of the model and the quality of the input data, and there are still certain challenges in the perfect simulation of complex ecosystems and vegetation dynamics. However, remote sensing technology has been widely used in vegetation monitoring due to its advantages of fast imaging speed, wide coverage, low cost, and long time series data [6]. Remote sensing technology has been further advanced by the emergence of Google Earth Engine (GEE), a cloud computing platform developed by Google and dedicated to the processing, analysis, and visualization of Earth observation data. It integrates large-scale remote sensing data, geographic information system (GIS) tools, and computational power to provide users with powerful tools to study and monitor environmental and geographic changes on Earth [7,8,9].
The vegetation index (VI) is a key parameter for studying vegetation coverage and ecosystem functions [10]. It can reflect information such as vegetation greenness and growth status and can reflect the vegetation type and density on land surfaces. The VI has been widely used in vegetation coverage assessment, growth status monitoring, drought monitoring, and other fields [11,12,13]. Currently, many researchers have developed various remote sensing indices, such as the normalized difference vegetation index (NDVI), leaf area index, ratio vegetation index, and difference vegetation index (DVI). These indices have been widely used in applications, such as vegetation coverage assessment, vegetation health monitoring, ocean island terrestrial ecosystem carbon storage estimation, and global climate change analysis [14,15,16,17,18,19,20,21,22,23,24]. Compared with other indices, the NDVI is the best indicator of the vegetation growth status and vegetation coverage and has a wide range of application values in the study of the environment and climate change. The NDVI has become an important and widely used indicator in remote sensing image analysis and environmental research. Wang et al. used linear regression, partial correlation analysis, and Copula methods to analyze the changes in the NDVI in various regions of Inner Mongolia, the growth status of vegetation in different regions, and changes in the ecological environment [25]. However, they did not comprehensively consider the many factors that affect vegetation growth and NDVI distribution in the study area. Lu et al. established a new biomass calculation model to estimate the biomass of the Nan Da Gang Wetland Reserve through linear regression calculations of the NDVI and canopy height but did not make a detailed analysis of the distribution of the spatial pattern of the NDVI [26,27,28,29]. Zhang et al. analyzed the relationship between spatial and temporal variations of the NDVI and climate change in Inner Mongolia using NDVI data and meteorological data using general least squares, trend analysis, correlation analysis, etc., with a lack of analysis of anthropogenic factors in the distribution of the NDVI [30,31,32,33]. Currently, research on and applications of the NDVI have become an active topic in remote sensing and an indispensable part of environmental research.
Based on the GEE cloud platform and Landsat time series remote sensing images, in this paper, the spatial and temporal distributions of the NDVI on Zhoushan Island from 1985 to 2022 are mapped. Furthermore, combined with Moran’s I for detecting spatial aggregation or dispersion of data, high/low clusters for further distinguishing aggregation patterns, clustering and outlier for identifying geographic areas with similar characteristics, and cold/hot spots for identifying low-value and high-value areas analyze the characteristics of their spatiotemporal patterns. Finally, climatic, topographic, and anthropologic factors are selected to detect the factors affecting the changes in the NDVI on Zhoushan Island. This study provides reliable basic information for the ecological planning of Zhoushan Island and contributes to the sustainable development of Zhoushan’s economy.

2. Materials

2.1. Study Area

Zhoushan Island is located off the southeast coast of China (122°06′44″–122°45′02″E latitude, 29°25′15″–30°01′12″N longitude). Zhoushan Island is the largest island in the Zhoushan Archipelago, with a total area of approximately 434.30 km2. It has a complex coastline, flat terrain, and low altitude. It is the largest island in Zhejiang Province and the fourth-largest island in China [34]. A map of the study area is presented in Figure 1. Zhoushan Island has a subtropical monsoon climate, which is warm in winter, cool in summer, mild, and humid. It receives significant precipitation throughout the year. There are a variety of vegetation types distributed on the island, including forests, wetlands, and grasslands, forming a variety of ecosystems. Among these vegetation types, the forest covers a wide area, plays an important role in protecting the soil and water in the ecosystems of the island, and also provides valuable habitats for many animals and plants. As precious resources in nature, islands have become the focus of the attention of ecologists and geographers due to their unique geographical environment and ecological characteristics. As the largest island in the Zhoushan Archipelago, Zhoushan Island has diverse vegetation types. The study of its VI is of great significance for revealing the changes and responses of the island’s ecosystem.

2.2. Data

Landsat consists of a series of Earth observation satellites and is jointly operated by the National Aeronautics and Space Administration (NASA) and the United States Geological Survey [35,36]. The first satellite of this satellite series was launched in 1972, and nine satellites have been launched so far (among them, the sixth satellite failed to launch), providing continuous data for long-term Earth observation. In this study, Landsat satellite time series imagery data provided by the GEE were used. The original images had been processed, including radiometric correction and geometric correction. According to the data source status and experimental requirements, in this study, image sets with a cloud cover of less than 10% and with good imaging effects in each target year were selected (Table 1).
To study the factors influencing the NDVI distribution on Zhoushan Island, in this paper, the climatic factors, topographical factors, and anthropogenic factors were comprehensively considered. Furthermore, China’s historical gross domestic product (GDP) spatial distribution kilometer gridded dataset, global rainfall dataset, digital elevation model (DEM) dataset, slope dataset, aspect dataset, based on which the slope direction is computed, and other datasets were selected for use. The details are presented in Table 2.

3. Methods

The explosive growth of geospatial data has fundamentally changed human perception and interaction with the Earth. Traditional geographic information and remote sensing methods are facing challenges due to their high computational complexity and high processing costs. The emergence and development of satellite remote sensing cloud storage and cloud computing platforms represented by GEE not only allow users to access and analyze large-scale remotely sensed geographic data and carry out full-waveband and high-intensity distributed image computation but also integrate multi-source and multi-scale global remote sensing imagery, which greatly realizes efficient and continuous remote sensing monitoring and provides the convenience and possibility of realizing the monitoring of the NDVI in a long time series [37]. The GEE cloud platform has been widely used in applications such as the information extraction of breeding ponds in coastal areas, shoreline change monitoring, land use and cover change research, and environment assessment [38,39,40].
Based on the GEE cloud platform, in this study, Landsat images from 1985 to 2022 were used to calculate the NDVI, analyze the characteristics of the spatiotemporal patterns of vegetation, and detect the factors that affect vegetation changes. This included the following steps: (1) based on the GEE platform, the images for each year were obtained for preprocessing, including QA band cloud removal processing, cloud cover screening (<10%), interannual median synthesis, and clear images that can fully displayed the study area. (2) The NDVI was calculated; based on the normalized difference water index (NDWI) data, the lakes and other inland water bodies and outliers were removed, and the spatial and temporal distributions of the NDVI were determined. (3) Based on Moran’s I, high/low cluster analysis, clustering and outlier analysis, and cold/hot spot analysis were conducted, and the temporal trend and spatial pattern of the vegetation coverage on Zhoushan Island were analyzed. (4) Using the geodetector, the factors influencing the vegetation change on Zhoushan Island were detected from the perspectives of the climate, terrain, and anthropogenic factors. The specific workflow of the research is presented in Figure 2.

3.1. Data Acquisition and Preprocessing

First, the Landsat products for the study area covering the target years were selected in GEE to compile an initial dense time series image collection of the study area, which contained surface reflectance data that had been atmospherically and radiometrically corrected. Then, we used the QA band to perform cloud removal processing and screen out all high-quality images with less than 10% cloud cover in the image set to build a Landsat image stack. Finally, the median filtering method was used to filter the image stack by assigning a median value to each pixel of the entire image stack, i.e., sorting these pixel values and selecting the intermediate value as the median pixel value to synthesize a high-quality remote sensing image that showed the study area clearly and completely.

3.2. Drawing the NDVI Spatiotemporal Distribution Map

The NDVI is a commonly used remote sensing index, which is based on the absorption and reflection spectral characteristics of plant chlorophyll and is used to evaluate the health status and growth vitality of vegetation. The value range of the NDVI is between −1 and +1. The closer the value is to +1, the higher the vegetation coverage is. When the value is closer to −1, the land cover is water or ice and snow. In this study, numerical calculation of the NDVI on Zhoushan Island was conducted, and the inland water bodies on Zhoushan Island were delineated using the NDWI. The formulas are as follows:
N D V I = N I R R E D N I R + R E D ,
N D W I = G R E E N N I R G R E E N + N I R ,
where NIR, RED, and GREEN denote the near-infrared band, red band, and green band, respectively.
First, according to the calculated NDWI results, a mask was created for the water body area, which had values greater than 0. Then, the mask was applied to the NDVI data for Zhoushan Island, and the pixels corresponding to the water body area were masked to exclude the interference of the inland water bodies and outliers. Finally, the temporal and spatial distributions of the NDVI in each target year were mapped to achieve an intuitive understanding of the interannual changes in the vegetation on Zhoushan Island.

3.3. Spatiotemporal Pattern Analysis

3.3.1. Time Trend Analysis

NDVI classification analysis was conducted to classify and group the NDVI values, which have important application value in vegetation health monitoring, land use planning, and ecosystem monitoring. It provides key information for regional decision-making and helps formulate effective management strategies and conservation measures. To assess the change in vegetation on Zhoushan Island, combining the actual vegetation cover with the trend graph of the NDVI mean value, it was found that the mean value of the NDVI in each year was less than 0.6, and when the vegetation index was greater than 0.6, the image vegetation appeared to be saturated, and at this time, the vegetation would no longer be distinguishable. Based on existing NDVI classification studies, in this study, we fully considered the distinguishability of the vegetation coverage and the NDVI distribution in the study area and defined values of 0–0.2 as the low NDVI area, values of 0.2–0.4 as the medium NDVI area, values of 0.4–0.6 as the high NDVI area, and values of greater than 0.6 as the extremely high NDVI area [27,41,42]. Based on the grading results, the interannual changes were analyzed based on the areas occupied by different NDVI grades and the mean value of the NDVI. The transfer matrix between 1985 and 2022 was calculated, and cumulative and chordal graphs of the area proportions were plotted to analyze the transformations between the different levels of vegetation cover on Zhoushan Island.

3.3.2. Spatial Pattern Analysis

Since the 1960s, the use of spatial statistics has gradually emerged. In addition, spatial autocorrelation has received increasing attention from scholars, and a series of research tools have been continuously developed [43,44,45]. Parker Moran proposed Moran’s I to measure the degree of spatial autocorrelation, which is used to evaluate the degree of aggregation and dispersion of data in the entire world. J.P. Guilford proposed the clustering analysis method and divided the cluster analysis into two methods: high-level clustering and low-level clustering. This method has been widely used in spatial autocorrelation analysis. The clustering and outlier analysis methods were proposed by Ronald A. Fisher to better understand and explain geographic phenomena and patterns. Wang Jinfeng et al. proposed a geographic information mining method based on statistics and spatial analysis—namely, the geodetector—to detect correlations, nonlinear relationships, and interaction effects in spatial data [46]. Accurately grasping the distribution pattern of the NDVI and determining whether there is an aggregation of the NDVI values on Zhoushan Island is important for the analysis of the spatial distribution characteristics. As a comprehensive index for evaluating the degree of the spatial autocorrelation of data, Moran’s I can be used to determine the spatial distribution mode of the data. As a common composite indicator for assessing the degree of spatial autocorrelation of data, Moran’s I can be used to determine the spatial distribution pattern of data, quantify the degree of spatial correlation, with strong interpretability, and provide important insights into geographic phenomena for decision-making and problem-solving. The results will return the z- and p-values. The p-value indicates the possibility of rejecting the null hypothesis—that is, the possibility that the data are not randomly distributed. The z-value indicates the multiple of the standard deviation, indicating the degree of rejection of the null hypothesis. A smaller p-value and larger z-value indicate a greater chance of rejecting the null hypothesis. It can determine globally aggregated, discrete, or random data distribution patterns. The formulas are as follows:
I = n W i = 1 n j = 1 n ω i j ( x i x ¯ ) ( x j x ¯ ) i = 1 n ( x i x ¯ ) 2 ,
z = I E ( I ) V ( I ) ,
E ( I ) = 1 n 1 ,
V ( I ) = E ( I 2 ) E ( I ) 2 ,
where n is the total number of spatial units; x i and x j are the attribute values of the ith and jth spatial units, respectively; x ¯ is the mean value of the attribute value of all of the units; ω i j is the value of the spatial weight; W is the sum of all of the spatial weights; E ( I ) is the expectation; and V ( I ) is the variance.
Based on grasping the NDVI numerical aggregation of Zhoushan Island, to deeply analyze the degree of aggregation of the NDVI values, we need to assess the potential risk areas, judge the quality and validity of the numerical assessment to measure the clustering results, further judge the aggregation pattern of Zhoushan Island, and provide important insights about the geographic data for the environmental assessment. The high/low clusters analysis method is introduced here, which evaluates the clustering measurements by means of the General G index, a method that intuitively divides the data into two categories: high and low aggregation, making the clusters results interpretable. By evaluating the General G index and the z-value and p-value returned by the results, it is possible to clearly understand how the data points are clustered in space. The General G index is also calculated by dividing the existing data into n different cells and combining the weight of each cell. The result will return the z-value and p-value. The p-value indicates the possibility of rejecting the null hypothesis. The formulas are as follows:
G = i = 1 n j = 1 n ω i j x i x j i = 1 n j = 1 n x i x j , i j ,
z = G E ( G ) V ( G ) ,
E ( G ) = i = 1 n j = 1 n ω i j n ( n 1 ) , i j ,
V ( G ) = E ( G 2 ) E ( G ) 2 ,
where n is the total number of spatial units; x i and x j are the attribute values of the ith and jth spatial units, respectively; and ω i j is the value of the spatial weight. The higher the General G value is, the more it tends to be high clustering; otherwise, it is low clustering. If the General G observation is greater than the General G expectation, the z-value is positive and larger, and the element distribution tends to be a high-clustering distribution; otherwise, it is a low-clustering distribution. High clustering is based on similarity connections or splits, while low clustering is based on distance or similarity groupings. The high/low clusters method can intuitively divide the data into two categories of high clustering and low clustering, making the clustering results interpretable.
Geospatially, to further understand the intrinsic patterns and group structures of NDVI data on Zhoushan Island, we need to grasp the visualization results of NDVI data aggregation or dispersion and further identify potential NDVI data subsets or clusters and those that are significantly different from other NDVI outliers, evaluate the quality and consistency of the data, provide decision-making data for environmental planning and ecological protection, and analyze different clusters and outlier types. Usually, a significant high-value cluster is defined as a high-high cluster, a statistically significant low-value cluster is defined as a low-low cluster, the case where low values surround a high value is defined as a high-low cluster, and the case where high values surround a low value is defined as a low-high cluster. This approach enables a deeper understanding of the spatial relationships of the data by performing a classification process to identify natural clusters present in the data and to explore the spatial relationships at a finer scale.
Combining geospatial knowledge to provide policymakers with a reliable reference is crucial for decision-making, such as regional planning and the identification of areas suitable for development and areas that may require special attention or improvement. Cold/hot spot analysis, as a method used to identify areas of low-value aggregation and areas of high-value aggregation in geospatial data, can help us to understand the spatial patterns and trends of NDVI data, find the patterns and characteristics of NDVI values in the region, and discover the areas of high vegetation destruction or ecosystem hot spots in the study area, which are of great significance for the interpretation of geographic phenomena, ecological and environmental monitoring, and the improvement of decision making in a scientific way. Although high/low values tend to attract attention, the mere presence of high/low values does not mean that they are statistically significant hot/cold spots. To be a statistically significant hot/cold spot, a feature needs to have a high/low value and be surrounded by other adjacent features with high/low values. It is often calculated using the Getis-Ord Gi* statistics. The formulas are as follows:
G e t i s O r d   G i * = j = 1 n ω i j x j X ¯ j = 1 n ω i j S [ n j = 1 n ω 2 i j ( j = 1 n ω i j ) 2 ] n 1 ,
X ¯ = j = 1 n x j n ,
S = j = 1 n x 2 j n ( X ¯ ) 2 ,
where n is the total number of spatial units, x j is the attribute value of the jth spatial unit, and ω i j is the value of the spatial weight.

3.4. Analysis of the Influencing Factors

An in-depth understanding of the development status, change trends, and influencing factors on Zhoushan Island will help achieve a balance between economic development and ecological protection and will promote the sustainable development of Zhoushan Island. The geodetector is a new statistical method for detecting spatial variability and revealing the drivers behind it. It has an elegant form and clear physical meaning. In this study, we investigated three types of factors affecting the distribution of the NDVI on Zhoushan Island: climatic factors, topographical factors, and anthropological factors.
According to different data characteristics, the existing data for each influencing factor were stratified differently, and the q-values of different influencing factors were calculated by combining the variance within the layer and the total variance of the entire area using the geodetector. The degree of influence of various influencing factors on the spatial pattern of the NDVI on Zhoushan Island was measured and analyzed using the q-value. The formulas are as follows:
q = 1 h = 1 L N h σ h 2 N σ 2 = 1 S S W S S T ,
S S W = h = 1 L N h σ h 2 , S S T = N σ 2 ,
where h is the stratification of the variables or influencing factors; N h and N are the number of units in the layer and the entire region, respectively; σ h 2 and σ 2 are the stratum variance and the variance of the entire region, respectively; and SSW and SST are the sum of the stratum variance and the sum of the entire region’s variance, respectively.
Using the q-value, it is also possible to further ecological detection and interaction detection between two influences, as well as the strength and direction of the interaction.
Ecological detection was used to detect whether there were significant differences in the effects of two different influencing factors (X1 and X2) on the spatial distribution of the NDVI on Zhoushan Island, which was measured using F statistics. The formulas are as follows:
F = N X 1 ( N X 2 1 ) S S W X 1 N X 2 ( N X 1 1 ) S S W X 2 ,
S S W X 1 = h = 1 L 1 N h σ h 2 , S S W X 2 = h = 1 L 2 N h σ h 2 ,
where N X 1 and N X 2 are the sample sizes of X1 and X2, respectively; S S W X 1 and S S W X 2 are the sums of the intra-stratum variances of the layers formed by X1 and X2, respectively; L1 and L2 are the numbers of layers for variables X1 and X2, respectively; and σ h 2 is the variance of layer h.
When detecting the interaction, first, the q-values of the individual influencing factors are calculated, and then, the q-values when they interact are calculated. Finally, different q-values are compared with the types of interactions to attain a conclusion.
q ( X 1 X 2 ) < M i n ( q ( X 1 ) , q ( X 2 ) ) ,
M i n ( q ( X 1 ) , q ( X 2 ) ) < q ( X 1 X 2 ) < M a x ( q ( X 1 ) , q ( X 2 ) ) ,
q ( X 1 X 2 ) > M a x ( q ( X 1 ) , q ( X 2 ) ) ,
q ( X 1 X 2 ) = q ( X 1 ) + q ( X 2 ) ,
q ( X 1 X 2 ) > q ( X 1 ) + q ( X 2 ) ,
Equation (18) represents nonlinear weakening, Equation (19) represents single-factor nonlinear weakening, Equation (20) represents dual-factor enhancement, Equation (21) represents independence, and Equation (22) represents nonlinear enhancement.

4. Results and Analysis

4.1. Drawing NDVI Spatiotemporal Distribution Maps

Based on the GEE cloud platform and Landsat satellite remote sensing data, the NDVI on Zhoushan Island was calculated, and spatial and temporal distribution maps were drawn (Figure 3).
As can be seen from Figure 3, the high NDVI values were mainly concentrated in the inner part of Zhoushan Island, where the overall vegetation cover was high and the vegetation growth conditions were good, while the low NDVI values were mainly concentrated in the coastal area of Zhoushan Island. The vegetation cover was low in the southeastern coastal area of the main island, which exhibited an increasing trend. Based on the satellite imagery shown in Figure 1, the areas with low NDVI values were built-up areas where the vegetation cover was mainly influenced by human activities. In the northwest region of the island, the vegetation cover was low in 1985 and increased in 1990. The northeastern region of the island has expanded since 2010 and has experienced land use changes. Based on the satellite images, it was inferred this was caused by the expansion of the built-up areas and the construction of breeding ponds.

4.2. Temporal Trend Analysis

Based on the calculated NDVI results, the grading process was performed, and the results of vegetation grading were obtained by counting the area of each grade and the mean value of the NDVI in each year (Figure 4, Figure 5 and Figure 6 and Table 3 and Table 4).
It can be seen from Figure 4, Figure 5 and Figure 6 and Table 3 and Table 4 that the average NDVI value exhibited a decreasing trend from 1985 to 2022, decreasing from 0.53 in 1985 to 0.46 in 2022. Before 2005, Zhoushan City vigorously developed its economy, and Zhoushan Island experienced obvious urban expansion [39,40]. The average NDVI value of Zhoushan Island showed a downward trend. After 2005, Zhoushan City began to focus on ecological restoration, and the average NDVI value showed a slow upward trend [39]. The areas and proportions of the low NDVI area and the extremely high NDVI area changed significantly. From 1985 to 2022, the low NDVI area significantly increased from 28.84 km2 in 1985 to 67.29 km2 in 2022, and the proportion of the low NDVI area increased from 6% in 1985 to 13% in 2022, with an average annual rate of change of 3.60%. The extremely high NDVI area decreased significantly from 197.96 km2 in 1985 to 146.32 km2 in 2022, and the proportion of the high NDVI area decreased from 42% in 1985 to 29% in 2022, with an average annual rate of change of −0.78%. Overall, the extremely high NDVI area on Zhoushan Island exhibited a decreasing trend, while the low NDVI area and the medium NDVI area exhibited increasing trends, and the vegetation on Zhoushan Island was degraded.
In this study, the NDVI grading chord diagram and the 1985–2022 NDVI grading transfer matrix for Zhoushan Island from 1985 to 2022 were drawn according to the NDVI magnitude transfer matrix (Figure 7 and Table 5).
As can be seen from Figure 7 and Table 5, during the 37-year study period, the proportion of the high NDVI area transferred to the extremely high NDVI area was the greatest, with an area of 83.10 km2, followed by the proportion of the extremely high NDVI area transferred to the medium NDVI area, with an area of 56.99 km2. In addition, the high NDVI area was transferred from other magnitude areas—among which, the transfer from the extremely high NDVI area was the greatest, with an area of 36.90 km2. The land transfers among the other magnitudes were relatively small, all less than 20.00 km2.

4.3. Spatial Pattern Analysis

Based on the NDVI calculation results for Zhoushan Island, in this study, Moran’s I, high/low cluster analysis, clustering and outlier analysis, and cold/hot spot analysis were conducted to analyze the spatial distribution pattern of the NDVI on Zhoushan Island.
Moran’s I can measure the similarity of variable values at various locations in a geographic area, help people understand the spatial correlation of the data, and reveal the spatial patterns and trends in the data. In this study, the spatial autocorrelation tool was used to analyze the NDVI data for Zhoushan Island, and the calculation results of Moran’s I index were obtained (Figure 8 and Table 6).
As can be seen from Table 6 and Figure 8, the global Moran’s I index was 0.6302, the z-value was 4.3270, and p < 0.01, so the NDVI on Zhoushan Island exhibited significant spatial autocorrelation. There was obvious spatial clustering, and the possibility of randomly generating this type of clustering was less than 1%.
High/low cluster analysis is a clustering method based on data similarity or distance measurement, which can help us discover natural grouping or aggregation patterns in data and can reveal the internal structure and organization of data. To deeply analyze the aggregation of the NDVI on Zhoushan Island, the spatial autocorrelation tool was used to process the NDVI data for Zhoushan Island, and the analysis results of the high/low clusters were obtained (Figure 9 and Table 7).
As can be seen from Figure 9 and Table 7, the General G observation was 0.0033 greater than the General G expectation (0.0017), the z-value was 3.9462 > 0, and p < 0.01. Therefore, the NDVI values on Zhoushan Island exhibited obvious high-value agglomeration. The trend of the NDVI high-value data agglomeration was obvious, and the probability of randomly generating such a high-value agglomeration was less than 1%. This may be related to the geographic environment of Zhoushan Island. That is, it is surrounded by narrow alluvial plains, and the rest of the island is mountainous and hilly, so the high NDVI values are concentrated and are mainly distributed in the mountainous and hilly areas on Zhoushan Island.
Clustering and outlier analysis, as a method that combines clustering analysis and outlier detection, aims to simultaneously cluster data and identify outliers. Cluster and outlier analysis can provide detailed information about the internal structure and anomalies of a dataset, helping us to better understand the data and identify potential patterns and problems. The results of the combined clustering and outlier analysis are presented in Figure 10.
As can be seen from Figure 10, the low-low NDVI clusters were mainly concentrated along the coast of Zhoushan Island, where the intensity of the land development was high and the vegetation ecological index was low. The high-high NDVI clusters were mainly concentrated in the inner area of the island, where the vegetation was rich and the vegetation ecological index was high.
Cold/hot spot analysis uses statistical methods to determine the degree of similarity and dispersion of data within a geographic area to help us understand the spatial distribution patterns of data and to identify clusters of high values and clusters of low values in a particular area. In this study, the cold/hot spots on Zhoushan Island were identified based on the Getis-Ord Gi* statistical index (Figure 11).
It can be seen from Figure 11 that the significant hot spots (99% confidence) were mainly concentrated in the interior of Zhoushan Island, where the significantly high NDVI value areas were surrounded by other adjacent elements with high values. The significant cold spots (99% confidence) were mainly concentrated in the coastal area of Zhoushan Island, where the significantly low NDVI value areas were surrounded by other adjacent elements with low values.

4.4. Analysis of the Influencing Factors

To further study the factors affecting the spatial distribution of the NDVI on Zhoushan Island, we analyzed the factors influencing the vegetation change on Zhoushan Island, including climate factors, terrain factors, and anthropologic factors. The climatic factors included temperature and precipitation; the topographical factors included the DEM, slope, and aspect; and the anthropologic factors included the GDP and population.
Based on the NDVI data for Zhoushan Island in 2015, the q-value of a single influencing factor was calculated and compared, ecological monitoring was performed, and then, the q-value after the interaction of two influencing factors was calculated and compared. The results are presented in Figure 12 and Table 8 and Table 9.
According to Figure 12, the three factors that had greater effects on the spatial distribution of the NDVI on Zhoushan Island in 2015 were the DEM, slope, and temperature. Among them, the DEM had the greatest influence on the spatial distribution of the NDVI on Zhoushan Island. Its q-value was 0.4978, so the DEM had the strongest explanatory power for the distribution of the spatial pattern of the NDVI on Zhoushan Island.
According to Table 8, when two different influencing factors were selected to conduct ecological detection on the spatial distribution of the NDVI on Zhoushan Island in 2015, there were significant differences in the effects of the interactions between temperature and DEM, temperature and slope, DEM and precipitation, slope and precipitation, aspect and population, and aspect and GDP on the spatial distribution of the NDVI on Zhoushan Island.
According to Table 9, interactions between three pairs of factors had the strongest effects on the spatial distribution of the NDVI on Zhoushan Island in 2015: the DEM and slope, DEM and temperature, and DEM and population. Among them, the interaction between the DEM and slope had the greatest effect on the spatial distribution of the NDVI on Zhoushan Island, and its q-value was 0.5435. In addition, it was found that, when the DEM participated in the interaction, the q-value was greater than 0.5000. The results further revealed that the interactions between the precipitation, GDP, population, and aspect and the interaction between the population and precipitation exhibited nonlinear enhancement of the spatial distribution of the NDVI on Zhoushan Island, and the interactions between the other factors exhibited two-factor enhancement.
As can be seen from the remote sensing images in Figure 1 and Figure 11, the natural factors (e.g., DEM, slope, and temperature) played a positive role in the spatial distribution of the NDVI on Zhoushan Island. The active role of the natural factors determined the spatial pattern of the environment of Zhoushan Island, and the spatial variations in the natural factors led to the spatial heterogeneity of the environment [47,48,49]. In the coastal area of Zhoushan Island, due to strong human activities, a high GDP, and dense population, the VI was relatively low. In such an environment, the anthropologic factors, especially the high GDP and large population, had negative effects on the spatial distribution of the NDVI on Zhoushan Island.

5. Discussion

Based on Landsat long-term satellite images and the GEE cloud platform, in this study, NDVI distribution maps of Zhoushan Island from 1985 to 2022 were created, the spatiotemporal characteristics of the vegetation coverage on Zhoushan Island were analyzed, and the factors that affected the vegetation changes on Zhoushan Island were clarified.

5.1. Accuracy of the Results

In this study, it is based on the GEE cloud platform with high computing power and Landsat long-time high-quality satellite remote sensing images. A 30 m resolution NDVI distribution map of Zhoushan Island was drawn. The interannual average results show that the NDVI of Zhoushan Island showed a downward trend, reaching the lowest in 2005, and then showed an upward trend from 2005 to 2015. Combining the information released by the Zhejiang Provincial Bureau of Statistics and the Zhoushan Municipal People’s government, it was not difficult to find that, before 2005, Zhoushan vigorously developed the economy and carried out economic reforms but neglected the construction of ecological civilization. After 2005, the Zhoushan government issued a series of policies to accelerate ecological construction, strengthen ecological environmental protection, and promote changes in the quality of the ecological environment. Then, combined with Moran’s I, the General G index, etc., qualitative and quantitative analyses were conducted on the spatial aggregation degree of the NDVI on Zhoushan Island, the coverage and changes in vegetation were determined, and it was found that the NDVI values on Zhoushan Island showed obvious clustering of high values that were mostly distributed in the center of the island and that the possibility of such aggregation occurring randomly is less than 1%.
Combined with geodetector, we determined the influencing factors that affected the spatial pattern of the NDVI from the three aspects of climate, terrain, and human activities and detected the interactions between the influencing factors. The single factors that had a greater impact on spatial patterns were identified: DEM, slope, and temperature, and six groups of factors with significant differences in spatial pattern distribution, correlations, nonlinear relationships, and interactive effects in spatial data were detected [46,50,51,52].

5.2. Uncertainty of the Results

There will be certain uncertainties when using Landsat image data to draw NDVI distribution maps. In the process of calculating the NDVI on Zhoushan Island, some abnormal NDVI values were identified near the inland lakes. There may have been small algal blooms on the surfaces of the water bodies, which may have affected the accuracy of the NDVI. Therefore, this study first used the NDWI to identify the inland water bodies of Zhoushan Island and masked them to ensure the accuracy of the data as much as possible. In addition, considering the different resolutions of different remote sensing data, the calculated NDVI values were also different.

6. Conclusions

This study used remote sensing technology to study the vegetation coverage and influencing factors of Zhoushan Island. The main conclusions were as follows:
(1)
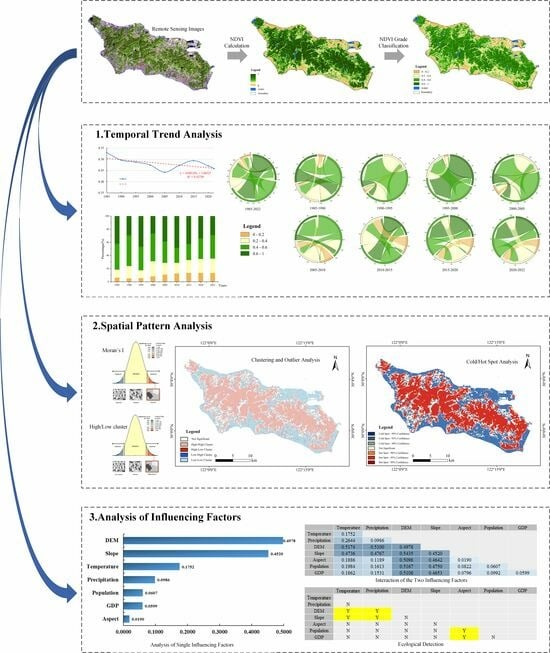
Based on the GEE cloud platform and Landsat long-term sequence images, a 30 m resolution NDVI spatiotemporal distribution map of Zhoushan Island in nine time phases from 1985 to 2022 was drawn.
(2)
The vegetation coverage on Zhoushan Island showed a sparse trend. The average NDVI value dropped from 0.53 in 1985 to 0.46 in 2022, the low vegetation area increased from 28.84 km2 in 1985 to 67.29 km2 in 2022, and the extremely high vegetation area decreased from 197.96 km2 in 1985 to 146.32 km2 in 2022.
(3)
There was an obvious spatial high value agglomeration phenomenon in the NDVI on Zhoushan Island. The low-low NDVI clusters and significant cold spots were mainly concentrated in the coastal area of Zhoushan Island, and the high-high NDVI clusters and significant hot spots were mainly concentrated in the inner area of the island.
(4)
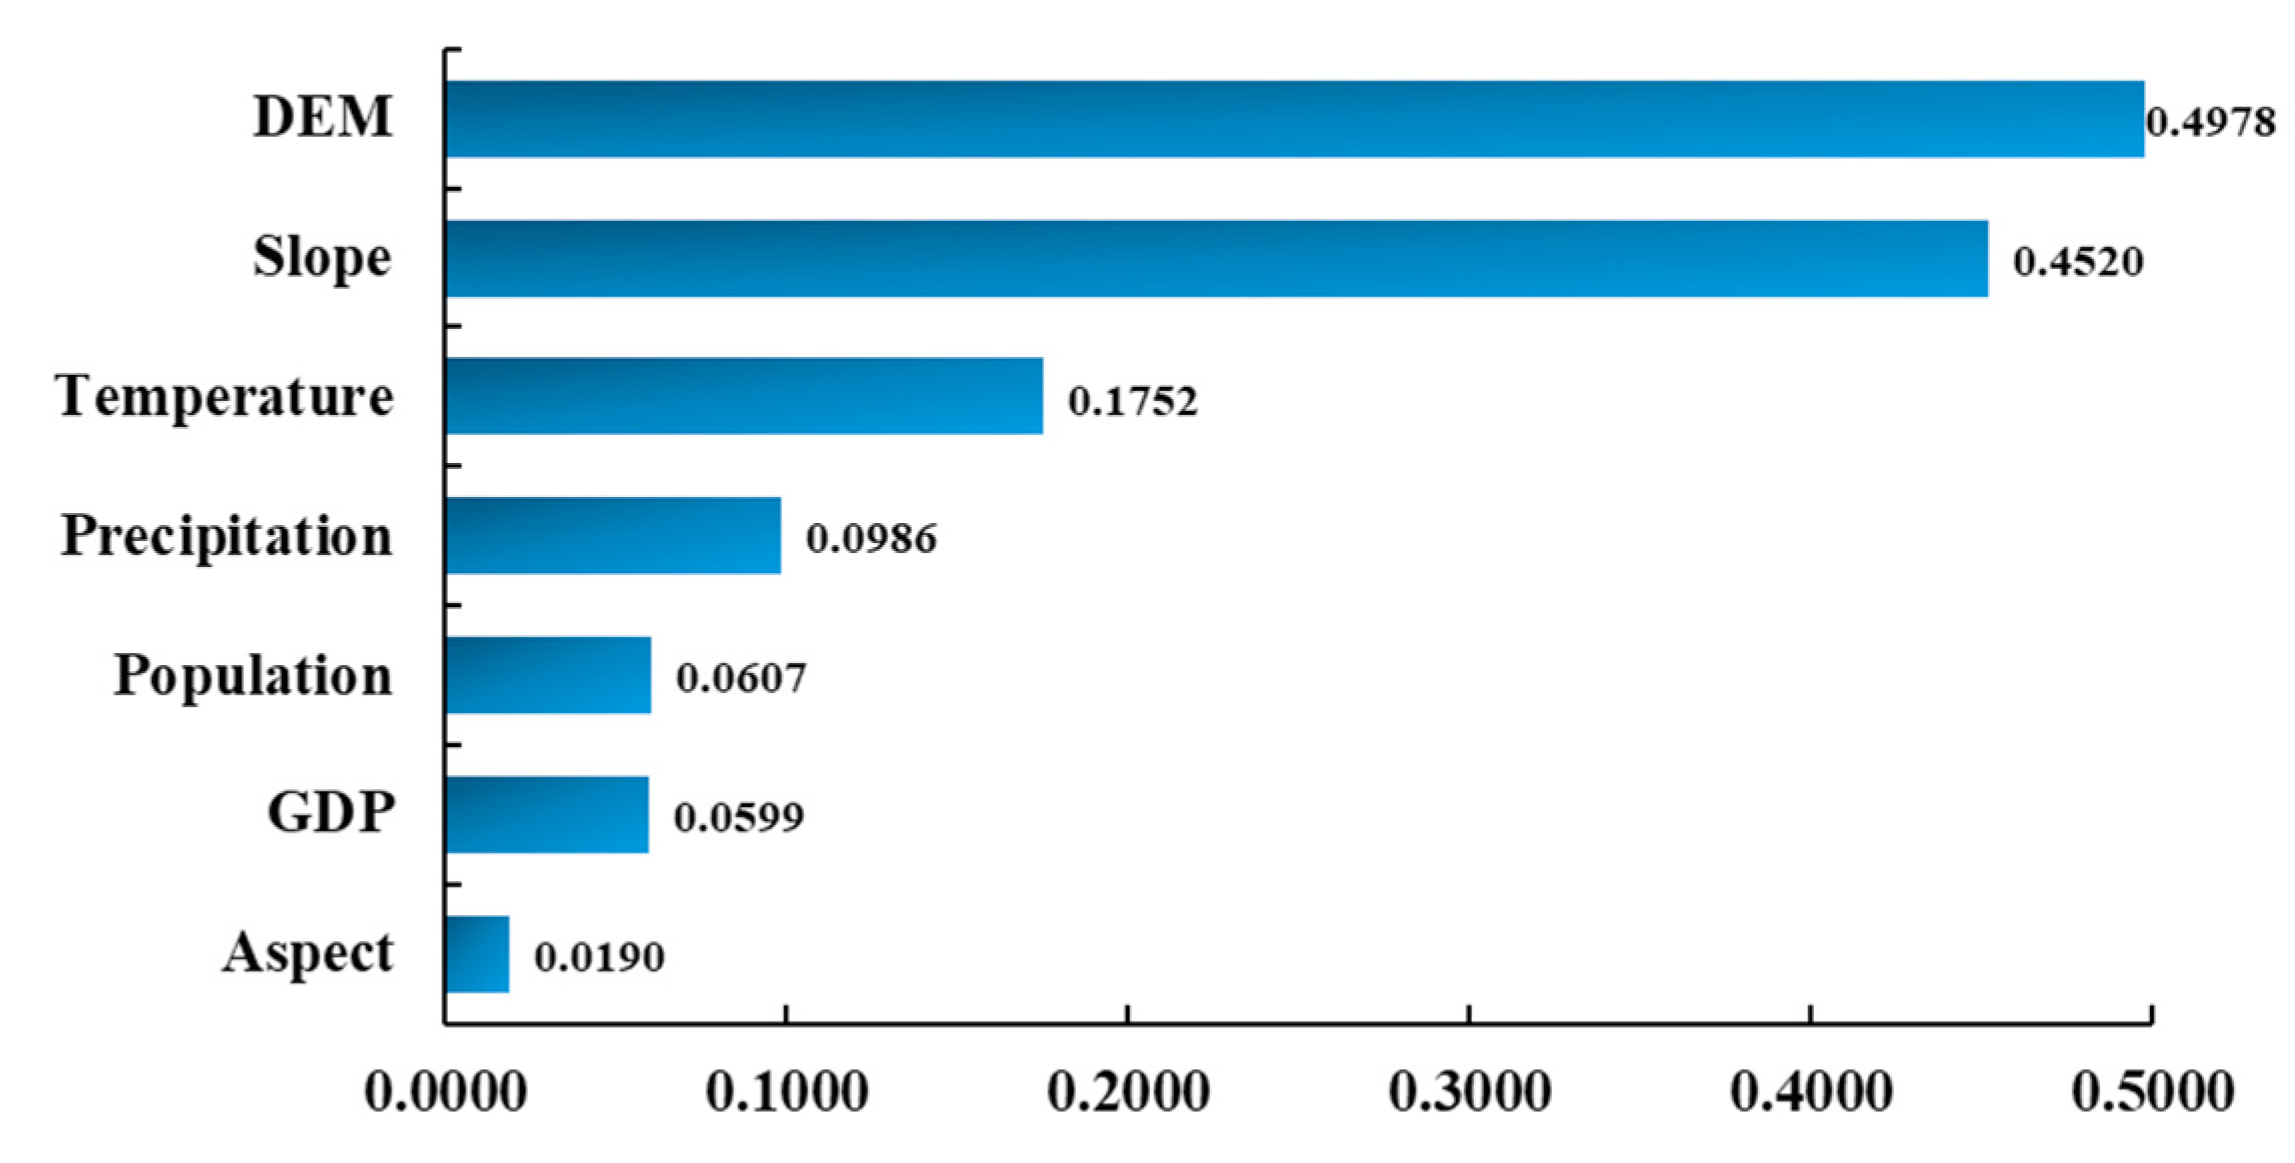
The analysis results combined with the geodetector showed that natural factors (e.g., DEM, slope, and temperature) played a positive role in the spatial distribution of the NDVI on Zhoushan Island, while the anthropologic factors (e.g., GDP and population) had a negative effect on the spatial distribution of the NDVI on Zhoushan Island.
Future works should include: (1) increasing the frequency of NDVI products to detect the characteristics of NDVI temporal and spatial evolution using a finer time scale and (2) deepening the analysis of the influencing factors to accurately detect the influencing factors of the temporal and spatial evolution of the NDVI from both natural and artificial perspectives.

Author Contributions

Conceptualization, Z.L., Y.C. and C.C.; methodology, Z.L. and C.C.; software, Z.L. and Y.C.; writing—original draft preparation, Y.C.; writing—review and editing, Z.L. and C.C.; project administration, Z.L.; and funding acquisition, C.C. All authors have read and agreed to the published version of the manuscript.

Funding

This work was funded by the National Natural Science Foundation of China (Grant No. 42171311) and the Training Program of Excellent Master Thesis of Zhejiang Ocean University.

Data Availability Statement

The data used in this paper are available from Google Earth Engine upon reasonable request, and the model, products, or codes generated in this paper are available from the corresponding author upon reasonable request.

Acknowledgments

The authors would like to thank the editors and the anonymous reviewers for their outstanding comments and suggestions, which greatly helped to improve the technical quality and presentation of this manuscript.

Conflicts of Interest

The authors declare no conflict of interest.

References

  1. Chen, C.; Wang, L.; Yang, G.; Sun, W.; Song, Y. Mapping of ecological environment based on Google earth engine cloud computing platform and landsat long-term data: A case study of the zhoushan archipelago. Remote Sens. 2023, 15, 4072. [Google Scholar] [CrossRef]
  2. Brinck, K.; Fischer, R.; Groeneveld, J.; Lehmann, S.; Dantas De Paula, M.; Putz, S.; Sexton, J.O.; Song, D.; Huth, A. High resolution analysis of tropical forest fragmentation and its impact on the global carbon cycle. Nat. Commun. 2017, 8, 14855. [Google Scholar] [CrossRef] [PubMed]
  3. Marchi, M.; Capezzuoli, F.; Fantozzi, P.L.; Maccanti, M.; Pulselli, R.M.; Pulselli, F.M.; Marchettini, N. GHG action zone identification at the local level: Emissions inventory and spatial distribution as methodologies for policies and plans. J. Clean. Prod. 2023, 386, 135783. [Google Scholar] [CrossRef]
  4. Duncanson, L.; Liang, M.; Leitold, V.; Armston, J.; Krishna Moorthy, S.M.; Dubayah, R.; Costedoat, S.; Enquist, B.J.; Fatoyinbo, L.; Goetz, S.J.; et al. The effectiveness of global protected areas for climate change mitigation. Nat. Commun. 2023, 14, 2908. [Google Scholar] [CrossRef] [PubMed]
  5. Chen, C.; Chen, Y.; Jin, H.; Chen, L.; Liu, Z.; Sun, H.; Hong, J.; Wang, H.; Fang, S.; Zhang, X. 3D Model Construction and Ecological Environment Investigation on a Regional Scale Using UAV Remote Sensing. Intell. Autom. Soft Comput. 2023, 37, 1655–1672. [Google Scholar] [CrossRef]
  6. Czyż, E.A.; Schmid, B.; Hueni, A.; Eppinga, M.B.; Schuman, M.C.; Schneider, F.D.; Guillén-Escribà, C.; Schaepman, M.E. Genetic constraints on temporal variation of airborne reflectance spectra and their uncertainties over a temperate forest. Remote Sens. Environ. 2023, 284, 113338. [Google Scholar] [CrossRef]
  7. Gorelick, N.; Hancher, M.; Dixon, M.; Ilyushchenko, S.; Thau, D.; Moore, R. Google Earth Engine: Planetary-scale geospatial analysis for everyone. Remote Sens. Environ. 2017, 202, 18–27. [Google Scholar] [CrossRef]
  8. Amani, M.; Ghorbanian, A.; Ahmadi, S.A.; Kakooei, M.; Moghimi, A.; Mirmazloumi, S.M.; Moghaddam, S.H.A.; Mahdavi, S.; Ghahremanloo, M.; Parsian, S. Google earth engine cloud computing platform for remote sensing big data applications: A comprehensive review. IEEE J. Sel. Top. Appl. Earth Obs. Remote Sens. 2020, 13, 5326–5350. [Google Scholar] [CrossRef]
  9. Tamiminia, H.; Salehi, B.; Mahdianpari, M.; Quackenbush, L.; Adeli, S.; Brisco, B. Google Earth Engine for geo-big data applications: A meta-analysis and systematic review. ISPRS J. Photogramm. Remote Sens. 2020, 164, 152–170. [Google Scholar] [CrossRef]
  10. Zeng, Y.; Hao, D.; Huete, A.; Dechant, B.; Berry, J.; Chen, J.M.; Joiner, J.; Frankenberg, C.; Bond-Lamberty, B.; Ryu, Y.; et al. Optical vegetation indices for monitoring terrestrial ecosystems globally. Nat. Rev. Earth Environ. 2022, 3, 477–493. [Google Scholar] [CrossRef]
  11. Villarroya-Carpio, A.; Lopez-Sanchez, J.M.; Engdahl, M.E. Sentinel-1 interferometric coherence as a vegetation index for agriculture. Remote Sens. Environ. 2022, 280, 113208. [Google Scholar] [CrossRef]
  12. Camps-Valls, G.; Campos-Taberner, M.; Moreno-Martínez, Á.; Walther, S.; Duveiller, G.; Cescatti, A.; Mahecha, M.D.; Muñoz-Marí, J.; García-Haro, F.J.; Guanter, L. A unified vegetation index for quantifying the terrestrial biosphere. Sci. Adv. 2021, 7, eabc7447. [Google Scholar] [CrossRef] [PubMed]
  13. Huang, S.; Tang, L.; Hupy, J.P.; Wang, Y.; Shao, G. A commentary review on the use of normalized difference vegetation index (NDVI) in the era of popular remote sensing. J. For. Res. 2021, 32, 1–6. [Google Scholar] [CrossRef]
  14. Zhang, C.; Ren, H.; Qin, Q.; Ersoy, O.K. A new narrow band vegetation index for characterizing the degree of vegetation stress due to copper: The copper stress vegetation index (CSVI). Remote Sens. Lett. 2017, 8, 576–585. [Google Scholar] [CrossRef]
  15. Higgins, S.I.; Conradi, T.; Muhoko, E. Shifts in vegetation activity of terrestrial ecosystems attributable to climate trends. Nat. Geosci. 2023, 16, 147–153. [Google Scholar] [CrossRef]
  16. Gao, L.; Wang, X.; Johnson, B.A.; Tian, Q.; Wang, Y.; Verrelst, J.; Mu, X.; Gu, X. Remote sensing algorithms for estimation of fractional vegetation cover using pure vegetation index values: A review. ISPRS J. Photogramm. Remote Sens. 2020, 159, 364–377. [Google Scholar] [CrossRef] [PubMed]
  17. Zhu, Y.; Yao, X.; Tian, Y.; Liu, X.; Cao, W. Analysis of common canopy vegetation indices for indicating leaf nitrogen accumulations in wheat and rice. Int. J. Appl. Earth Obs. Geoinf. 2008, 10, 1–10. [Google Scholar] [CrossRef]
  18. Qu, C.; Li, P.; Zhang, C. A spectral index for winter wheat mapping using multi-temporal Landsat NDVI data of key growth stages. ISPRS J. Photogramm. Remote Sens. 2021, 175, 431–447. [Google Scholar] [CrossRef]
  19. Garioud, A.; Valero, S.; Giordano, S.; Mallet, C. Recurrent-based regression of Sentinel time series for continuous vegetation monitoring. Remote Sens. Environ. 2021, 263, 112419. [Google Scholar] [CrossRef]
  20. Berger, K.; Machwitz, M.; Kycko, M.; Kefauver, S.C.; Van Wittenberghe, S.; Gerhards, M.; Verrelst, J.; Atzberger, C.; van der Tol, C.; Damm, A.; et al. Multi-sensor spectral synergies for crop stress detection and monitoring in the optical domain: A review. Remote Sens. Environ. 2022, 280, 113198. [Google Scholar] [CrossRef]
  21. Wang, Q.; Moreno-Martínez, Á.; Muñoz-Marí, J.; Campos-Taberner, M.; Camps-Valls, G. Estimation of vegetation traits with kernel NDVI. ISPRS J. Photogramm. Remote Sens. 2023, 195, 408–417. [Google Scholar] [CrossRef]
  22. Massetti, A.; Gil, A. Mapping and assessing land cover/land use and aboveground carbon stocks rapid changes in small oceanic islands’ terrestrial ecosystems: A case study of Madeira Island, Portugal (2009–2011). Remote Sens. Environ. 2020, 239, 111625. [Google Scholar] [CrossRef]
  23. Zeng, Y.; Chen, M.; Hao, D.; Damm, A.; Badgley, G.; Rascher, U.; Johnson, J.E.; Dechant, B.; Siegmann, B.; Ryu, Y.; et al. Combining near-infrared radiance of vegetation and fluorescence spectroscopy to detect effects of abiotic changes and stresses. Remote Sens. Environ. 2022, 270, 112856. [Google Scholar] [CrossRef]
  24. Song, Y.; Chen, B.; Ho, H.C.; Kwan, M.P.; Liu, D.; Wang, F.; Wang, J.; Cai, J.; Li, X.; Xu, Y.; et al. Observed inequality in urban greenspace exposure in China. Environ. Int. 2021, 156, 106778. [Google Scholar] [CrossRef] [PubMed]
  25. Wang, S.; Li, R.; Wu, Y.; Zhao, S. Vegetation dynamics and their response to hydrothermal conditions in Inner Mongolia, China. Glob. Ecol. Conserv. 2022, 34, e02034. [Google Scholar] [CrossRef]
  26. Lu, L.; Luo, J.; Xin, Y.; Duan, H.; Sun, Z.; Qiu, Y.; Xiao, Q. How can UAV contribute in satellite-based Phragmites australis aboveground biomass estimating? Int. J. Appl. Earth Obs. Geoinf. 2022, 114, 103024. [Google Scholar] [CrossRef]
  27. Zhang, H.; Chang, J.; Zhang, L.; Wang, Y.; Li, Y.; Wang, X. NDVI dynamic changes and their relationship with meteorological factors and soil moisture. Environ. Earth Sci. 2018, 77, 1–11. [Google Scholar] [CrossRef]
  28. Chen, C.; Fu, J.; Zhang, S.; Zhao, X. Coastline information extraction based on the tasseled cap transformation of Landsat-8 OLI images. Estuar. Coast. Shelf Sci. 2019, 217, 281–291. [Google Scholar] [CrossRef]
  29. Sun, W.; Chen, C.; Liu, W.; Yang, G.; Meng, X.; Wang, L.; Ren, K. Coastline extraction using remote sensing: A review. GISci. Remote Sens. 2023, 60, 2243671. [Google Scholar] [CrossRef]
  30. Zhang, H.; Guo, J.; Li, X.; Liu, Y.; Wang, T. Spatiotemporal Variation in and Responses of the NDVI to Climate in Western Ordos and Eastern Alxa. Sustainability 2023, 15, 4375. [Google Scholar] [CrossRef]
  31. Zhao, C.; Jia, M.; Wang, Z.; Mao, D.; Wang, Y. Toward a better understanding of coastal salt marsh mapping: A case from China using dual-temporal images. Remote Sens. Environ. 2023, 295, 113664. [Google Scholar] [CrossRef]
  32. Gong, H.; Cheng, Q.; Jin, H.; Ren, Y. Effects of temporal, spatial, and elevational variation in bioclimatic indices on the NDVI of different vegetation types in Southwest China. Ecol. Indic. 2023, 154, 110499. [Google Scholar] [CrossRef]
  33. Fu, H.; Sun, G.; Zhang, L.; Zhang, A.; Ren, J.; Jia, X.; Li, F. Three-dimensional singular spectrum analysis for precise land cover classification from UAV-borne hyperspectral benchmark datasets. ISPRS J. Photogramm. Remote Sens. 2023, 203, 115–134. [Google Scholar] [CrossRef]
  34. Wei, Z.; Jiao, X.; Du, Y.; Zhang, J.; Pan, H.; Wang, G.; Wang, D.; Wang, Y.P. The temporal variations in principal and shallow-water tidal constituents and their application in tidal level calculation: An example in Zhoushan Archipelagoes with complex bathymetry. Ocean Coast. Manag. 2023, 237, 106516. [Google Scholar] [CrossRef]
  35. Wulder, M.A.; Roy, D.P.; Radeloff, V.C.; Loveland, T.R.; Anderson, M.C.; Johnson, D.M.; Healey, S.; Zhu, Z.; Scambos, T.A.; Pahlevan, N.; et al. Fifty years of Landsat science and impacts. Remote Sens. Environ. 2022, 280, 113195. [Google Scholar] [CrossRef]
  36. Tulbure, M.G.; Broich, M.; Perin, V.; Gaines, M.; Ju, J.; Stehman, S.V.; Pavelsky, T.; Masek, J.G.; Yin, S.; Mai, J.; et al. Can we detect more ephemeral floods with higher density harmonized Landsat Sentinel 2 data compared to Landsat 8 alone? ISPRS J. Photogramm. Remote Sens. 2022, 185, 232–246. [Google Scholar] [CrossRef]
  37. Yang, X.; Qiu, S.; Zhu, Z.; Rittenhouse, C.; Riordan, D.; Cullerton, M. Mapping understory plant communities in deciduous forests from Sentinel-2 time series. Remote Sens. Environ. 2023, 293, 113601. [Google Scholar] [CrossRef]
  38. Wang, M.; Mao, D.; Xiao, X.; Song, K.; Jia, M.; Ren, C.; Wang, Z. Interannual changes of coastal aquaculture ponds in China at 10-m spatial resolution during 2016–2021. Remote Sens. Environ. 2023, 284, 113347. [Google Scholar] [CrossRef]
  39. Chen, C.; Liang, J.; Xie, F.; Hu, Z.; Sun, W.; Yang, G.; Yu, J.; Chen, L.; Wang, L.; Zhang, Z.; et al. Temporal and spatial variation of coastline using remote sensing images for Zhoushan archipelago, China. Int. J. Appl. Earth Obs. Geoinf. 2022, 107, 102711. [Google Scholar] [CrossRef]
  40. Liang, J.; Chen, C.; Song, Y.; Sun, W.; Yang, G. Long-term mapping of land use and cover changes using Landsat images on the Google Earth Engine Cloud Platform in bay area—A case study of Hangzhou Bay, China. Sustain. Horiz. 2023, 7, 100061. [Google Scholar] [CrossRef]
  41. Zhu, L.; Meng, J.; Zhu, L. Applying Geodetector to disentangle the contributions of natural and anthropogenic factors to NDVI variations in the middle reaches of the Heihe River Basin. Ecol. Indic. 2020, 117, 106545. [Google Scholar] [CrossRef]
  42. Wang, L.; Yu, D.; Liu, Z.; Yang, Y.; Zhang, J.; Han, J.; Mao, Z.; Li, S. Study on NDVI changes in Weihe Watershed based on CA-Markov model. Geol. J. 2018, 53, 435–441. [Google Scholar] [CrossRef]
  43. Bhatti, U.A.; Marjan, S.; Wahid, A.; Syam, M.S.; Huang, M.; Tang, H.; Hasnain, A. The effects of socioeconomic factors on particulate matter concentration in China’s: New evidence from spatial econometric model. J. Clean. Prod. 2023, 417, 137969. [Google Scholar] [CrossRef]
  44. Song, Y. The second dimension of spatial association. Int. J. Appl. Earth Obs. Geoinf. 2022, 111, 102834. [Google Scholar] [CrossRef]
  45. Ferrari, G.; Ai, P.; Alengebawy, A.; Marinello, F.; Pezzuolo, A. An assessment of nitrogen loading and biogas production from Italian livestock: A multilevel and spatial analysis. J. Clean. Prod. 2021, 317, 128388. [Google Scholar] [CrossRef]
  46. Wang, J.; Zhang, T.; Fu, B. A measure of spatial stratified heterogeneity. Ecol. Indic. 2016, 67, 250–256. [Google Scholar] [CrossRef]
  47. Fang, L.; Wang, L.; Chen, W.; Sun, J.; Cao, Q.; Wang, S.; Wang, L. Identifying the impacts of natural and human factors on ecosystem service in the Yangtze and Yellow River Basins. J. Clean. Prod. 2021, 314, 127995. [Google Scholar] [CrossRef]
  48. Jia, M.; Wang, Z.; Mao, D.; Ren, C.; Song, K.; Zhao, C.; Wang, C.; Xiao, X.; Wang, Y. Mapping global distribution of mangrove forests at 10-m resolution. Sci. Bull. 2023. early access. [Google Scholar] [CrossRef]
  49. Yasir, M.; Jianhua, W.; Shanwei, L.; Sheng, H.; Mingming, X.; Hssain, M. Coupling of deep learning and remote sensing: A comprehensive systematic literature review. Int. J. Remote Sens. 2023, 44, 157–193. [Google Scholar] [CrossRef]
  50. Song, Y.; Wang, J.; Ge, Y.; Xu, C. An optimal parameters-based geographical detector model enhances geographic characteristics of explanatory variables for spatial heterogeneity analysis: Cases with different types of spatial data. GISci. Remote Sens. 2020, 57, 593–610. [Google Scholar] [CrossRef]
  51. Chen, C.; Liang, J.; Yang, G.; Sun, W. Spatio-temporal distribution of harmful algal blooms and their correlations with marine hydrological elements in offshore areas, China. Ocean Coast. Manag. 2023, 238, 106554. [Google Scholar] [CrossRef]
  52. Sun, G.; Pan, Z.; Zhang, A.; Jia, X.; Ren, J.; Fu, H.; Yan, K. Large kernel spectral and spatial attention networks for hyperspectral image classification. IEEE Trans. Geosci. Remote Sens. 2023. early access. [Google Scholar] [CrossRef]
Figure 1. Map of the study area; the remote sensing image is the combined result of the sixth, fifth, and fourth bands of Landsat 8.
Remotesensing 15 04980 g001
Figure 2. Flowchart of the analysis of the spatiotemporal pattern and influencing factors of Zhoushan Island.
Remotesensing 15 04980 g002
Figure 3. Spatiotemporal distribution maps of the NDVI on Zhoushan Island from 1985 to 2022.
Remotesensing 15 04980 g003
Figure 4. NDVI grading maps of Zhoushan Island from 1985 to 2022.
Remotesensing 15 04980 g004
Figure 5. Cumulative area proportion chart of different classes from 1985 to 2022.
Remotesensing 15 04980 g005
Figure 6. Trend of the average NDVI from 1985 to 2022.
Remotesensing 15 04980 g006
Figure 7. Chord diagram of the NDVI grade transfer on Zhoushan Island from 1985 to 2022.
Remotesensing 15 04980 g007
Figure 8. Moran’s I analysis chart.
Remotesensing 15 04980 g008
Figure 9. High/low cluster analysis results.
Remotesensing 15 04980 g009
Figure 10. Clustering and outlier analysis results.
Remotesensing 15 04980 g010
Figure 11. Cold/hot spot analysis results.
Remotesensing 15 04980 g011
Figure 12. q-value statistics of a single influencing factor.
Remotesensing 15 04980 g012
Table 1. Landsat satellite remote sensing data were used in this study.
DatasetSatelliteSensorResolutionYears
LANDSAT/LC08/C02/T1_L2Landsat 8Operational Land Imager30 m2022
LANDSAT/LC08/C01/T1_SRLandsat 8Operational Land Imager30 m2015, 2020
LANDSAT/LT05/C01/T1_SRLandsat 5Thematic Mapper30 m1985, 1990, 1995, 2000, 2005, 2010
Table 2. Datasets used in this study.
CategoryDataDatasetData SourcesYears
Topographical FactorsDEMNASA/NASADEM_HGT/001NASA JPL2020
SlopeNASA/NASADEM_HGT/001NASA JPL2020
AspectNASA/NASADEM_HGT/001NASA JPL2020
Climatic FactorsTemperatureMODIS/006/MOD11A1NASA2015
PrecipitationUCSB-CHG/CHIRPS/DAILYUCSD2015
Anthropogenic FactorsPopulationWorldPop/GP/100m/pop/CHN_2015https://www.worldpop.org (15 May 2023)2015
GDPKilometer grid dataset of China’s historical GDP spatial distributionNational Tibetan Plateau Data Center2015
Table 3. Areas of different NDVI grades (km2).
Low Vegetation Area (0–0.2)Medium Vegetation Area (0.2–0.4)High Vegetation Area (0.4–0.6)Extremely High Vegetation Area (0.6–1)
198528.8457.57185.32197.96
199023.8986.92218.63137.48
199526.1355.61168.20219.81
200038.07108.32199.13124.74
200551.1983.35152.54181.56
201060.8578.94112.16234.27
201567.7796.42122.02210.66
202067.74107.20157.38170.17
202267.29110.69180.78146.32
Table 4. Mean NDVI values in different years.
Years198519901995200020052010201520202022
Mean NDVI value0.530.500.490.470.440.470.490.470.46
Table 5. NDVI classification transfer matrix (km2) from 1985 to 2022.
2022Low Vegetation Area (0–0.2)Medium Vegetation Area (0.2–0.4)High Vegetation Area (0.4–0.6)Extremely High Vegetation Area (0.6–1)
1985
Low vegetation area (0–0.2)14.389.693.000.21
Medium vegetation area (0.2–0.4)9.1920.0519.647.91
High vegetation area (0.4–0.6)18.0856.9971.7936.90
Extremely high vegetation area (0.4–0.6)3.5010.1083.10101.17
Table 6. Moran’s I analysis.
Moran’s I IndexExpectation IndexVariancez-Valuep-Value
0.6302−0.07140.02634.32700.0000
Table 7. High/low cluster analysis.
General G ObservationGeneral G ExpectationVariancez-Valuep-Value
0.00330.00170.00003.94620.0001
Table 8. Ecological detection results.
TemperaturePrecipitationDEMSlopeAspectPopulationGDP
Temperature
PrecipitationN
DEMYY
SlopeYYN
AspectNNNN
PopulationNNNNY
GDPNNNNYN
Table 9. q-value statistics after the interaction of the two influencing factors.
TemperaturePrecipitationDEMSlopeAspectPopulationGDP
Temperature0.1752 Remotesensing 15 04980 i001
Precipitation0.26440.0986
DEM0.51740.51000.4978
Slope0.47360.47670.54350.4520
Aspect0.18860.11890.50980.46420.0190
Population0.19840.16130.51670.47500.08220.0607
GDP0.18620.15310.51080.46530.07960.09920.0599
Disclaimer/Publisher’s Note: The statements, opinions and data contained in all publications are solely those of the individual author(s) and contributor(s) and not of MDPI and/or the editor(s). MDPI and/or the editor(s) disclaim responsibility for any injury to people or property resulting from any ideas, methods, instructions or products referred to in the content.

