Review

Contribution of Photogrammetry for Geometric Quality Assessment of Satellite Data for Global Climate Monitoring

by
Sultan Kocaman
1 and
Gabriela Seiz
2,*
1
Department of Geomatics Engineering, Hacettepe University, Beytepe, Ankara 06800, Turkey
2
Seiz SG Advisory, Europaallee 41, 8004 Zurich, Switzerland
*
Author to whom correspondence should be addressed.
Remote Sens. 2023, 15(18), 4575; https://doi.org/10.3390/rs15184575
Submission received: 31 July 2023 / Revised: 6 September 2023 / Accepted: 15 September 2023 / Published: 17 September 2023

Abstract

:
This article reviews the role that photogrammetry plays in evaluating the geometric quality of satellite products in connection to the long-term monitoring of essential climate variables (ECVs). The Global Climate Observing System (GCOS) is responsible for defining the observations required for climate monitoring. Only satellite products are capable of providing high-quality observations of a particular subset of ECVs on a global scale. Geometric calibration and validation of these products are crucial for ensuring the coherence of data obtained across platforms and sensors and reliable monitoring in the long term. Here, we analyzed the GCOS implementation plan and the data quality requirements and explored various geometric quality aspects, such as internal and external accuracy and band-to-band registration assessment, for a number of satellite sensors commonly used for climate monitoring. Both geostationary (GEO) and low-earth orbit (LEO) sensors with resolutions between 250 m and 3 km were evaluated for this purpose. The article highlights that the geometric quality issues vary with the sensor, and regular monitoring of data quality and tuning of calibration parameters are essential for identifying and reducing the uncertainty in the derived climate observations.

1. Introduction

Systematic climate observations are an essential driver of progress in our understanding of climate change [1]. It is clear that “what we do not observe we cannot understand, and what we cannot understand we cannot predict, adapt to and mitigate” [2]. The 1992-founded Global Climate Observing System (GCOS) has the mandate that the observations required to address climate-related challenges are identified, acquired, and provided to potential users [3].
The entire climate system, i.e., the atmospheric, oceanic, and terrestrial domains, is covered by GCOS with a set of so-called Essential Climate Variables (ECVs), which relies on a wide range of observing systems, both in-situ and from space [2]. Satellite observations play a crucial role within GCOS to observe the climate system from an almost global perspective and to monitor the state and development of ECVs around the world [2,4,5,6,7,8,9]. An extensive set of climate variables, such as, for example, cloud cover, sea-surface temperature, or land cover, can only be reasonably measured globally from space.
To understand the climate system and its changes, we rely on high-quality observations. The importance of high-quality observations has been addressed by GCOS at a very early stage [4] and has been repeatedly underlined in subsequent implementation plans [2,10,11]. The quality aspects of satellite-based products include radiometry and geometry. Thereby, the emphasis has often been placed on radiometric accuracy, while geometric accuracy has received comparatively less consideration [12]. Photogrammetry (and its methods and tools) offer many possible contributions to meteorology, both for weather and climate [13,14], and photogrammetric techniques are optimally suited to assess the geometric quality of satellite-based data [15], which are then the basis for further retrieval of ECV products. Potential geometrical errors have an impact on the subsequent extraction of geometrical and thematic data from satellite imagery. On the retrieval of thematic information, even geometric inaccuracies at small magnitudes might have a big impact [16].
In this context, this article reviewed the geometric uncertainty sources of widely used Earth Observation (EO) satellites and the contribution of photogrammetric techniques to their assessment and eventual improvement. A subset of EO sensors has been selected for in-depth analysis, covering both geostationary (GEO) and low earth orbit (LEO) sensors with resolutions between 250 m and 3 km. The selected sensors include the Spinning Enhanced Visible and InfraRed Imager (SEVIRI) aboard Meteosat Second Generation (MSG), the Advanced Very High-Resolution Radiometer (AVHRR) aboard MetOp satellites, the Moderate Resolution Imaging Spectroradiometer (MODIS) aboard Aqua and Terra, and the Sea and Land Surface Temperature Radiometer (SLSTR) and the Ocean and Land Color Instrument (OLCI) sensors aboard Sentinel-3. The sensors allow the monitoring of various ECVs in the atmospheric, oceanic, and terrestrial domains, such as aerosols, cloud properties, ocean color, fire, etc.
Thus, this article is organized to provide an overview of GCOS for long-term monitoring of ECVs (Section 2), a description of the geometric quality of satellite products, and a review of the photogrammetric techniques to process and assess their geometric quality (Geometric Quality Assessment—GQA) (Section 3). Section 4 addresses the conclusions of this work and future directions in the field.

2. Long-Term Monitoring of ECVs within GCOS

GCOS was established in 1992 and is co-sponsored by the World Meteorological Organization (WMO), the Intergovernmental Oceanographic Commission of the United Nations Educational, Scientific, and Cultural Organization (IOC-UNESCO), the United Nations Environment Program (UNEP), and the International Science Council (ISC). The GCOS Implementation Plan [2,4,10,11] outlines a practical and affordable path toward a combined observing system that relies on both ground-based and satellite-based measurements. It also establishes the GCOS Climate Monitoring Principles (GCMPs), which offer fundamental guidelines for the planning, operation, and management of observing networks and systems. The GCOS Climate Monitoring Principles (GCMPs) define a set of ECVs covering the entire climate system, subdivided into the atmospheric, oceanic, and terrestrial domains. The recently revised 2022 GCOS Implementation Plan [2] (and its 2022 ECVs Requirements addendum [17]) provides an update on the originally defined actions and considers the recent developments in sensors and observations with a stronger emphasis on adaptation, increased attempts to maximize mitigation measures, and the requirement for better climate change projections.
In order to compare the state and evolution of ECVs in various regions of the world and to obtain observations of the climate system from a near-global viewpoint, satellite observations are crucial. Therefore, a significant satellite component of GCOS is essential for a comprehensive global climate record in the future. The so-called “Satellite Supplement” of the 2004 GCOS Implementation Plan [18] precisely outlines the systematic observation criteria for satellite-based products for climate. The GCMPs have thereby been extended by ten additional satellite-specific principles, recognizing the essentiality and challenges of space-based observations for climate monitoring. The space agencies responded to the GCOS Satellite Supplement for the first time in 2006 through the Committee on Earth Observation Satellites (CEOS) [5]. Since then, progress reports have been regularly submitted by CEOS, and subsequently by CEOS and the Coordination Group for Meteorological Satellites CGMS (“Joint CEOS/CGMS Working Group on Climate”), on behalf of the Space Agencies to the UNFCCC [9], and in line with the Strategy Towards an Architecture for Climate Monitoring from Space [8].
The latest Space Agency Response to the (2016) GCOS Implementation Plan [9] reassessed climate monitoring from space and characterized more than 900 climate data records (CDRs) to which satellite data can contribute. The report also strongly emphasized the requirement of in situ reference measurements to validate the accuracy and reliability of CDR products, the integration of cross-sensor observations, and understanding the CDR uncertainty levels in space and time. A new Space Agency Response to the GCOS Implementation Plan is planned to be released by the end of 2023.

3. Geometric Quality Assessment (GQA) of ECVs Using Photogrammetry

The GQA of the products of EO satellite sensors is essential for assessing system performance and predicting product quality [19]. Continuous monitoring and data quality reporting are among the main tasks of satellite operators, and users essentially need such reports as the quality affects the products directly. In addition, the GQA activities are crucial for the integration of satellite data and their derived products, including ECVs, considering inter-sensor, multi-temporal, and multi-resolution measurements. Furthermore, differences between spectral band definitions across sensors and interband registration errors between the bands of the same sensor must also be addressed. Recent studies on the GQA of both GEO and LEO sensor data have shown that the systematic errors and their magnitudes depend on the sensor design and may vary over time [19,20,21,22,23,24,25,26,27,28,29,30]. Thanks to the precise measurement methods within the domain of photogrammetry, the errors can be detected with a precision of up to 1/20 pixels [31,32]. In Table 1, we provide a list of sensors explained in Section 3.2 and data characteristics investigated in some of the reviewed studies.

3.1. A Review of ECVs Observed with Satellite Products

An ECV is a physical, chemical, or biological variable (or set of related variables) that makes a significant contribution to the description of the climate on Earth [17]. ECV products characterize the variables by providing measures with pre-defined spatial (2D or 3D) and temporal (e.g., hourly, daily, or annual) resolutions, measurement uncertainty (given in units of 2 standard deviations unless stated otherwise), stability (per decade), and timeliness (expected frequency of accessibility and availability) [17]. For this purpose, the GCOS Implementation Plan identified the Goal (G: ideal), Breakthrough (B: intermediate level), and Threshold (T: minimum requirement) values for ensuring data usability. The Space Agency Response to the GCOS Implementation Plan (2018), presented by the Joint CEOS/CGMS Working Group on Climate (WGClimate) and the WMO, has characterized over 900 Climate Data Records (CDRs) that directly respond to the GCOS ECV requirements. In Table 2, we present a selection of exemplary ECV products (i.e., one example ECV by domain) derived from satellites with their measures (extracted from [17]) to illustrate the ECV requirements in order to assess the usability of different sensors for this purpose. The full list of the 2022 GCOS ECV requirements for all ECVs is described in detail in [17].
Saunders and the ESA-CCI Climate Modeling User Group [33] have also presented satellite-based ECV products and emphasized the importance of consistency across ECVs to be able to monitor and attribute them, assess their impacts, and predict future changes. The selected sensors, which are discussed under different GQA aspects in Section 3 (see also Table 1), have capabilities to measure the three exemplary ECVs described in Table 2 as well as further ECVs (see [33]). The capabilities thereby may be at different degrees and vary over time depending on novel processing methods and updates in the sensors and their data products. In addition, there are a number of further sensors worldwide today (beyond the ones mentioned in [33] and the selected sensors for the GQA analysis) that have the capability to measure ECVs.

3.2. GQA of Satellite Sensors (in Particular Those Related to ECVs)

In this section, various GQA aspects such as absolute and relative accuracy, pointing accuracy, etc. are briefly explained. Examples of the geometry and image quality issues of a number of satellites widely used for ECV monitoring are provided, and the use of photogrammetry for their GQA is elaborated.

3.2.1. Various GQA Aspects and Measures

The GQA tasks mainly include absolute, relative (including multi-temporal), and interband registration assessments. Gruen and Kocaman [15] addressed the different geometric assessment types for high-resolution satellite images, such as:
  • Absolute and relative geometric accuracy;
  • Image inner geometry;
  • Pointing accuracy and variations in it along the orbit;
  • Band-to-band (interband) registration accuracy;
  • Stereoscopic capability.
In this article, we omit the latter one and focus on the first four aspects. The absolute accuracy of an image or a product is to be determined with respect to external references of superior quality. The relative accuracy also evaluates the quality w.r.t. a reference, but the reference does not necessarily need to be an external one; it can be of the same type and may have comparable quality. Multi-temporal accuracy assessments between the products of the same sensor (e.g., long-term stability analysis) or comparisons between variables with indifferent quality can be considered relative accuracy assessments.
When compared to absolute and relative accuracy, the assessment of image inner geometry by operators has been carried out less frequently. One reason for this situation may be the availability of reference data, as it essentially requires per-pixel information. Although the systematic errors that affect the inner geometry (local coherence) can be measured or functionally modeled, such as with laboratory or field-based calibration of cameras, the errors may increase over time during the operational phase of a satellite. Thus, the uncertainty increases and the model quality degrades. As a result, image inner geometric and multi-temporal accuracy may deteriorate if the sensor is not calibrated at regular intervals. Furthermore, other actively working instruments on the satellite platform and moving components of the sensor itself, such as steering mirrors, satellite micro-vibrations, and fluctuations in platform velocity, can all have an impact on the satellite’s location and attitude dynamically [15].
Pointing accuracy refers to good location knowledge of a target and is typically indicated by the ratio of a pixel, GSD, or instantaneous field of view (IFOV) in degrees. A spacecraft’s ability to point precisely depends on its ability to maintain attitude stability through appropriate attitude sensing and control methods (such systems may include vibration control, the elimination of alignment errors caused by thermal distortions, etc.) [15]. Although the quality of satellite products derived from raw imagery is affected by this measure, their accuracy may be different (better or worse) depending on the processing methods and reference data used as ancillary information. Although the pointing accuracy does not have inter-sensor implications, the value varies with the acquisition conditions and over time. Radiometric problems may also affect the pointing accuracy by deteriorating the image quality and, consequently, the image measurement precision. The variations in pointing accuracy along the orbit are also associated with the sensor mechanical components, deviations in sensor-object distances, and the availability and quality of ancillary data, if any dependence exists.
Considering the pointing accuracy, which also influences the image quality, the General Image-Quality Equation (GIQE) can be taken as the base attribute. As defined by Leachtenauer et al. [34], the three main ones are scale represented in GSD, sharpness assessed from the Modulation Transfer Function (MTF), and noise level as evaluated by the Signal-to-Noise Ratio (SNR). As part of MTF analysis, Point Spread Function (PSF), Line Spread Function (LSF), Edge Spread Function (ESF), and Relative Edge Response (RER) are used to interpret the image sharpness [35]. On the other hand, six factors were taken into account by Valenzuela and Reyes [36]: the GSD, the Rayleigh diffraction limit, the ground spot size, the modified Rayleigh resolution criterion, the Sparrow limit, and the Full-Width at Half Maximum (FWHM) of the PSF/LSF for the GQA of sensors, systems, and products.
The band-to-band registration (also referred to as interband) accuracy estimates the geometric coherence of different spectral channels of a sensor. Depending on the sensor’s geometric and spectral specifications, the task can be challenging. The interband registration correction can be carried out by using a bias model in planimetry or a more complex mathematical model such as polynomials, followed by a resampling interpolation. Undermodeling of systematic errors in geometry would yield poor registration of bands, which affects the derived products as a consequence. Although the interband registration problem can be solved precisely with camera calibration procedures, in-orbit registration with actual data or over calibration test fields may be difficult due to different spatial resolutions and dissimilar top of atmosphere (TOA) radiance measurements of the bands.
The absolute, relative, interband, and image local coherence (inner geometry) geometric accuracy is often assessed based on point coordinate comparisons. The points can be referred to as ground control, check, tie, feature, conjugate, or keypoints, and their coordinates are determined in 2-dimensional (2D) or 3D reference systems. The origins, axes, and dimensions of the reference systems can be defined according to the sensor, the earth, or the image itself. Based on the image measurements, the ground coordinates may be obtained through georeferencing algorithms. The outcomes of the comparisons are often a set of coordinate discrepancy (or residual) values, which are then used for computing well-known statistical measures such as root mean square error (RMSE), mean, median, minimum and maximum discrepancy values, and the standard deviation of the set. The standard deviation denotes an internal quality check (also relative accuracy), whereas the RMSE calculated from check points is an explicit measure of absolute accuracy. It must be noted that empirical standard deviations can also be computed from the mean of the residuals and the RMSE values [15].
The term ground control points (GCPs) implies known earth-referenced coordinates, whereas their use could be both as control (for model parameter estimation or learning) and check (testing) points in practice. The means and variances of the adjusted ground point coordinates can also be utilized as theoretical accuracy measures in a bundle block adjustment procedure, as stated by Gruen [37]. The tie, feature, conjugate, or keypoints indicate points with image coordinates, which are in principle measured in multiple images. When the images are already georeferenced, such as orthoimages or image stereopairs with known interior and exterior orientation parameters, the image coordinates of such points can be transformed to earth coordinates by using the respective mathematical model. However, the accuracy of the ground coordinates would be influenced by the image orientation quality.

3.2.2. MSG SEVIRI

The SEVIRI sensors aboard the geostationary MSG satellites are capable of observing a large portion of the globe with a very high temporal frequency (5–15 min) from a total of 12 spectral bands [38] at 1 km and 3 km resolutions. The first Meteosat Third Generation (MTG) imaging satellite (MTG-I1) was successfully placed in its orbit by the end of 2022 and is able to deliver full disc/rapid scan data at 10 min/2.5 min frequency from 16 spectral bands and 500 m–2 km resolutions [38]. Several ECVs in the atmospheric, oceanic, and terrestrial domains can be reliably observed from SEVIRI, such as sea [39], air [40], and land surface temperature [41,42], vegetation [43], soil moisture detection [44], and surface emissivity and temperature [45,46], etc.
Operated by EUMETSAT, the SEVIRI products are routinely assessed by the operator for absolute, relative, and band-to-band registration accuracy. A landmark matching approach based on the Normalized Cross Correlation (NCC) has been used for the GQA of SEVIRI images by EUMETSAT. Due to the low spatial resolution, the landmark points were selected from shorelines with a total count of a few hundred, and analysis of the image quality in the inlands was not possible. Band-to-band registration accuracy issues with SEVIRI were also detected by Nain and Mueller [47]. Thus, EUMETSAT initiated the GQA Tool Study in order to increase the accuracy, density, and reliability of the existing methodology [19,25] for Level 1 products. The algorithm developed in the study was based on the area-based least squares matching (LSM) method for extracting prominent image features (keypoints) with goodFeatureToTrack [48] and matching using the Kanade–Lucas–Tomasi (KLT) optical tracking approach [49,50] with a Python and OpenCV implementation. A statistical outlier elimination methodology has also been implemented to increase matching robustness. The method was previously developed for the relative and interband registration accuracy assessment of SEVIRI images [12,29,30] and evaluated for the AVHRR aboard MetOp [16,27,28] and MODIS [20] as well. These studies employed a lake matching approach for the absolute quality assessment as the study area extent covered Switzerland and its surroundings due to the collaborative project requirements defined by the Swiss GCOS Office and ETH Zurich.
As proposed by [32] and stated by [31], the LSM can provide an accuracy of up to 0.01 to 0.02 pixels in laboratory tests with signalized points. Within the GQA Tool study, the absolute accuracy assessment approach was newly developed by using global image mosaics with superior spatial resolution and georeferencing accuracy as reference data. For this purpose, the usability of Landsat 5-7-8, MERIS aboard ESA Envisat-1, OLCI, and Sentinel-2 has been investigated [26]. The main advantages of using global image mosaics as a reference can be listed as data availability over different years, seasons, or event months, adaptability across different spectral bands, and the possibility of updating the reference data whenever needed. In addition, greater geographical coverage can also be provided when compared with the landmark approach. On the other hand, the quality of the reference data must also be carefully inspected [19]. As demonstrated by [26], the reference mosaics may occasionally suffer from various geometric and radiometric errors, such as geometric problems over shorelines possibly sourced from post-processing (MERIS RGB mosaic), jpeg artifacts, and poor contrast in bright regions (Sentinel-2 cloudless), and radiometric non-uniformity between orthoimages of Landsat 7 and 8 (see Figure 1). In addition, striping in different bands also has an influence on the GQA of satellite data and may be observed in some cases, as can be seen in Figure 1.
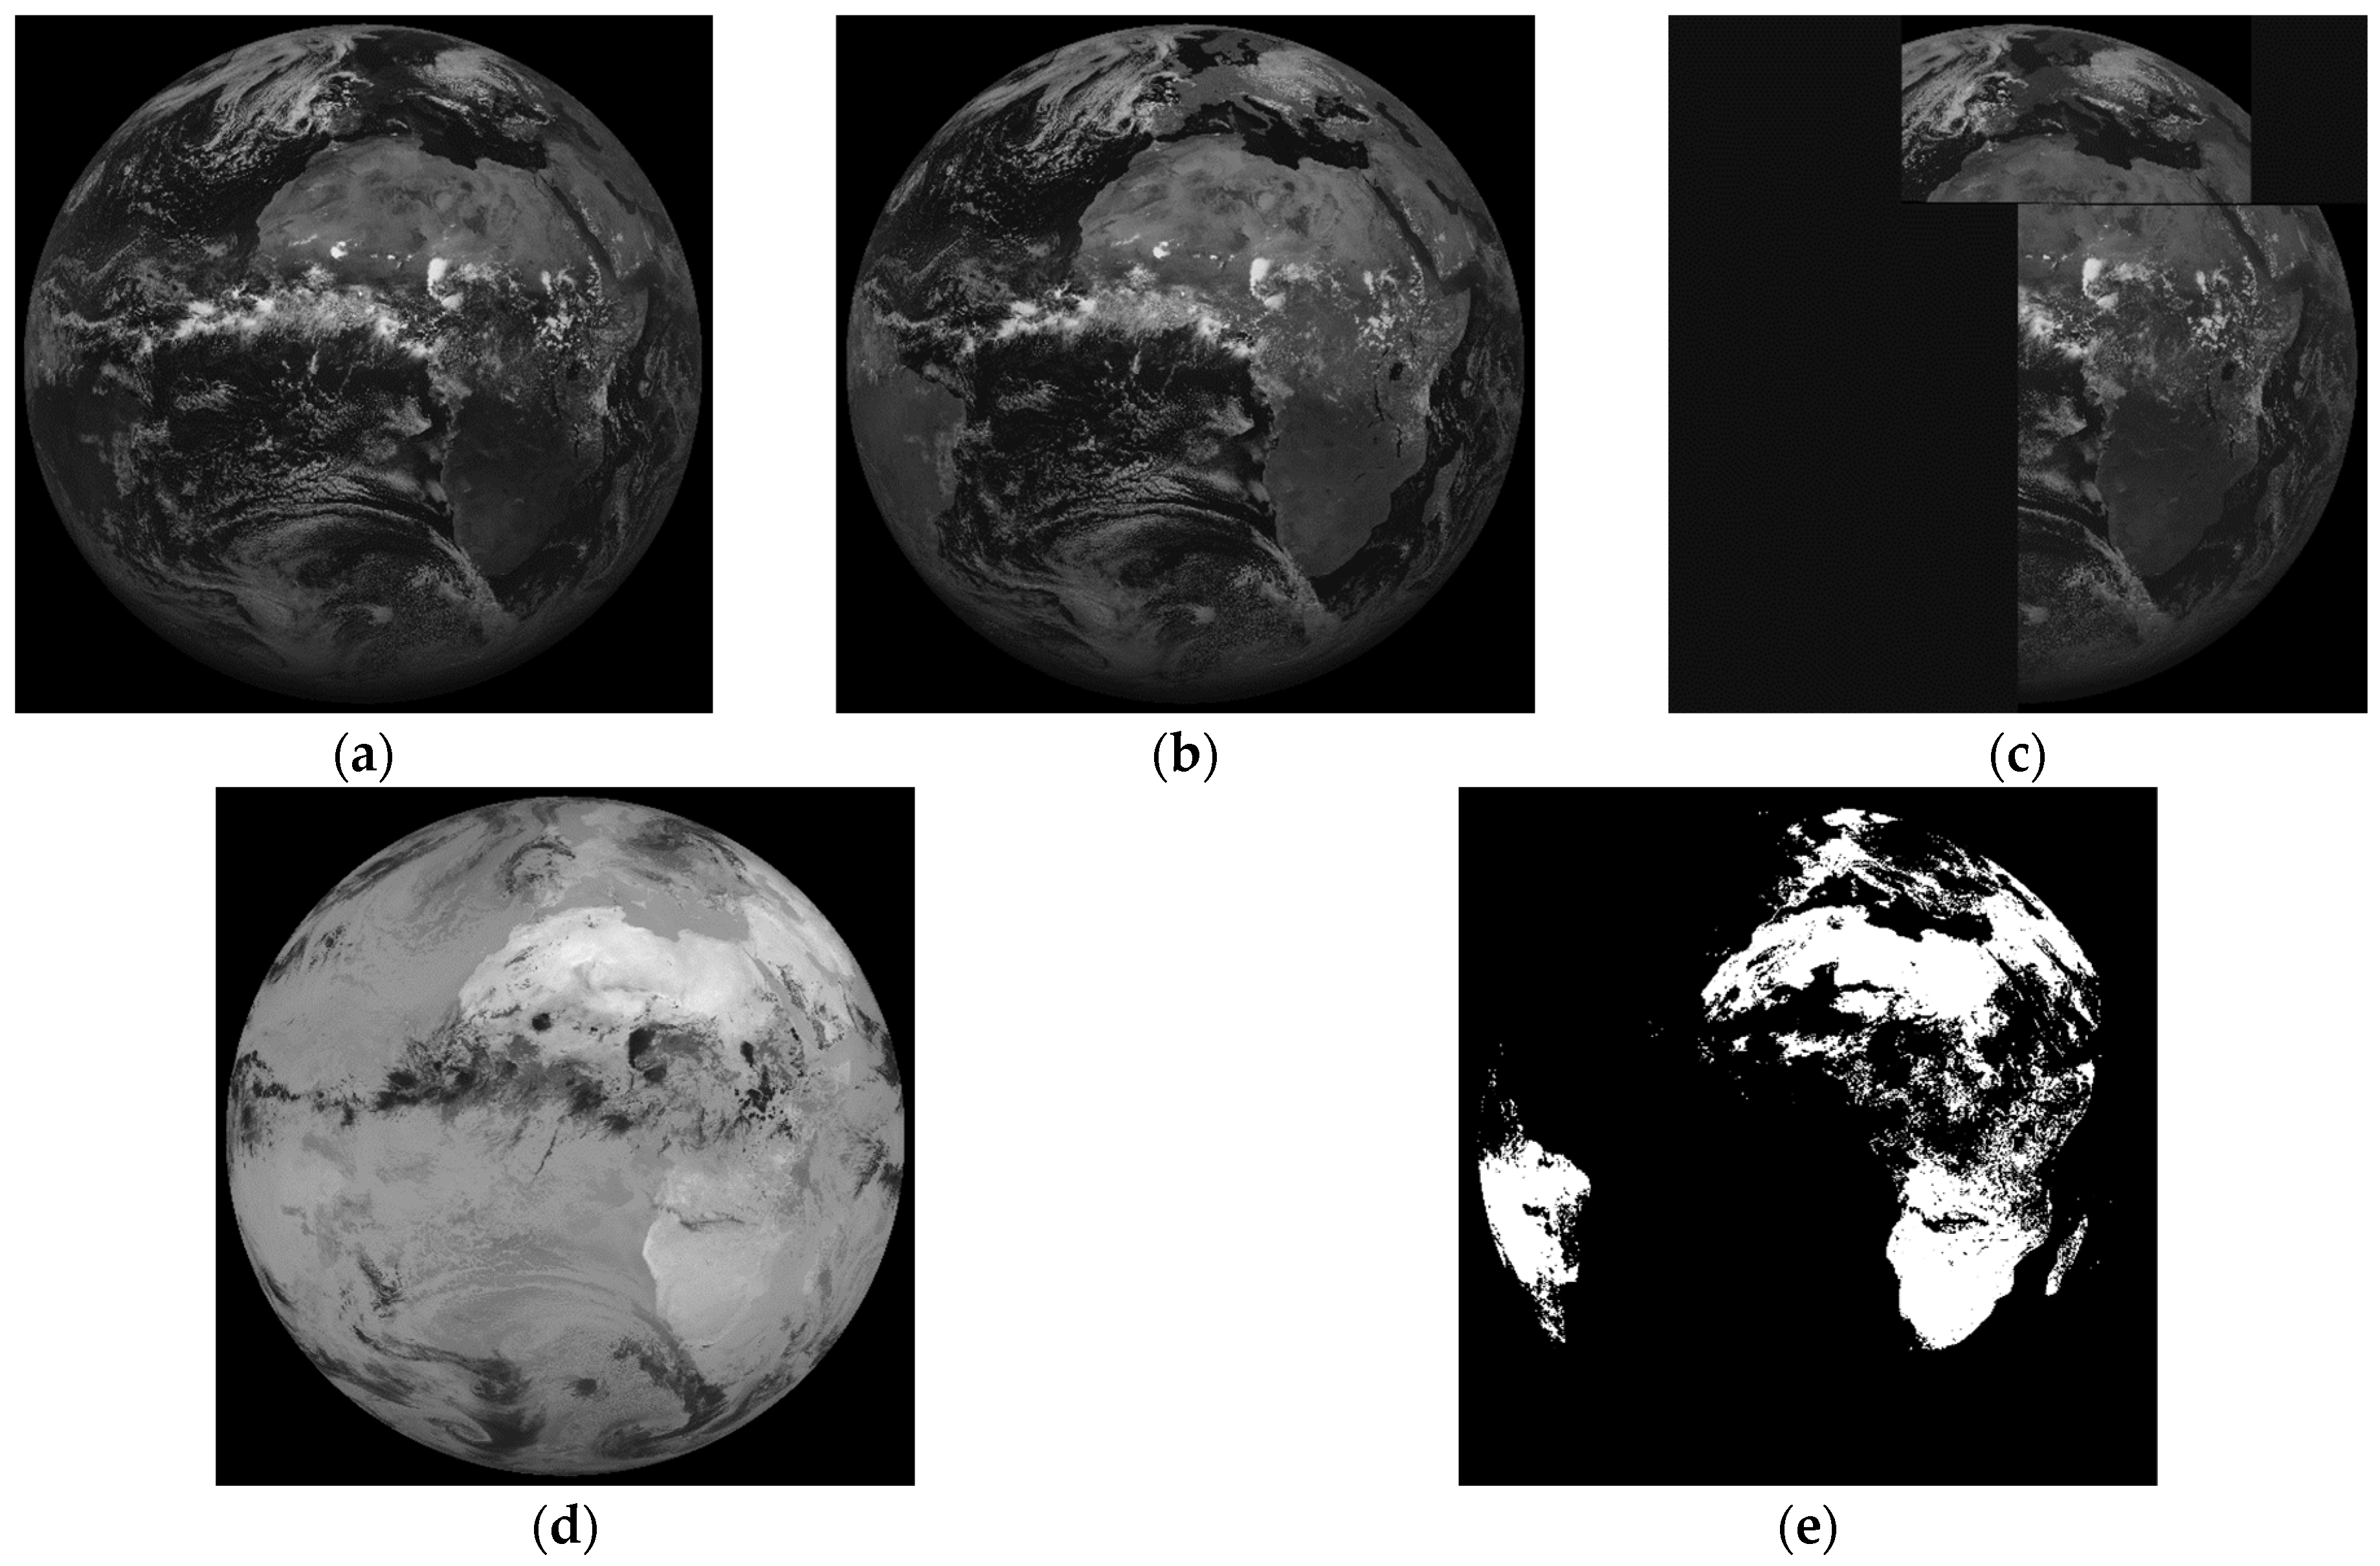
On the other hand, different texture extraction and enhancement algorithms, including Sobel, Laplacian, Wallis, local binary patterns (LBP), and gray-level co-occurrence matrix (GLCM), were studied due to the limited textural content of SEVIRI data, particularly the thermal infrared band images that are indispensable for nighttime data acquisition for the visible and infrared images from one acquisition (see Figure 2). Furthermore, additional image pre-processing steps, such as image inversion, were applied prior to image texture extraction to increase the similarity of the assessed bands in the thermal infrared domain for nighttime data. Cloud and water masks were also integrated in the keypoint extraction stage to avoid false matches in these regions. The performance of the different image and texture enhancement methods is explained in detail in [19]. In brief, the GQA Tool takes reference and target (to be assessed) images and validity mask (cloud and water pixels) as input; applies necessary geometric transformations (resampling to the same GSD, coordinate conversions depending on the reference system to work, etc.); performs image inversion for night-time data; enhances the texture with a Laplacian filter with 5 × 5 window matching for both reference and target images; extracts prominent features with GoodFeaturestoTrack [48]; matches with KLT Tracker [49,50]; carries out reverse matching for outlier elimination; performs statistical validation for further outlier detection and elimination; and visualizes the discrepancy plots. The tool is planned to be integrated into the EUMETSAT Performance, Image Quality, Monitoring, and Characterization System (PIQMICS) for the Cal/Val activities of EPS-SG, the next generation of polar-orbiting satellites of EUMETSAT composed of two series of spacecrafts (Metop-SG A and B) [51].
The overall workflow for the absolute, band-to-band registration, and multi-temporal GQA of SEVIRI that is implemented in the final GQA Tool is given in [25]. The algorithm validation with respect to the MEDICIS Tool of CNES [52] and the traditional EUM online and offline tools of EUMETSAT are also provided in the same publication [25], along with the long-term quality monitoring results. Debacker et al. [21] compared the GQA Tool results with the EUMETSAT operational tool comprehensively and found that there were over a thousand keypoints detected, even during the nighttime. The EUM Offline tool detected less than one hundred keypoints for nighttime thermal band images (IR10.8 band), while the MEDICIS Tool could not find any points for nighttime data. The statistical values based on RMSE and mean from the EUM tools were similar to those from the GQA Tool, but the MEDICIS Tool had oscillations. The higher standard deviations from the GQA Tool were due to a larger number of evaluated keypoints, revealing local systematic errors. Throughout the day, RMSE and mean values exhibited a smooth trend with no significant deviations between consecutive acquisitions. Early and late daytime acquisitions had fewer keypoints compared to midday due to partial darkness [25].
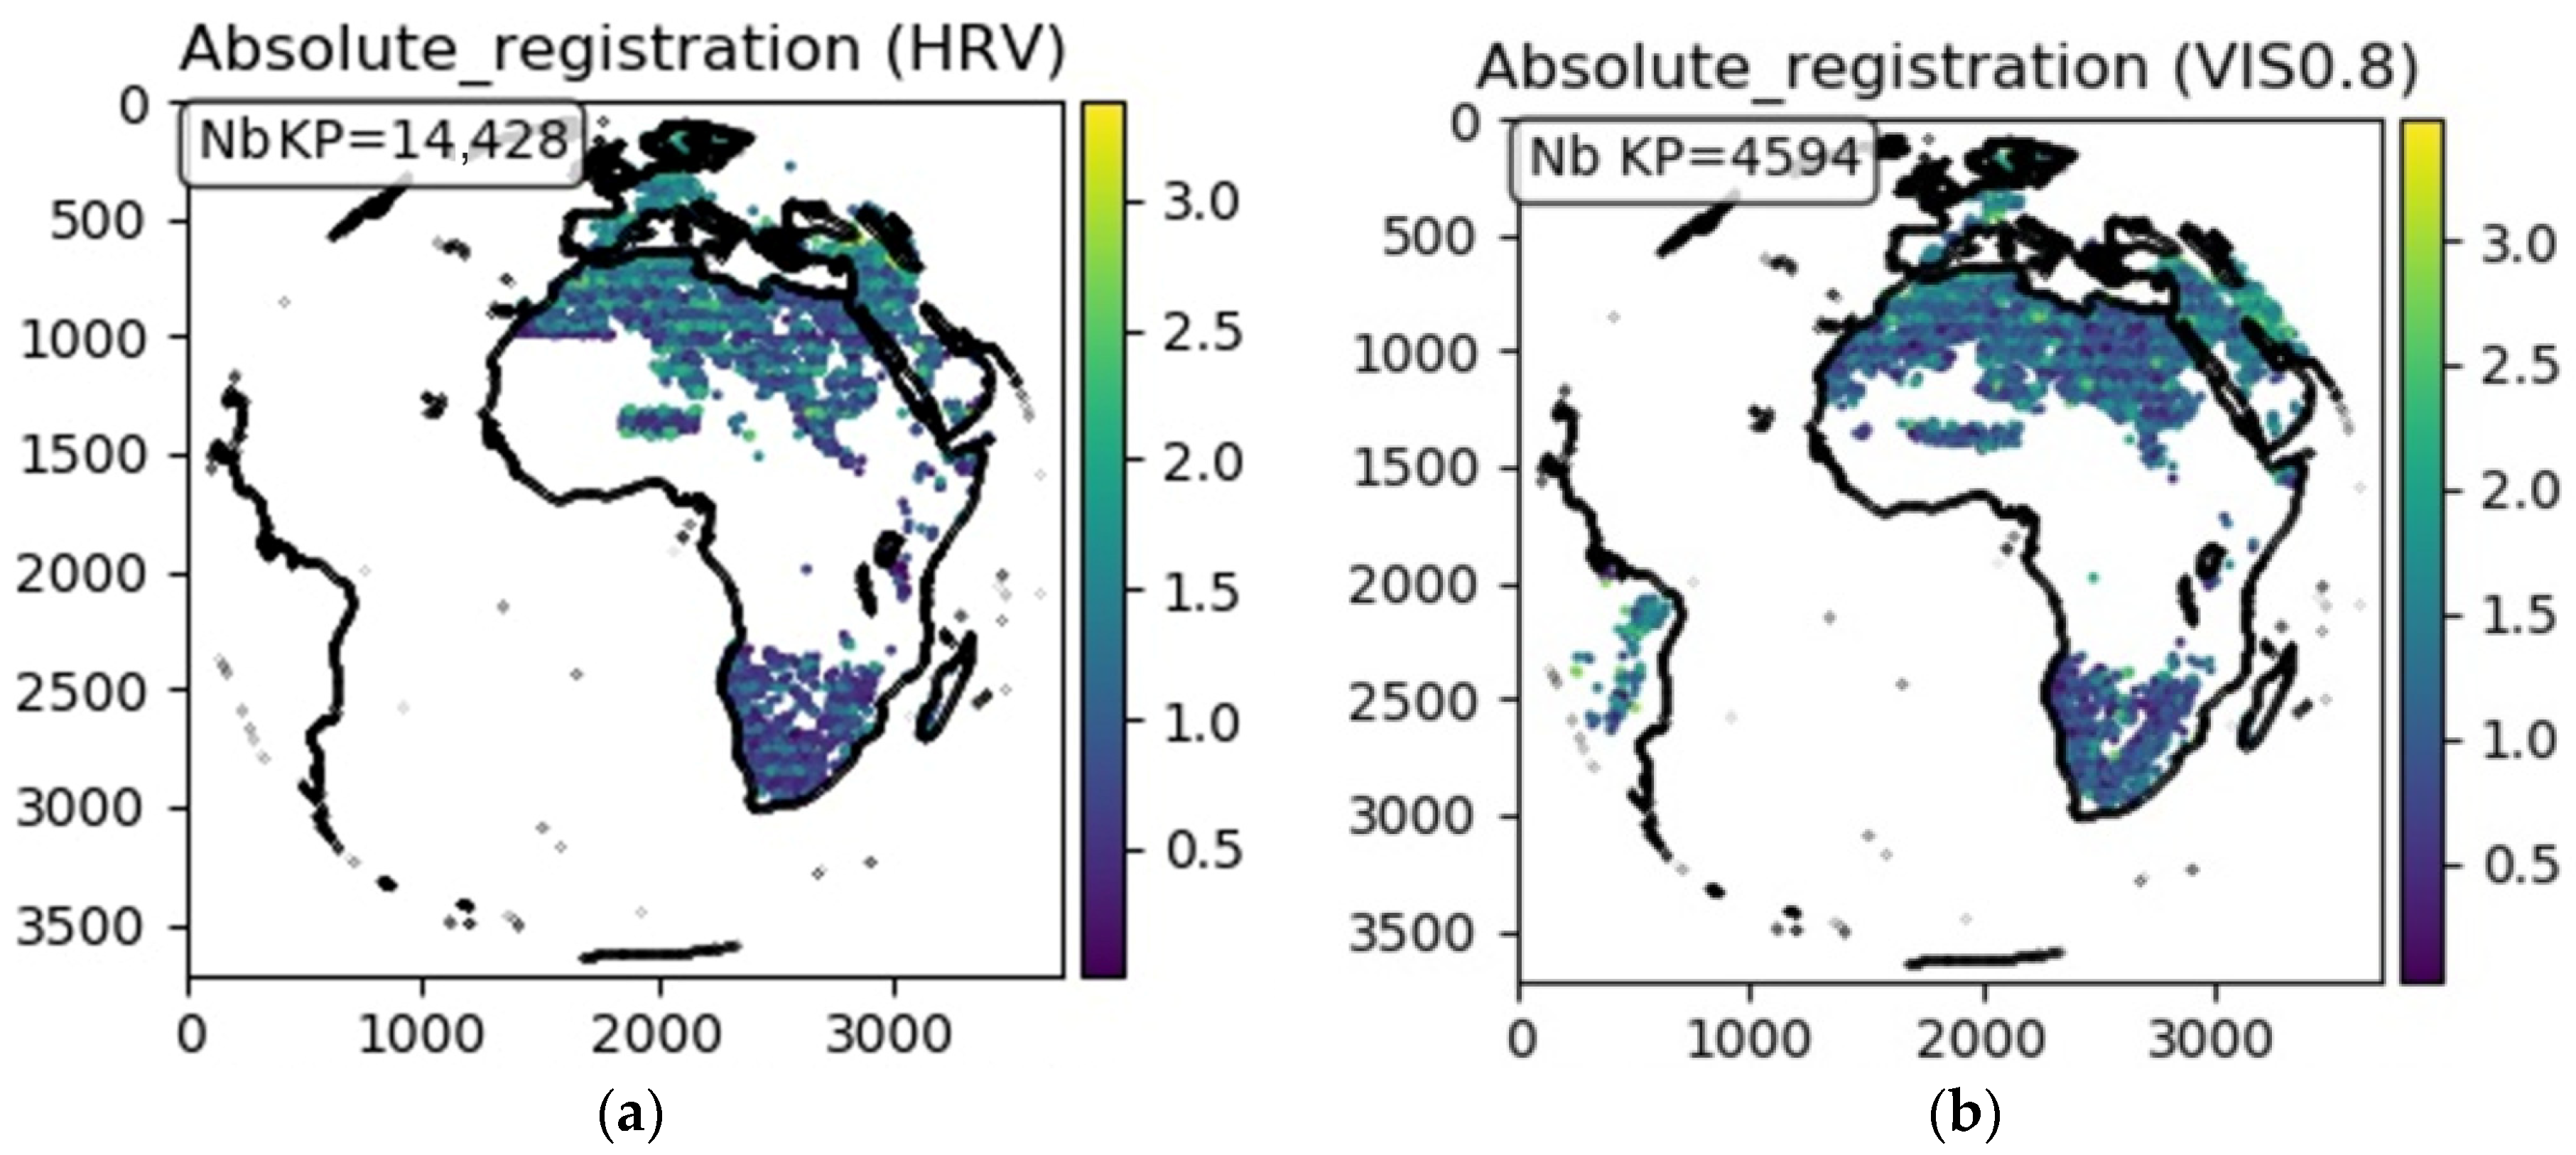
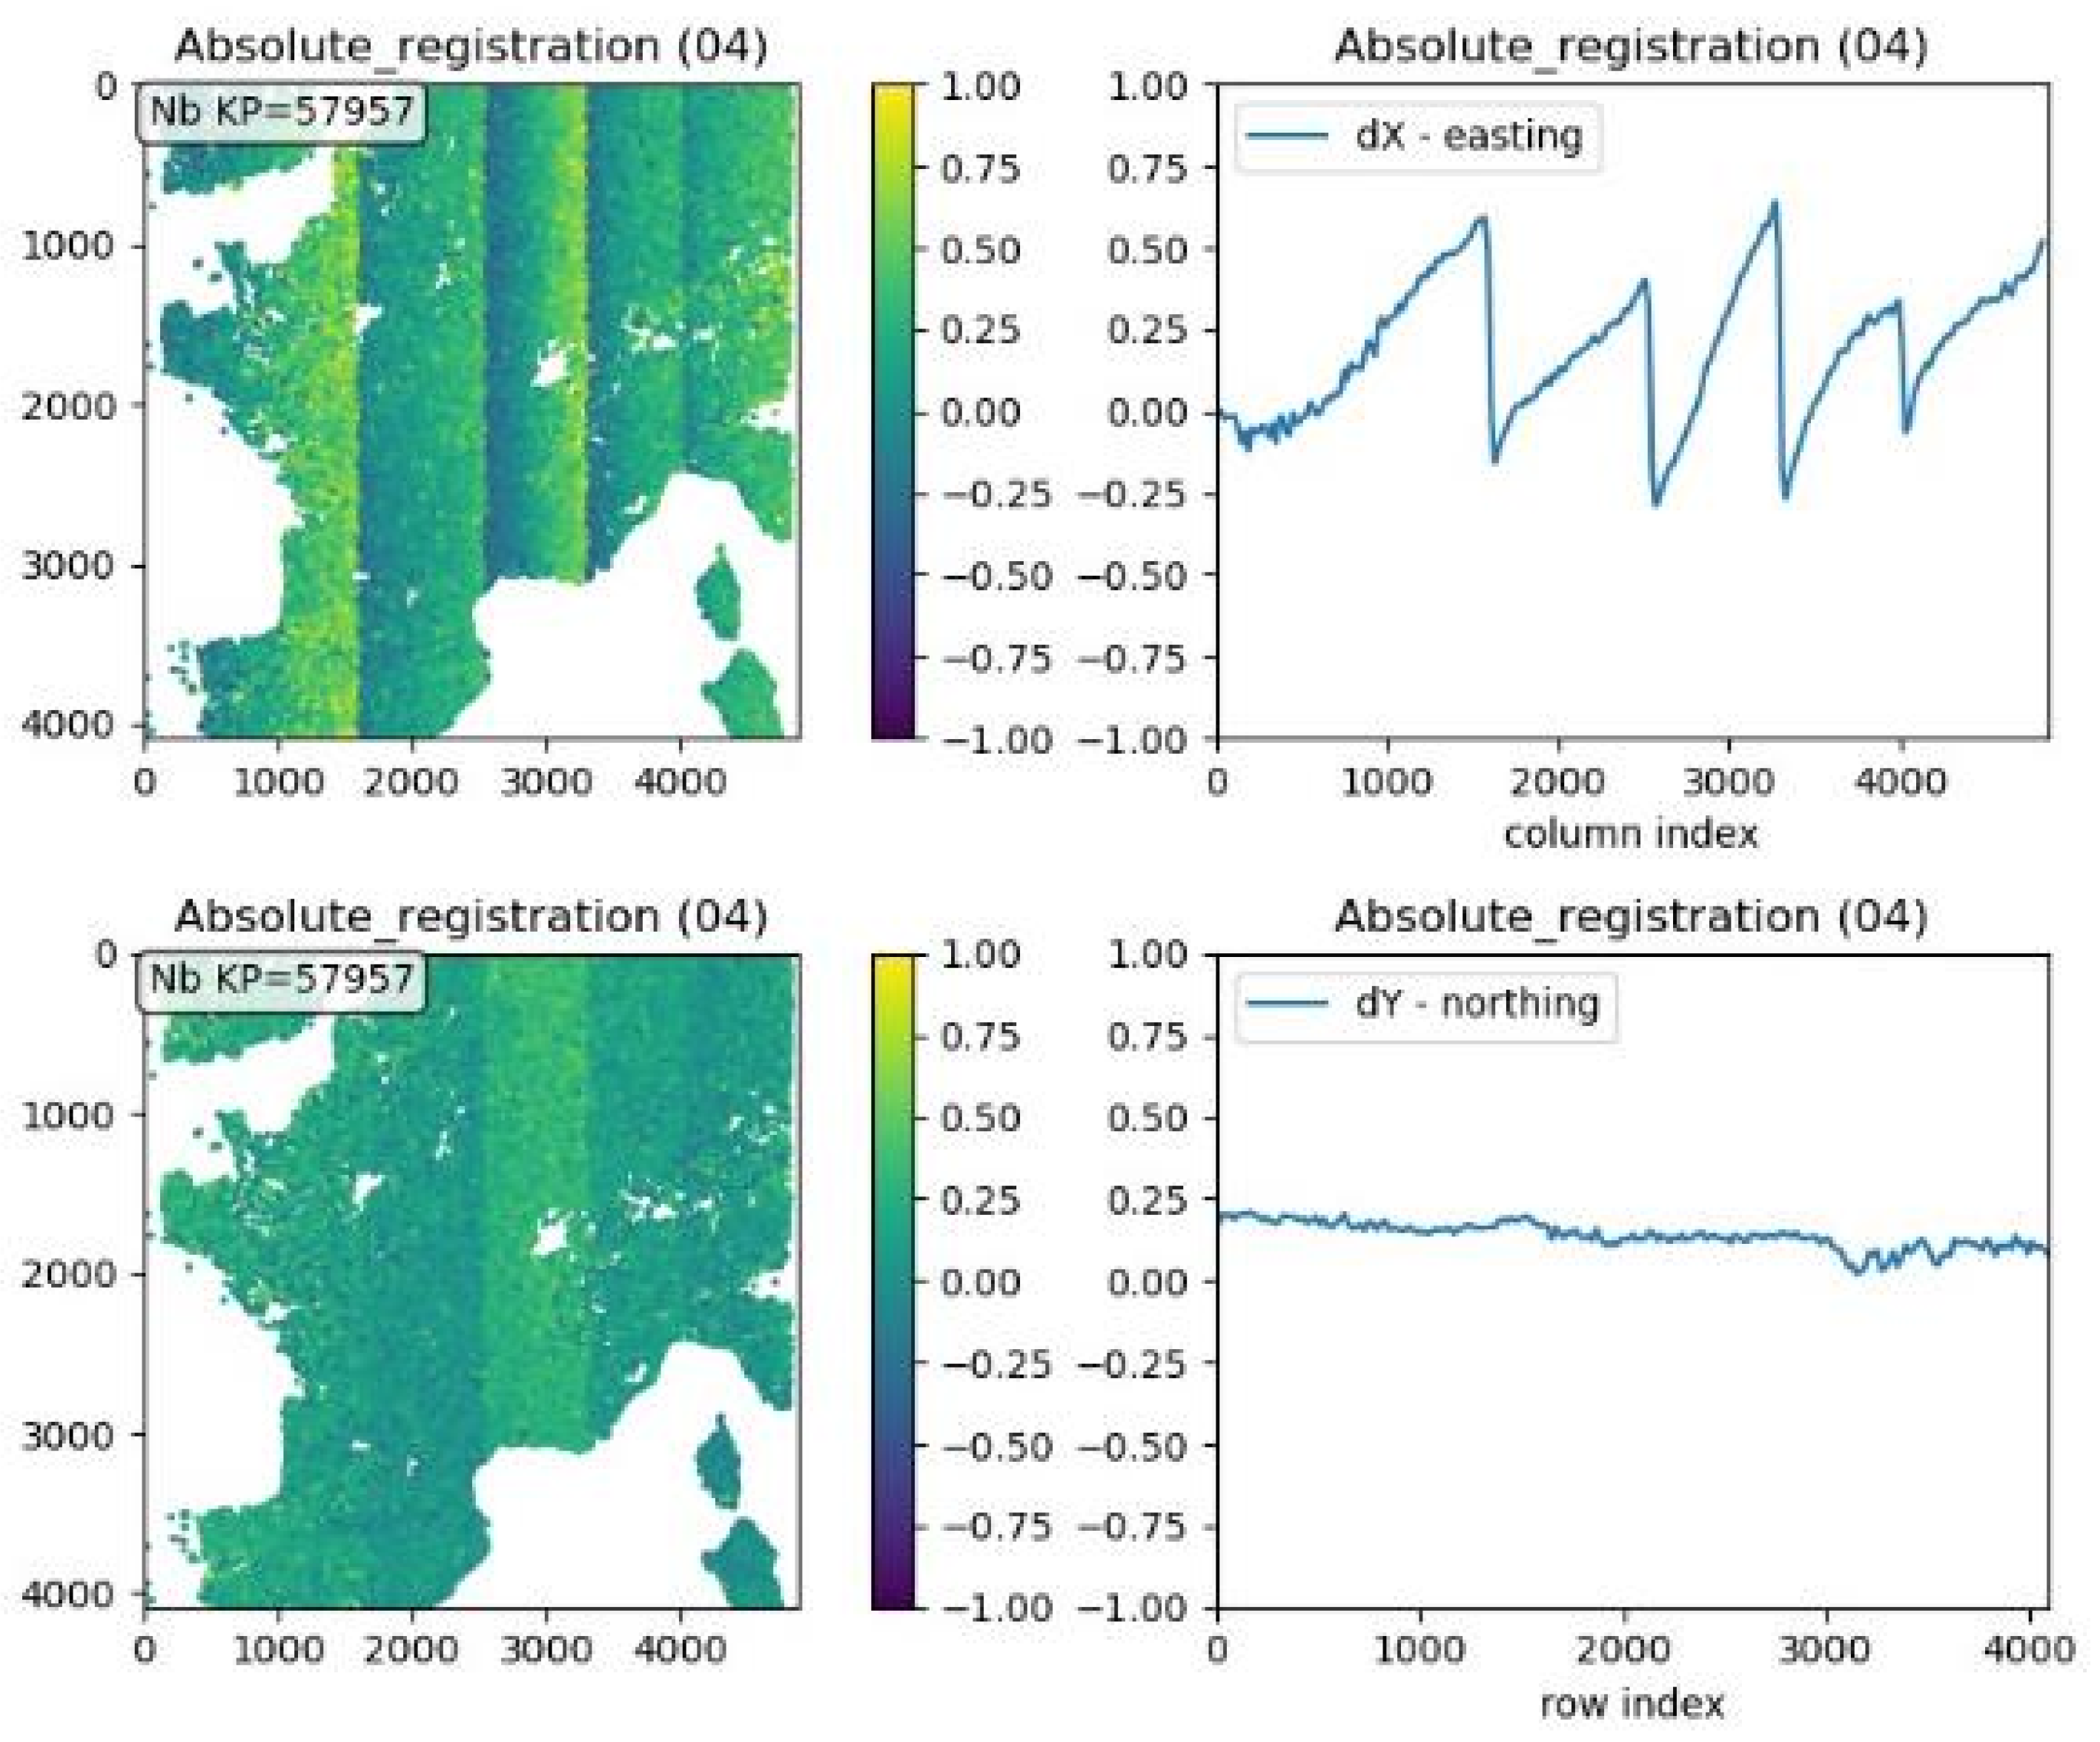
On the other hand, stripe patterns were observed in the image coordinate discrepancy distributions when compared with the reference MERIS L3 mosaic, as shown in Figure 3. In the figure, the horizontal and vertical (left) axes depict the pixel coordinates, whereas the color bar shows the magnitude of the displacements (also in pixels) in the North-South direction. The absolute GQA of day and all-year products from Meteosat-11 demonstrated that shifts were less than 1 km throughout the year, with slightly poorer stability in the infrared band (IR10.8, around 1 km). The larger variations were observed in the North-South direction, with errors up to 1.5 km [25]. The interband registration between the visible bands of 1 km and 3 km resolutions was found to be highly accurate and stable (i.e., approximately 500 m in East-West and 200 m in North-South) for the same satellite. The infrared and visible bands exhibited higher discrepancies (up to 1 km), which can be attributed to the position of IR10.8 on a separate focal plane. The standard deviations in the temporal assessments during one day demonstrated the accuracy of the suggested approach (i.e., 0.01–0.02 pixels).
Based on the study outcomes, it was obvious that photogrammetric image processing and dense matching methods aided by computer vision techniques are capable of assessing the geometric accuracy across different bands with diverse spectral characteristics, even by using reference data from the other sensors with 10–500 m resolutions, also for partial assessment of twilight images, and yield highly precise results covering the global extent and over time. In addition, image inner geometric quality could be assessed thanks to the densely matched keypoints over inlands.
The main limitations of the algorithm arise from the feature detection and matching approaches, which depend on the surface land cover and texture. In addition, image artifacts in both reference and target images and the quality of the cloud and water masks affect the algorithm’s performance. Furthermore, image product level and projection system definition are essential for the algorithm’s usability. The approach is recommended to be used on images projected or rectified to the same plane (such as epipolar images) or on orthoimages because good initial values are important for least squares estimation. Prior to matching, significant geometric disparities between the images to be matched should be minimized. It must also be noted that the reference images may also suffer from decreased inner accuracy, especially over mountainous areas or in regions with large elevation differences, mainly sourced from the quality of georeferencing parameters and the digital elevation model (DEM) used in the orthorectification process. Yan and Roy [53] demonstrated that sub-pixel accuracy can be achieved by matching Landsat MSS images for a one-year dataset, but matching was challenging in agricultural, mountainous, and coastal regions due to seasonal changes and rugged terrain.
A similar effort was undertaken to assess the image navigation (NAV) and registration (INR) performance of the US Geostationary Operational Environmental Satellite R-series (GOES-R) Advanced Baseline Imager (ABI) and Geostationary Lightning Mapper (GLM). They produced high-precision INR metrics that are critical for evaluation and monitoring, allowing for the refinement of navigation algorithms and parameters, and demonstrating that both GOES-R ABIs meet mission INR requirements [54]. The developed methodology was implemented in a tool called IPATS, which relies on image matching with sub-sampling and edge extraction and uses Landsat 8 images as reference data.

3.2.3. AVHRR

AVHRR is an imaging sensor mounted on National Oceanic and Atmospheric Administration (NOAA) Polar Orbiting Environmental Satellites (POES) and MetOp-A-B-C satellites with a primary application area for cloud cover, sea and land surface temperatures, snow, ice, and vegetation cover [16,24,55]. The sensor operates as an across-track scanning system, acquiring images with a swath coverage of approximately 1447 km [55] at six different bands, including thermal infrared (bands 3B, 4, and 5) and solar (bands 1, 2, and 3A) in the visible and NIR parts of the electromagnetic spectrum. All bands have the same GSD (1.1 km). Only five bands are broadcast to the ground at any given time since bands 3A and 3B cannot operate concurrently. For MetOp-A, band 3A acquires images during the daytime, whereas band 3B operates at night. Radiances, cloud information (including cloud top temperature and cloud mask), normalized difference vegetation index (NDVI), land-water boundaries, snow and ice, and SST can be extracted by the AVHRR Level 1B products [56]. Figure 4 illustrates the footprint of one AVHRR acquisition, part of Band 1 over Europe, and the dense matching results against the MERIS L3 mosaic [23]. In Figure 4c, the red dots illustrate the matched points, and the white lines show the detected edges with the Laplacian filter. When Figure 4b,c is compared, it can be seen that the cloud and water areas could be omitted in the matching, and a good geographic distribution of points in the inlands could be obtained.
The accuracy of AVHRR orthoimages obtained from MetOp-A and NOAA satellite series over Switzerland was evaluated by [16,27,28]. The temporal and interband accuracy assessment was based on the LSM method, similar to the SEVIRI methodology [12,23]. The absolute GQA was carried out by utilizing lake polygons based on pixel intensity values (lower values were expected). The study [16] concluded that while the EUMETSAT and GCOS specifications were satisfied in most of the cases, dense image matching detected local systematic errors in the form of stripe patterns in NOAA-18 images based on the relative GQA. Shifts at larger magnitudes (i.e., up to 4 km in East-West and up to 2 km in North-South) were also available in some images. However, the study processed the data only for Switzerland, and it was not possible to utilize the absolute GQA approach globally, i.e., in areas without water bodies.
Schmidt et al. [57] also evaluated the geometric accuracy of AVHRR data at two sites located on the coasts of Australia with 100 GCPs extracted from Landsat ETM+ images and found average differences in nadir pixel locations of 0.40 pixels in the cross-track and 0.33 pixels in the along-track directions, with lower accuracy towards the swath edges. Cross-track errors increased at higher altitudes, and along-track errors were associated with satellite clock drifts.
Wu et al. [58] proposed a matching method to evaluate AVHRR GAC data’s geolocation accuracy at coarse resolution. They used image window matching with data from NOAA-17, MetOp-A, and MetOp-B satellites based on cross-correlation. The method achieved subpixel-level accuracy and revealed average shifts of −1.9 km and −0.02 km in the x and y directions for MetOp-A, along with standard deviations of 1.1 km and 0.79 km, respectively. They noted that their method did not rely on specific landmarks and prevented false landmark detection due to mixed pixels.
The AVHRR data was also assessed within the GQA Tool Study [23,24] using several products from 2020. Sub-parts of the images over six different test areas were employed for evaluating the absolute, relative, and interband registration accuracy. The MERIS L3 mosaic was used as a reference. The results reported in the study demonstrated 2D systematic shifts ranging between 0.2 and 1.6 pixels, indicating that absolute geolocation accuracy performance may be lower than the specifications in some cases, as also reported by Wu et al. [58]. Based on the standard deviations calculated from the coordinate residuals, the results of the temporal registration show that there is more variance in the East-West direction. The interband registration results for bands 1, 2, and 3A show high accuracy, better than 0.1 pixels, which is still within the specifications. When compared with the previous results given in [16], the interband registration also improved when compared with the data from 2008. The photogrammetric methods developed within the GQA Tool study can be reliably used for long-term monitoring of accuracy and stability.

3.2.4. MODIS

The MODIS is an important part of the NASA Earth Observing System (EOS), which was developed to provide worldwide observations and scientific analysis of land cover, global productivity, sea surface temperature, atmospheric and climate conditions, and natural hazards. In order to sample the visible and infrared spectra, MODIS has 490 detectors set up in 36 spectral bands [59]. MODIS bands include the reflective solar bands (RSB) and the thermal emissive bands (TEB), which provide daytime and nighttime images of thermal emissions. The resolution of the MODIS bands 1–2 is nominally 250 m along track, bands 3–7 are nominally 500 m along-track, and bands 8–36 are nominally 1 km along track at the sub-satellite position [60].
According to the absolute, relative, and band-to-band registration accuracy assessments carried out by ETH Zurich and the Swiss GCOS Office at MeteoSwiss, the MODIS products remained within the vendor specifications [20]. However, the GCOS specifications are stricter than the vendor specifications, and higher accuracy is required. Within the study, striping was also observed in several bands, which is a known issue that has been discussed in numerous papers (e.g., see [60,61,62]). According to [62], the majority of MODIS thermal emissive bands (TEBs) exhibit striping as a result of relative variances in the radiometric responses of individual detectors, which change over time and rely on the scan angle and mirror sides. Several Aqua Band 6 detectors were known to be inoperative prior to launch [59]. Such image quality issues affect the ECVs derived from these bands and must be handled carefully. An early example of the influence of band-to-band registration errors of MODIS aboard Aqua on ECV Cloud Properties can be found in [63]. A more recent study by Lin et al. [64] analyzed the geolocation accuracy of MODIS sensors aboard Aqua and Terra for a combined period of 36 years and indicated that the geolocation biases were compensated and the geolocation accuracy was increased by reprocessing the data. Reprocessing of the ECVs derived from MODIS data should be considered in this case.

3.2.5. Sentinel-3 (OLCI and SLSTR)

To assist ocean forecasting systems and environmental and climate monitoring, the Sentinel-3 mission measures ocean and land surface color, ocean and land surface temperature, and sea surface topography. The mission offers operational ocean and land observation services and is jointly operated by ESA and EUMETSAT. The OLCI, SLSTR, SAR Radar Altimeter (SRAL), MicroWave Radiometer (MWR), and Precise Orbit Determination (POD) sensors make up the main payload of the Sentinel-3 mission [65].
OLCI-A and OLCI-B’s georeferencing accuracy has been regularly monitored by ESA using ground control points identified in the visible band (Oa17) [66]. Current georeferencing reveals a worldwide accuracy substantially below the required 0.5 pixels, at roughly 0.3 pixels (90 m) expressed in RMSE [66]. The biases along- and across-track directions for both instruments are less than 0.1 pixels (multi-temporal accuracy) after updating instrument geometric calibration data [66].
On the other hand, the SLSTR-A and SLSTR-B’s absolute geometric accuracy has been validated using visible data using ground control points by ESA. The visible channel demonstrated an accuracy of 0.1 pixels (50 m) in the nadir view along and across the track as well as in the oblique view across the track, with a slightly larger accuracy of 0.2 pixels (100 m) in the oblique view along the track [67]. However, band-to-band registration accuracy issues were observed with the S7 band when compared with S8 and S9 (ca. 250 m for SLSTR-A and 120 m for SLSTR-B). Additionally, the fire channel, F1, also has similar issues, with an offset less than 1 km at the swath’s center that rises as the satellite zenith angle rises and also in the oblique view [67].
Within the GQA Tool study [23], the absolute, temporal, and band-to-band registration accuracies of SLSTR and OLCI data were also evaluated over a number of test sites distributed across the globe using the methodology described in [19,25]. The test sites for SLSTR involved Canary, Europe, Nepal, Amazonia, Australia, South Africa, and Yukon. For OLCI, data from Europe, Nepal, Amazonia, Australia, South Africa, and Yukon were assessed. Topography, land cover, geographic distribution, and data acquisition conditions were considered for the selection of test sites.
The SLSTR results [23] showed that it was difficult to match S7 band images in the evaluated study regions except Europe until 2020. The radiometric and geometric quality of the F1 and S8 bands was improved by EUMETSAT thanks to the newly introduced F1 geolocation, and the improvements were visible especially in band-to-band registration. The time series study over Europe also indicated improved radiometric quality and geolocation accuracy of S7 band pictures after 2020. The S7-band results were in line with [67]. The matching of S7 band images was even more difficult during the winter, most likely as a result of the higher cloud coverage and seasonal differences from the reference Sentinel-2 mosaic. Saturation was frequently observed with the S7 band. Due to the high angle of acquisition (about 55 degrees) of oblique images, this condition appears to deteriorate. In addition, undetected cloud pixels caused outliers in automated matching [23]. Occasional blurring was also observed in the F1 band in the 2019 data. The band-to-band registration accuracy assessments over Europe involved S3, S6, S7, S8, F1, and F2 bands and showed that relatively large shifts can be detected for S8, F1, and F2 bands. The temporal accuracy assessment results over Europe showed high temporal stability of the sensor. A limitation of the applied method is observed in the matching of oblique images, as the variation in viewing angles between reference and search data leads to differences in image texture, yielding a lower count of keypoints. It was emphasized in the study [23] that seasonal disparities between the reference and working images may result in local variations, although the overall shifts in the images can serve as indicators of sensor stability, derived from the mean and median values of all residuals in an image. Employing reference data taken from similar viewing angles may be essential but challenging.
The absolute GQA of OLCI [23] indicated good stability of the sensor and was in line with Bourg et al. [66]. However, local systematic errors as stripes were observed (see Figure 5) [23], which also increased the standard deviations. Dense matching against high-resolution reference images (Sentinel-2) gave the possibility of analyzing the inner geometric accuracy. Although the global values remained low, at camera transitions, the delta of error reached almost 1 pixel in 2019. This trend was observed in products from 2019 and may need to be checked in newer products (e.g., 2020). Regarding the interband registration results, the accuracy was very high (below 0.1 pixel) at all sites.
On the other hand, a study by Carr et al. [68] demonstrated discrepancies between the SLSTR nadir and oblique scenes when compared to the MODIS reference, suggesting a misalignment or lack of registration between the SLSTR images and MODIS while validating stereo-wind products. Moreover, nighttime ascending passes have presented challenges with increased geo-registration errors caused by the absence of GCPs in the reflective channel, although the study focused on the polar regions and further investigations may be needed on this topic in different geographic locations. They also emphasized that the multi-angle (or stereo) capability of SLSTR is essential for producing better-quality wind data, also by integrating with the other sensors, but accurate geometry and time information are necessary for this purpose.

4. Conclusions and Future Directions

The ability to observe the climate system globally and compare the evolution of GCOS ECVs in various regions of the world is now made possible by satellites [2]. Therefore, it is critical to emphasize the requirement for a thorough evaluation of the geometric quality of the various satellite-based products. This paper has described the important role of photogrammetric methods and tools for Geometric Quality Assessment (GQA) of satellite data to derive GCOS ECVs. In specific cases, different geometric quality aspects of MSG SEVIRI, MODIS, Sentinel-3 OLCI and SLSTR, and AVHRR were discussed in detail.
The absolute geolocation and temporal accuracy of the sensors are often monitored with great care by the space agencies. Regarding the reviewed satellites and image products, the data quality has been regularly monitored, and issues are handled with the help of novel approaches and methods by the operators. In addition, the products may be reprocessed when needed, such as with the availability of updated sensor calibration or processing algorithms. Such situations should be communicated to the users proactively, as observations made for ECVs may not be updated accordingly.
Regarding the interband quality assessments, the results can be summarized as follows: the sensor and product design, i.e., being at different local planes or product grids, need to be considered. This issue is particularly important for ECVs derived from multiple bands or from time series analysis. Image quality aspects such as no data, saturation, image compression, or radiometric inequalities must also be considered. Image inner geometry should also be analyzed against high-quality reference data, e.g., Sentinel-2, instead of utilizing sparsely distributed GCPs. Photogrammetric processing techniques have proven to be useful for obtaining successful matches, developing proper outlier elimination approaches, and thus increasing the measurement precision. They may also eventually support the generation of unusable data masks (UDM), which is an essential auxiliary data type for end users.
Although the reviewed studies indicate that dense image matching methods for assessing the geometric quality of medium and low-resolution satellite sensors are mature, improvements can be sought in the requirements for good initial approximations between the reference and target images, such as similar resolutions and being on the same georeferencing grid (projection system and processing level). As mentioned above, reprocessing of archive data for improving the geometric quality is now possible thanks to the availability of a great deal of higher-resolution reference data and has already been undertaken by various agencies/operators. However, challenges still exist due to the different viewing angles, as in the case of SLSTR, spectral differences, and seasonal differences in land cover between the reference and target images. Although research on aligning radiometry of multiple sensors towards building virtual constellations exists [69], more research is needed on this aspect. Moreover, as a frequently used data type in the production of upper-level products (Level 1B or Level 2), DEMs need to be of high quality (dense, accurate, complete, and well-distributed), aligned in the same time frame as the image acquisition, represent similar objects (terrain, surface, etc.), and be accurately co-registered with the images to be processed. Further research may be carried out for this purpose.
In the future, the observation of the climate system will be further extended and strengthened. Thereby, the continuity of existing EO programs of climate-relevant sensors is vital to guaranteeing the long-term continuity of important measurement series from space. In addition, the observation system will be complemented by new operational and research missions (public), as well as potentially increasing commercial missions. In this respect, the calibration/validation (Cal/Val) initiatives become even more important than before, as cross-sensor and multi-temporal observations are essential for monitoring the ECVs accurately. The efforts made by the ESA Earthnet Program set a good example as they greatly contributed to the EO community and to the Global Earth Observation System of Systems (GEOSS) [70]. The recent Earthnet Data Assessment Project (EDAP; 2018–2021) and its continuation (EDAP+) aimed at assessing a variety of Cal/Val parameters and the usability of Third Party Missions (TPMs) worldwide [71,72] (see also Copernicus Contributing Missions [73] for further efforts on sensor and data integration) and established guidelines for quality assessments adapted within the global QA4EO Framework [74]. In summary, for all these missions, it is crucial that calibration and validation activities ensure the highest level of quality for the derived climate variables to ensure reliable information for addressing the challenges in global climate monitoring and further understanding, predicting, mitigating, and adapting to climate change.

Funding

This research received no external funding.

Acknowledgments

The authors kindly dedicate this article to Armin Grün for his leadership in advancing the collaboration between photogrammetry and atmospheric sciences. The authors also kindly acknowledge the great contributions of Emmanuel Baltsavias to the photogrammetry and remote sensing methods and tools for monitoring ECVs.

Conflicts of Interest

The authors declare no conflict of interest.

References

  1. Masson-Delmotte, V.; Zhai, P.; Pirani, A.; Connors, S.L.; Péan, C.; Berger, S.; Caud, N.; Chen, Y.; Goldfarb, L.; Gomis, M.I.; et al. (Eds.) IPCC Climate Change 2021: The Physical Science Basis. Contribution of Working Group I to the Sixth Assessment Report of the Intergovernmental Panel on Climate Change; Cambridge University Press: Cambridge, UK; New York, NY, USA, 2023. [Google Scholar] [CrossRef]
  2. World Meteorological Organization. 2022 GCOS Implementation Plan; GCOS-244; World Meteorological Organization: Geneva, Switzerland, 2022. [Google Scholar]
  3. World Meteorological Organization. The Second Report on the Adequacy of the Global Observing Systems for Climate in Support of the UNFCCC; WMO TD 1143; WMO GCOS-82; WMO GCOS: Geneva, Switzerland, 2003; p. 81. [Google Scholar]
  4. World Meteorological Organization. 2004 GCOS Implementation Plan. Implementation Plan for the Global Observing System for Climate in Support of the UNFCCC; WMO TD 1219; WMO GCOS-92; WMO GCOS: Geneva, Switzerland, 2004; p. 136. [Google Scholar]
  5. Committee on Earth Observation Satellites (CEOS). Report on a Coordinated Response from Space Agencies Involved in Global Observations to the Needs Expressed in the Global Climate Observing System Implementation Plan. UNFCCC Document FCCC/SBSTA/2006/MISC.14. 2006. Available online: https://unfccc.int/documents/4416 (accessed on 25 July 2023).
  6. Karl, T.R.; Diamond, H.J.; Bojinski, S.; Butler, J.H.; Dolman, H.; Haeberli, W.; Harrison, D.E.; Nyong, A.; Rösner, S.; Seiz, G.; et al. Observation needs for climate information, prediction and application: Capabilities of existing and future observing systems. Procedia Environ. Sci. 2010, 1, 192–205. [Google Scholar] [CrossRef]
  7. Seiz, G.; Foppa, N.; Meier, M.; Paul, F. The role of satellite data within GCOS Switzerland. Remote Sens. 2011, 3, 767–780. [Google Scholar] [CrossRef]
  8. Dowell, M.; Lecomte, P.; Husband, R.; Schulz, J.; Mohr, T.; Tahara, Y.; Eckman, R.; Lindstrom, E.; Wooldridge, C.; Hilding, S.; et al. Strategy Towards an Architecture for Climate Monitoring from Space. 2013, p. 39. Available online: http://www.cgms-info.org/ (accessed on 30 July 2023).
  9. The Joint CEOS/CGMS Working Group on Climate (WGClimate). Space Agency Response to GCOS Implementation Plan. ESA-ECO-EOPS-WGCL-RP-17-0061. Version 2.2.1. 2018. Available online: www.ceos.org (accessed on 30 July 2023).
  10. World Meteorological Organization. 2010 GCOS Implementation Plan. Implementation Plan for the Global Observing System for Climate in Support of the UNFCCC (2010 Update); WMO TD 1523; WMO GCOS-138; WMO GCOS: Geneva, Switzerland, 2010; p. 180. [Google Scholar]
  11. World Meteorological Organization. 2016 GCOS Implementation Plan. The Global Observing System for Climate: Implementation Needs; GCOS-200; World Meteorological Organization: Geneva, Switzerland, 2016. [Google Scholar]
  12. Kocaman Aksakal, S. Geometric Accuracy Investigations of SEVIRI High Resolution Visible (HRV) Level 1.5 Imagery. Remote Sens. 2013, 5, 2475–2491. [Google Scholar] [CrossRef]
  13. Seiz, G.; Baltsavias, E.; Gruen, A. Satellite- and Ground-Based Stereo Analysis of Clouds. J. Jpn. Soc. Photogramm. Remote Sens. 2003, 44, 36–45. [Google Scholar] [CrossRef]
  14. Clothiaux, E.E.; Fischer, J.; Quiby, J.; Seiz, G. Photogrammetry and Remote Sensing for Meteorological Applications—Challenges for the Future; Commemorative Volume for the 60th Birthday of Prof. Dr. Armin Grün; ETH Zurich: Zurich, Switzerland, 2004; 284p. [Google Scholar]
  15. Gruen, A.; Kocaman, S. Optical Sensors High Resolution: Geometry Validation Methodology; Technical Report Submitted to ESA/ESRIN. RFQ/3-11780/06/I-OL; ETH Zurich: Zurich, Switzerland, 2008. [Google Scholar]
  16. Kocaman, S.; Neuhaus, C.; Baltsavias, E.; Schindler, K. Geometric Quality Analysis of AVHRR Orthoimages. Remote Sens. 2015, 7, 3293–3319. [Google Scholar] [CrossRef]
  17. World Meteorological Organization. The 2022 GCOS ECVs Requirements; GCOS-245; World Meteorological Organization: Geneva, Switzerland, 2022. [Google Scholar]
  18. World Meteorological Organization. Systematic Observation Requirements for Satellite-Based Products for Climate; WMO TD 1338; WMO GCOS-107; WMO GCOS: Geneva, Switzerland, 2006; p. 90. [Google Scholar]
  19. Kocaman, S.; Debaecker, V.; Bas, S.; Saunier, S.; Garcia, K.; Just, D. A Comprehensive Geometric Quality Assessment Approach for MSG SEVIRI Imagery. Adv. Space Res. 2022, 69, 1462–1480. [Google Scholar] [CrossRef]
  20. Kocaman, S.; Baltsavias, E.; Schindler, K. Analysis of the Geometric Accuracy of Satellite-Based Products of GCOS Switzerland; Swiss GCOS Office at Meteoswiss: Zurich, Switzerland, 2014. [Google Scholar]
  21. Debaecker, V.; Saunier, S.; Kocaman, S.; Bas, S. Level 1 GQA Tool Study Algorithm Theoretical Basis Document (ATBD) for GQA Tool; Technical Report; GQA-TPZ-009-ATBD Issue 1.2; EUMETSAT: Darmstadt, Germany, 26 November 2020.
  22. Kocaman, S.; Saunier, S. Level 1 GQA Tool Study Report Part 1. Technical Report Submitted to EUMETSAT. GQA-TPZ-007-SREP Issue 1.1. 22 September 2019. Available online: https://www-cdn.eumetsat.int/files/2021-08/GQA-TPZ-007-SREP_1.1_Part1%20-%20Final.pdf (accessed on 9 July 2023).
  23. Kocaman, S.; Bas, S.; Debaecker, V.; Saunier, S. Level 1 GQA Tool Study Report Part 2. Technical Report Submitted to EUMETSAT. GQA-TPZ-017-SREP Issue 1.0. 7 July 2020. Available online: https://www-cdn.eumetsat.int/files/2021-08/GQA-TPZ-017-SREP_1.0_Part2%20-%20Final.pdf (accessed on 9 July 2023).
  24. Bas, S.; Debaecker, V.; Kocaman, S.; Saunier, S.; Garcia, K.; Just, D. Investigations on the Geometric Quality of AVHRR Level 1B Imagery Aboard MetOp-A. PFG—J. Photogramm. Remote Sens. Geoinf. Sci. 2021, 89, 519–534. [Google Scholar] [CrossRef]
  25. Debaecker, V.; Kocaman, S.; Saunier, S.; Garcia, K.; Bas, S.; Just, D. On the Geometric Accuracy and Stability of MSG SEVIRI Images. Atmos. Environ. 2021, 262, 118645. [Google Scholar] [CrossRef]
  26. Kocaman, S.; Debaecker, V.; Bas, S.; Saunier, S.; Garcia, K.; Just, D. Investigations on the Global Image Datasets for the Absolute Geometric Quality Assessment of MSG SEVIRI Imagery. Int. Arch. Photogramm. Remote Sens. Spat. Inf. Sci. 2020, 43, 1339–1346. [Google Scholar] [CrossRef]
  27. Kocaman Aksakal, S.; Baltsavias, E.; Schindler, K. Geometric Accuracy Investigations of AVHRR Orthoimages. In Proceedings of the 35th Asian Conference on Remote Sensing, Nay Pyi Taw, Myanmar, 27–31 October 2014. [Google Scholar]
  28. Kocaman Aksakal, S.; Baltsavias, E.; Schindler, K. Geometric accuracy assessment of AVHRR orthoimages from METOP-2. In Proceedings of the EUMETSAT Conference, Geneva, Switzerland, 22–26 September 2014. [Google Scholar]
  29. Kocaman Aksakal, S.; Baltsavias, E.; Schindler, K. Geometric Accuracy Assessment of MSG-SEVIRI Level 1.5 Imagery. In Proceedings of the Joint EUMETSAT/AMS Conference, Vienna, Austria, 16–20 September 2013. [Google Scholar]
  30. Kocaman Aksakal, S.; Baltsavias, E.; Schindler, K. Analysis of the Geometric Accuracy of MSG-SEVIRI Imagery with Focus on Estimation of Climate Variables. In Proceedings of the 34th Asian Conference on Remote Sensing, Bali, Indonesia, 20–24 October 2013. [Google Scholar]
  31. Gruen, A. Development and Status of Image Matching in Photogrammetry. Photogramm. Rec. 2012, 27, 36–57. [Google Scholar] [CrossRef]
  32. Gruen, A. Adaptive least squares correlation: A powerful image matching technique. S. Afr. J. Photogramm. Remote Sens. Cartogr. 1985, 3, 175–187. [Google Scholar]
  33. Saunders, R. Satellite-based ECV products. In Proceedings of the Copernicus Workshop on Climate Observation Requirements, Reading, UK, 29 June–2 July 2015; Available online: https://www.ecmwf.int/sites/default/files/elibrary/2015/13467-satellite-based-ecv-products.pdf (accessed on 30 July 2023).
  34. Leachtenauer, J.C.; Malila, W.; Irvine, J.; Colburn, L.; Salvaggio, N. General image-quality equation: GIQE. Appl. Opt. 1997, 36, 8322–8328. [Google Scholar] [CrossRef] [PubMed]
  35. Yalcin, I.; Kocaman, S.; Saunier, S.; Albinet, C. Radiometric Quality Assessment for Maxar HD Imagery. Int. Arch. Photogramm. Remote Sens. Spat. Inf. Sci. 2021, 43, 797–804. [Google Scholar] [CrossRef]
  36. Valenzuela, A.Q.; Reyes, J.C.G. Basic spatial resolution metrics for satellite imagers. IEEE Sens. J. 2019, 19, 4914–4922. [Google Scholar] [CrossRef]
  37. Gruen, A. The accuracy potential of the modern bundle block adjustment in aerial photogrammetry. Photogramm. Eng. Remote Sens. 1982, 48, 45–54. [Google Scholar]
  38. EUMETSAT. 2023. Available online: https://www.eumetsat.int/mtg-data (accessed on 7 July 2023).
  39. Picart, S.S.; Marsouin, A.; Legendre, G.; Roquet, H.; Péré, S.; Nano-Ascione, N.; Gianelli, T. A Sea Surface Temperature data record (2004–2012) from Meteosat Second Generation satellites. Remote Sens. Environ. 2020, 240, 111687. [Google Scholar] [CrossRef]
  40. Meyer, H.; Schmidt, J.; Detsch, F.; Nauss, T. Hourly gridded air temperatures of South Africa derived from MSG SEVIRI. Int. J. Appl. Earth Obs. Geoinf. 2019, 78, 261–267. [Google Scholar] [CrossRef]
  41. Martins, J.P.A.; Trigo, I.F.; Ghilain, N.; Jimenez, C.; Göttsche, F.-M.; Ermida, S.L.; Olesen, F.-S.; Gellens-Meulenberghs, F.; Arboleda, A. An All-Weather Land Surface Temperature Product Based on MSG/SEVIRI Observations. Remote Sens. 2019, 11, 3044. [Google Scholar] [CrossRef]
  42. Sobrino, J.A.; Julien, Y.; Jiménez-Muñoz, J.C.; Skokovic, D.; Sòria, G. Near real-time estimation of Sea and Land surface temperature for MSG SEVIRI sensors. Int. J. Appl. Earth Obs. Geoinf. 2020, 89, 102096. [Google Scholar] [CrossRef]
  43. García-Haro, F.J.; Camacho, F.; Martínez, B.; Campos-Taberner, M.; Fuster, B.; Sánchez-Zapero, J.; Gilabert, M.A. Climate Data Records of Vegetation Variables from Geostationary SEVIRI/MSG Data: Products, Algorithms and Applications. Remote Sens. 2019, 11, 2103. [Google Scholar] [CrossRef]
  44. Ghilain, N.; Arboleda, A.; Batelaan, O.; Ardö, J.; Trigo, I.; Barrios, J.M.; Gellens-Meulenberghs, F. A new retrieval algorithm for soil moisture index from thermal infrared sensor on-board geostationary satellites over Europe and Africa and its validation. Remote Sens. 2019, 11, 1968. [Google Scholar] [CrossRef]
  45. Masiello, G.; Serio, C.; De Feis, I.; Amoroso, M.; Venafra, S.; Trigo, I.F.; Watts, P. Kalman filter physical retrieval of surface emissivity and temperature from geostationary infrared radiances. Atmos. Meas. Tech. 2013, 6, 3613–3634. [Google Scholar] [CrossRef]
  46. Masiello, G.; Serio, C.; Venafra, S.; Liuzzi, G.; Göttsche, F.; Trigo, I.F.; Watts, P. Kalman filter physical retrieval of surface emissivity and temperature from SEVIRI infrared channels: A validation and intercomparison study. Atmos. Meas. Tech. 2015, 8, 2981–2997. [Google Scholar] [CrossRef]
  47. Nain, J.; Mueller, J. Improving band to band registration accuracy of SEVIRI level 1.5 products. In Proceedings of the Image and Signal Processing for Remote Sensing XXV, International Society for Optics and Photonics, Strasbourg, France, 9–12 September 2019; Volume 11155, p. 1115503. [Google Scholar] [CrossRef]
  48. Shi, J.; Tomasi, C. Good features to track. In Proceedings of the IEEE Computer Society Conference on Computer Vision and Pattern Recognition, Seattle, WA, USA, 21–23 June 1994; pp. 593–600. [Google Scholar]
  49. Tomasi, C.; Kanade, T. Detection and Tracking of Point Features; Technical Report CMU-CS-91-132; Carnegie Mellon University: Pittsburgh, PA, USA, April 1991. [Google Scholar]
  50. Lucas, B.D.; Kanade, T. An iterative image registration technique with an application to stereo vision. In Proceedings of the International Joint Conference on Artificial Intelligence, Vancouver, BC, Canada, 24–28 August 1981; pp. 674–679. [Google Scholar]
  51. De Bartolomei, M.; Müller, J.; Nain, J.; Munro, R.; Sunda, M.; Horn, C.; Mammone, C.; Debaecker, V.; Kocaman, S. Image Geometric Quality Assessment in the EPS-SG Calibration and Validation. In Proceedings of the EUMETSAT Meteorological Satellite Conference 2022, Brussels, Belgium, 19–23 September 2022. [Google Scholar]
  52. Cournet, M.; Giros, A.; Dumas, L.; Delvit, J.M.; Greslou, D.; Languille, F.; Michel, J. 2D Sub-Pixel Disparity Measurement Using QPEC/Medicis. Int. Arch. Photogramm. Remote Sens. Spat. Inf. Sci. 2016, 41, 291–298. [Google Scholar] [CrossRef]
  53. Yan, L.; Roy, D.P. Improving Landsat Multispectral Scanner (MSS) geolocation by least-squares-adjustment based time-series co-registration. Remote Sens. Environ. 2021, 252, 112181. [Google Scholar] [CrossRef]
  54. Tan, B.; Dellomo, J.J.; Folley, C.N.; Grycewicz, T.J.; Houchin, S.; Isaacson, P.J.; Johnson, P.D.; Porter, B.C.; Reth, A.D.; Thiyanaratnam, P.; et al. GOES-R series image navigation and registration performance assessment tool set. J. Appl. Remote Sens. 2020, 14, 032405. [Google Scholar] [CrossRef]
  55. EUMETSAT. AVHRR Level 1b Product Guide. Doc. no: EUM/OPS-EPS/MAN/04/0029, Issue: v3A. 21 January 2011. Available online: https://www-cdn.eumetsat.int/files/2020-04/pdf_avhrr_l1b_product_guide.pdf (accessed on 25 July 2023).
  56. EUMETSAT. AVHRR Factsheet. Doc. no: EUM/OPS/DOC/09/5183, Issue: v1C e-Signed. 1 December 2015. Available online: https://www-cdn.eumetsat.int/files/2020-04/pdf_avhrr_factsheet.pdf (accessed on 25 July 2023).
  57. Schmidt, M.; King, E.A.; McVicar, T.R. Assessing the geometric accuracy of AVHRR data processed with a state vector based navigation system. Can. J. Remote Sens. 2008, 34, 496–508. [Google Scholar] [CrossRef]
  58. Wu, X.; Naegeli, K.; Wunderle, S. Geometric accuracy assessment of coarse-resolution satellite datasets: A study based on AVHRR GAC data at the sub-pixel level. Earth Syst. Sci. Data 2020, 12, 539–553. [Google Scholar] [CrossRef]
  59. Xiong, J.; Toller, G.; Chiang, V.; Sun, J.; Esposito, J.; Barnes, W. MODIS Level 1B Algorithm Theoretical Basis Document; NASA MODIS Characterization Support Team: Washington, DC, USA, 2005.
  60. NASA MODIS Characterization Support Team. MODIS Level 1B Algorithm Theoretical Basis Document Version 4. 14 June 2013. Available online: https://mcst.gsfc.nasa.gov/sites/default/files/file_attachments/MODIS_L1B_ATBD_ver8_finalupload.pdf (accessed on 25 July 2023).
  61. Bisceglie, M.; Episcopo, R.; Galdi, C.; Ullo, S.L. Destriping MODIS data using overlapping field-of-view method. IEEE Trans. Geosci. Remote Sens. 2009, 47, 637–651. [Google Scholar] [CrossRef]
  62. Bouali, M.; Ignatov, A. Estimation of Detector Biases in MODIS Thermal Emissive Bands. IEEE Trans. Geosci. Remote Sens. 2013, 51, 4339–4348. [Google Scholar] [CrossRef]
  63. Arnold, G.T.; Hubanks, P.A.; Platnick, S.; King, M.D.; Bennartz, R. Impact of Aqua Misregistration on MYD06 Cloud Retrieval Properties. In Proceedings of the MODIS Science Team Meeting, Washington, DC, USA, 26–28 January 2010. [Google Scholar]
  64. Lin, G.G.; Wolfe, R.E.; Zhang, P.; Tilton, J.C.; Dellomo, J.J.; Tan, B. Thirty-six combined years of MODIS geolocation trending. In Proceedings of the Earth Observing Systems XXIV, San Diego, CA, USA, 11–15 August 2019; Volume 11127, pp. 219–230. [Google Scholar] [CrossRef]
  65. Sentinel-3. Available online: https://sentinels.copernicus.eu/web/sentinel/missions/sentinel-3 (accessed on 25 July 2023).
  66. Bourg, L.; Bruniquel, J.; Henocq, C.; Morris, H.; Dash, J.; Preusker, R.; Dransfeld, S. Copernicus Sentinel-3 OLCI Land User Handbook. 14 April 2023. Available online: https://sentinel.esa.int/documents/247904/4598066/Sentinel-3-OLCI-Land-Handbook.pdf (accessed on 17 July 2023).
  67. Polehampton, E.; Cox, C.; Smith, D.; Ghent, D.; Wooster, M.; Xu, W.; Bruniquel, K.; Henocq, C.; Dransfeld, S. Copernicus Sentinel-3 SLSTR Land User Handbook. 14 April 2023. Available online: https://sentinel.esa.int/documents/247904/4598082/Sentinel-3-SLSTR-Land-Handbook.pdf (accessed on 17 July 2023).
  68. Carr, J.L.; Wu, D.L.; Friberg, M.D.; Summers, T.C. Multi-LEO Satellite Stereo Winds. Remote Sens. 2023, 15, 2154. [Google Scholar] [CrossRef]
  69. Saunier, S.; Pflug, B.; Lobos, I.M.; Franch, B.; Louis, J.; De Los Reyes, R.; Debaecker, V.; Cadau, E.G.; Boccia, V.; Gascon, F.; et al. Sen2Like: Paving the Way towards Harmonization and Fusion of Optical Data. Remote Sens. 2022, 14, 3855. [Google Scholar] [CrossRef]
  70. Mannan, R.; Halsall, K.; Albinet, C.; Ottavianelli, G.; Goryl, P.; Boccia, V.; Melchiorre, A.; Piro, A.; Giudici, D.; Fox, N.; et al. ESA’s Earthnet data assessment pilot: Paving the way for new space players. In Proceedings of the International Society for Optics and Photonics, Sensors, Systems, and Next-Generation Satellites XXIII, Strasbourg, France, 10 October 2019; Volume 11151. [Google Scholar] [CrossRef]
  71. ESA EDAP. Earthnet Data Assessment Pilot Project. 2022. Available online: https://earth.esa.int/eogateway/activities/edap (accessed on 30 July 2023).
  72. Saunier, S.; Karakas, G.; Yalcin, I.; Done, F.; Mannan, R.; Albinet, C.; Goryl, P.; Kocaman, S. SkySat Data Quality Assessment within the EDAP Framework. Remote Sens. 2022, 14, 1646. [Google Scholar] [CrossRef]
  73. Copernicus. Contributing Missions. Available online: https://www.copernicus.eu/en/contributing-missions (accessed on 30 July 2023).
  74. QA4EO. Available online: https://qa4eo.org/ (accessed on 30 July 2023).
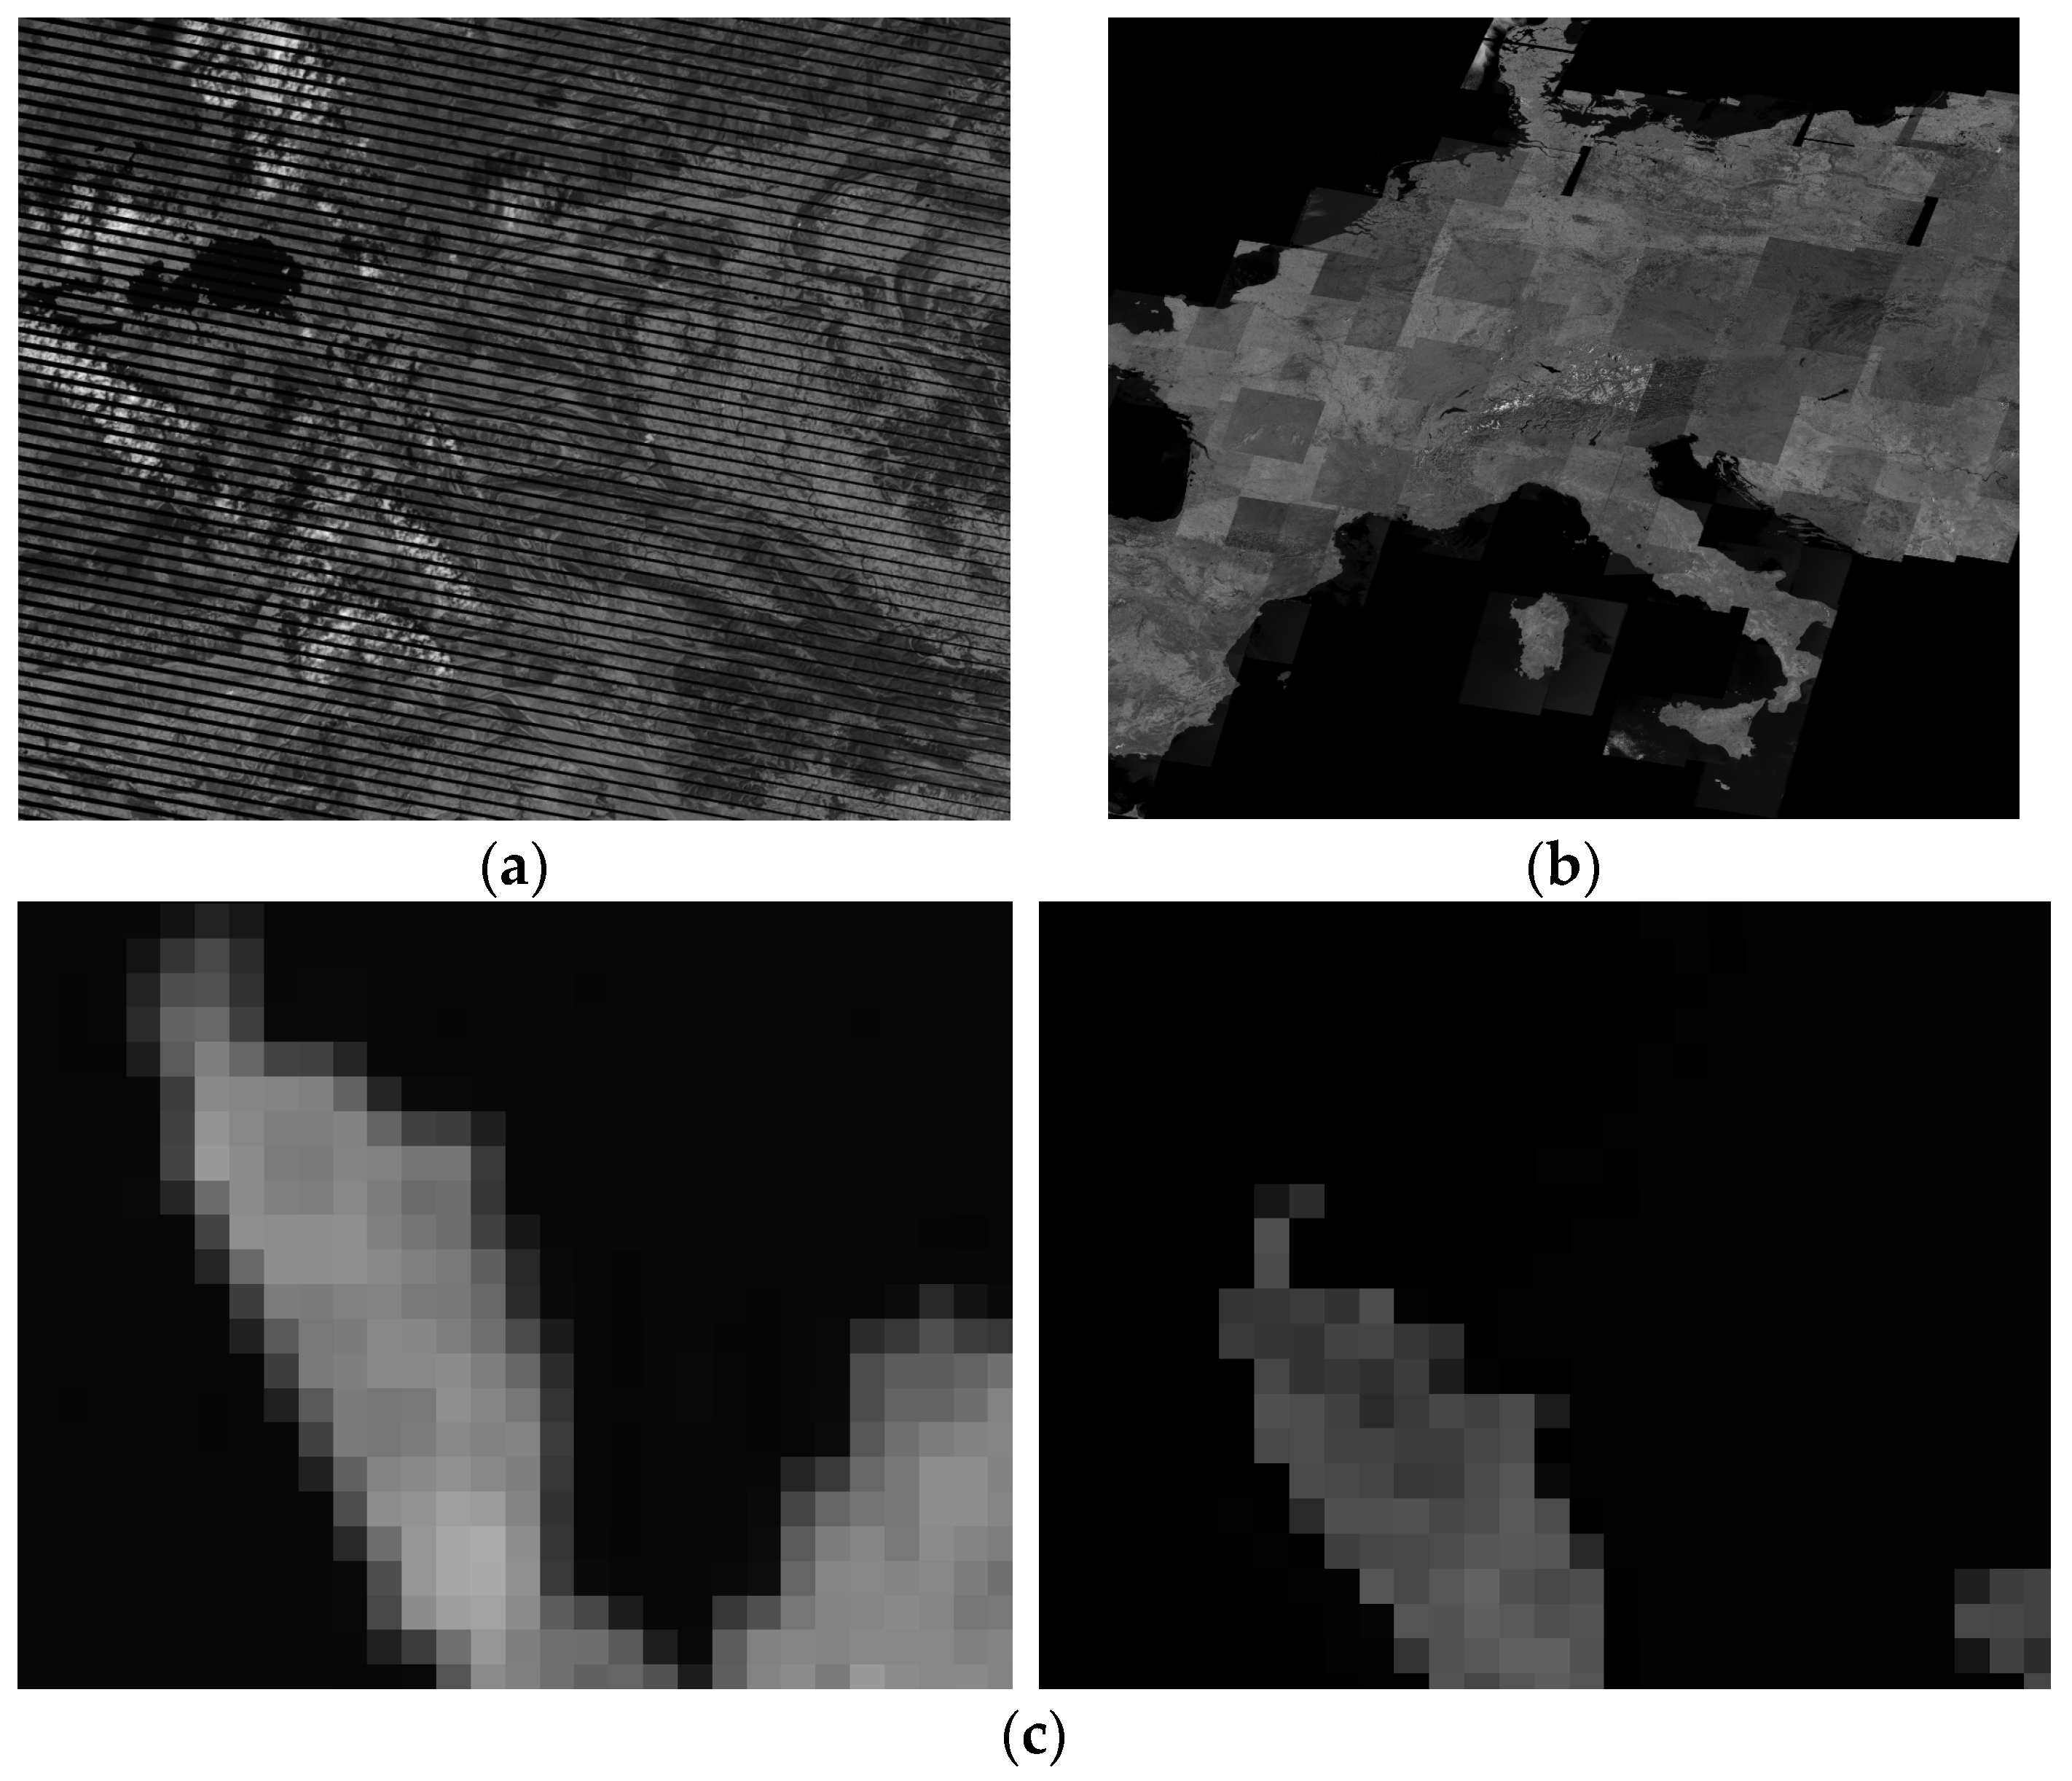
Figure 1. Various image quality issues such as (a) striping and (b) radiometric differences between image tiles in GLS2010 data; and (c) geolocation differences between different MERIS mosaics observed in the shorelines [26].
Remotesensing 15 04575 g001
Figure 2. SEVIRI (a) VIS0.6, (b) VIS0.8, (c) high resolution visible (HRV), (d) IR10.8 images, and (e) the cloud mask on 1 July 2018 at 12:00 UTC.
Remotesensing 15 04575 g002
Figure 3. Image coordinate discrepancy distributions between reference MERIS L3 and SEVIRI: (a) HRV and (b) VIS0.8 images [21].
Remotesensing 15 04575 g003
Figure 4. (a) Footprint of one AVHRR acquisition over Europe; (b) AVHRR Band 1 image; and (c) matched points against the MERIS L3 mosaic [23].
Remotesensing 15 04575 g004
Figure 5. Stripes observed in residual distributions after matching of the OLCI Band 4 image and the Sentinel 2 red band mosaic over Europe [23].
Remotesensing 15 04575 g005
Table 1. Specifications of various satellite datasets used in some of the reviewed studies.
Satellite/
Product
ProductImaging Date(s)GSD *BandsUsageGQA TypesSourceReferences
SEVIRI aboard Meteosat 8Level 1.52008, 23 January 20201 km and 3 kmHRV, VIS0.6, VIS0.8, IR10.8Target (assessed) imagesAbsolute, relative, band-to-bandEUMETSAT **[20,21,25]
SEVIRI aboard Meteosat 10Level 1.55 January 20201 km and 3 kmHRV, VIS0.6, VIS0.8, IR10.8Target (assessed) imagesAbsolute, relative, band-to-bandEUMETSAT[21,25]
SEVIRI aboard Meteosat 11Level 1.51 July 2018–1 June 2019 at 12:00 UTC1 km and 3 kmHRV, VIS0.6, VIS0.8, IR10.8Target (assessed) imagesAbsolute, relative, band-to-bandEUMETSAT[21,25]
AVHRR aboard MetOP-ALevel 1B2008, 5 February 2020, 5 March 2020, 5 April 20201.1 km1, 2, 3ATarget (assessed) imagesAbsolute, relative, band-to-bandEUMETSAT[20,23,24]
Sentinel-3 OLCILevel 12019, 2020300 mB4, B7, B17Target (assessed) imagesAbsolute, relative, band-to-bandESA ***, EUMETSAT[23]
Sentinel-3 SLSTRLevel 12019, 2020500 mS3, S6, S7, S8, F1, F2Target (assessed) imagesAbsolute, relative, band-to-bandESA, EUMETSAT[23]
MODIS aboard Terra and AquaLevel 1B2008250 m, 500 m, 1 kmAll bands except 5, 13–16, 21, 24–30, 33–36 for Terra and B6 for AquaTarget (assessed) imagesAbsolute, relative, band-to-bandNASA[20]
Landsat 4–5 and 7Landsat GLS2010 L1 (orthorectified)2008–201230 mB4, B5, B6, B10ReferenceAbsoluteNASA/USGS[26]
MERIS **** aboard Envisat-1L3 mosaic weekly synthesis (orthorectified)2018–2020260 m × 300 mB7, B12, B13ReferenceAbsoluteESA CCI[26]
Sentinel-2Cloudless mosaic (orthorectified)Yearly mosaics (2016, 2018–2021)10 mRGBReferenceAbsoluteEOX IT Services[26]
* Ground sampling distance. ** European Organization for the Exploitation of Meteorological Satellites. *** European Space Agency. **** Medium Resolution Imaging Spectrometer.
Table 2. ECV requirements defined by the 2022 GCOS (for a full list, see 2022 GCOS ECV Requirements [17]).
ECV ProductDomainRequirement
Horizontal ResolutionVertical ResolutionTemporal ResolutionTimelinessMeasurement Uncertainty (2σ)Stability (per Decade)
Cloud coverAtmosphericG: 25 m
B: 100 m
T: 500 m
-G: 1 h
B: 24 h
T: 720 h
G: 1 h
B: 3 h
T: 12 h
G: 3%
B: 6%
T: 12%
G: 0.3%
B: 0.6%
T: 1.2%
Sea Surface Temperature (SST)OceanicG: 5 km
B: -
T: 100 km
-G: 1 h
B: -
T: 7 d
G: 3 h
B: -
T: 24 h
G: 0.05 K
B: -
T: 0.3 K
G: 0.01 K
B: -
T: 0.1 K
Land CoverTerrestrialG: 10 m–300 m
B: 300 m–1 km
T: >1 km
-G: 1 month
B: 12 months
T: 60 months
G: 3 months
B: 12 months
T: 60 months
G: 5%
B: 20%
T: 35%
G: 5%
B: 15%
T: 25%
Disclaimer/Publisher’s Note: The statements, opinions and data contained in all publications are solely those of the individual author(s) and contributor(s) and not of MDPI and/or the editor(s). MDPI and/or the editor(s) disclaim responsibility for any injury to people or property resulting from any ideas, methods, instructions or products referred to in the content.