Abstract
The acquisition of precise deformation data, including the entirety of the subsidence basin resulting from subterranean mining operations, assumes critical significance in the context of surface impairment monitoring during the course of mining activities. In light of the constraints associated with InSAR technology when applied to the surveillance of expansive deformation gradient mining regions, an innovative approach is advanced herein for InSAR deformation phase retrieval. This approach integrates a reference phase, derivable through a variety of means, including pre-existing models or measurements. Initially, the reference deformation phase is subjected to subtraction from the wrapped InSAR deformation phase, culminating in the derivation of the wrapped phase indicative of the residual phase. Notably, it is posited that the fringe density characterizing the wrapped phase of the residual phase is theoretically diminished in comparison to that of the InSAR wrapped phase. This reduction in complexity in phase unwrapping ensues as a direct consequence. Subsequent to this, the phase retrieval process is effectuated through the summation of the reference phase and the unwrapped phase pertaining to the residual phase. The study harnesses Sentinel-1A and ALOS PALSAR-2 data, employing the PIM-predicted outcomes and GNSS-RTK monitoring outcomes as reference phases for the execution of phase retrieval experiments in two designated study areas. The computation of subsidence is subsequently realized through the combination of the displacement vector depression angle model and the retrieved phase, with the accuracy thereof corroborated through the utilization of leveling data. The experimental findings underscore the efficacy of the reference phase retrieval methodology in securing a more precise deformation phase characterization within expansive deformation gradient mining regions, thereby demonstrating the suitability of this methodological approach.
1. Introduction
The extraction of mineral resources from beneath the Earth’s surface can induce movements and deformations, which precipitate geological hazards and environmental challenges in mining areas, thereby imperiling the safety of both individuals and property []. Consequently, the pursuit of efficient and precise methodologies for the monitoring of surface deformations within mining zones emerges as an imperative endeavor. Initially, conventional measurement techniques, such as leveling and global navigation satellite systems (GNSS), predominated as the primary tools for early-stage surface deformation monitoring. While these methods conferred high levels of accuracy, they were characterized as being time-intensive, labor-intensive, and cost-prohibitive, and offered a limited spatiotemporal resolution in terms of monitoring outcomes. Interferometric synthetic aperture radar (InSAR) technology emerged as a pioneering approach for surface deformation monitoring, initially harnessed for elevation data extraction. Subsequently, the extension of the InSAR principle to underwater acoustics gave rise to interferometric synthetic aperture sonar (InSAS) for the measurement of seabed terrain [,]. The advent of Ddfferential InSAR (DInSAR) technology, introduced by Gabriel et al. in 1989, marked the inception of InSAR-based surface deformation monitoring []. Furthermore, the utilization of unmanned aerial vehicles (UAV) in photogrammetry has given rise to a progressive surge in the monitoring of surface deformations within mining areas, affording a more realistic representation of surface deformation within regions characterized by pronounced deformation gradients [,]. In the context of mining subsidence prediction, the probability integration method (PIM) presently stands as one of China’s most established and widely applied techniques [].
InSAR technology has found extensive application across diverse domains, including ground deformation, mining subsidence, seismic deformation, and volcanic surface deformation [,,,,,]. Following the pioneering work by Carnec et al. [] in 1996, who initiated the use of DInSAR technology for surface deformation monitoring in mining areas, InSAR technology has progressively achieved widespread adoption in the monitoring of mining subsidence, often yielding monitoring accuracies at the centimeter or even millimeter levels [,,,,,,]. Nevertheless, it is essential to acknowledge that InSAR technology exclusively captures the line of sight (LOS) deformation, which may not consistently mirror the true surface deformation [,]. Additionally, surface deformations arising from mining activities within mining areas frequently exhibit rapid rates and extensive magnitudes. The deformation gradient within the central region of the subsidence basin is typically substantial, exceeding the monitoring capabilities inherent to InSAR technology [,,].
Recent years have witnessed significant advancements in UAV-based measurement technologies, leading to an increased reliance on UAV-based photogrammetry and LiDAR for the monitoring of surface deformations. For instance, Zhou et al. [] used UAV photogrammetry to monitor subsidence in mining areas, achieving an accuracy level of 121 mm in terms of root mean square error (RMSE). Zheng et al. [] established a precise digital subsidence model for monitoring coal mining subsidence based on laser point clouds, with a peak accuracy of 97 mm. Liu et al. [] combined UAV point clouds with the structure-from-motion method to amass multi-temporal, high-resolution terrain data. Nonetheless, it is pertinent to note that the accuracy of surface change assessment was substantially affected by outlier errors, primarily ranging between 0.2 m and 0.3 m. Moreover, scholars have also directed their efforts toward achieving precise measurements of horizontal movement within mining areas. For instance, Benoit et al. [] employed co-registered orthomosaics to quantify horizontal displacements on the surface of a glacier. Puniach et al. [,] devised an automated workflow for determining horizontal displacements engendered by underground mining, relying on ultra-high-resolution orthomosaics, and achieved accuracies at the level of 1–2 pixels. While image registration algorithms have yielded satisfactory outcomes in urbanized regions, their applicability encounters constraints within agricultural and forested areas.
Numerous researchers have delved into fusion methodologies aimed at combining surface deformation monitoring outcomes from InSAR, offset tracking (OT), PIM, UAV measurements, and traditional measurement techniques to derive precise surface deformation information covering the entire basin. Chen et al. [] introduced a refined monitoring approach for surface subsidence within mining areas that combines InSAR and PIM, thereby elevating monitoring accuracy at the periphery of the subsidence basin. He et al. [] conducted a systematic analysis of the current research landscape concerning InSAR- and Beidou/GNSS-integrated methods for surface deformation monitoring. Fan et al. [,] used the combination of InSAR technology and OT technology to acquire the LOS deformation of the goaf surface as the true ground subsidence, subsequently inverting PIM parameters using the oppositional-based learning chaotic bat algorithm (OLCBA). Ma et al. [] deployed three methods, namely, SBAS InSAR, temporal DInSAR, and OT technology, to monitor surface deformation within mining areas. These were followed by the application of a decision fusion methodology, which consolidated comprehensive terrain deformation information for the entire basin, duly accounting for the strengths and limitations of each technique. Zhou et al. [] and Zhang et al. [] explored a mining subsidence basin monitoring approach that harmonizes UAV photogrammetry with InSAR technology. The results underscored that this approach facilitates more accurate monitoring of surface subsidence within mining areas, as opposed to the independent utilization of InSAR or drone technology.
The present research endeavor seeks to combine the surface deformation characteristics of mining subsidence and fully exploit the potential of InSAR technology to enhance its deformation monitoring capabilities within regions characterized by pronounced deformation gradients. Existing methodologies, as proposed by previous researchers, predominantly rely on PIM or photogrammetry, both of which grapple with unstable monitoring accuracy when procuring deformation information within regions offering significant deformation gradients. To attain more precise deformation information within such regions, the pivotal challenge lies in the phase unwrapping process intrinsic to InSAR. Several scholars have undertaken investigations into algorithms aimed at heightening the accuracy of phase unwrapping in InSAR, yielding promising outcomes concerning the restoration of phase within regions marked by substantial local noise [,,,,]. However, in the central region of the basin, typified by profound gradient deformation, conventional phase unwrapping methodologies, such as branch-cut and minimum cost flow (MCF), grapple with challenges in effectually unwrapping the interferometric phase. Consequently, some scholars have explored prior models, establishing the theoretical constraint relationship that exists between the actual LOS deformation phase and the predicted LOS deformation phase. They have formulated an InSAR phase unwrapping model, thereby deriving the recovered deformation phase, including the entire basin [,,,,,,,]. Shi et al. [] posited a novel PU algorithm, reinforced by the 2D elliptical Gaussian function, with the aim of heightening the accuracy of time-series LOS displacements over coal mining areas featuring pronounced displacement gradients. Jiang et al. [] harnessed the Boltzmann function prediction model (BPM) as an ancillary condition to facilitate interferometric phase unwrapping within mining areas. These research efforts have borne practical applications within specified mining areas employing C-band SAR data. Nonetheless, within plateau and hilly terrain areas, the intricate topographical alterations introduce an additional layer of complexity to surface deformation. This complexity, compounded by the influence of prior models and parameter errors, exacerbates the disparities between the predicted outcomes of the prior model and the actual deformation, thereby constraining the applicability of the deformation phase retrieval methodology. Hence, the crux of phase retrieval lies in the attainment of a more precise reference phase. Such a model would closely align with the subsidence basin, accounting for horizontal movement, and incorporate high-resolution UAV photogrammetry or UAV-based LiDAR. Additionally, the utilization of high-resolution L-band SAR data assumes pivotal significance in the context of phase retrieval within mining areas characterized by substantial deformation gradients.
Building upon this foundation, we introduce an open approach, denominated as the reference phase retrieval method, and elucidate its theoretical viability. The reference phase can be derived from any surface deformation source procured through monitoring or prediction methodologies. In this methodology, the reference deformation phase undergoes an initial subtraction from the actual deformation phase, culminating in the generation of the interferogram’s residual phase and the wrapped phase of said residual phase. Notably, it is posited that the fringe density characterizing the wrapped phase fringes within the residual phase is considerably diminished in comparison to that of the InSAR wrapped phase, thereby reducing the intricacy entailed in the phase unwrapping process. Ultimately, the unwrapping outcome converges with the reference phase, thereby facilitating phase retrieval. To operationalize this approach, we utilize Sentinel-1A and ALOS PALSAR-2 data, accompanied by PIM-derived results and GNSS-RTK monitoring results, as reference phases. These references are harnessed to conduct phase retrieval experiments within two mining areas. Subsequently, the displacement vector depression model is combined with the retrieved phase to compute subsidence, with the accuracy thereof corroborated via leveling data.
2. Methodology
2.1. Basic Theory of InSAR and Probability Integration Method
2.1.1. INSAR Technology
InSAR technology uses two SAR images of the same geographical area, each with slight geometric disparities, to engender the interferometric phase through conjugate multiplication. DInSAR, conversely, extends InSAR by incorporating an external DEM to emulate the terrain phase. The emulated terrain phase is then subtracted from the interferometric phase, thereby yielding surface deformation data. DInSAR includes various modalities, including the 2-pass differential, 3-pass differential, and 4-pass differential. Among these, the 2-pass differential interference technique stands as the most dependable and is compatible with readily accessible external DEM data. The processing sequence for DInSAR 2-pass differential is illustrated in Figure 1.
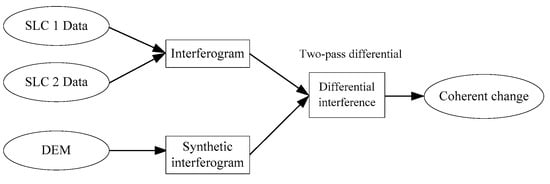
Figure 1.
2-pass DInSAR.
The extraction of surface deformation through DInSAR entails several pivotal steps, as follows. Differential interference: this includes baseline estimation, multi-look processing, registration, interferogram generation, interferogram flattening, interferogram filtering, and coherence computation. Phase unwrapping: this process entails setting an appropriate correlation threshold to unwrap the filtered phase, resolving the 2π ambiguity issue, and obtaining a precise deformation phase. Refinement and re-flattening: high-correlation areas devoid of surface deformation are chosen as ground control points (GCP) to compute phase offsets and enhance orbital parameter precision. Phase-to-displacement conversion and geocoding: this involves transforming the deformation phase into displacement values and geocoding into the WGS84 geographic coordinate system.
The coherence coefficient within interferometry serves as an indicator of the phase stability of the interferometric image pair. The quality of coherence profoundly influences the effectiveness of InSAR technology. Reduced or lost coherence poses challenges for geophysical property inversion and surface feature extraction. Coherence reduction is primarily influenced by the relative displacement of ground objects, delineated by the deformation gradient. The phase gradient signifies the ratio between the relative displacement difference of two points and their separation in the SAR coordinate system. The relative displacement difference is determined by the fringes between the points, inversely proportional to the wavelength. The maximum deformation gradient that InSAR can detect is constrained to one interference fringe within adjacent pixels:
where dmax is the maximum deformation gradient, µ′ represents the pixel’s edge length, and λ corresponds to the wavelength.
2.1.2. Basic Theory of PIM
The process of coal mining leads to the creation of distinctive and discontinuous structures within the rock mass. These structures include a variety of heterogeneous features, including cracks and faults. Building upon this understanding, J. Litwiniszyn, a scholar from Poland, conceptualized the rock mass as a granular medium. He introduced the theory of random medium to elucidate the movement of rocks []. Empirical evidence and theoretical principles have established notable similarities between the principles governing rock motion and the resultant surface shifts induced by mining, thereby aligning with the random medium model. Chinese researchers, including Liu Baochen and Liao Guohua, introduced the concept of random media to China during the 1960s []. Subsequently, they refined and developed this concept into the PIM. The PIM model represents the most extensively employed prediction technique for subsidence resulting from mining activities. This approach views the movement of rock strata as a stochastic process governed by statistical principles. Consequently, the surface deformation due to mining is mathematically expressed as an integral formula derived from the probability density function []. Assuming a working face with dimensions D1 × D2, the subsidence and maximum horizontal movement of any point (x, y) on the surface resulting from mining can be mathematically represented as follows []:
Among them:
where W0 is the maximum surface subsidence, m is mining thickness, q is the subsidence coefficient, and represents the coal seam dip angle. is the subsidence value of the surface point on the strike main section when the dip main section is fully mined, and is the subsidence value of the surface point on the dip main section when the strike main section is fully mined. H represents the average mining depth, and is the horizontal movement value of the points whose abscissa on the strike main section is x when the strike is fully mined. Moreover, is the horizontal movement of the points whose abscissa on the strike main section is y when the strike is fully mined. H1 and H2 are the mining depths in the uphill and downhill directions. is the tangent of the main influence angle; it is the ratio of the mining depth H to the main influence radius r and can be expressed as . Further, and are the tangents of the main influence angle in the uphill and downhill directions, respectively. s1 and s2 are the inflection point offset on the strike main section. Further, s3 and s4 are the inflection point offset on the dip main section. is the propagation angle of the mining influence. Further, b is the horizontal movement coefficient, which is the ratio of maximum subsidence W0 to maximum horizontal movement U0 and can be expressed as . b1 and b2 are the horizontal movement coefficients in the uphill and downhill directions, and is the direction with the maximum horizontal movement value (i.e., the direction of the horizontal movement vector), which is the angle of the counterclockwise rotation in the positive direction of the x-axis. is the inclination value of the surface point on the strike main section when the dip main section is fully mined, which is the first derivative of x in , and it can be expressed as . is the inclination value of the surface point on the dip main section when the strike main section is fully mined, which is the first derivative of y in , and it can be expressed as , where the character behind the semicolon in the right bracket of the equation represents the parameters. For example, t1 in represents the corresponding parameters of the mountain down boundary. The prediction parameters of PIM are derived from the measured or empirical values.
2.2. Research Methods
During phase unwrapping, phase continuity is the key to successful unwrapping, with correct unwrapping achieved when the difference between adjacent pixels falls within the range of (−2π, 2π). However, in regions with substantial deformation gradients within mining sites, the difference between adjacent pixels may exceed ±2π, posing challenges to accurate phase unwrapping. To address this challenge, Dr. Diao Xinpeng [] first introduced the phase unwrapping method using the probability integration method, which employs the deformation phase predicted by PIM as a reference phase for phase retrieval. This reference phase can also be obtained through alternative means such as UAV photogrammetry, airborne LiDAR, ground-based 3D laser scanning, and GNSS. UAV photogrammetry and UAV-based LiDAR provide information on surface subsidence using the difference of DEMs, while horizontal deformation can be achieved based on image registration algorithms [,]. GNSS-RTK enables the acquisition of high-precision subsidence and horizontal movement measurements. Both UAV and GNSS measurement techniques offer high-accuracy horizontal movement data, potentially enhancing the phase retrieval capability of the reference phase retrieval method. Subsequently, subsidence is computed using the retrieved phase in conjunction with the displacement vector depression model.
2.2.1. InSAR Deformation Phase Retrieval Method Combined with Reference Phase
According to the technical principles of DInSAR, the phase and of the LOS deformation, represented by the actual surface subsidence and horizontal movement u in the mining subsidence area, can be expressed as follows [,]:
where is the radar incidence angle, and γ is the difference between the azimuth angle of the LOS direction and the azimuth angle of the horizontal movement vector, which is the angle between the projection line of the LOS direction on the horizontal plane and the horizontal movement vector.
The phase of surface deformation can be represented by combining the wrapped phase and the integer ambiguities of the phase:
where is the phase of the actual LOS deformation, which is the sum of and , is the interferometric wrapped phase, and the value range is (, ), and is the integer ambiguities of the actual deformation phase.
The surface deformation obtained from various monitoring or prediction methods is transformed into phases and utilized as reference phases. According to (7), it can be expressed as follows:
where is the sum of the LOS phase corresponding to the measured subsidence and the LOS phase corresponding to the horizontal movement, is the interferometric wrapped phase, with a value range of (, ), and is the integer ambiguities of the deformation phase.
Consequently, the subtraction of the reference deformation phase from the actual deformation phase yields the residual phase and the wrapped phase of the residual phase in the interferogram:
where is the residual phase of the interferogram. is the wrapped phase of , and the expression is , whose value lies between and . is the integer ambiguities of the residual phase. At this point, the difference of between adjacent pixels is lower than the difference in the original interferogram, and the fringe density is reduced, reducing the difficulty of phase unwrapping and providing the possibility of retrieving the true deformed phase. Assuming that the wrapped phase of the residual phase in the interferogram is unwrapped, then the residual phase is obtained. Based on (9), the true phase of surface deformation can be represented as follows:
2.2.2. Subsidence Calculation Method Combined with Retrieved Phase with the Displacement Vector Depression Angle Model
The movement vector of the surface point in the mining area constitutes a three-dimensional vector pointing towards the center of the subsidence basin at a downward angle. The depression angle of the displacement vector refers to the angle between the direction of the surface point’s movement vector and the horizontal plane. This angle progressively increases from 0° to 90° as one moves from the edge of the subsidence basin towards its center. The calculation of the displacement vector depression angle model can be accomplished using the PIM []. Taking a horizontal working face’s strike main section as an example, and based on (4), the following expression can be derived:
Among them: .
In Equation (11), ε(x) represents the depression angle of the displacement vector at x on the strike main section, while and denote the subsidence and horizontal movement of the points on the strike main section, respectively. The horizontal movement coefficient is denoted as b, which is the ratio of the maximum horizontal movement value to the maximum subsidence value of the surface points on the strike main section when the mine is fully mined. The calculating length is l, which is calculated from .
Horizontal movement vector , vertical deformation vector , surface movement vector d, and LOS deformation vector monitored by InSAR have a spatial, relationship as shown in Figure 2. The variable ε represents the depression angle of the surface movement vector d, which denotes the angle between d and the horizontal plane. Additionally, ω denotes the vector angle between the surface movement vector d and the LOS direction.
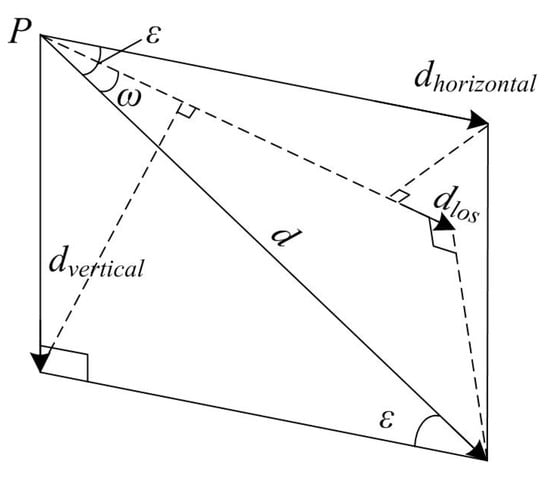
Figure 2.
Spatial relationship among and d.
The components of the surface movement vector d in the vertical and horizontal directions are and , respectively. The projection of the surface deformation vector in the LOS direction corresponds to the deformation vector captured by InSAR monitoring. The equation below expresses the vertical deformation []:
Among them, , and θ is the radar incidence angle.
3. Applicability Analysis and Simulation Experiment
3.1. Applicability of InSAR Deformation Phase Retrieval Method Combined with Reference Phase
As evident from (9), the accurate unwrapping of the phase initially wrapped in the interferogram, following the deduction of the reference phase from the real deformation phase, is of paramount importance for precise phase retrieval. Within regions characterized by substantial deformation gradients, the processed DInSAR interferograms often exhibit phase discontinuities. Figure 3 depicts both the normal wrapped phase and the wrapped phase with phase discontinuities.
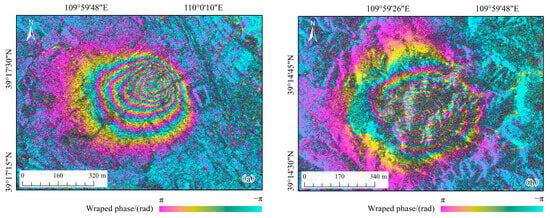
Figure 3.
Normal wrapped phase (a) and wrapped phase with phase discontinuities (b).
By observing Figure 3, it becomes evident that the interferogram’s phase exhibits periodic variations within the range of deformation gradients captured by InSAR. The phase value range of surface points is (, ), and the number of deformation phase cycles can be determined by the number of fringes. When phase hopping occurs in the wrapped phase, as illustrated, determining the actual deformation phase becomes unfeasible if the number of complete cycles of the deformation phase remains unknown.
The deformation gradient between neighboring pixels plays a pivotal role in determining the accuracy of deformation phase retrieval. Tilt, defined as the first derivative of subsidence, signifies the gradient change of subsidence. According to the fundamental principle of the PIM, the maximum inclination for surface points on the main section during semi-infinite mining is expressed as follows []:
Upon examination of Equation (13), it becomes evident that the resolution of SAR images plays a crucial role in determining the deformation gradient monitored by InSAR technology. To assess the applicability of the InSAR deformation phase retrieval method combined with reference phase under different SAR image resolutions and different radar wavelengths λ, assuming that there are two adjacent pixels i and i + 1 on the main section, i + 1 is close to the side of the goaf, and the phase of pixel i obtained by InSAR technology is . Based on (13), the difference in subsidence between adjacent pixels at the maximum inclination of the main section is as follows:
Due to the maximum horizontal movement and minimum horizontal deformation gradient at the maximum inclination point, horizontal movement has little effect on the phase difference of adjacent pixels; therefore, horizontal movement is not considered at this point. The phase difference of LOS deformation corresponding to (14) can be expressed as follows:
Then, the phase of pixel i +1 with respect to pixel i is as follows:
When utilizing a reference phase for retrieving the InSAR deformation phase, an error inevitably exists between the reference phase obtained through different methods and the actual deformation phase. The reference phase of pixel i is , and its expression is shown in (17). Assuming that there is a 10% error in the phase difference between adjacent pixels of the reference phase; then, the phase of pixel i + 1 can be represented by (18).
After subtracting the reference phase from the InSAR deformation phase, the remaining phase in the interferogram for pixels i and i + 1 can be expressed as follows:
By subtracting (20) from (19), the difference between the remaining phases of pixel i and i + 1 can be obtained as follows:
From Equation (21), it is evident that the difference in the remaining phases of adjacent pixels is only 10% of the actual phase difference between those pixels. As a result, the deformation phase gradient is significantly reduced, leading to a substantial decrease in fringe density. The decrease in fringe density mitigates the difficulties linked to phase unwrapping, thus improving the viability of phase retrieval. To exemplify this, let us examine ALOS PALSAR-2 data. If we assume a pixel size of 2 m, a primary influence radius of 100 m, a maximum subsidence of 4 m, and a radar incidence angle of 40 degrees, the greatest deformation disparity between neighboring pixels, as computed using Equation (15), totals 0.06 m. Nonetheless, based on (21), the deformation difference is further reduced to 0.006 m. This value is notably smaller than the threshold of 0.118 m that ALOS PALSAR-2 can accurately discern for deformation differences between proximate pixels. Similarly, when dealing with Sentinel-1 data, and maintaining a pixel size of 20 m while keeping other parameters unchanged, the maximum deformation difference between adjacent pixels is 0.6 m. However, in accordance with Equation (21), the deformation difference diminishes to 0.06 m. Based on the aforementioned analysis, it becomes apparent that in mining areas with available SAR data, the closer the resemblance between the reference phase and the true phase, the smaller the difference in the residual phase between neighboring pixels. Consequently, the accuracy of phase retrieval results based on the reference phase for the InSAR deformation phase improves, thereby enhancing its applicability.
3.2. Simulation Experiment
For computational convenience, we assume the presence of a horizontal working face with a primary section oriented in the east–west direction, measuring 300 × 600 m. The mining depth of the coal seam in this working face is 250 m, the maximum surface subsidence w0 is 3.5 m, the horizontal movement coefficient b is taken as 0.3, is taken as 1.6, and the inflection point offset is taken as 0 m. Utilizing the parameters mentioned above, we generate an actual subsidence basin based on Equation (2). Subsequently, we simulate the LOS subsidence basin using InSAR technology, following Equations (5) and (6). The basic parameters for C-band SAR data include ascending orbits, an 83.9° LOS azimuth, a radar incidence angle of 40°, and a wavelength (λ) of 56 mm. Figure 4 illustrates the simulated LOS deformation phase and the wrapped phase of the LOS deformation phase at an image resolution of 1 m.

Figure 4.
(a) LOS deformation phase. (b) Wrapped phase of LOS deformation phase.
Figure 4b illustrates the presence of phase discontinuities in the LOS deformation phase and its wrapped phase within the region characterized by significant deformation gradients in the subsidence basin. Consequently, conventional phase unwrapping methods such as MCF prove unworkable in this particular area. Hence, in practical scenarios, the PIM falls short of providing an accurate prediction of the actual surface deformation arising from mining subsidence. A modification of merely 10% in the predicted parameters quantifies the deviation from the genuine surface deformation. Using w0 = 3.2 m, b = 0.26, and as the prediction parameters, we generate the predicted LOS deformation phase as the reference phase for phase retrieval and then perform wrapping to obtain the LOS deformation phase wrapped phase. Referring to (9) (using the predicted phase to represent in the equation when calculating), we calculate the difference between the simulated real InSAR interferometric phase and the predicted InSAR interferometric phase and wrap them. Subsequently, the phase unwrapping process is performed on the wrapped phase to ascertain if the interferometric phase difference between the two interferograms can be acquired. To facilitate phase unwrapping experiments, a model and corresponding MATLAB programs are developed using simulated data. Figure 5 depicts both the wrapped phase and the unwrapped phase of the difference between the wrapped phases of the two interferograms.

Figure 5.
(a) Wrapped phase difference of the two interferograms. (b) Residual phase obtained from the wrapped phase.
Figure 5a reveals that the wrapped phase fringes, representing the difference in the wrapped phase between the two interferograms, are noticeably clearer and more distinct compared to the actual interferometric phase fringes shown in Figure 4b. Furthermore, the fringe density in Figure 5a is significantly lower than that observed in the genuine interferograms, aligning with the theoretical analysis in Section 3.1. The residual phase, derived from unwrapping the wrapped phase, is added to the predicted phase to obtain the simulated true deformation phase, as depicted in Figure 6. The disparity between the retrieved deformation phase and the original phase exhibits a relative error ranging from –0.001 to 0.001 rad (equivalent to a deformation error of 0.009 mm). This indicates the suitability of the proposed method for phase retrieval.
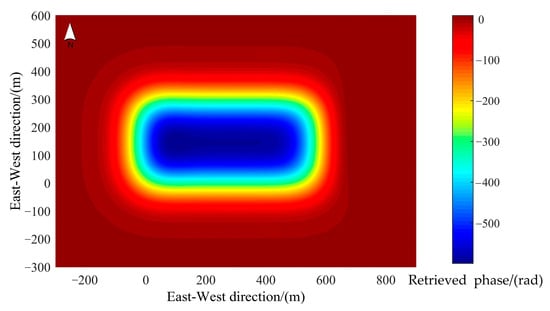
Figure 6.
Retrieved deformation phase.
The previously mentioned experiments utilized an image resolution of 1 m. However, when working with Sentinel-1 SAR data, which has a mapping resolution of 20 m, it becomes evident from Equation (1) that InSAR’s ability to monitor deformation gradients diminishes significantly. When there is a 10% alteration in predicted parameters, it can compromise the effectiveness of this deformation phase retrieval method. In Figure 7a, you can observe the wrapped phase difference between the two interferograms at a 20 m resolution. Notably, the central region of the basin displays phase jumps, making accurate phase unwrapping impossible. To provide a clearer visual explanation, let us consider the dip main section. Figure 7b illustrates the phase difference between the simulated actual deformation and the predicted deformation of the inclined main section at a 20 m resolution. At this resolution, InSAR can only monitor a maximum deformation difference of 0.028 m between adjacent pixels. In Figure 7b, the disparity below the red line exceeds 0.028 m, presenting challenges for accurate phase retrieval within this region.

Figure 7.
(a) Wrapped phase of wrapped phase difference. (b) Adjacent pixel difference between actual deformation and predicted deformation.
In analyzing the simulation experiment process and results, it becomes evident that the effectiveness of the phase retrieval method, when combined with the reference phase, is primarily influenced by factors such as image resolution, radar wavelength, and the rate of change in deformation disparity between the reference phase and the actual deformation. A more accurate reference phase leads to a smaller deviation from the true phase and increases the likelihood of the disparity between adjacent pixels falling within the range of (−2π, 2π). Consequently, there is a higher probability of successfully unwrapping the phase and accurately retrieving the true deformation phase. It is important to note that errors in phase retrieval results can arise due to the resampling of the deformation phase and the unwrapping of the residual deformation phase.
The above results demonstrate the theoretical application potential. However, in practical engineering scenarios, registration errors can significantly impact the method’s effectiveness. Additionally, factors such as noise and other influences further limit the regions where accurate retrieval using the reference phase method is possible, making them smaller than in the theoretical scenario [,]. To enhance the applicability of the reference phase retrieval method, exploring options such as using SAR data with higher resolution and longer wavelengths has been considered. For example, consider a horizontal working face oriented in the east–west direction, measuring 200 × 300 m. In this scenario, the utilization of L-band SAR data with the following parameters proves to be a crucial consideration: ascending orbits, 83.9° LOS azimuth, radar incidence angle of 42°, λ = 236 mm, and a mapping resolution of 2 m. Figure 8a shows the wrapped phase of LOS deformation simulated when the PIM inversion parameter is used. When the inversion parameters change by 20%, i.e.,, the wrapped phase of the difference of LOS phase simulated by the two groups of parameters is shown in Figure 8b, whose interference fringes become clearer and can be effectively unwrapped.

Figure 8.
(a) Wrapped phase of LOS deformation phase. (b) Wrapped phase of the difference between the wrapped phases of the two interferograms.
4. Real Data Experiment and Analysis
4.1. Study Area and Data
Shangwan Coal Mine, under the ownership of the Shendong Coal Group, holds significant importance as a production mine. This study is centered around the 12,401 working face within Shangwan Coal Mine. The surface elevation of this working face varies between 1188 and 1300 m, while the floor elevation ranges from 1043 to 1066 m. The coal seam has an average thickness of 9 m and an inclination of approximately 1 to 5°. The dimensions of the working face are 5000 m × 300 m, with a designed mining height of 8.6 m, and mining depths ranging from 150 to 250 m. The study area presents a hilly terrain plateau with relatively minor fluctuations. Sparse grasslands, bare sand, and shrubs predominantly cover the surface. Figure 9 offers an overview of the 12,401 working face, which is situated near the open-off cut area and the mining-stop area of the working face. In the upper right corner, there is a schematic diagram illustrating the orbit direction and LOS direction of the SAR data used in this article.
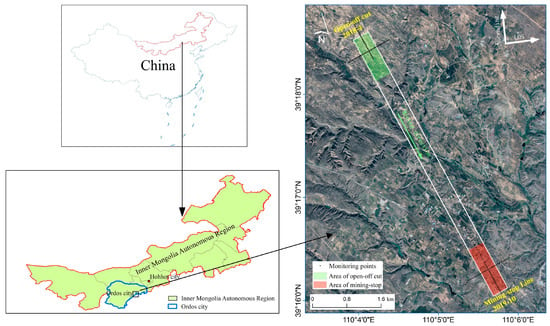
Figure 9.
Study area.
Experiment I focuses on the open-off cut of 12,401 as its research area. The data employed in this experiment comprise Sentinel-1A satellite data, precise orbit data, ALOS DEM, and certain measured data from the mining area. Sentinel-1A is an Earth observation satellite launched by the European Space Agency in April 2014. It operates in a near-polar solar synchronous orbit at an altitude of 693 km, with an inclination angle of 98.18°. This satellite offers a rapid revisit period of just 12 days and is equipped with a C-band synthetic aperture radar. Its radar system offers multiple imaging modes, including IW (interference wideband) mode, SM (stripe) mode, and EW (ultra-wideband) mode, enabling continuous Earth observation regardless of weather conditions. Due to the distinct characteristics of shallow burial and intense mining activities in the 12,401 working face, significant surface deformation occurs. Given the limited capability of Sentinel-1A data to monitor large deformation gradients, this study concentrates on two Sentinel-1A data acquisitions during the initial mining stage, specifically on 12 April 2018, and 24 April 2018.
The ALOS DEM provides a resolution of 12.5 m, offering superior terrain detail compared to NASA DEMs with resolutions of 30 m and 90 m. This enhanced resolution is instrumental in effectively eliminating terrain phase effects. GNSS-RTK measurements are conducted using six Trimble GPS units to monitor the entire network of monitoring points, with a frequency of one to two days. Additionally, the monitoring points on the main section are leveled on a daily basis. Figure 10 displays some images from the field survey operations.

Figure 10.
Images from the field study.
Experiment II focuses on the mining-stop area of the 12,401 working face and utilizes various data sources, including ALOS PALSAR-2, ALOS DEM, GNSS-RTK, and level measurements. The ALOS-2 satellite, Japan’s advanced land observation satellite successor, is the sole L-band SAR satellite currently in orbit, offering all-weather and all-day Earth observation capabilities. It surpasses its predecessor with enhanced mapping, regional monitoring, disaster monitoring, and resource investigation capabilities. ALOS-2 offers three observation modes: spotlight mode (1–3 m resolution, 25 km width), strip map mode (3–10 m resolution, 50–70 km width), and scanning mode (ScanSAR) (60–100 m resolution, 350–490 km width). This study utilizes two scenes of HH-polarized ALOS-2 data captured on 29 July 2019 and 12 August 2019, featuring ultra-fine mode strip data with approximately 2.1 m resolution in the distance direction and 1.77 m in the azimuth direction, along with a radar incidence angle of 42.21° and an azimuth angle of 83.95°. Figure 11 presents the interferogram and the unwrapped phase, obtained using the MCF method, within the study area.
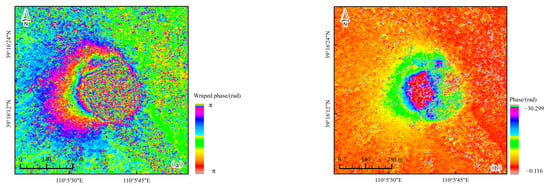
Figure 11.
(a) InSAR interferogram. (b) Unwrapped phase.
4.2. Experiment I: Phase Retrieval Based on PIM
4.2.1. DInSAR Data Processing
The processing of the two Sentinel-1A datasets using DInSAR technology is executed with the SARscape software. Consequently, the interferogram of the open-off cut area is generated, as depicted in Figure 12. This interferogram reveals two distinct deformation regions, denoted as Region (I) and Region (II), instead of a circular distribution. This pattern arises from the combined influence of the radar incidence angle and the deformation characteristics of the mining area. Due to the acute radar incidence angle, surface subsidence is observed along the LOS, indicating a sinking movement in the LOS direction. Region (I) exhibits horizontal movement in alignment with the LOS, resulting in heightened LOS deformation that may surpass the detectable deformation gradient of InSAR. In contrast, Region (II) displays horizontal movement opposing the LOS direction, reducing the deformation along the LOS and occasionally leading to surface uplift in the LOS direction. For a more comprehensive analysis, please refer to reference []. Region (III) corresponds to the central area of the subsidence basin and is characterized by inferior-quality interference fringes.
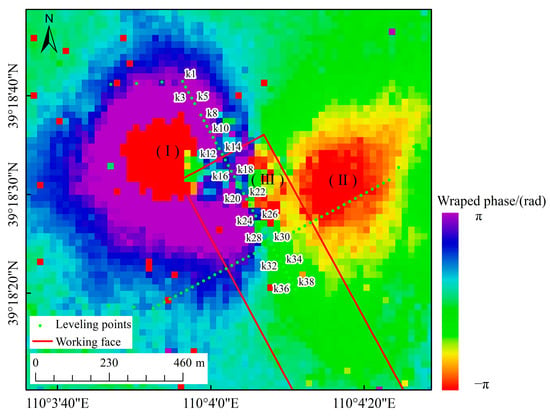
Figure 12.
Interferogram.
4.2.2. Phase Retrieval Based on PIM
The parameters of the PIM at the open-off cut of 12,401 working face are inverted by the measured leveling values, and the result is given as = [5.5; 0.5; 0.7; 1.7; 2.2; 25; 55]. Since the 12,401 working face is a near-horizontal coal seam, the tangents of the two main influence angles of the dip main section are considered to be the same and are represented by . S and S’ represent the calculating lengths of the strike main section and dip main section, respectively. On 24 April 2018, as the working face advanced by 115 m, the maximum surface subsidence reached approximately 1.55 m, with the maximum horizontal movement measuring around 0.76 m. In the open-off cut area, the radar incidence angle of Sentinel-1A was estimated to be approximately 40.85°, with a LOS azimuth angle of 83.9°. Utilizing these parameters, we calculated surface subsidence and horizontal movement, followed by the computation of the deformation phase using Equations (5) and (6). The resulting deformation phase was then wrapped. It is noteworthy that the predicted deformation phase obtained from the PIM method also indicates surface uplift in specific areas to the left of the advancing direction. This observation aligns with the DInSAR monitoring results of Sentinel-1A, as depicted in Figure 13.
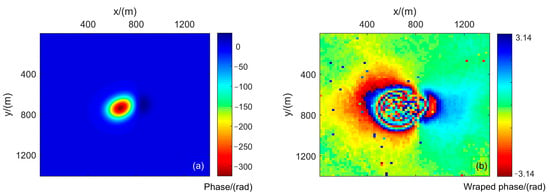
Figure 13.
(a) The predicted LOS deformation phase of PIM. (b) The wrapped phase of the wrapped phase difference.
The simulated deformation interference phase shown in Figure 13a acts as the reference phase. Next, we combine the interference phase from Sentinel-1A in Figure 12 with the reference phase to derive the wrapped phase of the residual phase in the interferogram, as demonstrated in Figure 13b, following Equation (9). After unwrapping, we add the reference phase to obtain the retrieved phase.
In Figure 14a, we observe the unwrapped phase of the remaining phase’s wrapped phase. Moving on to Figure 14b, the maximum phase obtained using the reference phase retrieval method measures approximately 337.37 radians. In contrast, Figure 14c displays the maximum phase unwrapped using the MCF method in the InSAR interferogram, which is only 6.7 radians, significantly lower than the actual deformation phase. We calculate the strike line depression angle using PIM parameters, as outlined in Equation (11), determining the strike line azimuth of the working face to be 151.1°. Consequently, we can calculate the subsidence of points on the strike main section in Figure 12 according to Equation (12). When comparing the leveling data with the subsidence values obtained by combining the reference phase retrieval method and the displacement vector depression model in Figure 15, we find that the maximum difference is 0.14 m, with a root mean square error (RMSE) of 0.05 m, accounting for 3.3% of the maximum subsidence. In contrast, Jiang et al. [] calculated three-dimensional deformation based on the Boltzmann function and subsidence characteristics, achieving an RMSE of subsidence compared to the measurement data, accounting for 9.4% of the maximum subsidence. This represents a 23.1% improvement in monitoring accuracy compared to the corresponding PIM prediction accuracy of 0.065 m. Errors in the edge areas of the basin are minimal, all within 0.01 m, while larger errors primarily occur in the central area of the basin. This can be attributed to the fact that at the resolution of Sentinel-1, the maximum deformation difference between adjacent pixels in the subsidence basin of the study area, as calculated by PIM, amounts to 0.16 m. This value exceeds the deformation difference of adjacent pixels (0.028 m) that can be monitored by Sentinel-1. The corresponding deformation difference of the residual phase between adjacent pixels, as determined by Equation (21), is approximately 0.016 m, slightly below 0.028 m. However, due to factors such as the accuracy of PIM prediction parameters, registration errors, resampling, terrain changes, and various sources of noise, the difference between the predicted deformation and the actual deformation may exceed the assumed value. As a result, the accuracy of phase retrieval based on PIM in regions with notable deformation gradients could be compromised.
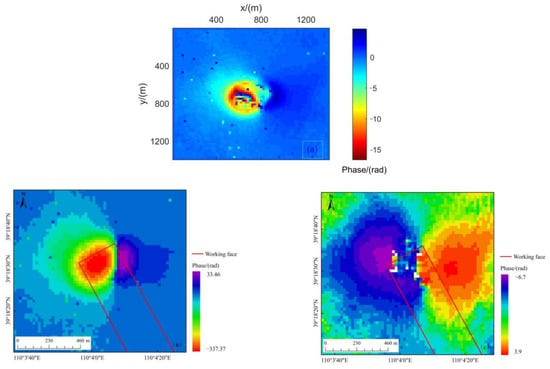
Figure 14.
(a) The wrapped phase of the wrapped phase difference. (b) The retrieved phase via the reference phase retrieval method. (c) The unwrapped phase of the InSAR interferogram.
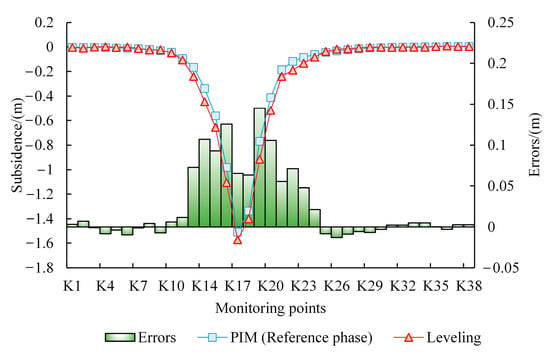
Figure 15.
Monitoring accuracy of reference phase retrieval method based on PIM.
4.3. Experiment II: Phase Retrieval Based on GNSS-RTK
4.3.1. GNSS-RTK Data Processing
RTK (real-time kinematic) is a real-time differential GPS (RTDGPS) technology based on carrier phase observations, marking a significant advancement in measurement technology. It comprises three key components: a GNSS base station, a data link, and a mobile station [,]. GNSS-RTK (global navigation satellite system real-time kinematic) delivers real-time 3D positioning results with centimeter-level accuracy []. In the periphery of the subsidence basin, where surface deformation is measured in centimeters or even millimeters, RTK maintains accuracy within the centimeter range. However, it is important to note that there exists a noticeable relative error in the RTK measurement values in this region. To obtain three-dimensional deformation information on the surface, we calculate the difference between two GNSS-RTK three-dimensional coordinates from two time periods. Given that the monitoring points in the research area are discrete and do not provide continuous surface deformation data, spatial interpolation becomes necessary for the GNSS-RTK monitoring results. Figure 16 offers an overview of the GNSS-RTK monitoring network points within the study area alongside the leveling points in the main section.
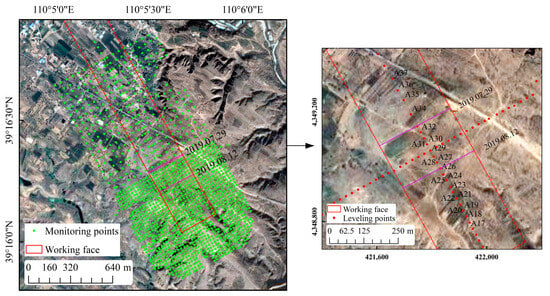
Figure 16.
GNSS-RTK monitoring points and leveling points.
The back-propagation neural network (BPNN), a well-established network architecture, including an input layer, a hidden layer, and an output layer, serves as a prevalent choice. Renowned for its capacity to model intricate nonlinear relationships, the BPNN represents one of the most commonly adopted network structures []. The three-layer BPNN is renowned for its potential to approximate any continuous function. In light of this, the BPNN is harnessed for spatial interpolation of GNSS-RTK monitoring outcomes in this study. The fundamental stages of BPNN include network weight initialization, forward propagation, error computation, backpropagation, network weight adjustment, and termination criteria. The comprehensive processing flow is illustrated in Figure 17.
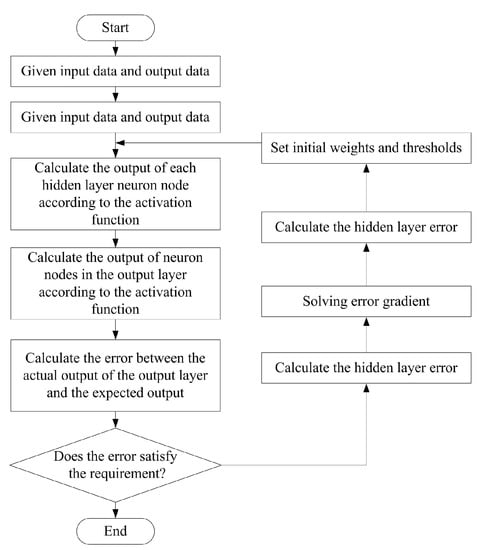
Figure 17.
BPNN process flow.
Within this study, the classical three-layer BPNN structure is applied. Data are initially fed into the hidden layer, where they undergo transformation via the activation function. The loss function is employed to measure the disparity between the forward propagation output and the actual value, facilitating adjustments to connection weights between neurons during subsequent iterations until the error descends below the predefined threshold. The range of the number of nodes within the hidden layer adheres to the formula , where n is the number of input layer nodes, l signifies the number of output layer nodes, and is a constant ranging between 1 and 10. Empirical exploration discerns the optimal number of nodes within the hidden layer to be 4 []. The learning rate is configured at 0.05, and the target training error is established at 0.001. Figure 18 portrays the interpolated horizontal movement deformation field, subsidence deformation field, and horizontal movement direction field derived from two distinct periods of GNSS-RTK monitoring data within the study area, employing the BPNN methodology. The pixel dimensions align with those of the InSAR results.

Figure 18.
(a) Subsidence deformation field. (b) Horizontal movement deformation field. (c) Horizontal deformation direction field.
The projection of horizontal deformation and vertical deformation monitored by GNSS-RTK to LOS direction can be determined as follows:
4.3.2. Phase Retrieval based on GNSS-RTK
The LOS deformation phase is computed using GNSS-RTK measurements, in accordance with Equation (22), and subsequently subjected to wrapping, as exemplified in Figure 19a. The PIM parameters for this region are ascertained based on measured leveling values. The maximum subsidence registers at 4.4 m, the tangent of the main influence angle is set to 1.6, the horizontal movement coefficient b is designated as 0.21, and the offsets for the inflection points of the strike main section and dip main section are stipulated as 10 m and 30 m, respectively. From 29 July 2019 to 12 August 2019, the working face progressed by approximately 195 m, including a width of 300 m. The PIM prognostications for this duration are depicted in Figure 19b.
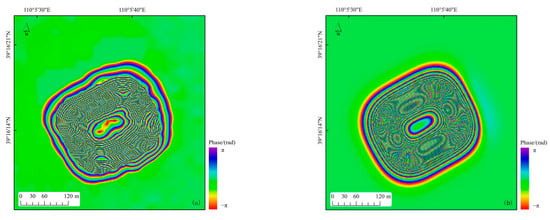
Figure 19.
The wrapped phase of GNSS-RTK (a) and PIM (b).
Phase retrieval is executed by using the reference phase retrieval method between the wrapped phase of GNSS-RTK and the wrapped phase of PIM. The phase retrieval result for both phases are exhibited in Figure 20, utilizing the reference phase repair method based on the interference phase of ALOS PALSAR-2.
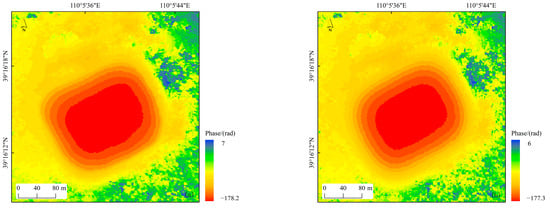
Figure 20.
Retrieved phase based on GNSS-RTK (a) and PIM (b).
The maximum phase difference between GNSS-RTK and PIM is quantified at 8.2 rad, corresponding to a deformation of approximately 154 mm. The RMSE for the phase discrepancy tallies at 2.8 radians, which corresponds to a deformation of 52 mm. The depression angle along the strike line is deduced through PIM parameters in compliance with Equation (11), considering a strike line azimuth angle of 151.1° for the working face. Subsequently, the subsidence of points along the strike line in Figure 16 is computed in line with Equation (12). The RMSE of the disparity between the subsidence values obtained via GNSS-RTK and PIM as the reference phases, compared to the measured values, materializes at 41 and 80 mm, respectively. The RMSE of subsidence includes a mere 0.91% and 1.8% of the maximum subsidence, respectively. The former reflects a 48.8% enhancement in accuracy in contrast to the latter. The comparison results are shown in Figure 21. In contrast, Jiang et al. [] measured three-dimensional deformation based on the retrieved phase, with the RMSE in relation to measurement data comprising 9.4% of the maximum subsidence. Employing the DPIM phase unwrapping technique and the three-dimensional deformation monitoring approach in mining territories, Jiang et al. [] gleaned surface subsidence, and the RMSE, as validated against measured data, stood at 3.5% of the maximum subsidence. A comparative analysis underscores that high-resolution L-band SAR data and GNSS-RTK measurements, which more faithfully mirror actual terrain conditions, are conducive to phase retrieval.
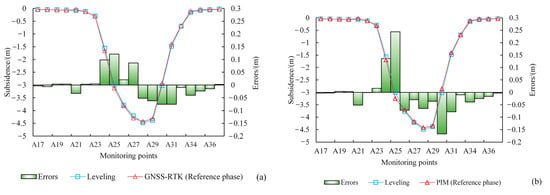
Figure 21.
Comparisons of monitoring accuracy. (a) Obtained subsidence using GNSS-RTK as the reference phase. (b) Obtained subsidence using PIM as the reference phase.
5. Discussion and Conclusions
5.1. Discussion
Deformation monitoring in mining areas characterized by significant deformation gradients poses a formidable challenge for InSAR technology. Other methodologies, such as photogrammetry and GNSS-RTK, rely on the subtraction of two-period data to estimate deformation, with precision ranging from centimeters to decimeters. In pursuit of achieving greater accuracy in the deformation phase for the entire basin, this study introduces an InSAR deformation phase retrieval method combined with a reference phase, substantiating its applicability through theoretical evidence. By conducting simulation experiments and practical applications utilizing Sentinel-1A and ALOS PALSAR-2 data, an improvement in the monitoring accuracy of the reference phase retrieval method is observed.
Accurately predicting parameters for PIM during the dynamic underground mining process is challenging, leading to significant disparities between predicted and actual deformations, which can impact the efficacy of the reference phase retrieval method. While GNSS-RTK can furnish subsidence and horizontal movement measurements, the results are both discrete and costly, rendering their application demanding. Therefore, within this study, GNSS-RTK primarily serves to assess the suitability of the reference phase retrieval method. Due to the constraints of data availability, alternative technologies such as UAV photogrammetry were not employed for further engineering applications.
The experimental results underscore that the applicability of the reference phase retrieval method is influenced by various factors, including SAR resolution, radar wavelength, deformation gradient, registration accuracy, and resampling. To attain more precise phase retrieval outcomes, the selection of the most suitable SAR data and the enhancement of data processing accuracy in engineering applications are imperative. Additionally, the presence of step cracks can introduce sharp spikes in local deformation gradients, posing challenges for phase unwrapping.
It is essential to recognize that the reference phase retrieval method hinges on the foundation of the InSAR interferometric phase map and operates within the constraints of deformation gradient theory. Its applicability is limited to cases where the surface deformation between adjacent pixels remains within one fringe.
5.2. Conclusions
The application of the reference phase retrieval method in simulation experiments and engineering applications culminates in the following conclusions:
- (1)
- The reference phase retrieval method effectively mitigates the deformation gradient between adjacent pixels, ameliorating the phase unwrapping challenge and establishing a theoretical basis for phase retrieval.
- (2)
- Experimental findings reveal that the performance of the reference phase retrieval method is influenced by factors including SAR resolution, radar wavelength, deformation gradient, registration accuracy, and resampling. L-band SAR data with higher resolution exhibited superior capabilities in reducing phase retrieval errors.
- (3)
- In Experiment I, the reference phase retrieval method, predicated on PIM and integrated with the depression model, accurately computed surface subsidence along the strike main section. Verification against leveling data yielded an RMSE of 0.05 m. In comparison, the corresponding prediction accuracy of PIM was 0.065 m. This method achieved a 23.1% enhancement in monitoring accuracy. In Experiment II, the RMSE of the subsidence difference calculated using GNSS-RTK and PIM as reference phases, compared to the measured values, stood at 41 mm and 80 mm, respectively. The former shows a 48.8% improvement in accuracy compared to the latter. These results underscore the applicability of the reference phase retrieval method for InSAR deformation phase retrieval in mining areas characterized by significant deformation gradients.
Author Contributions
Conceptualization, Z.W. and H.D.; methodology, Z.W.; software, Z.W. and J.R.; formal analysis, Z.W. and J.L.; investigation, Z.W. and Y.Y.; resources, H.D.; writing—original draft preparation, Z.W.; writing—review and editing, Z.W. and Y.Z.; visualization, Z.W.; supervision, Y.Z.; project administration, H.D. All authors have read and agreed to the published version of the manuscript.
Funding
This research was funded by the National Natural Science Foundation of China (Grant No. 51704205), the Bijie Science and Technology Project (Grant No. BKH [2035] 51),the Smart Geospatial Information Application Engineering Center (Grant No. BKH [2023] 8), the Karst Plateau Resources and Environment Remote Sensing Talent Team (Grant No. [2023] 14), the High Level and Innovative Talents Program of Guizhou Province (Grant No. [2021] 09), the Innovation Team of Universities in Guizhou Province for Mine Water Disaster Prevention and Control in the Southwest Karst Area (Grant No. [2023] 092), and the Natural Science Foundation of Guizhou Province (Grant No. [2020] 4001).
Data Availability Statement
Not applicable.
Acknowledgments
Thanks to all the field surveyors of Shangwan Mine.
Conflicts of Interest
The authors declare no conflict of interest.
Nomenclatures
| radar wavelength (m) | |
| maximum deformation gradient | |
| the edge length of the pixel (m) | |
| surface subsidence (m) | |
| horizontal movement (m) | |
| maximum subsidence (m) | |
| subsidence on the strike main section (m) | |
| subsidence on the dip main section (m) | |
| horizontal movement on the strike main section (m) | |
| horizontal movement on the dip main section (m) | |
| direction with the maximum horizontal movement (m) | |
| tangent of the main influence angle | |
| , | tangents of the main influence angle in the uphill and downhill directions |
| average mining depth (m) | |
| , | mining depth in the uphill and downhill directions (m) |
| , | inflection point offset on the strike main section. When s1 = s2, denoted as S (m) |
| , | inflection point offset on the dip main section. When s1 = s2, denoted as (m) |
| coal seam dip angle (°) | |
| the propagation angle of the mining influence (°) | |
| horizontal movement coefficient | |
| , | horizontal movement coefficients in the uphill and downhill directions |
| , | LOS phase corresponding to subsidence and horizontal movement (rad) |
| radar incidence angle (°) | |
| the angle between azimuth of the LOS and the horizontal movement vector (°) | |
| , | actual phase and reference phase (rad) |
| , | actual wrapped phase and reference wrapped phase (rad, [, ]) |
| , | integer ambiguities of the actual deformation phase and the reference phase |
| residual phase of the interferogram (i.e., difference between actual phase and the reference) | |
| depression angle of the displacement vector at x on the strike main section (°, (0, 90]) | |
| deformation vector | |
| horizontal movement vector | |
| subsidence vector | |
| LOS deformation vector | |
| vector angle between the surface deformation vector and the LOS direction (°) | |
| subsidence difference between adjacent pixels (m) | |
| phase difference between adjacent pixels (rad) | |
| , | vertical deformation and horizontal deformation monitored by GNSS-RTK (m) |
References
- Wang, Y.J. Research progress and prospect on ecological disturbance monitoring in mining area. Acta Geod. Cartogr. Sin. 2017, 46, 1705–1716. [Google Scholar]
- Zhang, X.B.; Yang, P.X.; Zhou, M.Z. Multireceiver SAS imagery with generalized PCA. IEEE Geosci. Remote Sens. Lett. 2023, 20, 1502205. [Google Scholar] [CrossRef]
- Huang, P.; Yang, P.X. Synthetic aperture imagery for high-resolution imaging sonar. Front. Mar. Sci. 2022, 9, 1049761. [Google Scholar] [CrossRef]
- Gabriel, A.K.; Goldstein, R.M.; Zebker, H.A. Mapping small elevation changes over large areas: Differential radar interferometry. J. Geophys. Res. Solid Earth 1989, 94, 9183–9191. [Google Scholar] [CrossRef]
- Liu, X.; Zhu, W.; Lian, X.; Xu, X. Monitoring Mining Surface Subsidence with Multi-Temporal Three-Dimensional Unmanned Aerial Vehicle Point Cloud. Remote Sens. 2023, 15, 374. [Google Scholar] [CrossRef]
- Luo, M.; Tian, Y.; Zhang, S.; Huang, L.; Wang, H.; Liu, Z.; Yang, L. Individual Tree Detection in Coal Mine Afforestation Area Based on Improved Faster RCNN in UAV RGB Images. Remote Sens. 2022, 14, 5545. [Google Scholar] [CrossRef]
- He, G.Q. Mining Subsidence; China University of Mining and Technology Press: Xuzhou, China, 1991. [Google Scholar]
- Brunori, C.A.; Murgia, F. Spatiotemporal Evolution of Ground Subsidence and Extensional Basin Bedrock Organization: An Application of Multitemporal Multi-Satellite SAR Interferometry. Geosciences 2023, 13, 105. [Google Scholar] [CrossRef]
- Carnemolla, F.; De Guidi, G.; Bonforte, A.; Brighenti, F.; Briole, P. The ground deformation of the south-eastern flank of Mount Etna monitored by GNSS and SAR interferometry from 2016 to 2019. Geophys. J. Int. 2023, 234, 664–682. [Google Scholar] [CrossRef]
- Blachowski, J.; Ellefmo, S.L. Mining Ground Deformation Estimation Based on Pre-Processed InSAR Open Data—A Norwegian Case Study. Minerals 2023, 13, 328. [Google Scholar] [CrossRef]
- Modeste, G.; Doubre, C.; Masson, F. Time evolution of mining-related residual subsidence monitored over a 24-year period using InSAR in southern Alsace, France. Int. J. Appl. Earth Obs. Geoinf. 2021, 102, 102392. [Google Scholar] [CrossRef]
- Fielding, E.J.; Sangha, S.S.; Bekaert, D.P.S.; Samsonov, S.V.; Chang, J.C. Surface Deformation of North-Central Oklahoma Related to the 2016Mw 5.8 Pawnee Earthquake from SAR Interferometry Time Series. Seismol. Res. Lett. 2017, 88, 971–982. [Google Scholar] [CrossRef]
- Hooper, A.; Zebker, H.; Segall, P.; Kampes, B. A new method for measuring deformation on volcanoes and other natural terrains using InSAR persistent scatterers. Geophys. Res. Lett. 2004, 31, L23611. [Google Scholar] [CrossRef]
- Carnec, C.; Massonnet, D.; King, C. Two examples of the use of SAR interferometry on displacement fields of small extent. Geophys. Res. Lett. 1996, 23, 3579–3582. [Google Scholar] [CrossRef]
- Colesanti, C.; Le Mouelic, S.; Bennani, M.; Raucoules, D.; Carnec, C.; Ferretti, A. Detection of mining related ground instabilities using the permanent scatterers technique: A case study in the east of France. Int. J. Remote Sens. 2005, 26, 201–207. [Google Scholar] [CrossRef]
- Ng, H.M.; Ge, L.; Yan, Y.; Li, X.; Chang, H.C.; Zhang, K.; Rizos, C. Mapping accumulated mine subsidence using small stack of sar differential interferograms in the southern coalfield of new south wales, australia. Eng. Geol. 2010, 115, 1–15. [Google Scholar] [CrossRef]
- Pawluszek-Filipiak, K.; Borkowski, A. Integration of DInSAR and SBAS Techniques to Determine Mining-Related Deformations Using Sentinel-1 Data: The Case Study of Rydułtowy Mine in Poland. Remote Sens. 2020, 12, 242. [Google Scholar] [CrossRef]
- Kopec, A. Long-term monitoring of the impact of the impact of mining operations on the ground surface at the regional scale based on the InSAR-SBAS technique, the Upper Silesian Coal Basin (Poland). Case study. Acta Geodyn. Geomater. 2021, 19, 93–110. [Google Scholar] [CrossRef]
- Liu, M.; Long, S.; Wu, W.; Liu, P.; Zhang, L.; Zhu, C. Instability Monitoring and Numerical Analysis of Typical Coal Mines in Southwest China Based on DS-InSAR. Sensors 2022, 22, 7811. [Google Scholar] [CrossRef]
- Hanssen, R.F. Radar Interferometry: Data Interpretation and Error Analysis; Kluwer Academic: Dordrecht, The Netherlands, 2001. [Google Scholar]
- Zhu, J.J.; Yang, Z.F.; Li, Z.W. Recent progress in retrieving and predicting mining induced 3D displacements using InSAR. Acta Geod. Cartogr. Sin. 2019, 48, 135–144. [Google Scholar] [CrossRef]
- Yang, Z.; Li, Z.; Zhu, J.; Yi, H.; Hu, J.; Feng, G. Deriving Dynamic Subsidence of Coal Mining Areas Using InSAR and Logistic Model. Remote Sens 2017, 9, 125. [Google Scholar] [CrossRef]
- Zhao, G.; Wang, L.; Deng, K.; Wang, M.; Xu, Y.; Zheng, M.; Luo, Q. An Adaptive Offset-Tracking Method Based on Deformation Gradients and Image Noises for Mining Deformation Monitoring. Remote Sens. 2021, 13, 2958. [Google Scholar] [CrossRef]
- Luo, H.B.; Li, Z.H.; Chen, J.J.; Pearson, C.; Wang, M.; Lv, W.; Ding, H. Integration of range split spectrum interferometry and conventional InSAR to monitor large gradient surface displacements. Int. J. Appl. Earth Obs. Geoinf. 2019, 74, 130–137. [Google Scholar] [CrossRef]
- Zhou, D.W.; Qi, L.Z.; Zhang, D.M.; Zhou, B.H.; Guo, L.L. Unmanned Aerial Vehicle (UAV) Photogrammetry Technology for Dynamic Mining Subsidence Monitoring and Parameter Inversion: A Case Study in China. IEEE Access 2020, 8, 16372–16386. [Google Scholar] [CrossRef]
- Zheng, J.; Yao, W.; Lin, X.; Ma, B.; Bai, L. An Accurate Digital Subsidence Model for Deformation Detection of Coal Mining Areas Using a UAV-Based LiDAR. Remote Sens. 2022, 14, 421. [Google Scholar] [CrossRef]
- Benoit, L.; Gourdon, A.; Vallat, R.; Irarrazaval, I.; Gravey, M.; Lehmann, B.; Prasicek, G.; Gräff, D.; Herman, F.; Mariethoz, G. A high-resolution image time series of the Gorner Glacier—Swiss Alps—Derived from repeated unmanned aerial vehicle surveys. Earth Syst. Sci. Data 2019, 11, 579–588. [Google Scholar] [CrossRef]
- Puniach, E.; Gruszczyński, W.; Stoch, T.; Mrocheń, D.; Ćwiąkała, P.; Sopata, P.; Pastucha, E.; Matwij, W. Determination of the coefficient of proportionality between horizontal displacement and tilt change using UAV photogrammetry. Eng. Geol. 2023, 312, 106939. [Google Scholar] [CrossRef]
- Puniach, E.; Gruszczyński, W.; Ćwiąkała, P.; Matwij, W. Application of UAV-based orthomosaics for determination of horizontal displacement caused by underground mining. ISPRS J. Photogramm. Remote Sens. 2021, 174, 282–303. [Google Scholar] [CrossRef]
- Chen, Y.; Tao, Q.X.; Liu, G.L.; Wang, L.Y.; Wang, F.Y.; Wang, K. Detailed mining subsidence monitoring combined with InSAR and probability integral method. Chin. J. Geophys. 2021, 64, 3554–3566. [Google Scholar]
- He, X.F.; Gao, Z.; Xiao, R.Y.; Luo, H.B.; Jia, D.Z.; Zhang, Z.T. Application and prospect of the integration of InSAR and BDS/GNSS for landsurface deformation monitoring. Acta Geod. Cartogr. Sin. 2022, 51, 1338–1355. [Google Scholar]
- Fan, H.D.; Gao, X.X.; Yang, J.K.; Deng, K.Z.; Yu, Y. Monitoring Mining Subsidence Using a Combination of Phase-Stacking and Offset-Tracking Methods. Remote Sens. 2015, 7, 9166–9183. [Google Scholar] [CrossRef]
- Fan, H.D.; Li, T.T.; Gao, Y.T.; Deng, K.Z.; Wu, H.G. Characteristics inversion of underground goaf based on InSAR techniques and PIM. Int. J. Appl. Earth Obs. Geoinf. 2021, 103, 102526. [Google Scholar] [CrossRef]
- Ma, J.; Yang, J.; Zhu, Z.; Cao, H.; Li, S.; Du, X. Decision-making fusion of InSAR technology and offset tracking to study the deformation of large gradients in mining areas-Xuemiaotan mine as an example. Front. Earth Sci. 2022, 10, 962362. [Google Scholar] [CrossRef]
- Zhou, D.W.; Wang, L.; An, S.K.; Wang, X.P.; An, Y.F. Integration of unmanned aerial vehicle (UAV)-based photogrammetry and InSAR for mining subsidence and parameters inversion: A case study of the Wangjiata Mine, China. Bull. Eng. Geol. Env. 2022, 81, 343. [Google Scholar] [CrossRef]
- Zhang, Y.; Lian, X.; Ge, L.; Liu, X.; Du, Z.; Yang, W.; Wu, Y.; Hu, H.; Cai, Y. Surface Subsidence Monitoring Induced by Underground Coal Mining by Combining DInSAR and UAV Photogrammetry. Remote Sens. 2022, 14, 4711. [Google Scholar] [CrossRef]
- Mao, W.; Wang, S.; Xu, B.; Li, Z.; Zhu, Y. An Improved Phase Unwrapping Method Based on Hierarchical Networking and Constrained Adjustment. Remote Sens. 2021, 13, 4193. [Google Scholar] [CrossRef]
- Liu, W.; Bian, Z.; Liu, Z.; Zhang, Q. Evaluation of a Cubature Kalman Filtering-Based Phase Unwrapping Method for Differential Interferograms with High Noise in Coal Mining Areas. Sensors 2015, 15, 16336–16357. [Google Scholar] [CrossRef] [PubMed]
- Conroy, P.; van Diepen, S.A.N.; Van Asselen, S.; Erkens, G.; van Leijen, F.J.; Hanssen, R.F. Probabilistic Estimation of InSAR Displacement Phase Guided by Contextual Information and Artificial Intelligence. IEEE Trans. Geosci. Remote Sens. 2022, 60, 5234611. [Google Scholar] [CrossRef]
- Heshmat, S.; Tomioka, S.; Nishiyama, S. Performance Evaluation of Phase Unwrapping Algorithms for Noisy Phase Measurements. Int. J. Optomechatronics 2014, 8, 260–274. [Google Scholar] [CrossRef]
- Rosa-Miranda, E.; de la Gonzalez-Ramirez, E.; Villa-Hernandez, J.J.; Berriel-Valdos, L.R.; Olvera-Olvera, C.; Rosa-Vargas, J.I.; de la Saucedo-Anaya, T.; Olague, J.G.A.; Alaniz-Lumbreras, D.; Castano, V.M. An alternative method for phase-unwrapping of interferometric data. J. Eur. Opt. Soc. Rapid Publ. 2014, 9, 14040. [Google Scholar] [CrossRef]
- Fan, H.; Lu, L.; Yao, Y. Method Combining Probability Integration Model and a Small Baseline Subset for Time Series Monitoring of Mining Subsidence. Remote Sens. 2018, 10, 1444. [Google Scholar] [CrossRef]
- Diao, X.P.; Wu, K.; Xu, Y.K.; Zhou, D.W.; Chen, R.L. Prediction-based phase unwrapping for differential interferograms of coal mining areas using a stochastic medium model. Remote Sens. Lett. 2018, 9, 478–487. [Google Scholar] [CrossRef]
- Jiang, C.; Wang, L.; Yu, X.X.; Wei, T.; Chi, S.; Guo, Q. Prediction of 3D deformation due to large gradient mining subsidence based on InSAR and constraints of IDPIM model. Int. J. Remote Sens. 2021, 42, 188–219. [Google Scholar] [CrossRef]
- Jiang, C.; Wang, L.; Yu, X.X.; Chi, S.; Wei, T.; Wang, X. DPIM-Based InSAR Phase Unwrapping Model and a 3D Mining-Induced Surface Deformation Extracting Method: A Case of Huainan Mining Area. KSCE J. Civ. Eng. 2022, 25, 654–668. [Google Scholar] [CrossRef]
- Jiang, C.; Wang, L.; Yu, X.; Lv, W.; Yang, X. A New Method of Monitoring 3D Mining-Induced Deformation in Mountainous Areas Based on Single-Track InSAR. KSCE J. Civ. Eng. 2022, 26, 2392–2407. [Google Scholar] [CrossRef]
- Shi, J.; Yang, Z.; Wu, L.; Niu, J. Large-Gradient Interferometric Phase Unwrapping Over Coal Mining Areas Assisted by a 2-D Elliptical Gaussian Function. IEEE Geosci. Remote Sens. Lett. 2022, 19, 4516405. [Google Scholar] [CrossRef]
- Jiang, K.; Yang, K.; Zhang, Y.; Li, Y.; Li, T.; Zhao, X. An Extraction Method for Large Gradient Three-Dimensional Displacements of Mining Areas Using Single-Track InSAR, Boltzmann Function, and Subsidence Characteristics. Remote Sens. 2023, 15, 2946. [Google Scholar] [CrossRef]
- Wang, Z.; Dai, H.; Yan, Y.; Liu, J.; Ren, J. Combination of InSAR with a Depression Angle Model for 3D Deformation Monitoring in Mining Areas. Remote Sens. 2023, 15, 1834. [Google Scholar] [CrossRef]
- Wempen, J.M.; Mccarter, M.K. Comparison of L-band and X-band differential interferometric synthetic aperture radar for mine subsidence monitoring in central Utah. Int. J. Min. Sci. Technol. 2017, 27, 159–163. [Google Scholar] [CrossRef]
- Dao, T.H.D.; Alves, P.; Lachapelle, G. Performance Evaluation of Multiple Reference Station GPS RTK for a Medium Scale Network. J. Glob. Position. Syst. 2004, 3, 173–182. [Google Scholar] [CrossRef]
- Mutluoglu, O.; Ceylan, A. An Investigation on Cost and Accuracy Analysis of Real-Time Kinematic GPS Method in Acquisition of Spatial Data for GIS. Inf. Technol. J. 2009, 8, 929–933. [Google Scholar] [CrossRef][Green Version]
- Meron, M.; Chen, A.; Rabinovitz, O.; Traub, E.; Levine-Orlov, V.; Marchaim, U. Water distribution analysis of a linear move irrigator by aerial survey and RTK-GNSS monitors. Precis. Agric. 2022, 23, 894–911. [Google Scholar] [CrossRef]
- Huang, X.; Jiang, P.; Li, M.; Zhao, X. Applicable Framework for Evaluating Urban Vitality with Multiple-Source Data: Empirical Research of the Pearl River Delta Urban Agglomeration Using BPNN. Land 2022, 11, 1901. [Google Scholar] [CrossRef]
- Cai, R.; Cui, Y.; Xue, P. Research on the methods of determining the number of hidden nodes in three-layer BP neural network. Comput. Inf. Technol. 2017, 25, 29–33. [Google Scholar]
Disclaimer/Publisher’s Note: The statements, opinions and data contained in all publications are solely those of the individual author(s) and contributor(s) and not of MDPI and/or the editor(s). MDPI and/or the editor(s) disclaim responsibility for any injury to people or property resulting from any ideas, methods, instructions or products referred to in the content. |
© 2023 by the authors. Licensee MDPI, Basel, Switzerland. This article is an open access article distributed under the terms and conditions of the Creative Commons Attribution (CC BY) license (https://creativecommons.org/licenses/by/4.0/).