Abstract
Road traffic is occasionally blocked by landslide geological disasters in remote mountainous areas, causing obstruction to economic society and national defense construction. It is vital to conduct landslide geological disaster risk assessment and vulnerability research on the road network. Based on landslide geological disaster risk on the road network, this study analyzed the potential effects of the main environmental elements. Due to the lack of previous research works, this study proposed an effective, rational, and understandable multicriteria heuristic analytical hierarchy process model, fuzzy comprehensive evaluation, and frequency ratio-interactive fuzzy stack analysis for vulnerability assessment of road networks in large and complex networks. Based on the comprehensive use of geographic information technology, the road network vulnerability of Tibet in China was evaluated by introducing slope, topographic relief, normalized difference vegetation index (NDVI), annual mean precipitation, distance from river drainage, glaciers and snow, habitation, seismic center and geological fault zone, and soil erosion intensity. According to the findings of the study, the three-stage framework proposed in this study can provide correct inferences and explanations for the potential phenomena of landslide geological disasters; the geological disaster risk are unevenly distributed in the study area; the distribution of the road network vulnerability in China’s Tibet significantly differs among different cities; the high-vulnerability section presents significant regional characteristics, which overlap with the area with a high risk of landslide geological disasters, and its distribution is mostly located in traffic arteries, link aggregations, and relatively frequent human activity.
1. Introduction
Geological disasters occur frequently in China annually. As the main type of collapse and landslide (hereinafter referred to as “landslide”) these geological disasters have caused huge losses to the country, economy, and society [1,2,3,4]. According to a report by the Highway Bureau of the Ministry of Transport in 2020, the total mileage of road disasters will exceed 6000 km and the direct loss of road production costs will reach CNY 22.8 billion [5]. The road failure caused by landslide blocking or even burying, the vulnerability of the road network is constantly exposed. Landslide geological disasters may greatly impact the transport capacity of nearby roads. Keeping major highways open, in particular, is crucial for supporting the functioning of the economy, society, and people. Therefore, the risk assessment of road landslide geological disasters is particularly important. The topography of Tibet in China is very complex, with various types of landform. The natural conditions of the surface are particularly obvious, and landslide geological disasters are widely experienced. The occurrence of landslide geological disasters is closely related to topography, geological structure, stratigraphic lithology, hydrology condition, human activity, and other factors. Owing to the complexity of the formation mechanism, no set of risk assessment systems is suitable for all areas, and factor selection is generally determined by the specific conditions of the study area [6,7]. Over the past few decades, various risk assessment methods for geological disasters have been developed worldwide, including analytical hierarchy process (AHP) [8], field surveys [8], satellite remote sensing [9], statistical models [10], deterministic coefficients, and machine learning [11,12,13]. It was found that previous studies were mostly from single models or combinations of several models, which obtained the risk susceptibility degree and partition but lacked research models with excellent hierarchical measures and high efficiency.
Vulnerability is a measure of the degree of disaster-bearing damage, which is an important link in disaster damage estimation and risk assessment and a bridge between disaster factors and situations. Through a literature review and analysis, it was found that the vulnerability evaluation factor mainly focuses on state and structural vulnerabilities [14,15,16], and vulnerability analysis methods include single analysis, multidimensional evaluation, optimization methods, and multiobjective algorithms [17,18,19,20,21]. Vulnerability has been analyzed and applied in power lines [22], communication networks, transportation [23], natural gas pipelines [24], urban flooding [25], emergency rescue [26], world heritage sites [27], and many more. The research on the vulnerability of road networks originated from the 1995 Kobe earthquake in Japan and the terrorist incidents on 11 September 2001. The 7.2-magnitude earthquake in Kobe, Japan damaged almost all transportation systems around the city, and the terrorist attacks of September 11th exposed transportation vulnerability to road network disruptions [28]. The concept of road network vulnerability was first proposed by Berdica, who believed that the vulnerability of a road transport system is a sensitive factor subject to a significant decrease in the service level of the road network [29]. Taylor et al. also defined the vulnerability of road networks from a similar point of view [30]; they believe that the vulnerability of the network depends on whether the accessibility of the network is greatly reduced after a few nodes (sections of road) are removed. Subsequently, other scholars insisted on an expression of vulnerability and risk, and vulnerability needs to be defined in the scope of risk degree. Some scholars such as Sohn tried to explain the vulnerability of road network more precisely. They connected the vulnerability of road networks with the probability and consequences of risks, and believed that the vulnerability, reliability, and risk of road networks were closely related concepts [31]. A statistical model was developed to reveal and quantify the main factors defining transport related consequences [32]; the integrated equilibrium model of traffic demand change [33], the attacker–defender model [34], which this research on road networks has promoted, has progressed road network research to a certain extent. It should be pointed out that these scenario-based evaluation methods, strategy-based evaluation methods, simulation-based evaluation methods and mathematical model evaluation methods have their own advantages and disadvantages. How to use them together or propose more effective methods to better evaluate the vulnerability of the road network is also worth studying [35]. Research on road network vulnerability has gained increasing attention in recent years. Significant changes have taken place in the study of road network vulnerability, including the study and application of multidimensional assessment, multiobjective algorithms, and optimization methods [19]. Road network vulnerability is an inherent attribute of the traffic network, which reflects the degree of overall service level decline when the road network is affected by natural disasters, traffic accidents or road maintenance. There is no unified definition of road network vulnerability, owing to a lack of clear measures. Although the global attack–defense model and map of landslide sensitivity, analysis of the road transportation network vulnerability, travel mode, and travel time affect the capacity and emissions [36,37], capacity-weighted spectrum analysis is used to identify potential key links, cloud model-based urban road network traffic system congestion status, and many road vulnerability and risk assessment studies [14,20,21,38,39]. However, vulnerability analysis application in road disasters research is still in the exploration and development stages, and its theory and methods require further improvement. The precise assessment of road network vulnerability is difficult because of the uncertainty and complexity of environmental differences and vulnerability-related events along roads [28]. As the road network system is confronted with multiple disturbances, it is necessary to propose more effective, rational, and understandable methods for vulnerability assessment of road networks in large and complex networks [30]. It is worth noting that road network vulnerability evaluation is particularly urgent and meaningful in remote mountainous areas [4,40].
In the above context, this study proposed a reasonably efficient and well-measured hierarchical research paradigm and model to predict vulnerability to geological disasters in high mountainous areas; exploring the correlation between landslide geological disaster risk and different environmental elements [41] and predicting the impact of regional landslide geological disaster risks on road networks to provide a scientific basis and technical support for taking measures to reduce vulnerability and loss. The remainder of this article is structured as follows. Section 2 describes the study area overview, datasets, and processing. In Section 3, the methods and models used in the case study are described. Section 4 introduces the risk assessment of geological hazards and the results of the road network vulnerability. Section 5 is the discussion followed by the conclusion.
2. Materials
2.1. Overview of the Study Area
The Tibet Autonomous Region is in the southwest of the Qinghai–Tibet Plateau, between north latitude 26°50′ to 36°53′ and east longitude 78°25′ to 99°06′. The region has jurisdiction over six prefecture-level cities and one region (Figure 1) with a land area of 1,202,800 km2, accounting for approximately one-eighth of China’s total area. The climate of Tibet is unique, complex, and diverse, showing characteristics of cold and dry conditions in the northwest and warm and humid conditions in the southeast. The vertical zonality is very significant. Mountains, glaciers, lakes, rivers, large terrain fluctuations, rock layer weathering and crushing, and geological conditions are complex. Tibet has a fragile ecological environment and poor economic and social development. As an area sensitive to global climate change, its strategic position is extremely important. In the context of the current century of change and the epidemic situation, road traffic not only represents infrastructure connectivity, but also represents the smooth flow of trade and people. By the end of 2020, the length of highway open to traffic in Tibet exceeded 117,000 km. In 2020, Tibet’s annual cargo transport turnover reached 15.818 billion ton/km, of which 11.673 billion ton/km were transported by road. Simultaneously, Tibet’s natural environment is complex, and mountain collapses and landslides occur frequently, with widespread distribution and serious harm, resulting in dangerous roads and necessitating higher requirements for high-quality transportation infrastructure construction in Tibet and economic and social development promotion.
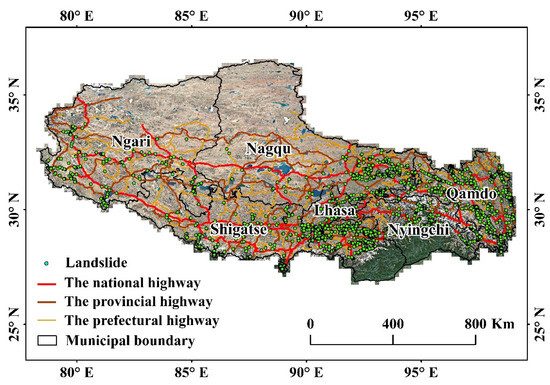
Figure 1.
Geographical location map of study area.
2.2. Data Sources and Preprocessing
2.2.1. Data Collection
Raw data were used for road network vulnerability evaluation, including occurrence of landslide geological disasters in the study area, national to prefectural roads, ASTER GDEM(DEM), normalized difference vegetation index(NDVI), annual mean precipitation, river systems, China’s second glacier cataloging dataset [42], geological fault zone, seismic center, soil erosion, and habitation (Table 1).

Table 1.
Data used in this study.
2.2.2. Data Preprocessing
To achieve consistency in the multisource data spatial benchmark, we uniformly adopted or converted the data layer into the WGS_1984_World_Mercator for processing and analysis [43]. As shown in Table 1, the resolution of the basic data used in the research is not completely consistent. This research used the resampling tool in GIS to unify the resolution of different data to 30 m. Among them, the cubic convolution map algebra technique was used for continuous data, such as slope, and the nearest neighbor method was used for categorical data, such as soil erosion intensity [44]. The continuous variable type environmental factors were graded, while the discrete variable types were classified and quantified. The classification quantification (Table 2) and thematic map (Figure 2) of the environmental evaluation factors of each landslide geological hazard were generated.
Table 2.
Quantitative classification of landslide environmental evaluation factors.
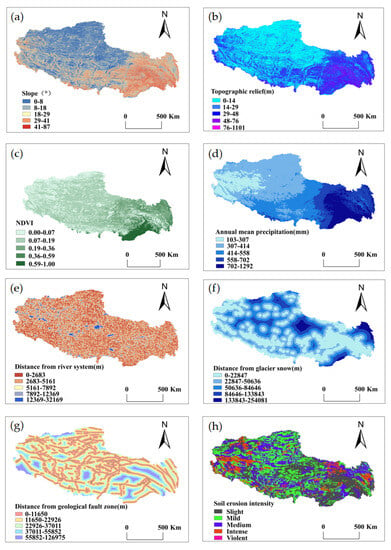
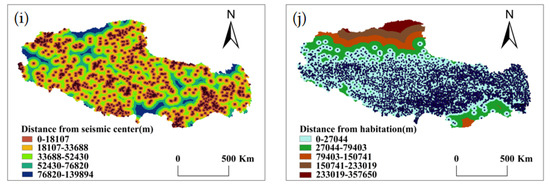
Figure 2.
Landslide environmental factors: (a) slope; (b) topographic relief; (c) NDVI; (d) annual mean precipitation; (e) distance from river system; (f) distance from glacier snow; (g) distance from geological fault zone; (h) soil erosion intensity; (i) distance from seismic center; and (j) distance from habitation.
Linear vector data, such as rivers and ditches of road networks and drainage elements, were classified, extracted, stitched, cut, stored, and grid into single values. The European distance from each cell grid to the nearest source was calculated by using the spatial distance analysis module of ArcGIS 10.8. The same method was also applied to the single value raster processing of the spatial distribution vector data of glaciers and snow, geological fault zones, seismic center, and habitation in the study area to calculate the Euclidean distance from each cell to the nearest source. In the process of DEM preprocessing, we used the grid surface analysis and a map algebra module to calculate and derive slope and topographic relief. After smoothing and normalizing the data, we obtained the average value of each pixel relative to NDVI over the years. For China’s monthly precipitation data set from 2001 to 2020 in NetCDF format, the annual mean precipitation data of the study area in GeoTiff format were obtained through Python programming processing. Based on the general requirements of soil Erosion Classification Standard SL190-96 of the People’s Republic of China, the degree of soil erosion in the study area was divided into five grades: slight, mild, moderate, intense, and violent. According to experimental requirements, of the 2521 geological disaster points in Tibet in recent years, 70% were randomly extracted as training sample points [37], and the remaining 30% were used to test and verify model accuracy.
3. Methods
3.1. Multicriteria Heuristic Analytical Hierarchy Process Model
By comprehensively collecting relevant data, the environmental factor mechanism of road landslide geological hazards in the research area was analyzed, and a heuristic hierarchical analysis model with five criteria and ten indicators was established. The multicriteria heuristic analytical hierarchy process model integrates qualitative and quantitative system analyses, simulates human thinking and decision-making processes [45], excavates and extracts the data of multifactor complex systems, and has many advantages, such as clear thinking and strong systems. Based on prior knowledge of professionals or cross fields, the method model can be applied in hierarchical clustering and combinations according to its influence and affiliation when solving specific problems to form an orderly hierarchical structure analysis and evaluation model.
In this study, the target layer was the road network vulnerability evaluation of the main environmental factors in Tibet: terrain changes, vegetation–soil conditions, regional hydrological conditions, geological activity structure, and habitation intensity. The index layer comprises slope, topographic fluctuation, annual average vegetation coverage, annual average precipitation, distance from river system, distance from glacier and snow, distance from geological fault zone, distance from seismic center, distance from habitation and soil erosion intensity. Constructing a judgment matrix is a key step in the heuristic analytical hierarchy process. The judgment matrix represents the relative importance of each element at the previous level. Based on this criterion, the options were compared pairwise and graded according to their importance. The nth-order judgment matrix is as follows:
where A denotes the judgment matrix. The scales of the judgment matrix elements were defined in Table 3. Based on multicriteria, prior knowledge, and expert-assisted decisions, the following judgment matrix was formed for the target layer (Table 4).
Table 3.
Quantitative classification of geological disaster.
Table 4.
Judgment matrix and weight.
To investigate whether the results of the analytical hierarchy process are reasonable, a consistency test for the determination matrix is required. To test the consistency index CI of the judgment matrix, it is necessary to divide the consistency index CI by the same order as the average random consistency index RI table (Table 5), and the consistency ratio of the judgment matrix should be recorded as CR.
Table 5.
Random consistency index (RI).
The judgment matrix is considered to have satisfactory consistency when CR < 0.1; otherwise, when CR ≥ 0.1, the judgment matrix is adjusted until it is satisfactory. After MATLAB programming calculation, the maximum feature root of the above judgment matrix is λ = 5.19, and the feature vector is the weight vector W in the table, CI = 0.05, RI = 1.12, and CR = 0.04 < 0.10. This judgment matrix exhibited satisfactory consistency. Regarding the importance of each index layer element to the corresponding criterion layer, the evaluation results are prone to overfitting or underfitting phenomena when analyzing and mining the landslide geological disasters distribution law. Therefore, in this study, the fuzzy logic model of quantitative statistics was used for improvement.
3.2. Fuzzy Comprehensive Evaluation Model
The fuzzy comprehensive evaluation method transforms qualitative evaluations into quantitative evaluations according to the membership degree theory of fuzzy mathematics. It has the advantages of being simple, practical, systematic, and can comprehensively evaluate fuzzy problems [46]. The basic idea of the fuzzy comprehensive evaluation method is based on the principles of fuzzy linear transformation and maximum membership, analysis of the factors affecting the objects to be evaluated, and comprehensive evaluation through fuzzy operation. It is suitable for evaluating objects that are restricted by a variety of factor attributes; however, a reasonable overall evaluation result can be comprehensively judged through the information characteristics of the attributes of each index.
In a complex risk evaluation system for landslide geological disasters, there are many factors, and there are different levels between them [47]. It was necessary to divide the evaluation factors into several categories according to certain attributes, conduct a comprehensive evaluation of each category, and then conduct a high-level comprehensive evaluation of the various types of evaluation results.
Step 1. Determine the factor set for the evaluation object. The object to be evaluated is considered as a finite domain U = {u1,u2, …, up}, where p is the number of factors involved in the evaluation, and set U is the factor set. The factor set in this study is the entire element of the index layer.
Step 2. Determine the evaluation level domain; that is, the set of V levels. Each level can correspond to a fuzzy subset V = {v1, v2, vi, …, vm}, and the evaluation set in this study is the entire element of the above criterion layer. The grades were divided into five classes: terrain changes were minor, small, medium, large, and greater; vegetation–soil conditions were worse, poor, medium, good, and superior; regional hydrological conditions were worse, poor, medium, good, and superior; distance from crustal motion were near, nearer, medium, far, and farther; and human activity intensity were slight, mild, moderate, intense, and violent.
Step 3. Construct the fuzzy relationship matrix, R. The grade fuzzy subset is established and needs to consider objects individually from each factor ui (i = 1, 2, …, p) on quantification, namely from the perspective of single factors, evaluated in the grade fuzzy subset of membership (R|ui), where m represents the level number of the fuzzy set. To reveal and excavate the nonlinear relationship between environmental factors and induced landslide geological disasters, the membership function was determined using the fuzzy statistics method, and the membership frequency method was used to obtain the fuzzy relationship matrix. The membership function of the corresponding hierarchical fuzzy subset is.
Step 4. Fuzzy comprehensive evaluation results. Based on the above weight allocation and fuzzy transformation operation of each evaluation factor, the fuzzy comprehensive evaluation results were obtained.
where A is the vector of the weight coefficient of each fuzzy subset level, and R is the decision matrix of the fuzzy relationship. To consider various factors, ordinary matrix multiplication was used for the synthesis operation because the model is suitable for sorting multiple factors. B is the fuzzy comprehensive evaluation result of each evaluation index, which was normalized to
BNormalized weights= [0.11 0.10 0.09 0.13 0.09 0.08 0.11 0.09 0.10 0.10]
3.3. Frequency Ratio-Interactive Fuzzy Overlay Analysis
Because existing related studies have the problem of training the model with the training set, the test set was used to test the model generalization ability and adjust the model according to the accuracy of the test set. To improve the operational efficiency and generalization ability of the presentation model, this study proposed a ubiquitous machine-learning model that attempts to supervise the model training stage based on the feature vector and regional fuzzy measure operator. The ubiquitous machine learning model is based on set theory [3,48]. In the “fuzzy superposition” analysis, the set corresponds to the subordinate class, and the data value is reclassified or transformed to the same informational feature level of each element. The results of the frequency ratio interactive fuzzy superposition analysis quantified the likelihood that each position in the input grid belonged to the fuzzy set of each evaluation index grade. Figure 3 shows the landslide frequency ratios [49] of the grid values for each environmental assessment factor. For example, the slope of a region indicates the possibility of transformation and fuzzy superposition.
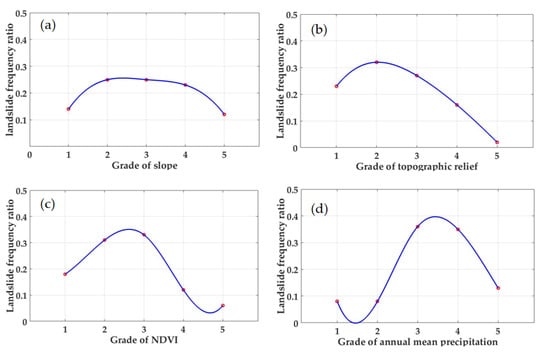
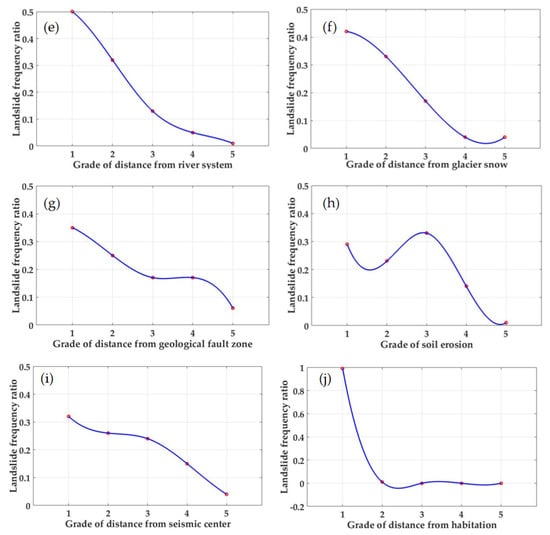
Figure 3.
Landslide frequency ratio curve of each evaluation index: (a) grade of slope; (b) grade of topographic relief; (c) grade of NDVI; (d) grade of mean annual precipitation; (e) grade of distance from river system; (f) grade of distance from glacial snow; (g) grade of distance from geological fault zone; (h) grade of soil erosion; (i) grade of distance from seismic center; and (j) grade of distance from habitation.
The grid layer of multiple landslide geological hazard risk indicators was comprehensively analyzed, and a regional vulnerability analysis was conducted by grading the combination of nonlinear superposition operators. Because the membership frequency ratio of each environmental risk factor in this study is between [0, 1] and is stored in grade, a nonlinear superposition operator should be used for fuzzy stack analysis [50]. Through reference to related studies and experimental analysis, it is found that the combination of Fuzzy Gamma and Fuzzy Product superposition operators, especially the value of 0.95 < γ < 1, has a good measure for the dispersion of local risk values in the study area.
4. Results
4.1. Frequency Ratio-Interactive Fuzzy Overlay Analysis
In this study, we adopted the natural breakpoint method to classify the risk index into five categories [51]: very low (0.00–0.68), low (0.68–0.73), medium (0.73–0.77), high (0.77–0.82), and very high (0.82–1.00). As can be seen from Figure 4, the high hazard risk is in the eastern and southern regions of the study area, relatively dispersed in the middle, western, and northern regions of the area, the median risk is relatively evenly distributed, and the low hazard risk is distributed in the midland, northern, and western regions. Areas with very low, low, medium, high, and very high risk indices accounted for 6.29%, 19.07%, 25.80%, 26.21%, and 22.63% of the study area, respectively.
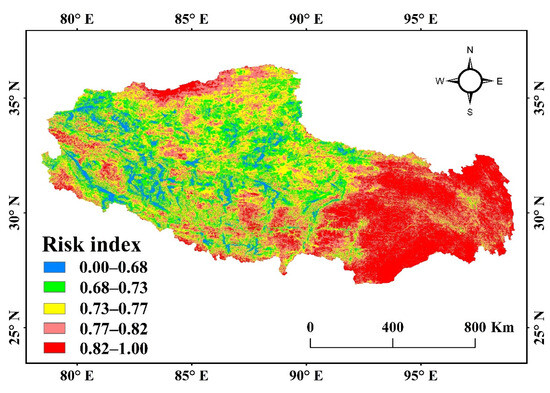
Figure 4.
Landslide geological disaster risk distribution in the study area.
From the distributed regional environment perspective, landslide development is not only affected by regional hydrological conditions, geological environment, topography, vegetation coverage, soil erosion, and other natural conditions, but also by the frequency of human engineering activity near towns and along highways. The Himalayan–Hengduan Mountain valley with great topography and a developed water system, located in the alpine and canyon areas of eastern Tibet, with its strong precipitation, broken structure, and crushed fault zone, is a high-risk area for landslide geological disasters. However, the vast areas in midland, western, and northern Tibet, with less human engineering activity, and valleys and basins are mild- and medium-risk areas for landslide geological disasters.
4.2. Test of Evaluation Results
In this study, the rationality of the evaluation results was tested by selecting the distribution of the sample points at risk levels (Figure 5) to ensure the objectivity and robustness of the evaluation model [51]. From the test results, the risk division results, and the distribution of the test sample points were analyzed by spatial statistics. The results showed that 291 geological disaster test sites are in very high-risk areas, 270 in high-risk areas, 123 in medium-risk areas, and only 41 and 31 in low-risk and very low-risk areas, respectively. That is 90.48% of the geological disaster test sites were located above the medium-risk zone and 74.21% were located above the high-risk areas. With an increase in risk level of landslide geological disasters, the geological disaster occurrence rate increases significantly. The diagnosis indicated the excellent accuracy of the evaluation model.
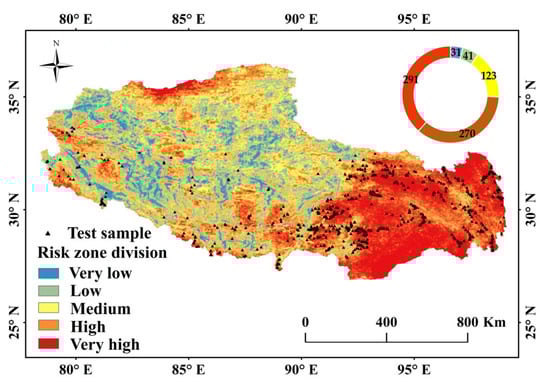
Figure 5.
Test sample distribution of landslide geological disasters at each level of risk.
4.3. Analysis of Road Network Vulnerability
The linear data of the main road network from national to prefectural roads in the study area were associated with the landslide geological hazard-prone risk results obtained from the comprehensive evaluation. The vulnerability distribution of the regional road network in Tibet, China, is shown in Figure 6. The vulnerability index was divided into five grades: very low (0.52–0.66), low (0.66–0.71), medium (0.71–0.76), high (0.76–0.80), and extremely high (0.80–0.90). In addition, we proposed a method to calculate the vulnerability distribution percentage of the interurban regional road network.
where Pvul is the vulnerability distribution percentage of the regional road network, is the mileage value of vulnerability grade of high and extremely high level of the road network in a city, and is the total mileage value of all studied roads in the city. Table 6 presents the distribution of road network vulnerabilities among the cities in the study area. Overall, more than two-thirds of the roads in Qamdo and Nyingchi had high and extremely high vulnerability levels, but less than a third of the roads in Ngari and Xigazehad had the same vulnerability. More than half of the roads in Lhasa and Shannan cities had high and extremely vulnerability levels while Naqu city is the opposite.
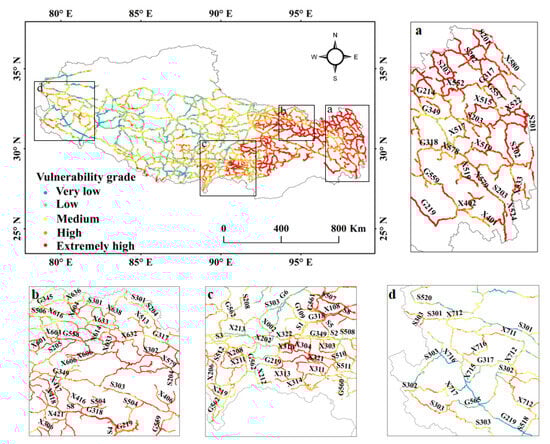
Figure 6.
Vulnerability level distribution of the main road network in the study area ((a–d) are enlarged maps of typical high-risk road clusters, corresponding to the east, north, south and west of the study area respectively).
Table 6.
Road network vulnerability distribution of seven Tibetan cities.
We selected four high risk road aggregation areas (Figure 6a–d). From the perspective of the distribution of high (including extremely high) vulnerability sections, the eastern and western sections of national highway G219 (Xin–Zang highway), G317 (north line of Sichuan–Tibet highway), the eastern and middle sections of G318 (southern line of Sichuan–Tibet highway), G214 (Yunnan–Tibet highway), G559, the provincial highways S201, S303, S8, and the prefectural highways X108, X321, X402, X508, and X606 all belong to this vulnerability level. The road network had denser branch lines than the road network structure. From a geographical perspective, these highly vulnerability sections exhibit distinct regional characteristics. In addition to overlapping with the high risk of landslide geological disasters, they occur in traffic arteries, link aggregations, and areas of relatively frequent human activity. For example, the G219 line and the Prochacha highway extending to Yunnan Province have been incorporated into the new G219, which serves the construction of the new Yunnan–Tibet highway and connects with the Sichuan–Tibet highway, namely the G318. In addition, G317, G318, G214, G559, S303, and other highways into Tibet have become important links for transportation, social production, border trade, cultural tourism, national defense construction, and ethnic unity. The S201 and S302, X108 and X401, and other branch roads in the area are the only sections for intercounty and rural trade, medical treatment, schools, and commuting. The vulnerability of these typical sections was prominent because of the landslide geological disaster risk.
5. Discussion
There is increasing concern about lifeline systems (e.g., water and energy supply, sewage, communication, and transport systems) and their vulnerability to damage and cause disruption during disasters such as geological hazards [1,17,52]. Vulnerability can be characterized across road networks or between risk scenarios for different networks [53]. Currently, most vulnerability studies focus on one aspect of vulnerability of the road network and lack an integrated consideration of indicators at different levels. In addition, there were more studies on the vulnerability of road networks in urban transport systems, while few studies have been conducted on transport networks in border areas [54]. Therefore, in this study, in response to the characteristic that road network vulnerability is mainly affected by natural environmental factors. We achieved qualitative and quantitative analysis and evaluation by combining a multicriteria heuristic analytical hierarchical process model [55] and fuzzy set theory [56,57], which is used for geological disaster risk assessment and mapping [58], on the basis of the existing studies and expert knowledge. In addition, we proposed a frequency ratio interactive fuzzy superposition algorithm. The landslide geological disaster risk map was generated by integrating the selected thematic layers through the comprehensive analysis of multiple landslide geological disaster risk indicators. Then, the credibility and accuracy analyses were carried out and the results were verified. Finally, the road network data in the study area were correlated with the landslide geological hazard susceptibility risk results obtained from the comprehensive evaluation to obtain the susceptibility distribution. The results show that the proposed three-stage framework based on the multicriteria heuristic analysis hierarchical process model, fuzzy comprehensive evaluation, and frequency ratio-interactive fuzzy superposition analysis is a reliable risk classification method, which is effective for vulnerability evaluation and zoning of road networks [59].
Whether single knowledge driven or data-driven [2,60,61], the evaluation results are prone to over or underfitting. Although this study analyzes and excavates the distribution law of landslide geological disasters and adopts a fuzzy logic model of quantitative statistics with hierarchical thought, some deficiencies remain. For instance, only the evaluation factors for road network vulnerability were selected, and traffic accidents were not included. In the frequency ratio-interactive fuzzy superposition of the model training stage, the γ values of the nonlinear superposition operators need to be adjusted within a reasonable range to obtain evaluation results with good measurement significance and astringency. Although the relevant evaluation model has moved toward complexity, regional environmental differences combined with road network vulnerability analysis is weak, and prediction accuracy and versatility require further improvement. Over the past years, observational, environmental, and instrumental data and the method of index verification was analyzed and verified by concerned study. These methods include support vector machine models [62], logistic regression models [63], random forest models [64], artificial neural networks [65], and deep learning algorithms [48]. In addition, uncertainty quantification (UQ) is an important benchmark to assess the performance of artificial intelligence (AI) and particularly deep learning ensembled-based models [66]. In the fairness of decision making, we should also pay attention to the characteristics of the road network itself and the local disaster relief capacity, and then combine the local economy, environment, and population to quantify the evaluation indicators. Meanwhile, because of the complex internal mechanism of the landslide geological disasters factors, there is no unified selection standard. Challenges still exist regarding how AI can be better applied to the vulnerability assessment of landslide geological disasters. Therefore, determining a set of general factor selection criteria and evaluation models should be the subject of future research and development. The three-stage framework proposed in this study can provide correct inferences and explanations for the potential phenomena. Firstly, on the basis of constructing a target-based vulnerability assessment system of the mountain road network, the preliminary vulnerability assessment of the mountain road network was completed. Then, using the preliminary results as a sample set, a road vulnerability prediction model can be constructed using the multiple machine learning algorithms. Finally, the model with the highest prediction accuracy was selected to complete the vulnerability assessment of road network for landslide geological disasters in high and remote mountainous areas.
The strategic position of the study area is important, and human activity is mainly concentrated in towns and plateau valleys with relatively dense road networks. The road network vulnerability research results were based on the risk of landslide geological disasters, and for different vulnerability sources, different measures or techniques can be taken to reduce the risks and consequences of vulnerability. For example, increasing the connection strength of low-grade and high-grade roads; exploring scientifically feasible three-dimensional traffic in plateau mountainous areas; improving the operational rate of road networks; construction and regular inspection of slope protection engineering facilities; scientific and reasonable allocation of emergency rescue facilities, personnel, and materials; difficult highway construction and maintenance in the study area; and strengthening traffic control and diversion based on the carrying capacity of roads and big data of traffic flow in key areas with frequent human activity [67,68].
6. Conclusions
The three-stage framework proposed in this study can provide correct inferences and explanations for the potential phenomena of landslide geological disasters. Landslide geological disasters are among the most destructive disasters and can cause traffic blockages related to road facilities, as well as direct and indirect economic losses. This study, guided by objectivity and operability, started with the main environmental elements of geological disasters in the breeding area, adopted a multicriteria heuristic analytical hierarchy process model, fuzzy comprehensive evaluation, and frequency ratio-interactive fuzzy stack analysis of the hierarchical thinking mode, and comprehensively evaluated the road vulnerability network in Tibet, China. In this study, based on relevant research results and expert consultation, regional characteristics, evaluation factors, and an index system were selected, and multisource data were investigated and collected. The environmental factors of the continuous variable type were classified and discretized, while those of the discrete variable type were classified and quantified. First, a heuristic hierarchical analysis model with five criteria and ten indexes was established. Subsequently, according to the evaluation object being restricted by various factors, a fuzzy comprehensive evaluation logic model of quantitative statistics was used, and the fuzzy comprehensive evaluation results of each evaluation index were obtained. Moreover, through frequency ratio interactive fuzzy superposition, the risk evaluation of the hierarchical superposition combination of the nonlinear superposition operator was adopted, and the spatial distribution characteristics were obtained. Finally, the road network vulnerability in the study area was evaluated. This research proposed a reasonably efficient and well-measured hierarchical research paradigm and model to predict road network vulnerability to geological disasters in high mountainous areas. The limitation is that the values of the nonlinear superposition operators need to be adjusted within a reasonable range to obtain evaluation results with good measurement significance and astringency. The main conclusions were summarized as follows.
(1) The high-value areas of geological hazard risk are in the eastern and southern parts of the study area and are relatively dispersed in the western part of the study area; the medium geological hazard risk is relatively evenly distributed in the north; and the low-value area of geological hazard risk is distributed in the midland, northern, and western regions. The Himalayan–Hengduan Mountains in southern Tibet, located in the alpine and canyon areas of Tibet, with great topography and a developed water system with strong precipitation, broken structures, and crushed fault zones, are high-risk areas for geological landslide disasters. However, the vast areas in midland, western, and northern Tibet, with less human engineering activity, and valleys and basins, are mild- and medium-risk areas for landslide geological disasters.
(2) The distribution of road network vulnerability in China’s Tibet has the following characteristics. In general, more than two-thirds of the roads in Qamdo and Nyingchi have high and extremely high vulnerability levels, but less than a third of the roads in AliNgari, Xigaze, and Nagqu have more than half the same vulnerability. More than half of the roads in Lhasa and Shannan Cities have high and extremely high vulnerability levels while Naqu city is the opposite.
(3) In the study area, the high-vulnerability section presents significant regional characteristics. In addition to overlapping with the area with a high risk of landslide geological disasters, its distribution is mostly located in traffic arteries, link aggregations, and relatively frequent human activity.
Author Contributions
Conceptualization, Y.Y.; methodology, Y.Y. and S.C.; software, Y.Y., M.C. and S.D.; validation, M.C. and J.Y.; formal analysis, H.C. and Z.L.; investigation, Y.Y. and S.C.; resources, L.C.; data curation, Y.Y. and L.C.; writing—original draft, Y.Y.; writing—review and editing, L.C., S.C., H.C. and N.L.; visualization, Y.Y. and Y.G.; supervision, L.C. and S.C.; project administration, L.C. and S.C. All authors have read and agreed to the published version of the manuscript.
Funding
This research was supported by the National Natural Science Foundation of China (grant numbers 42201450) and the National Key Research and Development Program of China (grant numbers 2022YFB3903600).
Data Availability Statement
The data presented in this study are available on request from the corresponding author.
Acknowledgments
We would like to extend special thanks to the editor and the anonymous reviewers for their valuable comments on the previous version of the manuscript.
Conflicts of Interest
The authors declare no conflict of interest.
References
- Qiang, Y.; Xu, J. Empirical Assessment of Road Network Resilience in Natural Hazards Using Crowdsourced Traffic Data. Int. J. Geogr. Inf. Sci. 2020, 34, 2434–2450. [Google Scholar] [CrossRef]
- Zhang, Q.; Yu, H.; Li, Z.; Zhang, G.; Ma, D.T. Assessing Potential Likelihood and Impacts of Landslides on Transportation Network Vulnerability. Transp. Res. Part D Transp. Environ. 2020, 82, 102304. [Google Scholar] [CrossRef]
- Ha, H.; Bui, Q.D.; Khuc, T.D.; Tran, D.T.; Pham, B.T.; Mai, S.H.; Nguyen, L.P.; Luu, C. A Machine Learning Approach in Spatial Predicting of Landslides and Flash Flood Susceptible Zones for a Road Network. Model. Earth Syst. Environ. 2022, 8, 4341–4357. [Google Scholar] [CrossRef]
- Amlan, H.A.; Hassan, S.A.; Alias, N.E. Discovering the Global Landscape of Vulnerability Assessment Method of Transportation Network Studies: A Bibliometric Review. Phys. Chem. Earth 2023, 129, 103336. [Google Scholar] [CrossRef]
- Fan, H.; Lu, Y.; Hu, Y.; Fang, J.; Lv, C.; Xu, C.; Feng, X.; Liu, Y. A Landslide Susceptibility Evaluation of Highway Disasters Based on the Frequency Ratio Coupling Model. Sustainability 2022, 14, 7740. [Google Scholar] [CrossRef]
- Ayalew, L.; Yamagishi, H.; Marui, H.; Kanno, T. Landslides in Sado Island of Japan: Part II. GIS-Based Susceptibility Mapping with Comparisons of Results from Two Methods and Verifications. Eng. Geol. 2005, 81, 432–445. [Google Scholar] [CrossRef]
- Tang, R.X.; Kulatilake, P.H.S.W.; Yan, E.C.; Cai, J. Sen. Evaluating Landslide Susceptibility Based on Cluster Analysis, Probabilistic Methods, and Artificial Neural Networks. Bull. Eng. Geol. Environ. 2020, 79, 2235–2254. [Google Scholar] [CrossRef]
- Maghsoudi Moud, F.; Abbaszadeh Shahri, A.; van Ruitenbeek, F.; Hewson, R.; van der Meijde, M. Evaluation of the Modified AHP-VIKOR for Mapping and Ranking Copper Mineralized Areas, A Case Study from the Kerman Metallogenic Belt, SE Iran. Arab. J. Geosci. 2022, 15, 1756. [Google Scholar] [CrossRef]
- El-Maissi, A.M.; Argyroudis, S.A.; Kassem, M.M.; Leong, L.V.; Mohamed Nazri, F. An Integrated Framework for the Quantification of Road Network Seismic Vulnerability and Accessibility to Critical Services. Sustainability 2022, 14, 12474. [Google Scholar] [CrossRef]
- Guzzetti, F.; Carrara, A.; Cardinali, M.; Reichenbach, P. Landslide Hazard Evaluation: A Review of Current Techniques and Their Application in A Multi-Scale Study, Central Italy. Geomorphology 1999, 31, 181–216. [Google Scholar] [CrossRef]
- Moayedi, H.; Mehrabi, M.; Mosallanezhad, M.; Rashid, A.S.A.; Pradhan, B. Modification of Landslide Susceptibility Mapping Using Optimized PSO-ANN Technique. Eng. Comput. 2019, 35, 967–984. [Google Scholar] [CrossRef]
- Xie, W.; Nie, W.; Saffari, P.; Robledo, L.F.; Descote, P.Y.; Jian, W. Landslide Hazard Assessment Based on Bayesian Optimization–Support Vector Machine in Nanping City, China. Nat. Hazards 2021, 109, 931–948. [Google Scholar] [CrossRef]
- Huang, S.; Dou, H.; Jian, W.; Guo, C.; Sun, Y. Spatial Prediction of the Geological Hazard Vulnerability of Mountain Road Network Using Machine Learning Algorithms. Geomat. Nat. Hazards Risk 2023, 14, 2170832. [Google Scholar] [CrossRef]
- Liu, Y.Q.; Wu, X. Analysis and Research on the Influencing Factor of the Road Transportation Network Vulnerability Based on the Interpretative Structural Model. In Proceedings of the 2015 IEEE International Conference on Grey Systems and Intelligent Services (GSIS), Leicester, UK, 18–20 August 2015; pp. 296–300. [Google Scholar] [CrossRef]
- Zhang, H.; Yao, Y. An Integrative Vulnerability Evaluation Model to Urban Road Complex Network. Wirel. Pers. Commun. 2019, 107, 193–204. [Google Scholar] [CrossRef]
- Cignetti, M.; Godone, D.; Bertolo, D.; Paganone, M.; Thuegaz, P.; Giordan, D. Rockfall Susceptibility along the Regional Road Network of Aosta Valley Region (Northwestern Italy). J. Maps 2021, 17, 54–64. [Google Scholar] [CrossRef]
- Wang, Z.; Chan, A.P.C.; Yuan, J.; Xia, B.; Skitmore, M.; Li, Q. Recent Advances in Modeling the Vulnerability of Transportation Networks. J. Infrastruct. Syst. 2015, 21, 1–9. [Google Scholar] [CrossRef]
- Pellicani, R.; Argentiero, I.; Spilotro, G. GIS-Based Predictive Models for Regional-Scale Landslide Susceptibility Assessment and Risk Mapping along Road Corridors. Geomat. Nat. Hazards Risk 2017, 8, 1012–1033. [Google Scholar] [CrossRef]
- Hassan, S.A.; Amlan, H.A.; Alias, N.E.; Ab-Kadir, M.A.; Sukor, N.S.A. Vulnerability of Road Transportation Networks under Natural Hazards: A Bibliometric Analysis and Review. Int. J. Disaster Risk Reduct. 2022, 83, 103393. [Google Scholar] [CrossRef]
- Alsabhan, A.H.; Singh, K.; Sharma, A.; Alam, S.; Pandey, D.D.; Rahman, S.A.S.; Khursheed, A.; Munshi, F.M. Landslide Susceptibility Assessment in the Himalayan Range Based along Kasauli–Parwanoo Road Corridor Using Weight of Evidence, Information Value, and Frequency Ratio. J. King Saud Univ.-Sci. 2022, 34, 101759. [Google Scholar] [CrossRef]
- El-Maissi, A.M.; Argyroudis, S.A.; Kassem, M.M.; Mohamed Nazri, F. Integrated Seismic Vulnerability Assessment of Road Network in Complex Built Environment toward More Resilient Cities. Sustain. Cities Soc. 2023, 89, 104363. [Google Scholar] [CrossRef]
- Ouyang, M.; Hong, L.; Mao, Z.J.; Yu, M.H.; Qi, F. A Methodological Approach to Analyze Vulnerability of Interdependent Infrastructures. Simul. Model. Pract. Theory 2009, 17, 817–828. [Google Scholar] [CrossRef]
- Redzuan, A.A.H.; Zakaria, R.; Anuar, A.N.; Aminudin, E.; Yusof, N.M. Road Network Vulnerability Based on Diversion Routes to Reconnect Disrupted Road Segments. Sustainability 2022, 14, 2244. [Google Scholar] [CrossRef]
- Wang, S.; Hong, L.; Ouyang, M.; Zhang, J.; Chen, X. Vulnerability Analysis of Interdependent Infrastructure Systems under Edge Attack Strategies. Saf. Sci. 2013, 51, 328–337. [Google Scholar] [CrossRef]
- Borowska-Stefańska, M.; Kowalski, M.; Wiśniewski, S.; Dulebenets, M.A. The Impact of Self-Evacuation from Flood Hazard Areas on the Equilibrium of the Road Transport. Saf. Sci. 2023, 157, 105934. [Google Scholar] [CrossRef]
- Aslan, E.; Çelik, M. Pre-Positioning of Relief Items under Road/Facility Vulnerability with Concurrent Restoration and Relief Transportation. IISE Trans. 2019, 51, 847–868. [Google Scholar] [CrossRef]
- Guerriero, L.; Napoli, M.D.; Novellino, A.; Martire, D.D.; Rispoli, C.; Lee, K.; Bee, E.; Harrison, A.; Calcaterra, D. Multi-Hazard Susceptibility Assessment Using Analytic Hierarchy Process: The Derwent Valley Mills UNESCO World Heritage Site Case Study (United Kingdom). J. Cult. Herit. 2022, 55, 339–345. [Google Scholar] [CrossRef]
- Chen, A.; Yang, C.; Kongsomsaksakul, S.; Lee, M. Network-Based Acessibility Measures for Vulnerability Analysis of Degradable Transportation Networks. Netw. Spat. Econ. 2007, 7, 241–256. [Google Scholar] [CrossRef]
- Berdica, K. An Introduction to Road Vulnerability: What Has Been Done, Is Done and Should Be Done. Transp. Policy 2002, 9, 117–127. [Google Scholar] [CrossRef]
- Taylor, M.A.P.; Sekhar, S.V.C.; D’Este, G.M. Application of Accessibility Based Methods for Vulnerability Analysis of Strategic Road Networks. Netw. Spat. Econ. 2006, 6, 267–291. [Google Scholar] [CrossRef]
- Sohn, J. Evaluating the Significance of Highway Network Links under the Flood Damage: An Accessibility Approach. Transp. Res. Part A Policy Pract. 2006, 40, 491–506. [Google Scholar] [CrossRef]
- Erath, A.; Birdsall, J.; Axhausen, K.W.; Hajdin, R. Vulnerability Assessment Methodology for Swiss Road Network. Transp. Res. Rec. 2009, 2137, 118–126. [Google Scholar] [CrossRef]
- Du, Z.P.; Nicholson, A. Degradable Transportation Systems: Sensitivity and Reliability Analysis. Transp. Res. Part B Methodol. 1997, 31, 225–237. [Google Scholar] [CrossRef]
- Cheung, K.F.; Bell, M.G.H. Attacker–Defender Model against Quantal Response Adversaries for Cyber Security in Logistics Management: An Introductory Study. Eur. J. Oper. Res. 2021, 291, 471–481. [Google Scholar] [CrossRef]
- Murray, A.T.; Matisziw, T.C.; Grubesic, T.H. A Methodological Overview of Network Vulnerability Analysis. Growth Chang. 2008, 39, 573–592. [Google Scholar] [CrossRef]
- Wu, Q.; Han, Z.; Cui, C.; Liu, F.; Zhao, Y.; Xie, Z. Vulnerability Identification and Cascading Failure Spatiotemporal Patterns on Road Network under the Rainstorm Disaster. ISPRS Int. J. Geo-Inf. 2022, 11, 564. [Google Scholar] [CrossRef]
- Zhang, H.; Ouyang, M.; Sun, W.; Hong, L. An Approach for Accessibility Assessment and Vulnerability Analysis of National Multimodal Transport Systems. Risk Anal. 2023, 1–18. [Google Scholar] [CrossRef] [PubMed]
- Drejza, S.; Bernatchez, P.; Marie, G.; Friesinger, S. Quantifying Road Vulnerability to Coastal Hazards: Development of a Synthetic Index. Ocean Coast. Manag. 2019, 181, 104894. [Google Scholar] [CrossRef]
- Ahmad, M.N.; Shao, Z.; Aslam, R.W.; Ahmad, I.; Liao, M.; Li, X.; Song, Y. Landslide Hazard, Susceptibility and Risk Assessment (HSRA) Based on Remote Sensing and GIS Data Models: A Case Study of Muzaffarabad Pakistan. Stoch. Environ. Res. Risk Assess. 2022, 36, 4041–4056. [Google Scholar] [CrossRef]
- Rupi, F.; Bernardi, S.; Rossi, G.; Danesi, A. The Evaluation of Road Network Vulnerability in Mountainous Areas: A Case Study. Netw. Spat. Econ. 2015, 15, 397–411. [Google Scholar] [CrossRef]
- Kasmalkar, I.G.; Serafin, K.A.; Miao, Y.; Bick, I.A.; Ortolano, L.; Ouyang, D.; Suckale, J. When Floods Hit the Road: Resilience to Flood-Related Traffic Disruption in the San Francisco Bay Area and Beyond. Sci. Adv. 2020, 6, 1–8. [Google Scholar] [CrossRef]
- Guo, W.; Liu, S.; Xu, J.; Wu, L.; Shangguan, D.; Yao, X.; Wei, J.; Bao, W.; Yu, P.; Liu, Q.; et al. The Second Chinese Glacier Inventory: Data, Methods and Results. J. Glaciol. 2015, 61, 357–372. [Google Scholar] [CrossRef]
- Mallick, J.; Singh, R.K.; AlAwadh, M.A.; Islam, S.; Khan, R.A.; Qureshi, M.N. GIS-Based Landslide Susceptibility Evaluation Using Fuzzy-AHP Multi-Criteria Decision-Making Techniques in the Abha Watershed, Saudi Arabia. Environ. Earth Sci. 2018, 77, 276. [Google Scholar] [CrossRef]
- Shahri, A.A.; Spross, J.; Johansson, F.; Larsson, S. Landslide Susceptibility Hazard Map in Southwest Sweden Using Artificial Neural Network. Catena 2019, 183, 104225. [Google Scholar] [CrossRef]
- Jena, R.; Pradhan, B.; Beydoun, G.; Alamri, A.; Shanableh, A. Spatial Earthquake Vulnerability Assessment by Using Multi-Criteria Decision Making and Probabilistic Neural Network Techniques in Odisha, India. Geocarto Int. 2021, 37, 8080–8099. [Google Scholar] [CrossRef]
- Zhang, P.; Feng, G. Application of Fuzzy Comprehensive Evaluation to Evaluate the Effect of Water Flooding Development. J. Pet. Explor. Prod. Technol. 2018, 8, 1455–1463. [Google Scholar] [CrossRef]
- Liu, Q.; Tang, A.; Huang, D.; Huang, Z.; Zhang, B.; Xu, X. Total Probabilistic Measure for the Potential Risk of Regional Roads Exposed to Landslides. Reliab. Eng. Syst. Saf. 2022, 228, 108822. [Google Scholar] [CrossRef]
- Lv, L.; Chen, T.; Dou, J.; Plaza, A. A Hybrid Ensemble-Based Deep-Learning Framework for Landslide Susceptibility Mapping. Int. J. Appl. Earth Obs. Geoinf. 2022, 108, 102713. [Google Scholar] [CrossRef]
- Saravanan, S.; Istijono, B.; Jennifer, J.J.; Abijith, D.; Sivaranjani, S. Landslide Susceptibility Assessment Using Frequency Ratio Technique—A Case Study of NH67 Road Corridor in the Nilgiris District, Tamilnadu, India. IOP Conf. Ser. Earth Environ. Sci. 2021, 708, 012017. [Google Scholar] [CrossRef]
- Fang, Z.; Wang, Y.; Peng, L.; Hong, H. A Comparative Study of Heterogeneous Ensemble-Learning Techniques for Landslide Susceptibility Mapping. Int. J. Geogr. Inf. Sci. 2021, 35, 321–347. [Google Scholar] [CrossRef]
- He, Y.; Xiong, J.; Cheng, W.; Yang, J.; He, W.; Yong, Z.; Duan, Y.; Liu, J.; Yang, G.; Wang, N. Assessing the Risk Posed by Flash Floods to the Transportation Network in Southwestern China. Geocarto Int. 2022, 37, 13210–13228. [Google Scholar] [CrossRef]
- Lin, J.; Lin, W. Transportation System Vulnerability Assessment Considering Environmental Impact. J. Adv. Transp. 2022, 2022, 8711894. [Google Scholar] [CrossRef]
- Liu, M.; Agarwal, J.; Blockley, D. Vulnerability of Road Networks. Civ. Eng. Environ. Syst. 2016, 33, 147–175. [Google Scholar] [CrossRef]
- Alexakis, D.D.; Agapiou, A.; Tzouvaras, M.; Themistocleous, K.; Neocleous, K.; Michaelides, S.; Hadjimitsis, D.G. Integrated Use of GIS and Remote Sensing for Monitoring Landslides in Transportation Pavements: The Case Study of Paphos Area in Cyprus. Nat. Hazards 2014, 72, 119–141. [Google Scholar] [CrossRef]
- Bianchini, S.; Solari, L.; Casagli, N. A GIS-Based Procedure for Landslide Intensity Evaluation and Specific Risk Analysis Supported by Persistent Scatterers Interferometry (PSI). Remote Sens. 2017, 9, 1093. [Google Scholar] [CrossRef]
- Leonardi, G.; Palamara, R.; Suraci, F. A Fuzzy Methodology to Evaluate the Landslide Risk in Road Lifelines. Transp. Res. Procedia 2020, 45, 732–739. [Google Scholar] [CrossRef]
- Yin, Y.; Sheng, Y.; He, Y.; Qin, J. Modeling Vague Spatiotemporal Objects Based on Interval Type-2 Fuzzy Sets. Int. J. Geogr. Inf. Sci. 2022, 36, 1258–1273. [Google Scholar] [CrossRef]
- Crawford, M.M.; Dortch, J.M.; Koch, H.J.; Zhu, Y.; Haneberg, W.C.; Wang, Z.; Bryson, L.S. Landslide Risk Assessment in Eastern Kentucky, USA: Developing a Regional Scale, Limited Resource Approach. Remote Sens. 2022, 14, 6246. [Google Scholar] [CrossRef]
- Donnini, M.; Esposito, G.; Pisano, L.; Petrucci, O.; Lollino, P.; Reichenbach, P. National and Regional-Scale Landslide Indicators and Indexes: Applications in Italy. Open Geosci. 2022, 14, 763–775. [Google Scholar] [CrossRef]
- Zeng, H.; Zhu, Q.; Ding, Y.; Hu, H.; Chen, L.; Xie, X.; Chen, M.; Yao, Y. Graph Neural Networks with Constraints of Environmental Consistency for Landslide Susceptibility Evaluation. Int. J. Geogr. Inf. Sci. 2022, 36, 2270–2295. [Google Scholar] [CrossRef]
- Cengiz, L.D.; Ercanoglu, M. A Novel Data-Driven Approach to Pairwise Comparisons in AHP Using Fuzzy Relations and Matrices for Landslide Susceptibility Assessments. Environ. Earth Sci. 2022, 81, 1–23. [Google Scholar] [CrossRef]
- Zhou, C.; Yin, K.; Cao, Y.; Ahmed, B.; Li, Y.; Catani, F.; Pourghasemi, H.R. Landslide Susceptibility Modeling Applying Machine Learning Methods: A Case Study from Longju in the Three Gorges Reservoir Area, China. Comput. Geosci. 2018, 112, 23–37. [Google Scholar] [CrossRef]
- Umar, Z.; Pradhan, B.; Ahmad, A.; Jebur, M.N.; Tehrany, M.S. Earthquake Induced Landslide Susceptibility Mapping Using an Integrated Ensemble Frequency Ratio and Logistic Regression Models in West Sumatera Province, Indonesia. Catena 2014, 118, 124–135. [Google Scholar] [CrossRef]
- Kim, J.C.; Lee, S.; Jung, H.S.; Lee, S. Landslide Susceptibility Mapping Using Random Forest and Boosted Tree Models in Pyeong-Chang, Korea. Geocarto Int. 2018, 33, 1000–1015. [Google Scholar] [CrossRef]
- Pradhan, B.; Lee, S.; Buchroithner, M.F. A GIS-Based Back-Propagation Neural Network Model and Its Cross-Application and Validation for Landslide Susceptibility Analyses. Comput. Environ. Urban Syst. 2010, 34, 216–235. [Google Scholar] [CrossRef]
- Shahri, A.A.; Shan, C.; Larsson, S. A Novel Approach to Uncertainty Quantification in Groundwater Table Modeling by Automated Predictive Deep Learning. Nat. Resour. Res. 2022, 31, 1351–1373. [Google Scholar] [CrossRef]
- Li, X.; Liu, X. Research on Identification Method of Key Road Sections in the Road Network under Disaster Situation. In Proceedings of the 2020 5th International Conference on Electromechanical Control Technology and Transportation (ICECTT), Nanchang, China, 15–17 May 2020; pp. 575–578. [Google Scholar] [CrossRef]
- Chamorro, A.; Echaveguren, T.; Allen, E.; Contreras, M.; Cartes, P.; Contreras, M.; Jimenez, G.; Pattillo, C.; Solminihac, H.D.; Vargas, J.; et al. Risk Management System for Road Networks Exposed to Natural Hazards. Lifelines 2022, 166–177. [Google Scholar] [CrossRef]
Disclaimer/Publisher’s Note: The statements, opinions and data contained in all publications are solely those of the individual author(s) and contributor(s) and not of MDPI and/or the editor(s). MDPI and/or the editor(s) disclaim responsibility for any injury to people or property resulting from any ideas, methods, instructions or products referred to in the content. |
© 2023 by the authors. Licensee MDPI, Basel, Switzerland. This article is an open access article distributed under the terms and conditions of the Creative Commons Attribution (CC BY) license (https://creativecommons.org/licenses/by/4.0/).