Article

Siam-EMNet: A Siamese EfficientNet–MANet Network for Building Change Detection in Very High Resolution Images

1
Faculty of Land Resources Engineering, Kunming University of Science and Technology, Kunming 650093, China
2
Key Laboratory of Plateau Remote Sensing, Yunnan Provincial Department of Education, Kunming 650093, China
3
Institute of Geographic Sciences and Natural Resources Research, Chinese Academy of Sciences, Beijing 100101, China
4
The Planning and Design Institute of Land and Resources of Yunnan Province, Kunming 650224, China
*
Author to whom correspondence should be addressed.
Remote Sens. 2023, 15(16), 3972; https://doi.org/10.3390/rs15163972
Submission received: 27 July 2023 / Revised: 3 August 2023 / Accepted: 9 August 2023 / Published: 10 August 2023
(This article belongs to the Special Issue Convolutional Neural Network Applications in Remote Sensing II)

Abstract

:
As well as very high resolution (VHR) remote sensing technology and deep learning, methods for detecting changes in buildings have made great progress. Despite this, there are still some problems with the incomplete detection of change regions and rough edges. To this end, a change detection network for building VHR remote sensing images based on Siamese EfficientNet B4-MANet (Siam-EMNet) is proposed. First, a bi-branches pretrained EfficientNet B4 encoder structure is constructed to enhance the performance of feature extraction and the rich shallow and deep information is obtained; then, the semantic information of the building is input into the MANet decoder integrated by the dual attention mechanism through the skip connection. The position-wise attention block (PAB) and multi-scale fusion attention block (MFAB) capture spatial relationships between pixels in the global view and channel relationships between layers. The integration of dual attention mechanisms ensures that the building contour is fully detected. The proposed method was evaluated on the LEVIR-CD dataset, and its precision, recall, accuracy, and F1-score were 92.00%, 88.51%, 95.71%, and 90.21%, respectively, which represented the best overall performance compared to the BIT, CDNet, DSIFN, L-Unet, P2V-CD, and SNUNet methods. Verification of the efficacy of the suggested approach was then conducted.

1. Introduction

Remote sensing as an effective means to obtain spatial and temporal information of ground objects with full coverage and long time series provides an effective guarantee for land cover monitoring [1,2], agricultural surveys [3], disaster assessment [4,5], military reconnaissance [6], etc. A VHR remote sensing image consists of rich spatial information and detailed features that can be used to detect changes to specific ground objects, such as buildings [7]. Buildings are important carriers of urban development. Real-time and accurate monitoring of building change information can provide a scientific basis and reference for ecological environmental protection, natural resource management, and urban expansion analysis [8,9]. Therefore, how to detect building changes automatically and efficiently using multi-temporal VHR remote sensing images has become a research hotspot that has received a significant amount of attention [10].
Building change information can be detected by the direct comparison of images [11,12] or by post-classification comparisons [13,14]. The former method uses differences between images and obtains change results by clustering or thresholding [15]. Yuan et al. [16] used multichannel Gabor filters to process images at different scales and orientations and extract building texture features, which solved false changes caused by projection differences. In addition to the difference calculation using the radiometric luminance values of each band of image pixels, some feature indices can be used. Examples include the commonly used morphological building index (MBI) [17] or the normalized difference built-up index (NDBI) [18]. The post-classification comparison method often uses various machine learning models to classify multi-temporal remote sensing images and then perform change detection. Among them, random forest (RF) [19], decision tree [20], support vector machine (SVM) [21], Markov random field (MRF) [22], and conditional random field (CRF) [23] have been applied. Tan et al. [24] constructed an SVM-based hyperspectral remote sensing image classification model, and the results showed that the radial basis kernel function had the highest classification accuracy when SVM performed hyperspectral classification. Zhang et al. [25] used the RF and utilized it to obtain image-level change detection results to reduce environmental effects such as illumination and observation angle, and then fused pixel-level change results and image objects to achieve image-level and target-level building change detection. Although classical change detection methods are well researched, the detection results are evidently affected by atmospheric conditions, and often perform poorly in complex scenes, which cannot meet the demand of high-precision change detection.
After several years of development, the satellites have evolved from the kilometer level to the meter and submeter level, and the increased spatial resolution allows us to perform finer monitoring of ground changes. At the same time, deep learning methods have injected new vigor into building change detection research. Zhu et al. [26] combined an improved SegNet network with image morphology to identify new buildings, but it is not sensitive to changes with large structural differences. A Unet++-based network with multiple side outputs was proposed by Peng et al. [27]. Since the depth features of a single image are not extracted, it limits the accuracy of change detection. Daudt et al. [28] proposed three end-to-end structures, in which the siamese structure with bi-branches can extract feature information separately and effectively enhance the accuracy of change detection. Fang et al. [29] combined the siamese network and NestedUNet, and proposed the SNUNet change detection network, which obtained better results on the CDD dataset through dense skip connections between the encoder–decoder. Chen et al. [30] divided the image into multiscale subregions, extracted features using a bi-branches pyramid model, and produced a remotely sensed building change detection dataset (LEVIR-CD). Although these siamese building change detection methods enhance the efficiency of change detection and achieve better accuracy, most models have inadequate feature extraction of the images and are prone to missed detection.
The attention mechanism can focus attention on the region of interest, improving the building change detection accuracy to some extent [31,32,33]. DASNet [34] introduces an extended attention mechanism consisting of two components, namely channel attention mechanism and spatial attention mechanism, which enhances the performance of the model in detecting building changes. Lei et al. [35] proposed an SNLRUX++ network for building change detection, which improves the prediction of feature maps at different scales by cascading multiscale feature fusion methods on dense building detection performance. In a study by Wang et al. [36], Unet++ with a multilevel difference module is combined to highlight change regions while reducing the influence of “pseudo-change”. The above deep learning method extracts the image features at a deeper level compared to traditional methods. However, continuous down-samplings causes insufficient spatial position information, which will lead to an incomplete detection of change regions and rough building edges.
Based on this, a siamese EfficientNet B4-MANet network (Siam-EMNet) is proposed for building change information extraction of VHR images. This article’s primary contributions are as follows:
(1) A bi-branched EfficientNet B4 encoder structure is designed. This encoder structure is compounded and expanded according to the width, depth, and resolution of the network, which helps to better predict building change regions and acquire higher quality prediction results. Meanwhile, pretrained weights are used to make the experimental results converge more stably.
(2) A Siam-EMNet change detection network is constructed. The decoder integrates PAB and MFAB from the MANet to up-sample the feature mapping of the encoder. The details are recovered and improved in the up-sampling process, the edge information of the changing regions can be detected more accurately, and the missed detection of small regions can be effectively avoided.
(3) The Siam-EMNet model is optimized using a hybrid loss function with a weighted combination of dice loss and cross-entropy loss to reduce the detection error caused by the imbalance of change and unchanged samples.
The rest of the paper is arranged as follows: Section 2 explains the proposed Siam-EMNet method; Section 3 performs the analysis of experimental results; Section 4 discusses the method of this paper; and Section 5 concludes the work of this paper.

2. Building Change Detection Framework

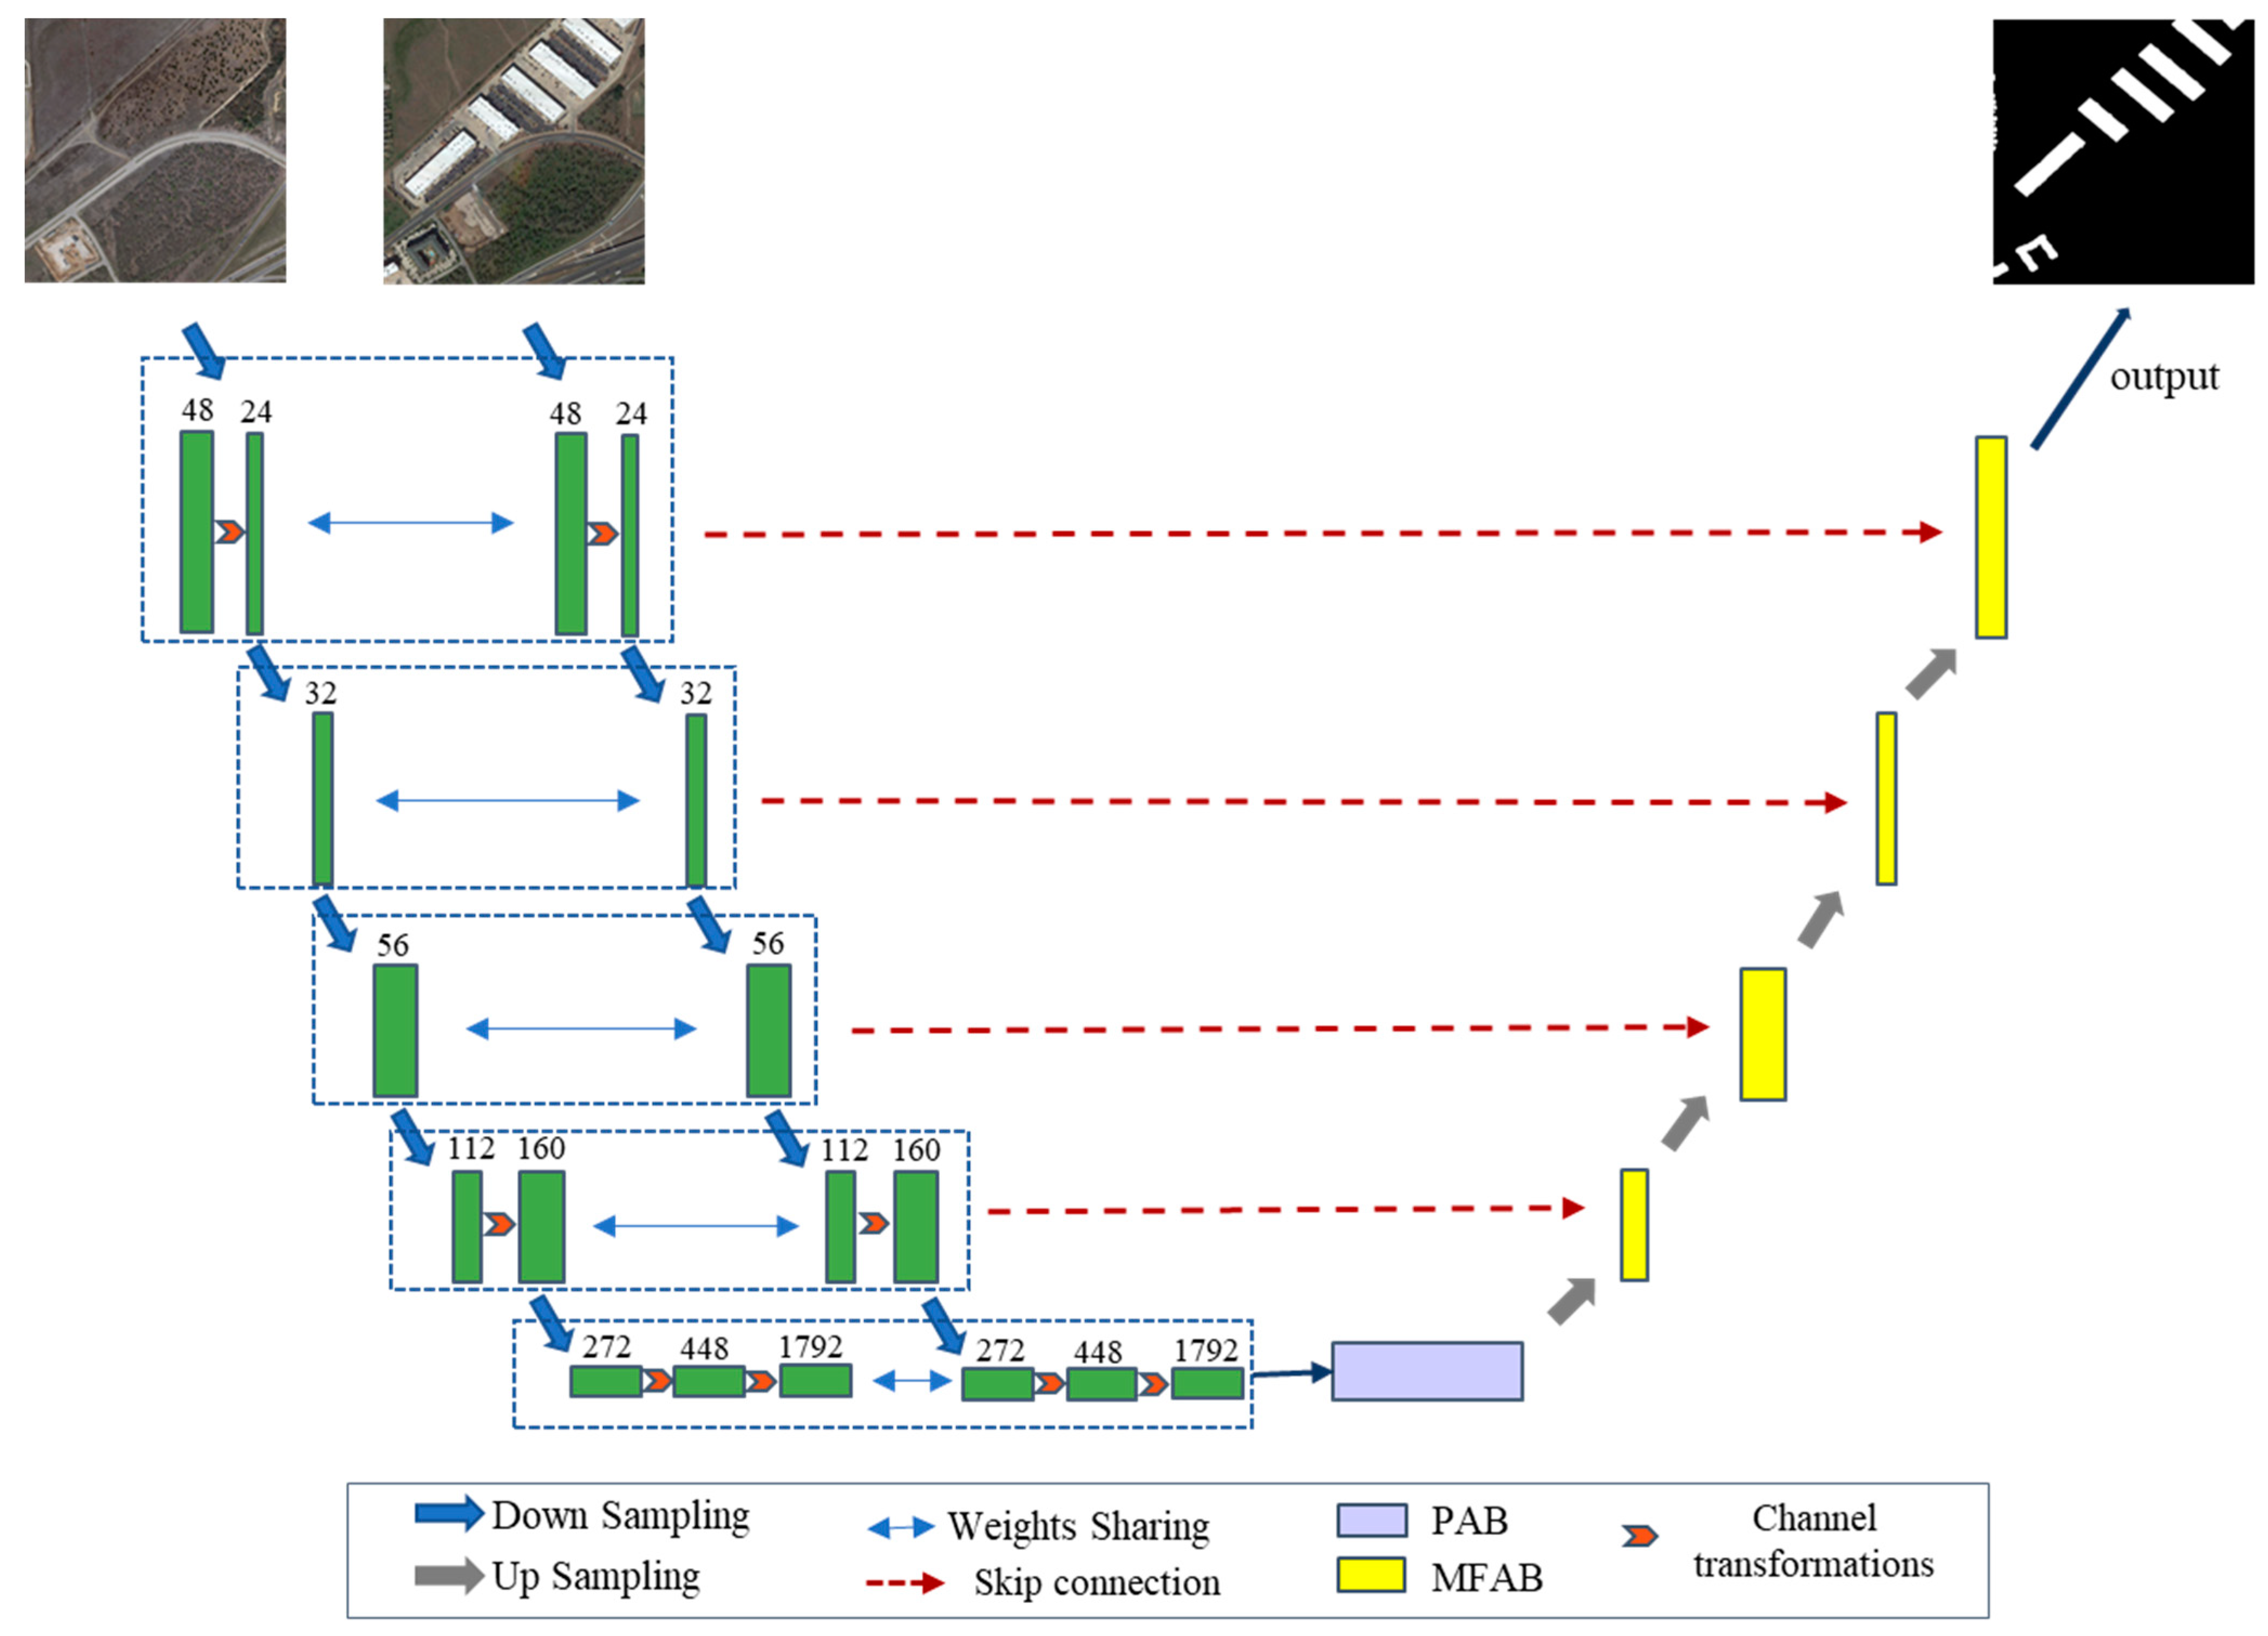
To detect building changes, a Siam-EMNet network model is proposed, which uses bi-temporal images as inputs and outputs binary detection maps. Figure 1 shows the network structure, where the encoder consists of siamese bi-branches EfficientNet B4, and the bi-branches share weights. To improve the accuracy of the model, the structure uses the compound scaling method on the network’s width, depth, and resolution. The PAB module in the decoder is used to acquire the spatial dependencies between pixels, and the MFAB module acquires the channel dependencies between arbitrary feature maps by fusing high-level and low-level semantic features, which combined with the dual attention mechanism can effectively use the multiscale feature information in the image to improve the accuracy.
The encoder–decoder6based network has high feature extraction accuracy [37]. The Siam-EMNet network can comprehensively and efficiently extract bi-temporal feature information from VHR remote sensing images and achieve the efficient fusion of multilevel information. EfficientNet B4 [38] pretrained on ImageNet is used as the backbone in the encoder to extract deep features, which improves the overall accuracy. Moreover, by using a skip connection, the encoder’s features are transferred to the decoder, which makes deep and shallow features more efficient to fuse.

2.1. Bi-Branches EfficientNet B4 Encoder

Generally, the accuracy of the model is optimized by deepening the network depth, expanding the network width, and improving the network resolution. AlexNet [39] combined dropout, ReLU, LRN, and other technologies with CNN for the first time, extending the width and depth of the CNN. VGGNet [40], ResNet [41], and InceptionNet [42] optimize the model by deepening the network depth and expanding the network width, respectively. Huang et al. [43] improved model performance by increasing image resolution. In most of the past research, only either width, depth, or resolution has been adjusted. EfficientNet is a series of CNN families proposed by Tan et al. [38] based on existing CNNs. The study extended different combinations of network width, depth, and image resolution to explore the effect of different combinations on the experimental accuracy, with a total of eight versions proposed, from EfficientNet B0 to EfficientNet B7. As shown in Table 1 with B0 as an example, each network is divided into a total of nine blocks.
In this study, a bi-branch EfficientNet B4 was used to extract feature information, with the two branches sharing weights and making efficient use of the information. Figure 2 shows the structure of the single-branch EfficientNet B4. The first block is a convolutional layer with a convolutional kernel size of 3 × 3 steps of 2. Block 2 to Block 8 repeat the stacked MBConv structure, while Block 9 is a normal 1 × 1 convolutional layer.
EfficientNet optimizes the network from three dimensions of width, depth, and resolution; its composite parameters are obtained using neural architecture search (NAS) technology, which is described as follows:
max d , w , r   A c c u r a c y   ( N a s ( w , d , r ) )
s . t .   N a s   ( w , d , r ) = i = 1 , s F ^ i d L ^ i ( X w C ^ i , r H ^ i , r W ^ i )
Memory   ( N a s )     t a r g e t _ m e m o r y
FLOPS   ( N a s )     t a r g e t _ f l o p s
where  F ^ i ,   L ^ i ,   H ^ i ,   W ^ i ,   and   C ^ i  are the predefined parameters of the basic network (Table 1), w, d, and r are the coefficients used to scale the width, depth, and resolution of the network, respectively; in Equation (2),  s . t .  denotes the constraints,  i = 1 , s  denotes the concatenated multiplication operation,  F ^ i d L ^ i  denotes that   F i  is repeated  L ^ i   times in the block and d is used to scale the depth,  X w C ^ i , r H ^ i , r W ^ i  denotes the feature matrix of the input block; target_memory and target_flops in Equations (3) and (4) are restricted to Memory (Nas) and FLOPS (Nas), respectively, and the Memory (Nas) and FLOPS (Nas) of each model are optimal values less than or equal to the restricted values.

2.2. Dual Attention Mechanism Decoder

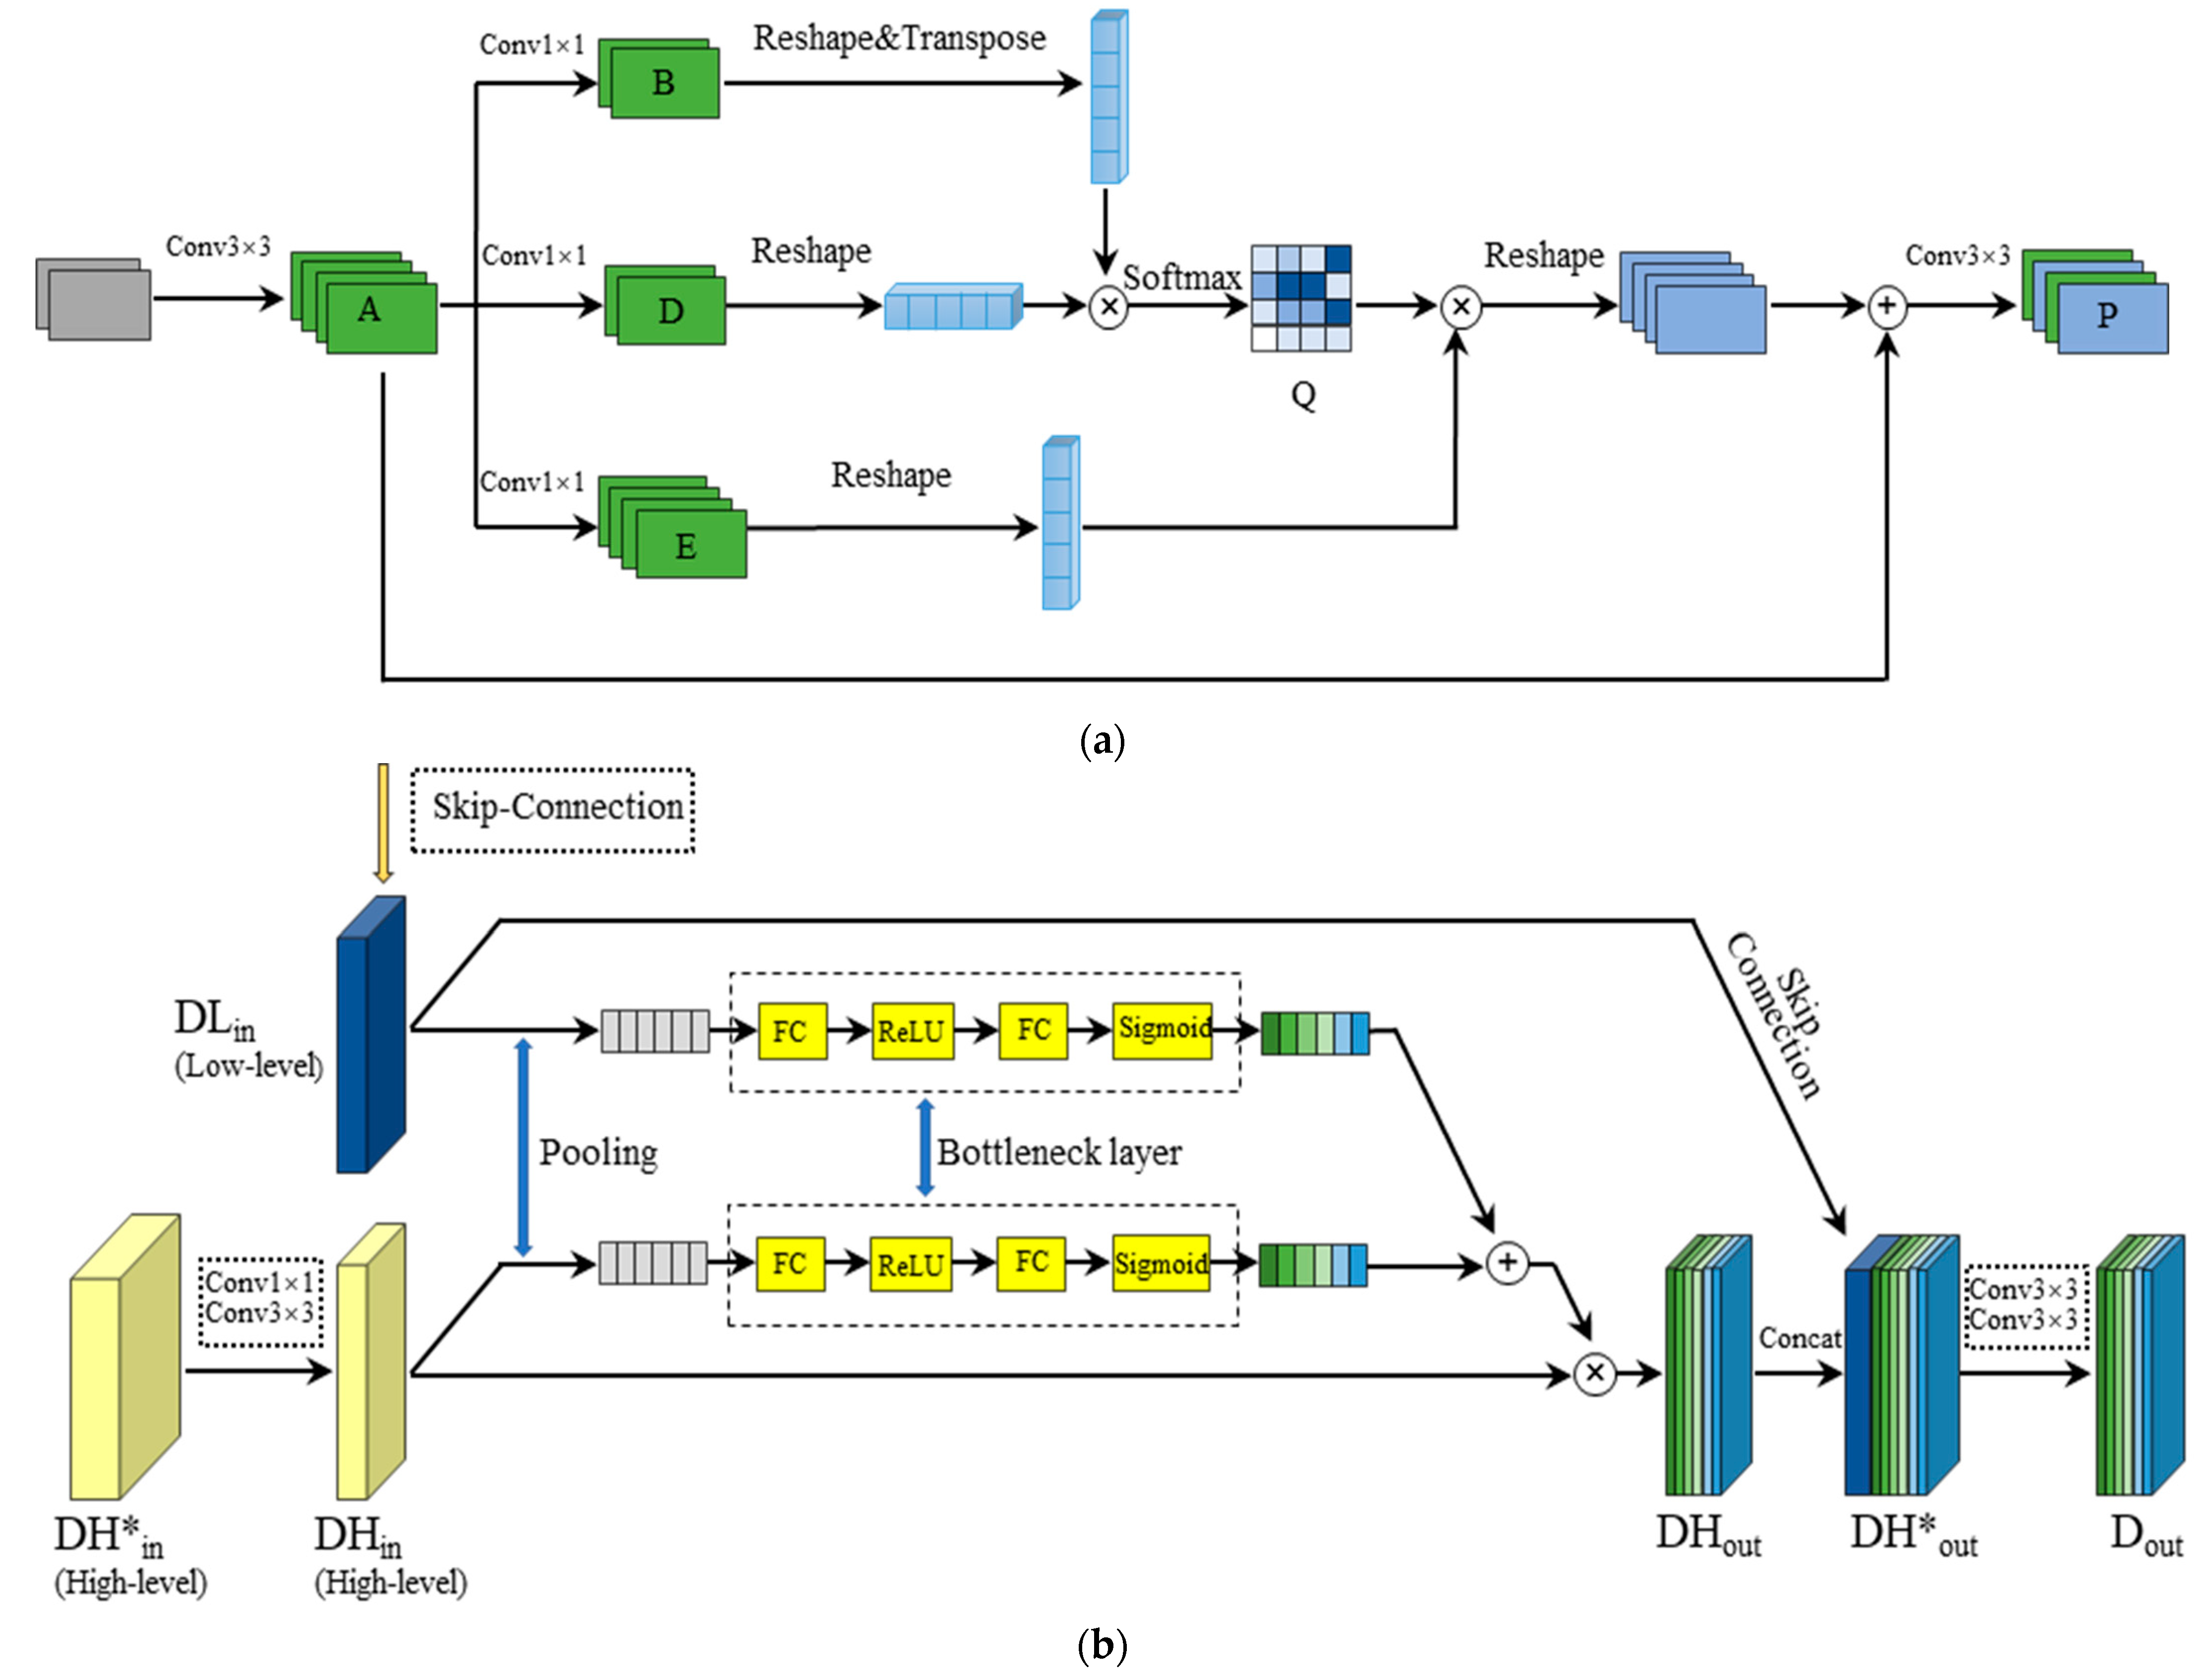
The local feature information obtained using traditional CNNs may lead to target misdetection. The decoder of the Siam-EMNet network model learns from the decoding structure of MANet, which has been maturely used for semantic segmentation of medical images [44]. To establish a rich context connection model on local features, dual attention modules (PAB and MFAB) are designed to capture spatial and channel information in the decoder part. Inspired by the literature [45], PAB [33] and MFAB [46] are introduced. The PAB module makes use of rich spatial context information to model, thus enhancing its representation ability. The MFAB captures feature–channel relationships by combining high-level and low-level feature mappings. According to the importance of the building segmentation task, the feature map is enhanced and suppressed. The structures of the two modules are shown in Figure 3, with PAB in (a) and MFAB in (b).

2.2.1. Position-Wise Attention Block

In Figure 3a, first, A   C × H × W   with local features is inputted to the convolution layer to generate two new feature maps B and D, respectively, where  { B , D } C × H × W   ; B and D are resampled as  C × N  (N is the total number of pixels N = H × W), then transposed and multiplied, and the spatial attention map  Q N × N  is computed using the softmax layer:
Q j i = exp ( B i D j ) i = 1 N exp ( B i D j )
where Qji denotes the effect of position i on position j. Meanwhile, another feature mapping  E   C × H × W   . generated by A is resampled to  C × N .
Then, the transpose of matrices E and Q is multiplied and the result is resampled to  C × H × W   ; finally, a scale parameter α is applied, and a pixel-by-pixel summation operation is performed on feature A to obtain the final output P   C × H × W   .
P j = σ i = 1 N Q j i E i + A j
where  σ  is initialized to 0 and more new weight values are obtained by training. P selectively aggregates contexts based on the spatial attention graph, improving intra-class compactness and semantic consistency.

2.2.2. Multiscale Fusion Attention Block

In Figure 3b, the structure of the MFAB module is shown, which operates in the following steps.
(1) The high-level features  D H i n *   are fed into 1 × 1 and 3 × 3 convolution layers to obtain  D H i n     C × H × W   D H i n     and  D L i n    have the same number of channels. The output feature mapping u = [ u 1 ,   u 2 ,   , u k ] can be computed as follows:
u k = v k D i n = i = 1 k ( v k i ) d i
where  D i n  = [ d 1 d 2 ,…,  d k ],  D i n ( D L i n   or   D H i n ) v k    = [ v k 1 v k 2 ,…,  v k i ] denotes the convolution kernel of the channel corresponding to  D i n , and * denotes the convolution.
(2) Compressing the features U and generating channel statistics are achieved using global average pooling, and the statistics are denoted as S1 and S2, respectively. Its kth pixel can be expressed as
S k 1 = F L ( D L i n ) = 1 H × W i = 1 H j = 1 W u k ( i , j )
S k 2 = F L ( D H i n ) = 1 H × W i = 1 H j = 1 W u k ( i , j )
where W and H denote the width and height, respectively, and  u k   denotes the feature map of each channel.
(3) A bottleneck layer is used to limit the complexity of the model and acquire channel relationship information  x 1  and  x 2 .
x 1 = F L S ( S 1 , R ) = θ 1 ( R 1 θ 2 ( R 2 θ 1 ) )
x 2 = F H S ( S 2 , R ) = θ 1 ( R 1 θ 2 ( R 2 θ 2 ) )
where  R 1  and  R 2   denote fully connected layers, and  θ 1   and  θ 2   denote sigmoid and ReLU, respectively. The channel-by-channel outputs of the low-level features  x 1  and the high-level features  x 2  are then combined using the Fadd function.
x = F a d d ( ) = x 1 + x 2
(4) DHout is obtained by activating the channel relation information x and rescaling the feature U.
D ˜ H o u t k = F b a s e ( T k , V k ) = V k T k
where Tk   H × W     is the set of information on the scaling of the feature U, Vk is the set of channel relationship information,  D ˜ H o u t k  = [ D ˜ H o u t 1 ,   D ˜ H o u t 2 ,   ,   D ˜ H o u t k ], and    F b a s e ( T k ,   V k )  is obtained from Vk. The feature mapping Tk   H × W   is obtained by multiplying them channel by channel. In addition, the final output  D H o u t *  is obtained by connecting with  D H o u t  and  D L i n  in this paper.

2.3. Loss Function

The dice loss function is a good choice for scenes with an imbalance between changed and unchanged samples. The function focuses more on mining the information of change regions during training, but its training is unstable for small target buildings, and in addition, it can produce gradient overfitting in extreme cases. The cross-entropy loss function measures the distance between the real and predicted outputs. The lower the entropy value is, the closer the two probability distributions are, and this value also determines the experimental training gradient. The smaller the value is, the slower the gradient updates, and the larger the gradient is, the faster the parameter updates. The update iteration of the parameter can compensate for the unstable results using a single dice loss [47] function. Therefore, a hybrid loss function with a weighted combination of dice loss and cross-entropy loss was used to optimize Siam-EMNet. It is defined as
L l o s s = L D i c e + L C E = 1 Z i = 1 Z β p i log y i + α p i y i p i + y i  
where pi and yi denote the predicted feature maps and ground truth, respectively, and Z denotes the batch size. Furthermore, two hyperparameters (0 < β < 5 and 0 < α < 5) are used to control the effect of the loss function. The best performance was achieved when β = 0.5 and α = 2 by adjusting the parameters during training.

3. Experimental Results and Analysis

3.1. Dataset

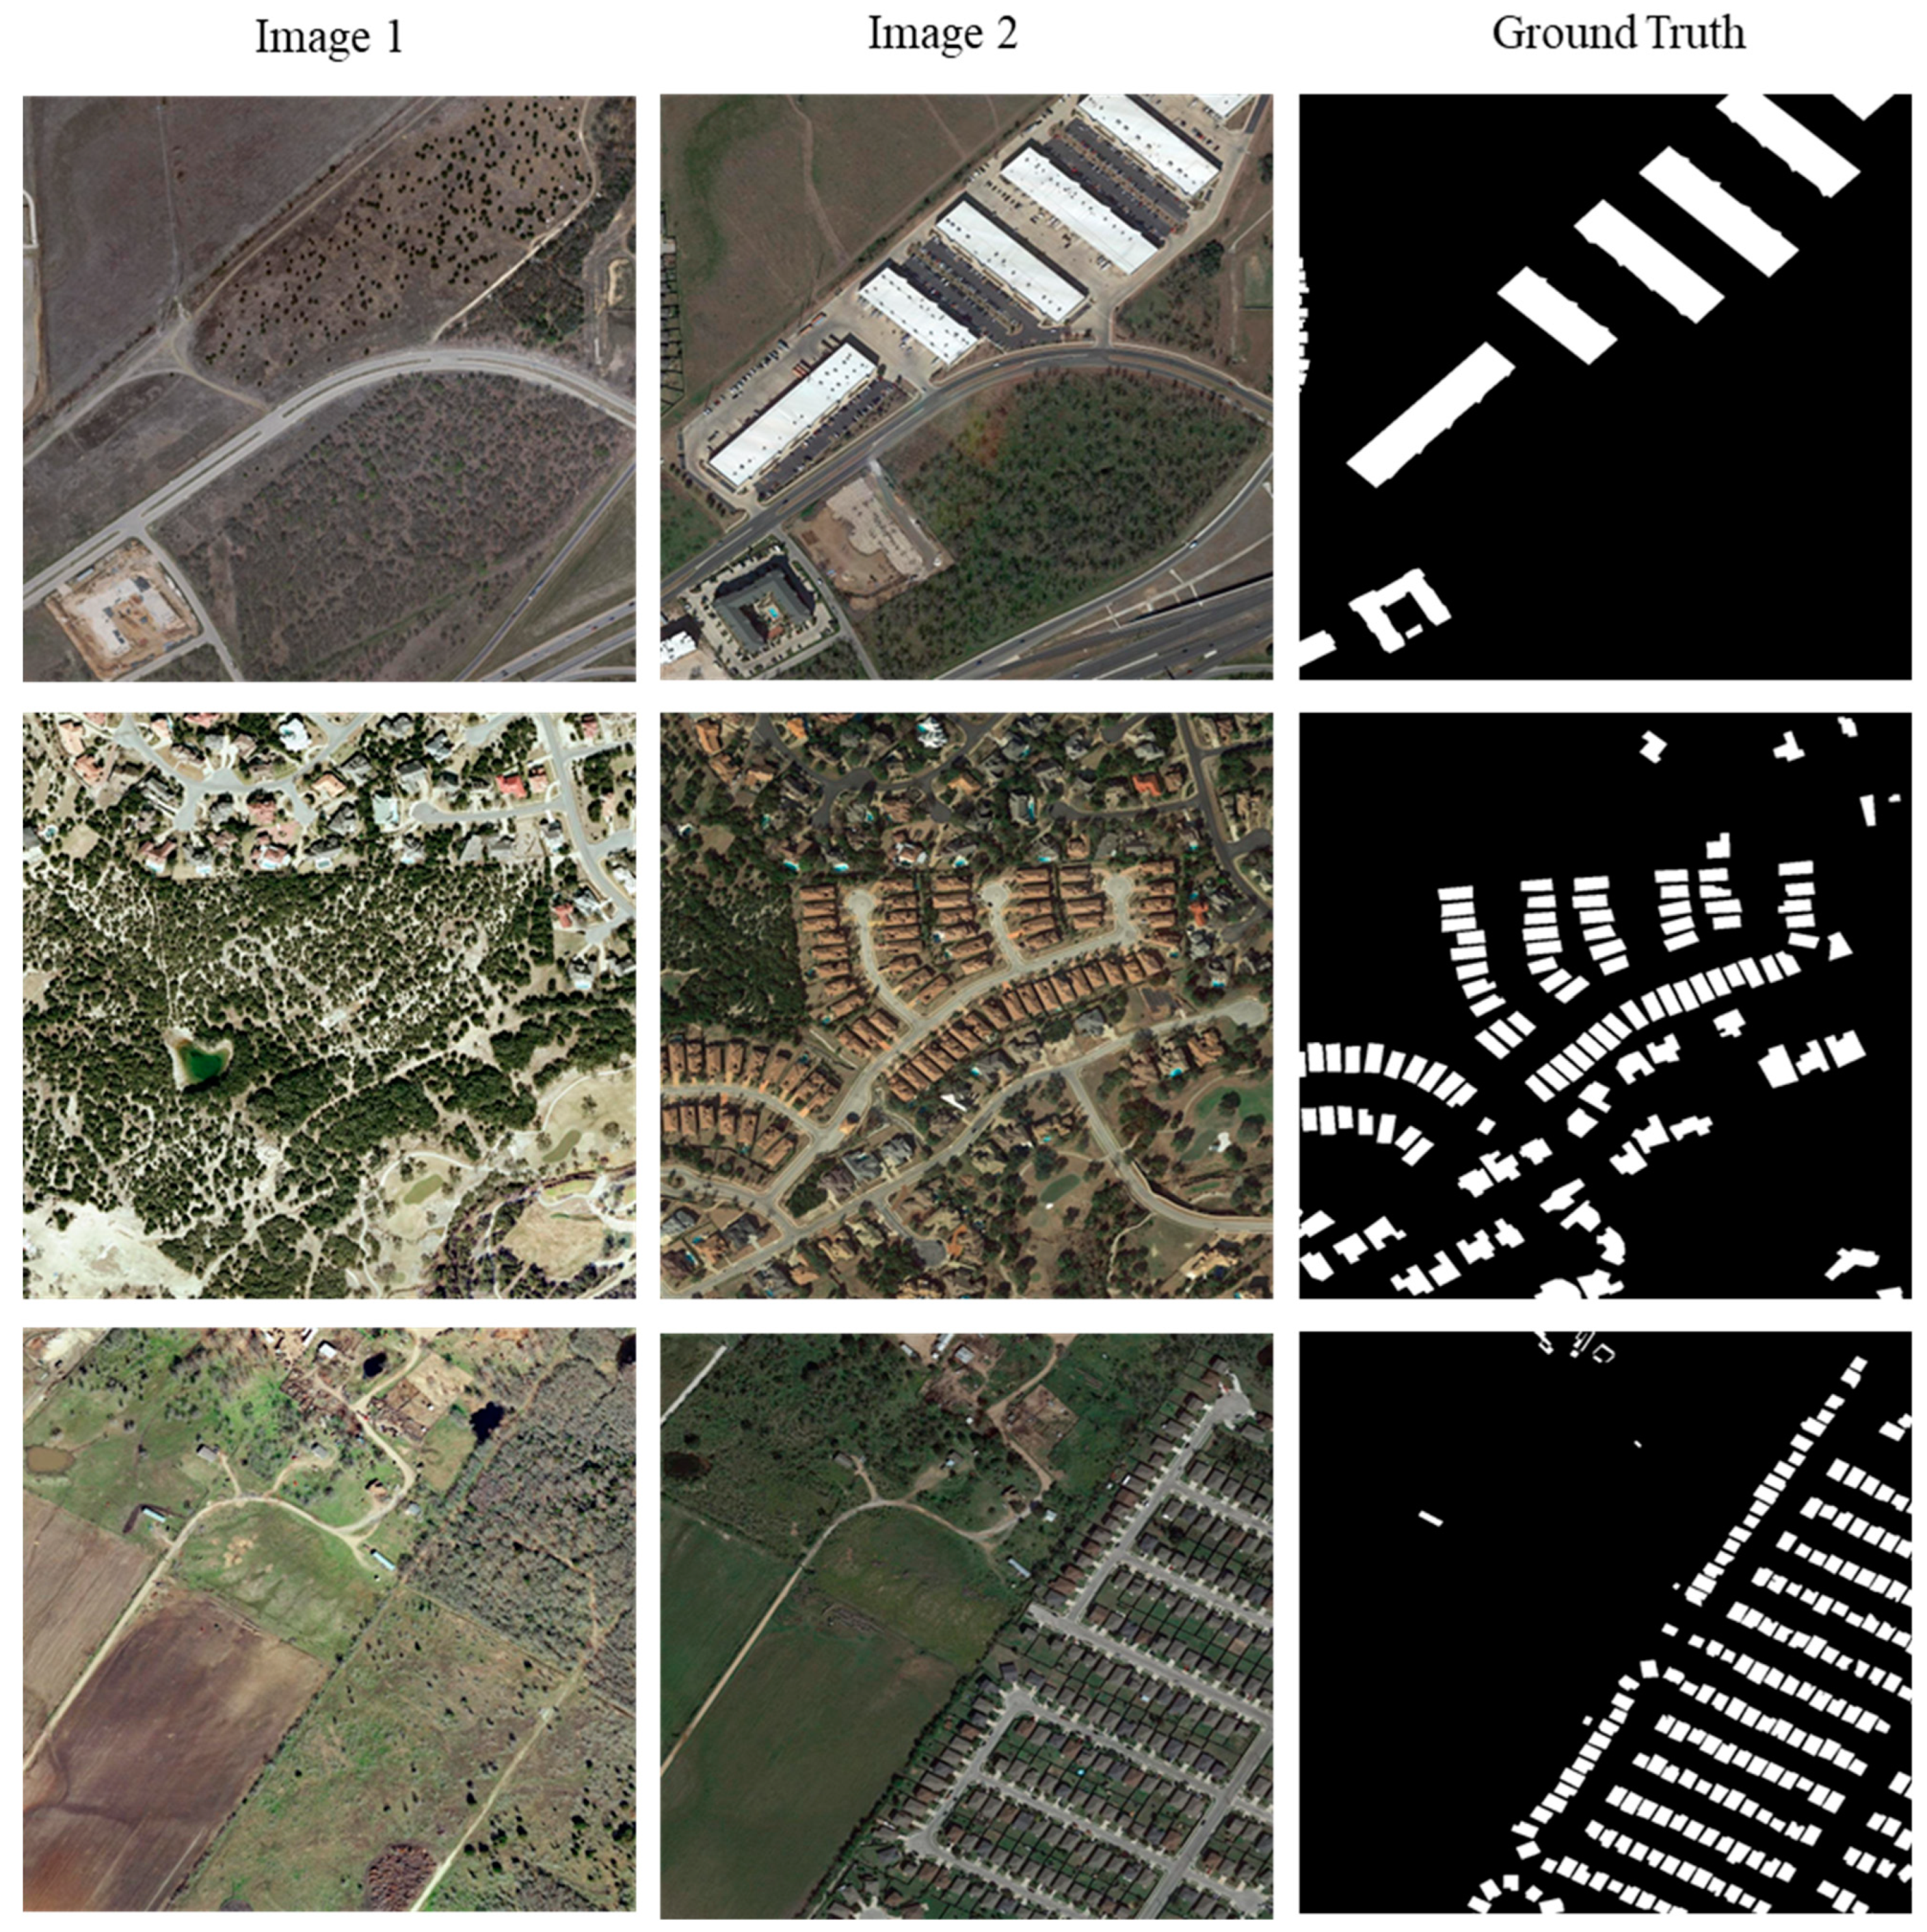
The LEVIR-CD [30] of the building change detection dataset published in 2020 was used. This dataset consists of 637 pairs of 1024 pixels × 1024 pixels VHR Google Earth images, with bi-temporal images from more than 20 areas in Texas, US, with a spatial resolution of 0.5 m (Figure 4). A total of 31,333 buildings of varying styles are included in the dataset. The method in this paper takes 445 pairs of images as the training set, 128 pairs for the test set, and 64 pairs for the validation set.

3.2. Experimental Design

To verify the superiority of the Siam-EMNet network in building change detection, two groups of comparative experiments were designed. Group 1 is the effect of different encoders on the model. In the Siam-EMNet network model, the pretrained EfficientNet B4 encoder structure is used (see Section 2.1). To verify its validity and reasonableness, it is compared with the encoder structures of MobileNet V2 [48], XCEP [49], ResNet34 [41], and VGG13 [40]; Group 2 is the comparison between different methods. The proposed Siam-EMNet network model is compared with BIT [10], CDNet [50], DSIFN [51], L-Unet [52], P2V-CD [53], and SNUNet [29].
To speed up training and increase training samples, the original images were cropped to 256 pixels × 256 pixels. The method was implemented on the PyTorch platform with all model environments using an NVIDIA GeForce RTX 3090, and 64 GB of RAM. We used the Adam optimizer, with an initial learning rate of 0.0001, an adjustment multiplier of 0.1, 80 iterations, and eight batches.

3.3. Evaluation Indicators

To effectively evaluate the detection performance of the Siam-EMNet network model for building change detection, the recall, precision, accuracy, and F1-score are selected as evaluation indices. The equations are shown as follows:
  Recall = TP TP + FN
Precision = TP TP + FP
Accuracy = TP + TN TP + TN + FP + FN
F 1 - score = 2 × Precision × Recall Precision + Recal
TN, TP, FN, and FP in (15), (16), and (17) are the numbers of true negatives, true positives, false negatives, and false positives, respectively.

3.4. Analyzing the Experimental Results

3.4.1. Experimental Results Obtained from Different Encoders

In this paper, EfficientNet B4 is compared with some currently popular encoders, and the quantitative results in Table 2 show that EfficientNet B4 has a good performance with 92.00% precision, 88.51% recall, 95.71% accuracy, and 90.21% F1-score on the LEVIR-CD dataset. Its F1-score was improved by 13.63%, 15.76%, 10.80%, and 9.99% compared to that of MobileNet V2, XCEP, ResNet34, and VGG13, respectively. The significant effect of the EfficientNet B4 encoder on detecting building changes in the dataset is demonstrated.

3.4.2. Comparison between Different Methods

To verify the effectiveness of Siam-EMNet, some SOTA (state-of-the-art) methods were compared, including BIT, CDNet, DSIFN, L-Unet, P2V-CD, and SNUNet. A similar preprocessing method was used in all experiments, and the parameter values were adjusted to make the experimental results comparable. A comparison in Table 3 shows that the proposed method achieved the highest recall, accuracy, and F1-score of the four evaluation indicators. Precision was suboptimal, 2.56% lower than DSIFN, but the recall, accuracy, and F1-score of the proposed method were 7.69%, 0.78%, and 3.06% higher than DSIFN. Experimental results show that Siam-EMNet performs well in detecting building changes.
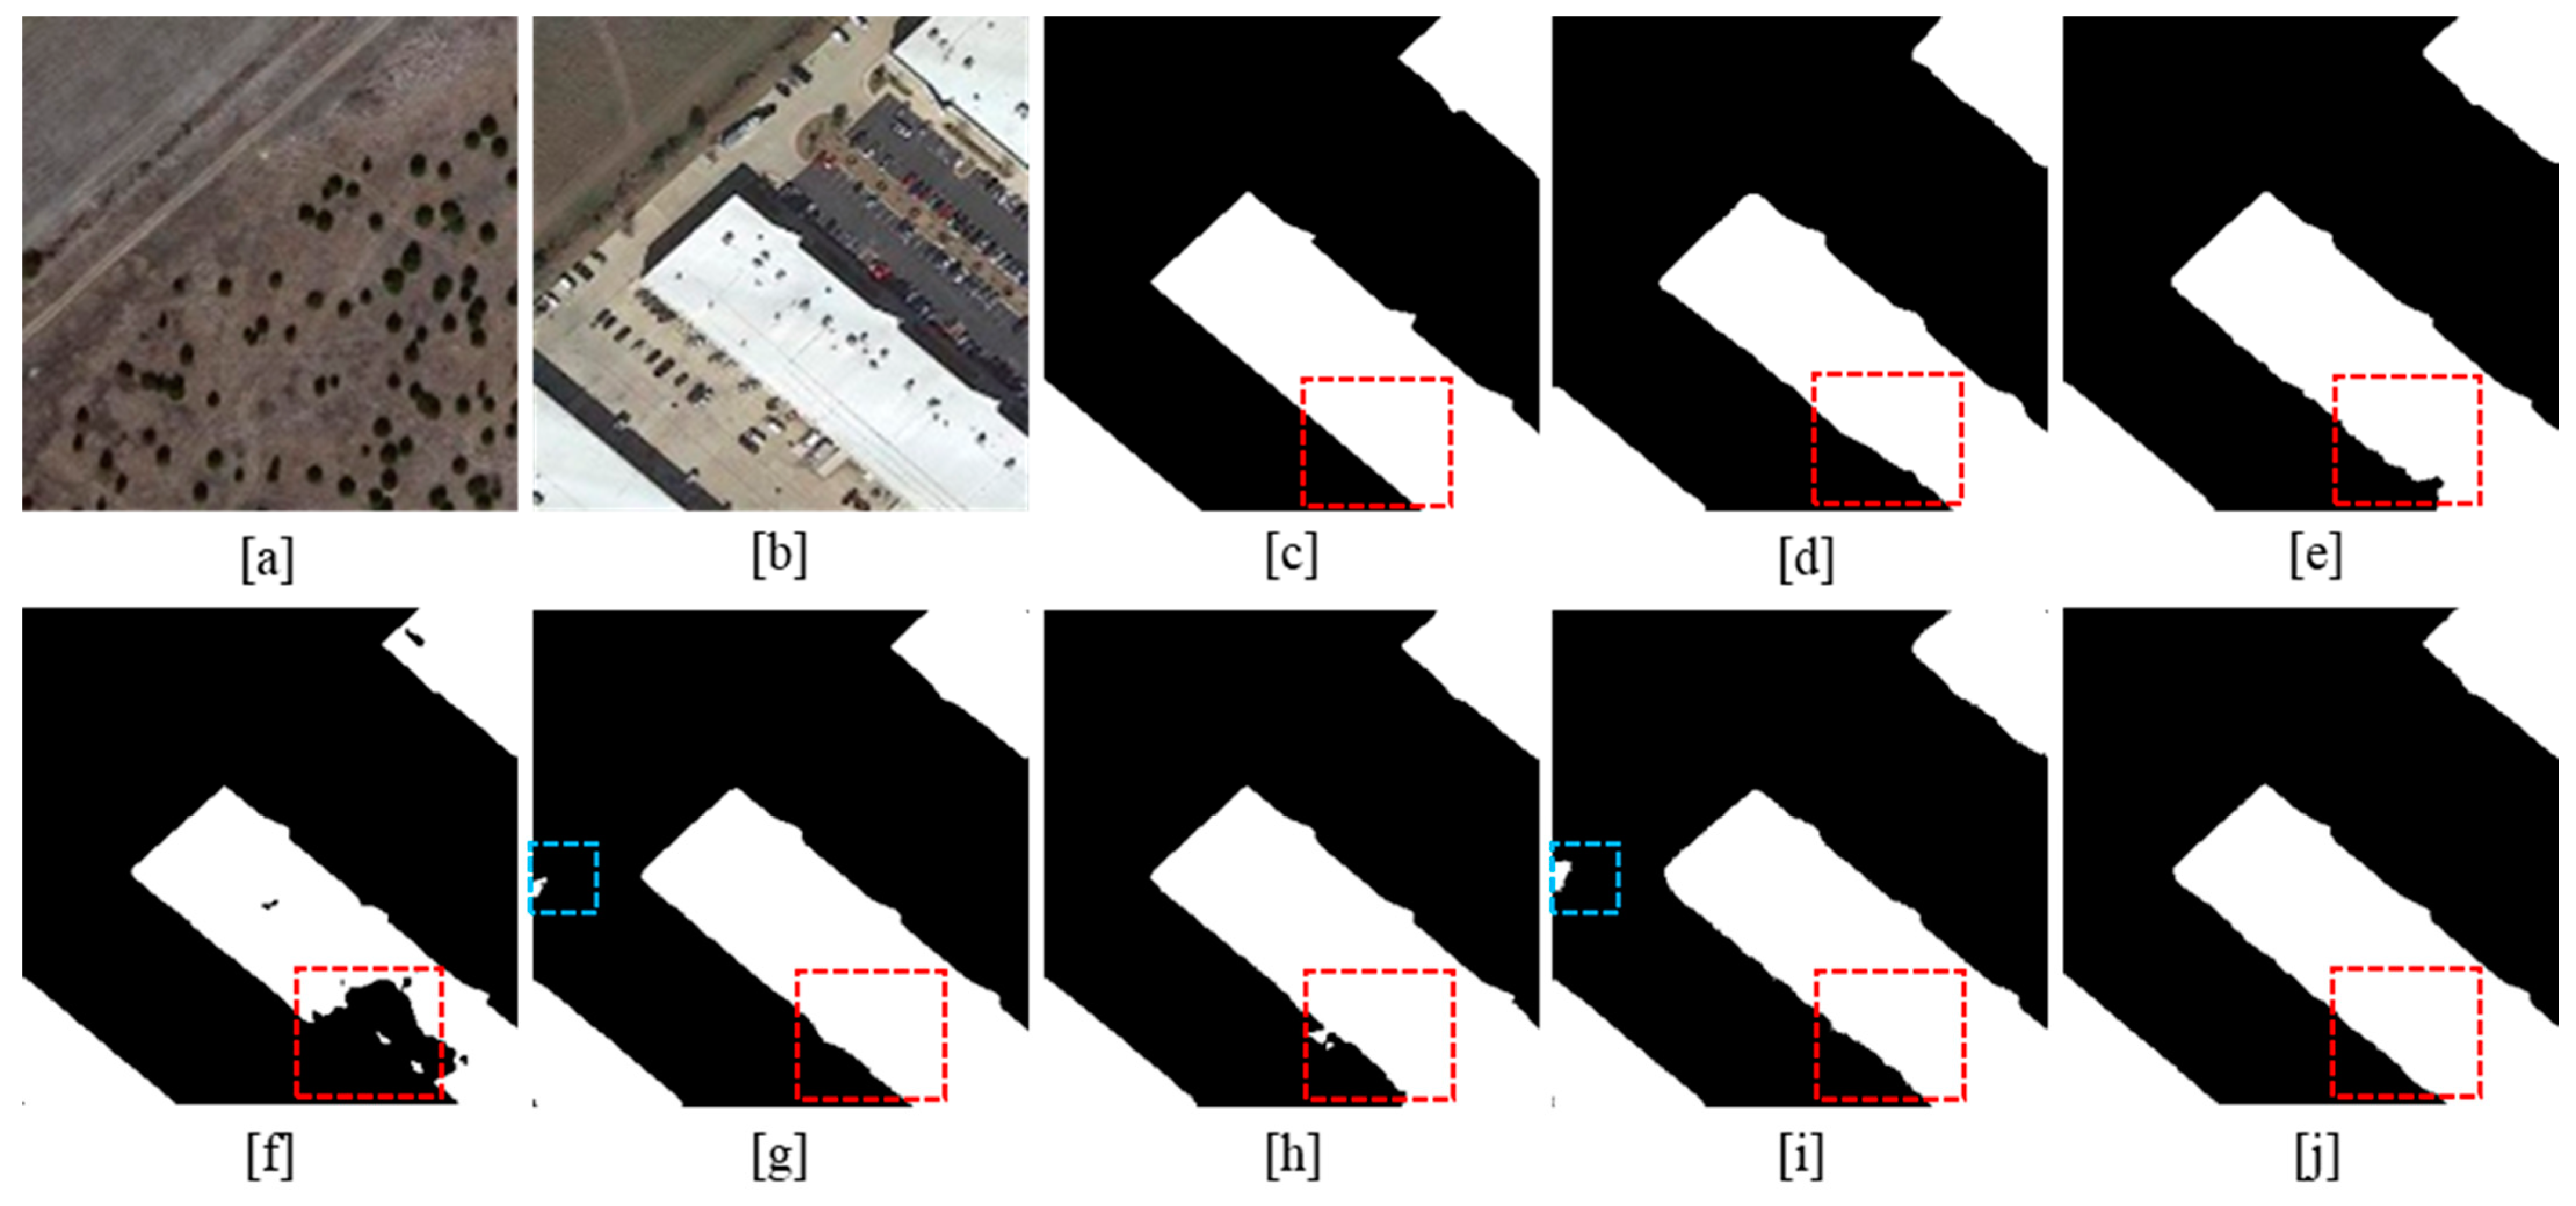
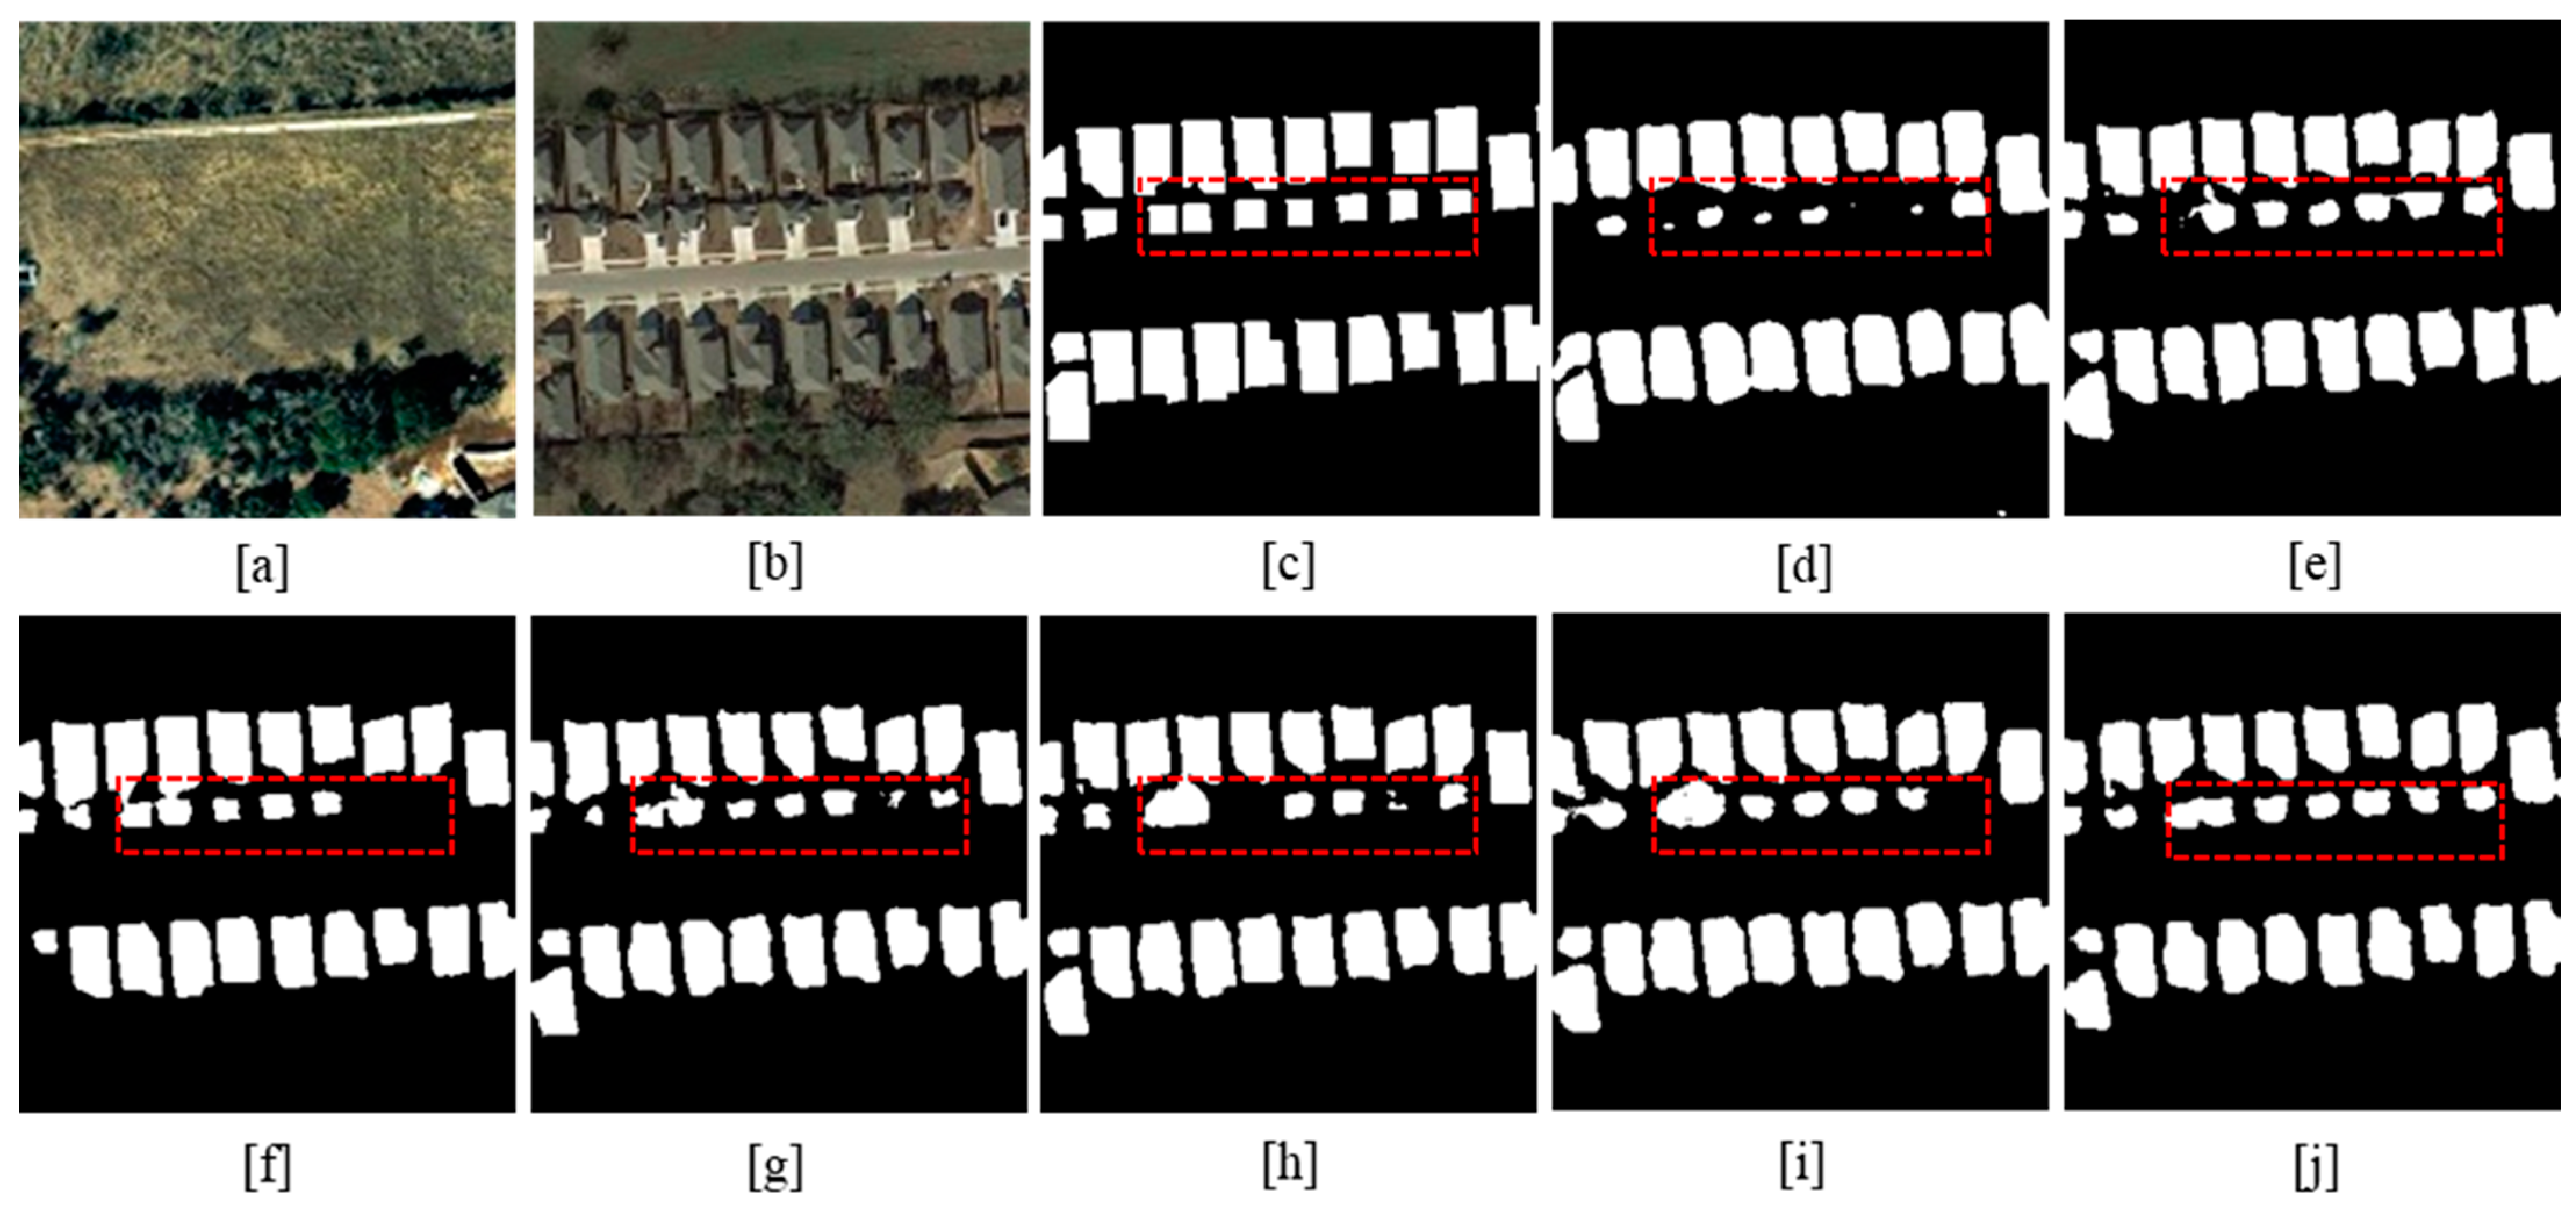
To further illustrate the excellent performance of the method in this paper, three scenarios were employed for elaboration in the experiments, as shown in Figure 5, Figure 6 and Figure 7 (256 pixels × 256 pixels).
According to the quantitative assessment results in Table 4, the Siam-EMNet model did not achieve optimal values for the recall metrics but did achieve optimal values for precision, accuracy, and F1-score. Figure 5 shows the change detection results for the large target buildings. It can be seen from the change detection results that, for the large target building scene, the BIT, CDNet, and DSIFN models have missed detection, especially DSIFN, which has a large area of missed detection, and the building edge integrity is poor; the P2V-CD model basically identifies changing building areas and obtains the best recall in Table 4, but there are misdetections in the red box; the L-Unet and SNUNet models have more complete building detection, but poor detection in the blue box at the edge of the image, with misdetection problems; the Siam-EMNet method is highly fused with deep and shallow information, can efficiently use the edge information of buildings in VHR remote sensing images, and the detection of the building edge is more consistent with the actual edge.
Figure 6 shows the change detection results for small target buildings. From the comparison results, the BIT, DSIFN, and P2V-CD models significantly missed detection. In contrast, the performance of L-Unet, P2V-CD, and SNUNet has been improved, especially the L-Unet method, which has high precision, although there are still some missed detections. SNUNet, although it obtains the best recall, has a 3.9% lower precision than that of the proposed method. The Siam-EMNet method maintains good detection performance in some small target buildings, which improves the problems of missed detection and edge blur in the detection of small target buildings. The results of the quantitative analysis in Table 5 show that the proposed Siam-EMNet model has the best precision, accuracy, and F1-score, although its recall is suboptimal. As a result of combining qualitative and quantitative results, it can be concluded that Siam-EMNet provides the best overall performance.
Figure 7 shows the change detection results for dense building clusters. In Figure 7, the buildings are intricate and are susceptible to interference by shadows and adjacent ground objects in the background. From Figure 7d–j, it can be seen that all seven models can determine the location of the changing building, but there is a large gap in the building edge detection effect. The red dashed box shows that the CDNet, L-Unet, P2V-CD, and SNUNet models are highly affected by the background information and are less effective in recognizing the edges of the buildings, with evident misdetection problems. The BIT model is better at this location but has detection errors in areas where the buildings are very densely populated, such as at the blue dashed box. DSIFN shows strong performance in the detection of building changes, but the fit of building edge is low and missed detection occurs. The Siam-EMNet method effectively avoids the influence of roads and shadows in the background, detects the complete edge information of buildings, has a strong anti-interference property, and has better edge detection results. Table 6 shows the quantitative assessment results of the seven models. In Table 6, although the DSIFN method precision is better than the proposed method, the proposed method’s recall, accuracy, and F1-score are optimal, with better overall performance than the other six methods.

4. Discussion

(1)
Validation of model generalization
A single dataset cannot measure the generalizability of the model. In addition to the LEVIR-CD dataset, experiments were also performed on the WHU-CD [54] change detection dataset, which is provided by Shunping Ji’s team at Wuhan University, with a spatial resolution of 0.075 m and a spatial size of 32,507 pixels × 15,354 pixels, and the original image is cropped to 256 pixels × 256 pixels by preprocessing. The method in this paper uses 3107 pairs of images as the training set, in addition to 923 pairs for the test set and 433 pairs for the validation set. The quantitative assessment results of the WHU-CD dataset are shown in Table 7, with 92.22%, 93.46%, 95.92%, and 92.77% for the Siam-EMNet method’s precision, recall, accuracy, and F1-score, respectively. Compared to SOTA methods, Siam-EMNet has an optimal recall, accuracy, and F1-score, and precision is only lower than DSIFN; however, the recall, accuracy, and F1-score of the proposed method were 11.66%, 1.23%, and 4.5% higher than DSIFN. The higher the recall, the lower the missed rate of the model, and consequently the more complete the detection of the change regions. Using two datasets, the proposed network model is validated for better generalization.
(2)
Effect of different versions of EfficientNet on change detection results
EfficientNet has eight versions of EfficientNet B0-B7. Different versions of EfficientNet have different abilities to extend depth, width, and resolution, and have certain requirements on image resolution and feature type as well as computer capability. To explore the performance difference of different versions of EfficientNet in building change detection, this paper uses the EfficientNet B0–B6 structure as the encoder. Due to the fact that EfficientNet B7 has relatively high computing power requirements, it is not used as a comparative experiment. As seen from the quantitative assessment results in Table 8, the EfficientNet B4 architecture selected in this paper has the best performance in detecting changes in buildings.
(3)
Effect of different loss functions the change detection results
In this paper, the effect of hybrid loss functions on model performance is explored through ablation experiments. As seen from the quantitative assessment results in Table 9, when the cross-entropy loss function is used alone, precision is slightly higher than the hybrid loss function used by the proposed method, but the recall, accuracy, and F1-score values are lower than the hybrid loss function used. Therefore, the combination of the dice loss function and the cross-entropy loss function optimizes the proposed model to the greatest extent and reduces the detection error caused by the imbalance between the changed and unchanged samples.

5. Conclusions

A VHR remote sensing image building change detection network based on Siamese EfficientNet B4-MANet (Siam-EMNet) was proposed to solve the problems of the incomplete detection of change areas and rough edges in the field of building change detection. The encoder structure compound expands the width, depth, and resolution of the network and enhances the ability to extract building feature information. The decoder structure integrates PAB and MFAB, enhancing the detection of building edge details and effectively avoiding the missed detection of small regions. The encoder can effectively extract the bi-temporal feature information of VHR remote sensing images by skipping connections between the encoder and decoder to achieve efficient multilevel information fusion. The results obtained using the LEVIR-CD dataset show that Siam-EMNet is effective for building change detection with a precision, recall, accuracy, and F1-score of 92.00%, 88.51%, 95.71%, and 90.21%, respectively. Compared to BIT, CDNet, DSIFN, L-Unet, P2V-CD, and SNUNet, Siam-EMNet achieves the best comprehensive performance. Additionally, the WHU-CD dataset was used to verify the generalizability of the network model, and the results show that the proposed network model has a good generalization. Despite the outstanding advantages of EfficientNet B4 in terms of accuracy, the model itself has a large number of parameters. Therefore, in future research, the number of parameters of the model can be reduced by pruning to improve the adaptability of the model.
Author Contributions

Q.T.: algorithm proposed and testing, manuscript writing, and research conceptualization. L.H.: funding acquisition, directing, and manuscript writing. B.-H.T.: project administration and supervision. W.L.: data processing. M.W.: data processing. X.M.: data processing. All authors have read and agreed to the published version of the manuscript.

Funding

This research was funded by Yunnan Fundamental Research Project (grant NO. 202201AT070164), Hunan Provincial Natural Science Foundation of China (grant NO. 2023JJ60561).

Data Availability Statement

If you would like to obtain the data that were used in this study, please contact the corresponding author.

Conflicts of Interest

The authors declare no conflict of interest.

References

  1. Yang, X.; Lv, Z.; Benediktsson, J.A.; Chen, F. Novel Spatial–Spectral Channel Attention Neural Network for Land Cover Change Detection with Remote Sensed Images. Remote Sens. 2023, 15, 87. [Google Scholar] [CrossRef]
  2. Shi, S.N.; Zhong, Y.F.; Zhao, J.; Lv, P.Y.; Liu, Y.H.; Zhang, L.P. Land-Use/Land-Cover Change Detection Based on Class-Prior Object-Oriented Conditional Random Field Framework for High Spatial Resolution Remote Sensing Imagery. IEEE Trans. Geosci. Remote Sens. 2020, 60, 1–16. [Google Scholar] [CrossRef]
  3. Liu, M.X.; Chai, Z.Q.; Deng, H.J.; Liu, R. A CNN-Transformer Network with Multiscale Context Aggregation for Fine-Grained Cropland Change Detection. IEEE J. Sel. Topics Appl. Earth Observ. Remote Sens. 2022, 15, 4297–4306. [Google Scholar] [CrossRef]
  4. Zheng, Z.; Zhong, Y.F.; Wang, J.J.; Ma, A.; Zhang, L.P. Building Damage Assessment for Rapid Disaster Response with a Deep Object-Based Semantic Change Detection Framework: From Natural Disasters to Man-Made Disasters. Remote Sens. Environ. 2021, 265, 112636. [Google Scholar]
  5. Dille, A.; Kervyn, F.; Handwerger, A.L.; d’Oreye, N.; Derauw, D.; Bibentyoet, T.M.; Samsonov, S.; Malet, J.; Kervyn, M.; Dewitte, O. When Image Correlation is Needed: Unravelling the Complex Dynamics of a Slow-Moving Landslide in The Tropics with Dense Radar and Optical Time Series. Remote Sens. Environ. 2021, 258, 112402. [Google Scholar] [CrossRef]
  6. Zelinski, M.E.; Henderson, J.; Smith, M. Use of Landsat 5 for Change Detection at 1998 Indian and Pakistani Nuclear Test Sites. IEEE J. Sel. Topics Appl. Earth Observ. Remote Sens. 2014, 7, 3453–3460. [Google Scholar]
  7. Zhang, Z.X.; Jiang, H.W.; Pang, S.Y.; Hu, X.Y. Review and Prospect in Change Detection of Multi-Temporal Remote Sensing Images. Acta Geod. Cartogr. Sin. 2022, 51, 1091–1107. [Google Scholar]
  8. Park, S.; Song, A. Hybrid Approach Using Deep Learning and Graph Comparison for Building Change Detection. GIsci Remote Sens. 2023, 60, 1548–1603. [Google Scholar] [CrossRef]
  9. Huang, X.; Zhang, L.P.; Zhu, T.T. Building Change Detection from Multitemporal High-Resolution Remotely Sensed Images Based on a Morphological Building Index. IEEE J. Sel. Topics Appl. Earth Observ. Remote Sens. 2014, 7, 105–115. [Google Scholar] [CrossRef]
  10. Chen, H.; Qi, Z.; Shi, Z.W. Remote Sensing Image Change Detection with Transformers. IEEE Trans Geosci Remote Sens. 2021, 60, 1–14. [Google Scholar] [CrossRef]
  11. Chen, J.; Gong, P.; He, C.Y.; Pu, R.L.; Shi, P.J. Land-Use/Land-Cover Change Detection Using Improved Change-Vector Analysis. Photogramm. Eng. Remote Sens. 2003, 69, 369–380. [Google Scholar] [CrossRef] [Green Version]
  12. Hu, J.; Zhang, Y. Seasonal Change of Land-Use/Land-Cover (LULC) Detection Using MODIS Data in Rapid Urbanization Regions: A Case Study of the Pearl River Delta Region (China). IEEE J. Sel. Topics Appl. Earth Observ. Remote Sens. 2013, 6, 1913–1920. [Google Scholar] [CrossRef]
  13. Walter, V. Object-Based Classification of Remote Sensing Data for Change Detection. ISPRS J. Photogramm. Remote Sens. 2004, 58, 225–238. [Google Scholar] [CrossRef]
  14. Radke, R.J.; Andra, S.; Al-Kofahi, O.; Roysamet, B. Image Change Detection Algorithms: A Systematic Survey. IEEE Trans. Image Process. 2005, 14, 294–307. [Google Scholar] [CrossRef]
  15. Singh, A. Review Article Digital Change Detection Techniques Using Remotely-Sensed Data. Int. J. Remote Sens. 1989, 10, 989–1003. [Google Scholar] [CrossRef] [Green Version]
  16. Yuan, X.X.; Song, Y.A. Building Change Detection Method Considering Projection Influence Based on Spectral Feature and Texture Feature. Geomatics Inf. Sci. Wuhan Univ. 2007, 32, 89–493. [Google Scholar]
  17. Huang, X.; Zhang, L.P. A Multidirectional and Multiscale Morphological Index for Automatic Building Extraction from Multispectral Geoeye-1 Imagery. Photogramm. Eng. Rem. S 2011, 12, 721–732. [Google Scholar] [CrossRef]
  18. Varshney, A. Improved NDBI Differencing Algorithm for Built-Up Regions Change Detection from Remote-Sensing Data: An Automated Approach. Remote Sens. Lett. 2013, 4, 504–512. [Google Scholar] [CrossRef]
  19. Seo, D.K.; Kim, Y.H.; Eo, Y.D.; Mi, H.L.; Wan, Y.P. Fusion of SAR and Multispectral Images Using Random Forest Regression for Change Detection. ISPRS Int. J. Geoinf. 2018, 7, 401. [Google Scholar] [CrossRef] [Green Version]
  20. Xie, Z.W.; Wang, M.; Han, Y.H.; Yang, D.Y. Hierarchical Decision Tree for Change Detection Using High Resolution Remote Sensing Images. In Proceedings of the 6th Conference on Geo-Informatics in Sustainable Ecosystem and Society, Handan, China, 25–26 September 2018. [Google Scholar]
  21. Huo, C.L.; Chen, K.M.; Ding, K.; Zhou, Z.X.; Pan, C.H. Learning Relationship for Very High Resolution Image Change Detection. IEEE J. Sel. Topics Appl. Earth Observ. Remote Sens. 2016, 9, 3384–3394. [Google Scholar] [CrossRef]
  22. Touati, R.; Mignotte, M.; Dahmane, M. Multimodal Change Detection in Remote Sensing Images Using an Unsupervised Pixel Pairwise-Based Markov Random Field Model. IEEE Trans. Image Process. 2020, 29, 757–767. [Google Scholar] [CrossRef]
  23. Hao, M.; Zhou, M.C.; Jin, J.; Shi, W.Z. An Advanced Superpixel-Based Markov Random Field Model for Unsupervised Change Detection. IEEE Geosci. Remote Sens. Lett. 2020, 17, 1401–1405. [Google Scholar] [CrossRef]
  24. Tan, K.; Du, P.J. Hyperspectral Remote Sensing Image Classification Based on Support Vector Machine. J. Infrared Millim W 2008, 27, 123–128. [Google Scholar] [CrossRef]
  25. Zhang, Z.Q.; Zhang, X.C.; Xin, Q.C.; Yang, X.L. Combining the Pixel-based and Object-based Methods for Building Change Detection Using High-resolution Remote Sensing Images. Acta Geod. Cartogr. Sin. 2018, 47, 102–112. [Google Scholar]
  26. Zhu, B.; Gao, H.M.; Wang, X.; Xu, M.X.; Zhu, X.B. Change Detection Based on the Combination of Improved Segnet Neural Network and Morphology. In Proceedings of the 3rd IEEE International Conference on Image, Vision and Computing, Chongqing, China, 27–29 June 2018. [Google Scholar]
  27. Peng, D.; Zhang, Y.; Guan, H. End-To-End Change Detection for High Resolution Satellite Images Using Improved Unet++. Remote Sens. 2019, 11, 1382. [Google Scholar] [CrossRef] [Green Version]
  28. Daudt, R.C.; Saux, B.L.; Boulch, A. Fully Convolutional Siamese Networks for Change Detection. In Proceedings of the 25th IEEE International Conference on Image Processing, Athens, Greece, 7–10 October 2018. [Google Scholar]
  29. Fang, S.; Li, K.Y.; Shao, J.Y.; Li, Z. SNUNet-CD: A Densely Connected Siamese Network for Change Detection of VHR Images. IEEE Geosci. Remote Sens. Lett. 2021, 19, 1–5. [Google Scholar] [CrossRef]
  30. Chen, H.; Shi, Z.W. A Spatial-Temporal Attention-Based Method and A New Dataset for Remote Sensing Image Change Detection. Remote Sens. 2020, 12, 1662. [Google Scholar] [CrossRef]
  31. Liu, Y.; Pang, C.; Zhan, Z.Q.; Zhang, X.M.; Yang, X. Building Change Detection for Remote Sensing Images Using a Dual-Task Constrained Deep Siamese Convolutional Network Model. IEEE Geosci. Remote Sens. Lett. 2020, 18, 811–815. [Google Scholar] [CrossRef]
  32. Shen, Q.; Huang, J.R.; Wang, M.; Tao, S.K.; Yang, R.; Zhang, X. Semantic Feature-Constrained Multitask Siamese Network for Building Change Detection in High-Spatial-Resolution Remote Sensing Imagery. ISPRS J. Photogramm. Remote Sens. 2022, 189, 78–94. [Google Scholar] [CrossRef]
  33. Fu, J.; Liu, J.; Tian, H.J.; Li, Y.; Bao, Y.J.; Fang, Z.W.; Lu, H.Q. Dual Attention Network for Scene Segmentation. In Proceedings of the 32nd IEEE Conference on Computer Vision and Pattern Recognition, Long Beach, CA, USA, 16–20 June. 2019. [Google Scholar]
  34. Chen, J.; Yuan, Z.; Peng, J.; Chen, L.; Huang, H.Z.; Zhu, J.W.; Liu, Y.; Li, H.F. DASNet: Dual Attentive Fully Convolutional Siamese Networks for Change Detection in High-Resolution Satellite Images. IEEE J. Sel. Topics Appl. Earth Observ. Remote Sens. 2020, 14, 1194–1206. [Google Scholar] [CrossRef]
  35. Lie, Y.J.; Yu, J.M.; and Chan, S.X. SNLRUX++ for Building Extraction from High-Resolution Remote Sensing Images. IEEE J. Sel. Topics Appl. Earth Observ. Remote Sens. 2021, 15, 409–421. [Google Scholar]
  36. Wang, C.; Wang, S.; Chen, X.; Li, J.Y.; Xie, T. Object-Level Change Detection of Multi-Sensor Optical Remote Sensing Images Combined with Unet++ and Multi-Level Difference Module. Acta Geod. Cartogr. Sin. 2023, 52, 283–296. [Google Scholar]
  37. Deng, W.J.; Shi, Q.; Li, J. Attention-Gate-Based Encoder–Decoder Network for Automatical Building Extraction. IEEE J. Sel. Topics Appl. Earth Observ. Remote Sens. 2021, 14, 2611–2620. [Google Scholar] [CrossRef]
  38. Tan, M.X.; Le, Q. Efficientnet: Rethinking Model Scaling for Convolutional Neural Networks. In Proceedings of the 37th IEEE International Conference on Machine Learning, Long Beach, CA, USA, 9–15 June 2020. [Google Scholar]
  39. Krizhevsky, A.; Sutskever, I.; Hinton, G.E. Imagenet Classification with Deep Convolutional Neural Networks. Commun. ACM 2017, 60, 84–90. [Google Scholar] [CrossRef] [Green Version]
  40. Simonyan, K.; Zisserman, A. Very Deep Convolutional Networks for Large-Scale Image Recognition. arXiv 2014, arXiv:1409.1556. Available online: https://arxiv.org/abs/1409.1556 (accessed on 10 April 2015).
  41. He, K.M.; Zhang, X.Y.; Ren, S.Q.; Sun, J. Deep Residual Learning for Image Recognition. In Proceedings of the 29th IEEE Conference on Computer Vision and Pattern Recognition, Las Vegas, NV, USA, 26 June–1 July 2016. [Google Scholar]
  42. Szegedy, C.; Vanhoucke, V.; Ioffe, S.; Shlens, J.; Wojna, Z. Rethinking the Inception Architecture for Computer Vision. In Proceedings of the IEEE Conference on Computer Vision and Pattern Recognition, Las Vegas, NV, USA, 26 June–1 July 2016. [Google Scholar]
  43. Huang, Y.P.; Cheng, Y.L.; Bapna, A.; Firat, O.; Chen, M.X.; Chen, D.H.; Lee, H.; Ngiam, J.Q.; Le, Q.; Wu, Y.H.; et al. Gpipe: Efficient Training of Giant Neural Networks Using Pipeline Parallelism. arXiv 2018, arXiv:1811.06965. Available online: https://arxiv.org/abs/1811.06965 (accessed on 25 July 2019).
  44. Sevim, Z.; Dogan, H.; Demir, Z.; Sezen, F.S.; Dogan, R.O. An Extensive Study: Creation of A New Inverted Microscope Image Data Set and Improving Auto-Encoder Models for Higher Accuracy Segmentation of HaCaT Cell Culture Line. In Proceedings of the 5th International Congress on Human-Computer Interaction, Optimization and Robotic Applications (HORA), Istanbul, Turkiye, 8–10 June 2023. [Google Scholar]
  45. Fan, T.L.; Wang, G.L.; Li, Y.; Wang, H.R. Ma-Net: A Multi-Scale Attention Network for Liver and Tumor Segmentation. IEEE Access. 2020, 8, 179656–179665. [Google Scholar] [CrossRef]
  46. Hu, J.; Shen, L.; Sun, G. Squeeze-and-Excitation Networks. In Proceedings of the 31st IEEE Conference on Computer Vision and Pattern Recognition, Salt Lake City, UT, USA, 18–23 June 2018. [Google Scholar]
  47. Li, X.; Sun, X.; Meng, Y.; Liang, J.J.; Wu, F.; Li, J.W. Dice Loss for Data-Imbalanced NLP Tasks. arXiv 2019, arXiv:1911.02855. Available online: https://arxiv.org/abs/1911.02855 (accessed on 29 August 2020).
  48. Alcantarilla, P.F.; Stent, S.; Ros, G.; Arroyo, R.; Gherardi, R. Street-View Change Detection with Deconvolutional Networks. Auton. Robot. 2018, 42, 1301–1322. [Google Scholar] [CrossRef]
  49. Mark, S.; Howard, A.; Zhu, M.L.; Zhmoginov, A.; Chen, L.C. MobileNetV2: Inverted Residuals and Linear Bottlenecks. In Proceedings of the 31st IEEE Conference on Computer Vision and Pattern Recognition, Salt Lake City, UT, USA, 18–23 June 2018. [Google Scholar]
  50. François, C. Xception: Deep Learning with Depthwise Separable Convolutions. arXiv 2016, arXiv:1610.02357. Available online: https://arxiv.org/abs/1610.02357 (accessed on 4 April 2017).
  51. Zhang, C.X.; Yue, P.; Tapete, D.; Jiang, L.C.; Shangguan, B.Y.; Huang, L.; Liu, G.C. A Deeply Supervised Image Fusion Network for Change Detection in High Resolution Bi-Temporal Remote Sensing Images. ISPRS J. Photogramm. Remote Sens. 2020, 166, 183–200. [Google Scholar] [CrossRef]
  52. Sun, S.T.; Mu, L.; Wang, L.Z.; Liu, P. L-UNet: An LSTM Network for Remote Sensing Image Change Detection. IEEE Geosci. Remote Sens. Lett. 2022, 19, 1–5. [Google Scholar] [CrossRef]
  53. Lin, M.H.; Yang, G.Y.; Zhang, H.Y. Transition Is a Process: Pair-to-Video Change Detection Networks for Very High Resolution Remote Sensing Images. IEEE Trans. Image Process. 2023, 32, 57–71. [Google Scholar] [CrossRef]
  54. Ji, S.P.; Wei, S.Q.; Lu, M. Fully Convolutional Networks for Multisource Building Extraction from an Open Aerial and Satellite Imagery Data Set. IEEE Trans. Geosci. Remote Sens. 2018, 57, 574–586. [Google Scholar] [CrossRef]
Figure 1. Structure diagram of Siam-EMNet.
Remotesensing 15 03972 g001
Figure 2. Structure diagram of single-branch EfficientNet B4.
Remotesensing 15 03972 g002
Figure 3. Attentional mechanisms: (a) PAB and (b) MFAB.
Remotesensing 15 03972 g003
Figure 4. Example of dataset.
Remotesensing 15 03972 g004
Figure 5. Change detection results of large target buildings. (a) T1 image (256 pixels × 256 pixels), (b) T2 image, (c) Truth map, (d) BIT, (e) CDNet, (f) DSIFN, (g) L-Unet, (h) P2V-CD, (i) SNUNet, and (j) Siam-EMNet (ours).
Remotesensing 15 03972 g005
Figure 6. Change detection results of small target building clusters. (a) T1 image (256 pixels × 256 pixels), (b) T2 image, (c) Truth map, (d) BIT, (e) CDNet, (f) DSIFN, (g) L-Unet, (h) P2V-CD, (i) SNUNet, and (j) Siam-EMNet (ours).
Remotesensing 15 03972 g006
Figure 7. Change detection results of dense building clusters. (a) T1 image (256 pixels × 256 pixels), (b) T2 image, (c) Truth map, (d) BIT, (e) CDNet, (f) DSIFN, (g) L-Unet, (h) P2V-CD, (i) SNUNet, and (j) Siam-EMNet (ours).
Remotesensing 15 03972 g007
Table 1. EfficientNet B0 network architecture.
Block
i
Operator
F ^ i
Layers
L ^ i
Resolution
H ^ i × W ^ i
Channels
C ^ i
1Conv 3 × 31224232
2MBConv, k3 × 31112216
3MBConv, k3 × 32112224
4MBConv, k5 × 5256240
5MBConv, k3 × 3328280
6MBConv, k5 × 53142112
7MBConv, k5 × 54142192
8MBConv, k3 × 3172320
9Conv1 × 1&Pooling&FC1721280
Table 2. Quantitative assessment results of EfficientNet B4 and other encoders.
EncoderLossPrecisionRecallAccuracyF1-Score
MobileNet V20.0415981.2877.9083.6376.58
XCEP0.0395776.3981.5883.3274.45
ResNet 340.0348985.6979.1385.4579.41
VGG 130.03285.2879.2484.6780.22
EfficientNet B40.0265292.0088.5195.7190.21
Optimal results are shown in bold.
Table 3. Quantitative assessment results of different methods.
MethodsPrecisionRecallAccuracyF1-Score
BIT89.2188.0594.6688.63
CDNet89.9386.8595.0288.36
DSIFN94.5680.8294.9387.15
L-Unet90.6088.4695.4489.52
P2V-CD91.8987.3895.5789.58
SNUNet88.1888.1294.8988.15
Siam-EMNet (ours)92.0088.5195.7190.21
Optimal results are shown in bold.
Table 4. Quantitative change detection results of large target buildings.
MethodsPrecisionRecallAccuracyF1-Score
BIT98.9495.4398.1797.15
CDNet98.8597.1398.8898.26
DSIFN98.9782.0993.9889.73
L-Unet99.0997.5298.9398.30
P2V-CD98.2498.3898.9298.31
SNUNet98.6096.7698.6497.67
Siam-EMNet (ours)99.6297.7698.9998.68
Optimal results are shown in bold.
Table 5. Quantitative change detection results of small target buildings.
MethodsPrecisionRecallAccuracyF1-Score
BIT88.6086.6594.1987.61
CDNet90.7285.4494.6788.00
DSIFN91.4283.5494.2087.30
L-Unet92.5185.7995.0289.02
P2V-CD92.4187.1495.2889.69
SNUNet89.1390.0694.9389.59
Siam-EMNet (ours)93.0389.3895.5490.04
Optimal results are shown in bold.
Table 6. Quantitative change detection results of dense building clusters.
MethodsPrecisionRecallAccuracyF1-Score
BIT89.7792.8493.9891.28
CDNet89.2293.8994.4791.49
DSIFN97.4687.1195.1391.99
L-Unet93.6892.3095.5592.98
P2V-CD93.8391.8795.4792.84
SNUNet89.0293.1493.6391.03
Siam-EMNet (ours)93.6394.6896.2494.15
Optimal results are shown in bold.
Table 7. Quantitative assessment results of WHU-CD dataset.
MethodsPrecisionRecallAccuracyF1-Score
BIT85.3991.1894.3288.19
CDNet82.7288.4293.7885.47
DSIFN95.8581.8094.6988.27
L-Unet66.3184.9989.1274.50
P2V-CD93.2288.0195.3890.54
SNUNet90.8589.8795.0390.36
Siam-EMNet (ours)92.2293.4695.9292.77
Optimal results are shown in bold.
Table 8. Quantitative assessment results of EfficientNet B0–B6.
EncoderLossPrecisionRecallAccuracyF1-Score
EfficientNet B00.0318984.9680.4184.0780.17
EfficientNet B10.028985.5782.3985.3382.40
EfficientNet B20.029185.4982.0884.7282.27
EfficientNet B30.0293887.4280.5385.8182.17
EfficientNet B40.0265292.0088.5195.7190.21
EfficientNet B50.0273584.8882.1288.3482.28
EfficientNet B60.0270886.1983.7189.1183.71
Optimal results are shown in bold.
Table 9. Quantitative assessment results of the loss function.
LossPrecisionRecallAccuracyF1-Score
LCE93.0984.0093.6888.08
LDice88.8086.9692.1186.77
LDice + LCE92.0088.5195.7190.21
Optimal results are shown in bold.
Disclaimer/Publisher’s Note: The statements, opinions and data contained in all publications are solely those of the individual author(s) and contributor(s) and not of MDPI and/or the editor(s). MDPI and/or the editor(s) disclaim responsibility for any injury to people or property resulting from any ideas, methods, instructions or products referred to in the content.