


Super-Resolution Rural Road Extraction from Sentinel-2 Imagery Using a Spatial Relationship-Informed Network


Abstract
: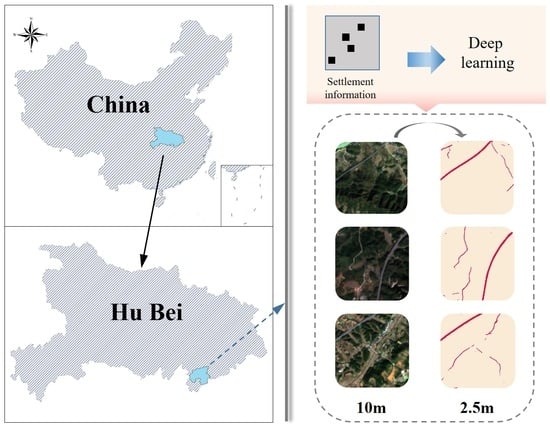
1. Introduction
2. Method
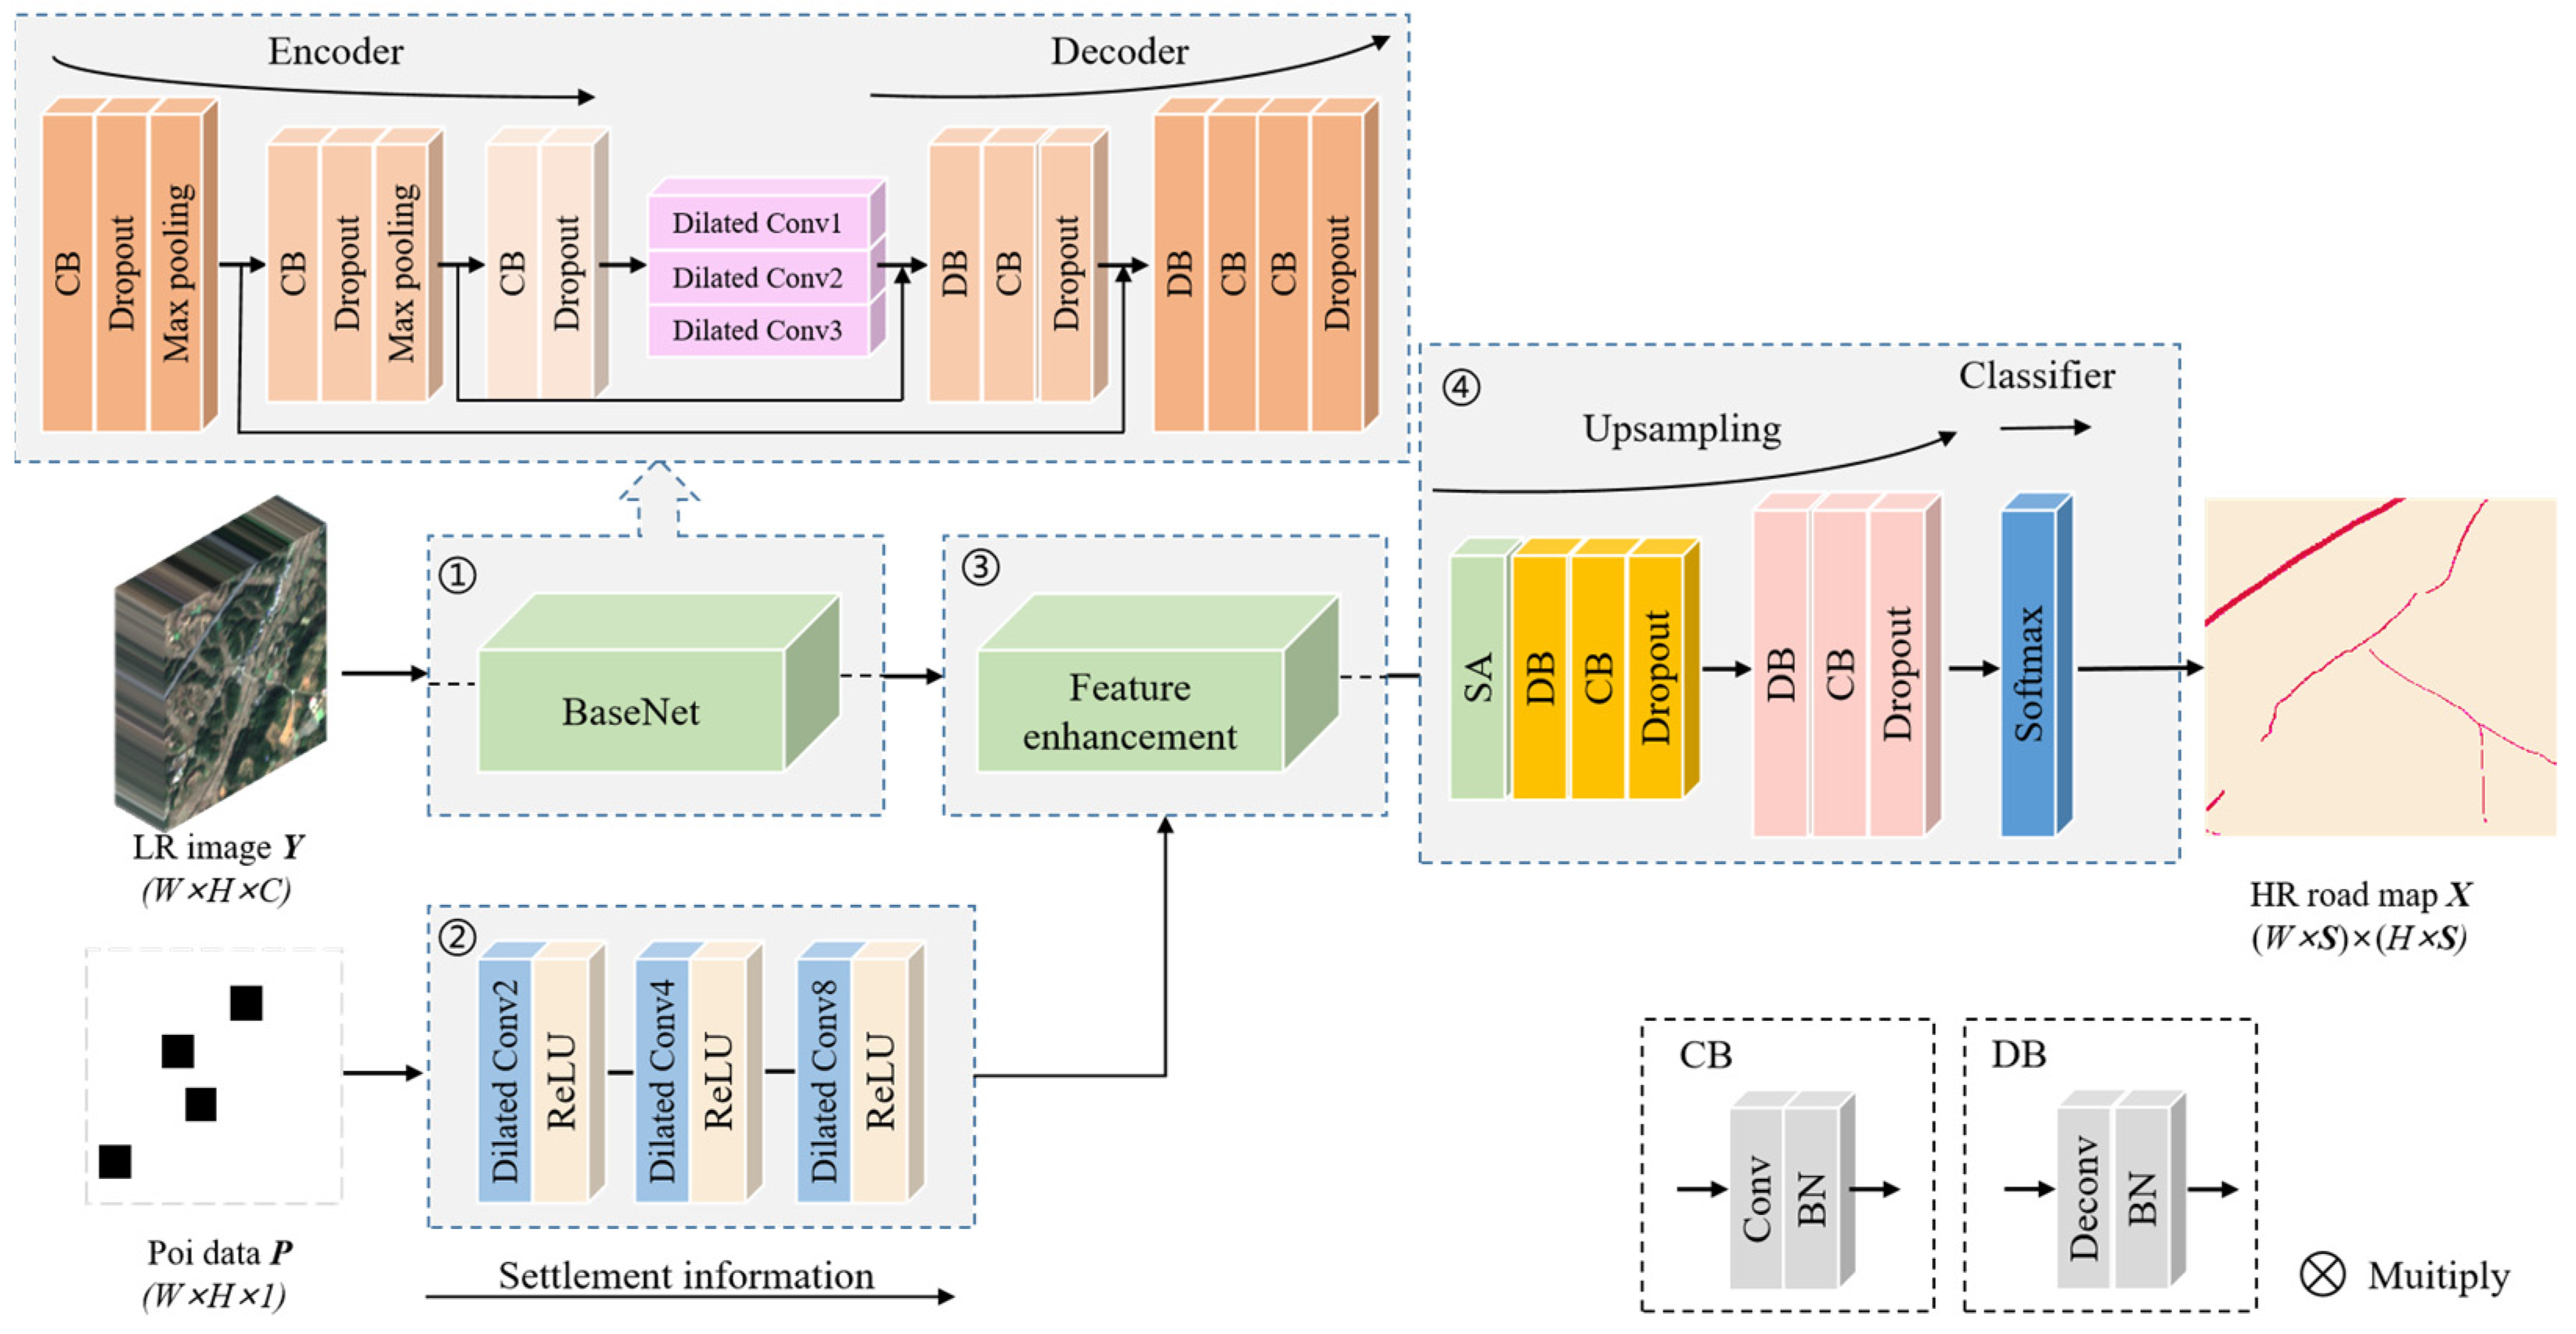
2.1. Overview of the SRSNet
2.2. BaseNet
2.3. POINet and Feature Enhancement Module
2.4. Up-Sampling Classification Module
3. Experiment
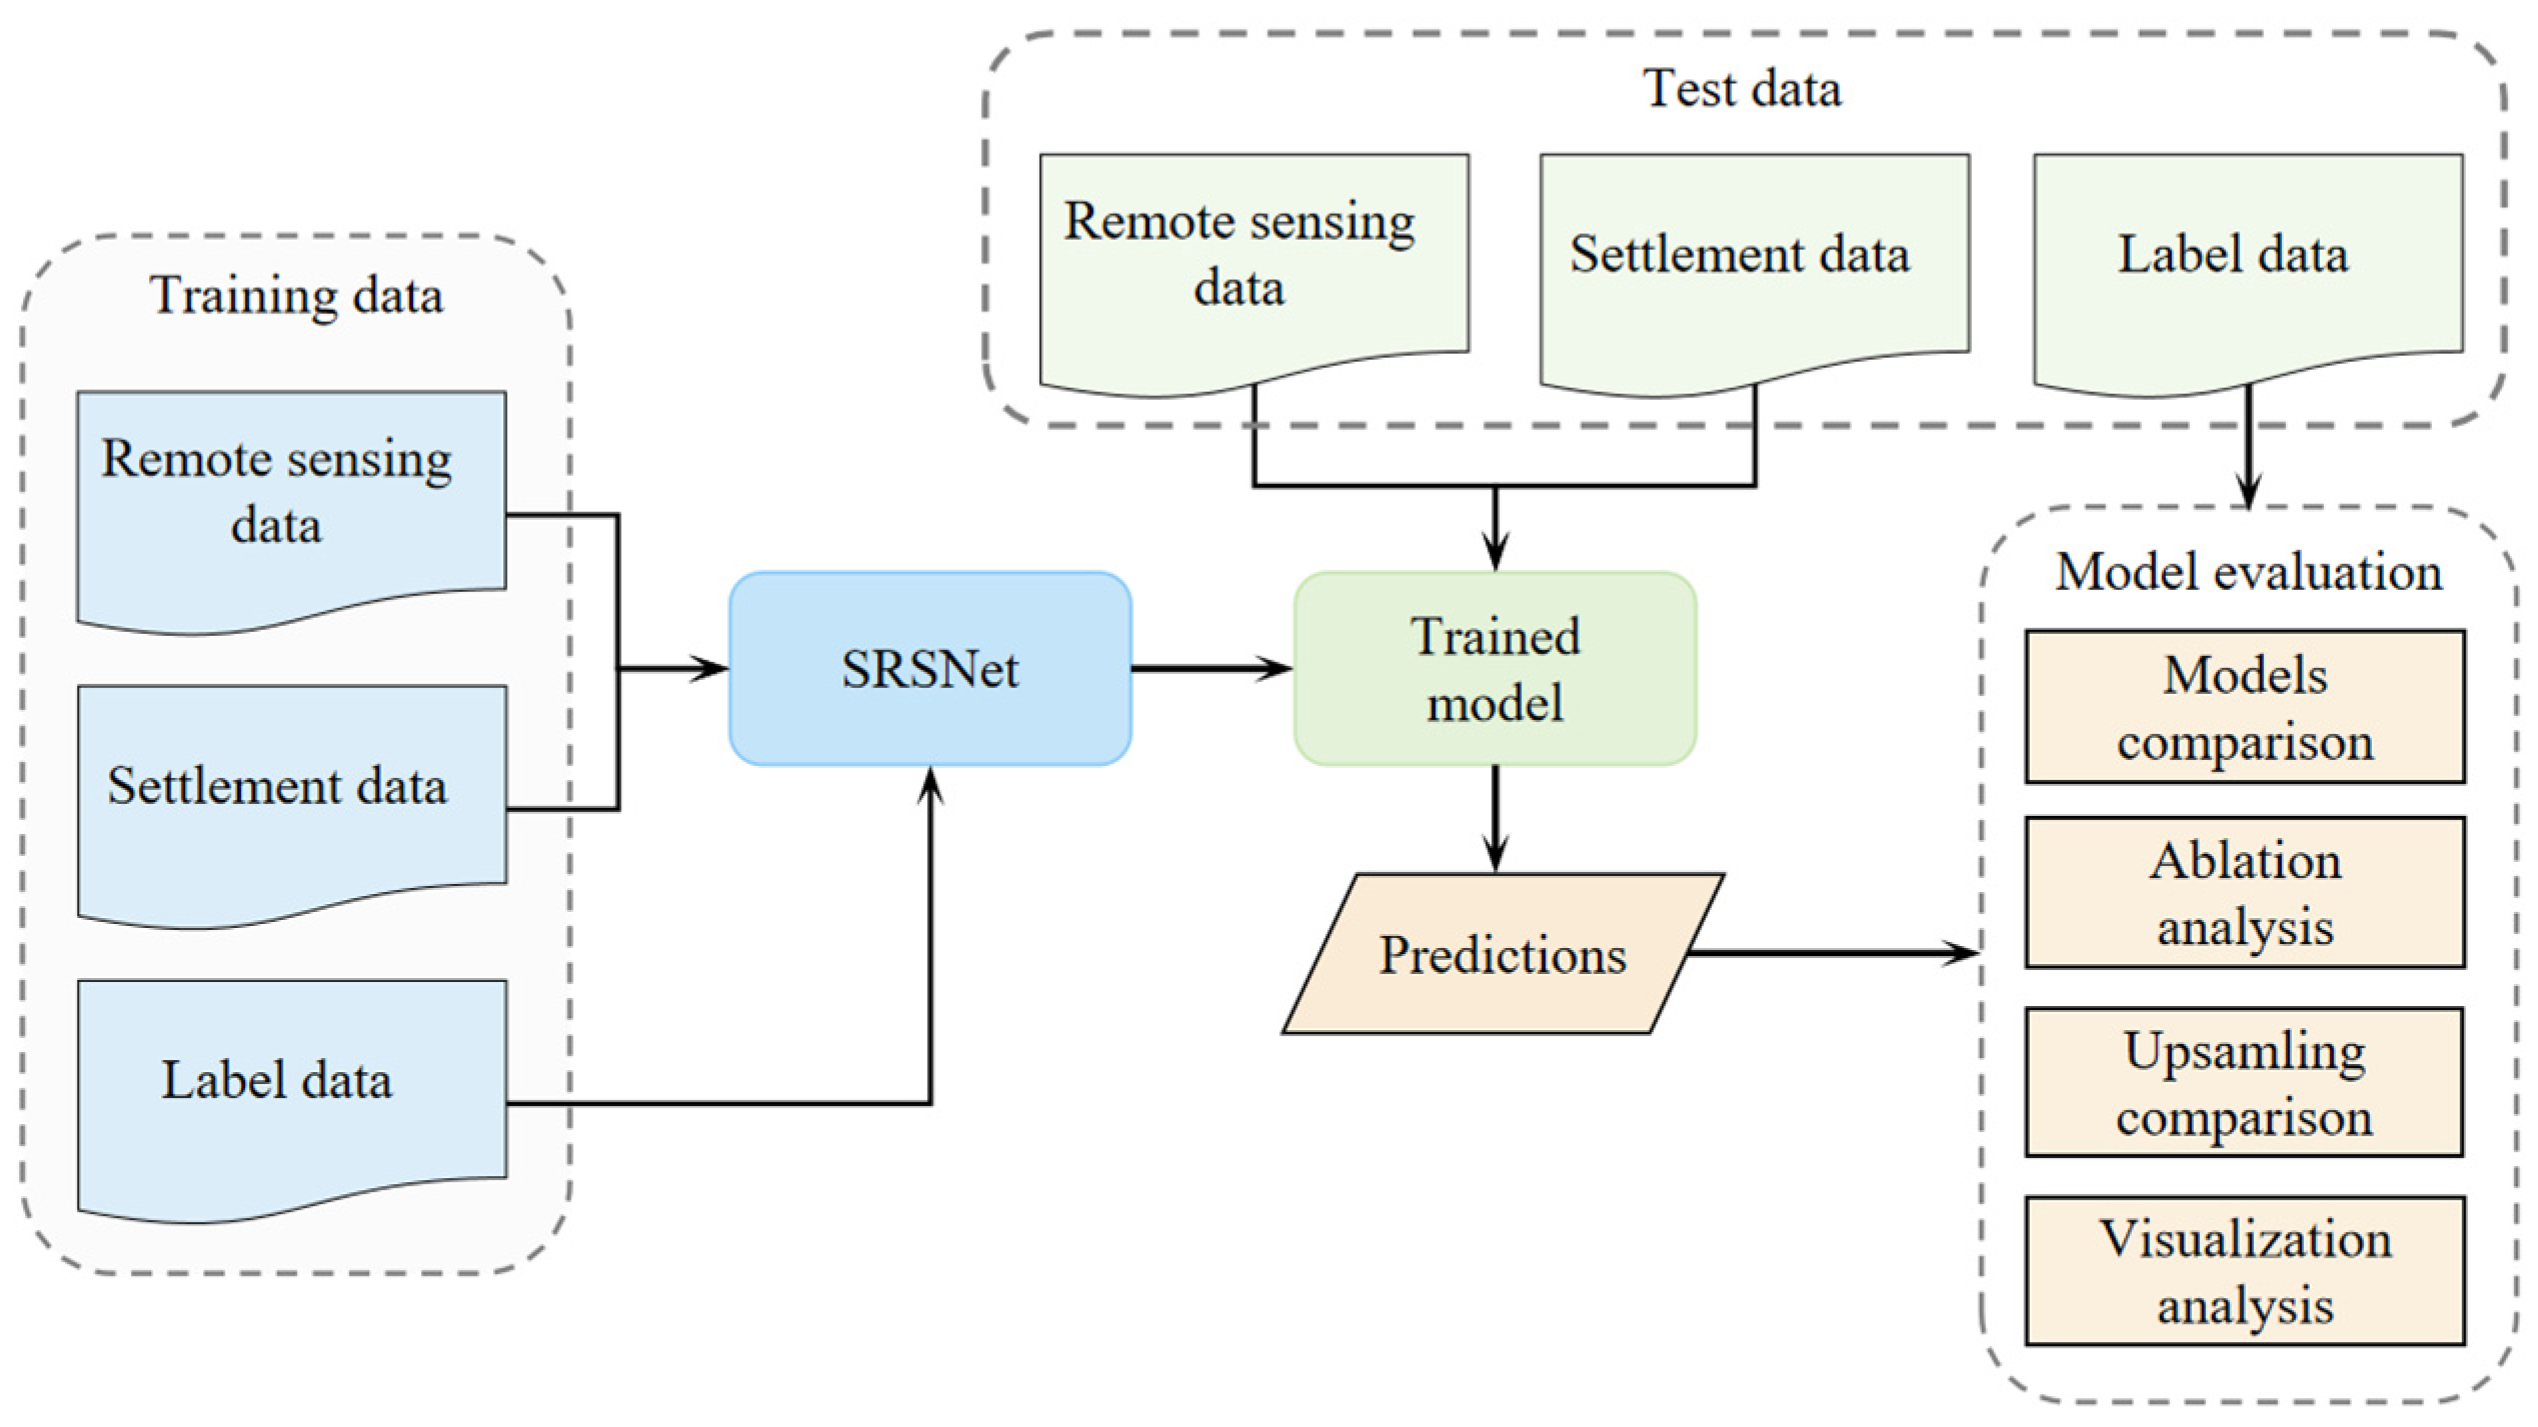
3.1. Overview of Methodology
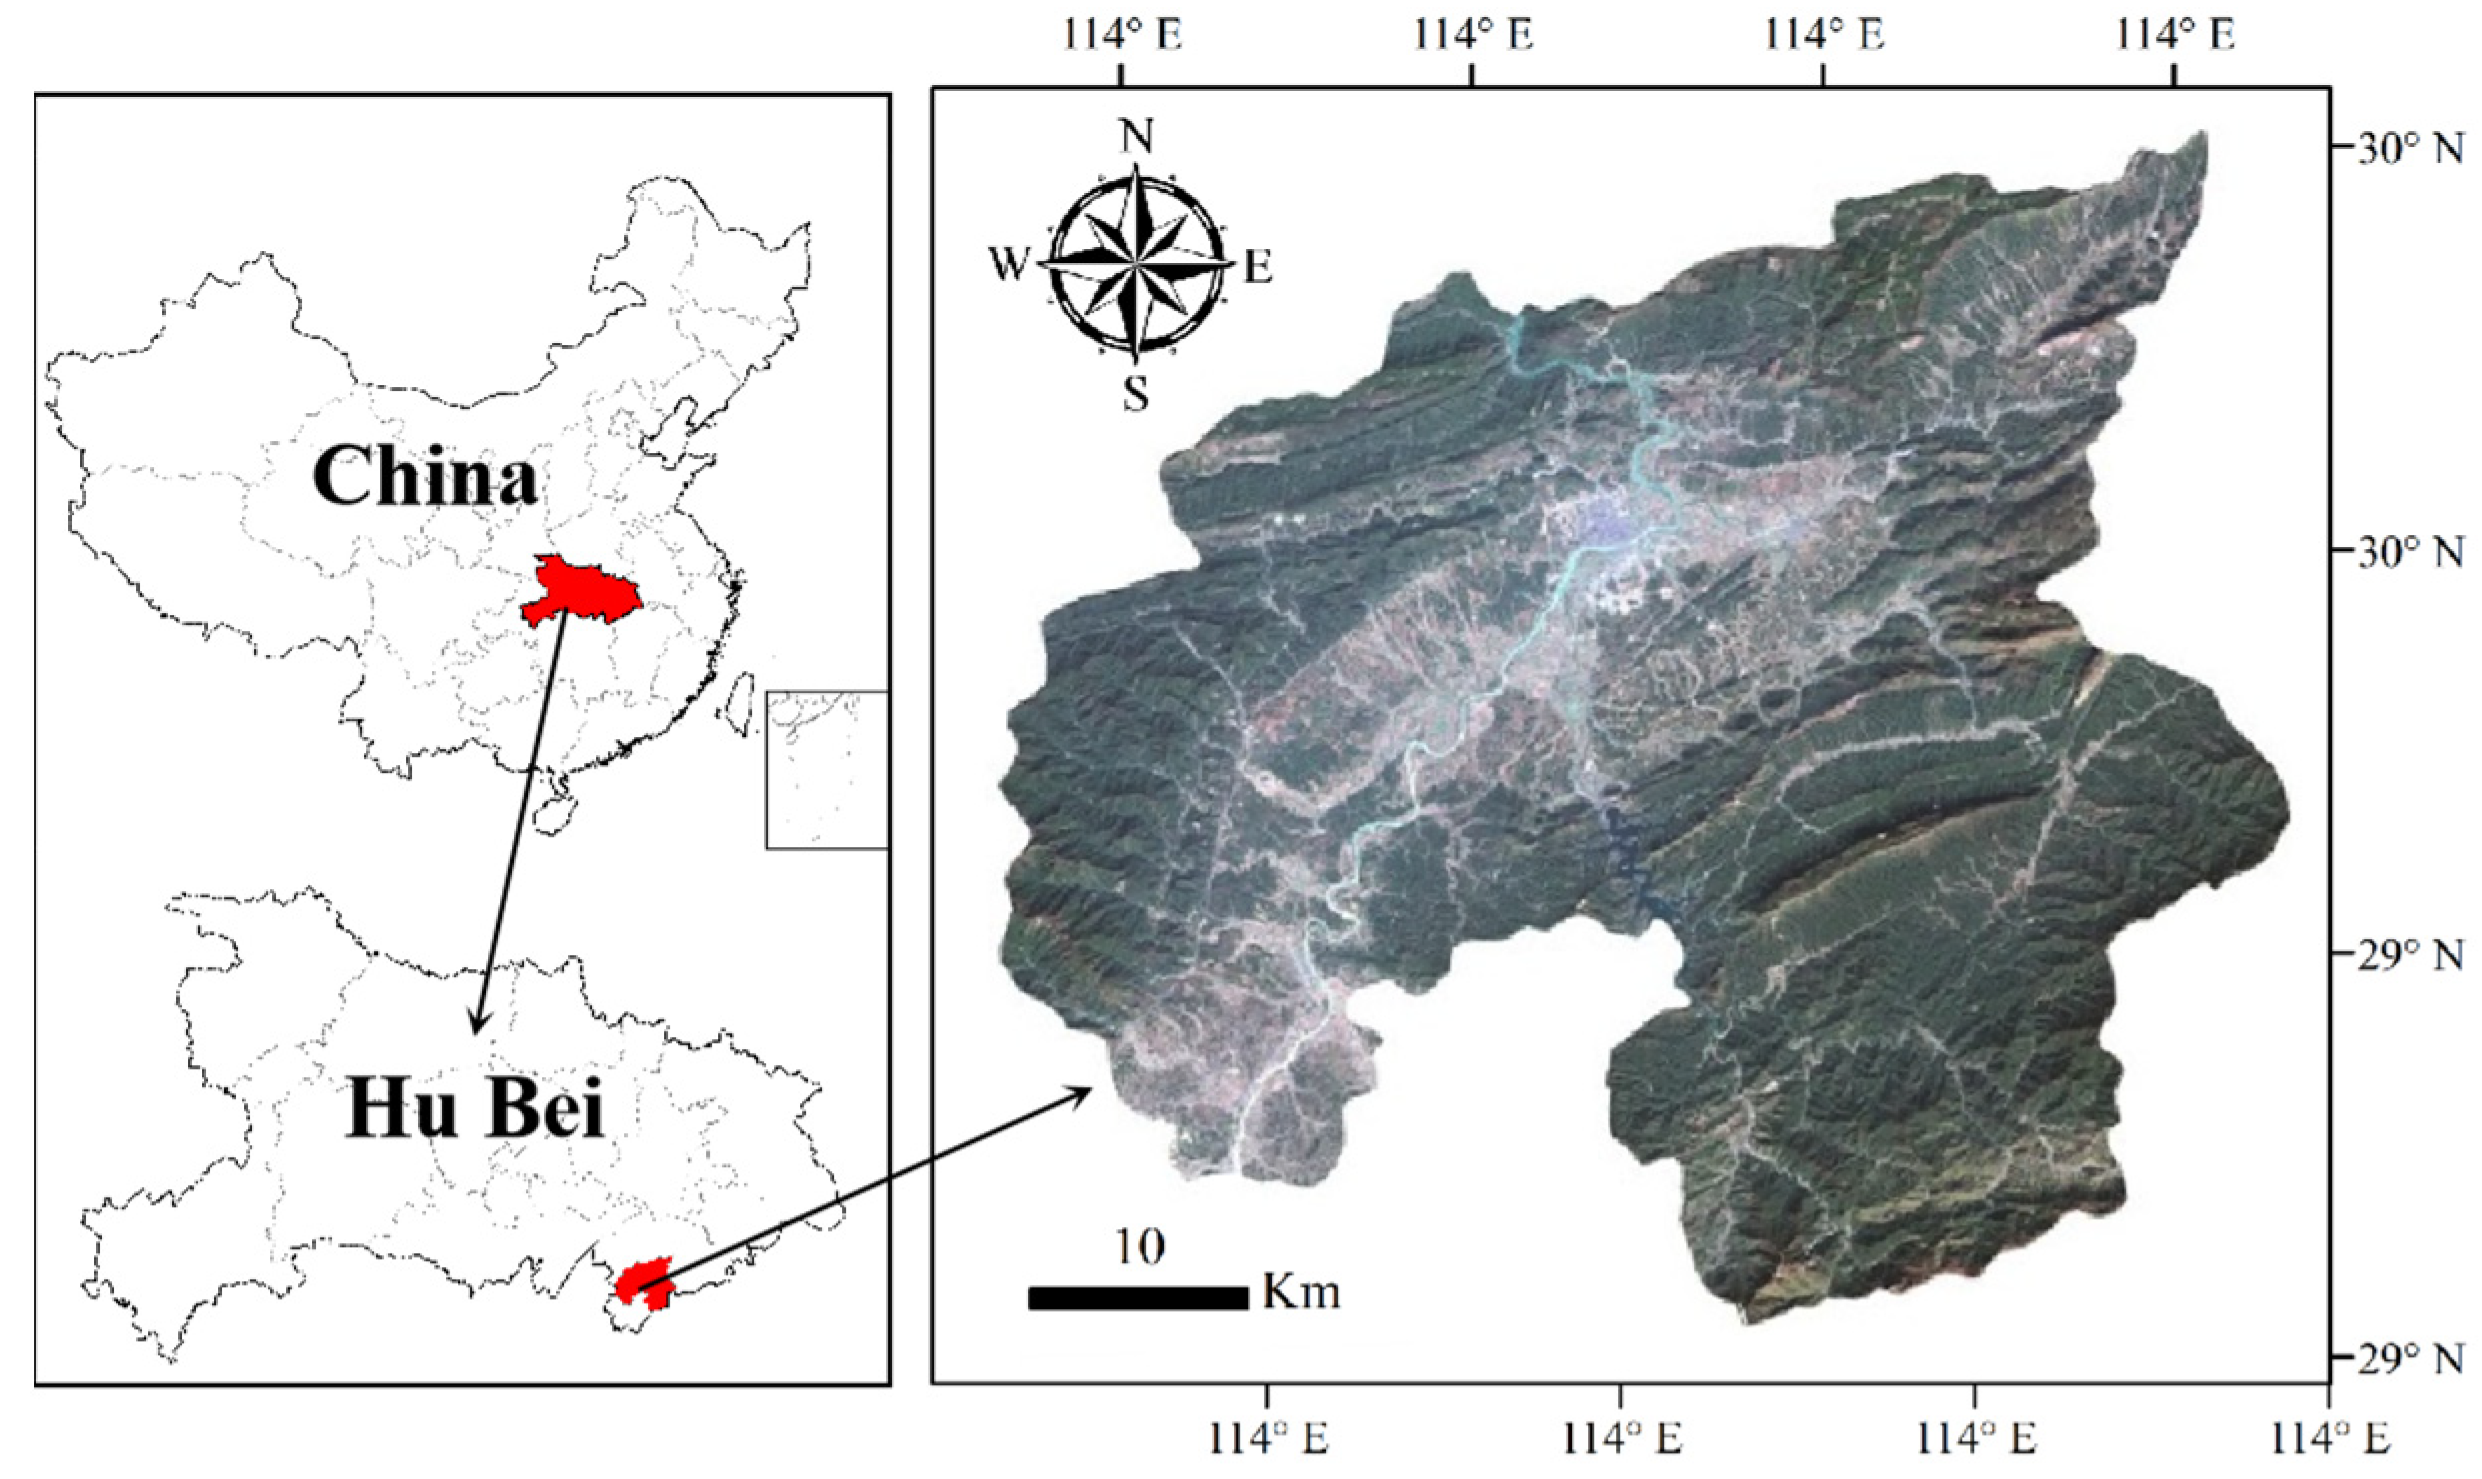
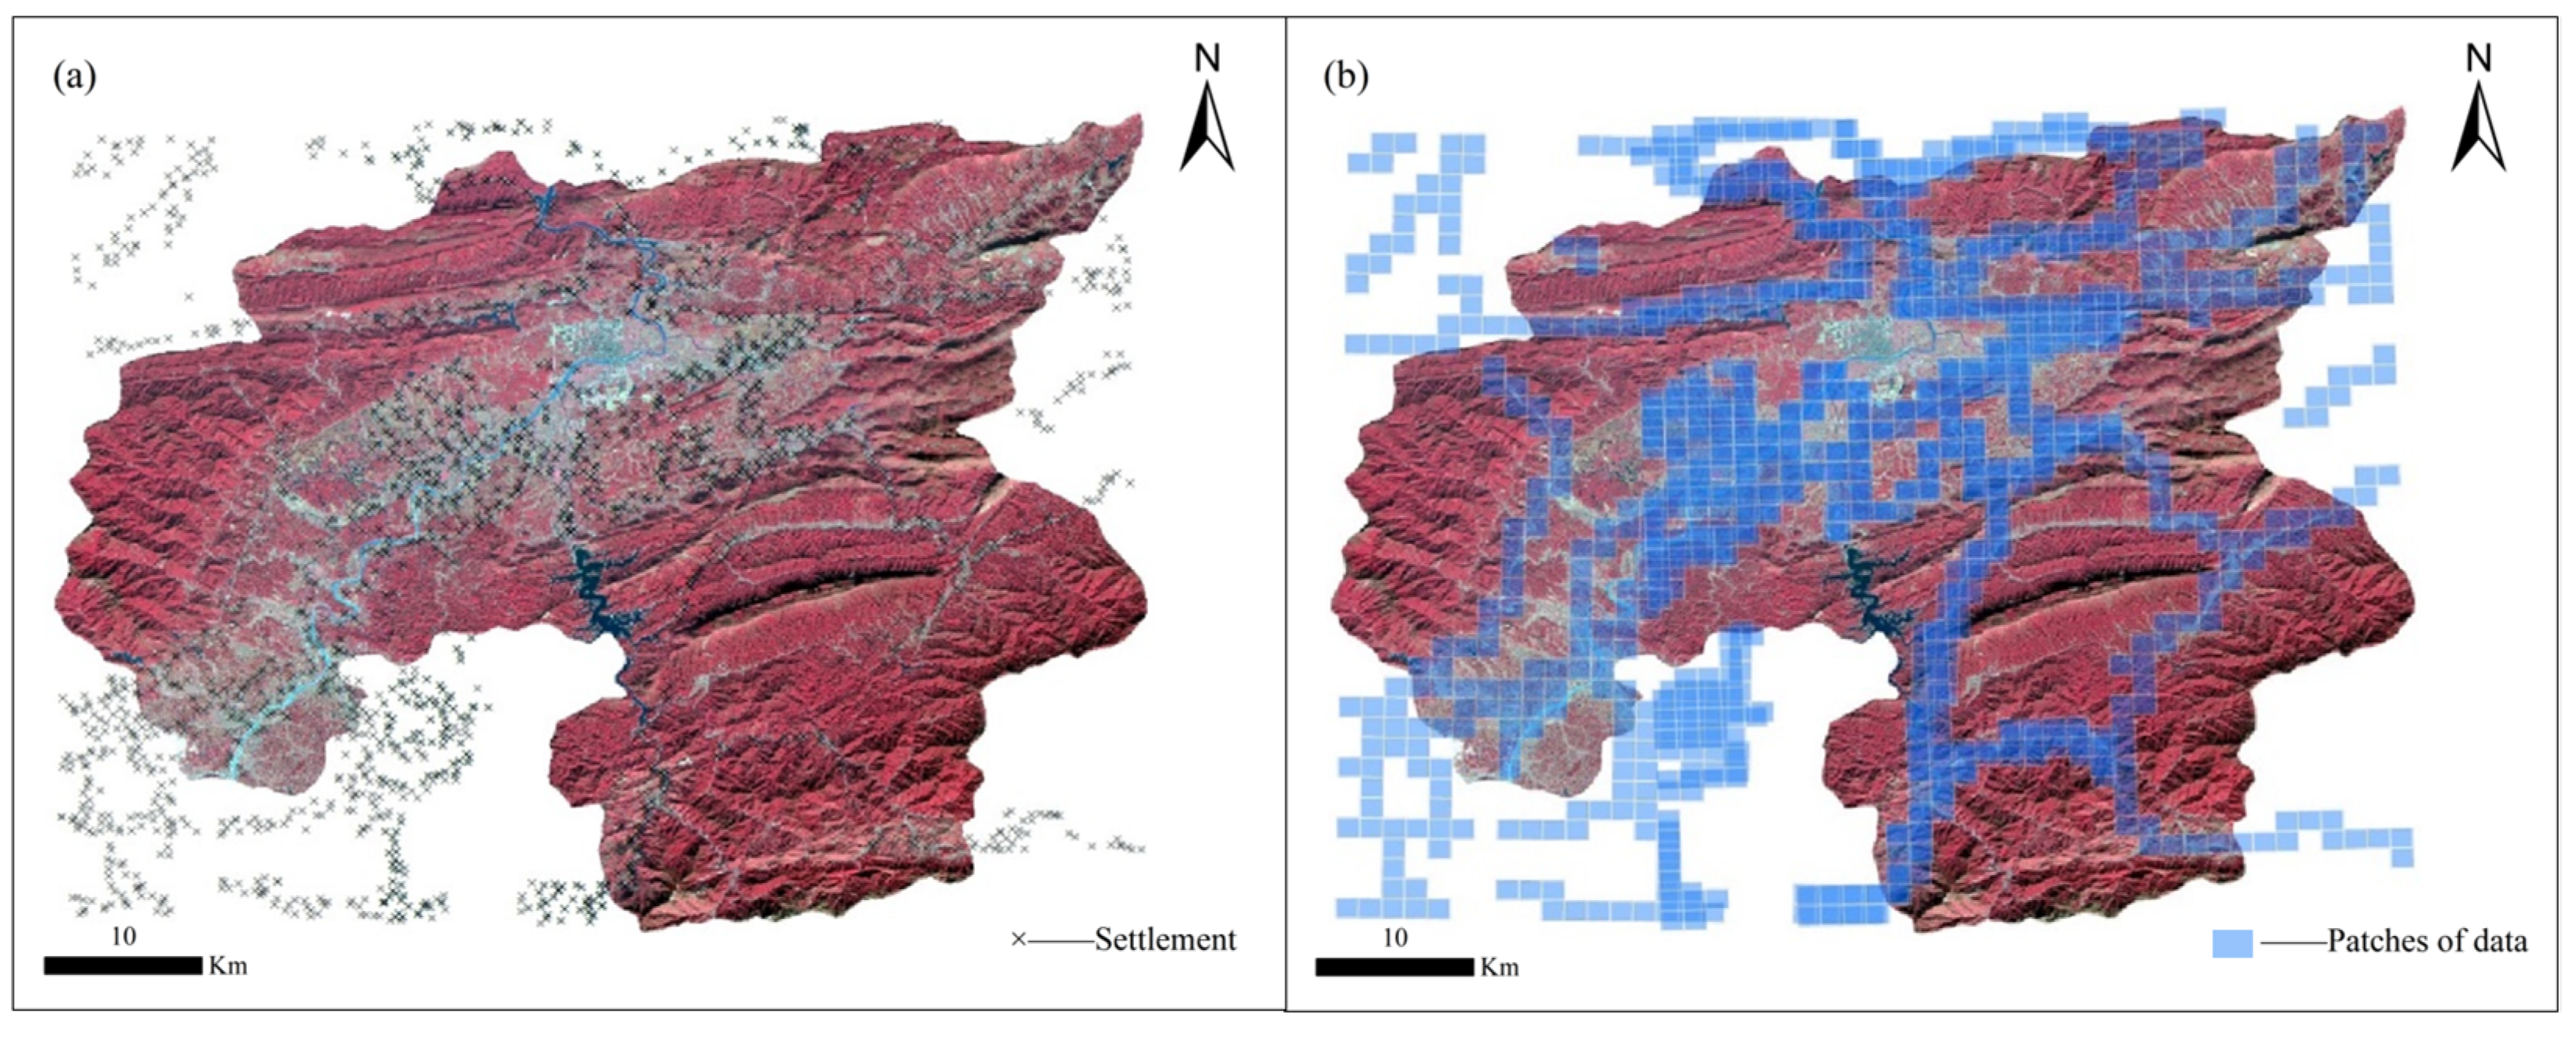
3.2. Study Area and Datasets
3.3. The Comparison Methods and Evaluation Metrics
3.4. Experimental Details
4. Experimental Results
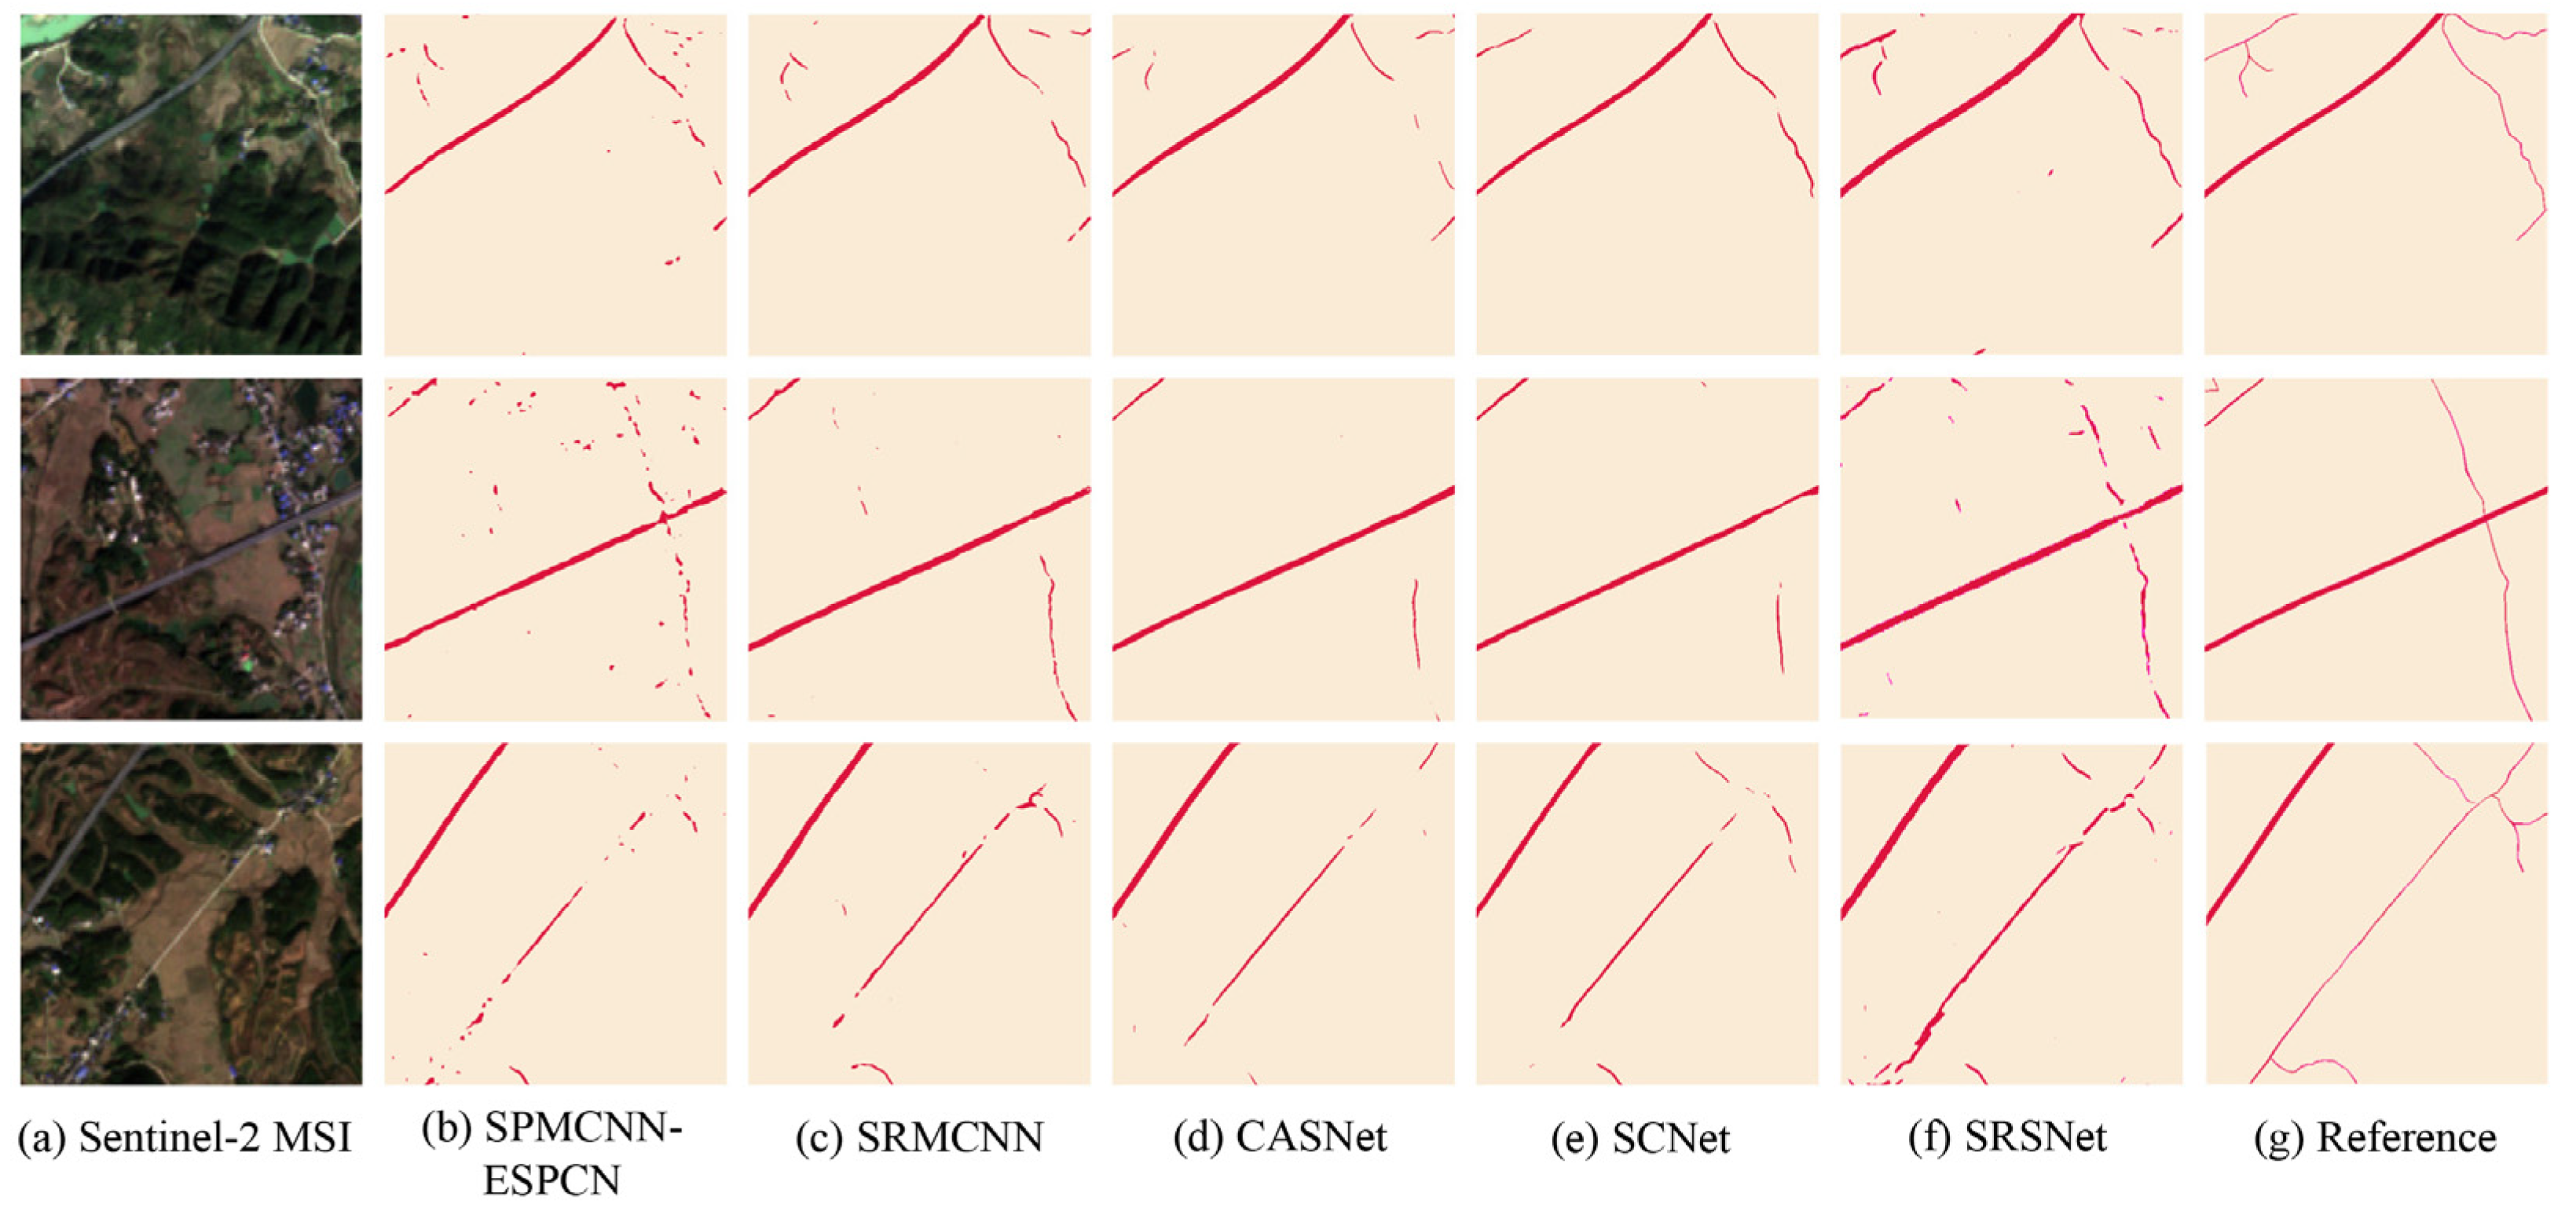
4.1. Comparison with Other Methods
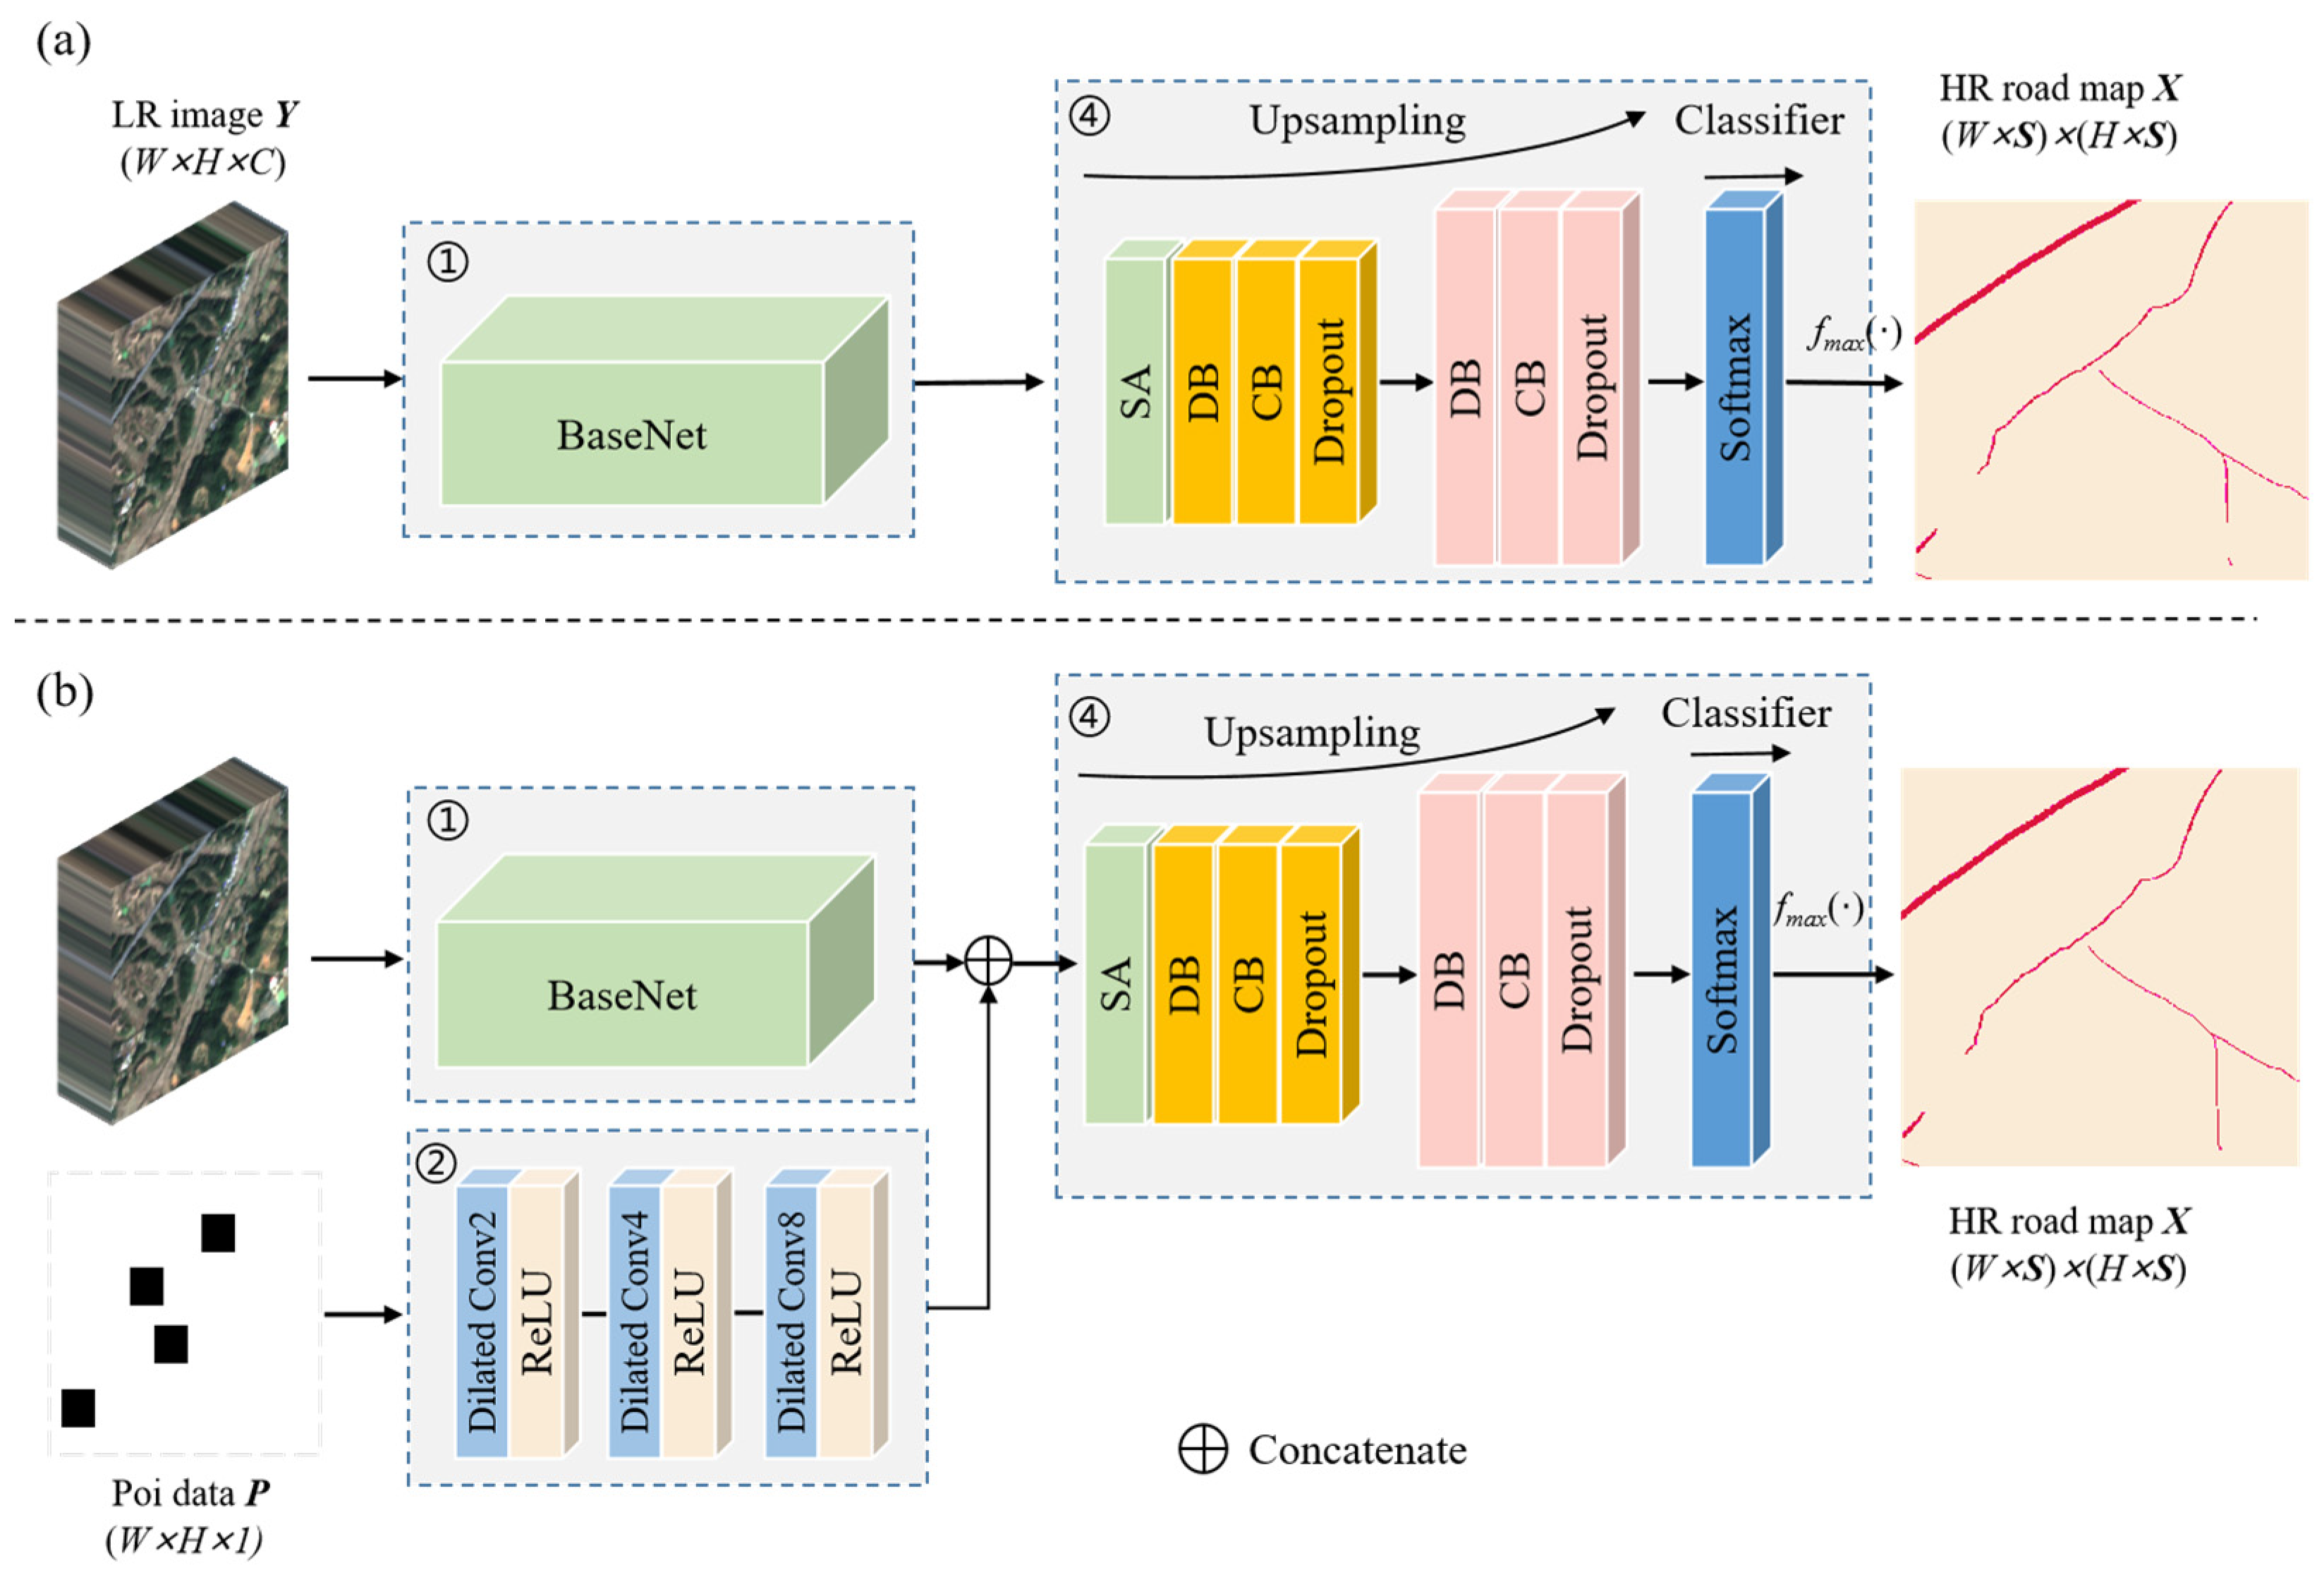
4.2. Ablation Studies on the Feature Enhancement Module
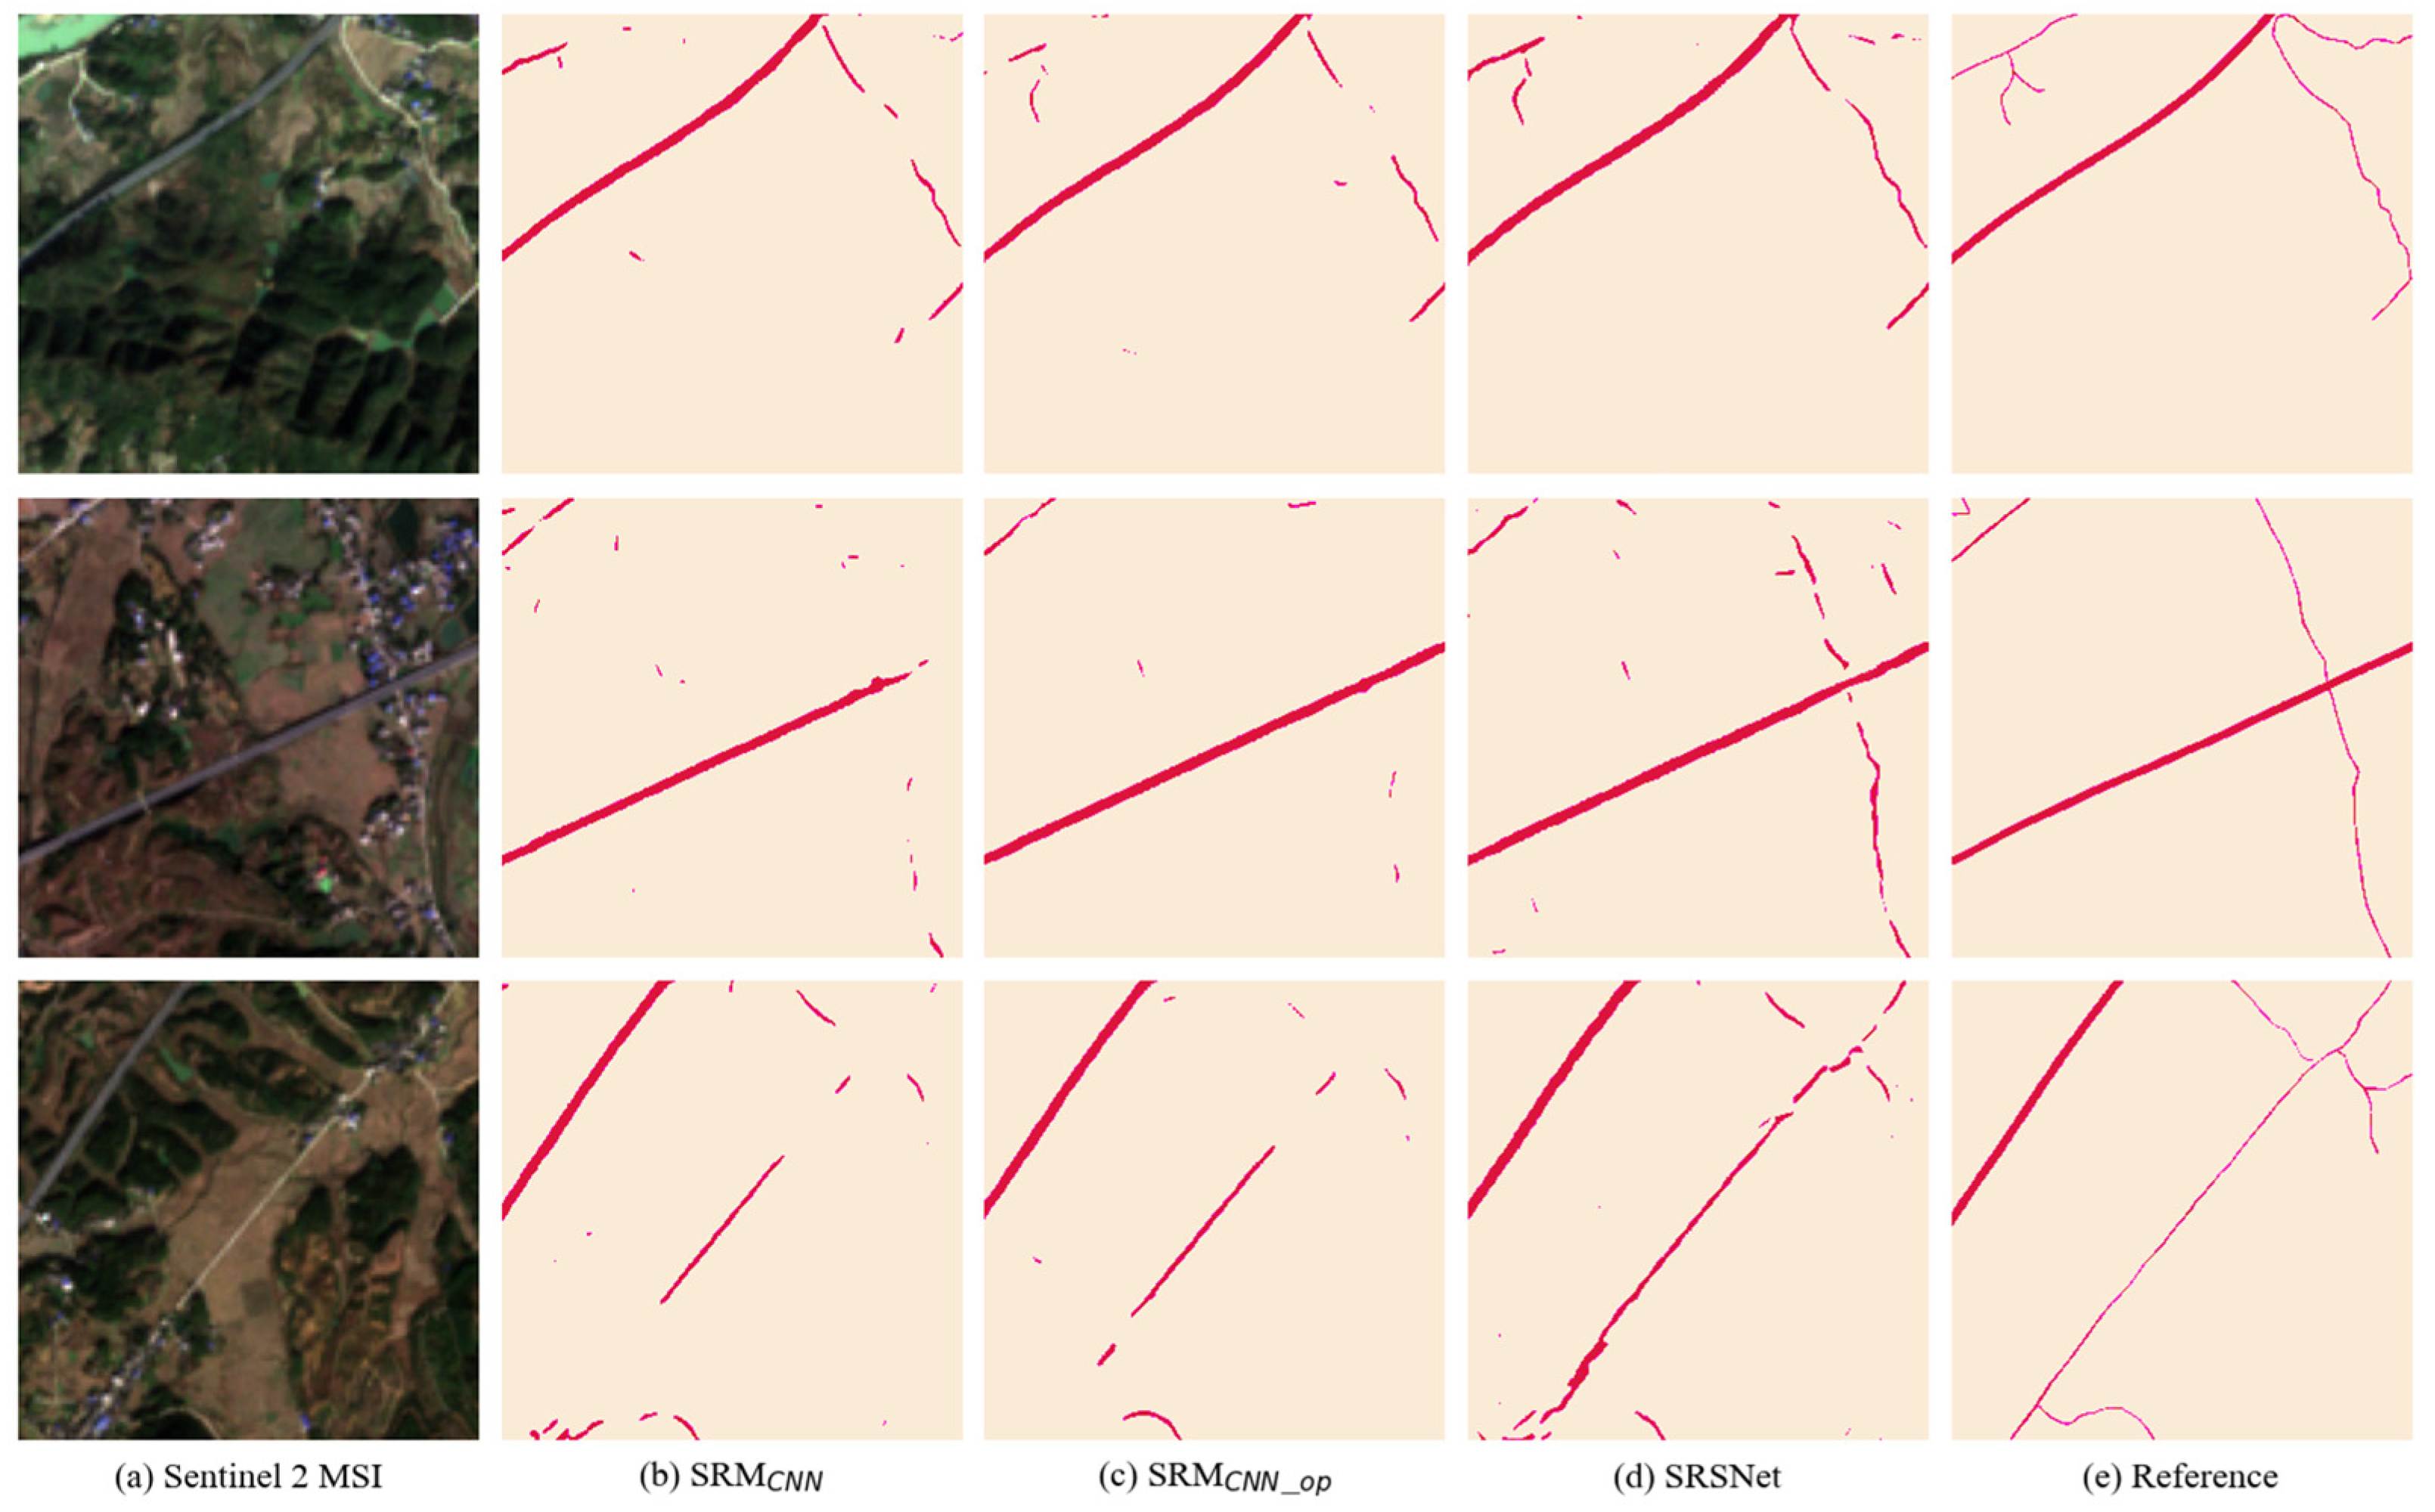
4.3. Analysis of Improvements for Road Extraction with Settlement Information
5. Discussion
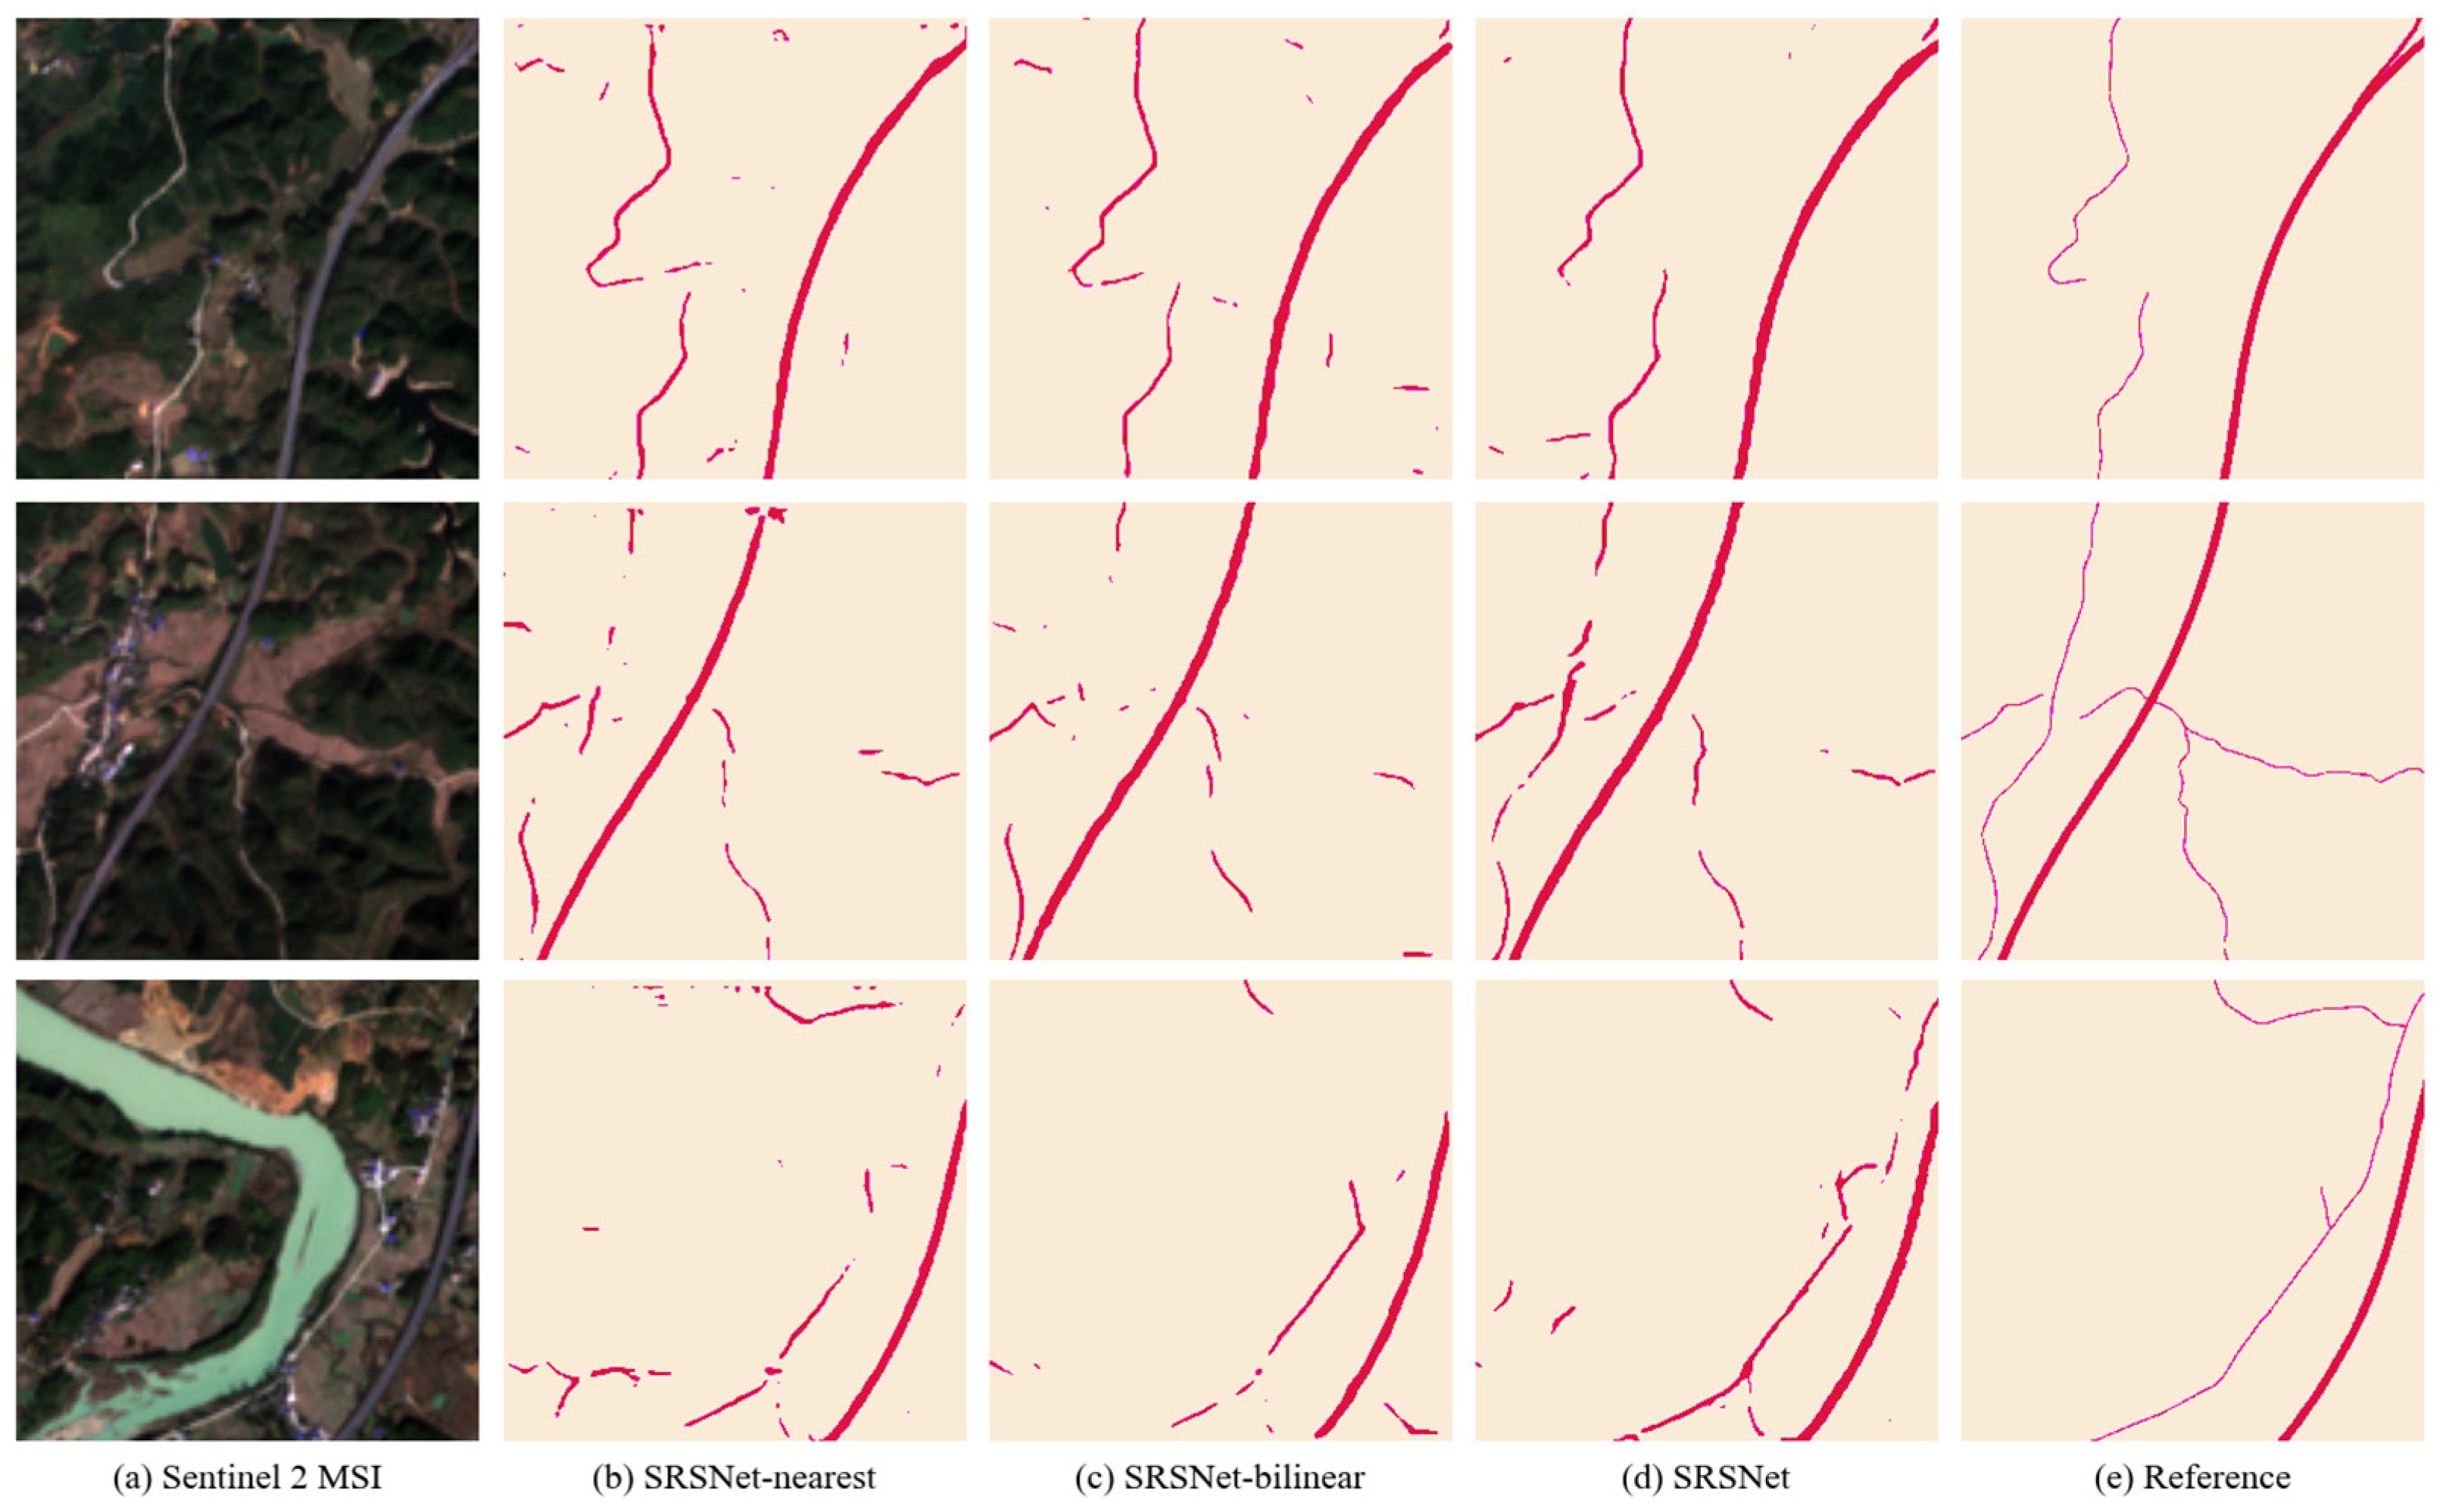
5.1. Comparison of Different Up-Sampling Methods
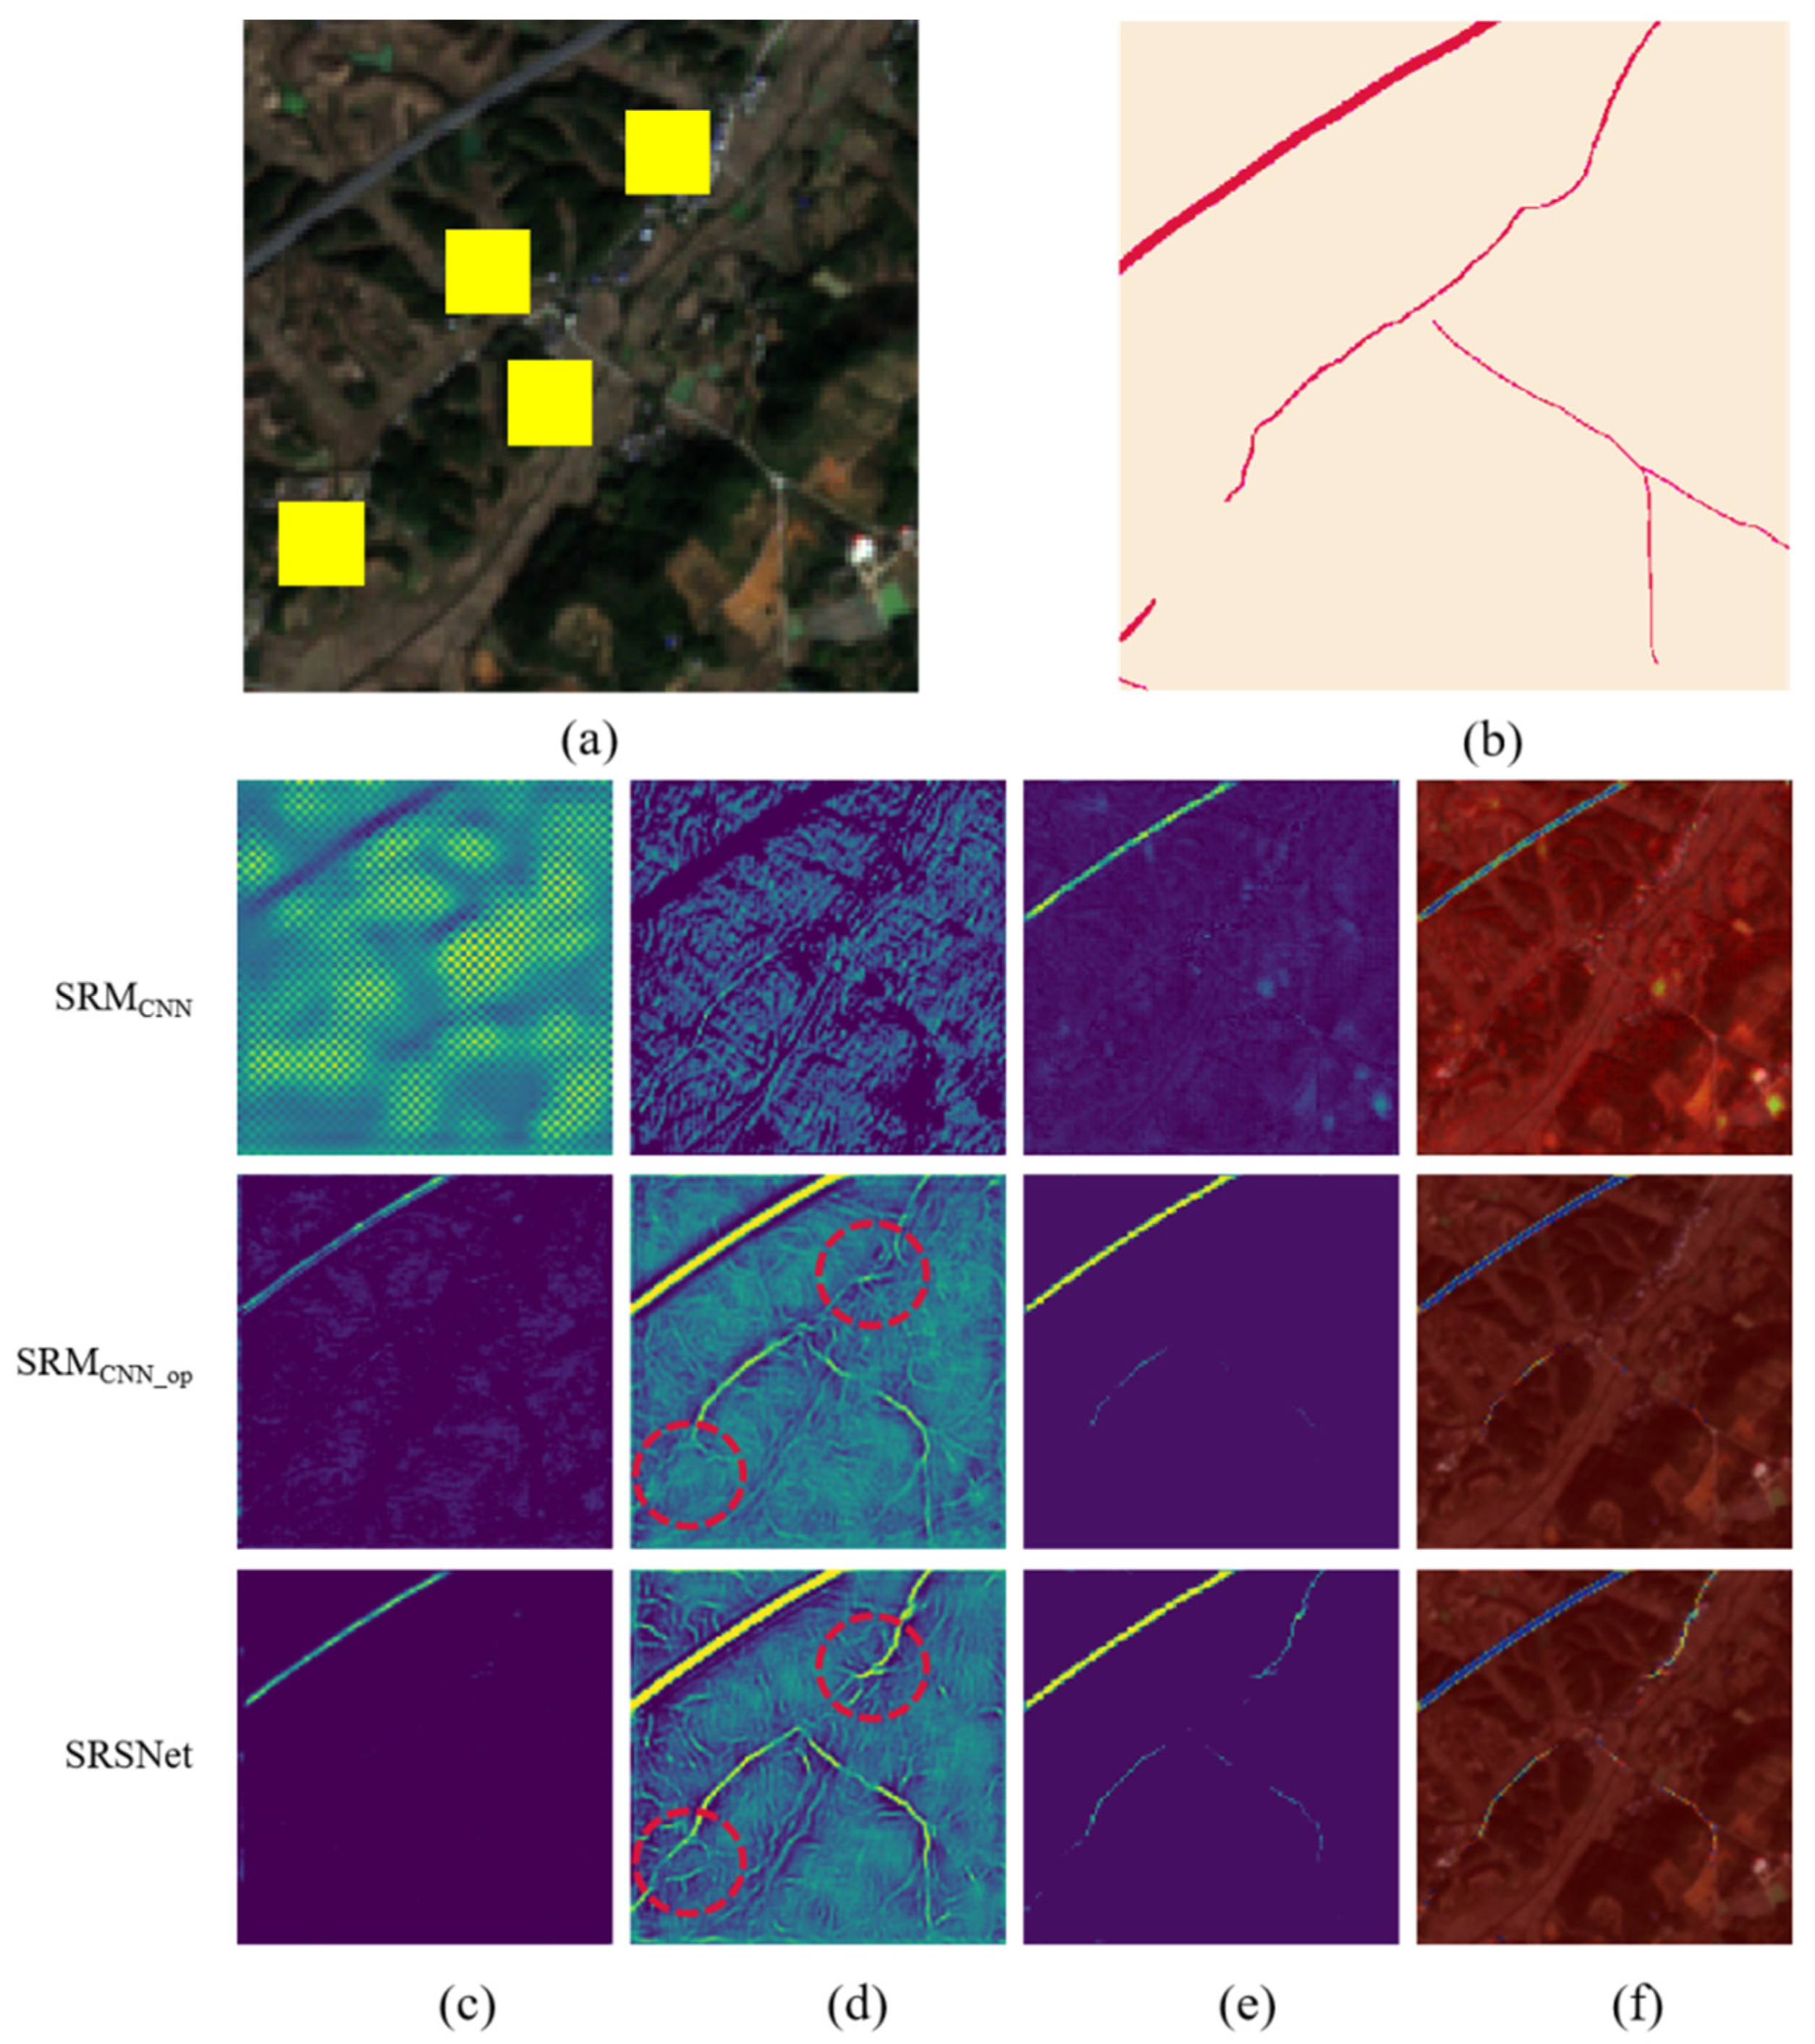
5.2. Visualization Analysis of Feature Maps at Different Layers
5.3. Limitations of the Study
6. Conclusions
Author Contributions
Funding
Data Availability Statement
Acknowledgments
Conflicts of Interest
References
- Li, Z.; He, W.; Cheng, M.; Hu, J.; Yang, G.; Zhang, H. SinoLC-1: The First 1-Meter Resolution National-Scale Land-Cover Map of China Created with the Deep Learning Framework and Open-Access Data. Earth Syst. Sci. Data Discuss. 2023, 1–38. [Google Scholar]
- Dai, J.; Ma, R.; Gong, L.; Shen, Z.; Wu, J. A Model-Driven-to-Sample-Driven Method for Rural Road Extraction. Remote Sens. 2021, 13, 1417. [Google Scholar] [CrossRef]
- Liu, J.; Qin, Q.; Li, J.; Li, Y. Rural Road Extraction from High-Resolution Remote Sensing Images Basedon Geometric Feature Inference. ISPRS Int. J. Geo.-Inf. 2017, 6, 314. [Google Scholar] [CrossRef]
- Abdollahi, A.; Pradhan, B.; Shukla, N.; Chakraborty, S.; Alamri, A. Deep Learning Approaches Applied to Remote Sensing Datasets for Road Extraction: A State-Of-The-Art Review. Remote Sens. 2020, 12, 1444. [Google Scholar] [CrossRef]
- Zhang, Q.; Kong, Q.; Zhang, C.; You, S.; Wei, H.; Sun, R.; Li, L. A new road extraction method using Sentinel-1 SAR images based on the deep fully convolutional neural network. Eur. J. Remote Sens. 2019, 52, 572–582. [Google Scholar] [CrossRef]
- Simler, C. An Improved Road and Building Detector on VHR Images. In Proceedings of the 2011 IEEE International Geoscience and Remote Sensing Symposium, Vancouver, BC, Canada, 24–29 July 2011. [Google Scholar]
- Li, M.; Stein, A.; Bijker, W.; Zhan, Q. Region-based urban road extraction from VHR satellite images using Binary Partition Tree. Int. J. Appl. Earth Obs. Geoinf. 2016, 44, 217–225. [Google Scholar] [CrossRef]
- Zhu, Q.; Zhang, Y.; Wang, L.; Zhong, Y.; Guan, Q.; Lu, X.; Zhang, L.; Li, D. A Global Context-aware and Batch-independent Network for road extraction from VHR satellite imagery. ISPRS J. Photogramm. Remote Sens. 2021, 175, 353–365. [Google Scholar] [CrossRef]
- Xu, Y.; Xie, Z.; Feng, Y.; Chen, Z. Road Extraction from High-Resolution Remote Sensing Imagery Using Deep Learning. Remote Sens. 2018, 10, 1461. [Google Scholar] [CrossRef]
- Tao, C.; Qi, J.; Li, Y.; Wang, H.; Li, H. Spatial information inference net: Road extraction using road-specific contextual information. ISPRS J. Photogramm. Remote Sens. 2019, 158, 155–166. [Google Scholar] [CrossRef]
- Ling, F.; Boyd, D.; Ge, Y.; Foody, G.M.; Li, X.; Wang, L.; Zhang, Y.; Shi, L.; Shang, C.; Li, X.; et al. Measuring River Wetted Width From Remotely Sensed Imagery at the Subpixel Scale With a Deep Convolutional Neural Network. Water Resour. Res. 2019, 55, 5631–5649. [Google Scholar] [CrossRef]
- He, D.; Shi, Q.; Liu, X.; Zhong, Y.; Zhang, L. Generating 2m fine-scale urban tree cover product over 34 metropolises in China based on deep context-aware sub-pixel mapping network. Int. J. Appl. Earth Obs. Geoinf. 2021, 106, 102667. [Google Scholar] [CrossRef]
- Li, J.; Qin, Q.; Han, J.; Tang, L.A.; Lei, K.H. Mining Trajectory Data and Geotagged Data in Social Media for Road Map Infer-ence. Trans. GIS 2015, 19, 1–18. [Google Scholar] [CrossRef]
- Ayala, C.; Aranda, C.; Galar, M. Towards Fine-Grained Road Maps Extraction Using Sentinel-2 Imagery. ISPRS Ann. Photogramm. Remote Sens. Spat. Inf. Sci. 2021, 5, 9–14. [Google Scholar] [CrossRef]
- Keshava, N.; Mustard, J.F. Spectral Unmixing. IEEE Signal Process. Mag. 2002, 19, 44–57. [Google Scholar] [CrossRef]
- Ge, Y.; Jin, Y.; Stein, A.; Chen, Y.; Wang, J.; Wang, J.; Cheng, Q.; Bai, H.; Liu, M.; Atkinson, P.M. Principles and methods of scaling geospatial Earth science data. Earth-Sci. Rev. 2019, 197, 102897. [Google Scholar] [CrossRef]
- Atkinson, P.M. Issues of Uncertainty in Super-Resolution Mapping and Their Implications for the Design of an In-ter-Comparison Study. Int. J. Remote Sens. 2009, 30, 5293–5308. [Google Scholar] [CrossRef]
- Wang, Q.; Zhang, C.; Tong, X.; Atkinson, P.M. General solution to reduce the point spread function effect in subpixel mapping. Remote Sens. Environ. 2020, 251, 112054. [Google Scholar] [CrossRef]
- Chen, Y.; Ge, Y.; Wang, Q.; Jiang, Y. A subpixel mapping algorithm combining pixel-level and subpixel-level spatial dependences with binary integer programming. Remote Sens. Lett. 2014, 5, 902–911. [Google Scholar] [CrossRef]
- Ling, F.; Du, Y.; Xiao, F.; Li, X. Subpixel Land Cover Mapping by Integrating Spectral and Spatial Information of Remotely Sensed Imagery. IEEE Geosci. Remote Sens. Lett. 2011, 9, 408–412. [Google Scholar] [CrossRef]
- Mertens, K.C.; de Baets, B.; Verbeke, L.P.C.; de Wulf, R.R. A Sub-Pixel Mapping Algorithm Based on Sub-Pixel/Pixel Spatial Attraction Models. Int. J. Remote Sens. 2006, 27, 3293–3310. [Google Scholar] [CrossRef]
- Atkinson, P.M. Sub-pixel Target Mapping from Soft-classified, Remotely Sensed Imagery. Photogramm. Eng. Remote Sens. 2005, 71, 839–846. [Google Scholar] [CrossRef]
- Chen, Y.; Ge, Y.; Heuvelink, G.B.M.; An, R.; Chen, Y. Object-Based Superresolution Land-Cover Mapping From Remotely Sensed Imagery. IEEE Trans. Geosci. Remote Sens. 2017, 56, 328–340. [Google Scholar] [CrossRef]
- Ge, Y.; Chen, Y.; Li, S.; Jiang, Y. Vectorial boundary-based sub-pixel mapping method for remote-sensing imagery. Int. J. Remote Sens. 2014, 35, 1756–1768. [Google Scholar] [CrossRef]
- Huang, C.; Chen, Y.; Wu, J. DEM-based modification of pixel-swapping algorithm for enhancing floodplain inundation mapping. Int. J. Remote Sens. 2013, 35, 365–381. [Google Scholar] [CrossRef]
- Ge, Y.; Jiang, Y.; Chen, Y.; Stein, A.; Jiang, D.; Jia, Y. Designing an Experiment to Investigate Subpixel Mapping as an Alter-native Method to Obtain Land Use/Land Cover Maps. Remote Sens. 2016, 8, 360. [Google Scholar] [CrossRef]
- Ling, F.; Du, Y.; Zhang, Y.; Li, X.; Xiao, F. Burned-Area Mapping at the Subpixel Scale with MODIS Images. IEEE Geosci. Remote Sens. Lett. 2015, 12, 1963–1967. [Google Scholar] [CrossRef]
- Ling, F.; Foody, G.M. Super-resolution land cover mapping by deep learning. Remote Sens. Lett. 2019, 10, 598–606. [Google Scholar] [CrossRef]
- Ma, X.; Hong, Y.; Song, Y.; Chen, Y. A Super-Resolution Convolutional-Neural-Network-Based Approach for Subpixel Mapping of Hyperspectral Images. IEEE J. Sel. Top. Appl. Earth Obs. Remote Sens. 2019, 12, 4930–4939. [Google Scholar] [CrossRef]
- Zhang, X.; Ge, Y.; Ling, F.; Chen, J.; Chen, Y.; Jia, Y. Graph Convolutional Networks-Based Super-Resolution Land Cover Mapping. IEEE J. Sel. Top. Appl. Earth Obs. Remote Sens. 2021, 14, 7667–7681. [Google Scholar] [CrossRef]
- Ma, X.; Hong, Y.; Song, Y. Super Resolution Land Cover Mapping of Hyperspectral Images Using the Deep Image Pri-or-Based Approach. Int. J. Remote Sens. 2020, 41, 2818–2834. [Google Scholar] [CrossRef]
- He, D.; Zhong, Y.; Wang, X.; Zhang, L. Deep Convolutional Neural Network Framework for Subpixel Mapping. IEEE Trans. Geosci. Remote Sens. 2021, 59, 9518–9539. [Google Scholar] [CrossRef]
- Jia, Y.; Ge, Y.; Chen, Y.; Li, S.; Heuvelink, G.B.M.; Ling, F. Super-Resolution Land Cover Mapping Based on the Convolu-tional Neural Network. Remote Sens. 2019, 11, 1815. [Google Scholar] [CrossRef]
- Arun, P.; Buddhiraju, K.; Porwal, A. CNN based sub-pixel mapping for hyperspectral images. Neurocomputing 2018, 311, 51–64. [Google Scholar] [CrossRef]
- Yuan, Q.; Shen, H.; Li, T.; Li, Z.; Li, S.; Jiang, Y.; Xu, H.; Tan, W.; Yang, Q.; Wang, J.; et al. Deep learning in environmental remote sensing: Achievements and challenges. Remote Sens. Environ. 2020, 241, 111716. [Google Scholar] [CrossRef]
- Ge, Y.; Ma, T.; Pei, T.; Weng, H.; Li, X.; Zhang, X. Progress of big geodata. Sci. Bull. 2022, 67, 1739–1742. [Google Scholar] [CrossRef]
- Ge, Y.; Zhang, X.; Atkinson, P.M.; Stein, A.; Li, L. Geoscience-aware deep learning: A new paradigm for remote sensing. Sci. Remote Sens. 2022, 5, 100047. [Google Scholar] [CrossRef]
- Zhang, X.; Ge, Y.; Chen, J.; Ling, F.; Wang, Q.; Du, D.; Xiang, R. High-quality super-resolution mapping using spatial deep learning. Iscience 2023, 26, 106875. [Google Scholar] [CrossRef]
- He, D.; Shi, Q.; Liu, X.; Zhong, Y.; Zhang, X. Deep Subpixel Mapping Based on Semantic Information Modulated Network for Urban Land Use Mapping. IEEE Trans. Geosci. Remote Sens. 2021, 59, 10628–10646. [Google Scholar] [CrossRef]
- Du, G.; Cao, X.; Liang, J.; Chen, X.; Zhan, Y. Medical Image Segmentation based on U-Net: A Review. J. Imaging Sci. Technol. 2020, 64, 1–12. [Google Scholar] [CrossRef]
- Pan, Z.; Xu, J.; Guo, Y.; Hu, Y.; Wang, G. Deep Learning Segmentation and Classification for Urban Village Using a Worldview Satellite Image Based on U-Net. Remote Sens. 2020, 12, 1574. [Google Scholar] [CrossRef]
- Duan, J.; Liu, X.; Wu, X.; Mao, C. Detection and segmentation of iron ore green pellets in images using lightweight U-net deep learning network. Neural Comput. Appl. 2019, 32, 5775–5790. [Google Scholar] [CrossRef]
- Tran, L.A.; Le, M.H. Robust U-Net-Based Road Lane Markings Detection for Autonomous Driving. In Proceedings of the 2019 International Conference on System Science and Engineering (ICSSE), Dong Hoi, Vietnam, 19–21 July 2019; pp. 62–66. [Google Scholar]
- Yu, F.; Koltun, V. Multi-Scale Context Aggregation by Dilated Convolutions. arXiv 2015, arXiv:1511.07122. [Google Scholar]
- Srivastava, N.; Hinton, G.; Krizhevsky, A.; Salakhutdinov, R. Dropout: A Simple Way to Prevent Neural Networks from Overfitting. J. Mach. Learn. Res. 2014, 15, 1929–1958. [Google Scholar]
- Fu, J.; Liu, J.; Tian, H.; Li, Y.; Bao, Y.; Fang, Z.; Lu, H. Dual Attention Network for Scene Segmentation. In Proceedings of the IEEE/CVF Conference on Computer Vision and Pattern Recognition, Long Beach, CA, USA, 15–20 June 2019; pp. 3146–3154. [Google Scholar]
- Zhu, X.; Cheng, D.; Zhang, Z.; Lin, S.; Dai, J. An Empirical Study of Spatial Attention Mechanisms in Deep Networks. In Proceedings of the IEEE/CVF International Conference on Computer Vision, Seoul, Republic of Korea, 27 October–2 November 2019; pp. 6688–6697. [Google Scholar]
- Rahman, M.A.; Wang, Y. Optimizing Intersection-over-Union in Deep Neural Networks for Image Segmentation. In International Symposium on Visual Computing; Bebis, G., Boyle, R., Parvin, B., Koracin, D., Porikli, F., Skaff, S., Entezari, A., Min, J., Iwai, D., Sadagic, A., et al., Eds.; Lecture Notes in Computer Science; Springer International Publishing: Cham, Germany, 2016; Volume 10072, pp. 234–244. ISBN 978-3-319-50834-4. [Google Scholar]
- Kingma, D.P.; Ba, J. Adam: A Method for Stochastic Optimization. arXiv 2014, arXiv:1412.6980. [Google Scholar]
- Selvaraju, R.R.; Das, A.; Vedantam, R.; Cogswell, M.; Parikh, D.; Batra, D. Grad-CAM: Why Did You Say That? arXiv 2016, arXiv:1611.07450. [Google Scholar]


| PA (%) | UA (%) | IoU (%) | |
|---|---|---|---|
| SPMCNN-ESPCN | 65.9 | 66.4 | 49.4 |
| SRMCNN | 73.7 | 72.1 | 57.4 |
| CASNet | 74.9 | 74.7 | 59.8 |
| SCNet | 68.7 | 85.6 | 61.6 |
| SRSNet | 75.9 | 88.1 | 68.9 |
| CN | MN | EN | PA (%) | UA (%) | IoU (%) | |
|---|---|---|---|---|---|---|
| SRMCNN | 108556 | 24196 | 36436 | 74.9 | 81.8 | 64.2 |
| SRMCNN_op | 114732 | 18020 | 38484 | 74.9 | 86.4 | 67.0 |
| SRSNet | 117016 | 15736 | 37188 | 75.9 | 88.1 | 68.9 |
| PA (%) | UA (%) | IoU (%) | |
|---|---|---|---|
| SRSNet-nearest | 73.9 | 74.2 | 58.7 |
| SRSNet-bilinear | 70.6 | 78.5 | 59.2 |
| SRSNet | 75.9 | 88.1 | 68.9 |
Disclaimer/Publisher’s Note: The statements, opinions and data contained in all publications are solely those of the individual author(s) and contributor(s) and not of MDPI and/or the editor(s). MDPI and/or the editor(s) disclaim responsibility for any injury to people or property resulting from any ideas, methods, instructions or products referred to in the content. |
© 2023 by the authors. Licensee MDPI, Basel, Switzerland. This article is an open access article distributed under the terms and conditions of the Creative Commons Attribution (CC BY) license (https://creativecommons.org/licenses/by/4.0/).
Share and Cite
Jia, Y.; Zhang, X.; Xiang, R.; Ge, Y. Super-Resolution Rural Road Extraction from Sentinel-2 Imagery Using a Spatial Relationship-Informed Network. Remote Sens. 2023, 15, 4193. https://doi.org/10.3390/rs15174193
Jia Y, Zhang X, Xiang R, Ge Y. Super-Resolution Rural Road Extraction from Sentinel-2 Imagery Using a Spatial Relationship-Informed Network. Remote Sensing. 2023; 15(17):4193. https://doi.org/10.3390/rs15174193
Chicago/Turabian StyleJia, Yuanxin, Xining Zhang, Ru Xiang, and Yong Ge. 2023. "Super-Resolution Rural Road Extraction from Sentinel-2 Imagery Using a Spatial Relationship-Informed Network" Remote Sensing 15, no. 17: 4193. https://doi.org/10.3390/rs15174193
APA StyleJia, Y., Zhang, X., Xiang, R., & Ge, Y. (2023). Super-Resolution Rural Road Extraction from Sentinel-2 Imagery Using a Spatial Relationship-Informed Network. Remote Sensing, 15(17), 4193. https://doi.org/10.3390/rs15174193