Abstract
Multi-class geospatial object detection in high-resolution remote sensing images has significant potential in various domains such as industrial production, military warning, disaster monitoring, and urban planning. However, the traditional process of remote sensing object detection involves several time-consuming steps, including image acquisition, image download, ground processing, and object detection. These steps may not be suitable for tasks with shorter timeliness requirements, such as military warning and disaster monitoring. Additionally, the transmission of massive data from satellites to the ground is limited by bandwidth, resulting in time delays and redundant information, such as cloud coverage images. To address these challenges and achieve efficient utilization of information, this paper proposes a comprehensive on-board multi-class geospatial object detection scheme. The proposed scheme consists of several steps. Firstly, the satellite imagery is sliced, and the PID-Net (Proportional-Integral-Derivative Network) method is employed to detect and filter out cloud-covered tiles. Subsequently, our Manhattan Intersection over Union (MIOU) loss-based YOLO (You Only Look Once) v7-Tiny method is used to detect remote-sensing objects in the remaining tiles. Finally, the detection results are mapped back to the original image, and the truncated NMS (Non-Maximum Suppression) method is utilized to filter out repeated and noisy boxes. To validate the reliability of the scheme, this paper creates a new dataset called DOTA-CD (Dataset for Object Detection in Aerial Images-Cloud Detection). Experiments were conducted on both ground and on-board equipment using the AIR-CD dataset, DOTA dataset, and DOTA-CD dataset. The results demonstrate the effectiveness of our method.
1. Introduction
High-resolution remote sensing images are valuable resources that contain detailed ground information, making them highly relevant in disaster monitoring, industrial production, agricultural production, military surveillance, and other fields. Within remote sensing image processing, multi-class geospatial object detection plays a vital role by automatically extracting information about various ground objects. However, the traditional remote sensing object detection process involves several time-consuming steps, including image acquisition, image download, ground image processing, and remote sensing object detection. This entire process consists of multiple tedious processing steps, which can undermine the timeliness of tasks requiring fast processing, such as disaster monitoring and military warning. To address this issue, deploying object detection methods directly on satellites for on-board detection would significantly enhance the effective utilization of high-resolution remote sensing image data for such tasks. By only downloading the specific information of interest rather than all captured images, the burden of data transmission can be effectively alleviated.
Earlier satellites like Earth Observation-1, QuickBird, and NEMO were limited by the hardware capabilities available at the time. They relied on FPGA (Field Programmable Gate Array) and DSP (Digital Signal Processor) technology, which allowed for basic on-board processing tasks but could not handle computationally complex algorithms like object detection. However, hardware advancements have led to the development of small edge computing devices with high computational performance. These devices, such as NVIDIA Jetson AGX Orin, HUAWEI Ascend 310, Raspberry Pi, and others, are now capable of processing artificial intelligence algorithms effectively. This development provides a solid hardware foundation for the development of on-board remote sensing object detection algorithms.
The advancement of deep learning object detection technology has laid the foundation for on-board remote sensing object detection. Deep learning object detection technology originated from the computer vision community and is mainly applied to natural images. Based on whether to choose region proposals [1] or not, deep learning object detection techniques are divided into two categories: two-stage and one-stage. A two-stage network requires the selection of a specific number of region proposal boxes beforehand. These boxes are then utilized in the feature extraction stage to enhance the accuracy of classification and positioning in object detection. Examples include R-CNN (Region Convolutional Neural Network), Fast R-CNN, Faster R-CNN, R-FCN (Region-based Fully Convolutional Network), Mask R-CNN [1,2,3,4,5], etc. The one-stage network, in contrast, operates based on the concept of regression, which directly generates detection boxes through the network without the need for a separate region proposal step. Examples include the YOLO series, SSD (Single Shot multibox Detector), RetinaNet [6,7,8,9,10,11,12,13], and so on.
Researchers in the Earth observation community have successfully applied deep learning object detection technology to improve remote sensing object detection accuracy. For accuracy enhancement, some two-stage remote sensing object detection methods have been proposed, such as Small, Cluttered, and Rotated Object Detector (SCRDet++), Adaptive Feature Fusion towards highly accurate oriented object Detection (AFF-Det), and Phase-Shifting Coder (PSC) [14,15,16,17]. SCRDet++ improves detection accuracy by adding denoising modules to Faster R-CNN and addressing rotation variation issues. AFF-Det introduces a multi-scale feature fusion module (MSFF) built on the top layer to mitigate the semantic information loss in small-scale features, and it also proposes a weighted RoI feature aggregation (WRFA) module to enhance the feature representations at different stages of the network based on an attention mechanism. PSC provides a unified framework for handling variable periodic fuzzy problems that arise due to rotational symmetry in oriented object detection. Considering practical applications, to improve the speed of remote sensing object detection, researchers have proposed one-stage methods like You Only Look Twice (YOLT), Hyper-Light deep learning network (HyperLi-Net), and Aligned Single-Shot Detector (ASSD) [18,19,20]. YOLT has proven that due to the size of remote sensing images being too large, scaling them to the appropriate size will result in a significant loss of image details. Based on YOLO v2, it is the first to propose a complete detection process that conforms to industrial production, including image slicing, tiles detection, and result mapping. HyperLi-Net combines various network techniques to create a lightweight network for high-speed and accurate ship detection from SAR (Synthetic Aperture Radar) imagery. ASSD addresses feature misalignment in one-stage detectors in remote sensing scenes, achieving a balance between speed and accuracy on the DOTA dataset [21].
In response to the pressing demand for on-board remote sensing object detection, numerous researchers have put forth methods based on existing research. Currently, on-board remote sensing object detection methods are primarily categorized into two scenarios: SAR image-oriented and optical image-oriented. Pan et al. [22] proposed on-board ship detection in HISEA-1 SAR images, which first used the Constant False Alarm Rate (CFAR) method to coarsely identify ships, and then used the YOLO v4 [9] method to obtain more accurate final results. Xu et al. [23] introduced a lightweight on-board ship detection model for SAR (Synthetic Aperture Radar) imagery, known as Lite-YOLOv5. This model incorporates several innovative modules to reduce computational complexity and enhance detection performance. One of the key advantages of SAR imagery is its ability to acquire data effectively regardless of weather conditions. Unlike optical imagery, which can be hindered by clouds, fog, or darkness, SAR can penetrate through such obstacles and capture data consistently. However, SAR imagery does have some inherent limitations. Firstly, the resolution of SAR imagery is generally lower compared to optical imagery. This means that the level of detail captured in SAR images may be coarser, making it challenging to discern fine-scale features or objects. Additionally, SAR imagery tends to exhibit a lower signal-to-noise ratio. The presence of noise in SAR images can stem from various sources, such as speckle noise caused by interference patterns in the radar signal. This noise can obscure the desired information and impact the quality of the image. It is very necessary to carry out on-board object detection for optical images. Del Rosso et al. [24] proposed on-board volcanic eruption detection through CNN (convolutional neural network) in satellite multispectral imagery, which is the first prototype that applies deep learning models to on-board optical remote sensing detection. Pang et al. introduced a fast and lightweight intelligent Satellite On-orbit Computing Network (SOCNet) [25] that aimed to accelerate model inference and reduce the number of parameters. They achieved this by implementing various techniques, including flat multibranch and coupled fine-coarse-grained feature extraction, exchanging a larger receptive field for network depth, depthwise separable convolution, and global average pooling. Li et al. [26] introduced a new intelligent optical remote sensing satellite Luojia-3 01, which is equipped with various on-board intelligent processing technologies, such as on-board object detection, change detection, and so on.
The mentioned on-board optical object detection methods have indeed made significant contributions in terms of algorithm advancements and practical applications. However, they have often overlooked a crucial factor: the influence of cloud coverage on optical images. According to data from the International Satellite Cloud Climate Project-Flux Data (ISCCP-FD) [27], it is estimated that the global average cloud coverage is approximately two-thirds. If object detection is performed directly on these images without considering the presence of clouds, it can lead to ineffective detection, wasted computing resources, and reduced detection efficiency. In response to the mentioned issue, this paper proposes a comprehensive on-board multi-class geospatial object detection scheme. Firstly, the satellite-captured remote sensing images are sliced into smaller tiles for efficient processing. Next, cloud detection is performed on all the tiles. The detection results are then evaluated, and any tiles identified as cloud images are filtered out. The third step involves conducting object detection on the remaining tiles that passed the cloud detection stage. In the fourth step, the detection results from the tiles are mapped back to the original remote-sensing image. This mapping process helps align the object detection results with their corresponding locations in the original image. Additionally, noise boxes are removed to enhance the accuracy. Finally, the object detection results are transmitted to the ground workstation for further analysis and utilization. In accordance with specific requirements, it is also possible to selectively download the tiles that have been filtered by the cloud detection step. This approach helps alleviate the pressure of data transmission. In the proposed process, this paper needs to take into account both the speed and accuracy of cloud detection, considering the limitations of hardware devices. To address these concerns, numerous previous studies have been dedicated to enhancing the performance of cloud detection methods. Jeppesen et al. [28] introduced a deep learning cloud detection model called the Remote Sensing Network (RS-Net) which utilizes the U-net architecture. The performance of this model, when using only the RGB bands, shows significant improvement in cloud detection accuracy. Li et al. [29] propose the global context-dense block U-Net (GCDB-UNet), a robust cloud detection network that integrates the global context-dense block (GCDB) into the U-Net framework, enabling effective detection of thin clouds. Pu et al. [30] introduced a high-precision cloud detection network that combines a self-attention module and spatial pyramidal pooling, excelling in detecting cloud edges. While these algorithms offer accuracy advantages, they may lack sufficient speed for on-board computing scenarios. In this paper, a cloud detection model based on the state-of-the-art (SOTA) real-time semantic segmentation network PID-Net [31] is utilized. This model is applied to the task of cloud detection through transfer learning. The reliability of the on-board cloud detection tasks is validated through experiments. To improve the performance of on-board object detection, this paper embeds the MIOU loss [32] into YOLO v7-Tiny [11], which improved the detection accuracy without losing inference speed. Due to a large number of truncated objects generated at the edge of tiles during remote sensing image slicing, many truncated boxes will be obtained after object detection. These truncated boxes are not easily removed when mapping the detection results of tiles back to the original image. Therefore, this paper uses the Truncated NMS algorithm to remove noise boxes, which has been proven effective by Shen et al. [33] in removing truncation boxes and duplicate detection boxes.
The main contributions of this paper are as follows:
- (1)
- This paper proposes a comprehensive on-board multi-class geospatial object detection scheme, including image slicing, cloud detection, tile filtering, object detection, coordinate mapping, and noise box removal. This scheme effectively avoids the waste of computing resources caused by performing object detection tasks on a large number of cloud images, significantly improving detection efficiency.
- (2)
- This paper implements fast on-board cloud detection based on real-time semantic segmentation network PID-Net, which combines efficiency and accuracy in cloud detection results, providing a guarantee for effectively removing cloud images.
- (3)
- To achieve fast on-board remote sensing object detection, this paper proposes MIOU loss-based YOLO v7-Tiny, which enhances the accuracy of the network while maintaining fast inference speed. And in the post-processing process, the Truncated NMS algorithm was effectively used to eliminate duplicate detection boxes and the truncated boxes generated by truncated targets near the tile edges.
- (4)
- This paper creates a new dataset called DOTA-CD to verify whether the on-board cloud detection process is effective in improving detection efficiency. To validate the performance of the PID-Net model in on-board cloud detection tasks, this paper compares its results with those of state-of-the-art (SOTA) deep learning cloud detection algorithms using the AIR-CD dataset [34]. Furthermore, to evaluate the effectiveness of the MIOU loss-based YOLO v7-Tiny in remote sensing object detection, this paper compares its performance with that of SOTA deep learning remote sensing object detection algorithms on the DOTA dataset. The scheme was conducted on the on-board equipment NVIDIA Jetson AGX Orin. All experimental results have verified the feasibility of our scheme.
2. Methodology
This paper proposes a comprehensive multi-class geospatial object detection scheme from ground to satellite. The proposed scheme consists of two main parts: the ground training part and the on-board inference part, as illustrated in Figure 1. The ground training part involves training the cloud detection model and object detection model on the ground training equipment using the transfer learning strategy. After training, the models are converted into the on-board format and uploaded to the on-board equipment. In the on-board inference part, the process begins with the large-sized remote sensing image being sliced into tiles of suitable size for network input. These tiles are then fed into the cloud detection model for cloud detection, determining whether each tile represents a cloud image. If a tile is identified as a cloud image, it is filtered out and excluded from further processing. If a tile is not classified as a cloud image, it proceeds to the next step. The remaining tiles, which are less affected by cloud coverage, are then input into the object detection model for multi-class geospatial object detection. The object detection model identifies and localizes various objects of interest within each tile. Finally, Truncated NMS is used to filter out duplicate object boxes and object boxes that may have been generated due to truncation of the tiles and the coordinates are mapped back to the original large image. Due to possible differences in data distribution between satellite-captured data and the existing sample library, newly captured data can be annotated and added to the sample library for fine-tuning the network. The new model can then be uploaded to the satellite to improve detection accuracy. This chapter will introduce cloud detection, object detection, Truncated NMS, and architecture of on-board multi-class geospatial object detection in four parts in sequence.
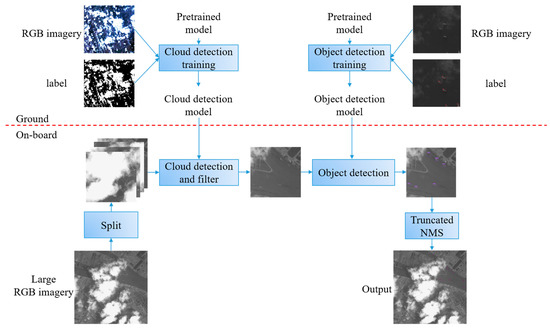
Figure 1.
The overview of multi-class geospatial object detection framework from ground to on-board.
2.1. Cloud Detection
2.1.1. Architecture of the PID-Net
The architecture of PID-Net is shown in Figure 2, which includes three branches: professional (P) branch, integral (I) branch, and derivative (D) branch. The P-branch retains the detailed information of high-resolution feature maps without further down-sampling operations and utilizes the Pixel-attention-guided fusion (Pag) module to parse these details. The Pag module is shown in Figure 3. Due to the small number of channels and network layers contained in the P-branch, rich semantic information provided by the I-branch is crucial for the Pag module to parse the P-branch. First, to make the feature maps of the two branches keep the same channel number and size, Conv 1 × 1 and up-sampling are performed on the feature maps of the I-branch and Conv 1 × 1 is performed on the feature maps of the P-branch. Then, two branches are merged by pixel-wise multiplication, and the merged results are performed channel-wise sum and the sigmoid activation function to get the attention map . Then, the P-branch is multiplied the by attention map and the I-branch is multiplied the by attention map . Finally, the output of Pag is obtained through the sum of the two results and the ReLU Activation function. Here, when , the network pays more attention to the detailed information of the P-branch, when , the network pays more attention to the contextual information of the I-branch. This allows for the exchange of information between the two branches and better parsing of P-branches. I-branch continuously down-sampling feature maps to obtain long-distance contextual information, which is used to provide global dependencies for P-branch and D-branch branches. PPM (Pyramid Pooling Module) in I-branch for quickly aggregating contextual information at different scales. As shown in Figure 4, the four feature maps are obtained by performing four different kernel size and stride average pooling operations and Conv 1 × 1 separately on the input feature maps. Then four new feature maps are obtained by up-sampling these four feature maps and adding them to the input feature maps respectively. PPM output is obtained by fusing the concatenation results of four feature maps and the input feature maps. D-branch extracts high-frequency features to predict boundary regions, and like P-branch, due to the lack of channel numbers and fewer network layers, it needs to fuse information from I-branch.
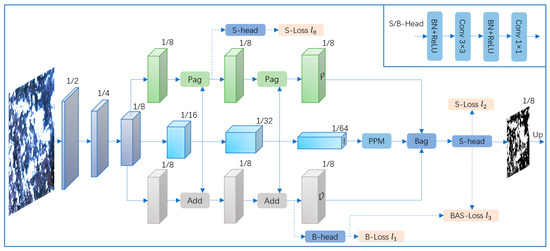
Figure 2.
PID-Net network architecture. BN means batch normalization. Conv 3 × 3 means convolution of kernel size = 3, stride = 2. Up means up sample. S-head means semantic head. B-head means Boundary head. Pag (Pixel-Attention-Guided fusion) module is shown in Figure 3. PPM (Pyramid Pooling Module) is shown in Figure 4. Bag (Boundary-Attention-Guided fusion) module is shown in Figure 5.

Figure 3.
Pag module. The multiplication and sum signs in the figure represent pixel-wise multiplication and pixel-wise sum, respectively.
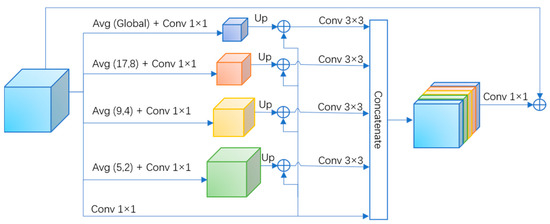
Figure 4.
PPM module. Avg (17,8) represents the average pooling of kernel size = 17, stride = 8. Global means global average pooling.
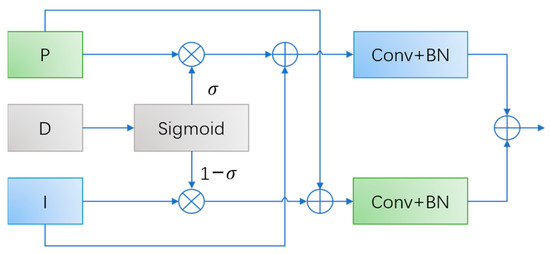
Figure 5.
Bag module. P. I and D refer to the three branches of P-branch, I-branch, and D-branch, respectively.
The network finally integrates the information of three branches through the Boundary-attention-guided fusion (Bag) module, as shown in Figure 5. The Bag module uses D-branch to guide the fusion of P-branch and I-branch. The I-branch is capable of providing rich semantic information. However, it tends to sacrifice a significant amount of spatial and geometric details, particularly in boundary areas and small objects. In contrast, the P-branch excels at preserving spatial detail information, making it better suited for accurately representing fine-grained details and capturing subtle geometric variations. The Bag module makes the model trust spatial details more in the boundary region, and contextual features more in the internal region of an object.
2.1.2. Loss Function
As illustrated in Figure 2, Following [35,36,37], PID-Net incorporates a semantic head in the P-branch to further enhance the optimization of the entire network. This semantic head introduces an additional semantic loss, denoted as . To emphasize the importance of the boundary area, PID-Net incorporates a boundary head in the D-branch and introduces a weighted binary cross-entropy loss based on dice loss [38], denoted as . For the semantic head output, PID-Net utilizes two cross-entropy (CE) losses [39], namely and . The loss is associated with semantic information and aids in optimizing the network’s semantic understanding of the objects. The loss combines both the boundary information from the B-head and the semantic information from the S-head. This combined loss aims to reinforce the role of the Bag module in effectively utilizing both boundary and semantic details. Based on the above, the loss of PID-Net is:
This paper keeps the loss parameters at their default settings, that is, = 0.4, = 20, = 1, = 1.
2.2. MIOU Loss-Based YOLO v7-Tiny for Multi-Class Geospatial Object Detection
2.2.1. Architecture of the YOLOv7-Tiny Network
The network structure of YOLO v7-Tiny is shown in Figure 6, which consists of three parts: backbone, neck, and head. Backbone consists of two Conv 3 × 3 operators, three Max Pooling operators, and four ELAN (Efficient Layer Aggregation Network) blocks, in which Conv 3 × 3 operators and Max Pooling operators are responsible for down-sampling and ELAN blocks are responsible for feature extraction. The input with the size of 1024 × 1024 is down-sampled by 8, 16, and 32 times to obtain feature maps with sizes of 128 × 128, 64 × 64, and 32 × 32, respectively. ELAN is an improved block based on VoVNet (Variety of View Network) [40] and CSPNet (Cross Stage Partial Network) [41], which optimizes the gradient length of the overall network. VoVNet is a concatenation-based model that preserves the information of intermediate feature layers by aggregating different receptive field feature layers while considering the efficiency of the network. Its speed and accuracy performance are better than previous plain structures and residual structures. CSPNet believes that the problem of high inference complexity is caused by the repetition of gradient information in network optimization. Therefore, the CSP module is used to first divide the feature mapping of the basic layer into two parts, and then merge them through a cross-stage hierarchical structure, reducing computational complexity while ensuring accuracy. ELAN retains the idea of VoVNet aggregating different receptive field feature layers, while also considering the inference calculation problem caused by repeated gradient information. The left two routes in Figure 7 reflect the concept of CSP (Cross Stage Partial), while the overall four routes reflect the concept of concatenation based, preserving the information of the middle layer. The neck of YOLO v7-Tiny adopts a classic PAN (Path Aggregation Network) structure [42], which consists of a top-down FPN (Feature Pyramid Network) [43] structure and a bottom-up FPN structure. The first FPN communicates the semantic information of the upper layer by concatenating the up-sampling results of the upper layer with the lower layer, while the second FPN concatenates the down-sampling results of the lower layer with the upper layer to convey the positioning information of the lower layer. The feature fusion of PAN effectively improves the effectiveness of the network. The internal blocks of the neck include an SPP block [44] and four ELAN blocks. The SPP block is shown in Figure 8. By executing Max Pooling with different kernels on the input, the feature maps of different receptive fields are obtained, and then these feature maps are concatenated to achieve multi-scale feature fusion. The head of YOLO v7-Tiny has three outputs, corresponding with sizes of 128 × 128 × 60, 64 × 64 × 60, and 32 × 32 × 60, 60 indicates that each location of the output feature map has three predicted boxes, each predicted box includes 15 categories, 4 coordinates, and 1 score.
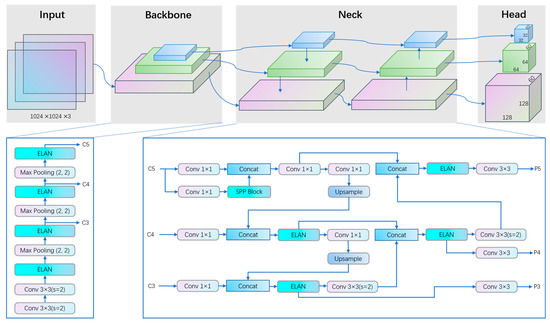
Figure 6.
YOLO v7-Tiny network architecture. The backbone is composed of stacked ELAN (Efficient Layer Aggregation Network) blocks, which output C3-C5 feature maps to the neck. The neck is PAN, which inputs three feature maps from backbone and outputs three feature maps to head. The head has three output branches. 60 indicates that each location of the output feature map has three predicted boxes, each predicted box includes 15 categories, 4 coordinates, and 1 score. Max pooling (2, 2) means max-pooling of kernel size = 2, stride = 2. Conv 3 × 3 (s = 2) means convolution of kernel size = 3, stride = 2. Conv 1 × 1 means convolution of kernel size = 1, stride = 1. Concat means concatenate. ELAN block is shown in Figure 7. SPP (Spatial Pyramid Pooling) block is shown in Figure 8.
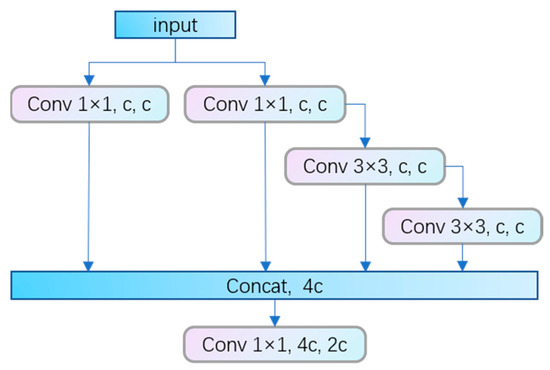
Figure 7.
ELAN block. Conv 1 × 1, c, c means the input channel number is c and the output channel number is c.
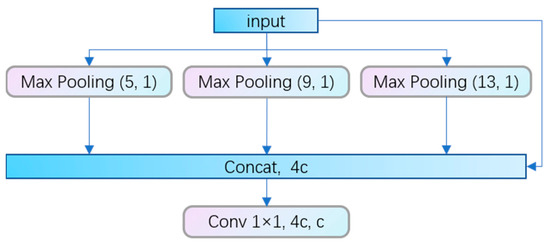
Figure 8.
SPP block.
2.2.2. Loss Function
The loss of YOLO v7-Tiny consists of three parts: regression loss, classification loss, and confidence loss. The BCE (Binary Cross Entropy) loss is used for classification loss and confidence loss, while the CIOU (complete intersection of union) loss [45] is used for regression loss. The regression loss has a significant impact on the regression speed and positioning accuracy of the predicted boxes. Considering Euclidean distance contained in the CIOU is very unstable in the early stage of network training and the denominator term of normalized Euclidean distance is verified to have a negative effect on the decline of loss, this paper use the MIOU-C loss [32], which adds Manhattan distance on the basis of the CIOU loss to compensate for the shortcomings of Euclidean distance, while setting the denominator terms of normalized Euclidean distance and Manhattan distance as coefficients to eliminating negative effect. the MIOU-C loss is defined as follows:
where is Intersection over Union between a ground-truth and the associated predicted box, is a positive trade-off parameter, and are normalization parameters, and measures the consistency of aspect ratio, is the Euclidean distance, is the Manhattan distance, b and denote center points of B and . is defined as follows:
where is the ground-truth and is the predicted box. is defined as follows:
parameters , and are defined as
where , and respectively, are the diagonal length, width, and height of the smallest enclosing box covering the two boxes and .
2.3. Truncated NMS Algorithm for Post-Processing of Geospatial Object Detection
In the process of slicing the original image into tiles, target truncation at the tile boundaries is an inevitable phenomenon. This truncation can lead to incomplete detection of targets, as shown in Figure 9. To address this issue, a 20% overlap rate is set during slicing to preserve complete target information in some tiles, such as image2. However, even with the overlap, the truncated parts of targets can still be detected, as seen in image 1. These detections create noise that cannot be effectively removed by the traditional NMS algorithm. The reason is that the overlap between the truncated detection box (red box in image1) and the complete detection box (blue box in image2) is insufficient, resulting in a low IOU score. To address this problem, the Truncated NMS algorithm [33] is introduced in the process of mapping the object detection results from the tiles back to the original image. Truncated NMS builds upon the effectiveness of traditional NMS [46] in removing duplicate detection boxes but specifically targets the suppression of truncated boxes at the image boundaries. It effectively suppresses these truncated boxes that have a small IOU with the correct detection boxes but cannot be removed by the regular NMS algorithm. By applying Truncated NMS, the noise caused by truncated detections can be reduced, improving the accuracy of the object detection results.
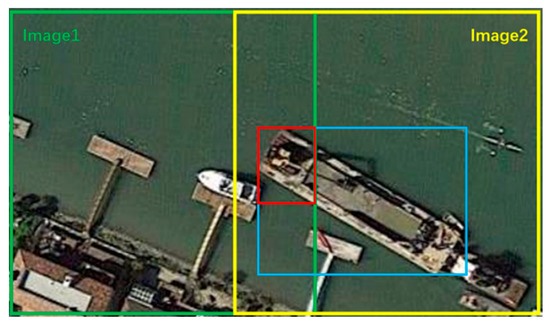
Figure 9.
The predicted box filtering in remote sensing images splicing. The red box indicates the predicted box in image1. The blue box is the predicted box in image2.
2.4. Architecture of On-Board Multi-Class Geospatial Object Detection
Figure 10 illustrates the process of on-board multi-class geospatial object detection. The steps involved are as follows: (1) Image Slicing: The input large image is divided into 1024 × 1024 tiles. (2) Cloud Detection: Cloud detection is performed on each tile, generating binary cloud detection images. If the cloud area exceeds 75% of the entire tile, the tile is considered a cloud image and filtered out. The process then moves on to the next tile. If the cloud area is below the threshold, the tile is considered to contain valid information and proceeds to the next step. (3) Object Detection: Object detection is performed on the retained tiles, aiming to detect and classify various objects of interest within the tile. (4) Truncated NMS: Truncated NMS is applied to the object detection results. This step filters out duplicate detection boxes and incomplete boxes caused by image slicing. The coordinates of the remaining detection boxes are mapped back to the input image.
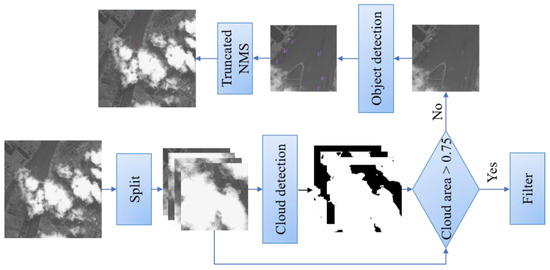
Figure 10.
The process of on-board multi-class geospatial object detection.
Throughout the entire process, the time consumption of post-processing steps, such as object detection deduplication and generating target boxes, is significantly higher than the time required for cloud detection. The combination of cloud detection and object detection enables the removal of cloud images, reducing the burden of satellite data transmission. It also avoids performing unnecessary operations, such as object detection and post-processing, on cloud images. The threshold for identifying cloud images is determined through ablation experiments in Section 3.3.4. For verification of the speed of cloud detection and object detection on on-board devices, please refer to Section 3.4.3.
3. Experiments
3.1. Data Description and Experiment Settings
3.1.1. Data Description
This paper utilizes three datasets: the large-scale remote sensing cloud detection dataset AIR-CD, the large-scale remote sensing object detection dataset DOTA, and our custom cloud detection and cloud image recognition dataset DOTA-CD. The AIR-CD dataset is generated using Gaofen-2 PMS data and is divided into 1024 × 1024 tiles, with a total of 1904 samples. Only the RGB visible bands of the AIR-CD dataset are retained for spectral band selection. The DOTA dataset comprises 2806 remote sensing images with varying sizes ranging from 800 to 13,000. It consists of 15 object categories, including baseball diamond (BD), bridge (BR), basketball court (BC), ground track field (GTF), helicopter (HC), harbor (HA), large vehicle (LV), plane (PL), roundabout (RA), small vehicle (SV), storage tank (ST), soccer ball field (SBF), swimming pool (SP), ship (SH), and tennis court (TC). In the DOTA dataset, the original images are sliced into 1024 × 1024 tiles with 50% overlap in the train subset and 20% overlap in the validation and test subsets. For parts smaller than 1024 × 1024, complete tiles are selected from back to front. DOTA dataset contains rotation detection (task1) and horizontal detection (task2), this paper selects the task2 track. Due to the differences in data distribution between the cloud detection dataset AIR-CD and the object detection dataset DOTA, the cloud detection model trained on AIR-CD cannot be effectively applied to DOTA for cloud image removal during object detection tasks. To address this, this paper creates the DOTA-CD dataset. This paper selects 15 cloud images from the DOTA dataset, ranging in size from 3500 to 5500, and sliced them into 264 tiles. The dataset includes two forms of annotation: the cloud binary map and the determination of whether the tile is a cloud map. For the cloud detection model, we initially train it on AIR-CD and then fine-tune it on DOTA-CD for improved performance.
3.1.2. Experiment Settings
All ground training tasks are implemented using PyTorch on four Nvidia RTX 3090 GPUs. All ground evaluation tasks using PyTorch on a Nvidia RTX 3090 GPU. All on-board evaluation tasks are using PyTorch and TensorRT on a NVIDIA Jetson AGX Orin. For the cloud detection training process, all experiments trained no more than 484 epochs and adopt the stochastic gradient descent (SGD) optimizer and step decay learning rate scheduling strategy with an initial learning rate of 0.01. The momentum and weight decay are respectively set as 0.9 and 0.0005. The training process on AIR-CD used pretrained model trained on CityScapes [47]. For the object detection training process, all experiments trained no more than 300 epochs and adopt the stochastic gradient descent (SGD) optimizer and cosine decay learning rate scheduling strategy with an initial learning rate of 0.1. The warm-up steps are a maximum of 3 epochs and 1000 iterations. The momentum and weight decay are respectively set as 0.937 and 0.005.
3.2. Evaluation Metrics
This section may be divided into subheadings. It should provide a concise and precise description of the experimental results, their interpretation, as well as the experimental conclusions that can be drawn.
To evaluate remote sensing cloud detection results, this paper uses five metrics: , , , F1-score, and IOU (Intersection over Union), whose formulas are:
where indicates True Positive, True Negative, False Positive, and False Negative respectively in pixel level.
To evaluate cloud image identification results in DOTA-CD, this paper uses three metrics: False Alarm, Miss Rate, and , whose formulas are:
where indicates True Positive, True Negative, False Positive, and False Negative, respectively, in image level.
To evaluate remote sensing object detection results, this paper uses the VOC metric [48], which is adopted as the official verification metric of the DOTA dataset. The VOC metric includes , , AP, and mAP:
where , , and indicates True Positive, False Positive, and False Negative, respectively, in object level. When the IOU of a predicted box and its associated target box exceeds 0.5, the predicted box is called positive, otherwise negative.
where p is , r is , and AP is average precision, which represents the area under the precision-recall curve in the coordinate system with recall as the horizontal axis and precision as the vertical axis.
where c represents category, n represents the total number of categories, and (mean average precision) represents the average value of AP in multiple categories.
To evaluate the speed and performance of the network, this paper uses two metrics: FPS or Latency, where FPS means frames per second and Latency means inference time.
3.3. Experimental Results on Ground Development Environment
3.3.1. Cloud Detection Results of PID-Net in AIR-CD
To evaluate the superior speed and accuracy of PID-Net in remote sensing cloud detection tasks, this paper compares it with SOTA cloud detection methods using the large-scale remote sensing cloud detection dataset, AIR-CD. Table 1 demonstrates the comparison results, showing that PID-Net achieves a slight improvement in IOU compared to the method proposed by Pu et al., with a lead of 0.3%. Moreover, PID-Net achieves an impressive FPS of 163 on 1024 × 1024 tiles, which is approximately five times faster than the previous method [30]. This significant increase in speed opens up possibilities for on-board cloud detection. Additionally, PID-Net outperforms other methods in , , and F1-Score, confirming its reliability in terms of accuracy. While the of PID-Net lags behind the methods CDNet, GCDB-Unet, and Pu et al., achieving 94.9% is still a reliable indicator for on-board cloud detection. Figure 11 presents the cloud detection results of PID-Net on the AIR-CD dataset. It can be observed that the algorithm achieves high accuracy in the first two columns with minimal false detections, while in the third column, there are some false detections, and in the fourth column, some small clouds are missed. This indicates that the algorithm performs well in dense cloud areas, but there may be some errors in sparse cloud areas.

Table 1.
Comparison with State-of-the-Art cloud detection methods in AIR-CD.
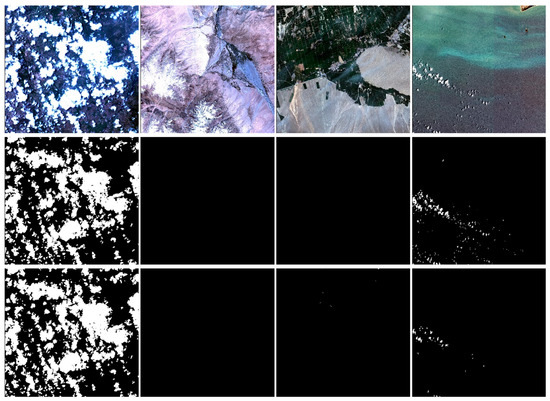
Figure 11.
Cloud Detection Results of PID-Net in AIR-CD. The first row contains original images, the second row contains ground truths, and the third row contains cloud detection results.
3.3.2. Cloud Detection Results of PID-Net in DOTA-CD
To demonstrate the effectiveness of the entire algorithm process for on-board multi-class geospatial object detection, this paper introduces the DOTA-CD dataset. This dataset contains various cloud thicknesses, and it is crucial to preserve areas with thin clouds as they may contain useful information for subsequent object detection tasks. Therefore, this paper considers thin clouds as non-cloud regions to retain these areas. In Section 3.3.1, this paper demonstrates the superior speed and accuracy of PID-Net in cloud detection tasks using the AIR-CD dataset. However, there are some differences in data distribution between AIR-CD and DOTA-CD. To ensure reliable cloud detection results on the DOTA-CD dataset, this paper fine-tunes the models specifically for DOTA-CD. This paper compares this result with other SOTA methods, as shown in Table 2. For a fair comparison, this paper uses the weights of all models trained on AIR-CD as pretrained models. The accuracy and IOU of PID-Net on DOTA-CD reached 94.4% and 78.9%, respectively, which is highly accurate for subsequent cloud image discrimination. At the same time, this paper finds that Pu et al. also exhibit similar accuracy as PID-Net, but its lower speed is not suitable for on-board object detection. Figure 12 illustrates the performance of PID-Net on DOTA-CD. This paper observes that PID-Net is robust in recognizing thick clouds, but there may be some omissions in identifying thin cloud areas, as evident in the fourth column. Although this error has minimal impact on subsequent cloud image discrimination, it is crucial to enhance the algorithm’s robustness for on-board detection. One way to achieve this is by expanding the sample database with actual data obtained from satellites, which will further reduce such errors and improve algorithm performance.

Table 2.
Pixel-based fine-tuning results of PID-Net in DOTA-CD.
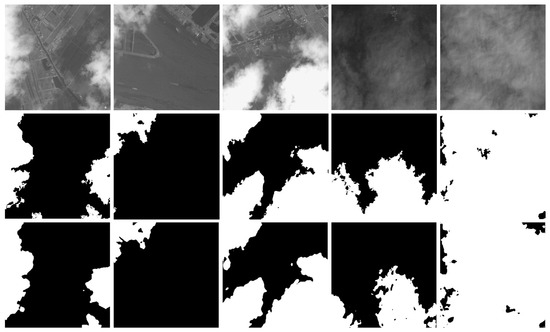
Figure 12.
Cloud Detection Results of PID-Net in DOTA-CD. The first row contains original images, the second row contains ground truths, and the third row contains cloud detection results.
3.3.3. Multi-Class Geospatial Object Detection Results in DOTA
To validate the effectiveness and reliability of our proposed MIOU loss-based YOLO v7-Tiny with Truncated NMS for multi-class geospatial object detection, this paper conducts comparisons with previous SOTA methods. The results are presented in Table 3. This paper observes that two-stage object detection networks achieve high detection accuracy, but their slow speed makes them unsuitable for deployment. Therefore, our focus was on exploring one-stage object detection methods. The method proposed by Shen et al. achieves a good balance between accuracy and speed. However, this paper notices that its backbone network, CSPParkNet53, has a large model size and computational complexity. According to Table 4, this paper finds that the parameters and FLOPs of Shen et al. are about 8 and 10 times that of our method, respectively. Considering the hardware limitations of inference devices and the time-consuming post-processing of object detection in practical deployment scenarios, this paper aims to develop smaller and faster models.

Table 3.
Comparison with State-of-the-Arts in DOTA dataset for task2. Penultimate row means MIOU loss-based YOLO v7-Tiny with NMS. Last row means MIOU loss-based YOLO v7-Tiny with TNMS. TNMS means Truncated NMS. Specifically, SCRNet++ comes in two versions, a two-stage method based on Det [53] and a one-stage method based on RetinaNet [13]. There are 15 object categories: plane (PL), baseball diamond (BD), bridge (BR), ground track field (GTF), small vehicle (SV), large vehicle (LV), ship (SH), tennis court (TC), basketball court (BC), storage tank (ST), soccer ball field (SBF), roundabout (RA), harbor (HA), swimming pool (SP), and helicopter (HC). Except for FPS, all other measures are %.

Table 4.
Comparison of model sizes between Shen et al. based on CSPParkNet53 and MIOUC+TNMS based YOLO v7-Tiny. Parameters represent number of parameters for the network. FLOPs represent floating point operations of the network when input image size is 1024.
Hence, this paper experiments with the leading object detection network, YOLO v7-Tiny, and finds that it achieves an impressive FPS of 180, surpassing the 55 FPS achieved by Shen et al. However, its mAP is only 74.6%. To bridge the accuracy gap, this paper introduces the MIOU loss to YOLO v7-Tiny, which significantly improved the network’s training effectiveness. Experimental results showed that the MIOU loss increased the mAP by 0.6% without sacrificing inference speed. Furthermore, this paper applies Truncated NMS to the coordinate mapping process after object detection to eliminate duplicate detection boxes and noise boxes generated due to truncated targets on tile edges. Through experiments, this paper observes a 0.6% improvement in mAP, validating the effectiveness of this approach.
In conclusion, our proposed MIOU loss-based YOLO v7-Tiny with Truncated NMS achieved a mAP of 75.8% and a speed of 180 FPS. Compared to previous SOTA methods, it achieved a speed improvement of over three times while maintaining a negligible 1.1% accuracy gap. This demonstrates our method’s superiority in satellite deployment scenarios. Figure 13 showcases the detection results of our method on 1024 × 1024 tiles, demonstrating effective detection across different object categories. Figure 14 presents the performance of our method on large-scale remote sensing images. Thanks to Truncated NMS, the algorithm effectively removes truncated object detection boxes caused by slicing. However, this paper also observes some missed detections of small vehicles, indicating the need for further improvement in the algorithm’s performance for small targets, especially when significant scale differences exist in remote sensing targets.
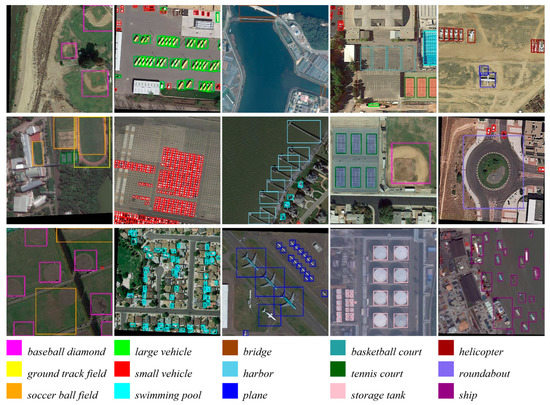
Figure 13.
Multi-class geospatial object detection results of MIOU loss-based YOLO v7-Tiny in image tiles of the DOTA dataset. The last three rows represent the colors of the boxes corresponding to different classes.
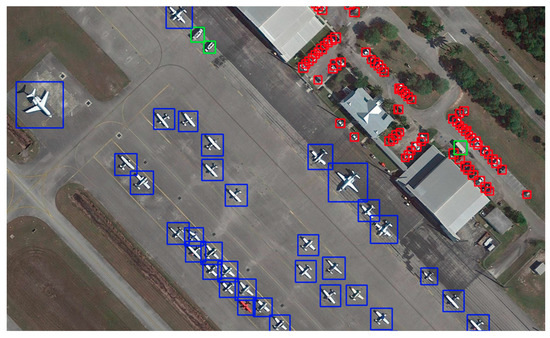
Figure 14.
Multi-class geospatial object detection results of MIOU loss-based YOLO v7-Tiny with Truncated NMS in large scenarios on DOTA dataset. The colors of the boxes are the same as Figure 13.
3.3.4. Cloud Image Identification Results in DOTA-CD
Optical remote sensing satellites often face the challenge of dealing with a high proportion of cloud data, which contains limited useful information. This issue has been a persistent challenge for cloud image recognition and removal in optical remote sensing satellites. However, in the context of on-board object detection, it is crucial to obtain images that predominantly contain valuable ground information. To address this challenge, this paper incorporates cloud image detection as a step in the on-board multi-class geospatial object detection process, as outlined in Figure 10. Traditional methods such as the threshold method [62] and ASM (angular second component) of gray level co-occurrence matrix [63], have been commonly used to recognize cloud images based on grayscale and texture information from the cloud layer. However, experimental results on the DOTA-CD dataset have shown that these methods exhibit high miss rates. To overcome these limitations, this paper validates the effectiveness of the deep learning algorithm PID-Net in pixel-level cloud detection, as described in Section 3.3.2 of the paper. Leveraging the algorithm’s high classification accuracy at the pixel level, this paper directly distinguishes the binary image of cloud detection results. By determining the proportion of pixels classified as a cloud within a tile, this paper can identify whether the tile represents a cloud image. The experimental results presented in Table 5 demonstrate the effectiveness of our approach. Specifically, our method achieved a False Alarm rate of 0, reduced the Miss Rate to 17.6%, and increased the to 97.8%. This highlights the reliability and accuracy of our pixel-level cloud detection technique, which successfully identifies and removes cloud images during the on-board multi-class geospatial object detection process.

Table 5.
Comparison of cloud image identification results with traditional methods in DOTA-CD.
To investigate the impact of different threshold ranges on the process of filtering cloud images, this paper conducts ablation experiments, the results of which are presented in Table 6. The purpose of these experiments was to determine the optimal threshold setting that balances accuracy and false alarms. This paper observes that as this paper varies the threshold, the metric reached its highest value when the threshold was set to 0.7. However, this setting resulted in a False Alarm rate of 1.7%, indicating that some tiles containing valuable information were mistakenly identified as cloud images and excluded from subsequent object detection tasks. On the other hand, a slight increase in the Miss Rate only leads to a marginal increase in the time required for ineffective detections. Considering practical applications, it is clear that the occurrence of false alarms is undesirable, as it may result in the loss of valuable data. Therefore, this paper makes the decision to set the threshold to 0.75, which strikes a balance between minimizing false alarms and maintaining an acceptable Miss Rate. By setting the threshold at this level, this paper aims to ensure that the majority of tiles containing useful information are included in the subsequent object detection process, while still achieving a high level of accuracy in cloud image filtering.

Table 6.
The effect of changes in the ranges of threshold on the process of filtering cloud images.
3.4. Experimental Results on On-Board Operational Environment
3.4.1. Cloud Detection Results of PID-Net in AIR-CD
Upon deploying the trained cloud detection model to the on-board device, this paper performes an evaluation of its performance, as presented in Table 7. Initially, when utilizing the PyTorch library, the model exhibited comparable accuracy to the ground device. However, due to hardware limitations on the deployed device, the inference speed experienced a significant decrease. To address this issue, this paper proceeds to convert the model to TensorRT, a framework specifically optimized for deployment on NVIDIA devices. During the model conversion process, this paper explores different quantization levels and observed their impact on both accuracy and speed. While INT8 quantization achieved the highest level of quantization, it resulted in a substantial loss of accuracy.

Table 7.
On-board cloud detection results of PID-Net in AIR-CD. The first line represents the inference results on the PyTorch framework, while the second to fourth lines represent the inference results after converting the Pytorch model into TensorRT models with different quantization levels.
After careful consideration, this paper ultimately opts for the FP16 quantization model, which strikes a balance between speed and accuracy. This choice allows us to leverage the accelerated processing capabilities of the on-board device while maintaining a satisfactory level of detection accuracy.
3.4.2. Multi-Class Geospatial Object Detection Results
As shown in Table 8, after deploying the trained object detection model to the on-board equipment, this paper observes that utilizing TensorRT-FP16 optimization helped achieve a balance between accuracy and speed. With a frame rate of 160 FPS, the on-board object detection process operates at a reliable and efficient speed.

Table 8.
On-board remote sensing object detection results of MIOU loss-based YOLO v7-Tiny with TNMS in DOTA validation set. The first line represents the inference results on the PyTorch framework, while the second to fourth lines represent the inference results after converting the Pytorch model into TensorRT models with different quantization levels.
3.4.3. Multi-Class Geospatial Object Detection Efficiency Analysis with Cloud Detection Preprocessing
To investigate the impact of cloud detection preprocessing on on-board multi-class geospatial object detection, this paper conducts calculations to determine the average delay of cloud detection, object detection, and post-processing of object detection for a single 1024 × 1024 tile. The results are summarized in Table 9. The post-processing for object detection mainly includes generating target boxes, removing duplicates, and saving detection results. The total delay for object detection, including post-processing, is approximately five times longer than that of cloud detection. If a tile is determined to be free from cloud coverage, an additional 1/5 of the time is required to perform cloud detection. On the other hand, if a tile is identified as a cloud image, it only undergoes cloud detection, resulting in a time savings of five times. Based on the International Satellite Cloud Climate Project’s Flux Data (ISCCP-FD) dataset, the global average cloud coverage is estimated to be around 2/3. Using this information, this paper can estimate that, compared to the benchmark time for cloud detection, approximately 1/3 of the effective data will require an additional round of cloud detection, taking one unit of time. Meanwhile, the remaining 2/3 of the data can be spared from object detection, resulting in a time savings of five units. This significant reduction in on-board object detection time can be achieved. Additionally, by avoiding the processing of 2/3 of redundant data, the need for downloading and transmitting such data is eliminated, leading to cost savings in data transmission.

Table 9.
On-Board Multi-Class Geospatial Object Detection Time consumption analysis.
4. Discussion
This paper presents a comprehensive architecture for on-board multi-class geospatial object detection, and its reliability has been thoroughly validated through both ground and on-board experiments. Our future plan involves the application of this scheme to optical remote sensing satellites to enable on-board object detection capabilities. At present, this paper successfully validates our algorithm framework in an on-board simulation system. In the upcoming months, optical remote sensing satellites equipped with RGB cameras and AI high computing power modules, incorporating our proposed algorithm, will be launched. Figure 15 illustrates the on-board simulation system. In this system, the ground station controls the satellite computer by sending commands. The satellite computer, in turn, manages the data transmission module and Command Receiving and Sending System (CRSS) through a Controller Area Network (CAN) protocol, based on the received commands. The data transmission module transmits the captured camera data to the Field Programmable Gate Array (FPGA) according to the satellite computer’s instructions. The FPGA then transfers the data to the memory, where it awaits reading by the AI module. The CRSS communicates with the AI module through a serial port, following the commands issued by the satellite computer. Upon receiving the commands, the AI module reads camera data from the memory via Peripheral Component Interconnect Express (PCIE). It performs on-board object detection tasks on the acquired data and subsequently transmits both the image data and detection results. Considering the differences between the actual data captured by the satellite and the training samples, the satellite also incorporates an upload function. Satellite-transmitted images are used to expand the sample library, and the model is fine-tuned accordingly. The refined model is then uploaded to the satellite to enhance the accuracy of on-board object detection.
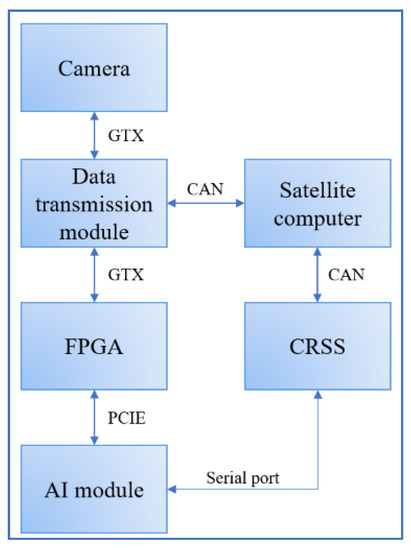
Figure 15.
On-board simulation system. GTX means Gigabit Transceiver, CAN means Controller Area Network, and FPGA means Field Programmable Gate Array. PCIE means Peripheral Component Interconnect Express. CRSS means Command Receiving and Sending System. AI module means Artificial Intelligence module.
5. Conclusions
In this paper, our main focus has been on addressing the practical challenges associated with on-board object detection. This paper recognizes that on-board object detection requires more than just efficient algorithms; it also necessitates careful consideration of computing resource utilization and efficiency in handling large volumes of data, particularly when a significant portion of that data may be irrelevant or contain no useful information. To address these challenges, this paper puts forth a comprehensive on-board multi-class geospatial object detection scheme, including image slicing, cloud detection, tile filtering, object detection, noise box removal, and coordinate mapping. Among them, this paper uses the deep convolutional neural network PID-Net with both accuracy and efficiency to perform cloud detection and specifically judged the cloud detection results to remove the cloud image, which saved a lot of computing resources for subsequent object detection and also reduced the pressure of satellite data download. For object detection, coordinate mapping, and noise box removal, this paper uses MIOU loss-based YOLO v7-Tiny with Truncated NMS, in which the MIOU loss improved accuracy without losing speed, and Truncated NMS effectively removed duplicate boxes and truncated target boxes at tile edges in the post-processing of detection results. This paper demonstrates the effectiveness of the above scheme through experiments. Next, we will deploy the proposed algorithm to the satellite and evaluate its performance based on the actual operation of the satellite. We hope to further improve the efficiency and accuracy of the algorithm in the future.
Author Contributions
Conceptualization, Y.S. and Q.Z.; Methodology, Y.S.; Validation, Y.S., J.C., Z.W. (Zhipan Wang) and Z.W. (Zhe Wang). Writing the original draft, Y.S., D.L. and Q.Z.; Formal analysis, Q.Z.; Writing, review, editing, and supervision Y.S., D.L., J.C. and Q.Z. All authors have read and agreed to the published version of the manuscript.
Funding
This research was funded by the Shenzhen Science and Technology Program (No. ZDSYS20210623091808026), and the National Key Research and Development Program of China (No. 2022YFE0209300).
Conflicts of Interest
The authors declare no conflict of interest.
References
- Girshick, R.; Donahue, J.; Darrell, T.; Malik, J. Rich feature hierarchies for accurate object detection and semantic segmentation. In Proceedings of the IEEE Conference on Computer Vision and Pattern Recognition, Columbus, OH, USA, 23–28 June 2014; pp. 580–587. [Google Scholar]
- Girshick, R. Fast r-cnn. In Proceedings of the IEEE International Conference on Computer Vision, Santiago, Chile, 7–13 December 2015; pp. 1440–1448. [Google Scholar]
- Ren, S.; He, K.; Girshick, R.; Sun, J. Faster r-cnn: Towards real-time object detection with region proposal networks. Adv. Neural Inf. Process. Syst. 2015, 28, 91–99. [Google Scholar]
- Dai, J.; Li, Y.; He, K.; Sun, J. R-fcn: Object detection via region-based fully convolutional networks. In Proceedings of the Advances in Neural Information Processing Systems, Barcelona, Spain, 5–10 December 2016; pp. 379–387. [Google Scholar]
- He, K.; Gkioxari, G.; Dollár, P.; Girshick, R. Mask r-cnn. In Proceedings of the IEEE International Conference on Computer Vision, Venice, Italy, 22–29 October 2017; pp. 2961–2969. [Google Scholar]
- Redmon, J.; Divvala, S.; Girshick, R.; Farhadi, A. You only look once: Unified, real-time object detection. In Proceedings of the IEEE Conference on Computer Vision and Pattern Recognition, Las Vegas, NV, USA, 27–30 June 2016; pp. 779–788. [Google Scholar]
- Redmon, J.; Farhadi, A. YOLO9000: Better, faster, stronger. In Proceedings of the IEEE Conference on Computer Vision and Pattern Recognition, Honolulu, HI, USA, 21–26 July 2017; pp. 7263–7271. [Google Scholar]
- Redmon, J.; Farhadi, A. Yolov3: An incremental improvement. arXiv 2018, arXiv:1804.02767. [Google Scholar]
- Bochkovskiy, A.; Wang, C.-Y.; Liao, H.-Y.M. Yolov4: Optimal speed and accuracy of object detection. arXiv 2020, arXiv:2004.10934. [Google Scholar]
- Li, C.; Li, L.; Jiang, H.; Weng, K.; Geng, Y.; Li, L.; Ke, Z.; Li, Q.; Cheng, M.; Nie, W. YOLOv6: A single-stage object detection framework for industrial applications. arXiv 2022, arXiv:2209.02976. [Google Scholar]
- Wang, C.-Y.; Bochkovskiy, A.; Liao, H.-Y.M. YOLOv7: Trainable bag-of-freebies sets new state-of-the-art for real-time object detectors. In Proceedings of the IEEE/CVF Conference on Computer Vision and Pattern Recognition, Vancouver, BC, Canada, 18–22 June 2023; pp. 7464–7475. [Google Scholar]
- Liu, W.; Anguelov, D.; Erhan, D.; Szegedy, C.; Reed, S.; Fu, C.-Y.; Berg, A.C. Ssd: Single shot multibox detector. In Proceedings of the European Conference on Computer Vision, Amsterdam, The Netherlands, 8–16 October 2016; pp. 21–37. [Google Scholar]
- Lin, T.-Y.; Goyal, P.; Girshick, R.; He, K.; Dollár, P. Focal loss for dense object detection. In Proceedings of the IEEE International Conference on Computer Vision, Venice, Italy, 22–29 October 2017; pp. 2980–2988. [Google Scholar]
- Yang, X.; Yan, J.; Yang, X.; Tang, J.; Liao, W.; He, T. Scrdet++: Detecting small, cluttered and rotated objects via instance-level feature denoising and rotation loss smoothing. arXiv 2020, arXiv:2004.13316. [Google Scholar]
- Zhen, P.; Wang, S.; Zhang, S.; Yan, X.; Wang, W.; Ji, Z.; Chen, H.-B. Towards accurate oriented object detection in aerial images with adaptive multi-level feature fusion. ACM Trans. Multimed. Comput. Commun. Appl. 2023, 19, 1–22. [Google Scholar]
- Yu, Y.; Da, F. Phase-shifting coder: Predicting accurate orientation in oriented object detection. In Proceedings of the IEEE/CVF Conference on Computer Vision and Pattern Recognition, Vancouver, BC, Canada, 18–22 June 2023; pp. 13354–13363. [Google Scholar]
- Balamurugan, D.; Aravinth, S.; Reddy, P.C.S.; Rupani, A.; Manikandan, A. Multiview objects recognition using deep learning-based wrap-CNN with voting scheme. Neural Process. Lett. 2022, 54, 1495–1521. [Google Scholar]
- Van Etten, A. You only look twice: Rapid multi-scale object detection in satellite imagery. arXiv 2018, arXiv:1805.09512. [Google Scholar]
- Zhang, T.; Zhang, X.; Shi, J.; Wei, S. HyperLi-Net: A hyper-light deep learning network for high-accurate and high-speed ship detection from synthetic aperture radar imagery. ISPRS J. Photogramm. Remote Sens. 2020, 167, 123–153. [Google Scholar] [CrossRef]
- Xu, T.; Sun, X.; Diao, W.; Zhao, L.; Fu, K.; Wang, H. ASSD: Feature Aligned Single-Shot Detection for Multiscale Objects in Aerial Imagery. IEEE Trans. Geosci. Remote Sens. 2021, 60, 1–17. [Google Scholar]
- Xia, G.-S.; Bai, X.; Ding, J.; Zhu, Z.; Belongie, S.; Luo, J.; Datcu, M.; Pelillo, M.; Zhang, L. DOTA: A large-scale dataset for object detection in aerial images. In Proceedings of the IEEE Conference on Computer Vision and Pattern Recognition, Salt Lake City, UT, USA, 18–23 June 2018; pp. 3974–3983. [Google Scholar]
- Xu, P.; Li, Q.; Zhang, B.; Wu, F.; Zhao, K.; Du, X.; Yang, C.; Zhong, R. On-board real-time ship detection in HISEA-1 SAR images based on CFAR and lightweight deep learning. Remote Sens. 2021, 13, 1995. [Google Scholar]
- Xu, X.; Zhang, X.; Zhang, T. Lite-yolov5: A lightweight deep learning detector for on-board ship detection in large-scene sentinel-1 sar images. Remote Sens. 2022, 14, 1018. [Google Scholar]
- Del Rosso, M.P.; Sebastianelli, A.; Spiller, D.; Mathieu, P.P.; Ullo, S.L. On-board volcanic eruption detection through cnns and satellite multispectral imagery. Remote Sens. 2021, 13, 3479. [Google Scholar]
- Pang, Y.; Zhang, Y.; Wang, Y.; Wei, X.; Chen, B. SOCNet: A Lightweight and Fine-Grained Object Recognition Network for Satellite On-Orbit Computing. IEEE Trans. Geosci. Remote Sens. 2022, 60, 1–13. [Google Scholar]
- Deren, L.; Mi, W.; Fang, Y. A new generation of intelligent mapping and remote sensing scientific test satellite Luojia-3 01. Acta Geod. Cartogr. Sin. 2022, 51, 789. [Google Scholar]
- Zhang, Y.; Rossow, W.B.; Lacis, A.A.; Oinas, V.; Mishchenko, M.I. Calculation of radiative fluxes from the surface to top of atmosphere based on ISCCP and other global data sets: Refinements of the radiative transfer model and the input data. J. Geophys. Res. Atmos. 2004, 109. [Google Scholar]
- Jeppesen, J.H.; Jacobsen, R.H.; Inceoglu, F.; Toftegaard, T.S. A cloud detection algorithm for satellite imagery based on deep learning. Remote Sens. Environ. 2019, 229, 247–259. [Google Scholar] [CrossRef]
- Li, X.; Yang, X.; Li, X.; Lu, S.; Ye, Y.; Ban, Y. GCDB-UNet: A novel robust cloud detection approach for remote sensing images. Knowl. Based Syst. 2022, 238, 107890. [Google Scholar]
- Pu, W.; Wang, Z.; Liu, D.; Zhang, Q. Optical remote sensing image cloud detection with self-attention and spatial pyramid pooling fusion. Remote Sens. 2022, 14, 4312. [Google Scholar] [CrossRef]
- Xu, J.; Xiong, Z.; Bhattacharyya, S.P. PIDNet: A Real-Time Semantic Segmentation Network Inspired by PID Controllers. In Proceedings of the IEEE/CVF Conference on Computer Vision and Pattern Recognition, Vancouver, BC, Canada, 18–22 June 2023; pp. 19529–19539. [Google Scholar]
- Shen, Y.; Zhang, F.; Liu, D.; Pu, W.; Zhang, Q. Manhattan-distance IOU loss for fast and accurate bounding box regression and object detection. Neurocomputing 2022, 500, 99–114. [Google Scholar] [CrossRef]
- Shen, Y.; Liu, D.; Zhang, F.; Zhang, Q. Fast and accurate multi-class geospatial object detection with large-size remote sensing imagery using CNN and Truncated NMS. ISPRS J. Photogramm. Remote Sens. 2022, 191, 235–249. [Google Scholar]
- He, Q.; Sun, X.; Yan, Z.; Fu, K. DABNet: Deformable contextual and boundary-weighted network for cloud detection in remote sensing images. IEEE Trans. Geosci. Remote Sens. 2021, 60, 1–16. [Google Scholar]
- Yu, C.; Gao, C.; Wang, J.; Yu, G.; Shen, C.; Sang, N. Bisenet v2: Bilateral network with guided aggregation for real-time semantic segmentation. Int. J. Comput. Vis. 2021, 129, 3051–3068. [Google Scholar]
- Li, X.; You, A.; Zhu, Z.; Zhao, H.; Yang, M.; Yang, K.; Tan, S.; Tong, Y. Semantic flow for fast and accurate scene parsing. In Proceedings of the Computer Vision–ECCV 2020: 16th European Conference, Glasgow, UK, 23–28 August 2020; pp. 775–793. [Google Scholar]
- Hong, Y.; Pan, H.; Sun, W.; Jia, Y. Deep dual-resolution networks for real-time and accurate semantic segmentation of road scenes. arXiv 2021, arXiv:2101.06085. [Google Scholar]
- Deng, R.; Shen, C.; Liu, S.; Wang, H.; Liu, X. Learning to predict crisp boundaries. In Proceedings of the European Conference on Computer Vision (ECCV), Munich, Germany, 8–14 September 2018; pp. 562–578. [Google Scholar]
- Takikawa, T.; Acuna, D.; Jampani, V.; Fidler, S. Gated-scnn: Gated shape cnns for semantic segmentation. In Proceedings of the IEEE/CVF International Conference on Computer Vision, Seoul, Republic of Korea, 27 October–2 November 2019; pp. 5229–5238. [Google Scholar]
- Lee, Y.; Hwang, J.-w.; Lee, S.; Bae, Y.; Park, J. An energy and GPU-computation efficient backbone network for real-time object detection. In Proceedings of the IEEE/CVF Conference on Computer Vision and Pattern Recognition Workshops, Long Beach, CA, USA, 16–17 June 2019. [Google Scholar]
- Wang, C.-Y.; Liao, H.-Y.M.; Wu, Y.-H.; Chen, P.-Y.; Hsieh, J.-W.; Yeh, I.-H. CSPNet: A new backbone that can enhance learning capability of CNN. In Proceedings of the IEEE/CVF Conference on Computer Vision and Pattern Recognition Workshops, Seattle, WA, USA, 14–19 June 2020; pp. 390–391. [Google Scholar]
- Liu, S.; Qi, L.; Qin, H.; Shi, J.; Jia, J. Path aggregation network for instance segmentation. In Proceedings of the IEEE Conference on Computer Vision and Pattern Recognition, Salt Lake City, UT, USA, 18–22 June 2018; pp. 8759–8768. [Google Scholar]
- Lin, T.-Y.; Dollár, P.; Girshick, R.; He, K.; Hariharan, B.; Belongie, S. Feature pyramid networks for object detection. In Proceedings of the IEEE Conference on Computer Vision and Pattern Recognition, Honolulu, HI, USA, 21–26 July 2017; pp. 2117–2125. [Google Scholar]
- He, K.; Zhang, X.; Ren, S.; Sun, J. Spatial pyramid pooling in deep convolutional networks for visual recognition. IEEE Trans. Pattern Anal. Mach. Intell. 2015, 37, 1904–1916. [Google Scholar] [CrossRef]
- Rezatofighi, H.; Tsoi, N.; Gwak, J.; Sadeghian, A.; Reid, I.; Savarese, S. Generalized intersection over union: A metric and a loss for bounding box regression. In Proceedings of the IEEE/CVF Conference on Computer Vision and Pattern Recognition, Long Beach, CA, USA, 15–20 June 2019; pp. 658–666. [Google Scholar]
- Neubeck, A.; Van Gool, L. Efficient non-maximum suppression. In Proceedings of the 18th International Conference on Pattern Recognition (ICPR’06), Hong Kong, China, 20–24 August 2006; pp. 850–855. [Google Scholar]
- Cordts, M.; Omran, M.; Ramos, S.; Rehfeld, T.; Enzweiler, M.; Benenson, R.; Franke, U.; Roth, S.; Schiele, B. The cityscapes dataset for semantic urban scene understanding. In Proceedings of the IEEE Conference on Computer Vision and Pattern Recognition, Las Vegas, NV, USA, 27–30 June 2016; pp. 3213–3223. [Google Scholar]
- Everingham, M.; Van Gool, L.; Williams, C.K.I.; Winn, J.; Zisserman, A. The Pascal Visual Object Classes (VOC) Challenge. Int. J. Comput. Vis. 2009, 88, 303–338. [Google Scholar] [CrossRef]
- Chen, L.-C.; Zhu, Y.; Papandreou, G.; Schroff, F.; Adam, H. Encoder-decoder with atrous separable convolution for semantic image segmentation. In Proceedings of the European Conference on Computer Vision (ECCV), Munich, Germany, 8–14 September 2018; pp. 801–818. [Google Scholar]
- Wang, H.; Xie, S.; Lin, L.; Iwamoto, Y.; Han, X.-H.; Chen, Y.-W.; Tong, R. Mixed transformer u-net for medical image segmentation. In Proceedings of the ICASSP 2022—2022 IEEE International Conference on Acoustics, Speech and Signal Processing (ICASSP), Singapore, 22–27 May 2022; pp. 2390–2394. [Google Scholar]
- Li, Z.; Shen, H.; Cheng, Q.; Liu, Y.; You, S.; He, Z. Deep learning based cloud detection for medium and high resolution remote sensing images of different sensors. ISPRS J. Photogramm. Remote Sens. 2019, 150, 197–212. [Google Scholar]
- Yang, J.; Guo, J.; Yue, H.; Liu, Z.; Hu, H.; Li, K. CDnet: CNN-based cloud detection for remote sensing imagery. IEEE Trans. Geosci. Remote Sens. 2019, 57, 6195–6211. [Google Scholar]
- Yang, X.; Liu, Q.; Yan, J.; Li, A.; Zhang, Z.; Yu, G. R3det: Refined single-stage detector with feature refinement for rotating object. arXiv 2019, arXiv:1908.05612. [Google Scholar]
- Azimi, S.M.; Vig, E.; Bahmanyar, R.; Körner, M.; Reinartz, P. Towards multi-class object detection in unconstrained remote sensing imagery. In Proceedings of the Asian Conference on Computer Vision, Perth, Australia, 2–6 December 2018; pp. 150–165. [Google Scholar]
- Yan, J.; Wang, H.; Yan, M.; Diao, W.; Sun, X.; Li, H. IoU-Adaptive Deformable R-CNN: Make Full Use of IoU for Multi-Class Object Detection in Remote Sensing Imagery. Remote Sens. 2019, 11, 286. [Google Scholar] [CrossRef]
- Yang, X.; Yang, J.; Yan, J.; Zhang, Y.; Zhang, T.; Guo, Z.; Sun, X.; Fu, K. Scrdet: Towards more robust detection for small, cluttered and rotated objects. In Proceedings of the IEEE/CVF International Conference on Computer Vision, Seoul, Republic of Korea, 27 October–2 November 2019; pp. 8232–8241. [Google Scholar]
- Li, C.; Xu, C.; Cui, Z.; Wang, D.; Zhang, T.; Yang, J. Feature-attentioned object detection in remote sensing imagery. In Proceedings of the 2019 IEEE International Conference on Image Processing (ICIP), Taipei, Taiwan, 22–25 September 2019; pp. 3886–3890. [Google Scholar]
- Sun, P.; Chen, G.; Luke, G.; Shang, Y. Salience biased loss for object detection in aerial images. arXiv 2018, arXiv:1810.08103. [Google Scholar]
- Fu, C.-Y.; Liu, W.; Ranga, A.; Tyagi, A.; Berg, A.C. Dssd: Deconvolutional single shot detector. arXiv 2017, arXiv:1701.06659. [Google Scholar]
- Wang, P.; Sun, X.; Diao, W.; Fu, K. FMSSD: Feature-Merged Single-Shot Detection for Multiscale Objects in Large-Scale Remote Sensing Imagery. IEEE Trans. Geosci. Remote Sens. 2020, 58, 3377–3390. [Google Scholar] [CrossRef]
- Fu, K.; Chen, Z.; Zhang, Y.; Sun, X. Enhanced Feature Representation in Detection for Optical Remote Sensing Images. Remote Sens. 2019, 11, 2095. [Google Scholar] [CrossRef]
- Kegelmeyer, W., Jr. Extraction of Cloud Statistics from Whole Sky Imaging Cameras; Sandia National Lab. (SNL-CA): Livermore, CA, USA, 1994. [Google Scholar]
- Li, P.; Dong, L.; Xiao, H.; Xu, M. A cloud image detection method based on SVM vector machine. Neurocomputing 2015, 169, 34–42. [Google Scholar] [CrossRef]
Disclaimer/Publisher’s Note: The statements, opinions and data contained in all publications are solely those of the individual author(s) and contributor(s) and not of MDPI and/or the editor(s). MDPI and/or the editor(s) disclaim responsibility for any injury to people or property resulting from any ideas, methods, instructions or products referred to in the content. |
© 2023 by the authors. Licensee MDPI, Basel, Switzerland. This article is an open access article distributed under the terms and conditions of the Creative Commons Attribution (CC BY) license (https://creativecommons.org/licenses/by/4.0/).