Abstract
Satellite synthetic aperture radar (SAR) images are recognized as one of the most efficient tools for day/night, all weather and large area monitoring of ships at sea. However, false alarms discrimination is still one key problem on SAR ship detection. While many discrimination techniques have been proposed for the treatment of false alarms, not enough emphasis has been targeted to explore how obtained false alarms are related to the changing ocean environmental conditions. To this end, we combined a large set of Sentinel-1 SAR images with ocean surface wind and wave data into one dataset. SAR images were separated into three distinct groups according to wave age (WA) conditions present during image acquisition: young wind sea, old wind sea, and swell. A constant false alarm rate (CFAR) ship detection algorithm was implemented based on the generalized gamma distribution (GΓD). Kolmogorov–Smirnov distance was used to analyze the distribution goodness-of-fit among distinct ocean environments. A backscattering analysis of different sizes of ship targets and sea clutter was further performed using the OpenSARShip and automatic identification system (AIS) datasets to assess its separability. We derived a discrimination threshold adjustment based on WA conditions and showed its efficacy to drastically reduce false alarms. To our present knowledge, the use of WA as part of the CFAR and for the adjustment of the threshold of detection is a novelty which could be tested and evaluated for different SAR sensors.
1. Introduction
Maritime surveillance is a topic of growing interest worldwide. Traditionally, this activity is done with the support of automatic ship reporting systems such as automatic identification system (AIS), long-range identification and tracking (LRIT) and vessel monitoring system (VMS). The AIS is designed primarily for collision avoidance. One key problem with AIS is that it cannot monitor non-cooperative ships; therefore, other sources of ship monitoring data should be used [1].
Among other means of monitoring ships and targets at sea, the use of satellite synthetic aperture radar (SAR) images has been considered the most adequate method and consequently has been the most intensively used [2]. The orbital SAR data have the advantage of low susceptibility to atmospheric effects (practically cloud transparent), with day and night acquisitions, an advantage not possible to be matched using visible and thermal infrared data. Visual inspection of SAR images for operational ship detection, although possible, is a very tedious task and thus automatic target detection must be performed as an alternative or complementary to human analysis. Among the existing target detection algorithms, the CFAR method is widely studied and used due to its simplicity and false alarm regulation properties [3].
A conspicuous difficulty associated with CFAR applied to SAR images is the observed number of false alarms, i.e., image pixels or groups of pixels erroneously identified as targets. False alarms can be produced by coastal infrastructures, exposed intertidal reefs, range/azimuth ambiguities, ocean/atmosphere features [4], and misrepresentation of the ocean clutter by the used probability density function (PDF). Notably, for the latter, it is well known they can be strongly affected by changing sea environments and polarimetric SAR data analysis has been done to tackle the difficulties [5]. To deal with this complexity, advanced techniques have been explored and fine-tailored CFAR detectors have been proposed particularly for near-shore ship detection using a multi-scale CFAR [6], or to theoretically model the interaction of microwave SAR pulses with a rough sea surface in the presence of possible wave breaking events [7].
However, only a few investigations have been targeted to understand the impact of the environment (mainly waves and winds) on the chosen clutter pdf and detection processes, especially in its exploitation for threshold adaptive techniques [3]. As a result, CFAR detection systems could be improved by incorporating observations of the varying environmental sea state.
The present work is also an attempt in this direction, with the distinguishing feature of using the wave age (WA) parameter as a descriptor of the ocean environment that incorporates a single parameter surface wind and wave field information and allows the setting of detection threshold adaptively according to the sea conditions.
The effect of varying oceanic environments on different SAR image PDF distributions has been investigated in [8]. However, no external wave and wind data were used; the sea conditions were analyzed from SAR image peak-to-background ratio and spectra via azimuthal wavelength cutoff. Although their conclusion pointed out the absolute necessity of incorporating parameters of sea state in the development of sea targets detectors, the effect of changing sea conditions on target detection performance was not explored.
In comparison to previous works, where various approaches were used to address the ocean target detection issues by means of complex algorithms and PDF modeling, our main contribution regards directly considering the WA information to the threshold adjustments. Thus, with environmental physical WA data, the present work aims to demonstrate how a relatively simple and well-known CFAR algorithm can be improved effectively to reduce the FA mainly arising by young wind sea, old wind sea, and swell.
In summary, we can say that our work hypothesis is: “The use of a quantitative and single parameter in the CFAR analysis, which incorporates the wind and wave regime as given by the wave age, not only brings a better awareness of environmental conditions present during image acquisition but can effectively be used for discrimination and reduction of a great part of false alarms”.
To contribute to a better understanding of CFAR sea target detection performance under distinct sea conditions, we here propose:
- (i)
- Detection process based on environmental situational awareness via a quantitative physical wave age parameter;
- (ii)
- Enhancement of CFAR performance by means of a discrimination scheme in which the detection threshold can be adjusted based on ocean conditions present during image acquisition and also based on WA values;
- (iii)
- A detection experiment conducted on real SAR very large data to evaluate their benefits, with false alarms and real ship targets validated with an AIS dataset and with the help of a statistical analysis of a cross-section of ships provided by OpenSARShip dataset. This experiment had the purpose of showing that the proposed scheme can successfully suppress most of the false alarms, and its results can be easily physically interpretable.
2. Data and Methods
2.1. Input Data
2.1.1. SAR Images
The SAR image dataset used includes 446 Sentinel-1 (S-1) VV- pol images in ground range detected (GRD) product format acquired in the interferometric wide (IW) swath mode, available on the USGS EarthExplorer portal.
The present study is focused on the oceanic region of the western tropical Atlantic and on the Brazilian Northeast coastal areas. Our dataset was acquired in 2019, mainly motivated by the very large oil spill event that reached the Brazilian coast from August 30th to December 2nd of that year, which still at the time of this writing has not had its origin or causing agent clearly determined. The spatial coverage of the image dataset consists of the adjacent oceanic region of Northeast Brazil (Figure 1). Scenes totally over the continent were not considered, only those with partial coverage of the ocean areas or total coverage of them.
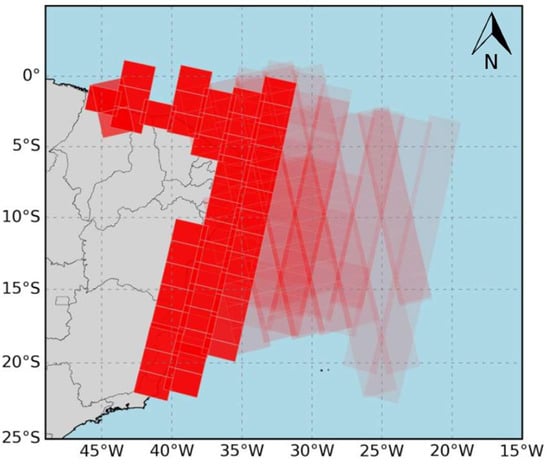
Figure 1.
Geographic spatial distribution of 446 Sentinel-1 scenes. Red rectangles indicate image footprints. Intense red colors indicate areas of higher image density. Sub-images totally over the continent were not considered.
To examine the regional seasonal variability in wave and wind regimes and to cover distinct oceanic environmental conditions, the image dataset includes a time span from April to November 2019. All images were radiometrically corrected, land masked, georeferenced, and resampled to 30 m pixel spacing.
2.1.2. Auxiliary Information
ERA5 reanalysis product [9] was used to provide supplementary oceanic surface wind and wave information for the regions and dates of used SAR images. ERA5 data were space/time selected according to the acquisition time and space coverage of SAR images. The 1 h temporal resolution of the reanalysis data allowed a time difference between images and ERA5 data maximum of 0.5 h. Notwithstanding the very different spatial resolutions between these two datasets (a few tens of meters for the IW mode SAR data and about 28 km for the ERA5), for a regional scale analysis this comparison is still acceptable.
Additionally, ocean radar backscattering was compared to the normalized radar cross-section (RCS) (σ0) of ships using the labeled OpenSARShip 2.0 dataset. This dataset has been prepared to provide the scientific community with a database specific to ships observed in Sentinel-1 SAR images allowing analysis of their geometry and scattering cross-section. The samples (ship chips) are presented radiometrically calibrated and in GeoTIFF format. Additionally, they are integrated with the AIS data allowing the extraction of additional information such as the type of ship and length [10]. The OpenSARShip 2.0 includes information about the interference of more than one ship in the samples. This allows us to collect only samples of just one ship. In total, we selected 6895 samples without interference and for VV polarization [10].
A comparison of CFAR ship detection results against the AIS position of ships was done using a high-temporal-frequency AIS dataset (<3 min), provided as a courtesy free of charge by HisdeSAT/ExactEarth. In addition, the open source OpenSARShip dataset was achieved to be a complementary ground truth by means of their checked ship’s RCS pixel values.
2.2. Methodology
2.2.1. Setting up a SAR Image Dataset Containing Distinct Ocean Environments
To investigate the CFAR detection performance for a range of different ocean environments, first, the SAR images and ERA5 reanalysis wind and waves data were integrated into one combined dataset. In summary, the steps for this dataset generation can be listed as follows.
- Images subdivision. Each S-1 image was subdivided into smaller sub-images of 667 × 667 pixels (equivalent to an area of 20 km × 20 km), resulting in a total of 26,657 sub-images analyzed. This subdivision size allows for a sub-image properly documented for segmentation and classification of distinct ocean geophysical features [11];
- Sub-images sorting according to the ocean environment. For this purpose, a wave age (WA) criterion was used to indicate the sea state condition and to estimate the local wave development stage. The used WA is based on the wave phase speed Cp and the friction velocity u*, which is related to the wind stress and its ability to generate ocean-short waves [12].where Cp is the phase speed at wave spectrum peak period (P) estimated from deep water gravity wave dispersion relation and u* is estimated from wind magnitude at 10 m height (U10) from eastward and northward wind components of ERA5 reanalysis product. Each sub-image was tagged as: Young wind–sea (WA ≤ 10), old wind–sea (10 < WA ≤ 35) or swell (WA > 35) [12].WA = Cp/u*,
- Sub-images sorting according to incidence angle range. Incidence angle (θ) was derived using S-1 product metadata. Sub-images were classified according to the following θ range regions: Near-range (30° < θ ≤ 35°), mid-range (35° < θ ≤ 40°), and far-range (40° < θ ≤ 45°).
To evaluate the influence of distinct sea environmental conditions on the CFAR algorithm performance, only sub-images representing pure ocean backscattering were selected. The final selection of used sub-images was done by calculating the following image quality parameters according to the following additional steps:
- 4.
- Equivalent number of looks (ENL). ENL is calculated from the sub-image backscattering mean and variance [13]:
ENL = Mean2/Variance
ENL indicates the degree of image homogeneity; lower values tend to represent the presence of strong ocean clutter and speckle. Only ENL > 2 sub-images were selected for subsequent analysis.
- 5.
- Signal-to-additive noise ratio (SNRA). SNRA measures the ratio between the desired information (ocean backscattering) and noise equivalent sigma-zero (NESZ), which is mainly dominated by the sensor thermal noise [14]:
SNRA = (Mean − NESZ)/NESZ
NESZ can be determined from the image product metadata using sub-image incidence angle. Herein, only sub-images for which SNR > 1 (or SNR > 0 dB) were selected.
2.2.2. Generalized Gamma Distribution CFAR Detection
Herein, use was made of the CFAR algorithm as specified in [15,16]. CFAR detection algorithm is based on statistical modeling of sea clutter, and a dynamical threshold estimation in which targets brighter than their surroundings and above the threshold are adaptatively detected using a properly sized template window over the image.
Normally, the first stage of CFAR consists in defining a template used for the estimation of sea clutter statistical PDF parameters and for target detection. To this end, the background, guard, and test window sizes were set to, respectively, 100 × 100, 20 × 20, and 1 × 1 considering ship maximum sizes of about 300 m.
The second stage refers to sea clutter statistical modeling. Accurate modeling of the sea clutter probability density function (PDF) is a very important part of CFAR detection. Herein, [15] a generalized gamma distribution (GΓD) PDF was used:
where v, , and are the power, shape, and scale parameters, respectively, and Γ(·) is the gamma function. GΓD has shown good fitting capability and high flexibility to model high-resolution SAR images [16]. Yet, its behavior in relation to different ocean environments of distinct wave and wind regimes, as incorporated in the WA parameter, is still an unexplored topic [8]. Herein, parameter estimation for the GΓD was performed analytically by the approximate estimator given in [17], which is based on the method of log-cumulants (MoLC) and has shown to be more computationally efficient compared to traditional estimators. The third and final stage of CFAR is the estimation of detection threshold T from a chosen probability of false alarm (PFA) as given by [16]:
where QInv(·) is the inverse incomplete gamma function. PFA must be specified according to an acceptable quantity of false alarms. Hence, the radar cross-section (RCS) of the pixel under test (PUT) was compared to T to decide if PUT corresponded or not to a target (if ≥ T: target; if < T: non-target).
In order to analyze the goodness-of-fit of the GΓD, the Kolmogorov–Smirnov (KS) distance was estimated. KS distance was defined as the maximum distance between theoretical model and data histogram observed on SAR image [18]. The lower the KS distance, the better the distribution fit.
2.2.3. Performance Metrics and Threshold Adjustments
Theoretically, one can obtain the expected number of FA (NFA) by means of a simple calculation:
where NT is the total number of pixels. As an example, for an assumed probability of false alarm—PFA of 10−4, in our image of NT = 667 × 667 pixels (444,889 pixels), near to 44 false alarms should be expected.
In practice, however, the observed NFA can be and normally is higher than the theoretical one associated with the chosen false alarm rate (FAR). To address this problem and the presence of a significantly higher number of false alarms in a real detection, considering that the number of false alarms is dependent on the estimated threshold value (T), the following correction parameter f and equation have been suggested [3],
where T is the theoretical threshold, derived from the chosen PDF and estimated parameters, M is the mean value of σo, and TA is the adjusted value of T. A f = 1 corresponds, therefore, to no correction.
TA= (T − M) f + M
The strategy here adopted to estimate the f values for different WA image classes was first to separate a set of images with distinct WA parameter ranges corresponding to young wind sea, old wind sea, and swell, and with no ships present upon a visual analysis. CFAR was then applied to each one of these images, separated by WA ranges and corresponding only to the ocean background. By doing so, it is possible to highlight in which conditions the CFAR algorithm mostly fails since all pixels detected as ships can be assumed as false alarms.
Starting with no adjustment (f = 1), we then varied f from unity onward in small increments of 0.01 and compared the number of false alarms (NFA) observed to the expected one which is dependent on the chosen PFA and the number of pixels in the analyzed image. As expected, as f increases a smaller number of false alarms is observed. The derived optimal f value was the one for which a minimum difference between the detected and expected number of false alarms was observed. This procedure was repeated for five distinct values of PFA (from 10−2 to 10−6). Note that, now the derived f values were dependent on the prevailing WA condition of the analyzed scene and could be used for different values of PFA.
3. Results
3.1. Wave Age Classification and Comparison of GΓD Fit
To separate distinct ocean environments and verify GΓD goodness-of-fit, first the separated sub-images were visually inspected. Figure 2a–c show examples of sub-images for the WA classification. In general, the three WA classes are distinguishable by the distinct ocean features present. In young wind–sea conditions (Figure 2a), the presence of linear features is noticeable, of several kilometers in length, alternating as dark and bright anomalies, mostly aligned to the surface wind, and notably known as wind streaks [19], which are typical of ocean environments dominated by moderate to strong winds. On the other hand, the swell sub-image (Figure 2c) exemplifies the case of long-period surface gravity waves, with wavelengths of the order of a few hundred meters. These features are also related to bright and dark features, which in this case are wave crests and troughs. In between these two conditions, the old wind–sea sub-image case (Figure 2b) represents a transitional environment, in which the waves are closer to full development. In summary, the WA parameter seems appropriate as a simple and good criterion to separate distinct ocean environments, integrating wind and wave data and, thus, useful to assess the GΓD fitting general behavior in relation to ocean environmental conditions.
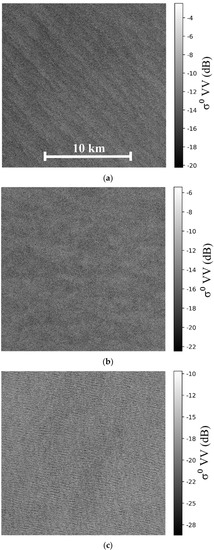
Figure 2.
Wave age sub-images classification examples (mid-range incidence angles): (a) Young wind–sea, (b) old wind–sea, and (c) swell.
Examples of GΓD fitting results for the three WA classes are presented in Figure 3a–c (linear scales). These results were obtained by the calculation of the whole dataset of 26,657 sub-images. For detailed display purposes, in the right column figures the radar cross-section histograms are normalized by their mean (σ0/M), M from Equation (7), and displayed in semi-log scale (Figure 3d–f). It is observed that GΓD has a better fit for young wind–sea conditions; as WA increases, a PDF fitting displacement in relation to the data occurs, particularly towards the tail of the distribution, which is exemplified starting from the point indicated by the red arrow on Figure 3e. The most challenging case is in the presence of swell conditions (Figure 2c), where there is the highest PDF tail displacement (Figure 3f).
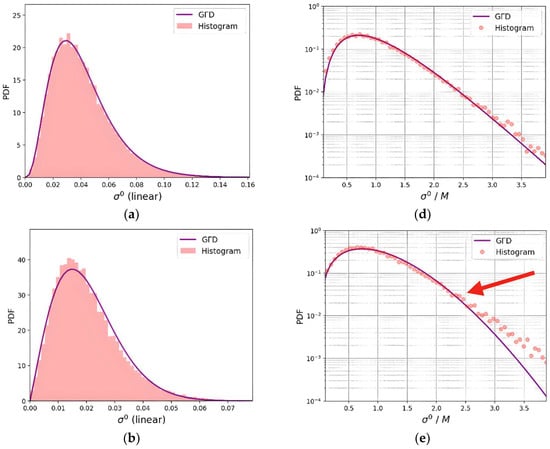
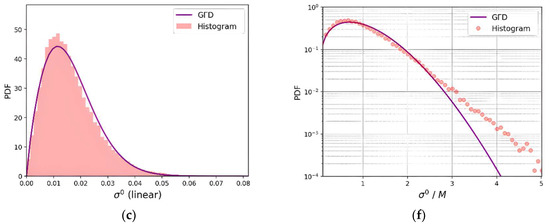
Figure 3.
Comparison of GΓD fitting results for WA classes: Normalized sub-image histograms for (a,d) young wind–sea, (b,e) old wind–sea, and (c,f) swell. Right column plots have sigma zero values normalized by the mean (M) and in semi-log format.
This loss of PDF fitting, particularly for the higher sigma-zero values is also confirmed by the KS distance results for all selected sub-images, shown in Table 1. The average KS distances indicate that GΓD ability of fitting the data is worse at swell conditions, i.e., with presence of long period/wavelength surface waves. As a result, a higher quantity of false alarms is expected to occur using this CFAR detector as WA increases, due to the PDF sub-estimations. It should be noted that the discrimination between true ships and false alarms is done in this high sigma values tail region. Regarding sub-image incidence angles, results presented show they are practically independent of range regions.

Table 1.
Kolmogorov–Smirnov distance results (n = 26,657).
Figure 4 presents the results obtained after applying the strategy described above (Section 2.2.3) to adjust the theoretical threshold value using the derived parameter f (Equation (7)) for different WA regimes and for a PFA of 10−4. As expected, the adjustment parameter f is dependent on the WA regime, increasing as the WA increases. A swell prevailing condition requires the greatest increase in T in order to bring the observed FAR closer to the theoretical expected one. Table 2 presents the f estimated for different values of PFA and three WA regimes, considering a sub-image 667 × 667 pixels sized, with a total of 444,889 pixels. It contains the mean values from the whole dataset of 26,657 sub-images, representing the three WA regimes.
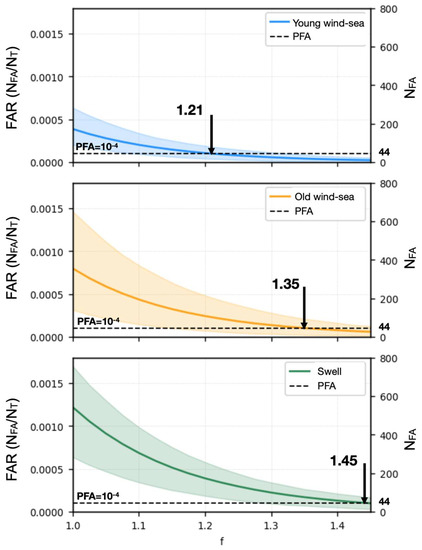
Figure 4.
Observed false alarm rate (FAR) (left vertical axis) as a function of adjustment factor f for a PFA = 10−4. Dashed horizontal line corresponds to the expected number of false alarms (NFA) (right vertical axis). Color bands are the 10% to 90% percentiles for different WA classes. Solid color lines are the average values. The position of the vertical black arrow indicates the optimal f value.

Table 2.
Correction parameter f optimized for each WA class. Mean values from the whole dataset of 26,657 sub-images.
As indicated, as the PFA becomes smaller, f increases for all WA regimes, which is related to the fact that for smaller values of chosen PFA, the threshold is displaced towards the high values of RCS, where there is a higher mismatch between the GΓD and the observed data (Figure 3).
Considering the images’ spatial resolution (30 m) and the typical sizes of ships to be detected, it is expected that the number of positively detected pixels would be relatively larger than the number of ships detected, even for a perfect CFAR detection. Additionally, the number of positive alarmed pixels is a function of the PFA chosen. Thus, for a better evaluation of the CFAR performance, we made a clustering of detected neighboring pixels.
In Table 3, we illustrated the worst environmental case scenario of WA > 35 corresponding to swell waves, and for a PFA from 10−6 to 10−4, with and without the threshold f adjustment. These numbers refer to the total number of pixels and clusters determined for eight images analyzed. The first point to notice is the large number of positive but false alarm detections without f adjustment. With the f adjustment, the number of false positives was reduced to less than 6% of the original, showing the efficacy of the adjustment.

Table 3.
Elements of ship detection for a group of 8 sub-images and for the swell class, using f values of Table 2, and considering 12 AIS correlated true ships.
Among the total number of 12 ships present, there were only 8 ships confirmed by the AIS system for the region and period. This could be, however, an underestimation of the true value considering that an unknown number of ships could be either not transmitting, or not having any AIS equipment installed on board. Another point to be noticed is that for large metallic objects such as big ships, their strong backscatter frequently produced “ghost” detections in pairs around the true ship and was oriented mostly in the azimuthal direction, for which they are called azimuthal ambiguities. Therefore, just due to this ambiguity, for one real ship, we might attain three detections: one real and two ghost images. For very weak winds, these ambiguities tended to be more prominent in relation to the sea clutter and being wrongly detected by the CFAR, even for a very small PFA [20].
The PDF fitting distortions here reported were also observed in [21] for the K distribution, which in that study showed an overall better fit compared to traditional models. Interestingly, even though GΓD has shown better flexibility as compared to K distribution [21], similar results were found here, hence indicating the importance of incorporating sea state parameters for the development of target detectors. Furthermore, this effect seems to be associated with small scattering elements which are riding on the long surface waves, and which have their scattering cross-section modulated by tilt, hydrodynamic mechanisms, and by some degree of wave breaking, mostly located near the wave steep crests [7].
Additionally, it can be argued that these elements alter the backscattered signal due to the introduction of non-polarized components (i.e., non-Bragg scattering) [22]. An example of a swell-dominated region is presented in Figure 5, in which the CFAR was applied with a high PFA value of 10−2 only to highlight the presence of false alarms associated with wave breaking on swell crests. A visual analysis of this figure indicated that a fraction of the false alarm pixels are aligned with the general orientation of the swell waves observed. In summary, the results clearly indicate that GΓD modeling skill may degrade as the contribution of long-period waves increases, irrespective of the SAR image incidence angle range. However, as presented earlier, in general, it still can be considered a suitable PDF distribution for ship detection.
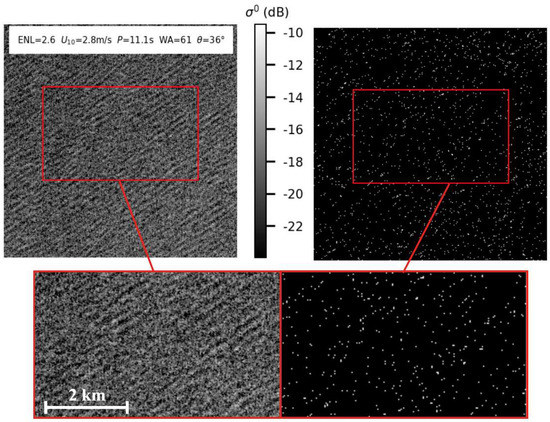
Figure 5.
Sub-image (VV) of swell waves and corresponding detection results for PFA = 10−2 with a visual alignment of a large number of false alarms with swell crests.
3.2. Backscattering Analysis
In order to have as a reference for the backscattering values of vessels, we used the OpenSARShip dataset. Figure 6a shows the distribution of maximum σ0 (maximum detectable backscattering cross-section pixel value) obtained from OpenSARShip dataset for each ship chip, as a result of 6895 samples on VV polarization, with the dataset binned by ship length. The central bright dot on the violin plots indicates the median of such distribution. As expected, as ship length increased, so did the maximum σ0; this pattern was particularly evident on ship lengths of 1 to 150 m. Regarding the median of the ship RCS distribution, it was above 0 dB for all length bins, and except for the smallest ships bin (1–50 m), a very small number of cases were below 0 dB. Regarding variations with incidence angle (not shown), a negligible influence was found.
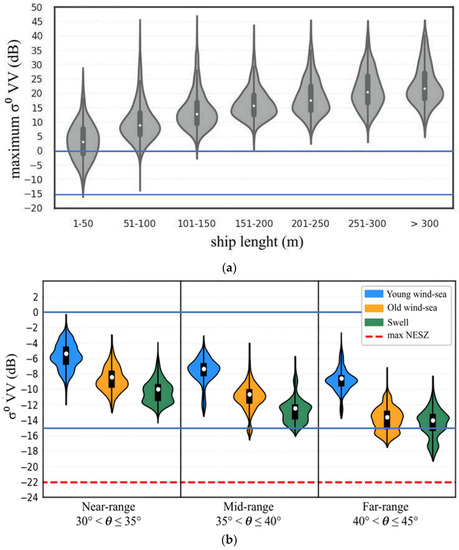
Figure 6.
Distributions of radar cross-section as violin plots of: (a) Ships from OpenSARShip dataset, and (b) CFAR outputs for known areas with no real target, in each WA class, using a PFA = 10−4. The two solid horizontal blue lines demarcate the span of possible values, in dB, for both cases, vessel pixels, and ocean conditions, in order to compare them. Dashed red horizontal line represents the maximum value for the sensor noise floor (noise equivalent sigma zero).
The distributions of RCS of detected CFAR pixels, obtained from selected sub-images, separated by WA and radar ranges are displayed in Figure 6b. First, it is to be noted that all detections were above the maximum NESZ by at least 3.0 dB, with the worst case being for swell waves at a far range. Thus, we are sure detections were not impacted by instrumental noise.
If we were to consider only RCS values, and that a higher separation between maximum targets σ0 and detected σ0 represents a higher ship detectability, the results shown in Figure 6a,b are consistent with well-established relations [23,24], which can be summarized as:
- The larger the ship size, the higher its detectability;
- The higher the incidence angle (or farther the radar range), the higher the ship detectability;
- The higher the wind magnitude (or lowest the wave age—young wind sea), the lower the ship detectability (more false alarms).
In addition to these points, the results here obtained allowed us to quantitatively assess this separability, and the novel following additional points can be noted:
- The most challenging detection condition is for small ships (<50 m in length) present in young wind–sea conditions and at a near range;
- Below −10 dB, as indicated in Figure 6a, a pixel will rarely represent a ship. Even for small ships (up to 50 m), RCS is usually higher than 2 dB, as can be seen by its median in Figure 6a. Moreover, and particularly for larger ships, this threshold could be raised to reduce or prevent false alarms;
- Sea clutter is rarely above −2 dB, and depending on the presented wave age, radar range, and PFA utilized, this threshold can be lowered;
Furthermore, in Figure 6, one can compare CFAR outputs for known areas with no real target, in each WA class, using a PFA = 10−4, to well-known real target RCS values from the OpenSARship dataset. Only small ships could be inconsiderate as false alarms and, thus, could be discarded. Otherwise, ocean pixels could pass through the CFAR threshold criteria due to having values close to the range of small ships’ RCS values. This analysis emphasizes the fact that FA mainly occurs when there is no real target in the surroundings (even the smallest) and when one of these WA classes is presented.
3.3. Detection Experiment
In the following, we present an experiment used to further evaluate CFAR detection accuracy, in addition to the simple discrimination criteria listed above. In order to reduce the acceptable number of false alarms in view of the number of ~445 K pixels in each sub-image, we set PFA = 10−6. First, detected clusters with a maximum σ0 below −10 dB and a number of pixels > 1 were discarded as indicated in Figure 6a. The detection results thus obtained were then confronted to the AIS ship positions and classified as:
- (a)
- Correlated (present in both, CFAR and AIS);
- (b)
- SAR Uncorrelated (CFAR detections not present on AIS); or
- (c)
- AIS Uncorrelated (AIS ship positions not detected by CFAR).
To keep the paper to an acceptable length, we only present the detection results on one S-1 image, which represents a young wind–sea condition (Figure 7a). Initially, CFAR resulted in a total of 191 detected clusters, from which 150 (78.5%) were discarded by the discrimination step described above. Hence, the remaining detections were considered of higher reliability and were further compared to AIS data.
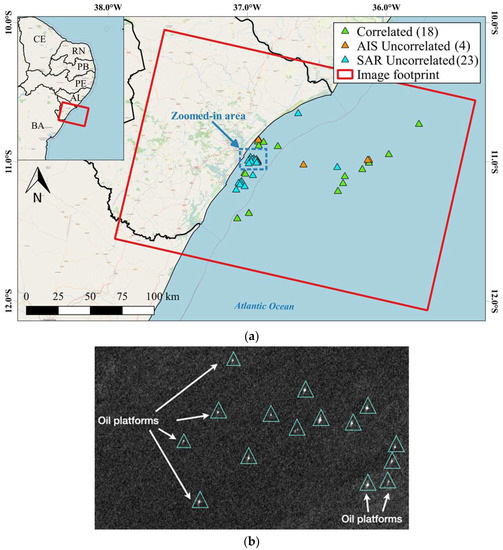
Figure 7.
Results of CFAR + discrimination detection elements: (a) Detection elements on the coast of Sergipe, Brazil, displayed with a basemap from OpenStreetMap and (b) zoomed-in area (blue dashed rectangle) of non-AIS-reporting ships. Detections not indicated by white arrows (oil platforms) are deemed as “dark ships”.
AIS presented a total of 22 unique ships for the analyzed image and the CFAR + discrimination criterion resulted in 41 targets (191−150). After confronting SAR detections and AIS, 18 Correlated positions were identified (green triangles). Regarding uncorrelated positions, 4 AIS Uncorrelated, AIS-reporting ships not detected by CFAR, probably representing small ships of length less than 20 m (orange triangles). A total of 23 SAR Uncorrelated, that is, elements detected by CFAR but not reported on AIS (blue triangles), were also observed. After visual inspection, from the 23 non-reporting elements, 15 were deemed as ships due to their backscattering signal disparate from local clutter, and 8 were confirmed oil platforms. To provide a better view of this, Figure 7b shows a zooming in of the dashed blue rectangle in Figure 6a, showing the 8 oil platforms and 7 ships. These results show that the number of ships not transmitting AIS, 15 in this case (also known as “dark ships”), can sometimes be relatively high even as compared to those reported in the AIS dataset; 15/22 = 68.2%. The example here reported is clear evidence of the additional value of the employed ship detection scheme based on SAR images. Table 4 summarizes the various detection elements results obtained.

Table 4.
Detection elements from CFAR algorithm (Figure 7) and AIS reporting. Correlated: ships present in AIS and CFAR; SAR uncorrelated: present only in CFAR; AIS uncorrelated: present only in AIS.
4. Discussion
To the best of our present knowledge, this is the first attempt at using wind and wave data in a combined way through a unique parameter, the wave age, for describing the environmental ocean conditions present during the acquisition of SAR images and their effect over the goodness-of-fit for the GΓD and the resulting CFAR performance. We understand the environmental ocean conditions representative of our region of study (tropical western Atlantic Ocean) are a subset of the more general or harsher conditions observed in mid to higher latitudes. Our analyzed dataset of SAR images, however, seems very representative of the variability of conditions observed for this region. We had images corresponding to winds from 0.3 to 12.5 ms−1 with an average value of 6.7 ms−1. These values compare very well to the average monthly values of previous studies for this region [25]. Regarding the wave periods (or wavelengths) observed in this region, [26] reports that periods above 10 s are frequently observed. Our histogram of peak wave periods (not shown) depicts maximum values at the 9–10 s bin, but with an appreciable number of higher periods present. Most of our WA histogram (not shown) is populated with old wind waves, seconded by swell waves and the smallest frequency of young wind sea. Therefore, we can say that the prevailing environmental condition in this region is of old wind waves representing a near saturation development, with wave energy almost in equilibrium [12,27] followed by swell conditions. The dataset had an almost flat distribution of incidence angles from 30.9 to 45.6 degrees present in IW GRD Sentinel-1 data. Therefore, the analysis of the role of this parameter is well represented by the dataset used.
As far as the loss of fitting accuracy of the chosen PDF caused by environmental ocean factors, we could not find studies giving particular attention to the GΓD although some have noticed this effect in K PDF [3]. It is interesting that although GΓD is more flexible as compared to K PDF [21], it seems equally affected by ocean environments dominated by swell waves. This effect seems to be linked to an increase in the scattering elements by the waves of longer wavelengths. These scattering elements are mostly located in the steep fronts of these waves and become more aggregated as the waves develop [7]. Additionally, it is argued that these elements alter the backscattered radar signal by introducing a non-polarized component (non-Bragg scattering) [27,28].
Regarding the comparison of scattering cross-section of targets present in the SAR images and those reported in OpenSARShip database and the best conditions for detection, in complementing the findings reported in [23,24], in this report we expanded those results indicating that below −10 dB there is negligible chance of a “detected” pixel being a ship target, and consequently this value could be used to discard false alarm in a post-processing stage. We could see as well that the most challenging detection situation was for small ships (about 50 m or less) in conditions of young wind waves and in the near range.
As an extension of the previous work [3] in which the authors state that the adjustment of the detection threshold was determined based on the operational experience of the Joint Research Centre—JRC), we here proposed an adjustment that was derived based on an analysis of a large dataset of CFAR detection and the WA regimes present during image acquisition.
5. Conclusions
In this paper, a GΓD-based CFAR ship detection was analyzed in relation to its performance regarding different ocean environmental conditions. First, a Sentinel-1 SAR dataset was generated from 446 collected scenes, which were subdivided into smaller sub-images of 667 × 667 pixels, resulting in a total of 26,657 sub-images analyzed. Three WA regimes were considered (young wind–sea; old wind–sea; and swell), according to ERA5 ancillary data. Second, based on this whole generated dataset, GΓD was shown to suffer distortions by oceanic longer period waves and mostly to swell conditions. Then, ship targets and sea clutter separability analysis showed that a simple criterion based on ocean wave and ship cross-section characteristics can be set in order to discriminate false alarms. The effectiveness of the discrimination step reveals the benefit of the proposed criteria, which can be used as a priori information, and gives a figure of the additional value of SAR detection compared to AIS. The new way of adjusting the theoretical threshold according to the WA regime during image acquisition has proved to bring down to less than 10% the number of false alarms. The adjustment of the threshold can be done for different probabilities of false alarms (PFA) using the values derived and presented in Table 2. These results are also useful to target detection operations and the maritime target detection community. An obvious limitation of the present work is related to the dataset of SAR images used, which included only Sentinel-1 VV data and for the region of study, a tropical oceanic region. The results of this investigation should be further improved by the analysis of different radar bands and polarizations, such as co-pol, cross-pol, and fully polarimetric SAR data, and other regions of the global ocean but using the same or a similar concept of incorporating oceanic environmental conditions in the CFAR in a compact and simple way as here has been done using the wave age parameter.
Author Contributions
Conceptualization, D.X.B. and J.A.L.; methodology, D.X.B. and J.A.L.; software, D.X.B.; validation, D.X.B., J.A.L. and R.L.P.; formal analysis, J.A.L. and R.L.P.; investigation, D.X.B.; resources, D.X.B.; data curation, D.X.B.; writing—original draft preparation, D.X.B. and J.A.L.; writing—review and editing, J.A.L. and R.L.P.; visualization, D.X.B.; supervision, J.A.L. and R.L.P.; project administration, J.A.L.; funding acquisition, J.A.L. All authors have read and agreed to the published version of the manuscript.
Funding
This research was carried out with partial support from National Council for Scientific and Technological Development—CNPq Grant No. 440857/2020-1, [Project EC6/2020], title: Research and Development for coping with oil spill off Brazilian Coast.
Data Availability Statement
Sentinel-1 data are openly accessible from https://earthexplorer.usgs.gov/, accessed on 20 July 2022.
Acknowledgments
The authors would like to thank the Brazilian Navy, HisdeSAT, and ExactEarth for generously providing AIS data. Also, the authors would like to thank CNPq for the grant support [under the Project EC6/2020].
Conflicts of Interest
The authors declare no conflict of interest.
References
- Paes, R.L.; Lorenzzetti, J.A.; Gherardi, D.F.M. Ship detection using TerraSAR-X images in the Campos Basin (Brazil). IEEE Geosc. Remote Sens. Lett. 2010, 7, 545–548. [Google Scholar] [CrossRef]
- El-Darymli, K.; McGuire, P.; Power, D.; Moloney, C. Target detection in synthetic aperture radar imagery: A state-of-the-art survey. J. App. Remote Sens. 2013, 7, 071598. [Google Scholar] [CrossRef]
- Greidanus, H.; Alvarez, M.; Santamaria, C.; Thoorens, F.-X.; Kourti, N.; Argentieri, P. The SUMO Ship Detector Algorithm for Satellite Radar Images. Remote Sens. 2017, 9, 246. [Google Scholar] [CrossRef]
- Lang, H.; Xi, Y.; Zhang, X. Ship Detection in High-Resolution SAR Images by Clustering Spatially Enhanced Pixel Descriptor. IEEE Trans. Geosci. Remote Sens. 2019, 57, 5407–5423. [Google Scholar] [CrossRef]
- Gao, G.; Shi, G. CFAR ship detection in nonhomogeneous sea clutter using polarimetric SAR data based on the Notch Filter. IEEE Trans. Geosci. Remote Sens. 2017, 55, 4811–4824. [Google Scholar] [CrossRef]
- Ao, W.; Xu, F.; Li, Y.; Wang, H. Detection and discrimination of ship targets in complex background from spaceborne ALOS-2 SAR images. IEEE J. Sel. Top. Appl. Earth Obs. Remote Sens. 2018, 11, 536–550. [Google Scholar] [CrossRef]
- Li, J.; Zhang, M.; Nie, D. Facet-based investigation on microwave backscattering from sea surface with breaking waves: Sea spikes and SAR imaging. IEEE Trans. Geosci. Remote Sens. 2017, 55, 2313–2325. [Google Scholar] [CrossRef]
- Sun, J.; Wang, X.; Yuan, X.; Zhang, Q.; Guan, C.; Babanin, A.V. The dependence of sea SAR image distribution parameters on surface wave characteristics. Remote Sens. 2018, 10, 1843. [Google Scholar] [CrossRef]
- Hersbach, H.; Bell, B.; Berrisford, P.; Hirahara, S.; Horányi, A.; Muñoz-Sabater, J.; Nicolas, J.; Peubey, C.; Radu, R.; Schepers, D.; et al. The ERA5 global reanalysis. Q. J. R. Meteorol. Soc. 2020, 146, 1999–2049. [Google Scholar] [CrossRef]
- Li, B.; Liu, B.; Huang, L.; Guo, W.; Zhang, Z.; Yu, W. OpenSARShip 2.0: A large-volume dataset for deeper interpretation of ship targets in Sentinel-1 imagery. In Proceedings of the 2017 SAR in Big Data Era: Models, Methods and Applications (BIGSARDATA), Beijing, China, 13–14 November 2017. [Google Scholar]
- Wang, C.; Mouche, A.; Tandeo, P.; Stopa, J.E.; Longépé, N.; Erhard, G.; Foster, R.C.; Vandemark, D.; Chapron, B. A labelled ocean SAR imagery dataset of ten geophysical phenomena from Sentinel-1 wave mode. Geosci. Data J. 2019, 6, 105–115. [Google Scholar] [CrossRef]
- Komen, G.J.; Cavaleri, L.; A Donelan, M.; Hasselmann, K.; Hasselmann, S.; Janssen, P.A.E.M. Dynamics and Modelling of Ocean Waves; Cambridge University Press: New York, NY, USA, 1994. [Google Scholar]
- Vespe, M.; Greidanus, H. SAR image quality assessment and indicators for vessel and oil spill detection. IEEE Trans. Geosc. Remote Sens. 2012, 50, 4726–4734. [Google Scholar] [CrossRef]
- Espeseth, M.M.; Brekke, C.; Jones, C.E.; Holt, B.; Freeman, A. The Impact of System Noise in Polarimetric SAR Imagery on Oil Spill Observations. IEEE Trans. Geosc. Remote Sens. 2020, 58, 4194–4214. [Google Scholar] [CrossRef]
- Li, H.; Hong, W.; Wu, Y.; Fan, P. On the empirical-statistical modeling of SAR images with generalized gamma distribution. IEEE J. Sel. Top. Signal Process. 2011, 5, 386–397. [Google Scholar]
- Qin, X.; Zhou, S.; Zou, H.; Gao, G. A CFAR Detection Algorithm for Generalized Gamma Distributed Background in High-Resolution SAR Images. IEEE Geos. Remote Sens. Lett. 2013, 10, 806–810. [Google Scholar]
- Gao, G.; Ouyang, K.; Luo, Y.; Liang, S.; Zhou, S. Scheme of Parameter Estimation for Generalized Gamma Distribution and Its Application to Ship Detection in SAR Images. IEEE Trans. Geosc. Remote Sens. 2017, 55, 1812–1836. [Google Scholar] [CrossRef]
- DeVore, M.D.; O’Sullivan, J.A. Quantitative statistical assessment of conditional models for synthetic aperture radar. IEEE Trans. Image Process. 2004, 13, 113–125. [Google Scholar] [CrossRef]
- Zhao, Y.; Li, X.; Sha, J. Sea surface wind streaks in spaceborne synthetic aperture radar imagery. J. Geophys. Res. Ocean. 2016, 121, 6731–6741. [Google Scholar] [CrossRef]
- Velotto, D.; Soccorsi, M.; Lehner, S. Azimuth ambiguities removal for ship detection using full polarimetric X-band SAR data. IEEE Trans. Geosci. Remote Sens. 2014, 52, 76–88. [Google Scholar] [CrossRef]
- Krylov, V.A.; Moser, G.; Serpico, S.B.; Zerubia, J. On the Method of Logarithmic Cumulants for Parametric Probability Density Function Estimation. IEEE Trans. Image Proces. 2013, 22, 3791–3806. [Google Scholar] [CrossRef]
- Kudryavtsev, V.; Kozlov, I.; Chapron, B.; Johannessen, J.A. Quad-polarization SAR features of ocean currents. J. Geophys. Res. Ocean. 2014, 119, 6046–6065. [Google Scholar] [CrossRef]
- Vachon, P.W.; Campbell JW, M.; Bjerkelund, C.A.; Dobson, F.W.; Rey, M.T. Ship detection by the RADARSAT SAR: Validation of detection model predictions. Can. J. Remote Sens. 1997, 23, 48–59. [Google Scholar] [CrossRef]
- Tings, B.; Bentes, C.; Velotto, D.; Volnov, S. Modelling ship detectability depending on TerraSAR-X-derived metocean parameters. CEAS Space J. 2019, 11, 81–94. [Google Scholar] [CrossRef]
- Silva, G.K.; dos Santos, A.C.S.; da Silva, M.V.M.; Brabo Alves, J.M.; Barros Barbosa, A.C.; de Oliveira Freire, C.; Alcântara, C.R.; Sombra, S.S. Estudo dos padrões de ventos offshore no litoral do Ceará utilizando dados estimados pelo produto de satélites BSW. Rev. Bras. Meteorol. 2017, 32, 679–690. [Google Scholar] [CrossRef]
- Silva, A.C.; Façanha, P.; Bezerra, C.; Araújo, A.; Pitombeiras, E. Characteristics of “Sea” and “Swell” waves observed off the coast of Ceará-Brazil: Annual and inter-annual variability. Trop. Ocean. 2011, 39, 123–132. [Google Scholar]
- De Farias, E.G.G.; Lorenzzetti, J.A.; Chapron, B. Swell and wind-sea distributions over the mid-latitude and Tropical North Atlantic for the period 2002–2008. Int. J. Oceanogr. 2012, 2012, 306723. [Google Scholar] [CrossRef]
- Viana, R.D.; Lorenzzetti, J.A.; Carvalho, J.T.; Nunziata, F. Estimating energy dissipation rate from breaking waves using polarimetric SAR images. Sensors 2020, 20, 6540. [Google Scholar] [CrossRef] [PubMed]
Disclaimer/Publisher’s Note: The statements, opinions and data contained in all publications are solely those of the individual author(s) and contributor(s) and not of MDPI and/or the editor(s). MDPI and/or the editor(s) disclaim responsibility for any injury to people or property resulting from any ideas, methods, instructions or products referred to in the content. |
© 2023 by the authors. Licensee MDPI, Basel, Switzerland. This article is an open access article distributed under the terms and conditions of the Creative Commons Attribution (CC BY) license (https://creativecommons.org/licenses/by/4.0/).