Article

Rapid-DEM: Rapid Topographic Updates through Satellite Change Detection and UAS Data Fusion

1
Center for Geospatial Analytics, North Carolina State University, Raleigh, NC 27695, USA
2
Department of Marine, Earth, and Atmospheric Sciences, North Carolina State University, Raleigh, NC 27695, USA
3
Department of Forestry and Environmental Resources, North Carolina State University, Raleigh, NC 27695, USA
*
Author to whom correspondence should be addressed.
Remote Sens. 2022, 14(7), 1718; https://doi.org/10.3390/rs14071718
Submission received: 1 March 2022 / Revised: 25 March 2022 / Accepted: 29 March 2022 / Published: 2 April 2022
(This article belongs to the Section Urban Remote Sensing)

Abstract

:
As rapid urbanization occurs in cities worldwide, the importance of maintaining updated digital elevation models (DEM) will continue to increase. However, due to the cost of generating high-resolution DEM over large spatial extents, the temporal resolution of DEMs is coarse in many regions. Low-cost unmanned aerial vehicles (UAS) and DEM data fusion provide a partial solution to improving the temporal resolution of DEM but do not identify which areas of a DEM require updates. We present Rapid-DEM, a framework that identifies and prioritizes locations with a high likelihood of an urban topographic change to target UAS data acquisition and fusion to provide up-to-date DEM. The framework uses PlanetScope 3 m satellite imagery, Google Earth Engine, and OpenStreetMap for land cover classification. GRASS GIS generates a contextualized priority queue from the land cover data and outputs polygons for UAS flight planning. Low-cost UAS fly the identified areas, and WebODM generates a DEM from the UAS survey data. The UAS data is fused with an existing DEM and uploaded to a public data repository. To demonstrate Rapid-DEM a case study in the Walnut Creek Watershed in Wake County, North Carolina is presented. Two land cover classification models were generated using random forests with an overall accuracy of 89% (kappa 0.86) and 91% (kappa 0.88). The priority queue identified 109 priority locations representing 1.5% area of the watershed. Large forest clearings were the highest priority locations, followed by newly constructed buildings. The highest priority site was a 0.5 km 2 forest clearing that was mapped with UAS, generating a 15 cm DEM. The UAS DEM was resampled to 3 m resolution and fused with USGS NED 1/9 arc-second DEM data. Surface water flow was simulated over the original and updated DEM to illustrate the impact of the topographic change on flow patterns and highlight the importance of timely DEM updates.

Graphical Abstract

1. Introduction

The sustainable management of urban landscapes is facing a new set of challenges in the wake of rapid urbanization [1,2]. As new development alters the existing land cover in these regions, the topography is also often modified, which can have adverse effects on the surrounding environment, such as altering stream channels in ways that increase flooding and contribute to water quality degradation [3]. City managers, researchers, and other decision-makers rely on geospatial models and data in order to better understand the impacts of urbanization on the landscape [2,4]. However, geospatial models are limited in their ability to inform decision-making without the availability of relevant, up-to-date geospatial data [5].
A broad range of cross-disciplinary applications (e.g., classification, change detection) utilize the synthetic fusion of multi-source data that range in spatial, temporal, and spectral resolutions [6] to improve the availability and accuracy of geospatial data. In remote sensing, multi-source data fusion methods have been characterized into three distinct levels: pixel, feature, and decision [6,7]. Pixel level fusion combines raw data from multiple sources into a new dataset of the same resolution. Feature level fusion works by combining extracted features (e.g., texture, edges) from various datasets into a new dataset and helps reduce data with high dimensionality. Decision level fusion is performed by fusing multiple modeled results (e.g., confidence intervals, categories) into a new decision dataset. High-level fusion methods (e.g. feature, decision) combine multiple-source data such as multispectral and hyperspectral data, GIS data, synthetic aperture radar (SAR), and lidar data to improve the accuracy of land cover image classification of high-resolution data [6,8]. However, the synthetic utilization of multi-source data comes with many technical challenges that are only increasing as the abundance of potential data sources and new sensor systems grow.
Multi-source multi-temporal land cover classification and change detection face challenges in co-registration as traditional earth observation platforms (e.g., Landsat, Sentinel-2) are fused or replaced with new satellite constellations. Satellite constellations such as PlanetScope [9] are made up of many satellites that individually capture small scenes that generally need to be patched into a mosaic for analysis. However, special consideration is needed to ensure the geometric and radiometric accuracy of the data because of potential differences in platforms and sensors and other environmental factors [10]. Current research in deep learning is working to improve multi-source and multi-temporal image registration by identifying features with a high degree of self-similarity at multiple spatial scales after traditional geographic registration is performed [8].
Other research in multi-source multi-temporal land cover classification is examining high-level fusion methods to utilize crowd-scoured GIS vector data such as OpenStreetMap (OSM) to enhance and augment land cover classification of remotely sensed imagery. These methods include augmenting classification results with high accuracy GIS data during post-processing, the generation of model training samples, and feature level fusion of GIS data to improve image segmentation [11,12,13]. Research is also being done on the reverse effect where optical imagery is being used with modified cyclically-trained generative adversarial networks (CycleGAN) [14] to update OSM [15].
In addition to optical imagery, the synthetic fusion of multiple-source digital elevation model (DEM) data requires its own set of considerations. For example, the United States Geological Survey (USGS) 3D Elevation Program (3DEP), an improvement on the National Elevation Dataset (NED), serves to combine and standardize localized airborne lidar from various data sources into a seamless national dataset [16]. The 3DEP program has specific standards and requirements of source data (e.g., spatial reference system, horizontal resolution, vertical resolution, etc.) designed to improve the overall quality of the derived multi-source products [16]. A recent study by Stoker and Miller evaluated assumptions that these data requirements provide enough standardization to combine these disparate elevation datasets into a single dataset and whether the fusion of high-resolution lidar data improves the accuracy of derived products [16]. Their results demonstrated that even with systemic requirements for data inclusion, errors still exist in the accepted datasets [16]. However, they found that the vertical accuracy outperforms global DEM datasets and that the fusion of lidar data increases the overall vertical accuracy of the 3DEP seamless data products [16]. These results are consistent with other studies that examine fusing high-resolution UAS-based DEM with lidar-based DEM to improve source data accuracy [17,18]. Recent research in land cover classification has shown that the fusion of multi-source remote sensing data with elevation data may increase the accuracy of derived land cover classification products. These studies align with Stoker and Miller’s results, which identified statistically significant differences between the mean elevation range and height above ground elevation between distinct land cover classes [16].
Digital elevation models have lower temporal resolutions than other types of geospatial data, such as high-resolution imagery and urban infrastructure data, because topographic change usually occurs slowly over large spatial extents. Additionally, traditional methods to update DEMs (e.g., airborne lidar surveys) are costly and therefore performed infrequently. However, in areas where rapid urbanization is modifying topography, DEMs no longer accurately reflect the landscape, increasing uncertainty in the geospatial models that depend on them (e.g., stormwater, flooding) [4,19]. These topographic changes are generally limited and spatially dispersed, covering only a small portion of the total area surveyed by airborne lidar or long-range unmanned aerial systems (UAS) (i.e., capable of flying entire cities). Satellite-based land cover change detection [20,21] and DEM data fusion with low-cost UAS provide a toolset to update these small area changes [17,18] by providing methods to identify where topographic changes occurred and a method to update an existing lidar-based DEM seamlessly [17,18]. However, the use of these methods alone is limited by the potentially large number of affected areas combined with the flight time limitations of low-cost UAS.
Therefore, a method is needed to prioritize where to send UAS to capture the most significant topographic changes for fusion and update of existing DEM. With the emergence of new earth observation satellite constellations (PlanetScope [9]), cloud-based computational platforms (Google Earth Engine [22]), and open-source UAS flight planning [23], processing, and data fusion methods [18] (WebODM [24] and GRASS GIS [25]) new opportunities are available to develop novel methods in DEM data acquisition and fusion. We developed Rapid-DEM, a framework that prioritizes areas of topographic change for UAS survey and data fusion using multispectral satellite data to detect, classify, and prioritize land cover change transitions with a high likelihood of topographic change in a priority queue. The priority queue utilizes the relationship between land cover data and DEM data as a proxy for the likelihood and magnitude of topographic change. We demonstrated Rapid-DEM with a case study where we evaluated the impact of topographic change captured in the fused DEM on spatial patterns of surface water runoff in the area identified as the highest priority location.

2. Methods

2.1. Rapid-DEM

The developed framework combines multiple geospatial technologies to detect, prioritize, plan, fly, and fuse elevation data to update a DEM at a location with major topographic changes (Figure 1). Rapid-DEM works by (1) ingesting PlanetScope 3 m multispectral satellite data [9] from a user defined time period and area of interest into Google Earth Engine (GEE) [22] where post-classification thematic change detection is performed to identify land cover change. (2) Next, the classification data is exported to GRASS GIS [25] where a priority queue is generated. (3) High-priority locations are then surveyed with UAS and the data is processed in WebODM using structure from motion (SfM) to generate a DEM of the location. (4) The UAS DEM is fused with an existing lidar-based DEM and (5) finally, the fused DEM is optionally uploaded to an open data repository (e.g., OpenTopography) [26].

2.1.1. Data

Rapid-DEM utilizes four datasets: satellite imagery from the PlanetScope constellation, crowd-sourced vector data from OpenStreetMap (OSM), existing lidar-based DEM, and UAS-based DEM. PlanetScope and OSM data are used for thematic change detection, while the UAS-based DEM and lidar-based DEM UAS are fused to create an updated DEM (Table 1).
PlanetScope is a satellite constellation that provides multispectral daily 3 m resolution satellite imagery consisting of 4 16-bit bands (red, green, blue, near-infrared) [9,27]. The Surface Reflectance PlanetScope Analytic Ortho Scene image product (Level 3B) was used for analysis because it does not require additional pre-processing or correction before analysis [27]. The imagery has a ground sampling distance (GSD) of 3.7 m and positional accuracy of less than 10 m RMSE [27]. The data is ordered and filtered with the Planet API Python Client [28] to a specific period and an area of interest. To reduce undesired environmental noise during the change detection process, environmental and mechanical filters such as cloud coverage and the off-nadir angle are used. The data is stored in a Google Cloud Storage bucket where GEE accesses it for processing as an ImageCollection [22].
OpenStreetMap (OSM) is a free crowd-sourced map of the world that includes various geospatial features ranging from transportation networks to land use characteristics. OSM attribute data is stored as tags, key-value pairs that are spatially linked to geospatial data structures (node, way, or relation). Nodes are geographic points, ways are lines, closed ways can be interpreted as polygons, and relations define how other elements work together. The data for some of these features is close to complete and highly accurate with worldwide street data being estimated at 80% complete [29]. To automate the development of training data for thematic land cover classification OSM data is accessed through Google BigQuery (GBQ) and converted into a GEE FeatureCollection for the analysis. The OSM data is queried with the tags Natural, Highway, Parking, Building, Surface, and Landuse in addition to specific values types [11,12,30]. The OSM FeatureCollection is then mapped to the land cover classification scheme that includes six thematic classes including, buildings, developed, forest, barren, grass, road, and water (Table 2). Each land cover class is generally well represented by the OSM data except for the barren class, which requires additional sources of derived sample data.
Consumer-grade UAS data platforms are capable of generating high quality aerial imagery and derived elevation products suitable for geospatial analysis [17,23,31]. Sensor data can vary depending on the UAS platform, but most UAS platforms capture the visible spectrum of red, green, and blue bands without customization. The resolution and accuracy of UAS data depend on many factors, including the sensor, flight elevation, image overlap, flight telemetry, time of day, and weather. Ground control points (GCP) are used to validate, as well as to improve horizontal and vertical accuracy when generating 3D terrain models using SfM, but are not always necessary or feasible to utilize [23]. As long as the positional accuracy of the UAS-generated DEM is acceptable for the specific fusion and modeling use case, Rapid-DEM does not require a specific UAS platform. Additionally, there are many existing lidar-based DEMs that can be used to create an updated DEM. However, the choice of which dataset to use depends on the specific application.

2.1.2. Land Cover Classification and Change Detection

To utilize GEE’s computational resources and modeling capabilities, the PlanetScope data ImageCollection is divided at the temporal midpoint and converted into two mosaic images using the median pixel value. These two mosaics represent the before and after images used for classification and change detection. Several change detection methods were explored (e.g., change vectors, multi-date composites), however, the combination of binary and pixel-based post-classification thematic change detection provided the most reliable results. Image differencing is performed on the mosaic images creating a binary change mask by subtracting the red band of the after image from the red band of the before image [32]. A statistical threshold is then set to include pixels less than −2.5 the standard deviation [33,34]. The threshold and choice of the band are based on visual analysis of the data. The remaining pixels are then clumped into discrete change objects using a plus-shaped kernel with a one-pixel radius, and an adjustable maximum object size (i.e., 128 pixels). The objects are areas that mask the pixel-based change detection and are not used to define segments (i.e., objects or polygons) used in object-based classification.
The Bare Soil Index (BSI) [35] and Normalized Difference Vegetation Index (NDVI) [36] are used to differentiate between vegetated and unvegetated surfaces. The BSI is a normalized index that separates bare soil by separating different canopy backgrounds (e.g., bare, sparse, and dense) using the red, green, blue, and near-infrared bands [35]. NDVI uses the red and near-infrared bands to distinguish vegetation health based on the reflectance properties of chlorophyll on visible and near-infrared light [37]. We represented barren land cover using BSI and NDVI thresholds, where b m i n and b m a x represent the BSI upper and lower threshold and n m i n and n m a x represent the upper and lower NDVI threshold.
B a r r e n L a n d = ( b m i n BSI b m a x ) A N D ( n m i n < NDVI < n m a x )
To generate barren training samples patches of barren land cover greater than 500 m 2 (e.g., the area of a small parcel) is created by joining connected components with a 1 m kernel. The barren land threshold values are determined through expert interpretation of the data [38] and would require modification to match the spectral characteristics of disparate spatial regions. In some cases, this method may not be applicable to the given dataset and a different method will be needed to supplement barren land cover training samples. The barren land patches and OSM features collection are then combined, and the binary change mask is used to remove features in areas with likely thematic change. The road and water classes are also removed from the training dataset because of their complete and stable representation and are re-included post-classification [11,29].
The features used for classification are generated separately for the before and after mosaics to account for spatial–temporal non-stationarity of multispectral satellite imagery caused by heterogeneous landscapes and seasonal effects reducing noise during post-classification comparison [20,39]. The features included summary statistics, low pass filters, spectral indices, and texture (Table 3). The median, standard deviation, minimum, and maximum values are calculated only from the blue and near-infrared bands because of their high correlation with the red and green bands. The spectral indices, NDVI [36,37], normalized difference water index (NDWI) [40], BSI [35] are also used in addition to the textural features contrast, angular second moment, and correlation generated from the gray-level co-occurrence matrix (GLCM) [41,42].
A random forest model is used to create a pixel-based thematic classification model using training samples from a weighted stratified random sample to ensure all land cover classes were represented. The sample sets are segmented into 70% training and 30% testing datasets [43] and the features are selected based on the evaluation of feature importance. Multiple random forest models are created at multiple tree levels (10, 50, 100, 250, 500, 1000) before the final model with the greatest overall accuracy is chosen to classify the image. During post-classification, water and street features from OSM are superimposed onto the classification results [11,29]. The two thematically classified images are then used to develop the priority queue using the priority queue algorithm during the planning phase.

2.1.3. Prioritizing and Contextualization

The priority queue algorithm involves seven steps to transform the two thematically classified land cover maps into the priority queue. The before and after land cover maps are transformed into a priority change map (PC) using the priority change table (Table 4). The priority change table maps land cover transition types based on expert knowledge using a seven-point Likert Scale [0, 7]. Zero represents land cover transitions that are not a priority, 1 represents the lowest priority change or noise, and 7 represents the highest priority change. The highest priority change is considered a change in land cover with a high likelihood of modifying the urban topography. For example, cells that change from forested to developed or barren land cover would have a high priority change because they likely indicate new development, which often includes site grading leading to change in topography. The PC map and binary change mask are combined to calculate the mean priority change for each object identified in the binary change mask producing the mean object priority change (MOPC) map. To account for different sized change objects, the product of the MOPC map and the area of each change object (COA) are used to produce the priority (P) map. The priority queue (PQ) map is created by normalizing the values in the P map to real numbers ranging between [0.0, 1.0] using MinMax normalization to improve the PQ map’s interpretability. We smoothed irregular boundaries and removed small gaps of each priority object by applying a four-cell buffer computing mode values from surrounding cells. These modifications produce objects that overlap bordering areas (i.e., unchanged) required for data acquisition and fusion. Finally, change objects that do not represent likely topographic change (mean priority value of zero) are removed, and the PQ is converted to vector polygons (VPQ) and sorted in descending order of importance DESC(VPQ).
Priority Queue Algorithm:
  • Create a new Priority Change (PC) map from date 1 and date 2 thematic classifications using priority change table expression
  • Create Mean Object Priority Change (MOPC) map by calculating the weighted mean for each labeled object in the PC map
  • Create Change Object Area (COA) map
    (a)
    Create Object Size (OS) map by counting the number of pixels per object
    (b)
    Create Object Pixel Area (OPA) map by calculating the area per pixel for the resolution
    (c)
    Calculate the Object Area (COA) map as OPA x OS
  • Create Priority (P) map as COA x MOPC
  • Generate Priority Queue (PQ) by normalizing the P map to real numbers between [0.0, 1.0] (Equation (2)).
  • Export PQ to a vector polygon Vector Priority Queue (VPQ)
  • Sort queue in descending order DESC (VPQ)
PQ = P m i n ( P ) m a x ( P ) m i n ( P )
The priority queue is contextualized through a priority context map (PCM) that explains the type of land change. The PCM is created by assigning each land cover change transition and action. These actions are defined by two base types of land change: New features and removed features (Table A1). New features are represented by changes such as the construction of a new building, road, parking lot, while removed features represent change such as forest clearings or demolished buildings. Static land cover and land change likely due to noise (e.g., seasonal variation, misclassification) are not included. To assign a final context to each priority change object the mode land cover change context class is calculated for each object in the priority queue.

2.1.4. UAS Data Acquisition and Processing

A flight plan of a selected high priority area is generated with a priority queue defined polygon or a manually defined area determined by the UAS pilot using a flight planning and control application such as Drone Deploy [44]. However, other UAS flight planning and mapping software solutions would work to capture the updates. Additionally, to ensure safety and compliance with local UAS regulations, a qualified UAS pilot should review all flight plans generated using priority queue-defined polygons. The use of GCPs is recommended to improve horizontal and vertical accuracy of the flight data, but is not necessary to produce a DEM with acceptable vertical accuracy for fusion in all locations [45,46].
The collected UAS data is processed using the open-source photogrammetry software WebODM [24], which provides a web user interface to OpenDroneMap’s (ODM) [47] implementation of SfM. SfM processes images with embedded positional information from the UAS GNSS receiver and outputs an orthomosaic and DEM(s), e.g., bare ground digital terrain model (DTM) and a digital surface model (DSM) with above-ground features. The UAS-based DEM can also be generated from other photogrammetric software solutions that generate comparable accuracy in output DEM [48].

2.1.5. DEM Fusion

UAS-based DEMs for modeling applications are limited due to their small spatial coverage and often irregular boundaries. Merging UAS-based DEM with existing, typically lidar-based DEM allows for more accurate viewshed or water flow analysis where larger spatial context plays an important role. However, simple mosaicing can lead to artifacts in the resulting DEM and subsequent analyses due to elevation differences along the irregular edge of the UAS-based DEM. DEM fusion [18], in which the transition between surfaces is controlled by distance-based weighted averaging along the DEM’s blending overlap is applied to minimize these artifacts and generate a seamless DEM. More formally, given elevation surfaces DEMlidar and DEMUAS, we compute the euclidean distance d from the edge of the surface DEMUAS and use it as weight coefficients w for the linear combination of the two surfaces:
DEM new = DEM UAS · w + DEM lidar ( 1 w )
Weight w is a function of overlap width s and distance d. We assume w to be linearly dependent on distance d, resulting in w = d / s for d in [ 0 , s ) and w = 1 for d > s . In the simplest case, s denotes a constant overlap width, however, s can be also spatially variable, derived from varying elevation differences along the blending seam. Spatially variable overlap width allows for a more gradual transition along the overlap where elevation differences are large while keeping a small overlap width and preserving the subtle features of both DEMs where differences are small.
The fusion process has been developed as GRASS GIS addon r.patch.smooth for raster-based elevation surfaces using basic GIS functionality such as raster algebra. Thanks to that, the fusion process is relatively fast compared to other methods e.g., based on merging point clouds [18]. However, it assumes both surfaces have been resampled to the same resolution. Resolution can match the UAS-based DSM to preserve all features captured by the UAS, however since the ultra-high resolution of the UASDSM does not always correspond to the actual level of detail of the DEM, reducing the resolution is typically needed. The fusion process also presupposes good vertical alignment of the two DEMs. When GCPs are not available when capturing the images and processing the DSM, the UAS-based DEM typically does not vertically align with the lidar-based DEM. To proceed with the fusion process we estimate the vertical shift and correct for it by subtracting it from the UAS DEM. In case the surveyed area has been locally altered, for example by raising a new building, a simple mean or median of the elevation differences between UAS- and lidar-based DEM would not accurately represent the shift and GCPs or unaltered features can be used to ensure adequate alignment.

2.2. Case Study

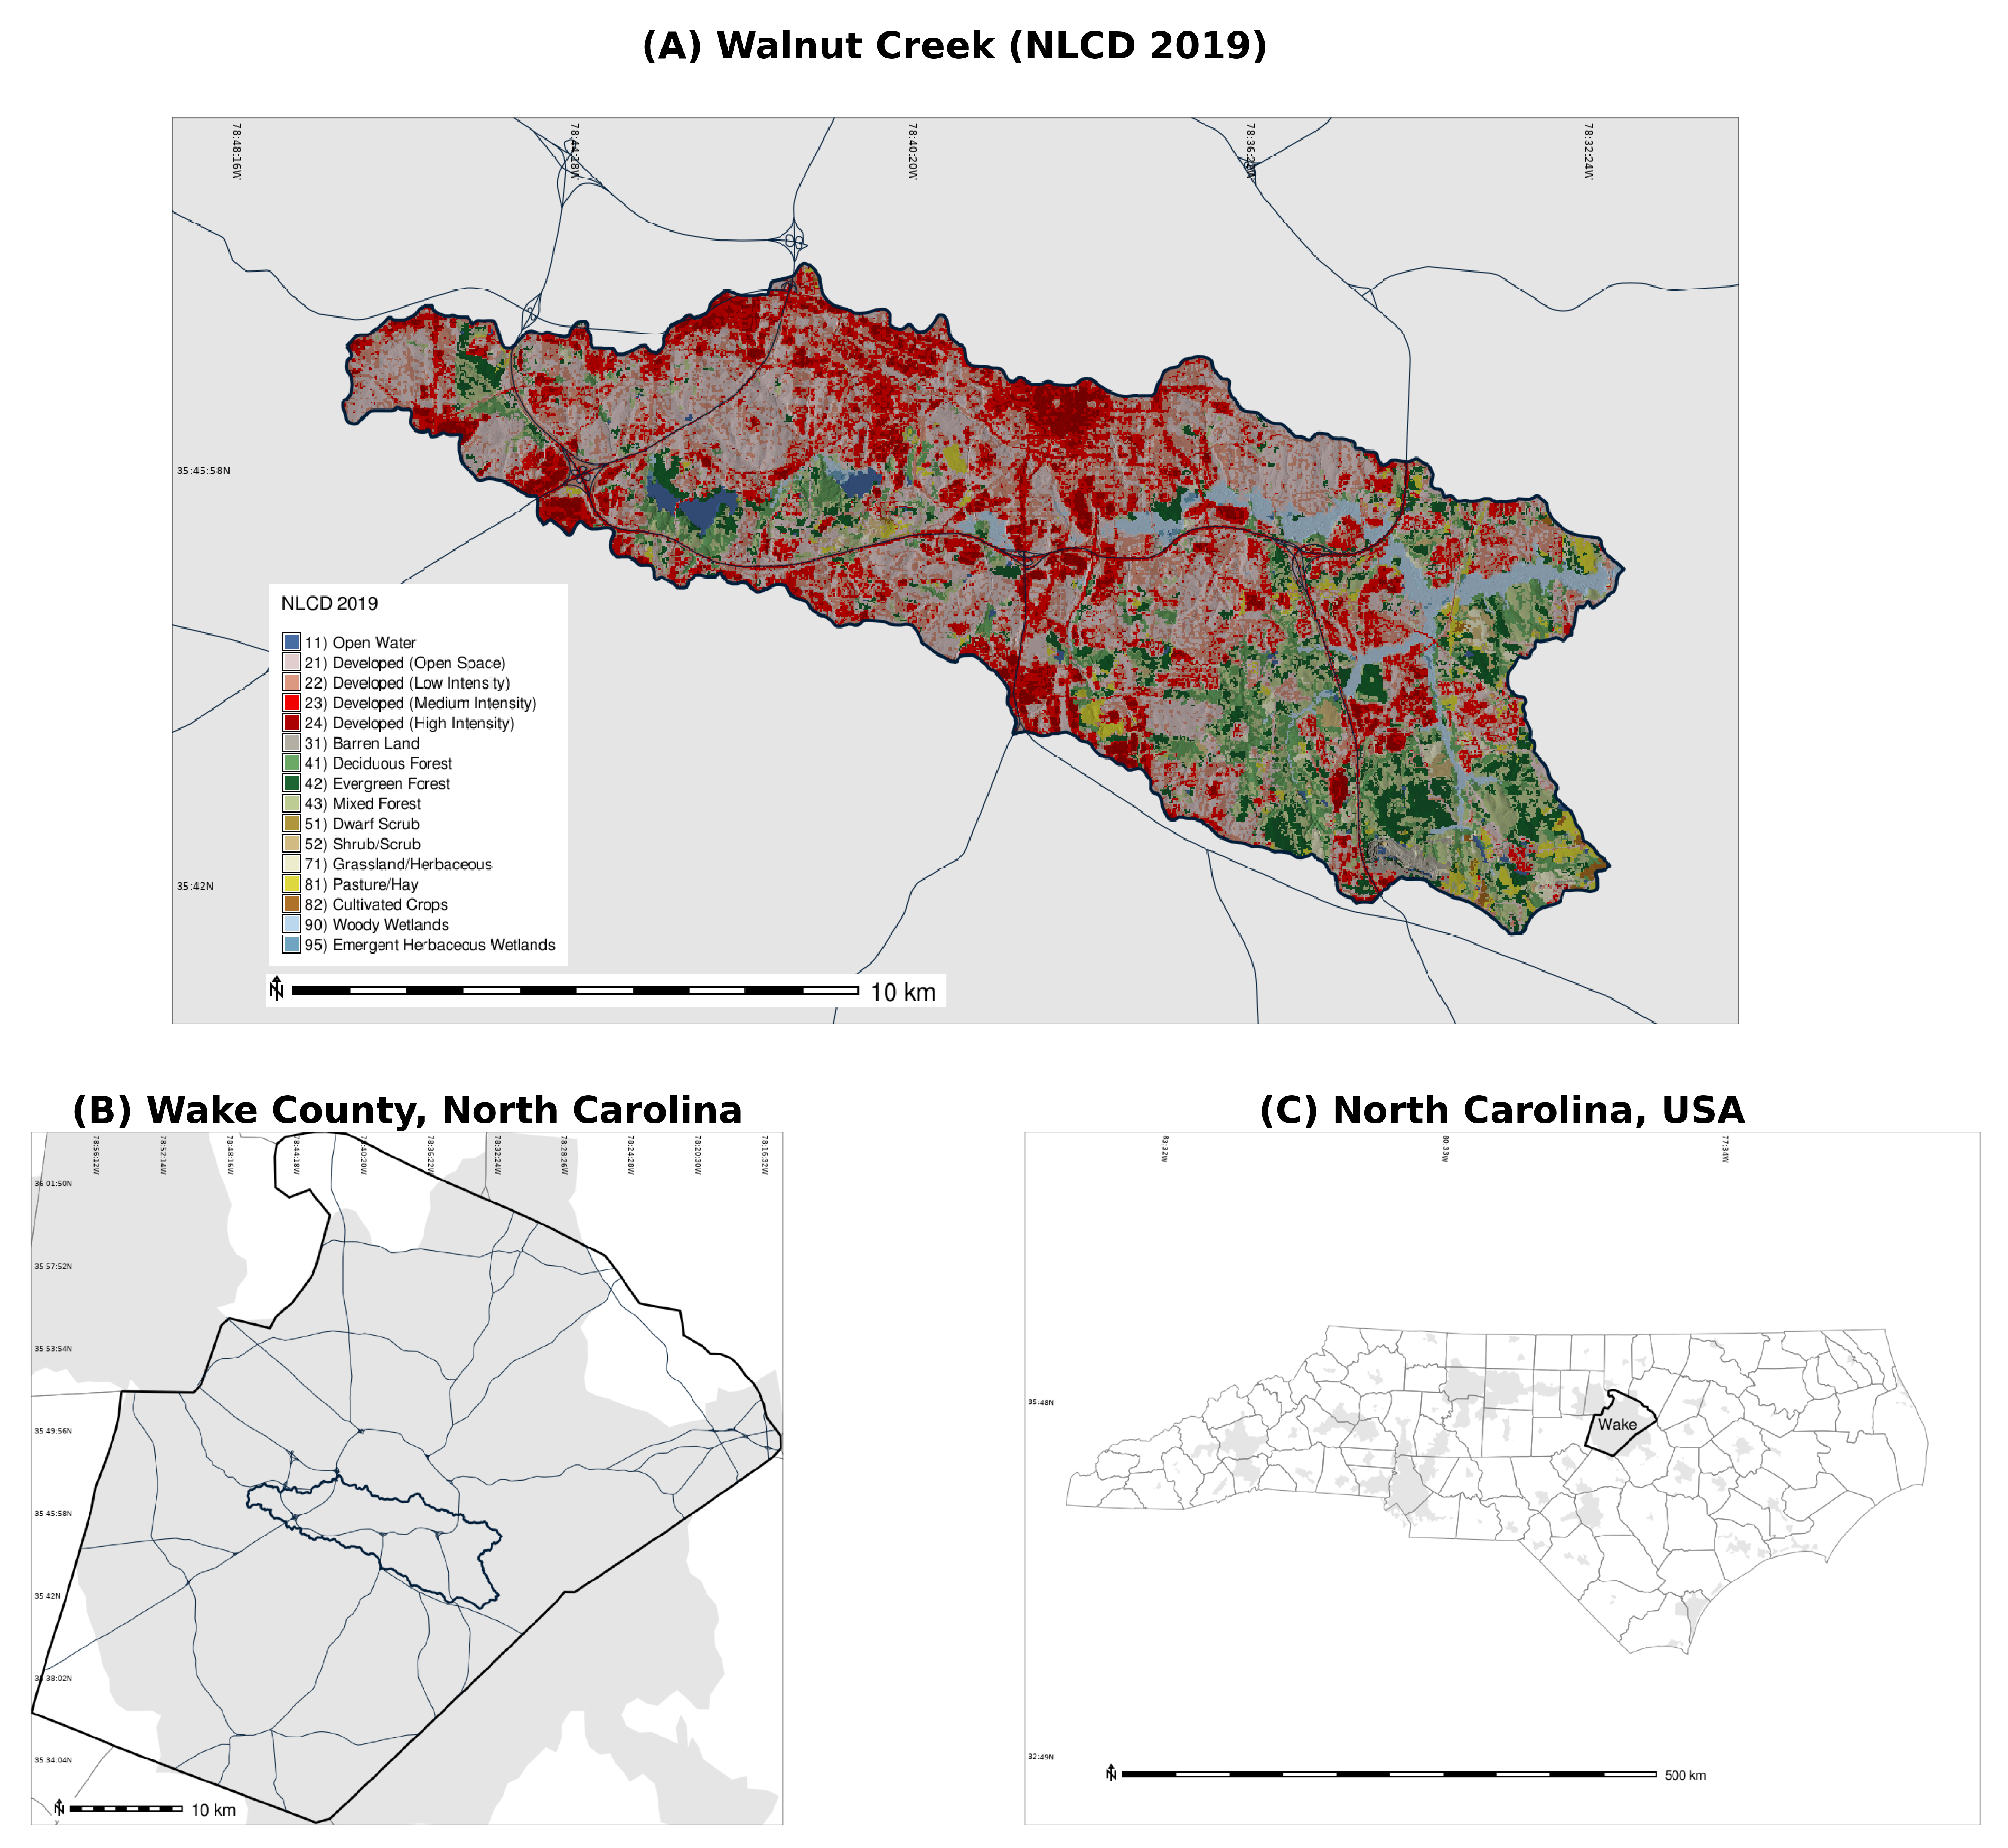
Rapid-DEM was implemented and tested at the Walnut Creek Watershed (119 km 2 ) in Wake County, North Carolina, USA (Figure 2). The Walnut Creek watershed is part of the Neuse River Basin and includes parts of the City of Raleigh and the Town of Cary, North Carolina. The watershed is predominately developed, but still partially forested, with open water [49] and includes Walnut Creek, which is a tributary to the Neuse River. Based on the National Land Cover Dataset (NLCD) high and medium intensity development are the fastest growing land classes between 2016 and 2019 in the Walnut Creek watershed [49,50]. Medium intensity land cover increased 40.9% from 14.4 km 2 to 20.2 km 2 mostly converting low intensity development ( 6.6 km 2 ). Similarly, high-intensity land cover increased 57.5% from 4 km 2 to 6.4 km 2 mostly converting medium intensity development ( 1.9 km 2 ). The data suggests the development density and total amount of impervious surface in Walnut Creek are increasing. We chose the Walnut Creek watershed as the study area because it enabled us to perform UAS flights on locations identified by the priority queue.

2.2.1. Priority Queue Data

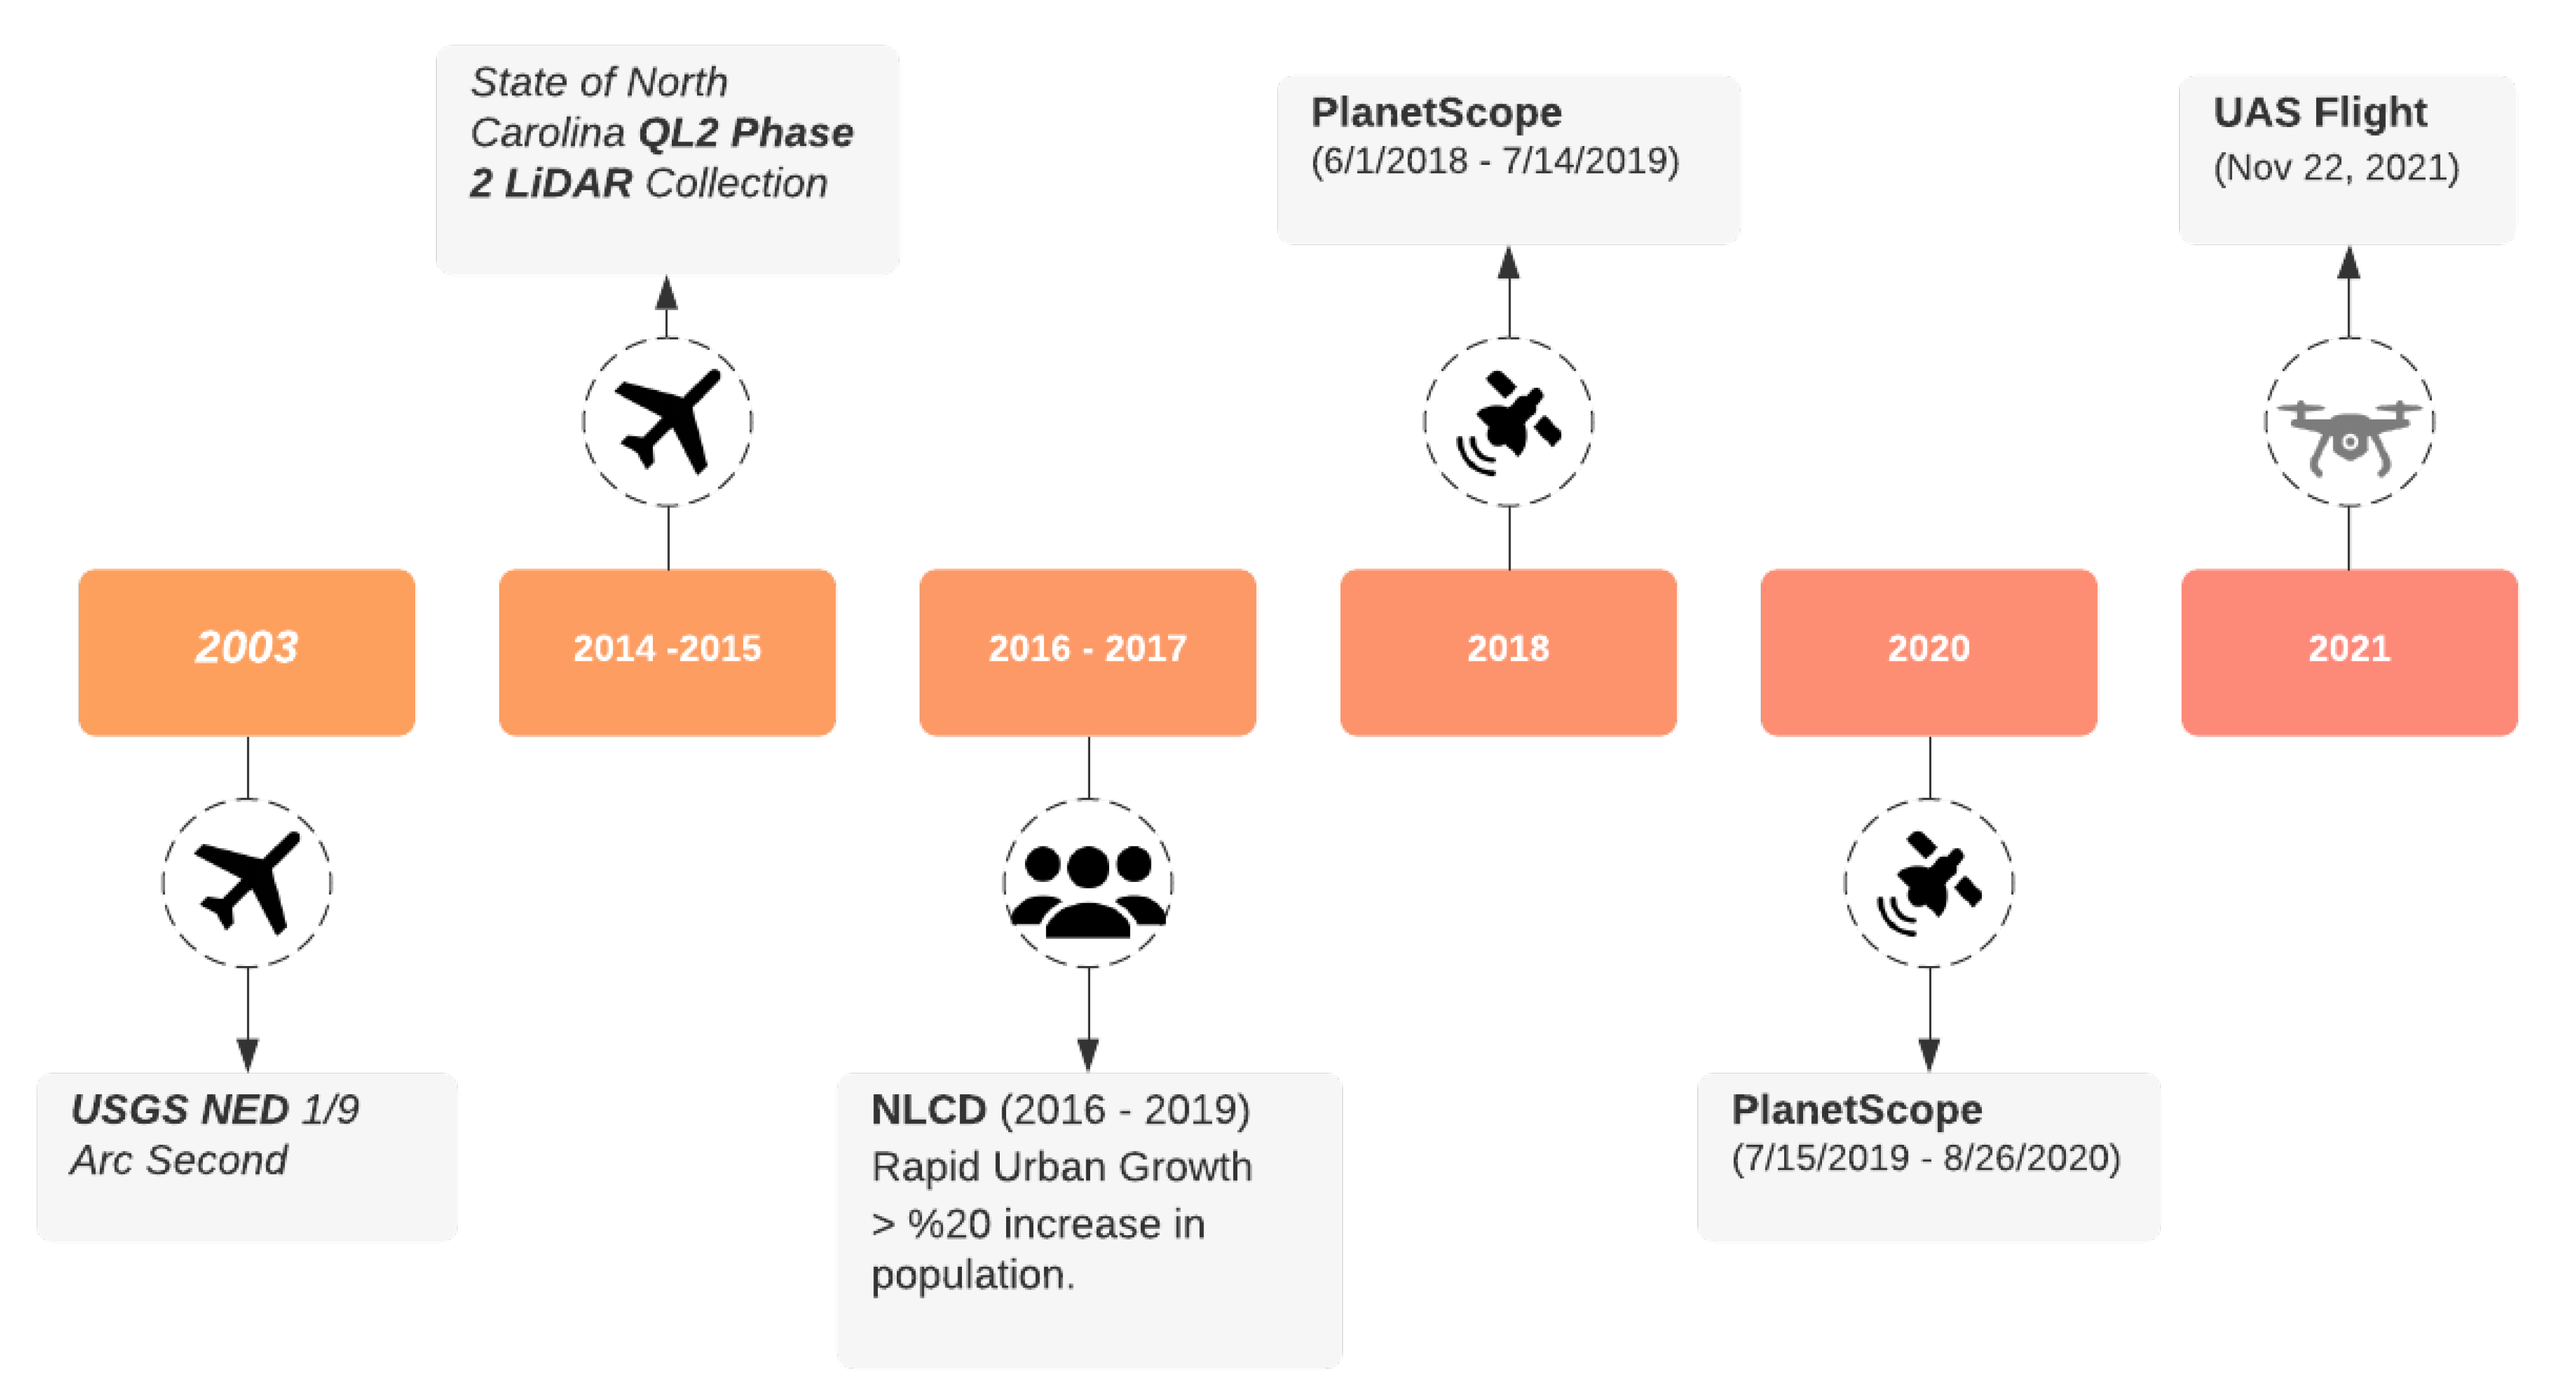
The data used for the case study was collected from 2003 to 2021 during a period of rapid urban growth (Figure 3). The priority queue of the Walnut Creek watershed was developed for the period 1 June 2018 to 26 August 2020 using 500 images from PlanetScope (Table 5). From these images 180 were used to create a before (1 June 2018–14 July 2019) image and 168 were used to create an after (15 July 2019–26 August 2020) image.
The before and after satellite imagery was thematically classified from training samples generated from 12,363 OSM objects and barren land cover data captured as areas with BSI = <103, 105.5> and NDVI = <0.16, 0.22> (Figure 4).
The priority queue was manually evaluated by reviewing if the identified locations contained change. The review was conducted using GRASS GIS to toggle the before and after satellite imagery mosaics used during classification with the areas classified as high priority. Locations that were identified as errors were flagged and used to validate the accuracy of the priority queue at detecting change.

2.2.2. UAS Flight Data and Fusion

A DJI Phantom 4 Pro was used with DroneDeploy [44] software to acquire aerial imagery in the area identified as a high priority for DEM update. The flight included areas outside the bounds of the priority queue to ensure sufficient overlap with the unchanged area and to represent the entire planned construction area, which may be used in future studies involving the site. Ground control points were not collected or used in processing because the busy construction site was inaccessible to the public.
The Phantom 4 Pro has a max flight time of 30 minutes, uses a 20-megapixel RGB sensor and a GPS and GLONASS (Globalnaya Navigatsionnaya Sputnikovaya Sistema) GNSS receiver. It has a ground sampling distance of 1.91 cm/px at 70 m altitude, a GNSS vertical accuracy of ± 0.5 m and horizontal accuracy of ± 1.5 m [46]. The survey was autonomously flown at 116 m above the ground altitude in a linear pattern to reduce flight time. Front and side overlaps were set to 75% and 65% each and the gimbal angle set to 90 degrees, nadir, manual focus set to infinity, ISO set to auto, and shutter priority mode set to 1/800 s. During the 25 min flight, 322 images were collected and covered 0.63 km 2 of the area. The resulting UAS data was processed in WebODM using customized parameters (Table A2) to improve the accuracy of the resulting DEMs [24].
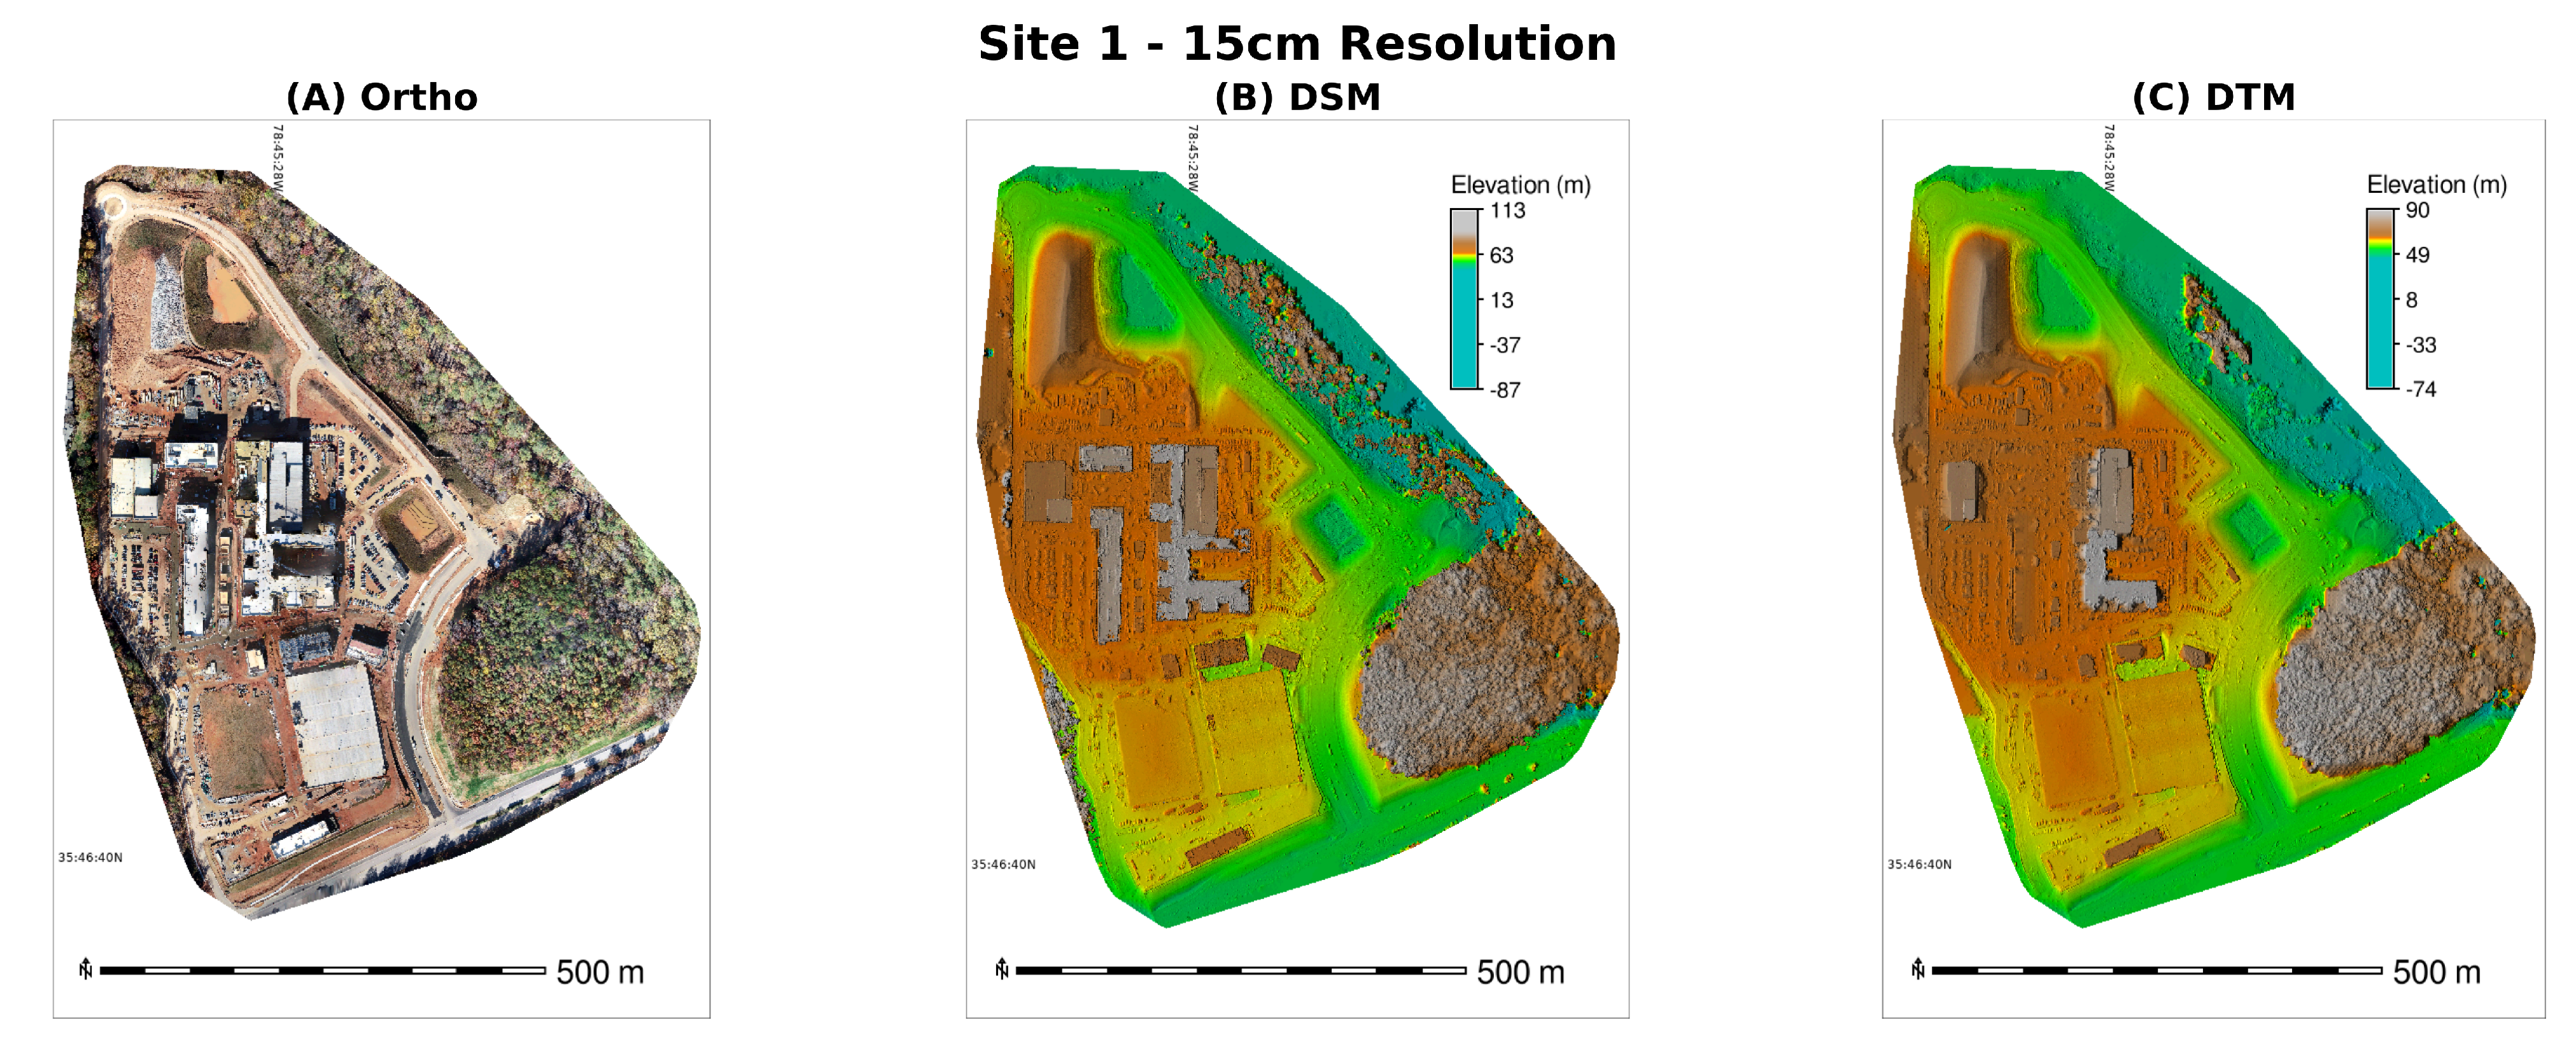
The processed data included a 15 cm resolution DTM, DSM, and orthoimagery with an average ground sampling distance of 6.2 cm. A full flight report is available in the Supplementary Materials (Report S1). The UAS DTM generated from WebODM was not a true DTM because vegetation and buildings were only partially removed. To account for this the DSM was further processed to generate a smoothed (i.e., 5-pixel moving window mean) bare ground DEM (UAS DEM)(Figure A1).
The UAS DEM was fused with a DEM from the United State Geological Survey (USGS) National Elevation Dataset (NED) (USGS NED DEM) (Table 6). The GRASS GIS [25] tool r.in.usgs [51] was used to directly download and import USGS NED DEM at 1/9 arc second (3 m) resolution for the study area (Table 6). The data uses a geographic coordinate system (GCS) with elevation units in meters and the NAD83 horizontal datum and NAVD88 vertical datum. The data was reprojected to the Lambert Conformal Conic projection (NAD83(HARN)/North Carolina, EPSG:3358) and resampled to 3 m resolution using bilinear interpolation. The USGS NED DEM was selected because of its ubiquitous availability and wide use.
The UAS DEM was prepared for fusion by resampling the resolution to match the 3 m USGS NED DEM data using bilinear interpolation. The UAS DEM was vertically registered using the overlapping lidar data, imagery, and surveyed points [52] along a stable road feature along the southern edge of Site 1 to calculate a median vertical shift of 79.97 m. The difference found between the UAS DEM and USGS NED DEM was caused by an ellipsoid/datum difference between the UAS (i.e., Phantom 4 Pro) and USGS NED DEM. The fusion process utilized a 13 pixel (3 m resolution) moving window to define the spatially variable overlap zone with a 30 degree transition angle and 9 m difference reach. The moving window, transition angle, and difference reach were selected based on a visual comparison of multiple fusions. The large transition angle and difference reach improved fusion along borders with large elevation differences along the edge of the fusion. The vertical elevations in the fused DEM were validated against a limited number of available surveyed stormwater inlet elevations, clustered along the southern edge of the site [52].
Table 6. Case Study Data.
Data NameData TypeSpatial ResolutionAcquisition DataSpatial ExtentSource
USGS NED DEMraster1/9 arc-second2001–2003Walnut Creek Watershed[25,53]
PlanetScoperaster3 m2018–2020Walnut Creek Watershed[9]
UAS DEMraster15 cm22 November 2021Local
Stormwater InletsvectorNA29 January 2022Town of Cary, NC[52]

2.2.3. Assessment of the Change Impacts

The land cover data created for the before and after images during the thematic change detection were used to quantify how much and what type of land cover changed. The fused DEM provided input for assessment of changes in slope, surface water flow patterns, stream channels, and watershed boundaries caused by the new development. Slope maps for the original and fused DEMs were calculated using the GRASS GIS module r.slope.aspect. Surface water flow patterns were simulated with GRASS GIS module r.sim.water. The module solves the bivariate form of shallow water flow equation using the Green’s function Monte Carlo method (path sampling approach [54]), which makes the simulations feasible even on high resolution, noisy surfaces.
The model was parameterized to simulate an extreme rainfall event with a steady, spatially uniform rainfall excess rate of 100 mm/hr, the infiltration rate of overland flow set to 0 mm/hr, and the Manning’s n roughness coefficient uniformly set to 0.1. The model was run with 1 million walkers over a 60 min period producing six, ten minute water depth output maps. The simulations were performed with USGS NED DEM (3 m), UAS DEM (3 m), and the fused DEM (3 m) as input elevation datasets. Changes to the watershed boundaries and stream channels were evaluated using the GRASS GIS module r.watershed.

3. Results

3.1. Land Cover Classification and Change Detection

The classification model of the before image had an 89% overall accuracy (kappa 0.86), and the after image had a 91% overall accuracy (kappa 0.88). The land cover of the before image was 49% forested, 16% developed, 8% grass, 6% buildings, and 3% barren, while the land cover of the after image classification showed that the buildings class increased from 7.1 km 2 to 9.7 km 2 , and the barren class decreased from 3.6 km 2 to 3.0 km 2 (Figure 5). The building class of the before land cover had user accuracy of 0.88 and a producers accuracy of 0.44, while the after classification had a user accuracy of 0.85 and a producers accuracy of 0.68. Grassland cover also contained greater uncertainty with producer accuracies ranging from 0.79 (before) to 0.75 (after). These discrepancies likely account for the larger variations found in these classes.

3.2. Priority Queue

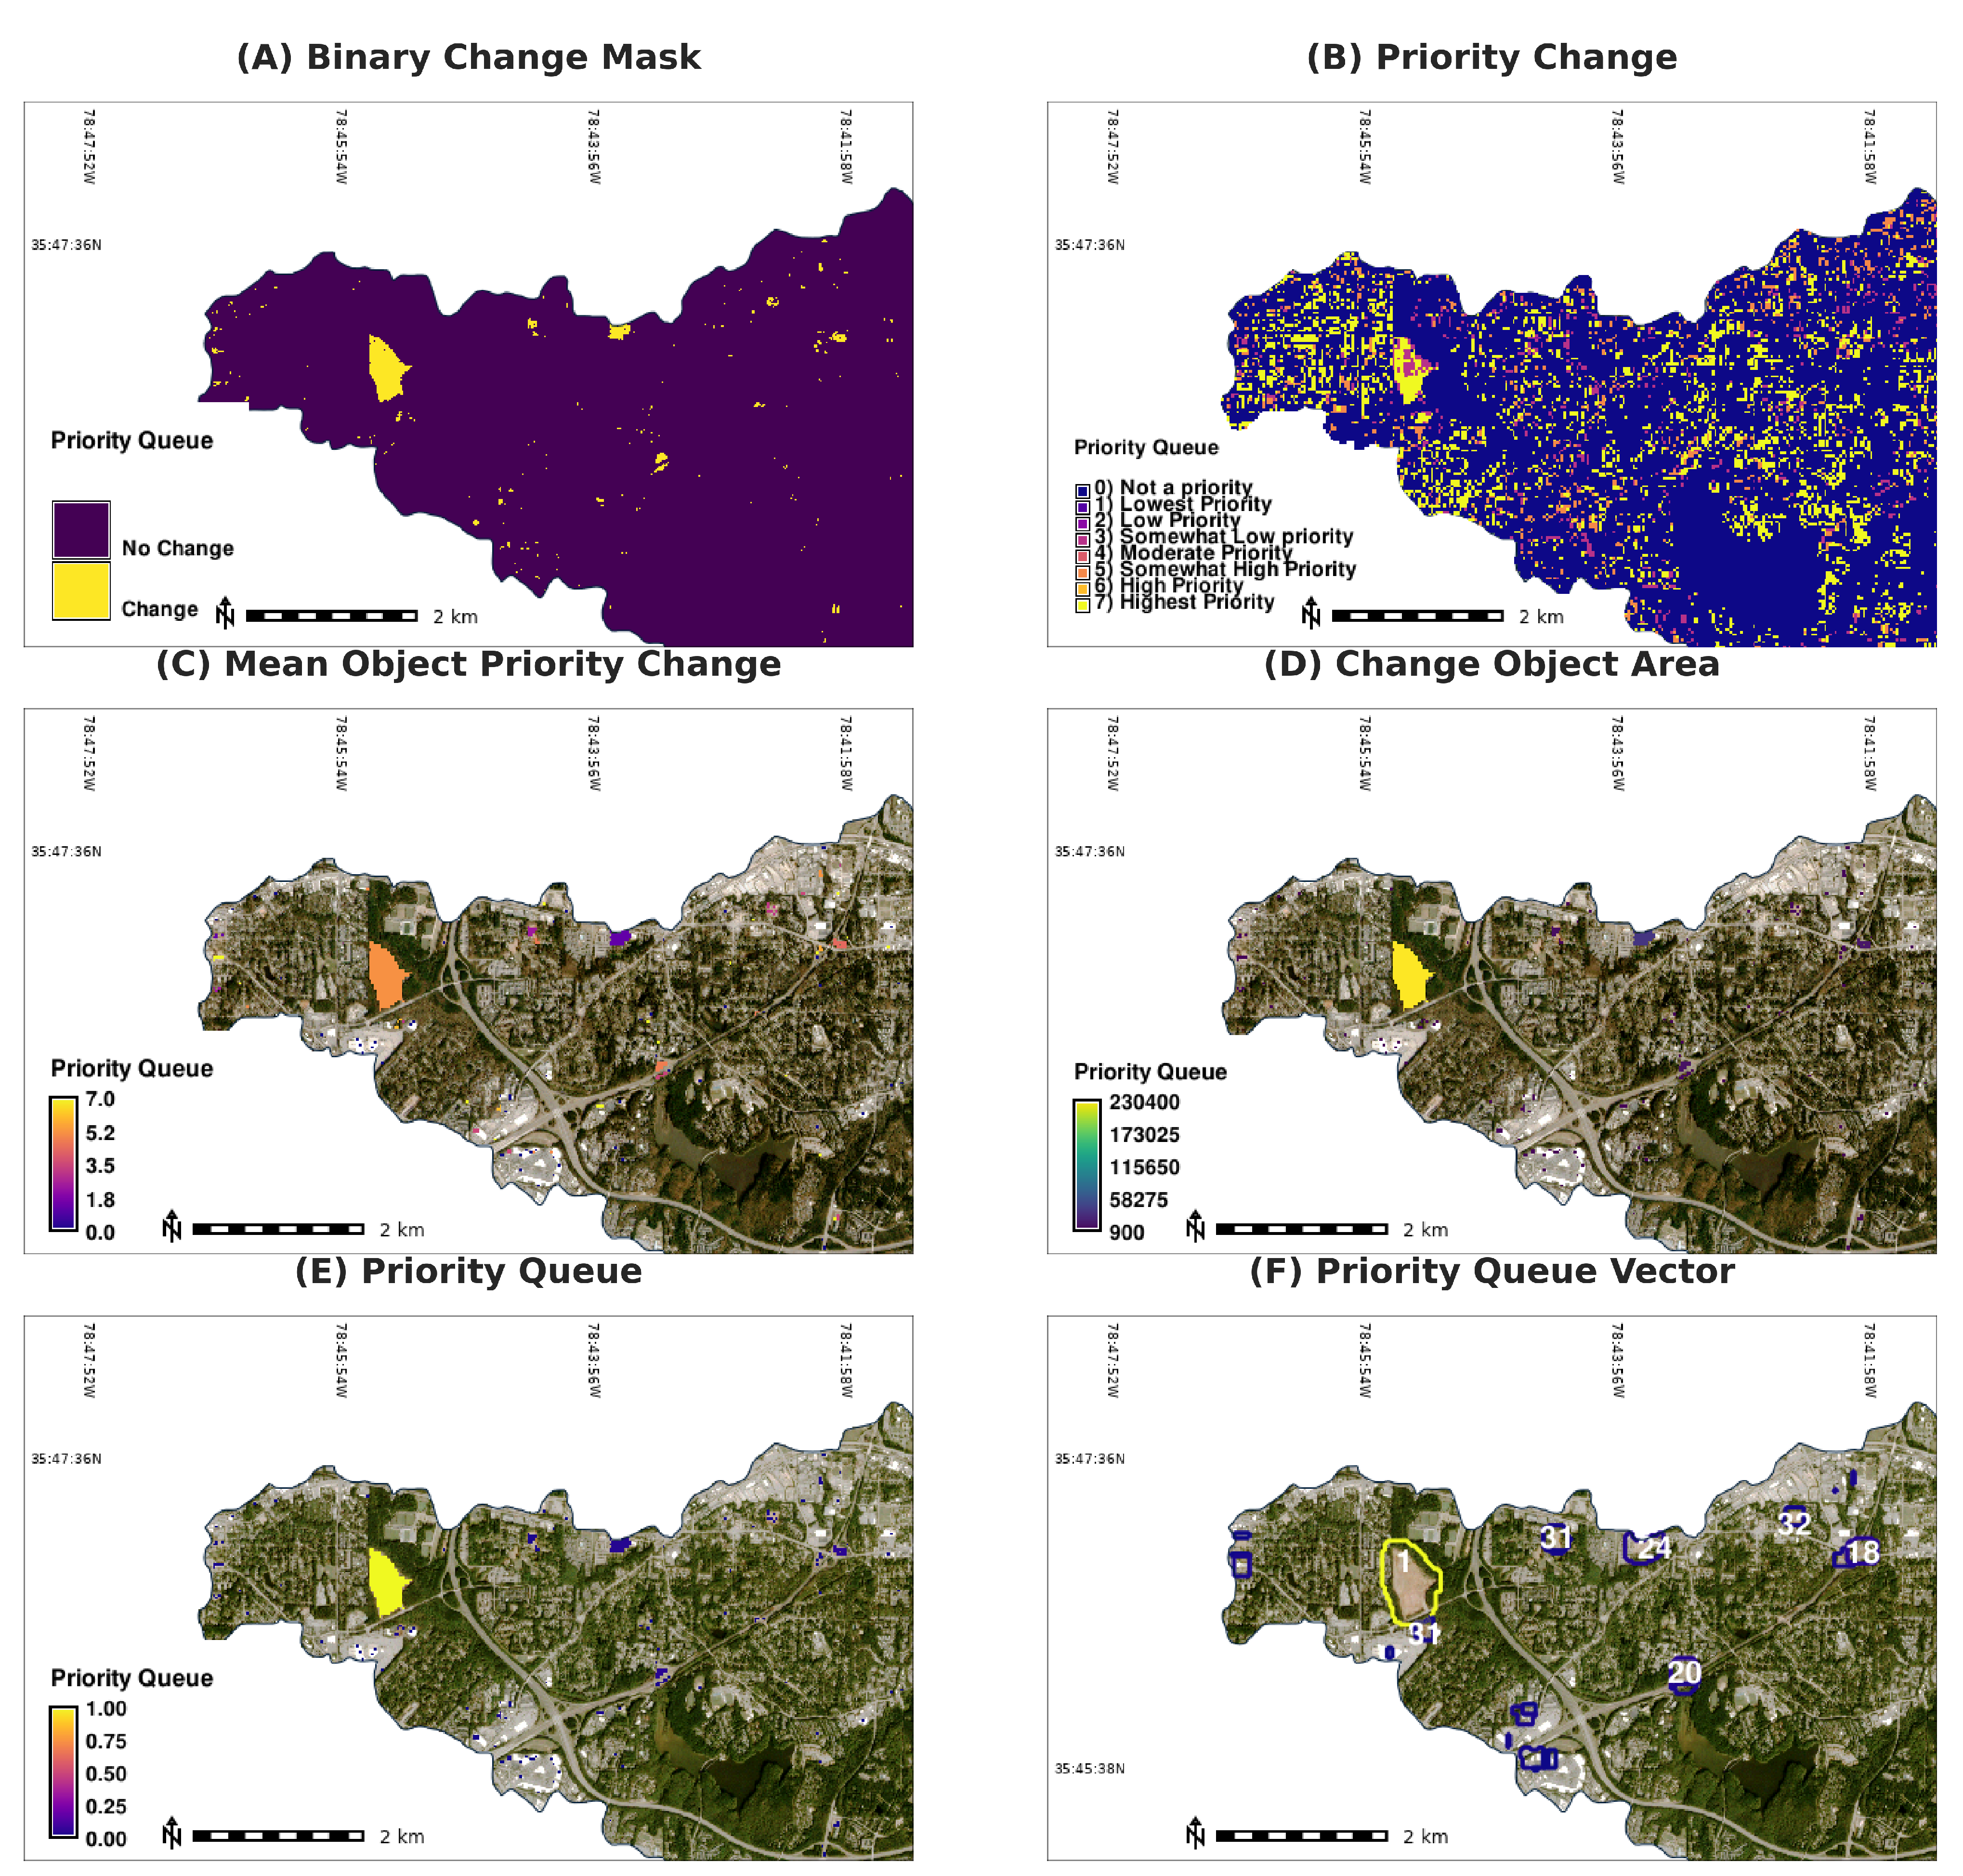
The binary change mask (Figure 6A) masked 0.19   k m 2 or 1.47% of the Walnut Creek watershed resulting in 162 change objects, while the priority change map (Figure 6B) indicated that 83% of the study area had no change and 7.41% had high priority change. The priority change objects had a mean priority change of 3.7 ± 2.1 (Figure 6C) and a mean area of 0.056 km 2 ± 0.076 km 2 (Figure 6D). The priority queue contained 109 locations (Figure 6E), 51 (47%) were validated as containing change while 58 (53%) were deemed as noise. However, filtering the priority queue to only include locations with priority values ( 0.016 ) and areas ( 0.04 km 2 ) greater than the median improved the accuracy of the results (Figure 7). The filtered priority queue contained 42 locations with 9.5% error and a 25.5% loss of valid low priority area.
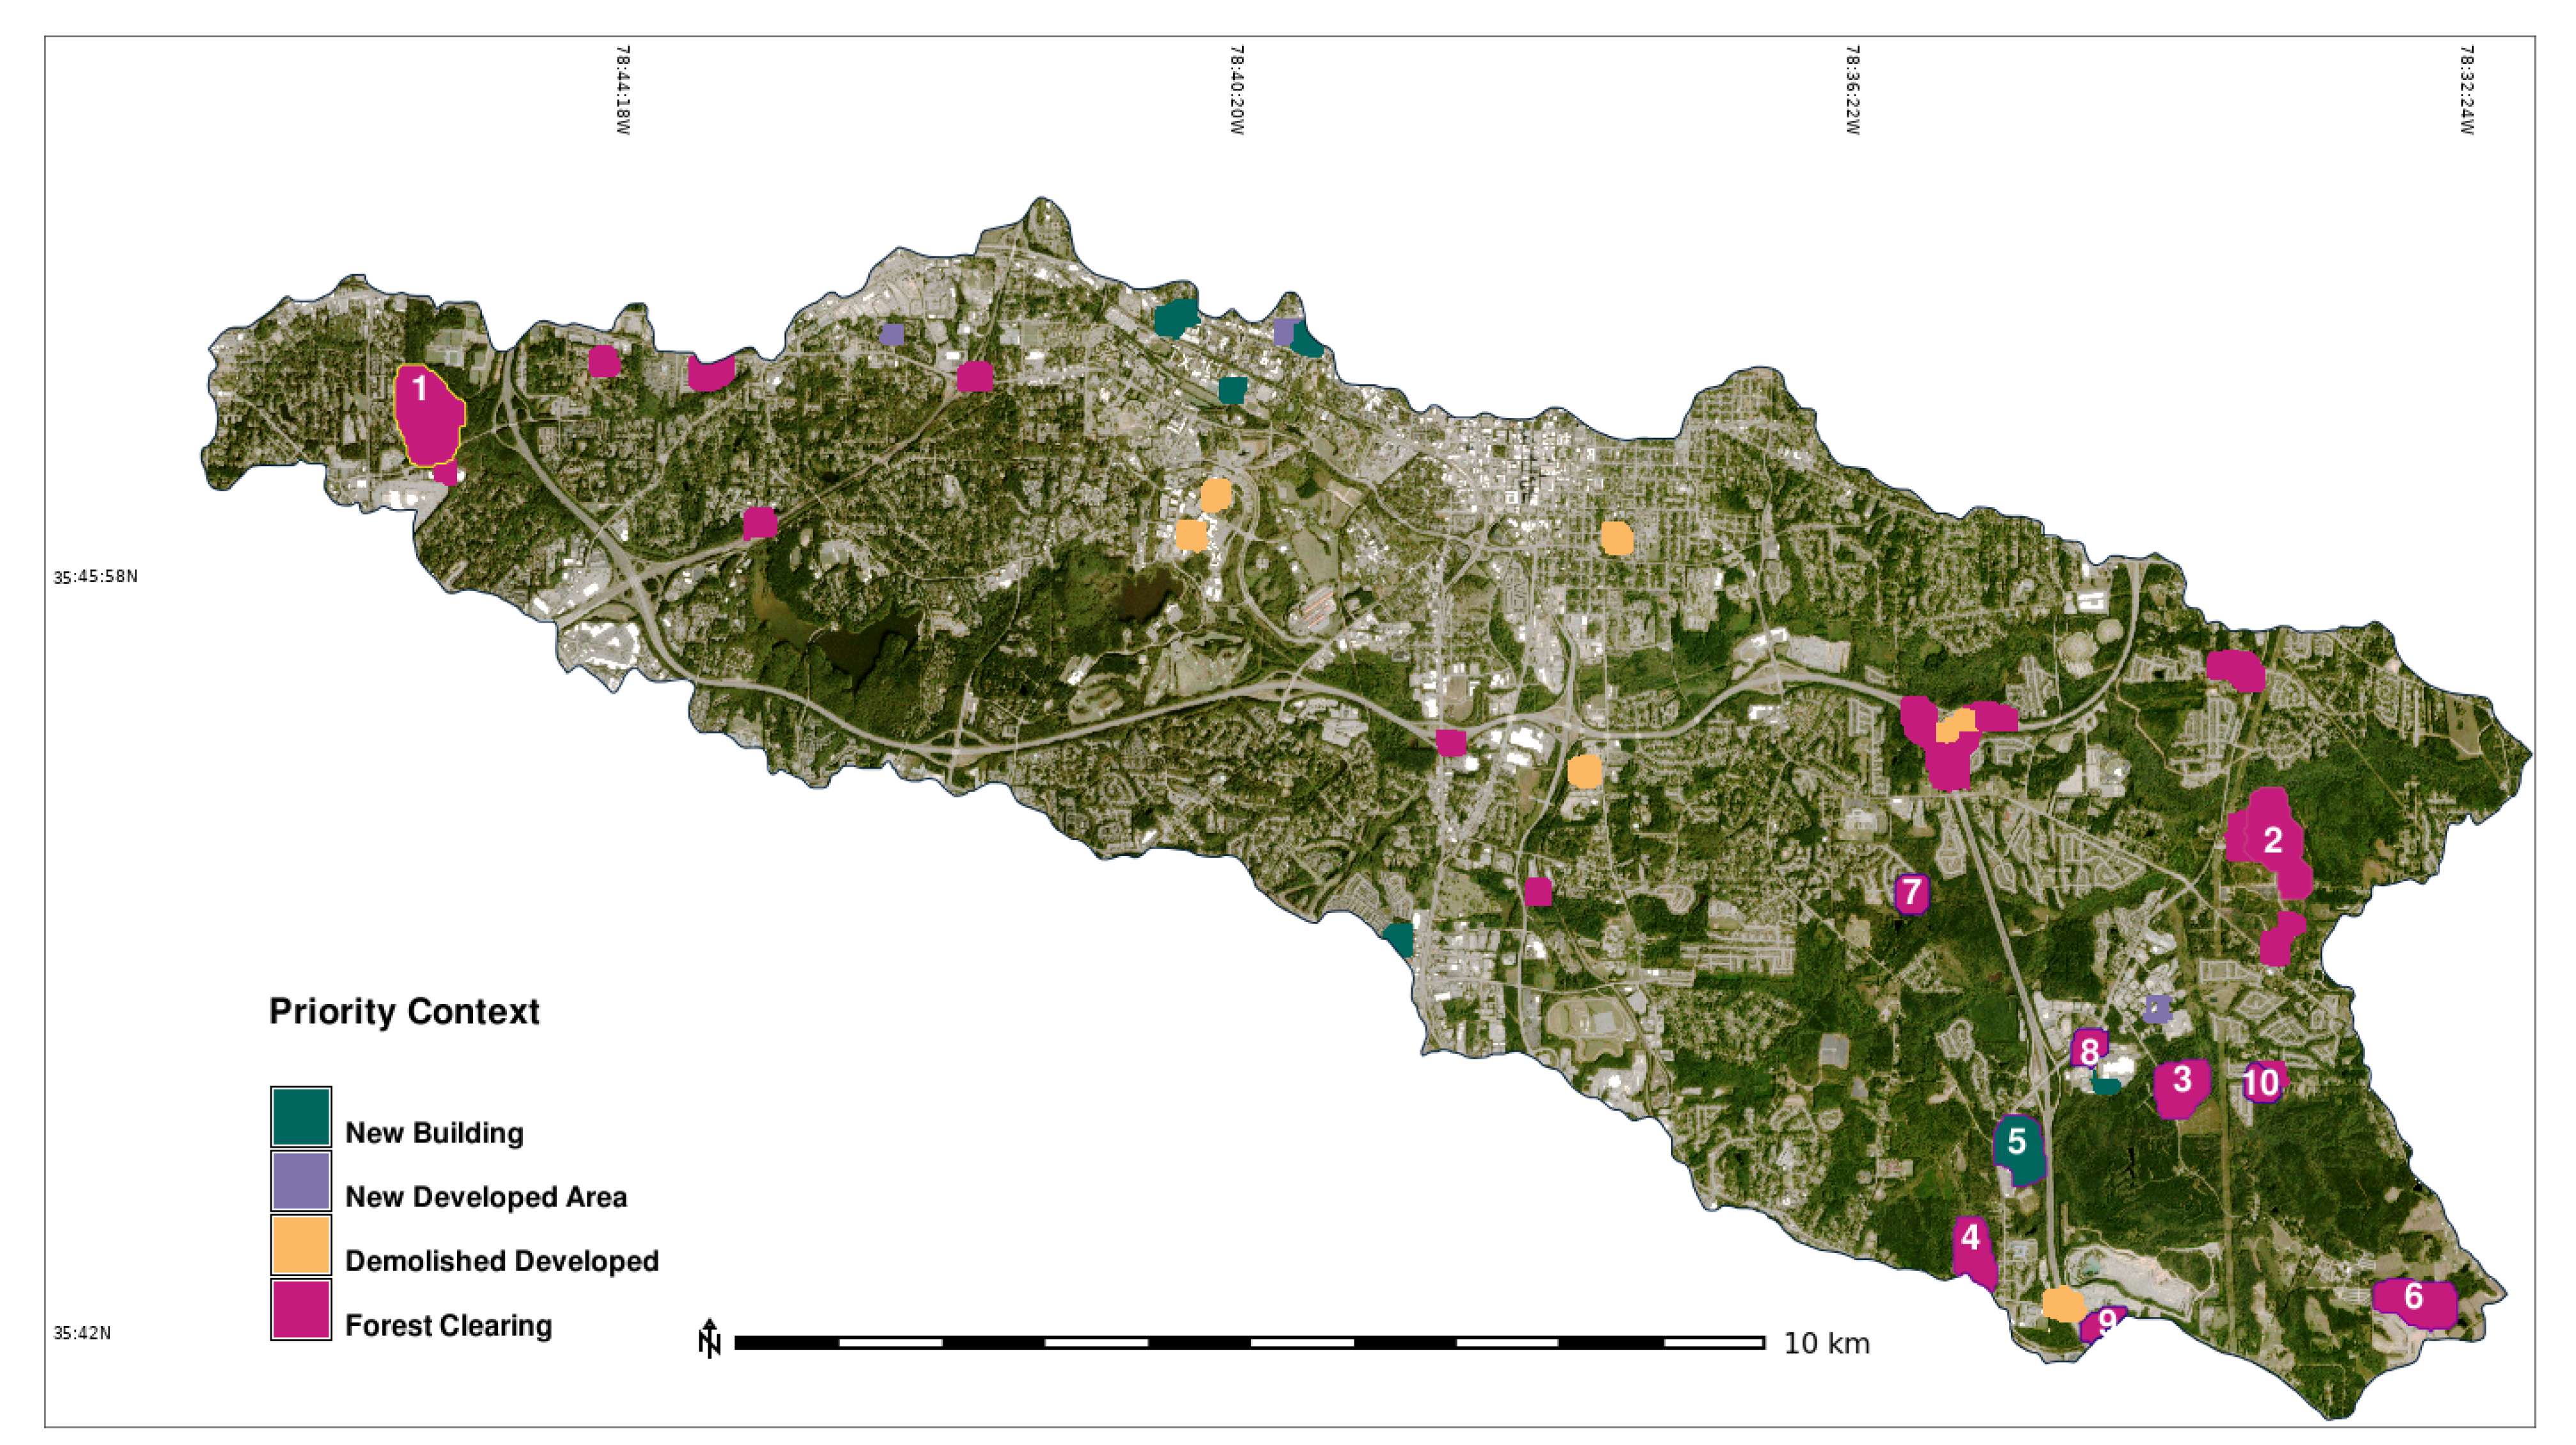
The priority context map revealed that the priority queue identified 26 forest clearings, six new buildings, seven demolished developments, and three newly developed areas (e.g., parking lot). Forest clearings were the most important type of change identified by the priority queue and represent 9 of the top 10 identified locations (Figure 8). New buildings represented the second most highly ranked topographic change detected by the priority queue with an average rank of 20th ± 10 in the priority queue. While demolished developments and newly developed areas were the third and fourth ranked changes detected by the priority queue.
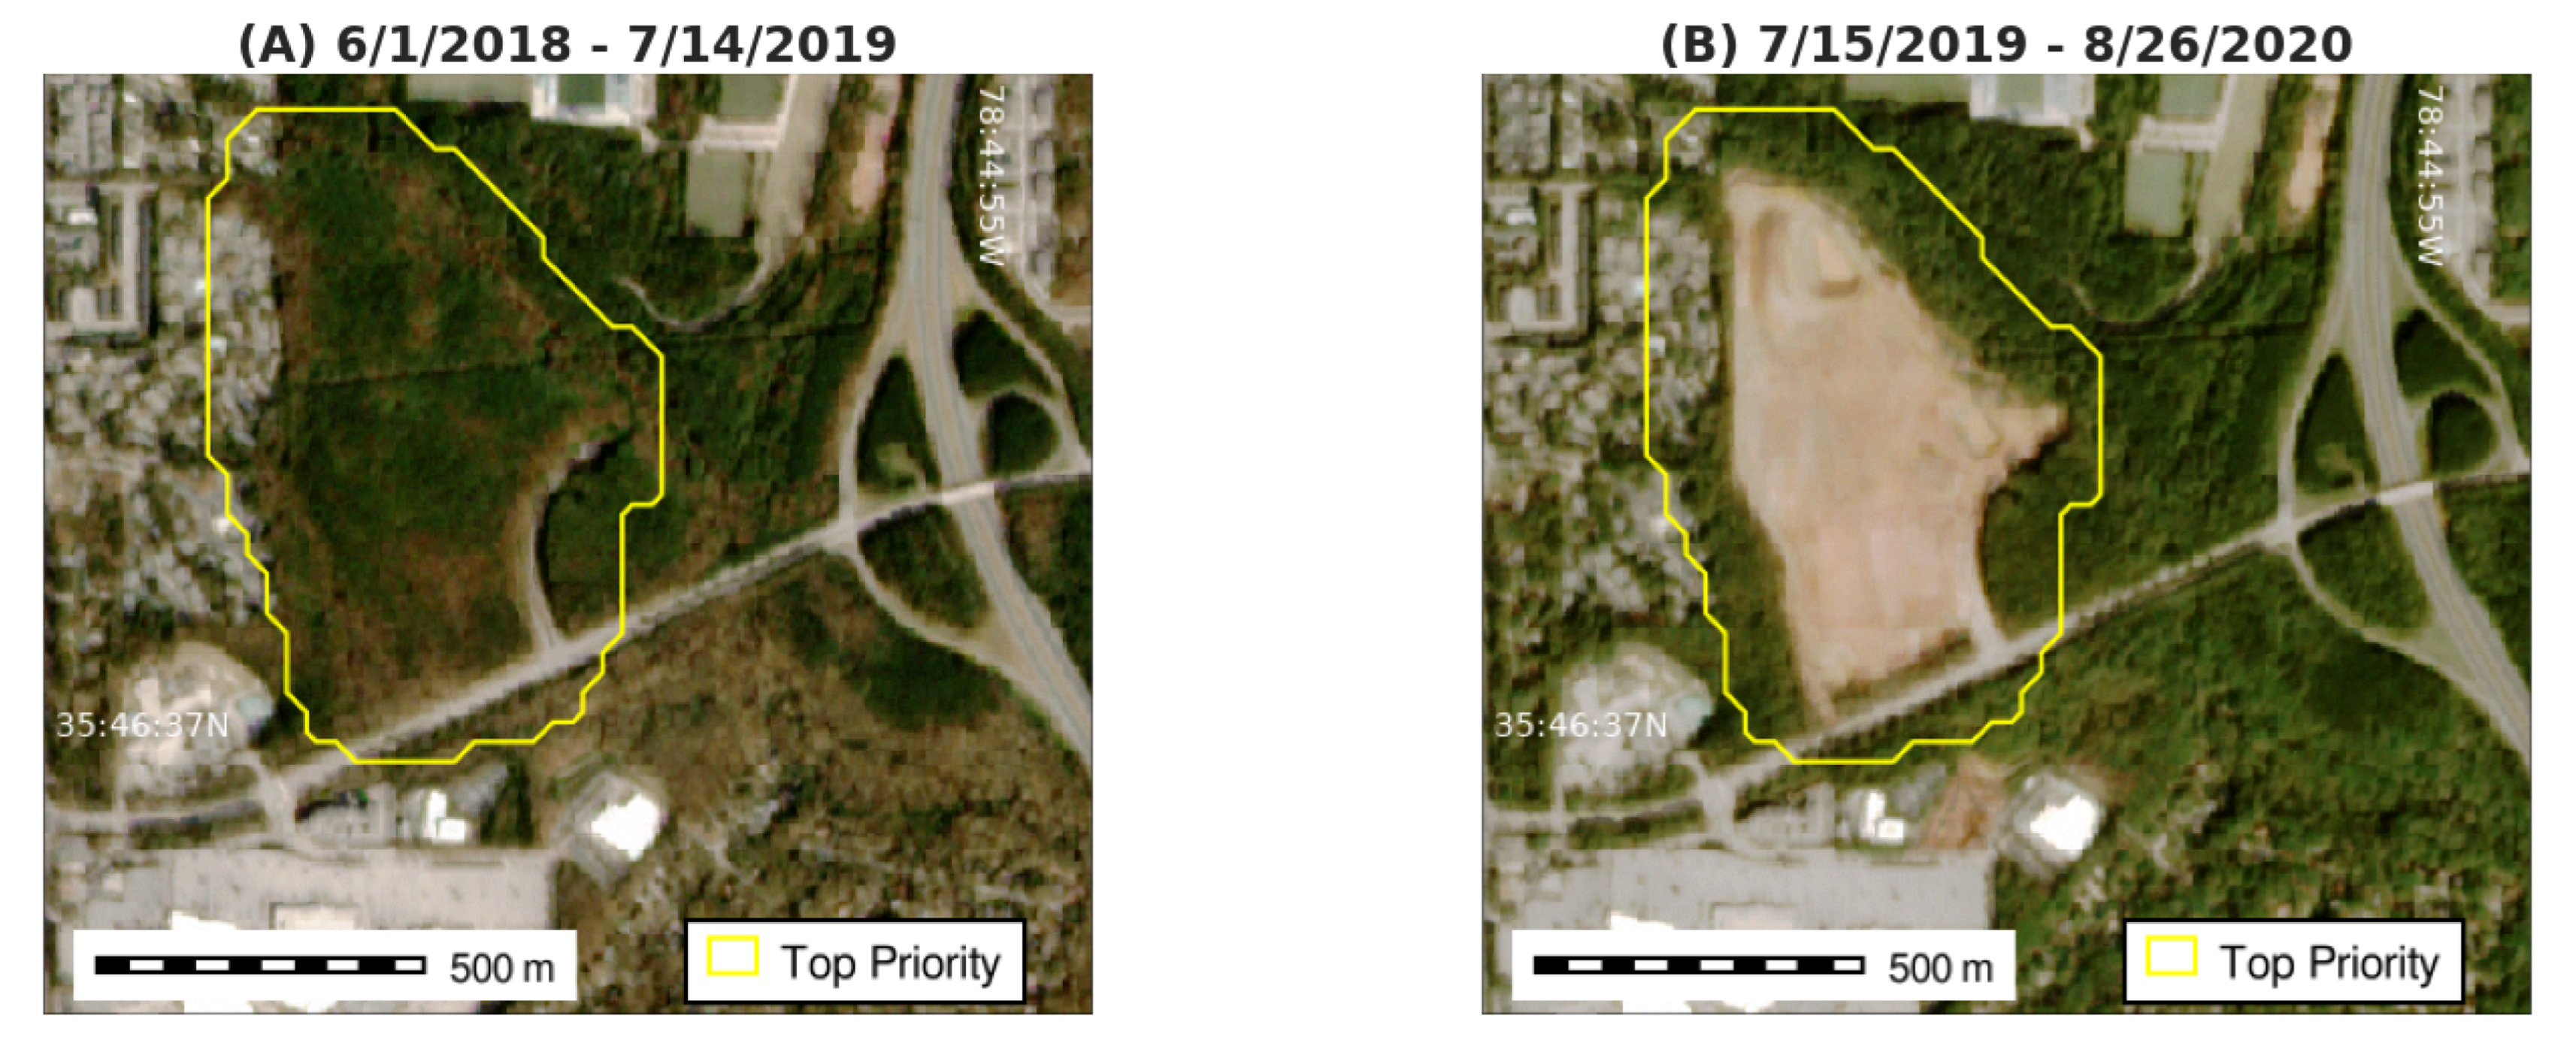
The top priority area (Site 1) was identified as a forest clearing in the western headwater region of the Walnut Creek watershed. Site 1 is planned to be a large multi-purpose development with mixed residential and commercial accommodations, and the construction is scoped to be completed in the Spring of 2022 (Figure 9). The before (1 June 2018–14 July 2019) and after (15 July 2019–26 August 2020) mosaics visually show that the land cover changed from forested to mostly barren. The classification maps identified the change as a 96% decrease in forest land cover to barren, developed, and grass land cover types giving the object a mean priority change value of 5.2. Site 1 had a priority value of one and an area of 0.5 km 2 .

3.3. Updated DEM

Visual analysis of the UAS survey results showed that additional development had occurred since the priority queue was generated (Figure 10). The updated site data contained multiple new structures, retaining walls, and vehicles including large cranes. Two stormwater control ponds that are required to minimize runoff and sediment transport from the construction sites were present in both the Planet imagery and the UAS derived-DEMs.
Resampling the bare earth UAS DEM to 3 m resolution reduced the high level of detail captured in the 15 cm (Figure 11).
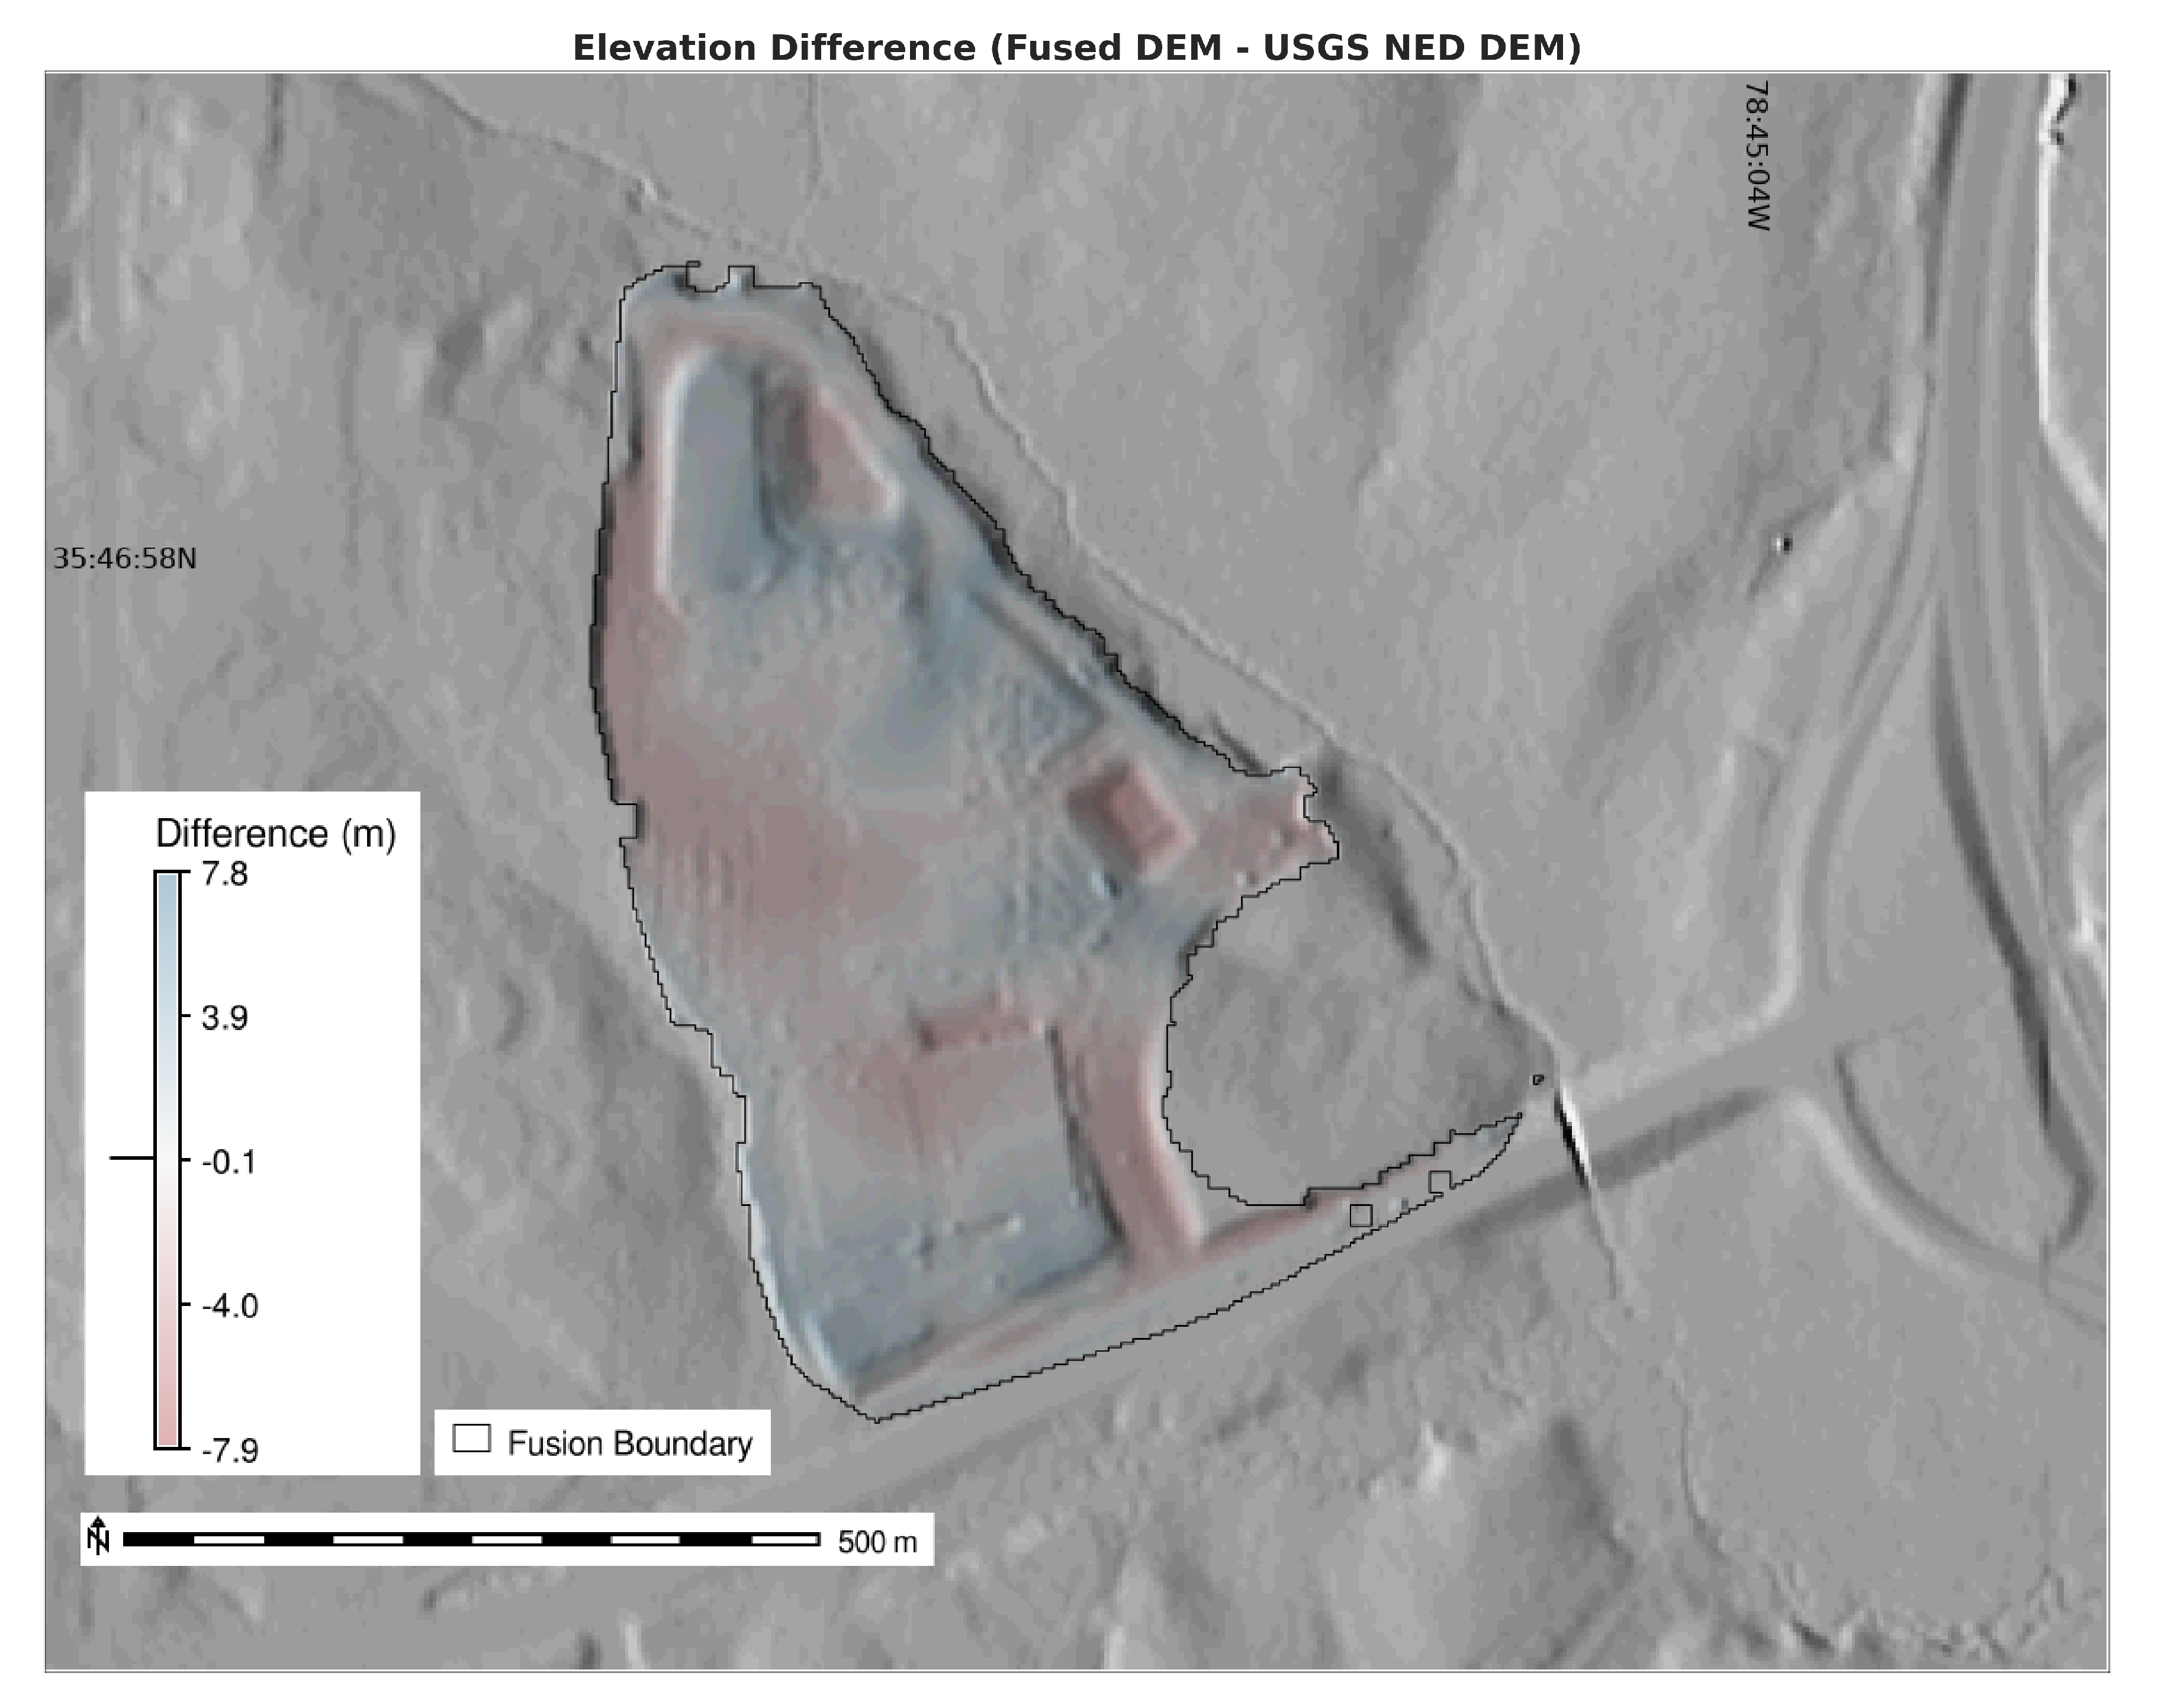
The fused DEM (i.e., UAS DEM fused with the USGS NED DEM) had a mean difference in elevation of 0.12 ± 2.52 m with the USGS NED DEM. Large variations in elevation were due to the cutting and filling of the terrain during construction (Figure 12). The mean edge elevation difference was 0.59 ± 2.61 m, with the greatest edge elevation differences occurring along edges with grading, retention walls, or forest. The fused DEM had a vertical RMSE of 0.5 m and the USGS NED DEM a had RMSE of 3.71 m based on the surveyed stormwater inlet rim elevations (Table A3). The large error in the USGS NED DEM reflects the impact of topographic change on the accuracy of the available DEMs and highlights the need for DEM updates in rapidly developing regions.
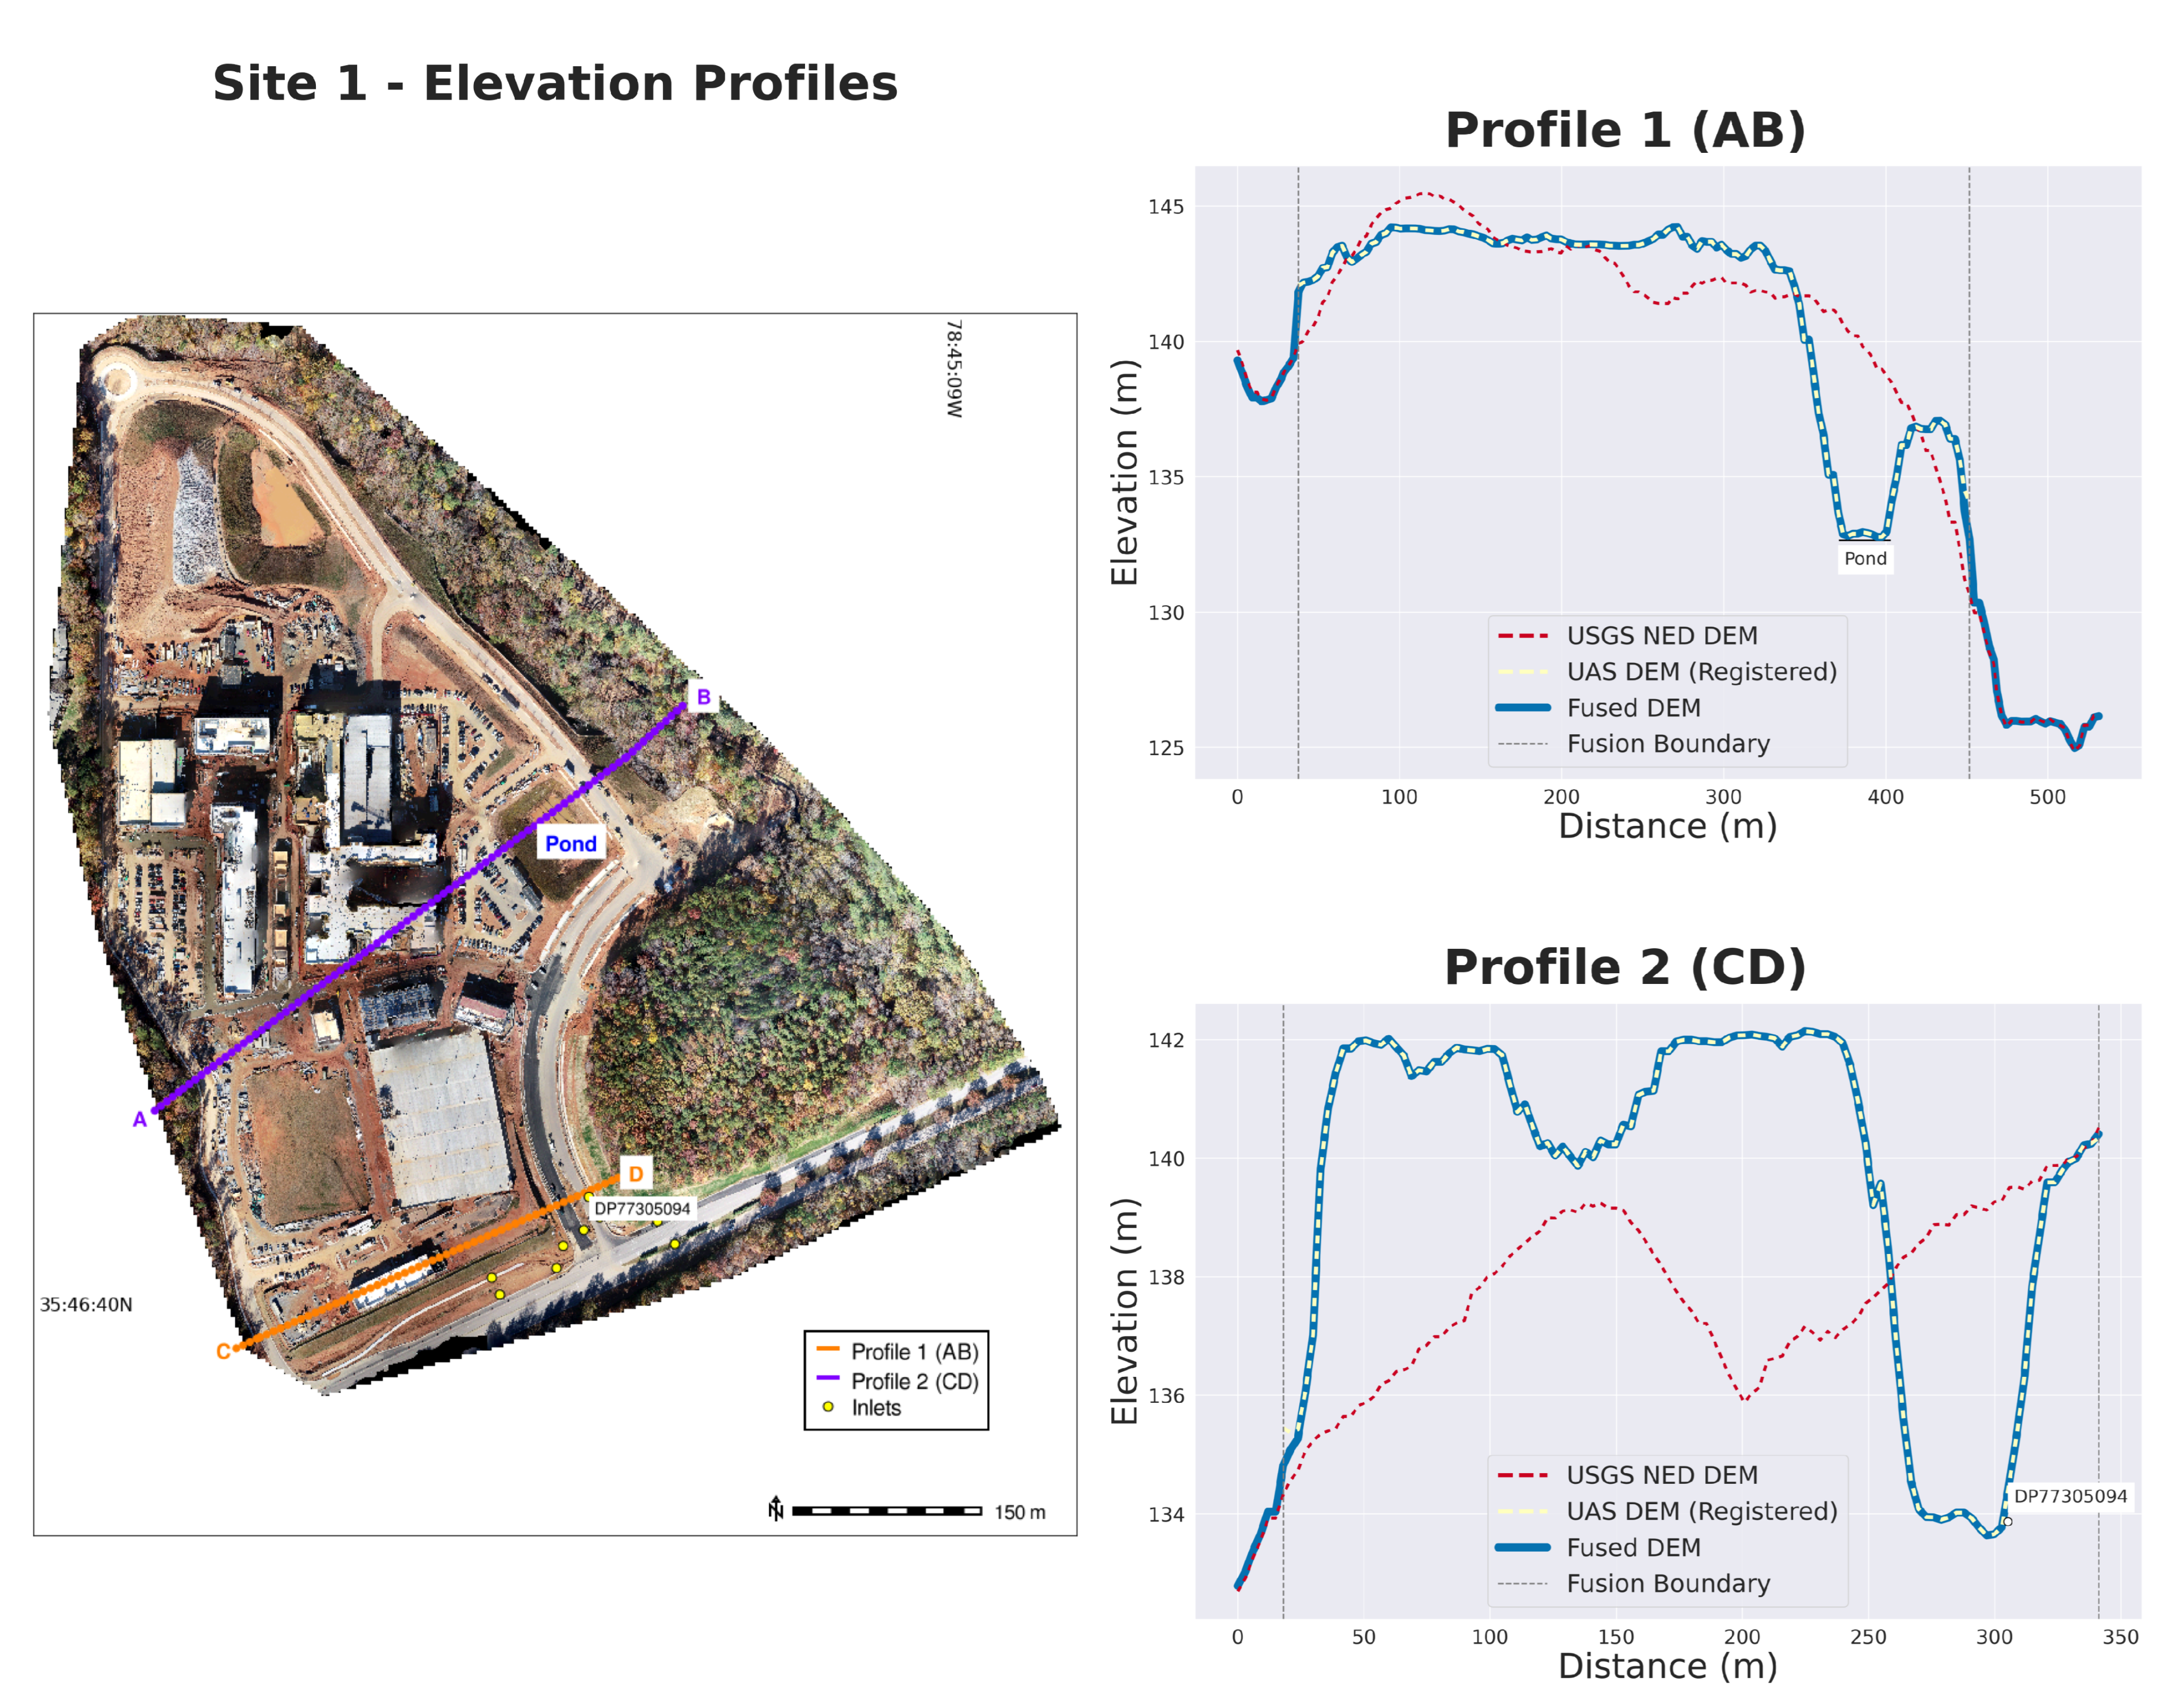
Elevation profiles of the USGS NED DEM, UAS DEM (i.e., registered, but not fused), and the fused DEM were run through two cross-sections of Site 1 (Figure 13). The profiles showed where the fusion process had to make adjustments to compensate for differences between the USGS DEM and UAS DEM. One difference of note occurs near FACILITYID DP77305094 where there was a significant difference ( 5.22 m) between the vertically corrected UAS DEM and the USGS NED DEM where grading had occurred on the hillside.
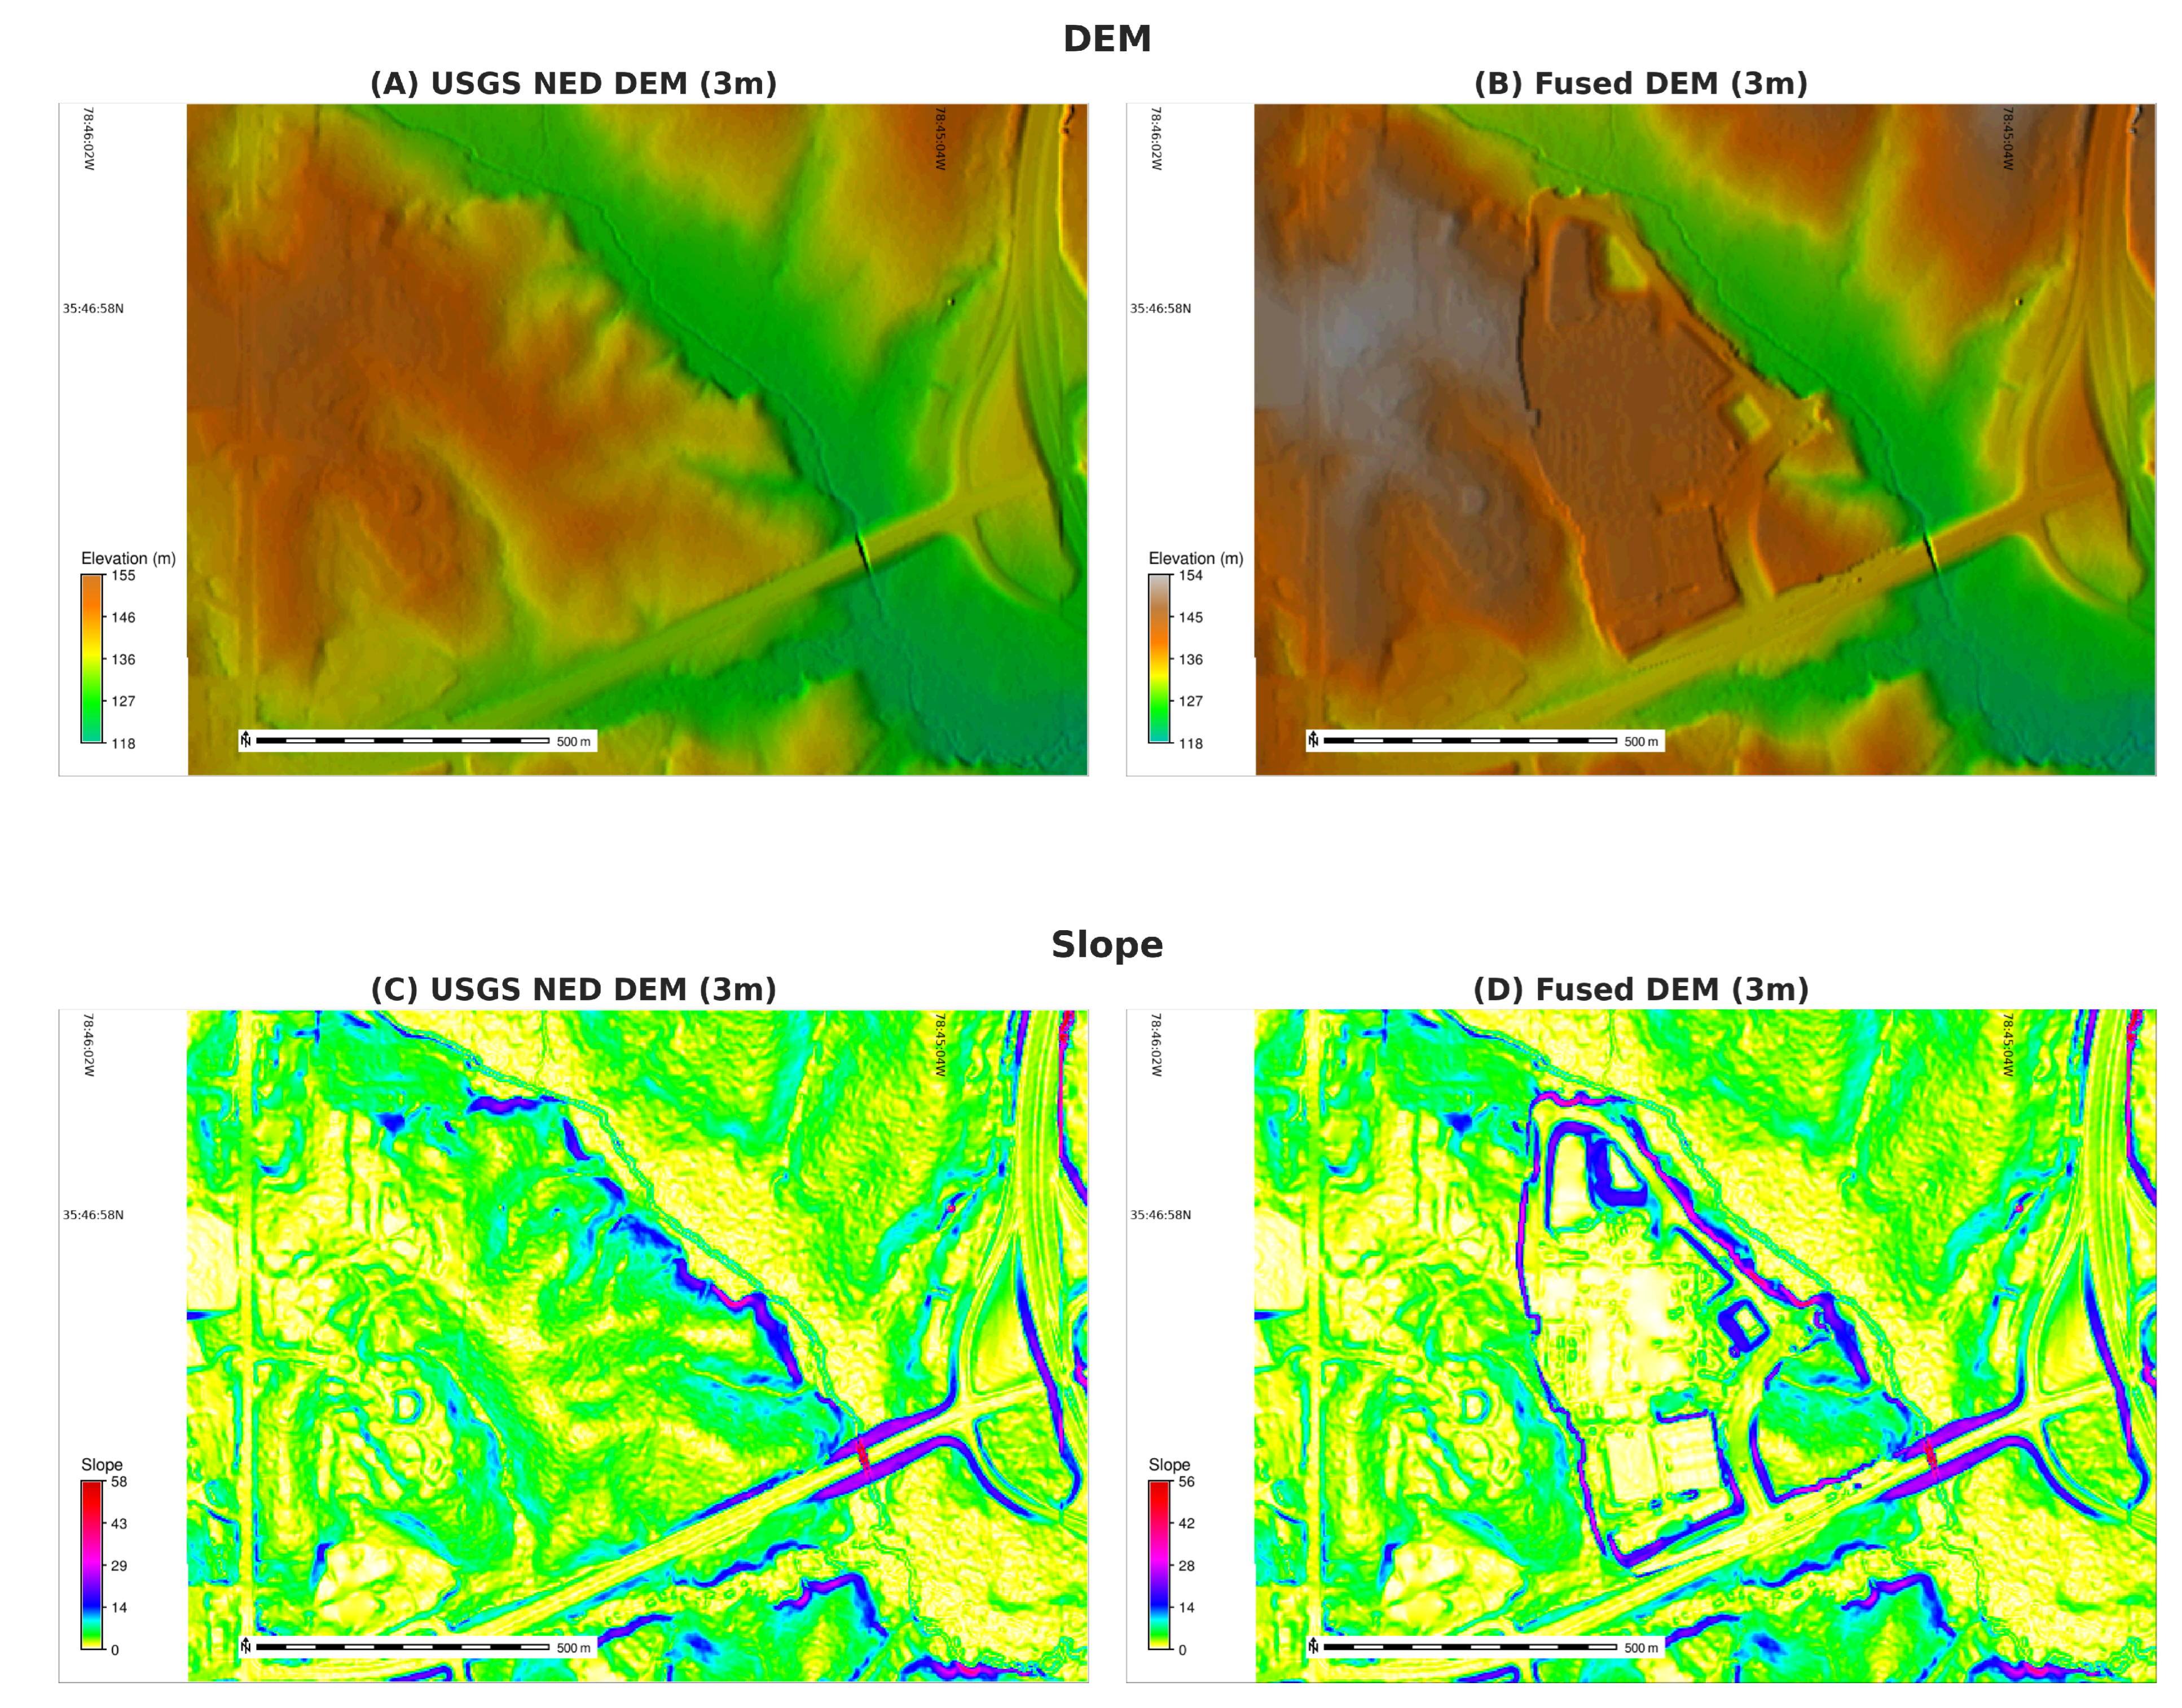
Slope maps derived from the USGS NED DEM and the fused DEM highlight the topographic changes when natural hillslopes with headwater streams are replaced by a flat area with structural features with steep slopes such as sedimentation ponds, cut-slopes, and retaining walls (Figure 14). The slope maps also show were portions of the natural topography were incorporated into the constructed environment with only partial modifications. These topographic changes increased the average slope of Site 1 from 4.59 ± 4.01 to 5.31 ± 6.73 degrees. The results indicated that fused DEM was appropriate to model surface water runoff to explore how the changes to the urban topography modified the urban stream channels and basins.

3.4. Impacts of Urban Topographic Change on Surface Water Runoff

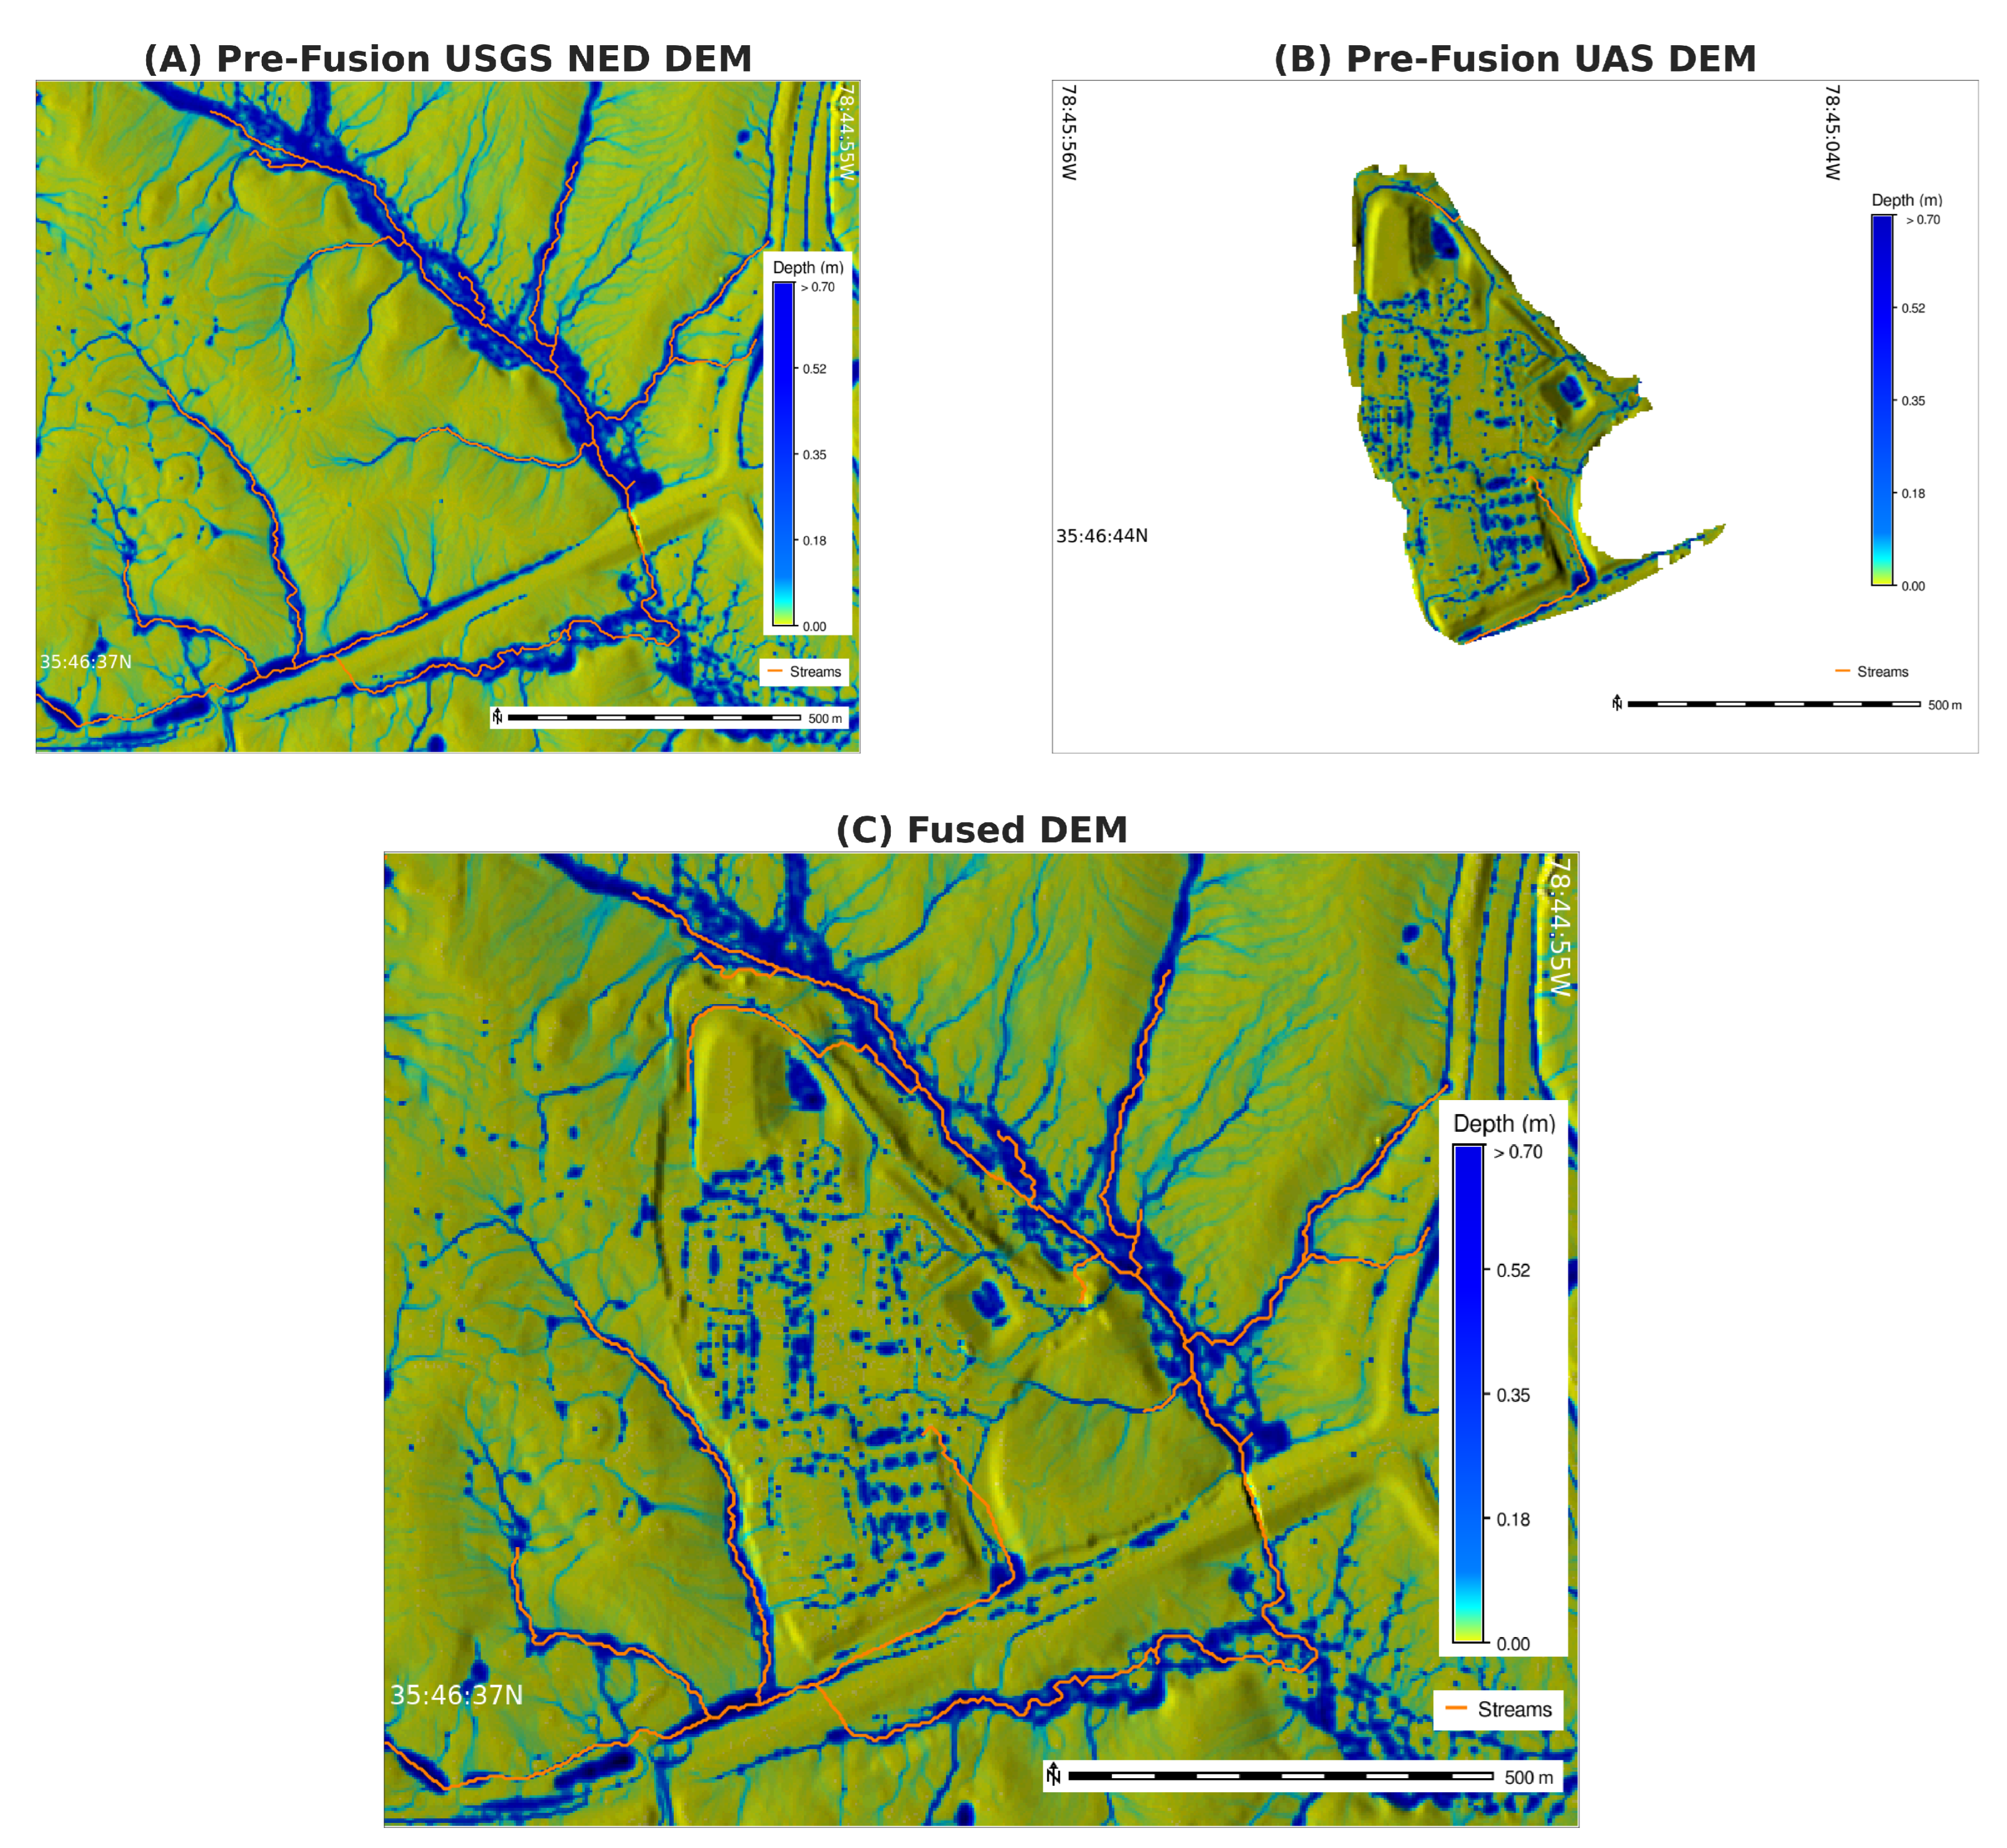
The results of the surface water flow simulation revealed that the flow patterns within the USGS NED DEM (Figure 15A) were significantly modified at Site 1 (Figure 15B). The fused DEM (Figure 15C) shows that the new flow patterns seamlessly transition from the fused area into the existing landscape without artificial accumulation along the fused edges. The simulation highlights the impact of grading on water flow, with water pooling on the graded construction site and capturing surface water runoff in the stormwater control ponds decreasing both the depth and flow rate into Walnut Creek.
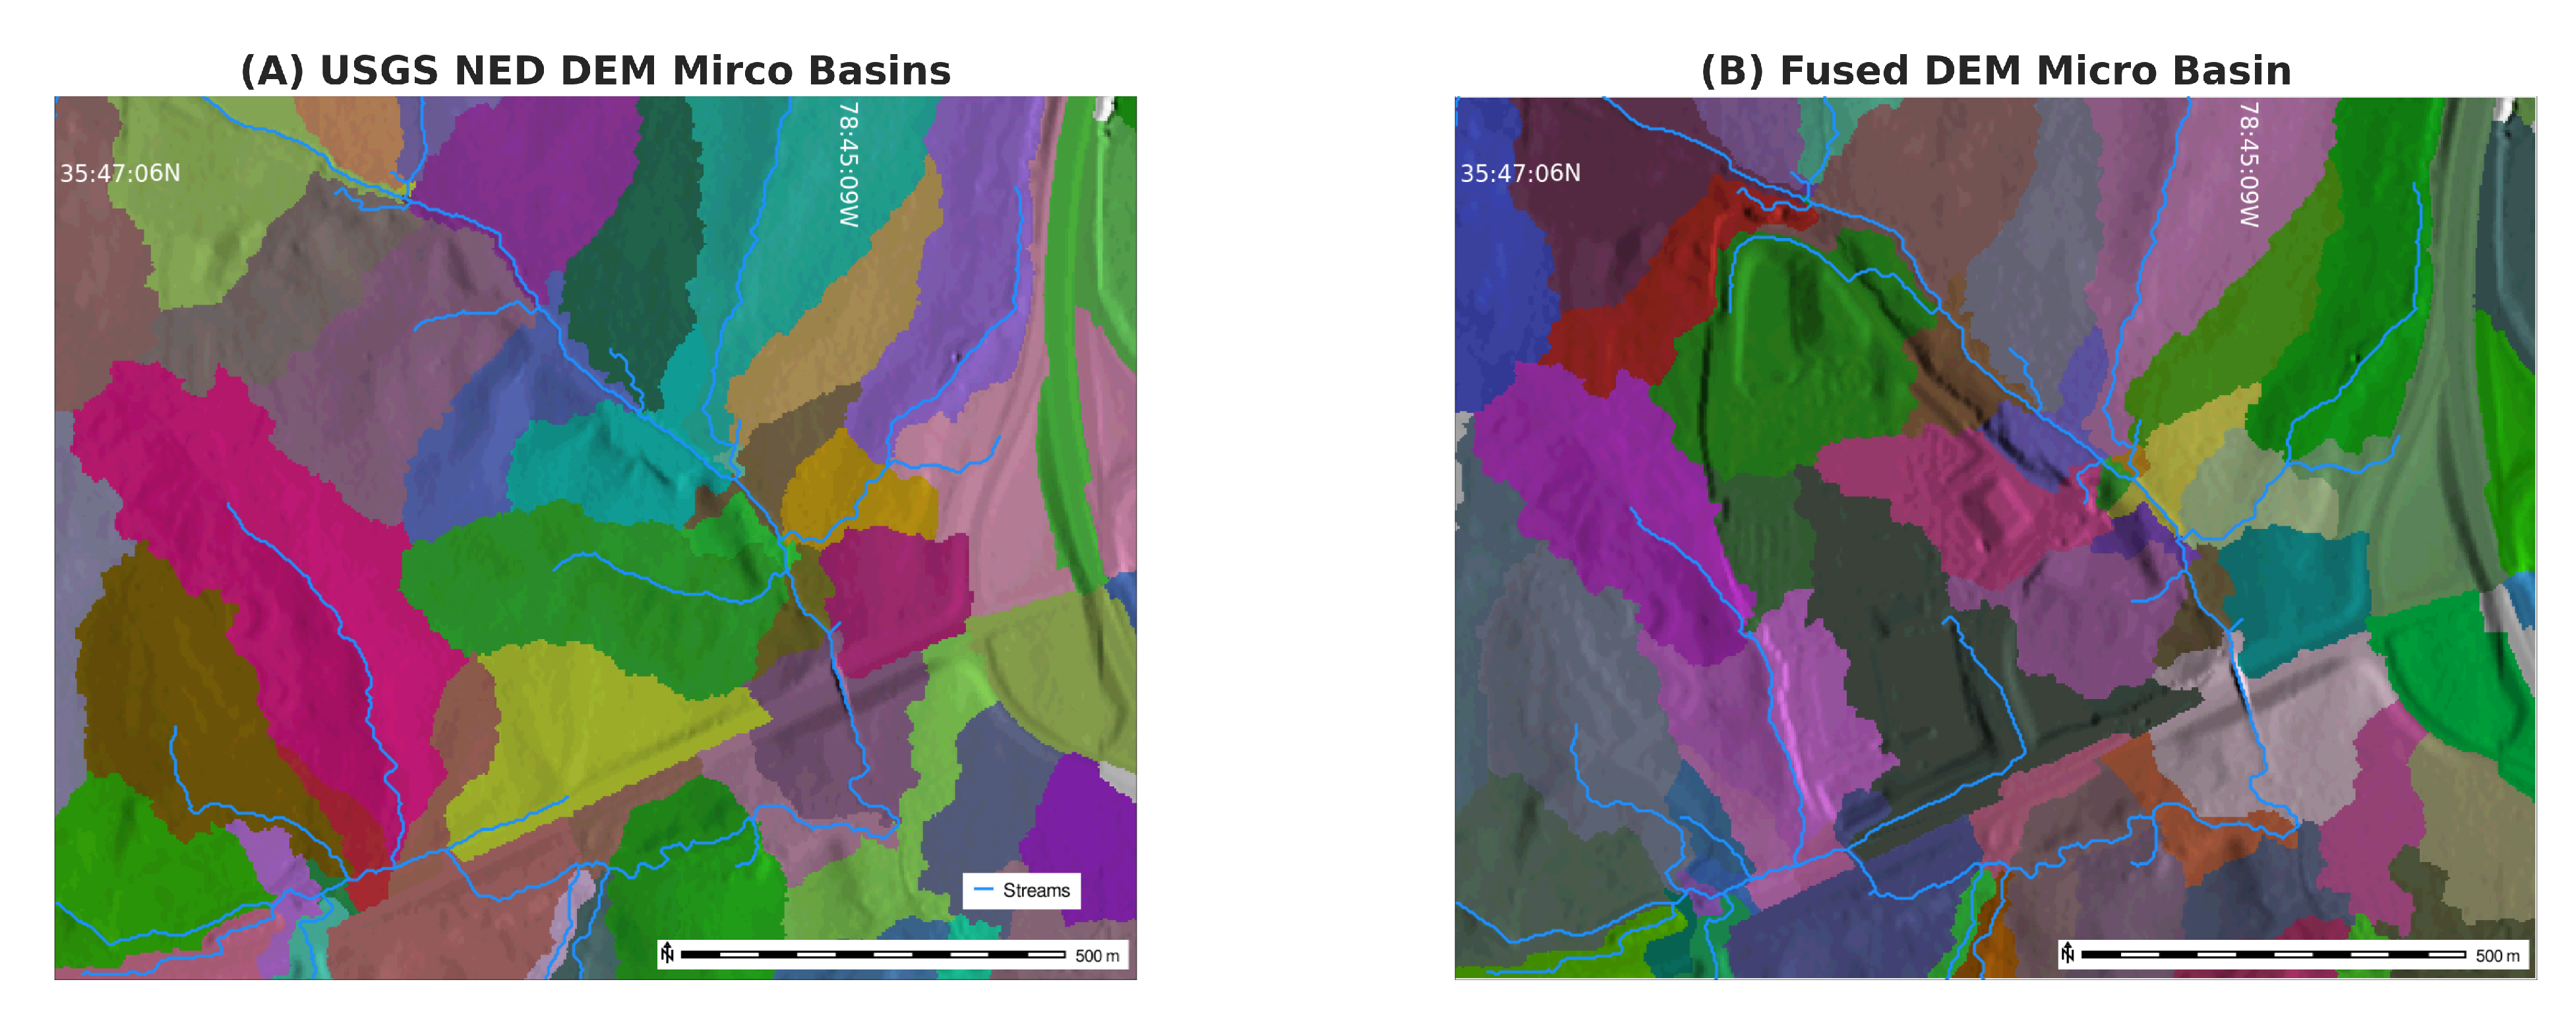
Micro basins derived from the USGS NED DEM and the fused DEM revealed that the development preserved the existing basins’ flow directions even with some modifications to the shape of the basins. The basins derived from the fused DEM outline the contributing areas for each of the stormwater control ponds and areas draining into Walnut Creek or the road on the southern side of Site 1 (Figure 16).

4. Discussion

Rapid-DEM represents a novel framework to identify and contextualize potential topographic change in rapidly developing regions, prioritizing sites to update DEMs with fused UAS data. The case study demonstrated the feasibility of the proposed approach, however, additional improvements in change detection and the priority queue can increase the efficiency and accuracy of the framework.

4.1. Land Cover Classification and Change Detection

Random forest is a well established method for land cover classification [39,55,56] because of its applicability and flexibility, and ability to hand high-dimensional data [57]. Rapid-DEM used a random forest because of its existing implementation in GEE [22] that does not require the use of additional computational resources to train more advanced classification models (e.g., UNET, CNN) [8].
Additionally, the resolution of PlanetScope data (3 m) allowed for either pixel-based or object-based thematic classification. We explored the use of object-based classification in GEE utilizing SNIC (Simple Non-Iterative Clustering) [58] for object segmentation and a random forest for classification, but the preliminary results provided less reliable thematic change and required longer computational run times compared to pixel-based approach. However, different implementations of object-based thematic change detection may out perform the pixel-based approach used in Rapid-DEM.
To reduce sources of error that stem from inaccuracies in the thematic land cover classification improvements could be made in the post-thematic change detection method. One example would be to utilize the high temporal resolution of PlanetScope data to create a dense series of land cover maps and integrate approaches such as hidden Markov models (HMM) to stabilize classifications by limiting noise derived from pixel flipping (i.e., toggling between thematic classes) [59]. While the binary change mask does remove a large proportion of potential error propagated from errors in thematic change detection the mask can potentially exclude important changes. In the case study system several areas of new construction were excluded from the priority queue because they were not identified by the change mask. Additionally, alternative approaches or improvements to post-classification thematic change detection could be used to detect topographic change. For example, methods used to generate DEMs directly from remotely sensed imagery [60,61].

4.2. Priority Queue

The presented case study demonstrated how an urban topographic change was detected and prioritized for UAS-based fusion with existing USGS NED DEM data. The priority queue identified and ranked 109 areas representing 1.5% of the Walnut Creek Watershed by importance with 47% accuracy that was increased to 90.5% by the use of median filters. The main causes of error found in the priority queue were small polygons generated when converting the raster priority queue to a vector polygon, variations in spectral responses from building rooftops, and seasonal variation of the tree canopy. These results indicate that a higher threshold could be set to remove small objects from the binary change mask before object prioritization.
In future work the priority queue could also be expanded to give more detailed insights into the specific type of change (e.g., construction phase), tracking progress over time, and use of other methods such Multi-Criteria Decision-Making (MCDM) and analytic hierarchy process (AHP) could be explored [62]. Participatory approaches could also be implemented by allowing diverse stakeholders to co-weight the priority change and priority context tables. The approaches would examine using a grassroots (bottom-up) approach to site prioritization compared to the current method, which utilized expert knowledge (top-down) [4]. However, regardless of the prioritization method used the results from the priority queue should be assessed to ensure that the most important changes to the urban topography are represented. Conceptually, Rapid-DEM provides modular flexibility that allows researchers to implement their classification models to perform thematic classification and set prioritization transition weights in the priority change table. Some examples of different use cases include priority changes in forest or agricultural land cover or changes due to natural disasters (e.g., landslides, tornadoes).

4.3. Data Acquisition and Fusion

Site 1 presented multiple challenges for UAS-surveying and fusion. These challenges included the size of the site, limited access to surveyed reference points, and a large vertical shift caused by an ellipsoid/datum difference between the UAS (i.e., Phantom 4 Pro) and USGS NED DEM. Additionally, the DTM generated with SfM in WebODM was not a true DTM because it still contained remnants of tree canopies and buildings, which needed to be removed in preparation for fusion. However, even with these less than ideal circumstances, the fused DEM provided a more accurate representation of the topography than the outdated NED DEM as confirmed by comparison with a limited number of available surveyed points. While GCPs are helpful for validation, these results are in agreement with other studies indicating that they are not essential for accurate topographic modeling [45].
However, the fused DEMs accuracy is lower than the accuracy required for the source data of the USGS NED DEM (RMSE < 0.25 m) [63,64]. Regardless, our rapid low-cost approach still had a lower RMSE than the USGS NED DEM ( 3.36 m), indicating that the fused DEM successfully captured the changes identified by the priority queue. The large RMSE of the USGS NED DEM computed using the surveyed stormwater inlets located within the newly constructed landscape reflects significant topographic modifications caused by the site grading. The areas with large edge elevation differences between the UAS DEM and USGS NED DEM are the most likely to contain distorted elevations from the fusion smoothing process. In future work parameter optimization of the fusion module will help minimize morphological distortions.

4.4. DEM Updates

Rapid-DEM presents opportunities for government or non-profit organizations to implement an API to crowd-source patch DEM updates improving national and statewide DEM databases. The dataset could be filtered by date and return the most updated DEM mosaics for a requested area. Validation methods should be implemented similar to other systems such as OpenTopography (https://opentopography.org/data/contribute, accessed on 6 December 2021) [26]. Additionally, the fused DEM could be added in either a stable state (i.e., post-construction) or during a period of disturbance to create a robust spatial–temporal dataset of topographic change.

4.5. Additional Applications of Rapid-DEM

Rapid-DEM could be developed outside of GEE using other open-source cloud-based geoprocessing solutions such as GRASS GIS’s Actinia (https://actinia.mundialis.de/, accessed on 6 December 2021) [65] or GeoTrellis (https://geotrellis.io/, accessed on 6 December 2021). In future work Rapid-DEM will be developed into an open-source application to provide an accessible method to update DEMs. The complete application could be configured to a specific location as a semi-automated service that continuously updates the priority queue and context for a given time interval (e.g., monthly, quarterly). As priority areas are updated with UAS-based data fusion the priority queue is updated moving the next highest priority location into its place. Over time a time series of location priority and context will produce a robust database of land change phases that may provide additional insights into local development trends. The fusion method [18] is also under development as a standalone plugin for WebODM [24].

5. Conclusions

The Rapid-DEM framework demonstrated the feasibility of prioritized DEM updates by combining satellite-based change detection with consumer-grade UAS mapping and open-source DEM fusion. The framework provides tools for addressing the availability of up-to-date elevation data in areas with changing topography, such as rapidly developing urban areas where the proposed priority queue helps to direct the mapping and updates to sites with the highest impact. The case study highlighted the importance of updated DEMs for modeling surface water flow. We consider this framework a first step in developing a robust, continuous DEM updating system that can be broadly deployed to capture dynamic landscapes beyond urban regions, such as coastal areas affected by storms and sea-level rise. As the computational resources, data storage, and UAS become more affordable, open-source platforms like Rapid-DEM can enable equitable access to up-to-date DEM data reducing uncertainty in model based decision-making.

Supplementary Materials

The following are available online at https://www.mdpi.com/article/10.3390/rs14071718/s1, Report S1: WebODM UAS Flight Report.

Author Contributions

Conceptualization, C.T.W. and H.M.; methodology, C.T.W., W.R, A.P., H.M.; software, C.T.W., A.P.; validation, C.T.W., H.M., W.R. and A.P.; formal analysis, C.T.W.; investigation, C.T.W.; resources, C.T.W., W.R.; data curation, C.T.W., W.R.; writing–original draft preparation, C.T.W.; writing–review and editing, C.T.W., W.R., A.P., R.K.M., H.M.; visualization, C.T.W.; supervision, H.M., R.K.M.; project administration, C.T.W. and H.M.; funding acquisition, H.M., R.K.M. All authors have read and agreed to the published version of the manuscript.

Funding

This research was funded by the National Science Foundation grant number 1737563.

Institutional Review Board Statement

Not applicable

Informed Consent Statement

Not applicable

Data Availability Statement

The data presented in this study are openly available in Open Science Foundation repository Rapid-DEM at DOI 10.17605/OSF.IO/YG6H8 [66].

Conflicts of Interest

The authors declare no conflict of interest.

Abbreviations

The following abbreviations are used in this manuscript:
UASUnmanned Aerial System
DEMDigital Elevation Model
DSMDigital Surface Model
DTMDigital Terrain Model
GCPGround Control Point
SfMStructure from Motion
OSMOpenStreetMap
ODMOpen Drone Map
GBQGoogle BigQuery
GCSGoogle Cloud Storage
GEEGoogle Earth Engine

Appendix A

Appendix A.1. Priority Context Table

Table A1. Priority Context Table: Land cover transitions listed as NA were land cover transitions types labeled as noise.
From/ToRoadBuildingDevelopedBarrenGrassForest
RoadNANANANANANA
BuildingNANANoiseDemolished BuildingNANA
DevelopedNew RoadNew BuildingNADemolished DevelopmentNANA
BarrenNew RoadNew BuildingNew Developed AreaNANANA
GrassNANew BuildingNew Developed AreaField/BarrenNANA
ForestNANAForest ClearingForest ClearingNANA

Appendix A.2. WebODM Processing Parameters

Table A2. WebODM Processing Parameters.
ParameterValue
dem-gapfill-steps5
dem-resolution15
depthmap-resolution1280
feature-qualityultra
ignore-gsdtrue
pc-classifytrue
pc-geometrictrue
pc-qualityultra
pc-rectifytrue
pc-sample0.3
smrf-scalar3
smrf-slope1.2
smrf-threshold2
smrf-window400

Appendix A.3. UAS DSM to UAS DEM Processing Steps
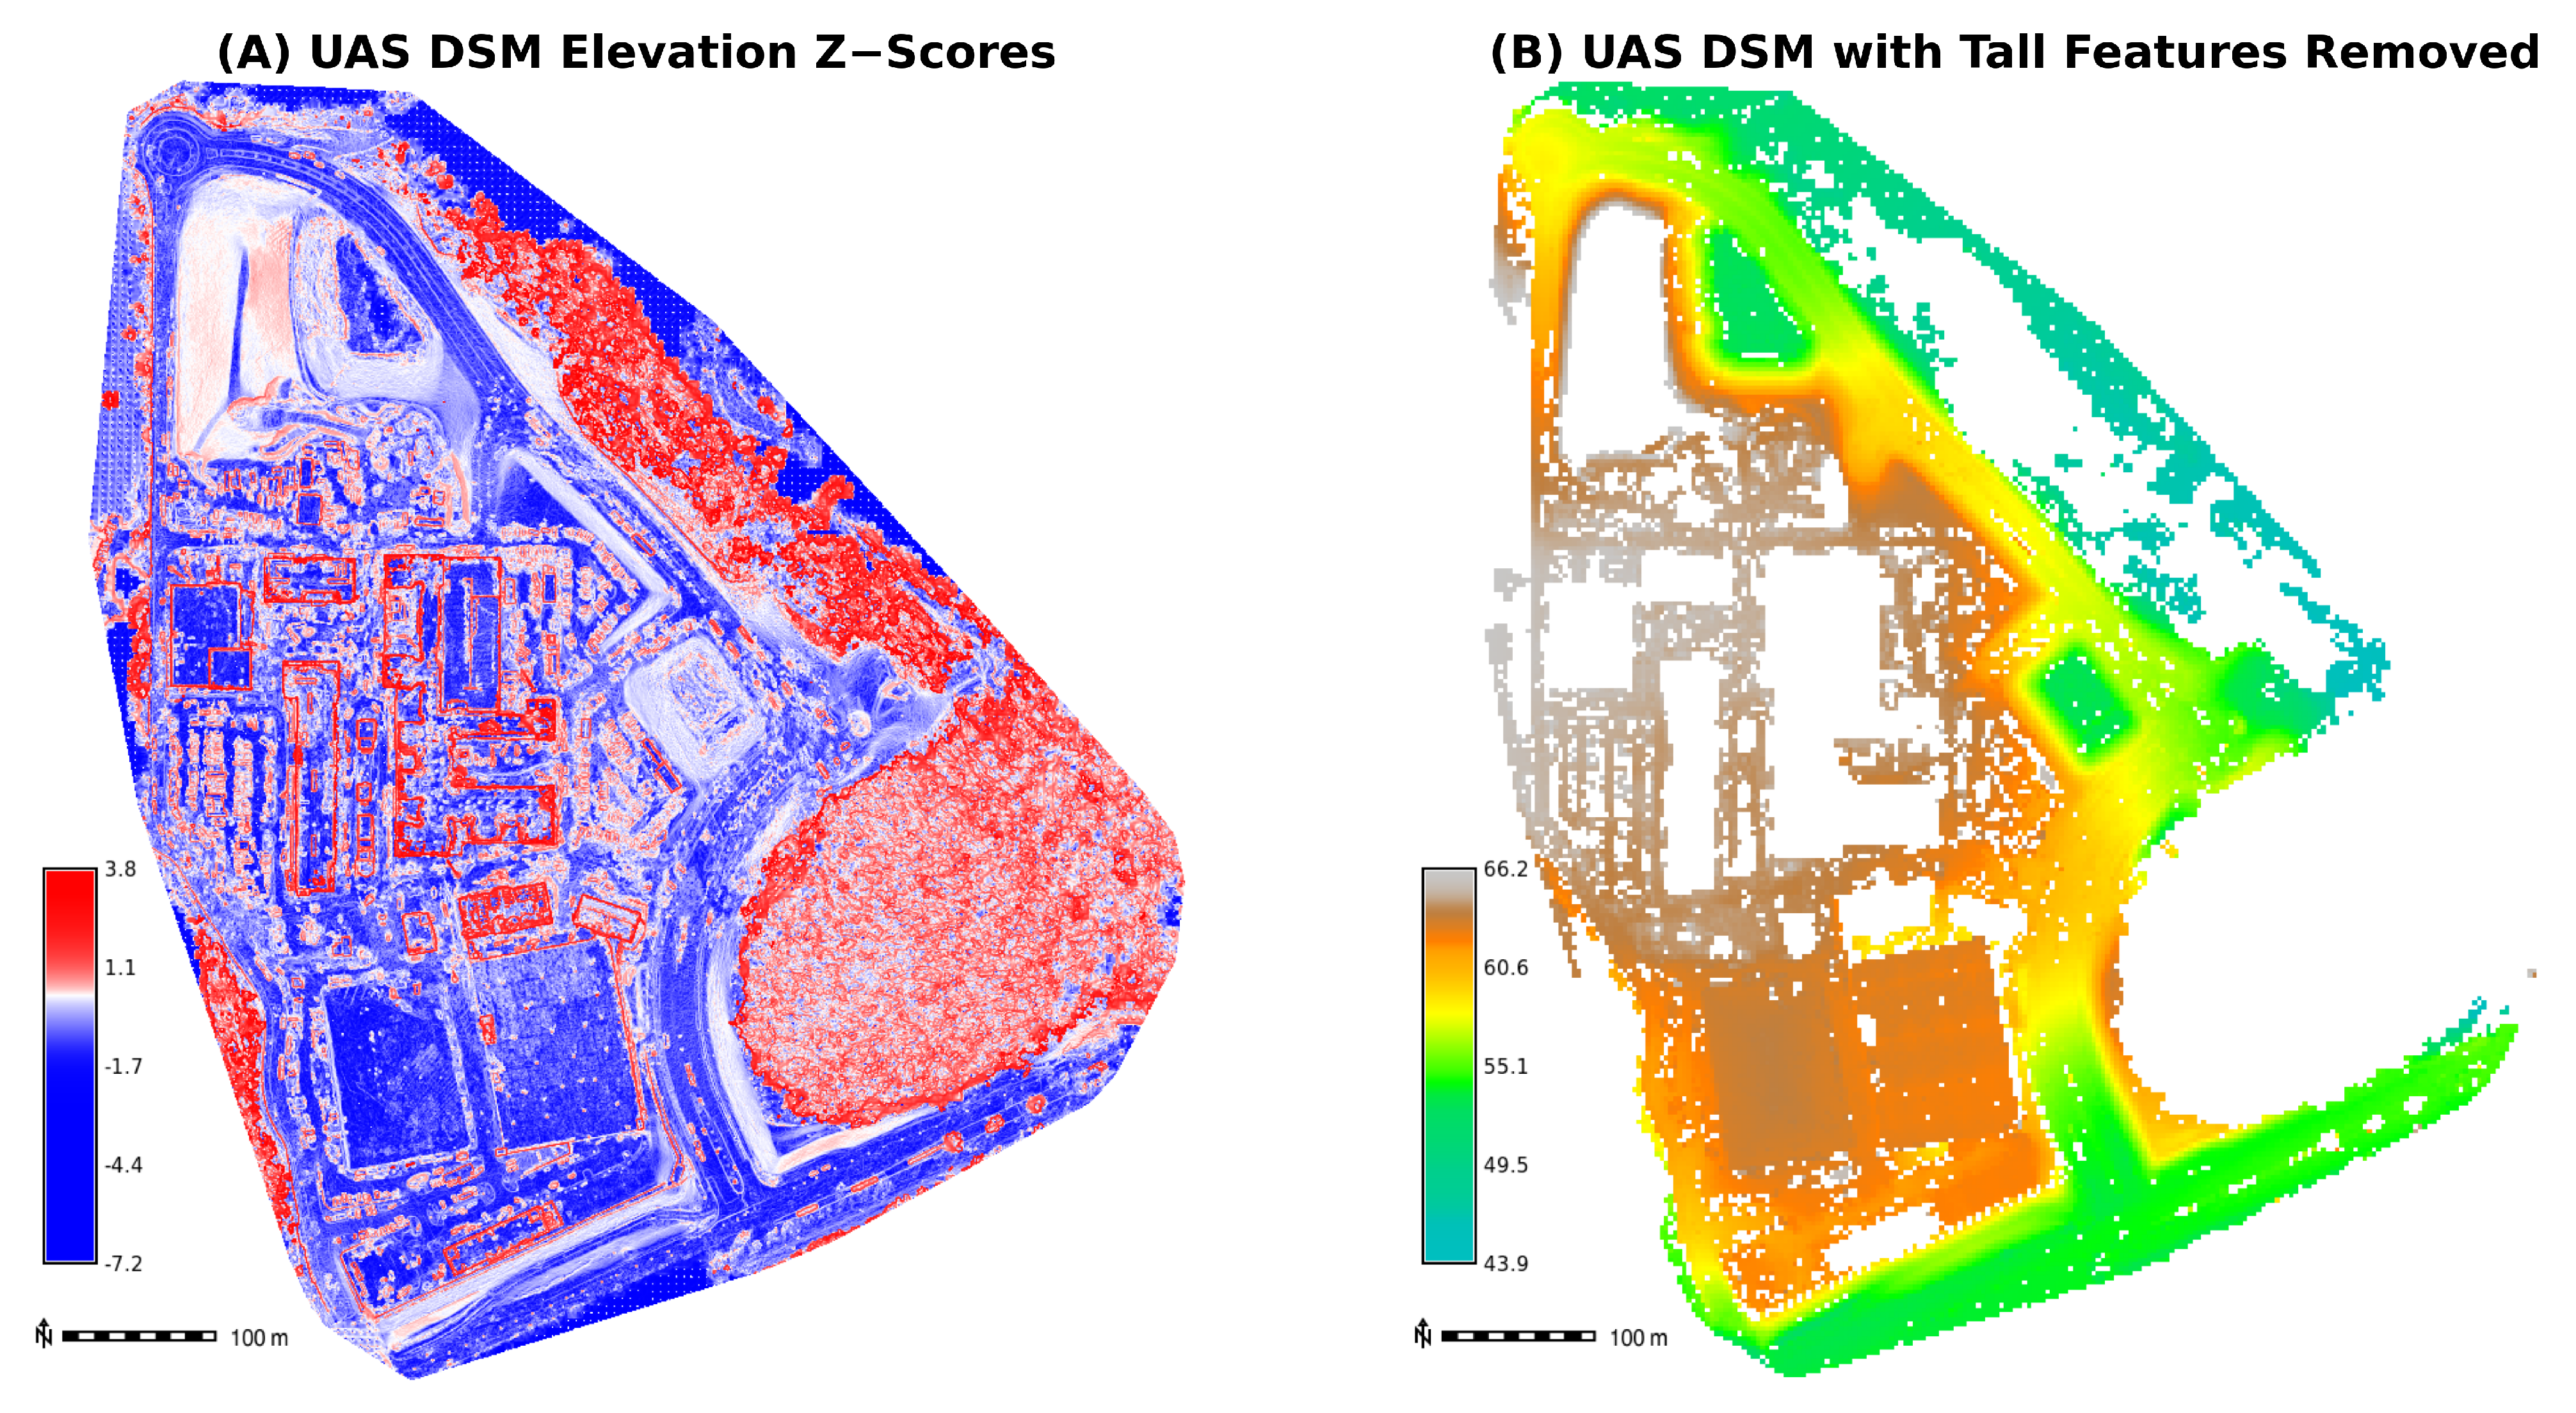
Figure A1. A bare earth DEM of the UAS data was created by hierarchically filtering tall features from the UAS DEM based on their z-score (A). The resulting DSM (B) contained holes where vegetation, buildings, and vehicles were removed that were filled through using regularized spline interpolation.
Remotesensing 14 01718 g0a1

Appendix A.4. Stormwater Rim Elevations Table

Table A3. Details report from surveyed stormwater inlet rim elevation used for DEM z-axis validation. Facility ids are unique tags used by the Town of Cary, North Carolina to track utility assets.
FACILITYIDInlet ElevUSGS DEMDiffUAS DEMDiffFused DEMDiff
DP77305061132.66133.52−0.86133.45−0.79133.45−0.79
DP77306010133.38138.39−5.01134.14−0.75134.14−0.75
DP77306019134.50133.870.63134.360.15134.360.15
DP77305094133.87139.08−5.21133.660.22133.660.22
DP77306020133.61138.39−4.78133.63−0.02133.63−0.02
DP77305095133.74137.71−3.97133.77−0.04133.77−0.04
DP77305096133.58136.83−3.25133.79−0.21133.79−0.21
DP77305093132.96135.74−2.78133.78−0.82133.78−0.82
RMSE 3.71 m 0.50  m 0.50  m

References

  1. UN. Secretary-General. In Progress towards the Sustainable Development Goals: Report of the Secretary-General; UN: New York, NY, USA, 2019. [Google Scholar]
  2. Vogler, J.B.; Vukomanovic, J. Trends in United States Human Footprint Revealed by New Spatial Metrics of Urbanization and Per Capita Land Change. Sustainability 2021, 13, 12852. [Google Scholar] [CrossRef]
  3. Zhu, C.; Li, Y. Long-Term Hydrological Impacts of Land Use/Land Cover Change from 1984 to 2010 in the Little River Watershed, Tennessee. Int. Soil Water Conserv. Res. 2014, 2, 11–21. [Google Scholar] [CrossRef] [Green Version]
  4. White, C.T.; Mitasova, H.; BenDor, T.K.; Foy, K.; Pala, O.; Vukomanovic, J.; Meentemeyer, R.K. Spatially Explicit Fuzzy Cognitive Mapping for Participatory Modeling of Stormwater Management. Land 2021, 10, 1114. [Google Scholar] [CrossRef]
  5. Eggimann, S.; Mutzner, L.; Wani, O.; Schneider, M.Y.; Spuhler, D.; Moy de Vitry, M.; Beutler, P.; Maurer, M. The Potential of Knowing More: A Review of Data-Driven Urban Water Management. Environ. Sci. Technol. 2017, 51, 2538–2553. [Google Scholar] [CrossRef] [Green Version]
  6. Zhang, J. Multi-source remote sensing data fusion: Status and trends. Int. J. Image Data Fusion 2010, 1, 5–24. [Google Scholar] [CrossRef] [Green Version]
  7. Pohl, C.; Van Genderen, J.L. Review article Multisensor image fusion in remote sensing: Concepts, methods and applications. Int. J. Remote Sens. 1998, 19, 823–854. [Google Scholar] [CrossRef] [Green Version]
  8. You, Y.; Cao, J.; Zhou, W. A Survey of Change Detection Methods Based on Remote Sensing Images for Multi-Source and Multi-Objective Scenarios. Remote Sens. 2020, 12, 2460. [Google Scholar] [CrossRef]
  9. Planet Team. Planet Application Program Interface: In Space for Life on Earth; Planet Team: San Francisco, CA, USA, 2017. [Google Scholar]
  10. Frazier, A.E.; Hemingway, B.L. A Technical Review of Planet Smallsat Data: Practical Considerations for Processing and Using PlanetScope Imagery. Remote Sens. 2021, 13, 3930. [Google Scholar] [CrossRef]
  11. Luo, N.; Wan, T.; Hao, H.; Lu, Q. Fusing High-Spatial-Resolution Remotely Sensed Imagery and OpenStreetMap Data for Land Cover Classification Over Urban Areas. Remote Sens. 2019, 11, 88. [Google Scholar] [CrossRef] [Green Version]
  12. Wan, T.; Lu, H.; Lu, Q.; Luo, N. Classification of High-Resolution Remote-Sensing Image Using OpenStreetMap Information. IEEE Geosci. Remote Sens. Lett. 2017, 14, 2305–2309. [Google Scholar] [CrossRef]
  13. Li, W.; He, C.; Fang, J.; Zheng, J.; Fu, H.; Yu, L. Semantic Segmentation-Based Building Footprint Extraction Using Very High-Resolution Satellite Images and Multi-Source GIS Data. Remote Sens. 2019, 11, 403. [Google Scholar] [CrossRef] [Green Version]
  14. Zhu, J.Y.; Park, T.; Isola, P.; Efros, A.A. Unpaired Image-to-Image Translation using Cycle-Consistent Adversarial Networks. arXiv 2020, arXiv:1703.10593. [Google Scholar]
  15. Albrecht, C.M.; Zhang, R.; Cui, X.; Freitag, M.; Hamann, H.F.; Klein, L.J.; Finkler, U.; Marianno, F.; Schmude, J.; Bobroff, N.; et al. Change Detection from Remote Sensing to Guide OpenStreetMap Labeling. ISPRS Int. J. Geo-Inf. 2020, 9, 427. [Google Scholar] [CrossRef]
  16. Stoker, J.; Miller, B. The Accuracy and Consistency of 3D Elevation Program Data: A Systematic Analysis. Remote Sens. 2022, 14, 940. [Google Scholar] [CrossRef]
  17. Jeziorska, J.; Mitasova, H.; Petrasova, A.; Petras, V.; Divakaran, D.; Zajkowski, T. Overland Flow Analysis Using Time Series Of SUAS-Derived Elevation Models. ISPRS Ann. Photogramm. Remote Sens. Spat. Inf. Sci. 2016, III-8, 159–166. [Google Scholar] [CrossRef] [Green Version]
  18. Petrasova, A.; Mitasova, H.; Petras, V.; Jeziorska, J. Fusion of high-resolution DEMs for water flow modeling. Open Geospat. Data Softw. Stand. 2017, 2, 6. [Google Scholar] [CrossRef] [Green Version]
  19. Sampson, C.C.; Smith, A.M.; Bates, P.D.; Neal, J.C.; Trigg, M.A. Perspectives on Open Access High Resolution Digital Elevation Models to Produce Global Flood Hazard Layers. Front. Earth Sci. 2016, 3, 85. [Google Scholar] [CrossRef] [Green Version]
  20. Wessels, K.; van den Bergh, F.; Roy, D.; Salmon, B.; Steenkamp, K.; MacAlister, B.; Swanepoel, D.; Jewitt, D. Rapid Land Cover Map Updates Using Change Detection and Robust Random Forest Classifiers. Remote Sens. 2016, 8, 888. [Google Scholar] [CrossRef] [Green Version]
  21. Sidhu, N.; Pebesma, E.; Câmara, G. Using Google Earth Engine to detect land cover change: Singapore as a use case. Eur. J. Remote Sens. 2018, 51, 486–500. [Google Scholar] [CrossRef]
  22. Gorelick, N.; Hancher, M.; Dixon, M.; Ilyushchenko, S.; Thau, D.; Moore, R. Google Earth Engine: Planetary-scale geospatial analysis for everyone. Remote Sens. Environ. 2017, 202, 18–27. [Google Scholar] [CrossRef]
  23. Reckling, W.; Mitasova, H.; Wegmann, K.; Kauffman, G.; Reid, R. Efficient Drone-Based Rare Plant Monitoring Using a Species Distribution Model and AI-Based Object Detection. Drones 2021, 5, 110. [Google Scholar] [CrossRef]
  24. OpenDroneMap Authors WebODM; WebODM. 2020. Available online: https://www.opendronemap.org/webodm/ (accessed on 11 February 2022).
  25. GRASS Development Team. Geographic Resources Analysis Support System (GRASS GIS) Software, Version 8.0. Open Source Geospatial Foundation. 2021. Available online: https://grass.osgeo.org (accessed on 28 February 2022).
  26. Krishnan, S.; Crosby, C.; Nandigam, V.; Phan, M.; Cowart, C.; Baru, C.; Arrowsmith, R. OpenTopography: A services oriented architecture for community access to LIDAR topography. In Proceedings of the 2nd International Conference on Computing for Geospatial Research & Applications, COM.Geo ’11, Washington, DC, USA, 23–25 May 2011; Association for Computing Machinery: New York, NY, USA, 2011; pp. 1–8. [Google Scholar] [CrossRef]
  27. Planet Team. Planet Imagery Product Specifications; Planet Labs Inc. 2018. Available online: https://assets.planet.com/docs/ (accessed on 8 February 2019).
  28. Planet Development Team. Planet API—Python Client—Planet API Client 1.4.6 Documentation. 2019. Available online: https://planetlabs.github.io/planet-client-python/index.html (accessed on 11 February 2022).
  29. Barrington-Leigh, C.; Millard-Ball, A. The world’s user-generated road map is more than 80% complete. PLoS ONE 2017, 12, e0180698. [Google Scholar] [CrossRef] [PubMed] [Green Version]
  30. Yang, D.; Fu, C.S.; Smith, A.C.; Yu, Q. Open land-use map: A regional land-use mapping strategy for incorporating OpenStreetMap with earth observations. Geo-Spat. Inf. Sci. 2017, 20, 269–281. [Google Scholar] [CrossRef] [Green Version]
  31. Crawford, B.; Swanson, E.; Schultz-Fellenz, E.; Collins, A.; Dann, J.; Lathrop, E.; Milazzo, D. A New Method for High Resolution Surface Change Detection: Data Collection and Validation of Measurements from UAS at the Nevada National Security Site, Nevada, USA. Drones 2021, 5, 25. [Google Scholar] [CrossRef]
  32. Jensen, J.R. Introductory Digital Image Processing: A Remote Sensing Perspective, 4th ed.; Prentice Hall Press: Upper Saddle River, NJ, USA, 2015. [Google Scholar]
  33. Rosin, P.L. Thresholding for Change Detection. Comput. Vis. Image Underst. 2002, 86, 79–95. [Google Scholar] [CrossRef]
  34. Rogerson, P.A. Change detection thresholds for remotely sensed images. J. Geogr. Syst. 2002, 4, 85–97. [Google Scholar] [CrossRef]
  35. Jamalabad, M.; Abkar, A. Forest Canopy Density Monitoring, Using Satellite Images. In Proceedings of the 20th ISPRS Congress, International Society for Photogrammetry and Remote Sensing, Istanbul, Turkey, 12–23 July 2004; pp. 12–23. [Google Scholar]
  36. Rouse, J.W.; Haas, R.H.; Schell, J.A.; Deering, D.W. Monitoring Vegetation Systems in the Great Plains with ERTS; Technical Presentations. NASA SP-351; NASA, Goddard Space Flight Center: Greenbelt, MD, USA, 1974; Volume 1. [Google Scholar]
  37. Goward, S.N.; Markham, B.; Dye, D.G.; Dulaney, W.; Yang, J. Normalized difference vegetation index measurements from the advanced very high resolution radiometer. Remote Sens. Environ. 1991, 35, 257–277. [Google Scholar] [CrossRef]
  38. Huang, X.; Weng, C.; Lu, Q.; Feng, T.; Zhang, L. Automatic Labelling and Selection of Training Samples for High-Resolution Remote Sensing Image Classification over Urban Areas. Remote Sens. 2015, 7, 16024–16044. [Google Scholar] [CrossRef] [Green Version]
  39. Gislason, P.O.; Benediktsson, J.A.; Sveinsson, J.R. Random Forests for land cover classification. Pattern Recognit. Lett. 2006, 27, 294–300. [Google Scholar] [CrossRef]
  40. McFeeters, S.K. The use of the Normalized Difference Water Index (NDWI) in the delineation of open water features. Int. J. Remote Sens. 1996, 17, 1425–1432. [Google Scholar] [CrossRef]
  41. Haralick, R.M.; Shanmugam, K.; Dinstein, I. Textural Features for Image Classification. IEEE Trans. Syst. Man Cybern. 1973, 6, 610–621. [Google Scholar] [CrossRef] [Green Version]
  42. Farda, N.M. Multi-temporal Land Use Mapping of Coastal Wetlands Area using Machine Learning in Google Earth Engine. IOP Conf. Ser. Earth Environ. Sci. 2017, 98, 012042. [Google Scholar] [CrossRef]
  43. Stehman, S.V. Sampling designs for accuracy assessment of land cover. Int. J. Remote Sens. 2009, 30, 5243–5272. [Google Scholar] [CrossRef]
  44. DroneDeploy Team. Drone & UAV Mapping Platform; DroneDeploy. 2020. Available online: https://www.dronedeploy.com/ (accessed on 28 September 2020).
  45. Stott, E.; Williams, R.D.; Hoey, T.B. Ground Control Point Distribution for Accurate Kilometre-Scale Topographic Mapping Using an RTK-GNSS Unmanned Aerial Vehicle and SfM Photogrammetry. Drones 2020, 4, 55. [Google Scholar] [CrossRef]
  46. Rogers, S.R.; Manning, I.; Livingstone, W. Comparing the Spatial Accuracy of Digital Surface Models from Four Unoccupied Aerial Systems: Photogrammetry versus LiDAR. Remote Sens. 2020, 12, 2806. [Google Scholar] [CrossRef]
  47. OpenDroneMap. ODM—A Command Line Toolkit to Generate Maps, Point Clouds, 3D Models and DEMs from Drone, Balloon or Kite Images. Available online: https://github.com/OpenDroneMap/ODM (accessed on 11 February 2022).
  48. Pell, T.; Li, J.Y.Q.; Joyce, K.E. Demystifying the Differences between Structure-from-MotionSoftware Packages for Pre-Processing Drone Data. Drones 2022, 6, 24. [Google Scholar] [CrossRef]
  49. Dewitz, J.; U.S. Geological Survey. National Land Cover Database (NLCD) 2019 Products (ver. 2.0, July 2020). U.S. Geological Survey Data Release. Available online: https://doi.org/10.5066/P96HHBIE (accessed on 1 July 2020).
  50. Homer, C.; Dewitz, J.; Jin, S.; Xian, G.; Costello, C.; Danielson, P.; Gass, L.; Funk, M.; Wickham, J.; Stehman, S.; et al. Conterminous United States land cover change patterns 2001–2016 from the 2016 National Land Cover Database. ISPRS J. Photogramm. Remote Sens. 2020, 162, 184–199. [Google Scholar] [CrossRef]
  51. Krautwurst, Z.; Petrasova, A.; Petras, V.; GRASS Development Team 2021; r.in.usgs. Geographic Resources Analysis Support System (GRASS) Software, Version 8.0. Open Source Geospatial Foundation. Available online: https://grass.osgeo.org/grass80/manuals/addons/r.in.usgs.html (accessed on 17 December 2021).
  52. Town of Cary. Storm Inlets; Wake County Open Data. Available online: https://maps.townofcary.org/arcgis/rest/services/Infrastructure/StormwaterNetwork/MapServer/35 (accessed on 30 January 2022).
  53. Gesch, D.B.; Evans, G.A.; Oimoen, M.J.; Arundel, S. The National Elevation Dataset. In Digital Elevation Model Technologies and Applications, 3rd ed.; The DEM Users Manual; American Society for Photogrammetry and Remote Sensing: Bethesda, MD, USA, 2018; pp. 83–110. [Google Scholar]
  54. Mitasova, H.; Thaxton, C.; Hofierka, J.; McLaughlin, R.; Moore, A.; Mitas, L. Path sampling method for modeling overland water flow, sediment transport, and short term terrain evolution in Open Source GIS. In Developments in Water Science; Elsevier: Chapel Hill, NC, USA, 2004; Volume 55, pp. 1479–1490. [Google Scholar] [CrossRef]
  55. Phan, T.N.; Kuch, V.; Lehnert, L.W. Land Cover Classification using Google Earth Engine and Random Forest Classifier—The Role of Image Composition. Remote Sens. 2020, 12, 2411. [Google Scholar] [CrossRef]
  56. Xie, S.; Liu, L.; Zhang, X.; Yang, J.; Chen, X.; Gao, Y. Automatic Land-Cover Mapping using Landsat Time-Series Data based on Google Earth Engine. Remote Sens. 2019, 11, 3023. [Google Scholar] [CrossRef] [Green Version]
  57. Talebi, H.; Peeters, L.J.M.; Otto, A.; Tolosana-Delgado, R. A Truly Spatial Random Forests Algorithm for Geoscience Data Analysis and Modelling. Math. Geosci. 2022, 54, 1–22. [Google Scholar] [CrossRef]
  58. Achanta, R.; Süsstrunk, S. Superpixels and Polygons Using Simple Non-iterative Clustering. In Proceedings of the 2017 IEEE Conference on Computer Vision and Pattern Recognition (CVPR), Honolulu, HI, USA, 21–26 July 2017; pp. 4895–4904. [Google Scholar] [CrossRef] [Green Version]
  59. Sulla-Menashe, D.; Gray, J.M.; Abercrombie, S.P.; Friedl, M.A. Hierarchical mapping of annual global land cover 2001 to present: The MODIS Collection 6 Land Cover product. Remote Sens. Environ. 2019, 222, 183–194. [Google Scholar] [CrossRef]
  60. Panagiotou, E.; Chochlakis, G.; Grammatikopoulos, L.; Charou, E. Generating Elevation Surface from a Single RGB Remotely Sensed Image Using Deep Learning. Remote Sens. 2020, 12, 2002. [Google Scholar] [CrossRef]
  61. Ghuffar, S. DEM Generation from Multi Satellite PlanetScope Imagery. Remote Sens. 2018, 10, 1462. [Google Scholar] [CrossRef] [Green Version]
  62. Nuhu, S.K.; Manan, Z.A.; Wan Alwi, S.R.; Md Reba, M.N. Roles of geospatial technology in eco-industrial park site selection: State–of–the-art review. J. Clean. Prod. 2021, 309, 127361. [Google Scholar] [CrossRef]
  63. U.S. Geological Survey. USGS NED ned19_n36x00_w078x75_nc_statewide_2003 1/9 arc-second 2012 15 × 15 Minute IMG. 2012. Available online: https://www.sciencebase.gov/catalog/item/581d2892e4b08da350d5ff30 (accessed on 7 February 2022).
  64. Floodplain Mapping Program, North Carolina Division of Emergency Management. 2002. Available online: https://fris.nc.gov/fris/Download.aspx (accessed on 7 February 2022).
  65. Neteler, M.; Gbbert, S.; Tawalika, C.; Bettge, A.; Benelcadi, H.; Löw, F.; Adams, T.; Paulsen, H. Actinia: Cloud Based Geoprocessing (Version 1). In Proceedings of the 2019 Conference on Big Data from Space (BiDS’2019), Munich, Germany, 19–21 February 2019; Publications Office of the European Union 5: Luxembourg, 2019; pp. 41–44. [Google Scholar] [CrossRef]
  66. White, C.T.; Petrasova, A.; Reckling, W.; Mitasova, H. Rapid-DEM. OSF. 25 March. Available online: http://doi.org/10.17605/OSF.IO/YG6H8 (accessed on 12 February 2022).
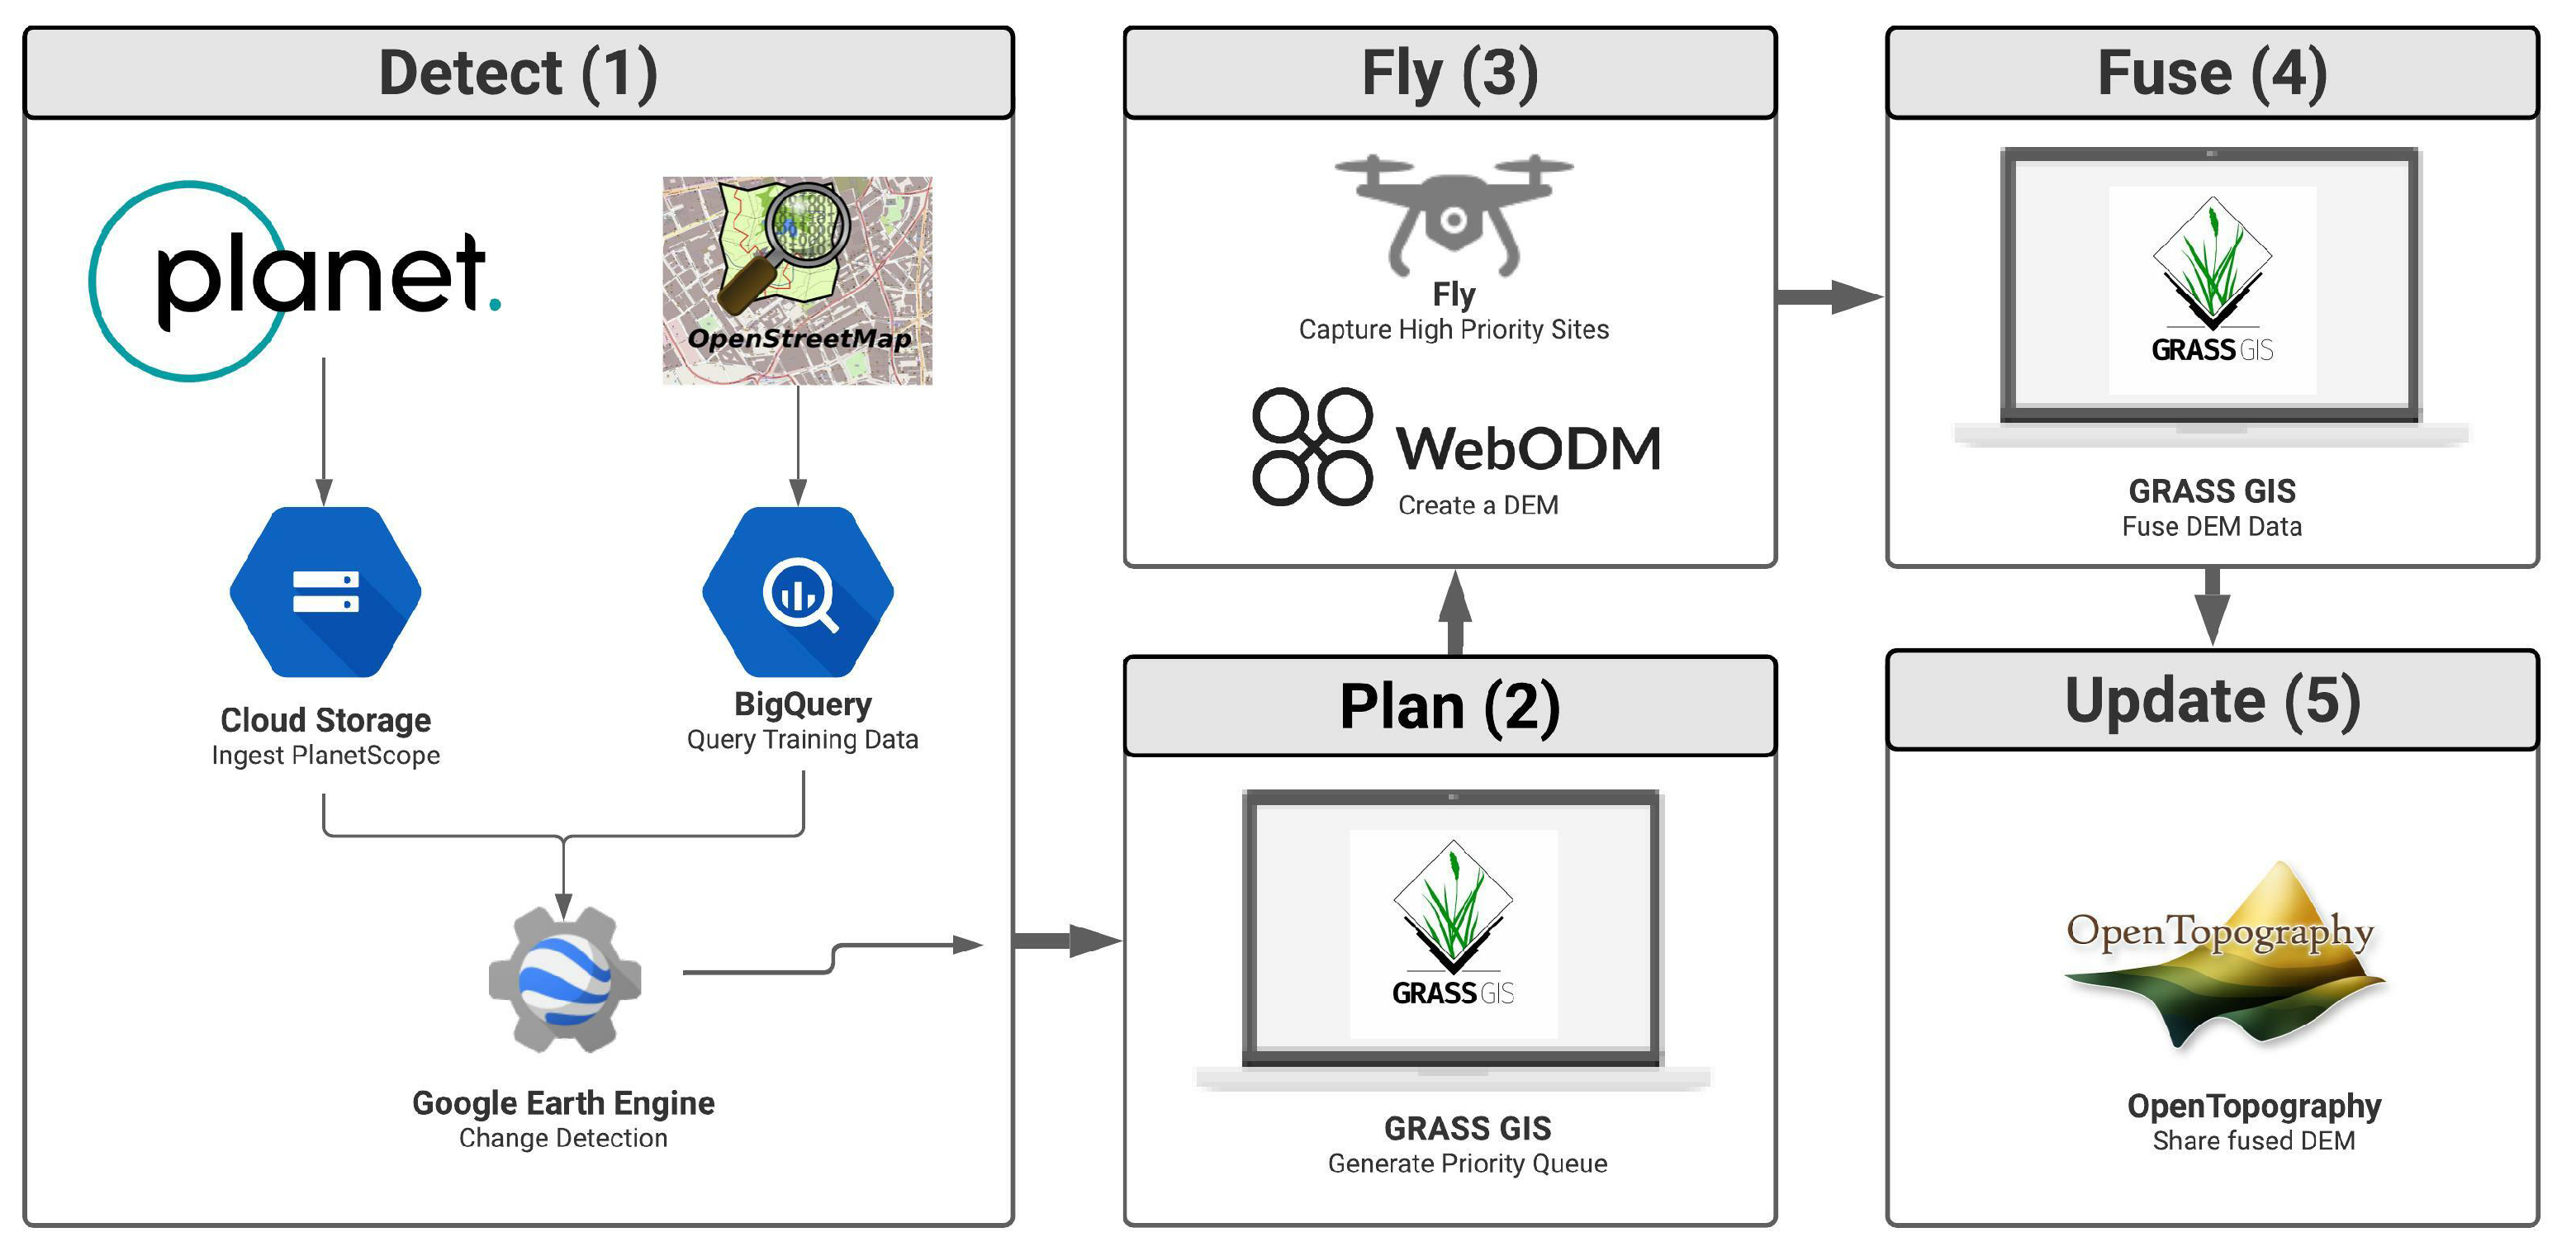
Figure 1. Rapid-DEM is a five-phase process that detects, plans, flies, fuses, and updates urban topographic change. Phase (1) generates land cover maps used to identify land cover change. Phase (2) creates a priority queue that identifies the most important change. Phase (3) uses the data from the priority queue to fly high priority locations and generate updated elevation models. Phase (4) fuses UAS-based DEM with an existing DEM dataset and phase (5) shares the updated fused DEM with the broader community.
Remotesensing 14 01718 g001
Figure 2. The study area is located in the (A) Walnut Creek Watershed (Neuse River Basin) of (B) Wake County, (C) North Carolina, United States of America. The most recent land cover provided by NLCD 2019 shows that the watershed is highly developed, but remains mostly forested in the south east.
Remotesensing 14 01718 g002
Figure 3. The datasets used for the case study were generated over a wide variety of spatial–temporal scales.
Remotesensing 14 01718 g003
Figure 4. The spatial distributions of land cover samples from OSM inside of Walnut Creek.
Remotesensing 14 01718 g004
Figure 5. The (A) before mosaic (1 June 2018–14 July 2019) and (B) after mosaic (15 July 2019–26 August 2020) land cover classification results were used to develop the priority map of the Walnut Creek watershed.
Remotesensing 14 01718 g005
Figure 6. By zooming in on the northwest corner of the Walnut Creek watershed the steps involved in calculating the priority queue are illustrated as follows: (A) binary change mask was used to filter noise seen in the (B) priority change map. The (C) mean priority change of each of these objects was then calculated and weighted by the (D) change objects area producing the (E) priority queue. The priority queue was then converted to (F) priority queue vector for use with UAS flight planning software.
Remotesensing 14 01718 g006
Figure 7. Median thresholds of the priority value and site area improved the overall accuracy of the priority queue.
Remotesensing 14 01718 g007
Figure 8. The top ten priority areas labeled with additional context to the type of change that occurred at each location.
Remotesensing 14 01718 g008
Figure 9. The priority queue vector map shows that Site 1 transitioned from a (A) forested area to a (B) forest clearing in preparation for new development in the headwaters of the Walnut Creek watershed.
Remotesensing 14 01718 g009
Figure 10. WebODM processed data generated from the UAS flight: (A) orthomosaic, (B) DSM, (C) DTM at 15 cm resolution.
Remotesensing 14 01718 g010
Figure 11. UAS DEM resampled to 3 m resolution with vegetation and structures removed before fusion with the USGS NED DEM.
Remotesensing 14 01718 g011
Figure 12. The difference in elevation of the fused DEM and the USGS NED DEM revealed how construction has modified Site 1’s topography.
Remotesensing 14 01718 g012
Figure 13. The elevation map with the location of profiles AB and CD, which illustrate the changes in elevation before and after the site grading (or construction) and the fusion of USGS NED DEM and UAS DEM along the site edges. Profile AB captures one of the sediment control ponds while Profile CD includes one of the surveyed inlets.
Remotesensing 14 01718 g013
Figure 14. Elevation and slope maps at 3 m resolution: (A) USGS NED DEM, (B) Fused DEM, (C) USGS NED DEM slope, and (D) Fused DEM slope.
Remotesensing 14 01718 g014
Figure 15. Spatial patterns of surface water flow depths computed using the USGS NED DEM (A), UAS DEM (B) and the fused DEM (C). The fusion ensured smooth flow between the USGS NED DEM and the area mapped by UAS.
Remotesensing 14 01718 g015
Figure 16. Micro basins derived from the (A) USGS NED DEM and (B) fused DEM indicate that the development generally preserved the existing basins.
Remotesensing 14 01718 g016
Table 1. Rapid-DEM uses four data sources in order to detect, plan, fuse, and update DEM in areas experiencing topographic change.
Data NameData TypeSpatial ResolutionTemporal ResolutionSpatial ExtentData Access
PlanetScoperaster3 mDailyGlobalGEE
Lidar-based DEMrasterVariable>AnnuallyVariableGEE
UAS-based DEMrasterVariableNALocalLocal
OpenStreetMapvectorNARegularly UpdatedGlobalGBQ
Table 2. OpenStreetMap keys and tags used to train land class classification model.
Land CoverOSM TagOSM Value(s)
WaterNaturalWater
RoadsHighwayResidential, Motorway, Trunk, Primary
DevelopedParkingSurface
BuildingsBuildingHouse, Residential, Retail, Public
BarrenSurfaceSand, Dirt
GrassSurfaceGrass
GrassLanduseGrass, Meadow
GrassNaturalGrassland
ForestNaturalWood
Table 3. Classification Features.
FeatureBandsKernelSourceEquation
OriginalB, NIR--
MedianB, NIRSquare-5 pixels-
MinimumB, NIRSquare-5 pixels-
MaximumB, NIRSquare-5 pixels-
NDVI--[36] NDVI = NIR R e d NIR + R e d
NDWI--[40] NDWI = B l u e NIR B l u e + NIR
BSI--[35] BSI = ( ( R e d + G r e e n ) ( R e d + B l u e ) ) ( ( NIR + G r e e n ) + ( R E D + B l u e ) ) × 100 + 100
GLCMRSquare - 3 pixels[41]
Table 4. Priority Change Table.
From/ToRoadBuildingDevelopedBarrenGrassForestWater
RoadNA744110
Building1NA57330
Developed37NA7330
Barren375NA220
Grass3753NA30
Forest37773NA0
Water000000NA
Table 5. Raw PlanetScope Imagery Characteristics.
TypeCloud CoverGSDSun AzimuthSun ElevationView Angle
count500500500500500
mean0.013.78131.9644.370.59
std0.010.1718.1215.790.54
min0.003.5089.9015.900.00
25%0.013.60113.6527.700.10
50%0.013.80132.0545.500.40
75%0.023.90149.5360.731.00
max0.054.70160.8070.401.90
Publisher’s Note: MDPI stays neutral with regard to jurisdictional claims in published maps and institutional affiliations.