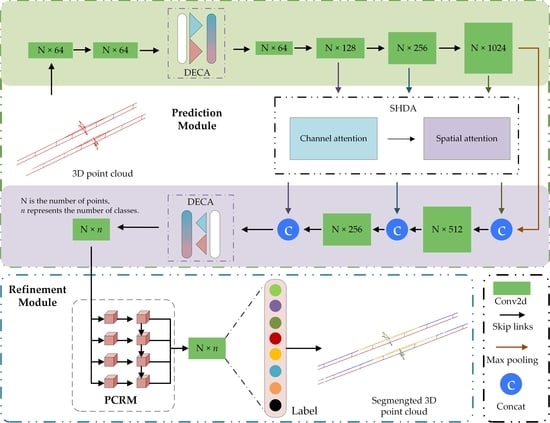
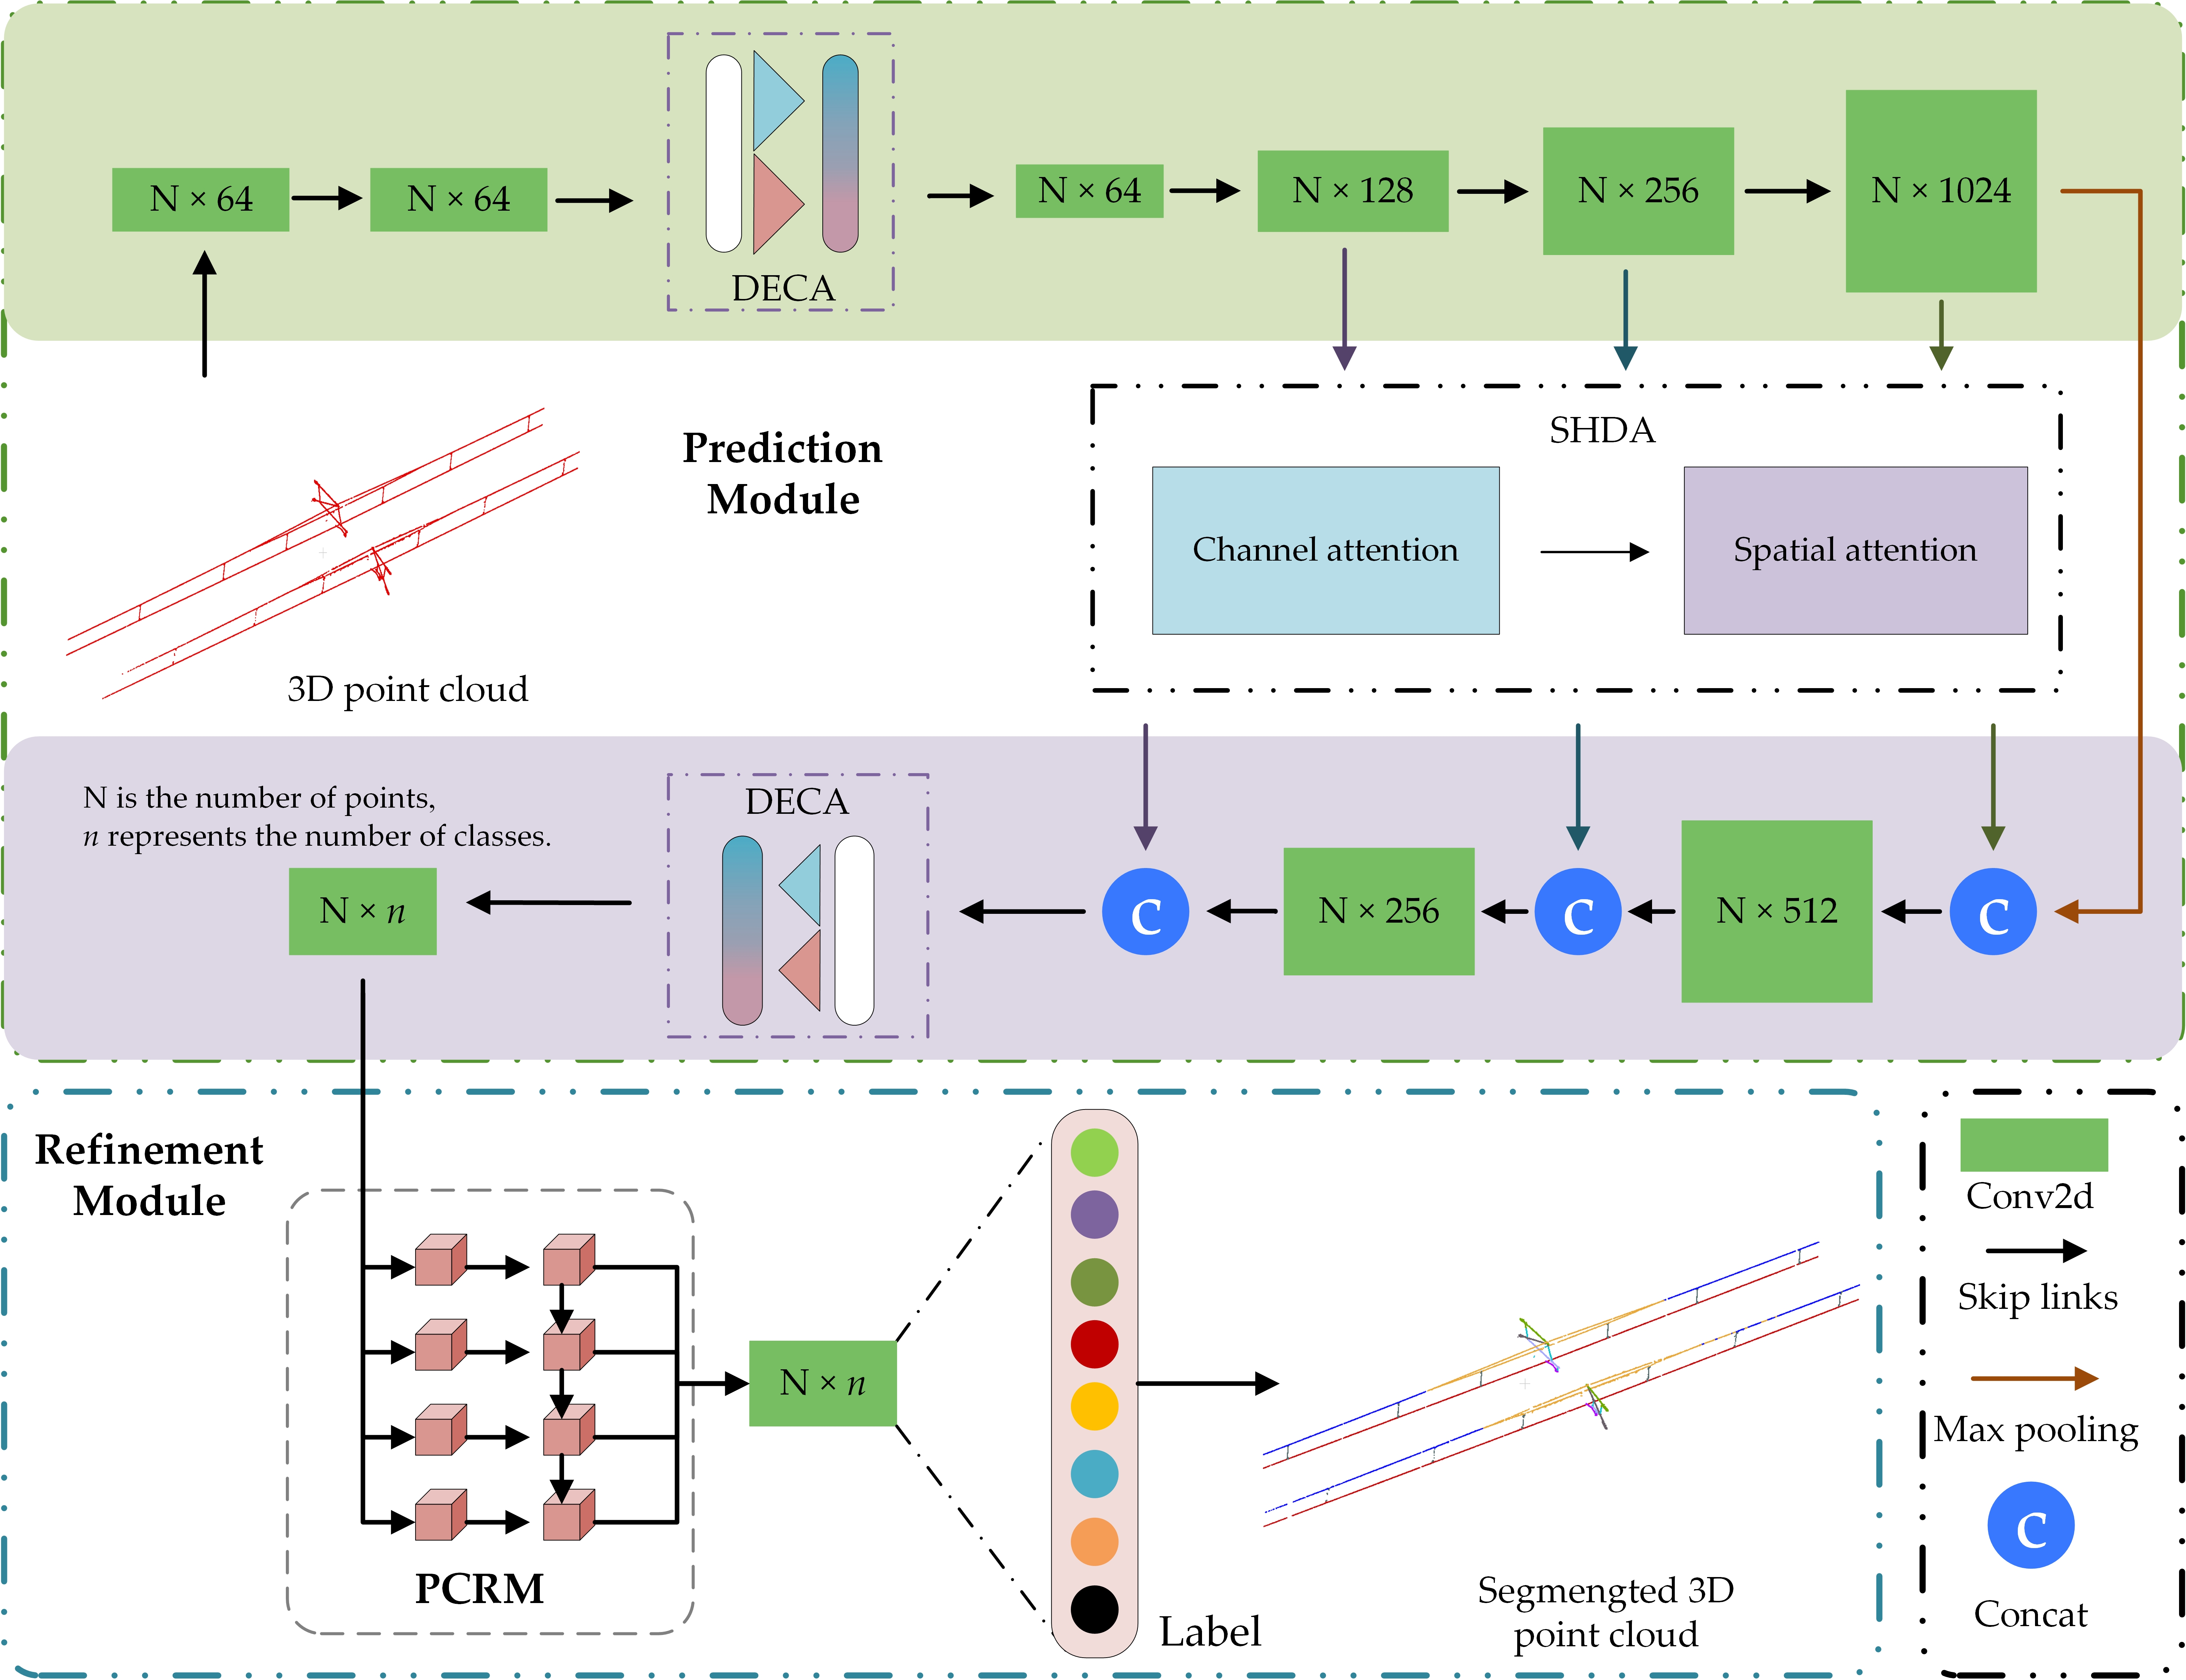
Figure 1.
Overall framework diagram of the proposed PMFR-Net.
Figure 1.
Overall framework diagram of the proposed PMFR-Net.
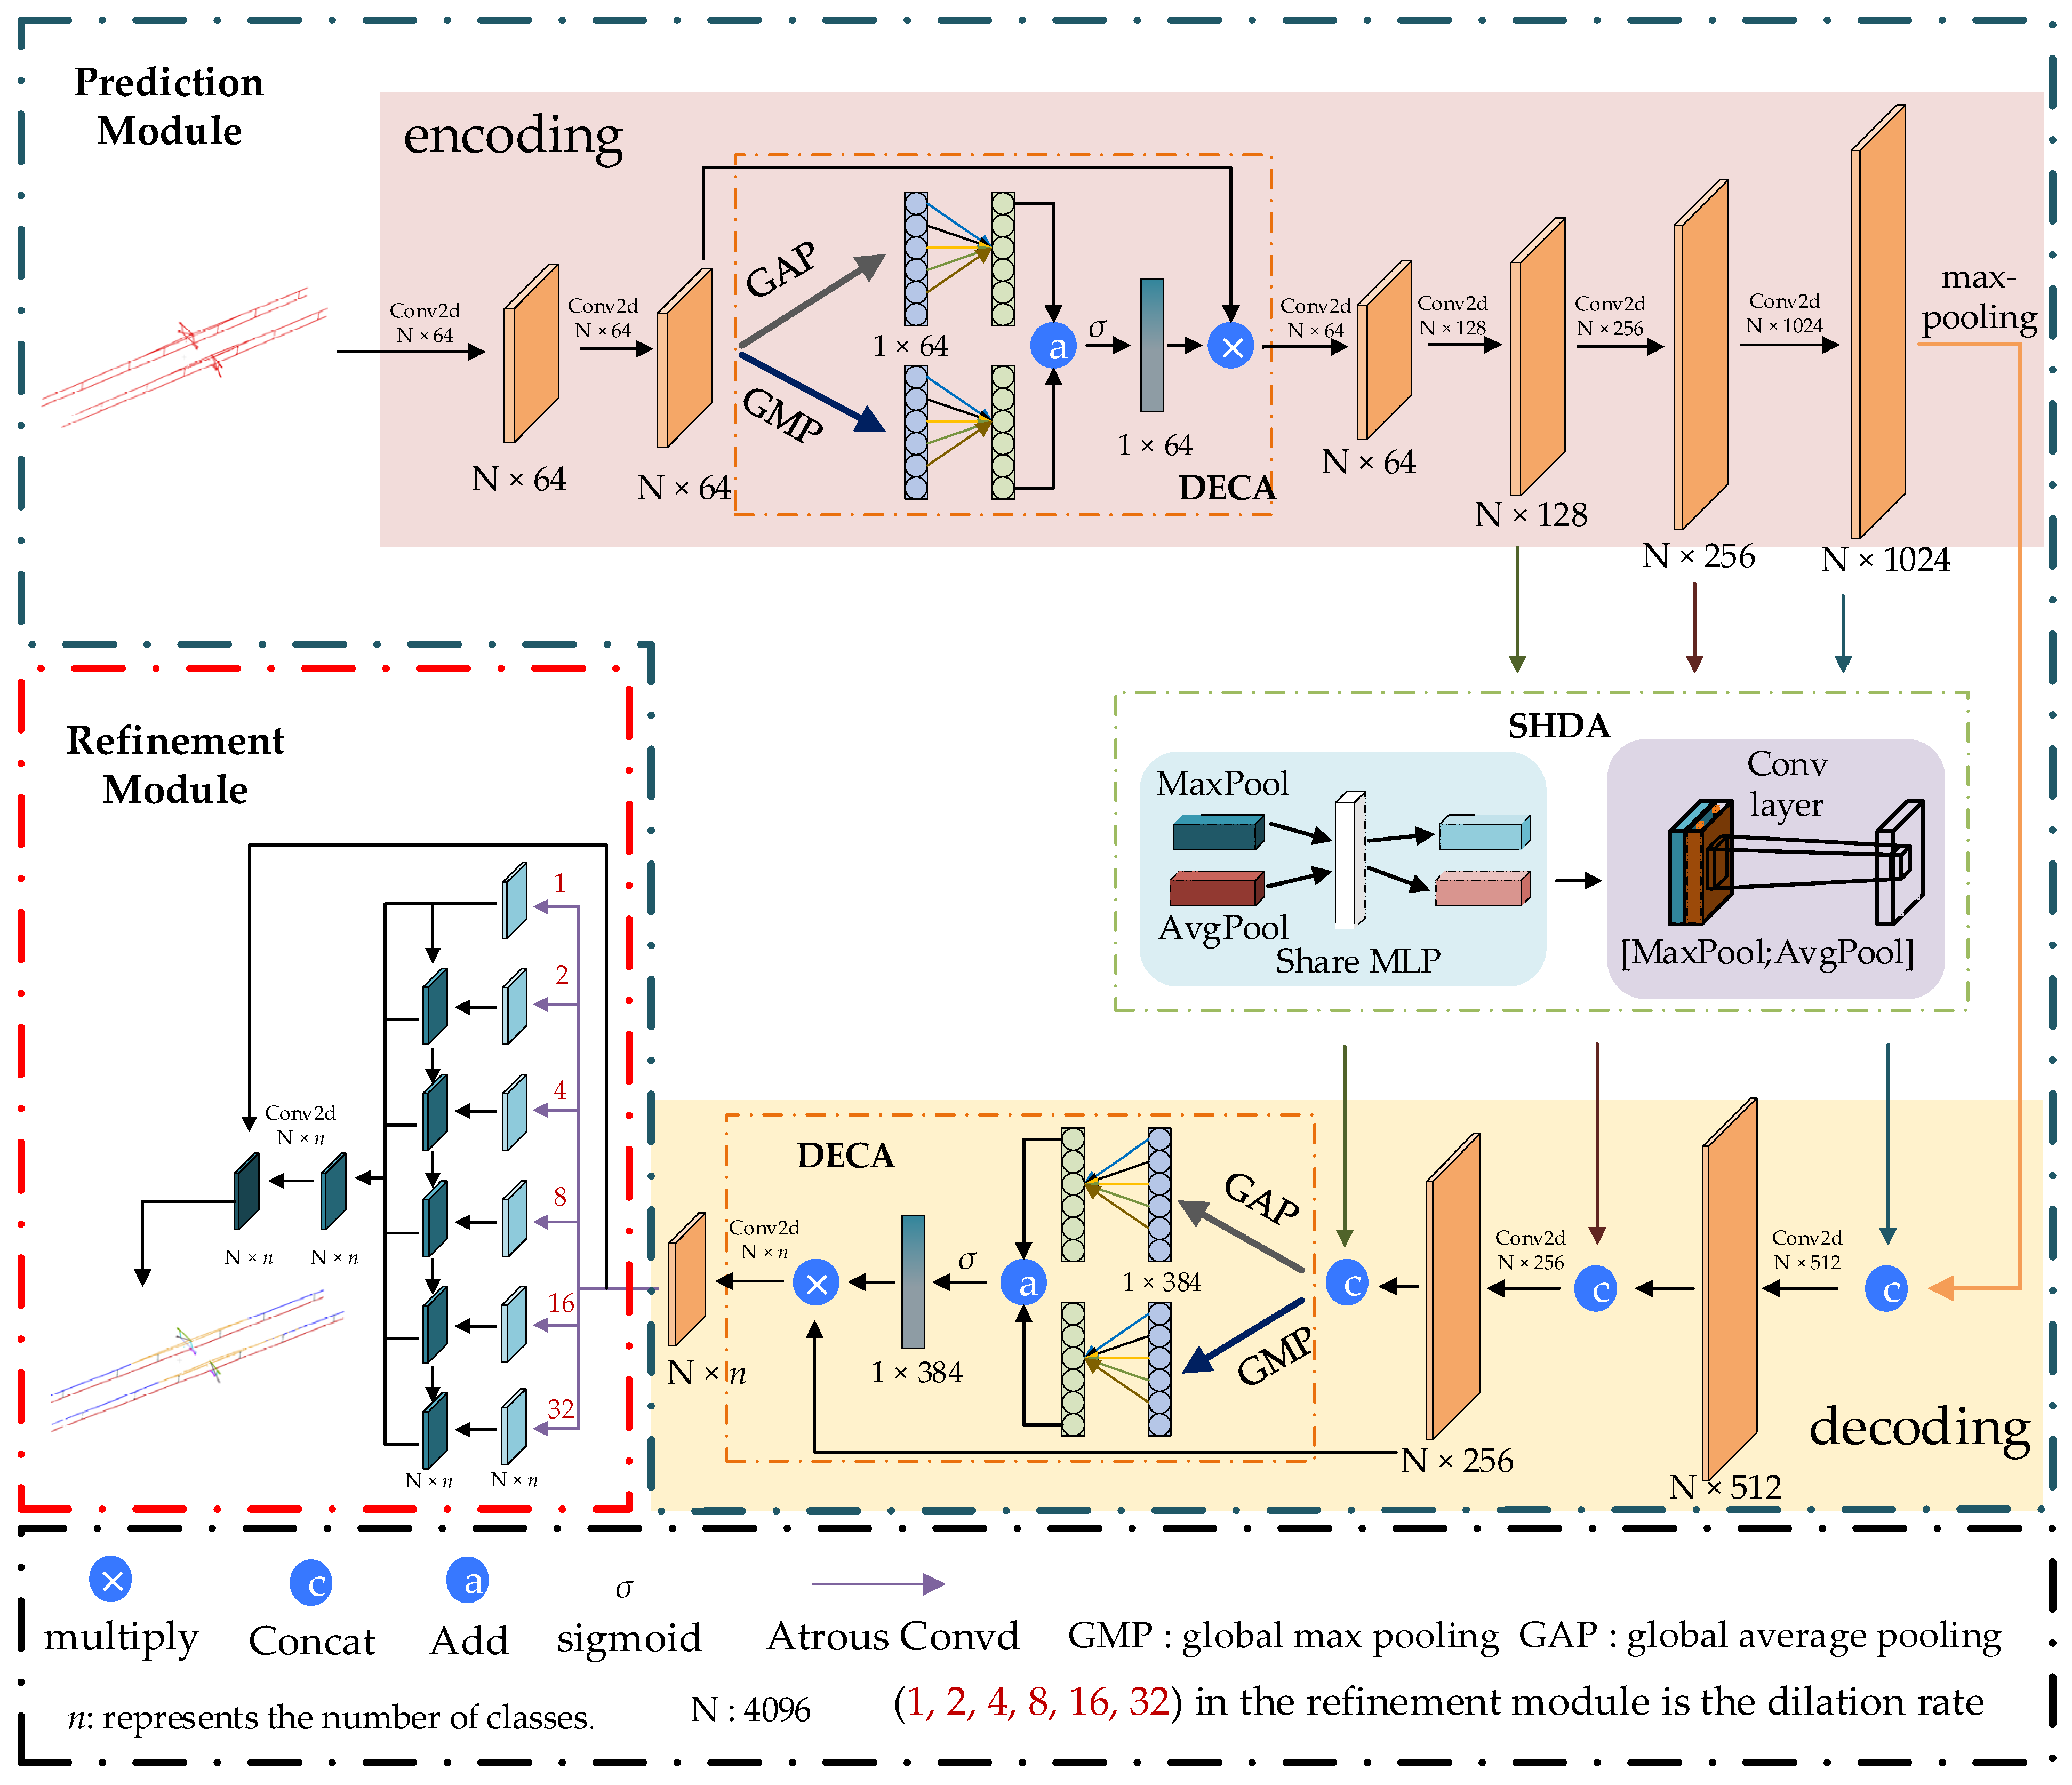
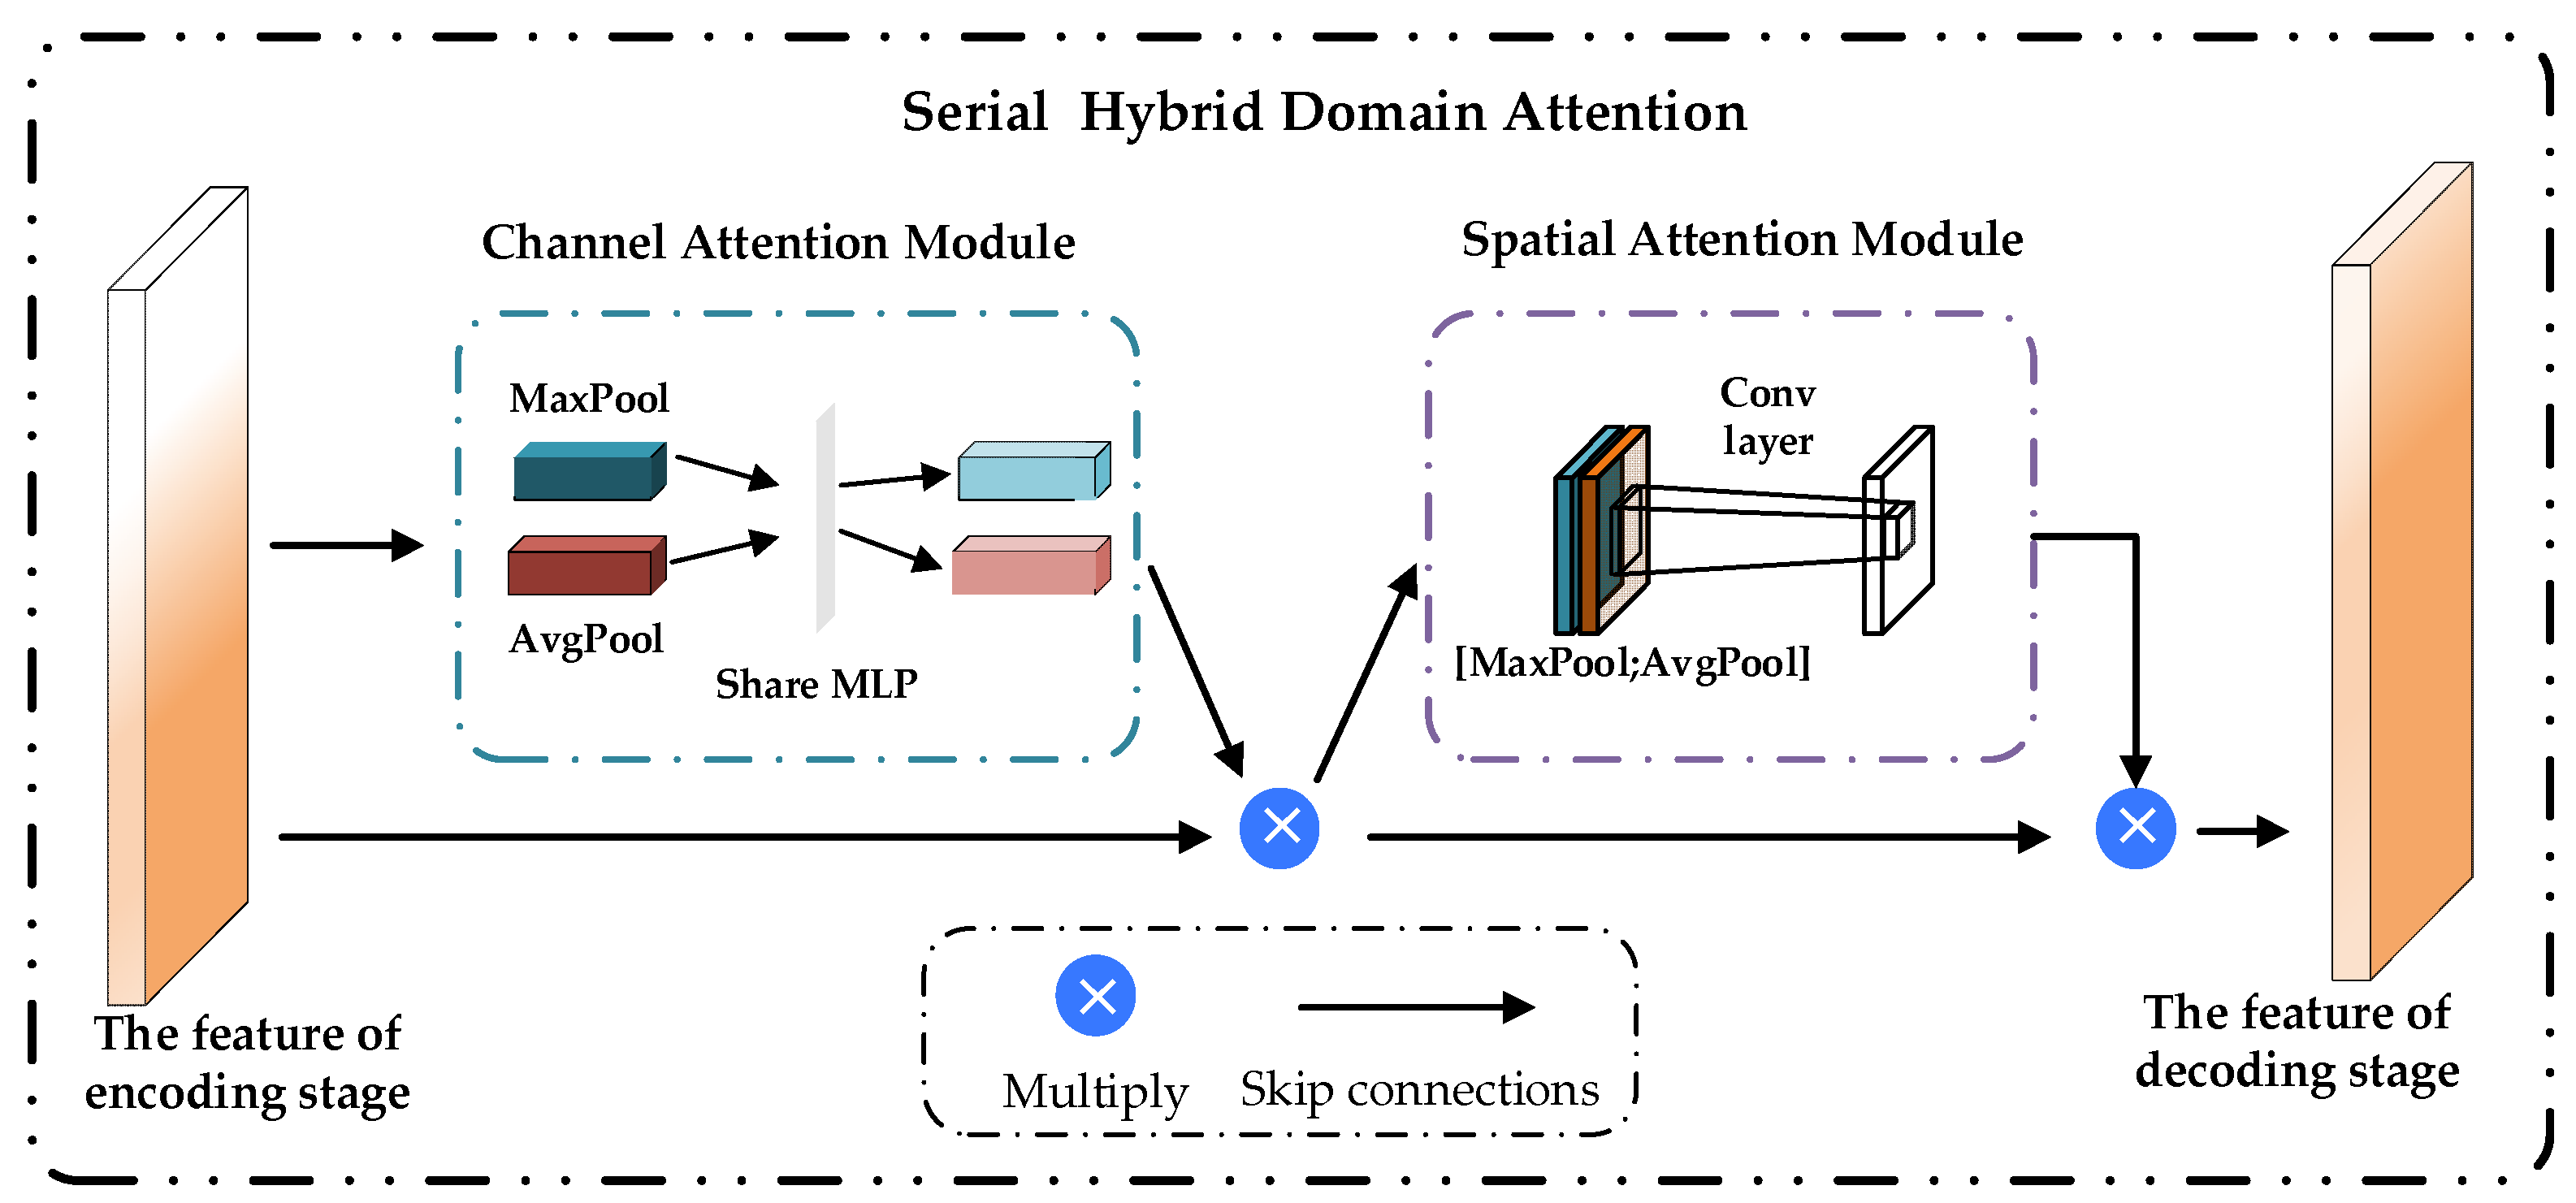
Figure 2.
Structure diagram of the serial hybrid domain attention (SHDA).
Figure 2.
Structure diagram of the serial hybrid domain attention (SHDA).
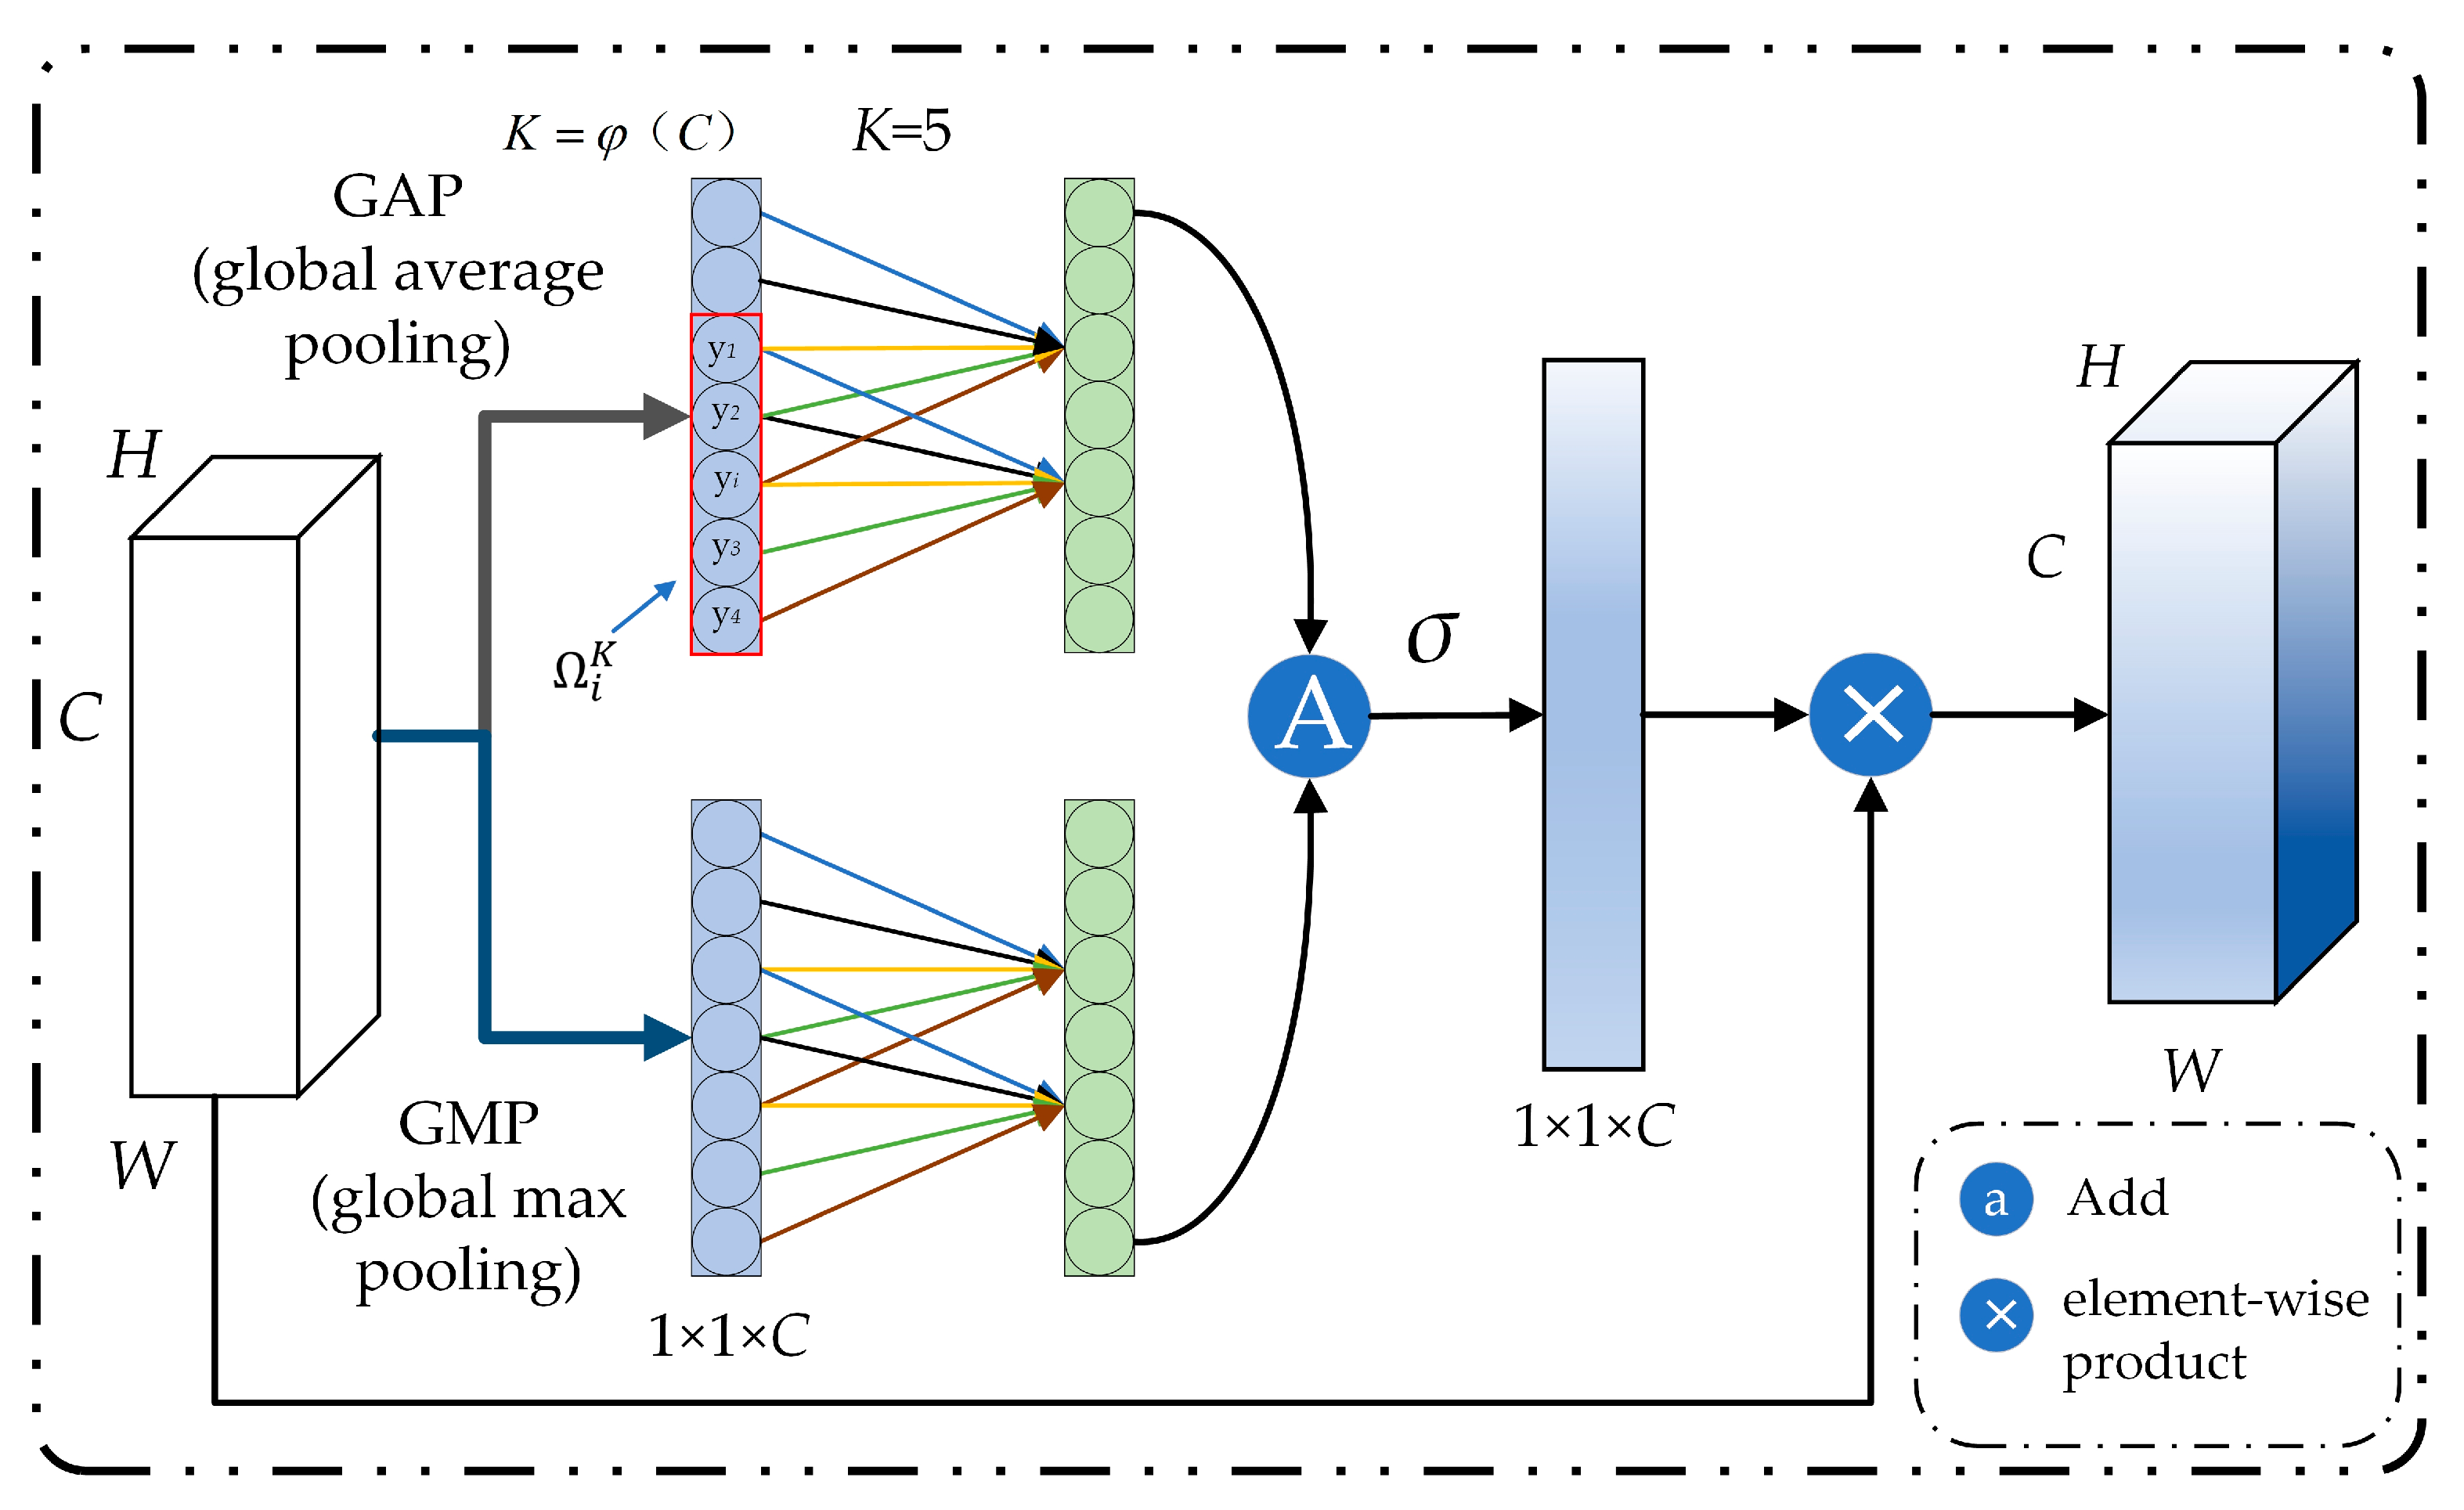
Figure 3.
Double efficient channel attention (DECA) module diagram. GAP stands for global average-pooling and GMP stands for global max-pooling.
Figure 3.
Double efficient channel attention (DECA) module diagram. GAP stands for global average-pooling and GMP stands for global max-pooling.
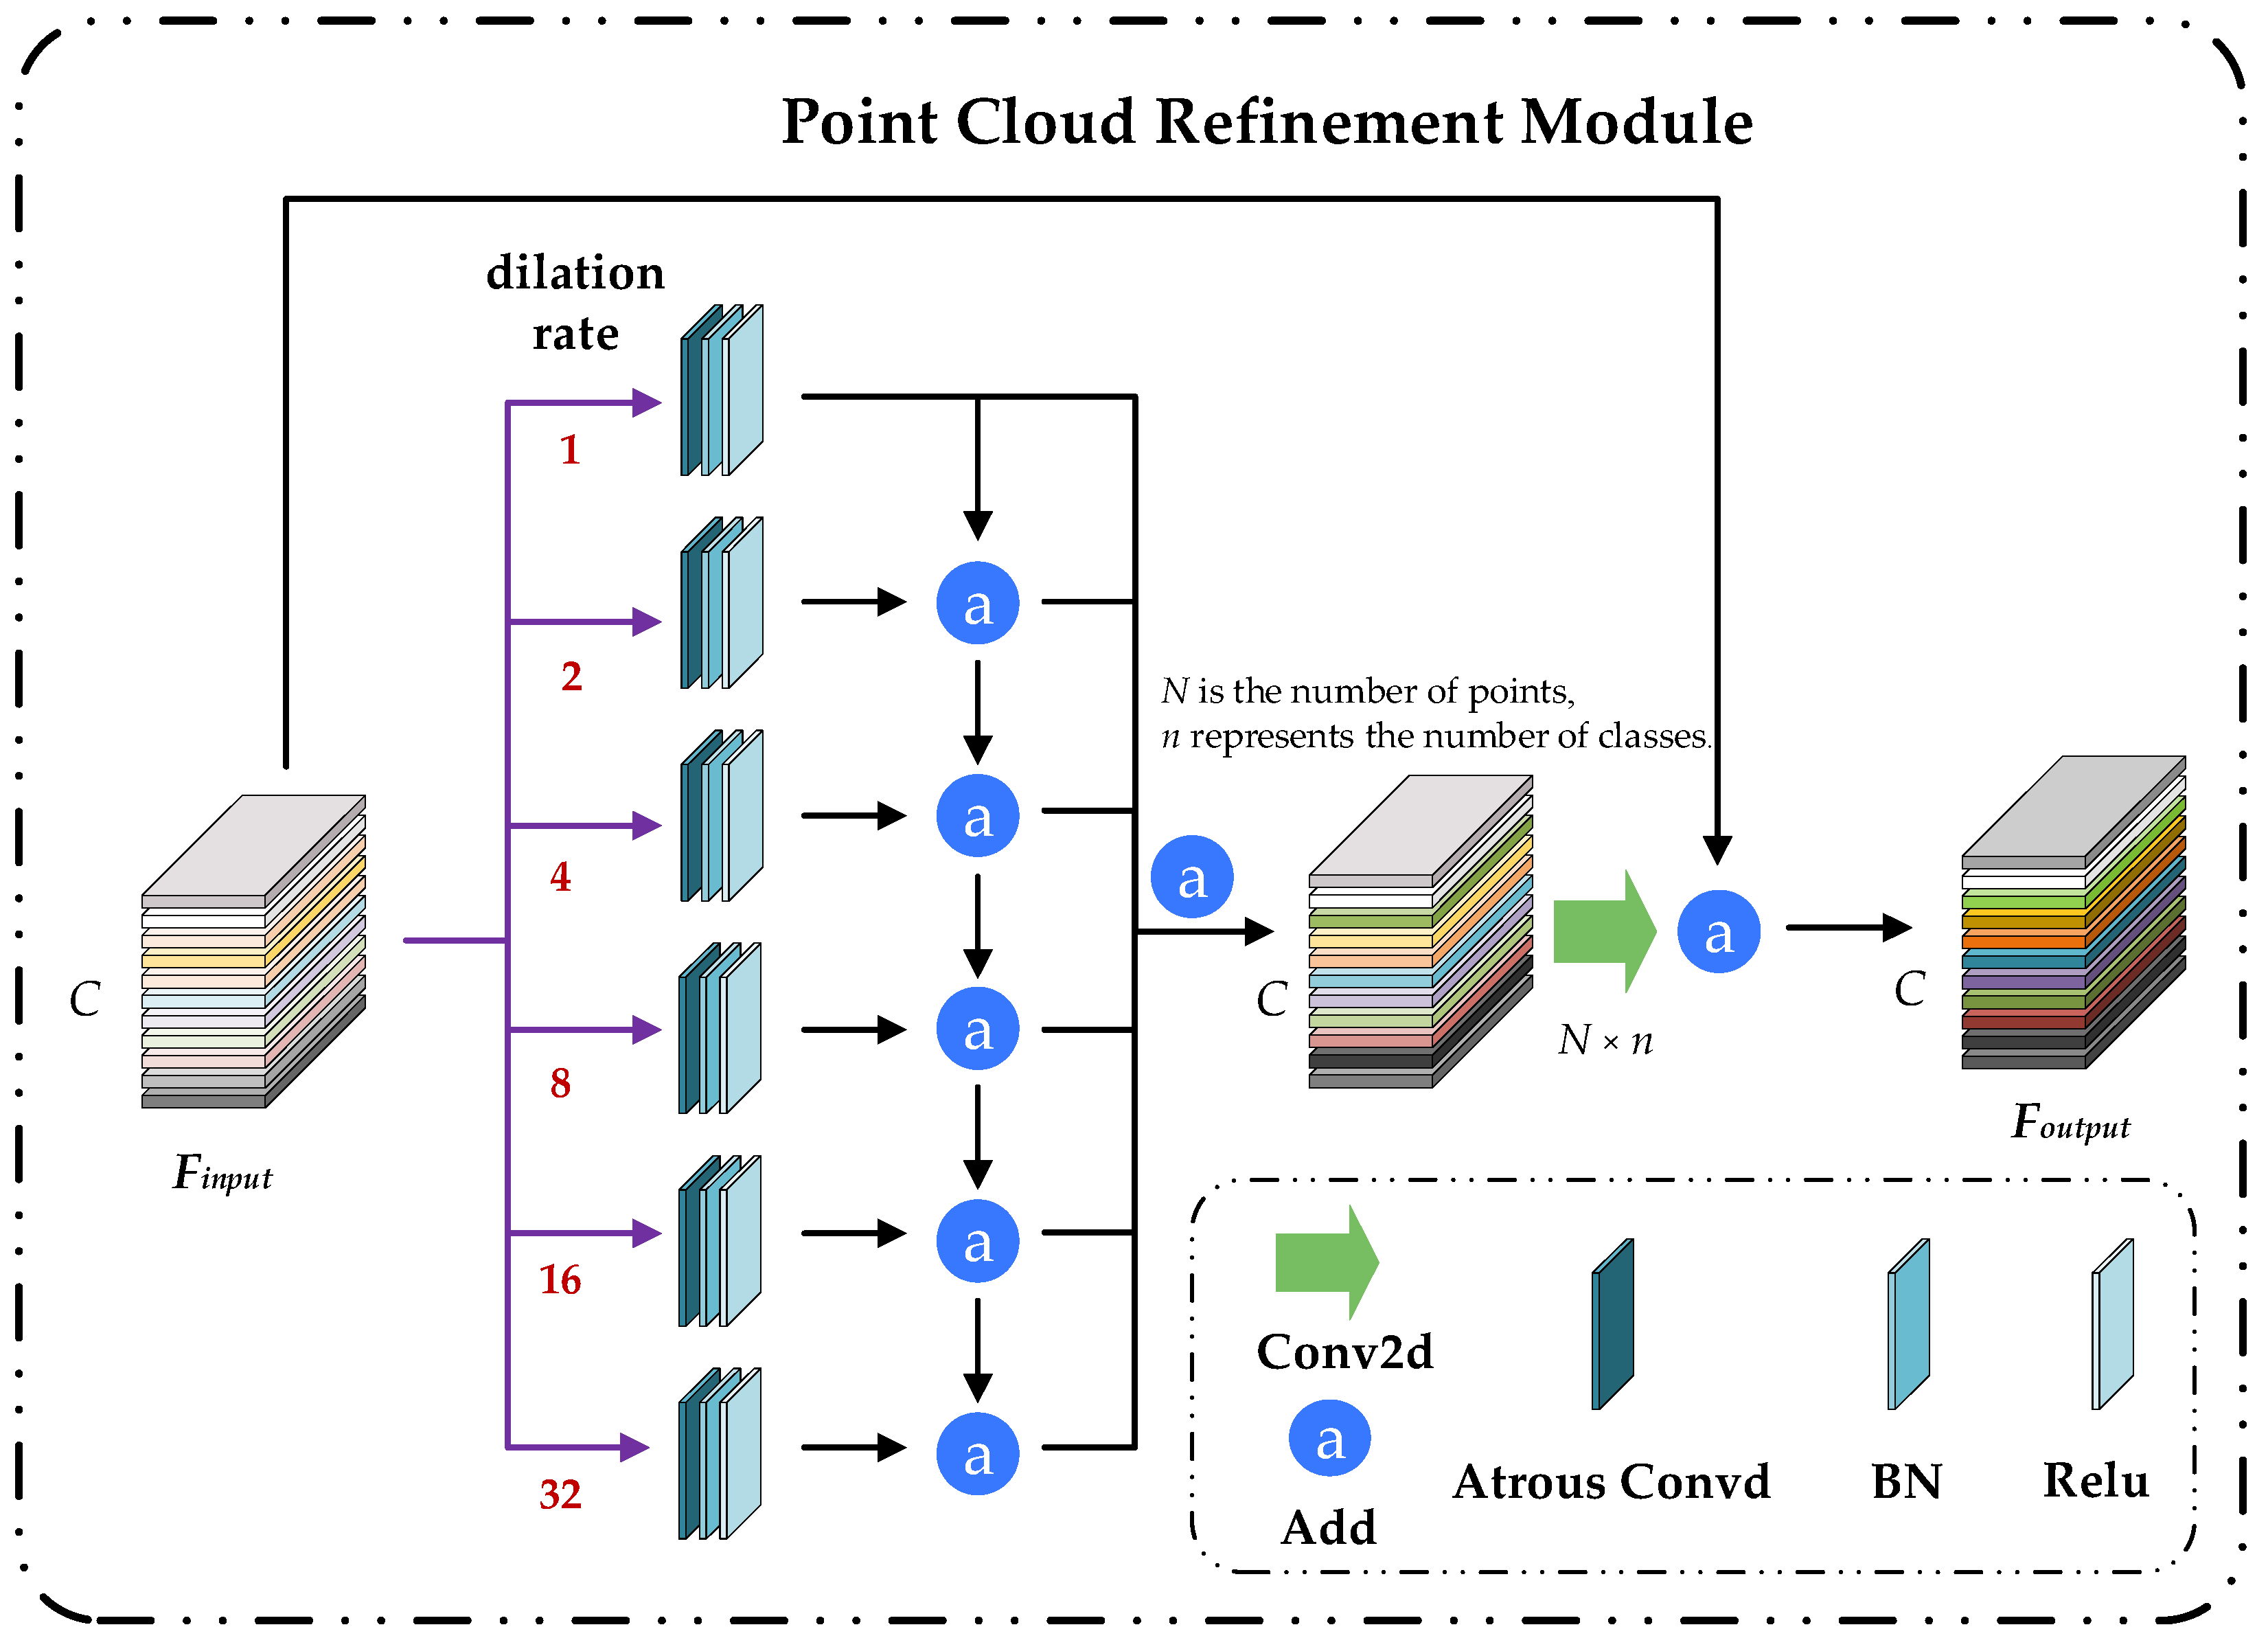
Figure 4.
Point cloud refinement module (PCRM) diagram.
Figure 4.
Point cloud refinement module (PCRM) diagram.
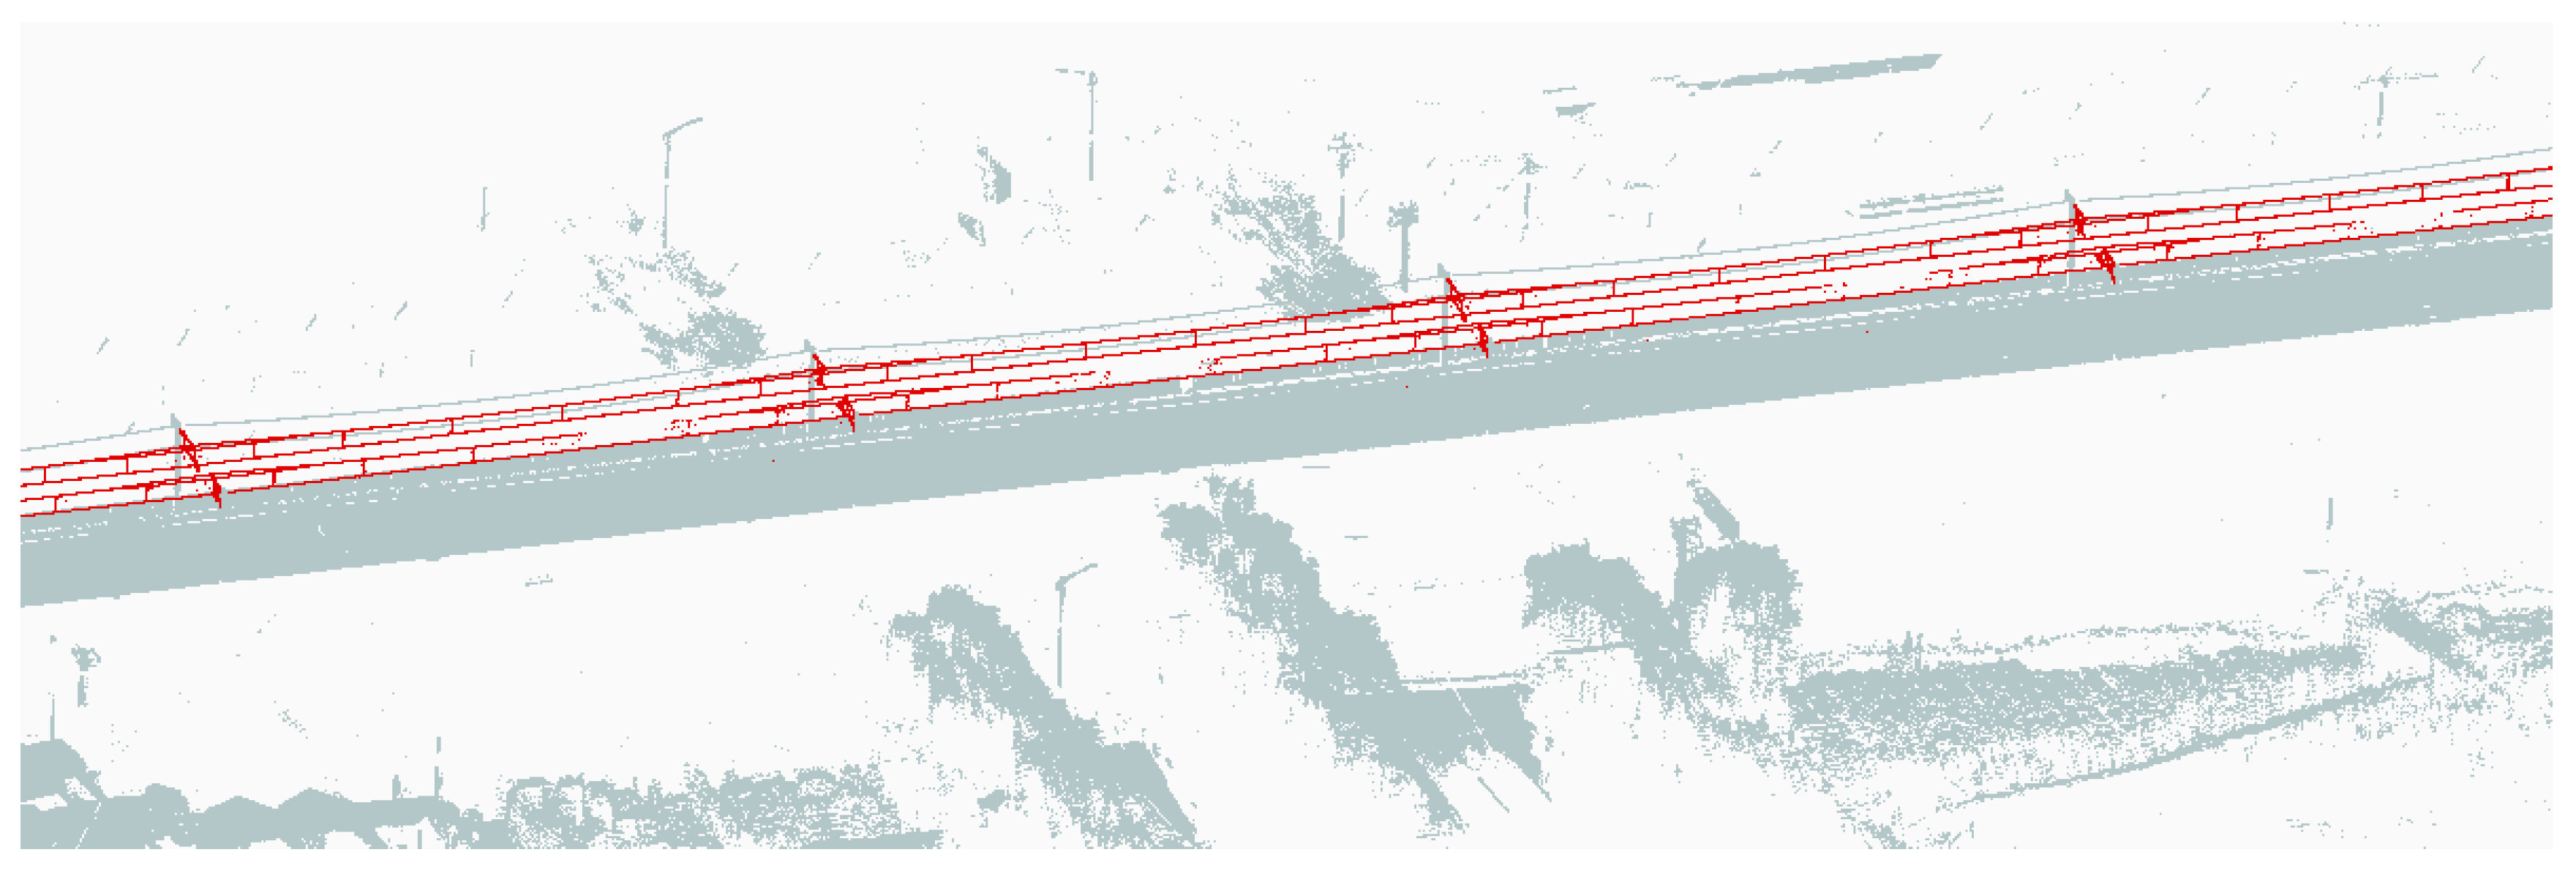
Figure 5.
The OCS extraction point cloud result by preprocessing (red is the OCS extraction result, gray is the background point).
Figure 5.
The OCS extraction point cloud result by preprocessing (red is the OCS extraction result, gray is the background point).
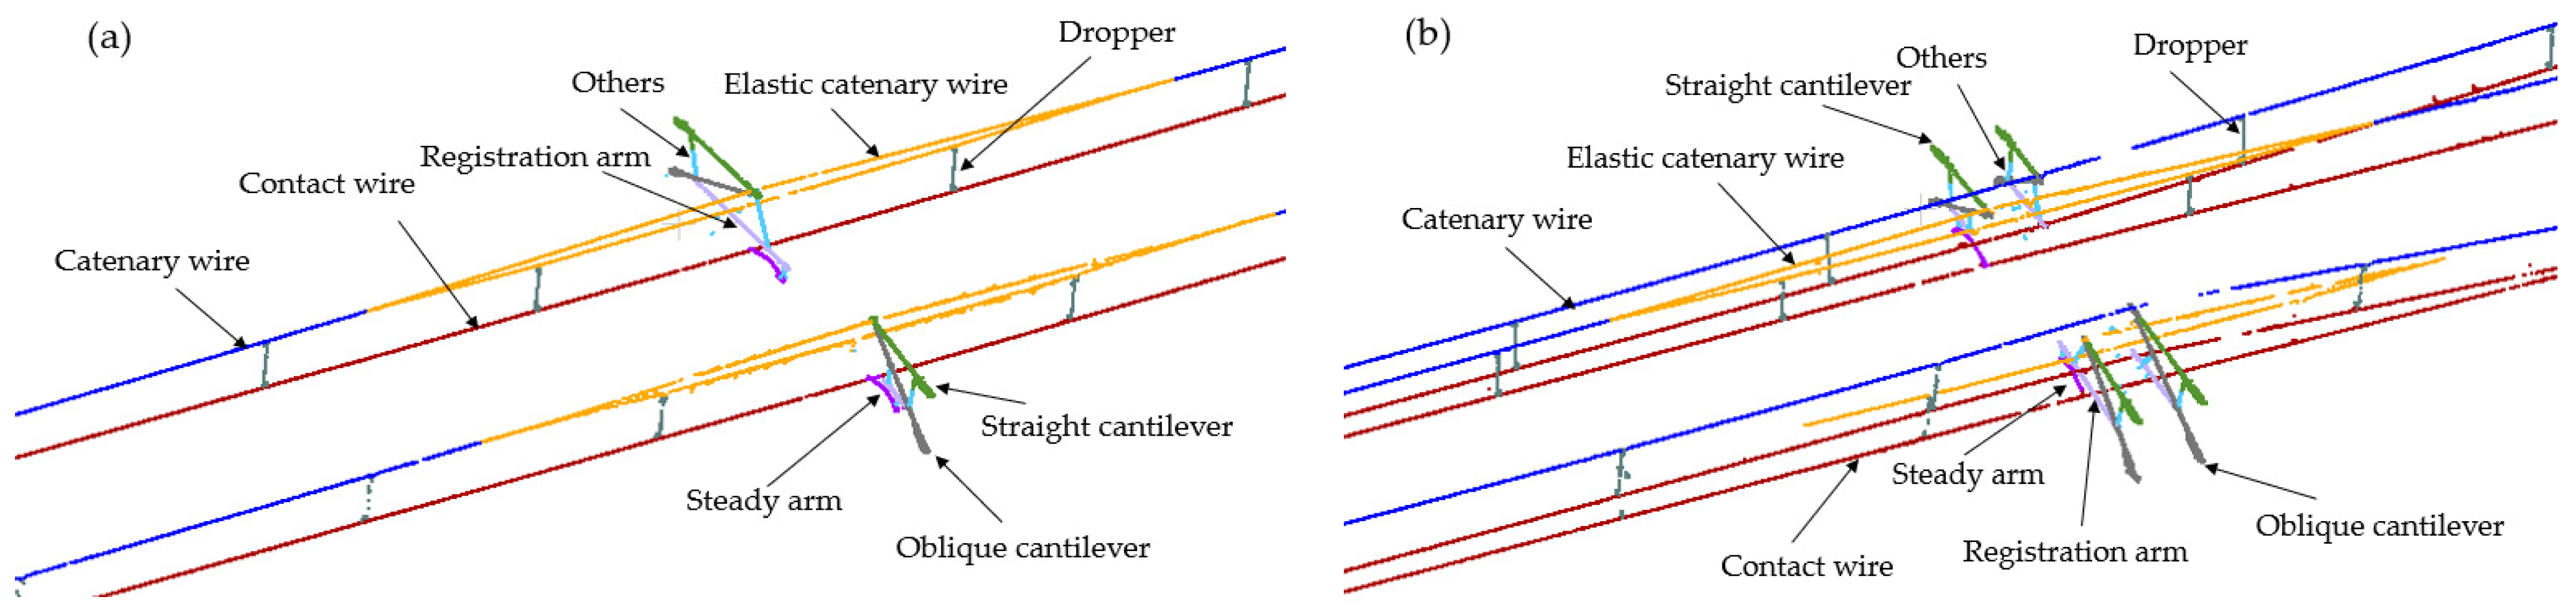
Figure 6.
Component diagram of the OCS: (a) is the single-arm OCS and (b) is the double-arm OCS.
Figure 6.
Component diagram of the OCS: (a) is the single-arm OCS and (b) is the double-arm OCS.
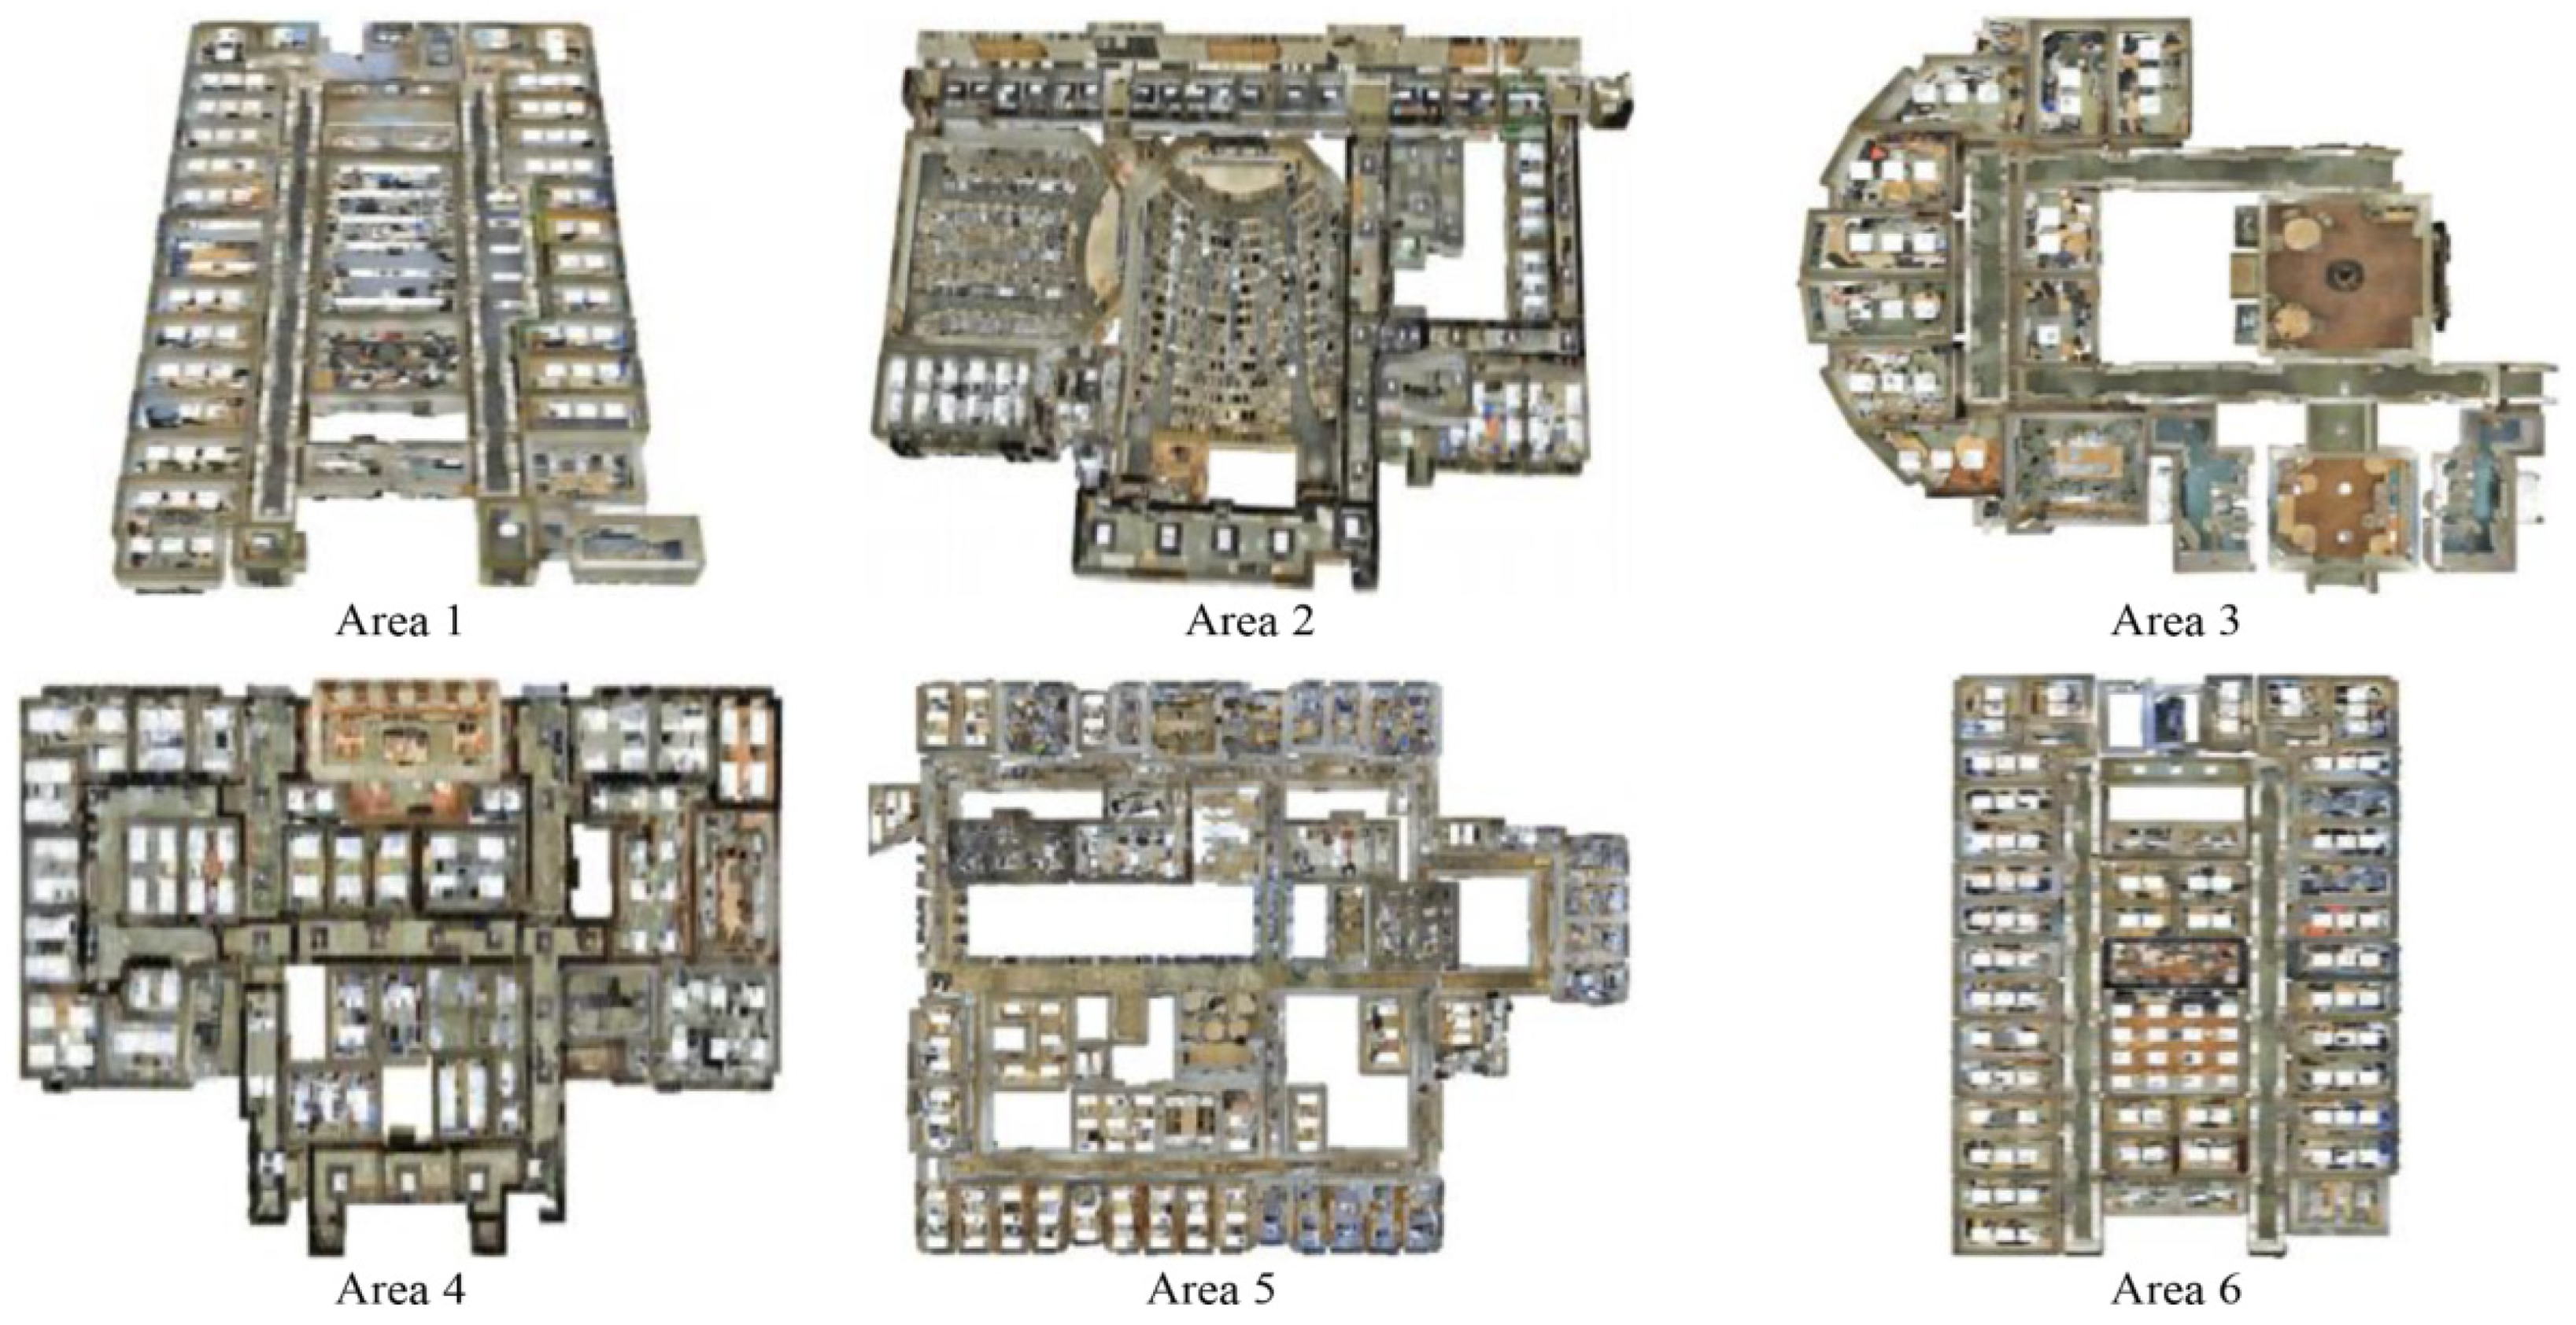
Figure 7.
The S3DIS dataset contains thumbnails of Area 1 to Area 6.
Figure 7.
The S3DIS dataset contains thumbnails of Area 1 to Area 6.
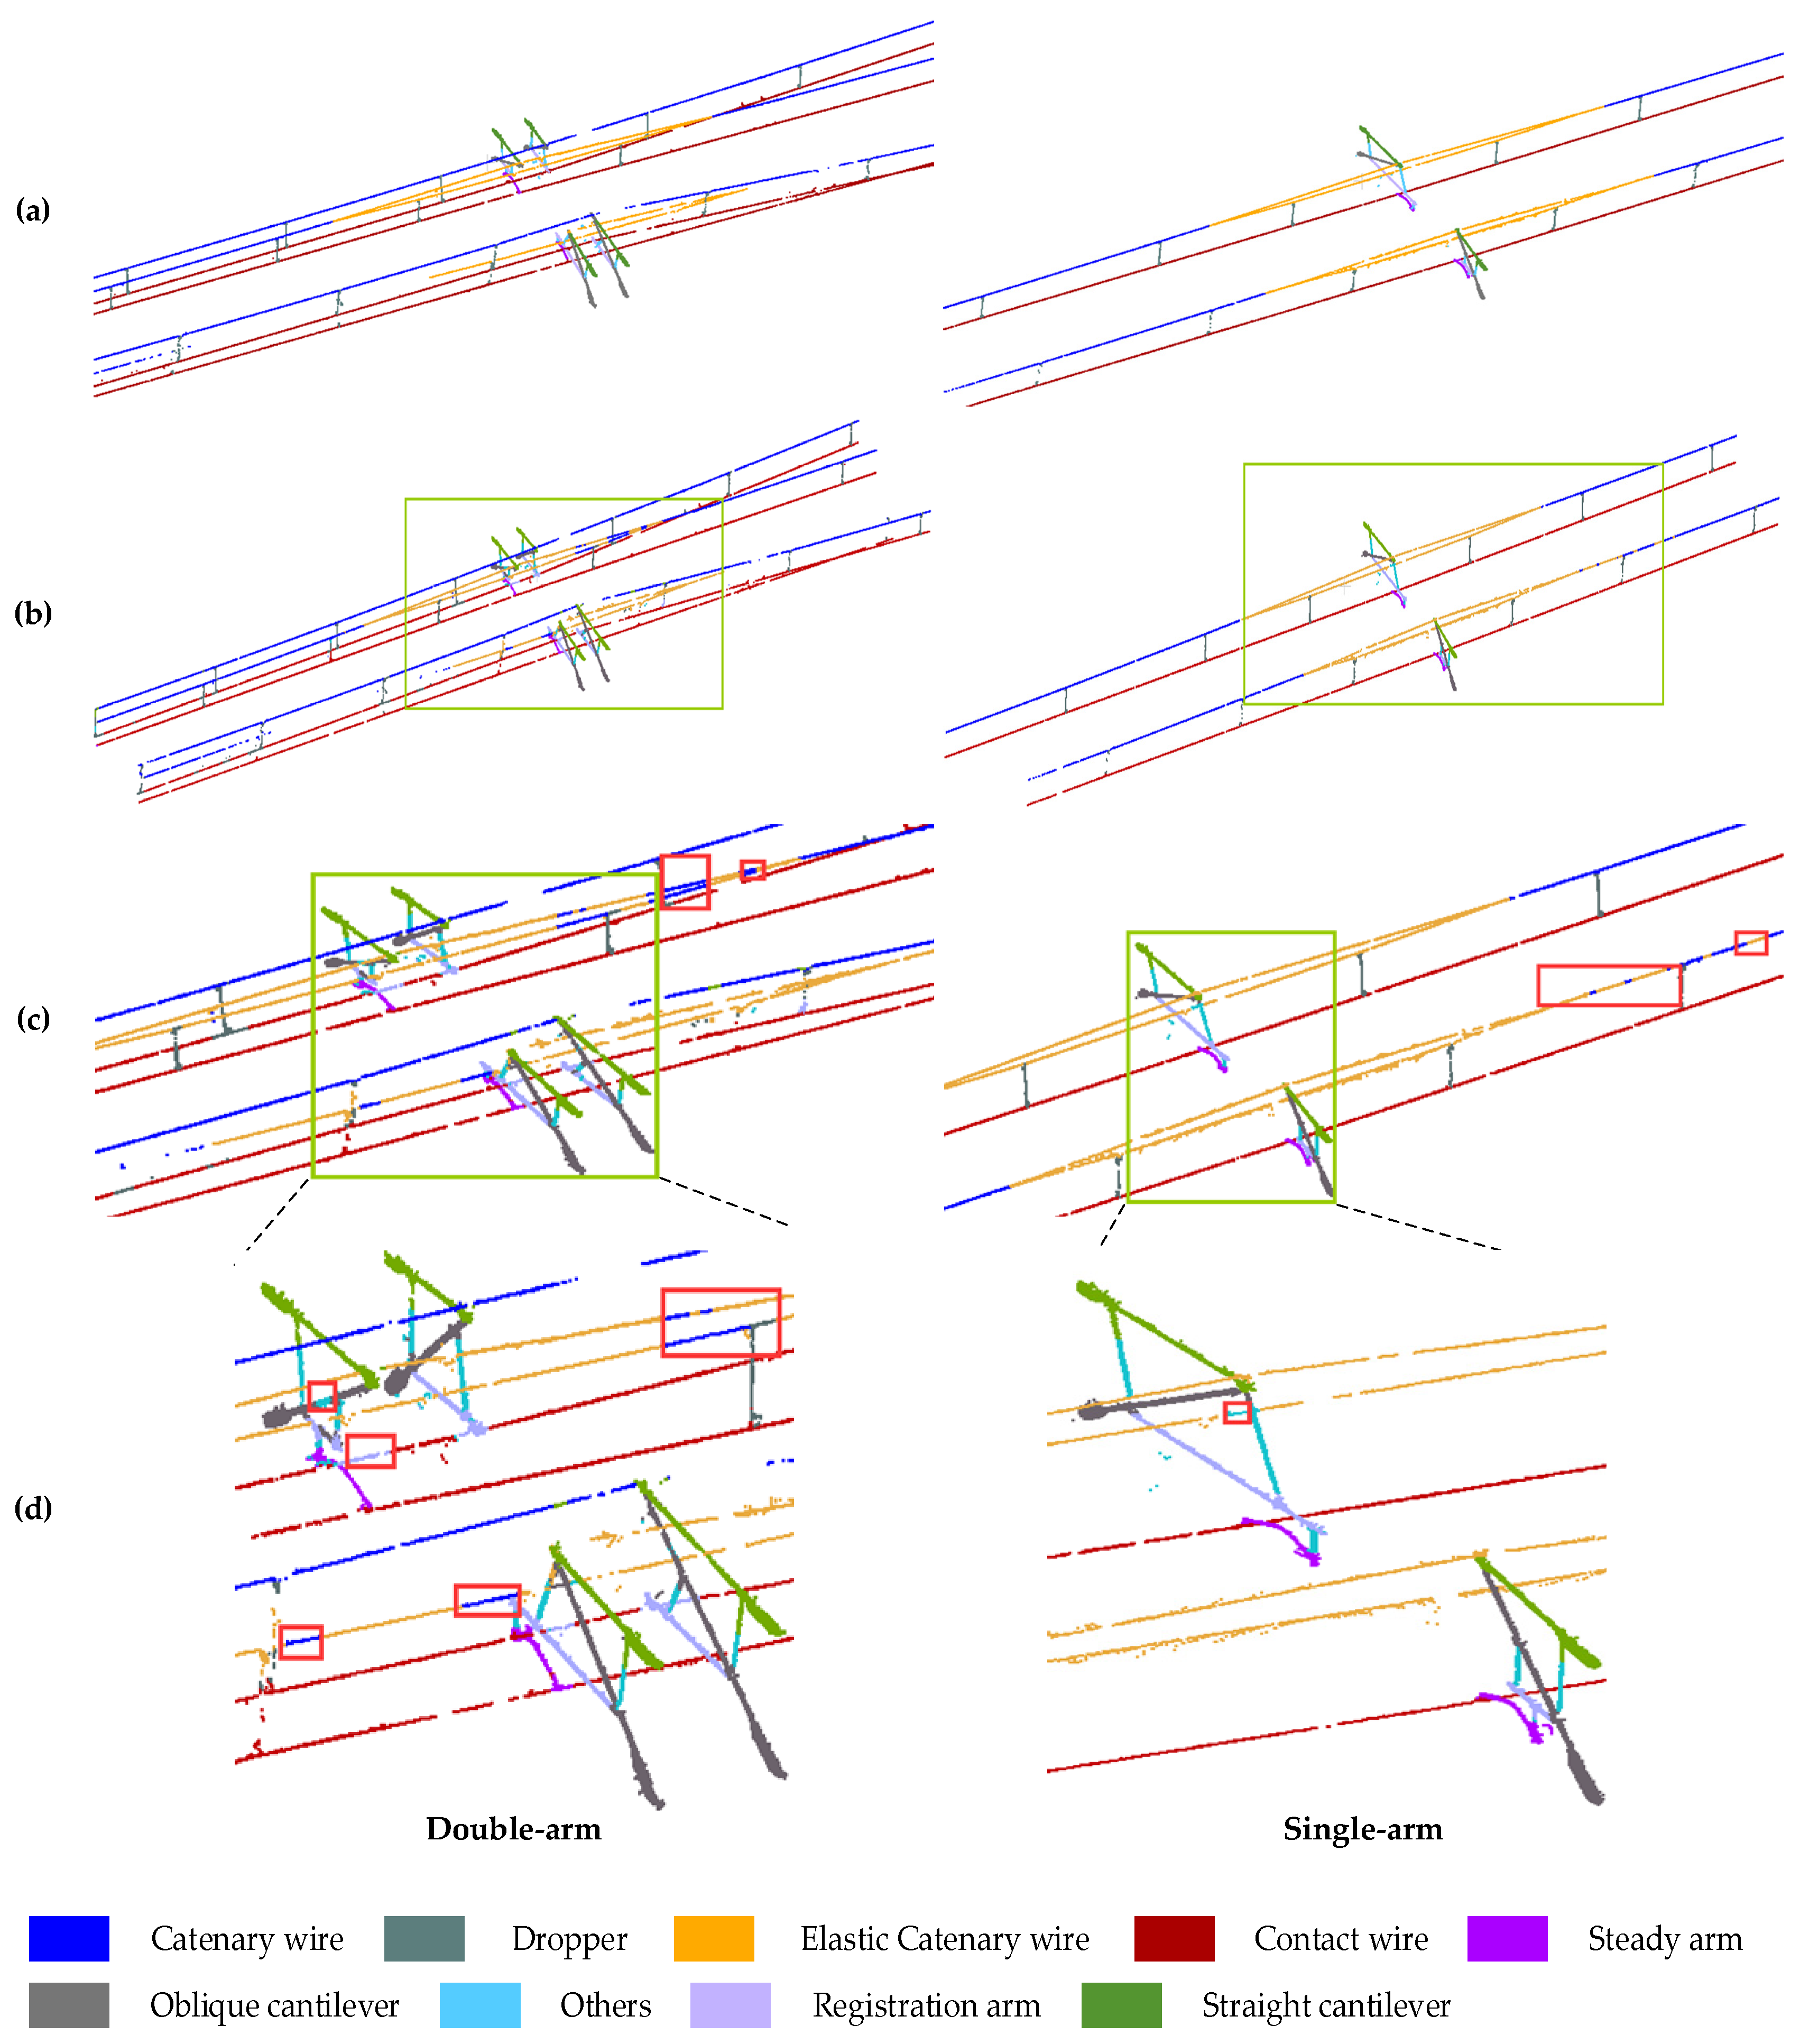
Figure 8.
Prediction results of single-arm and double-arm. (a) is the true value, (b) is the semantic segmentation result of PMFR-Net, (c) is the content in the green box in (b), and the red box is the wrongly classified point cloud, (d) is the content in the green box in (c), and the red box is the wrongly classified point cloud.
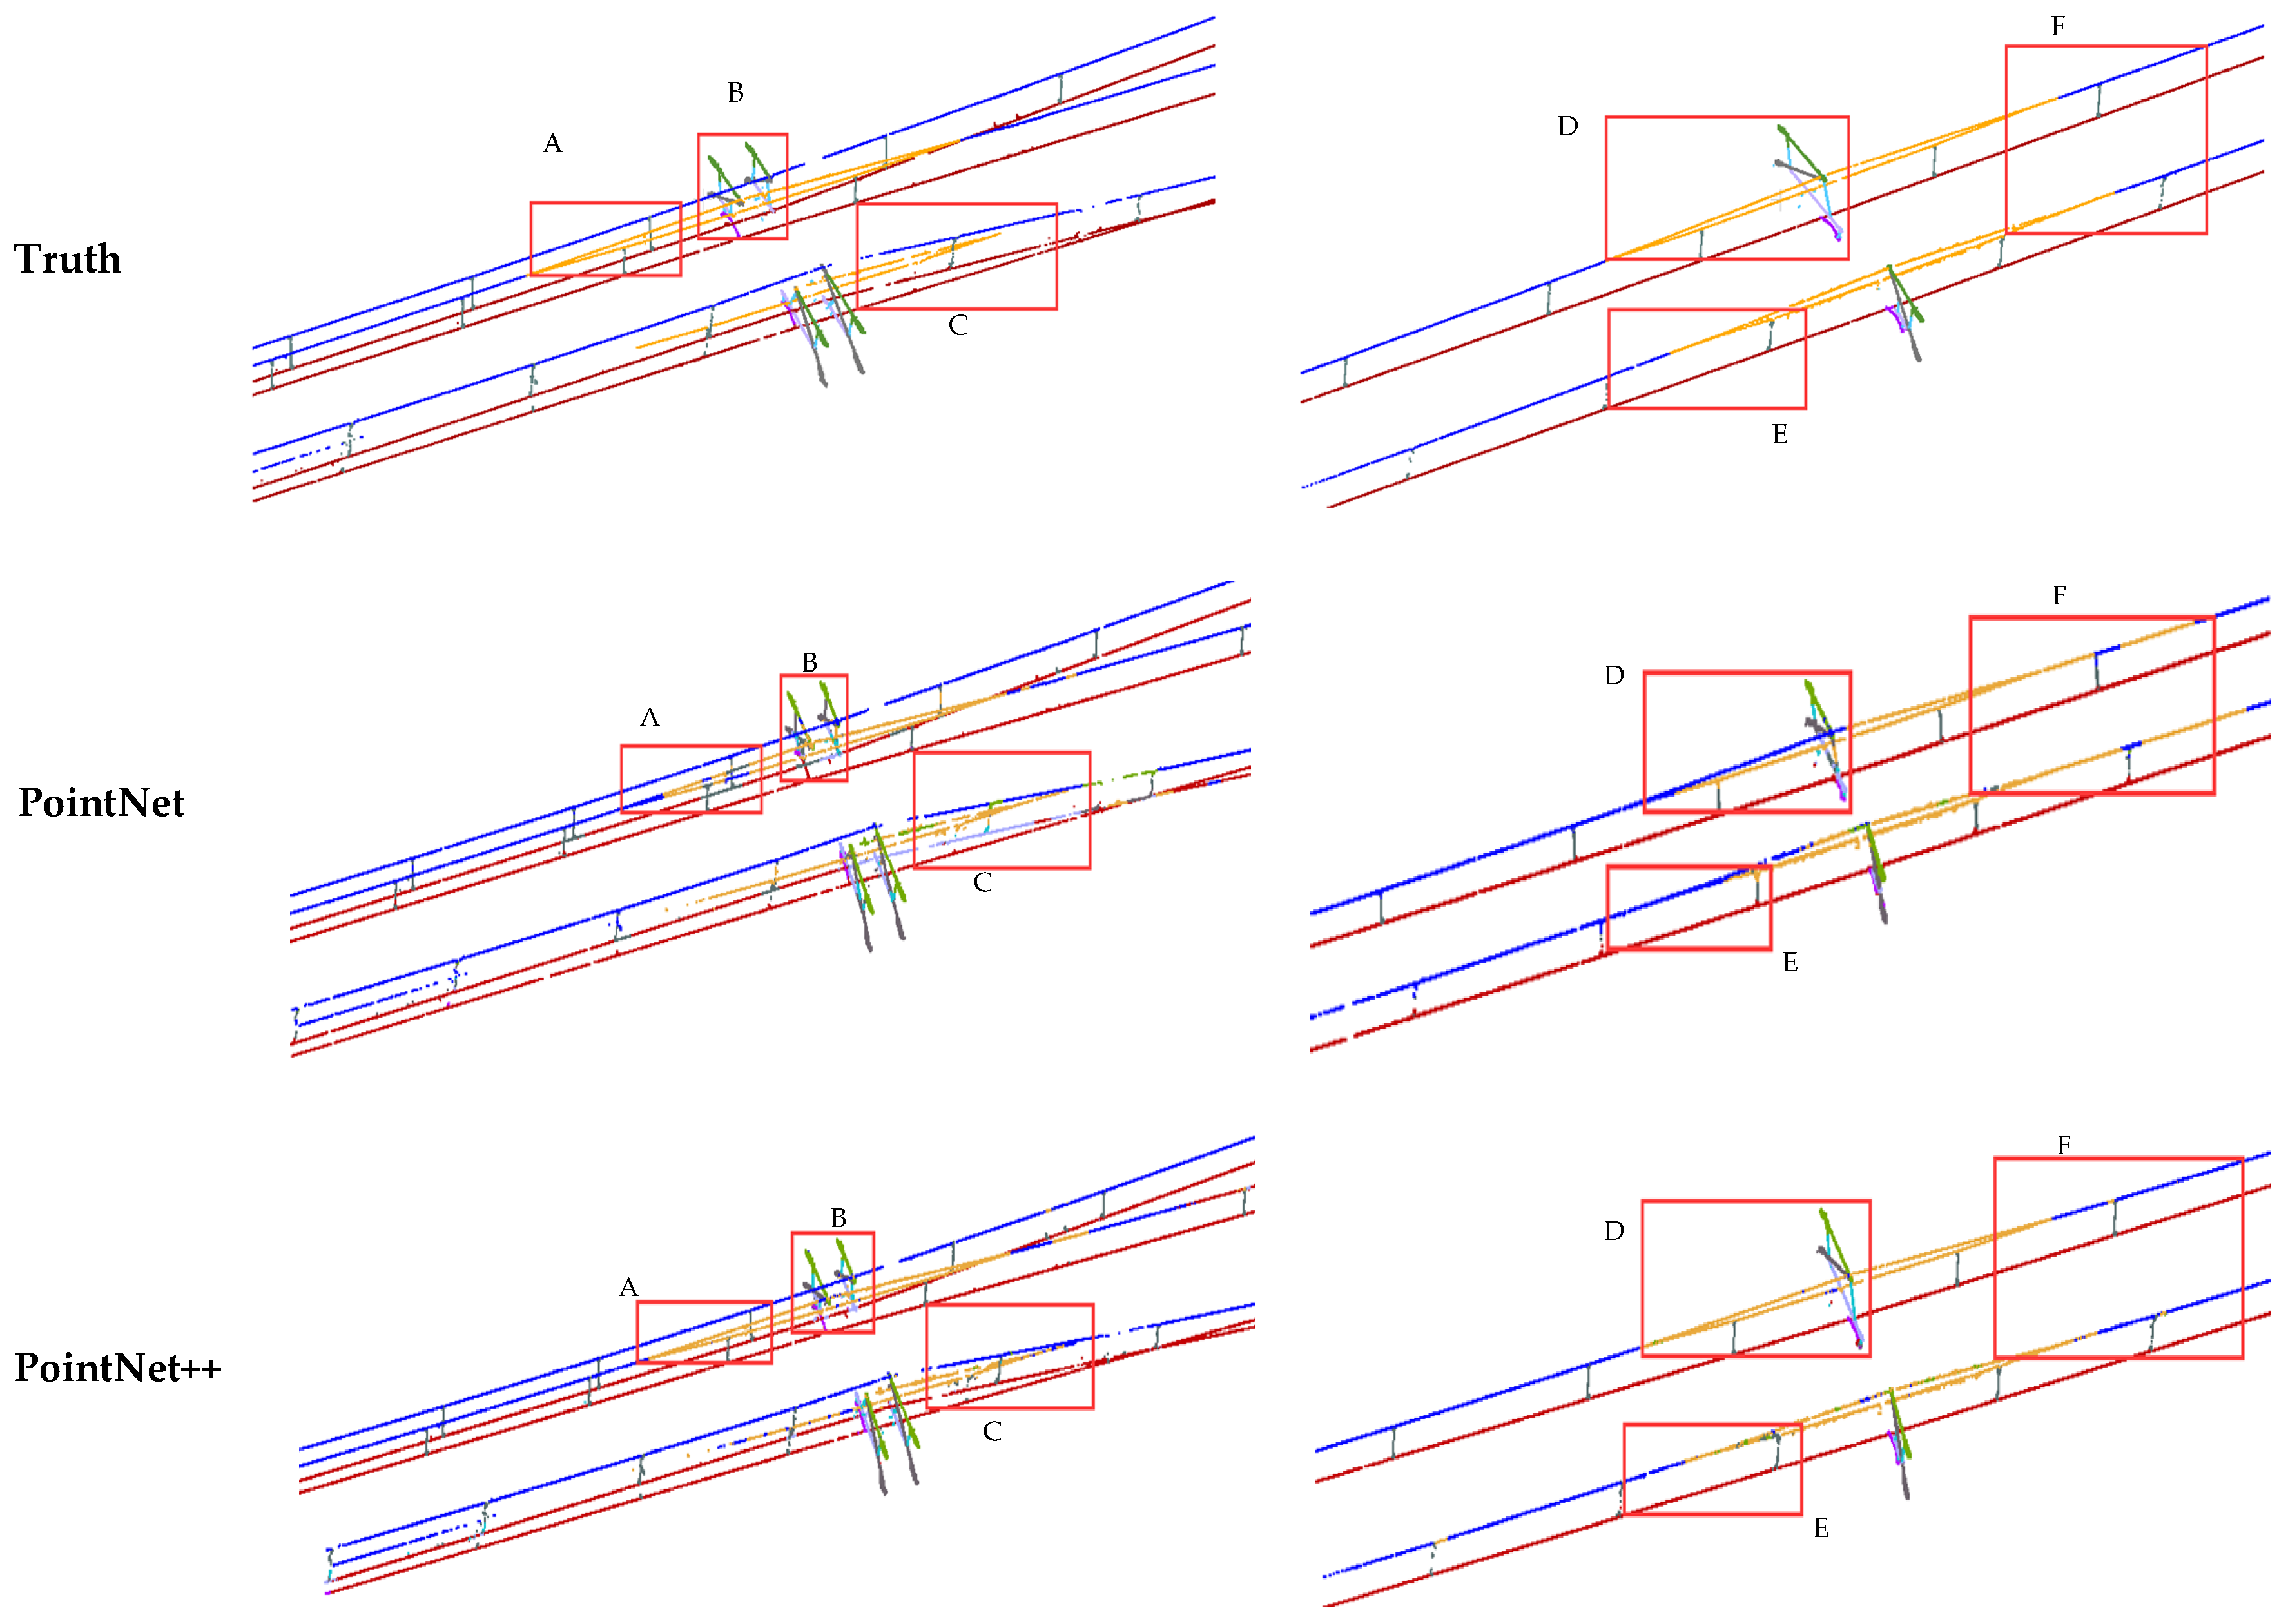
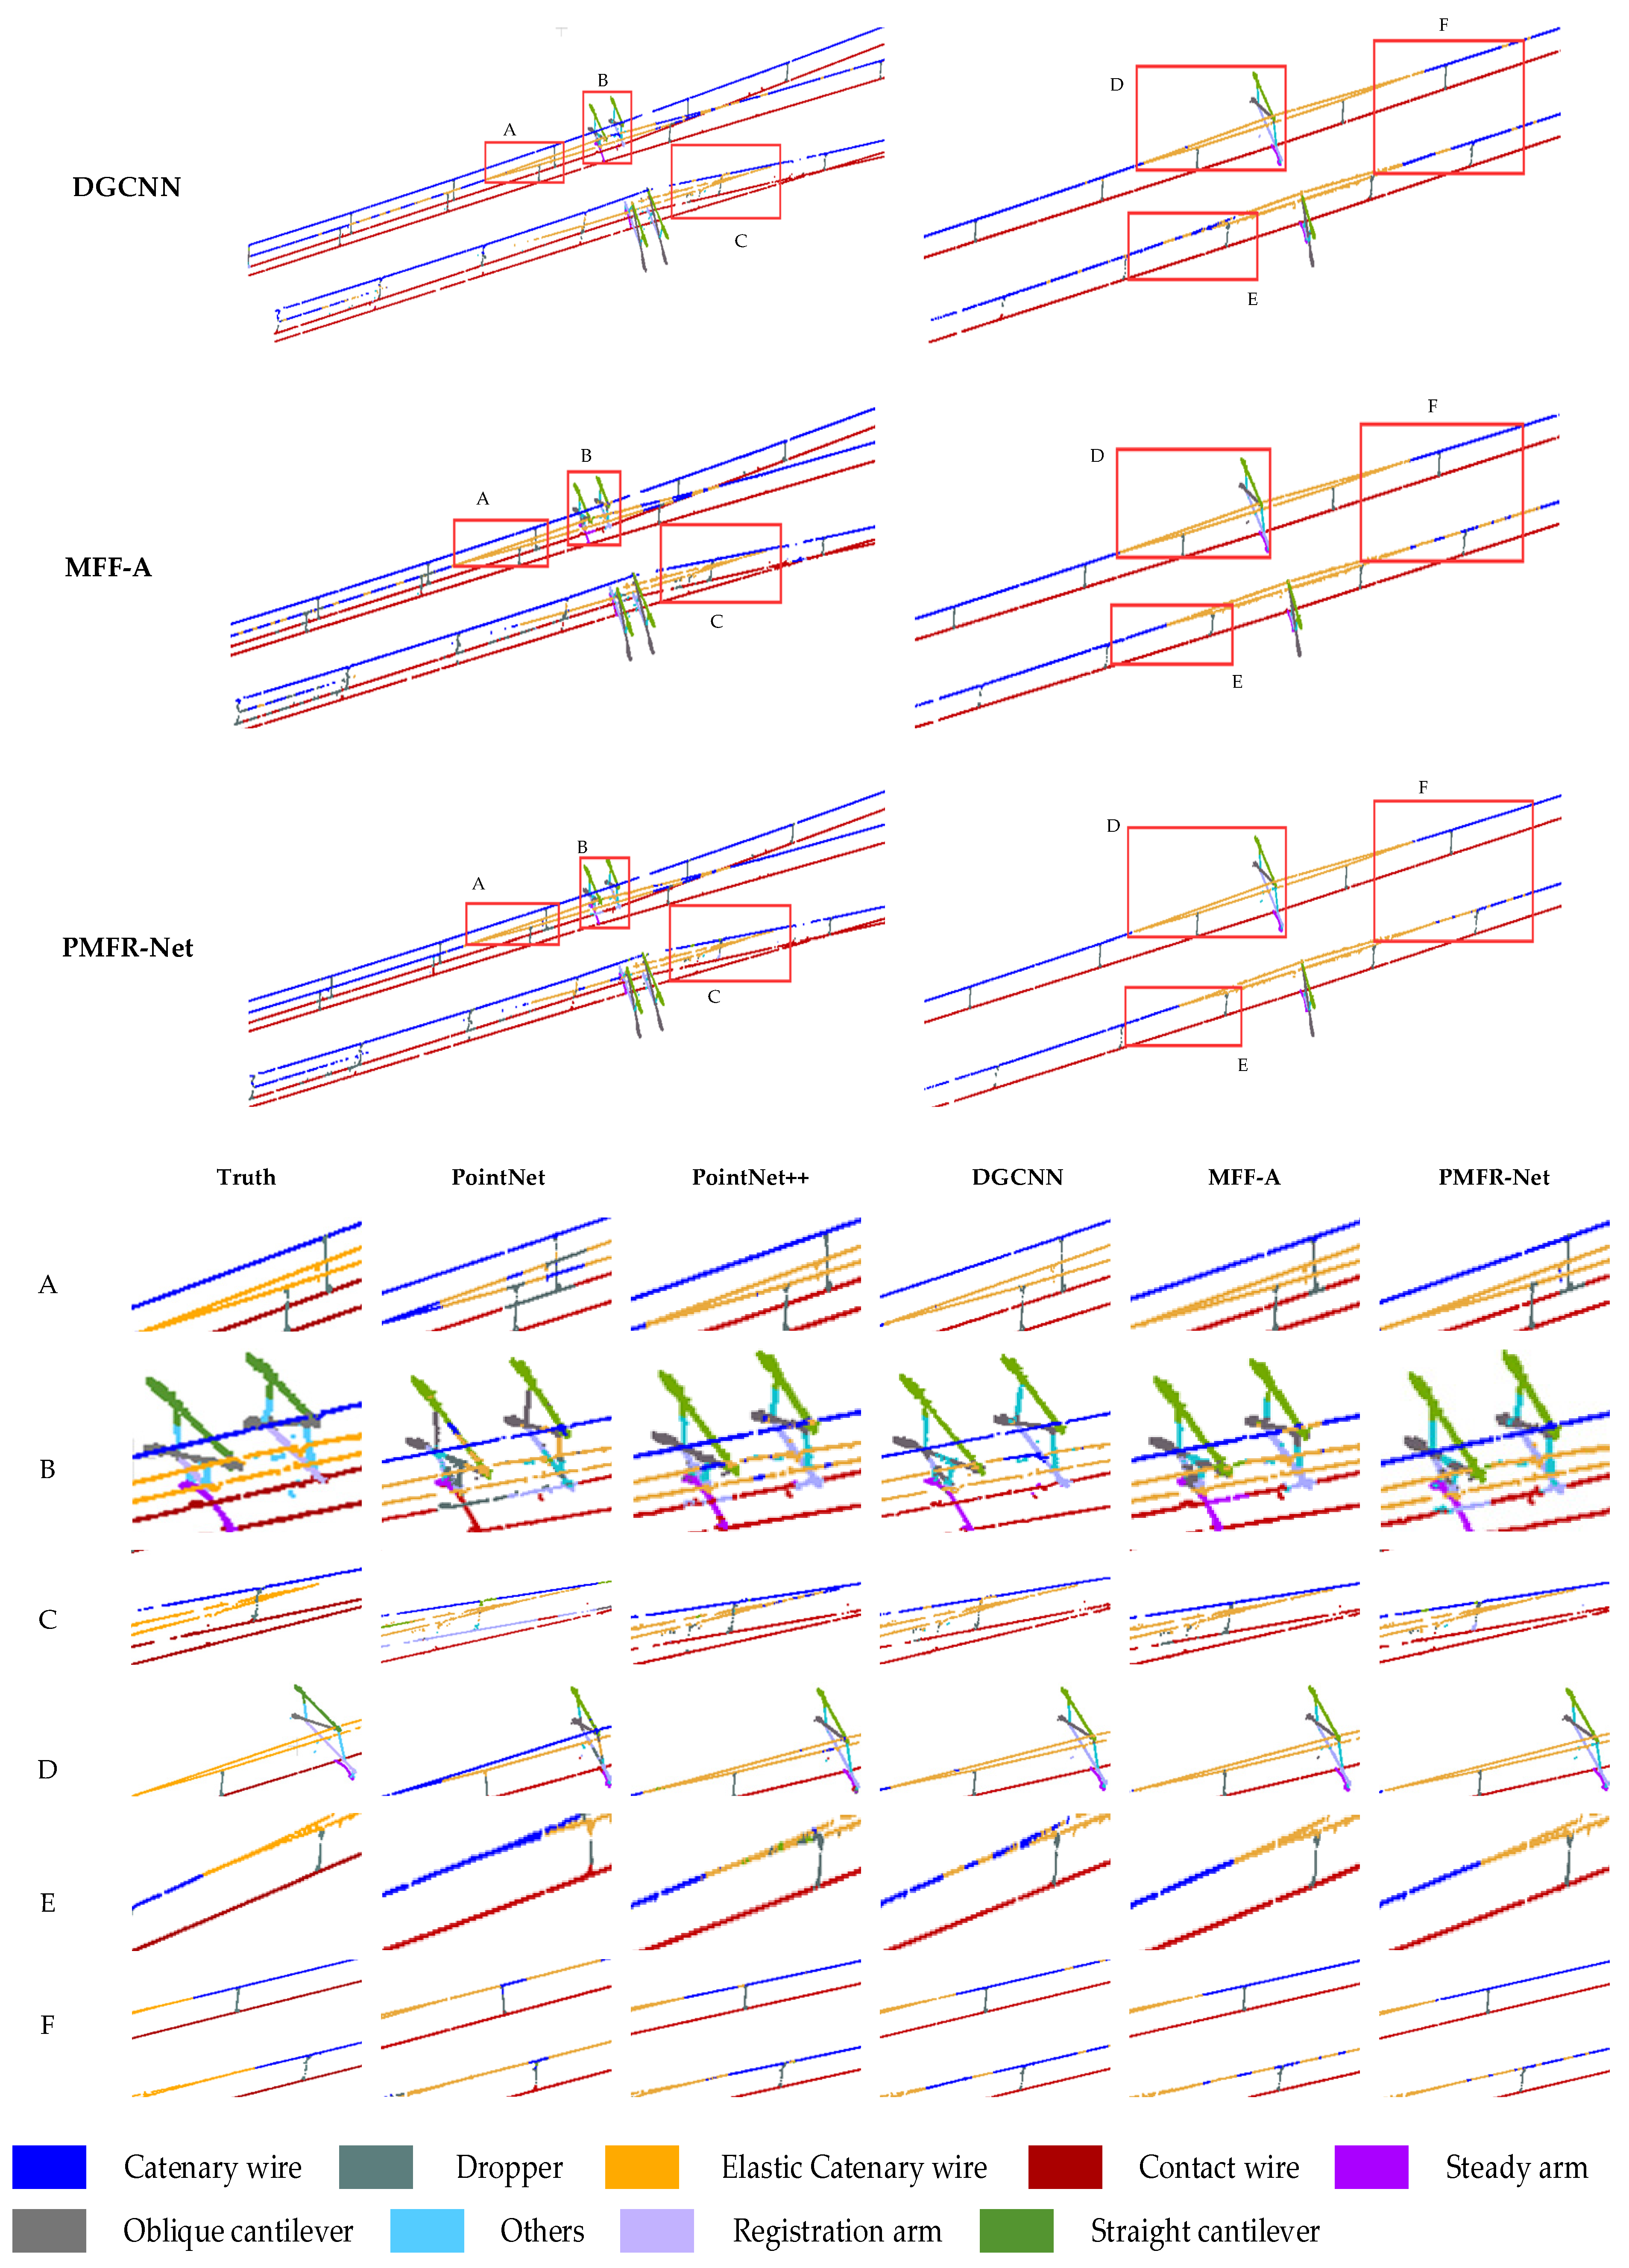
Figure 9.
Semantic segmentation results of the OCS point cloud are based on different methods. The range delineated in the red box is enlarged to present a more detailed visual comparison at the bottom, where A, B, and C are the ROI in the double-arm scene, and D, E, and F are the ROI in the single-arm scene.
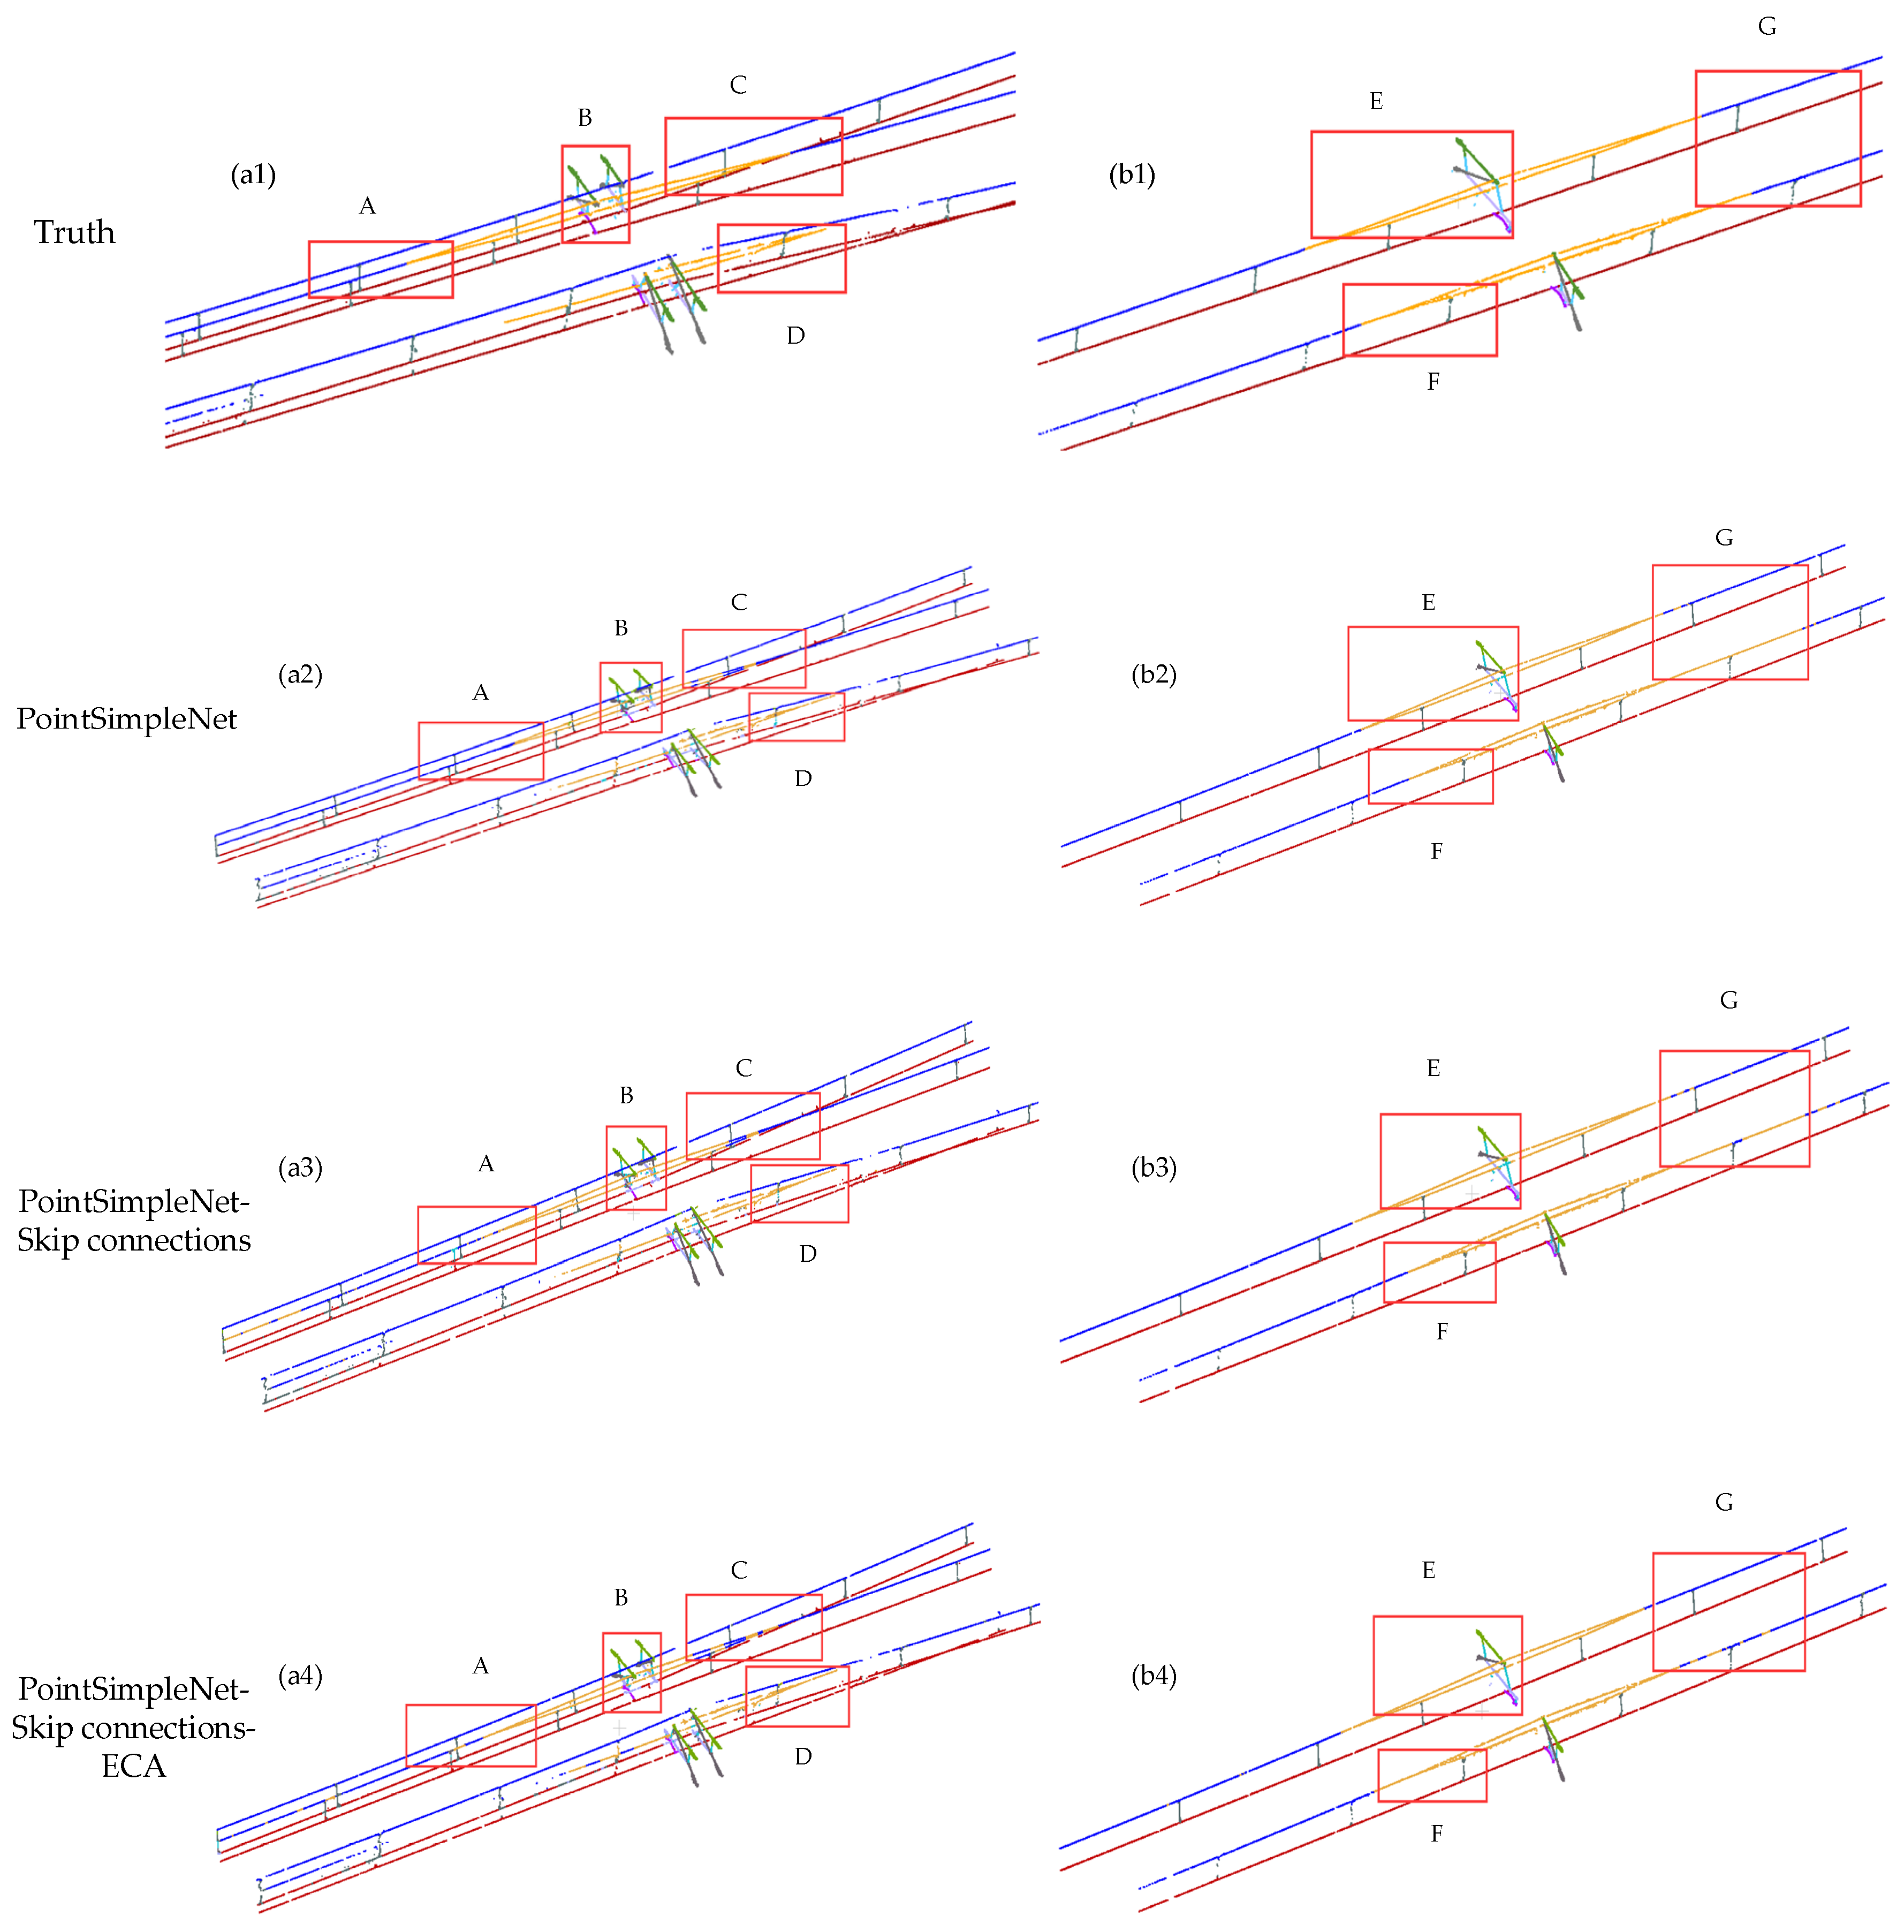
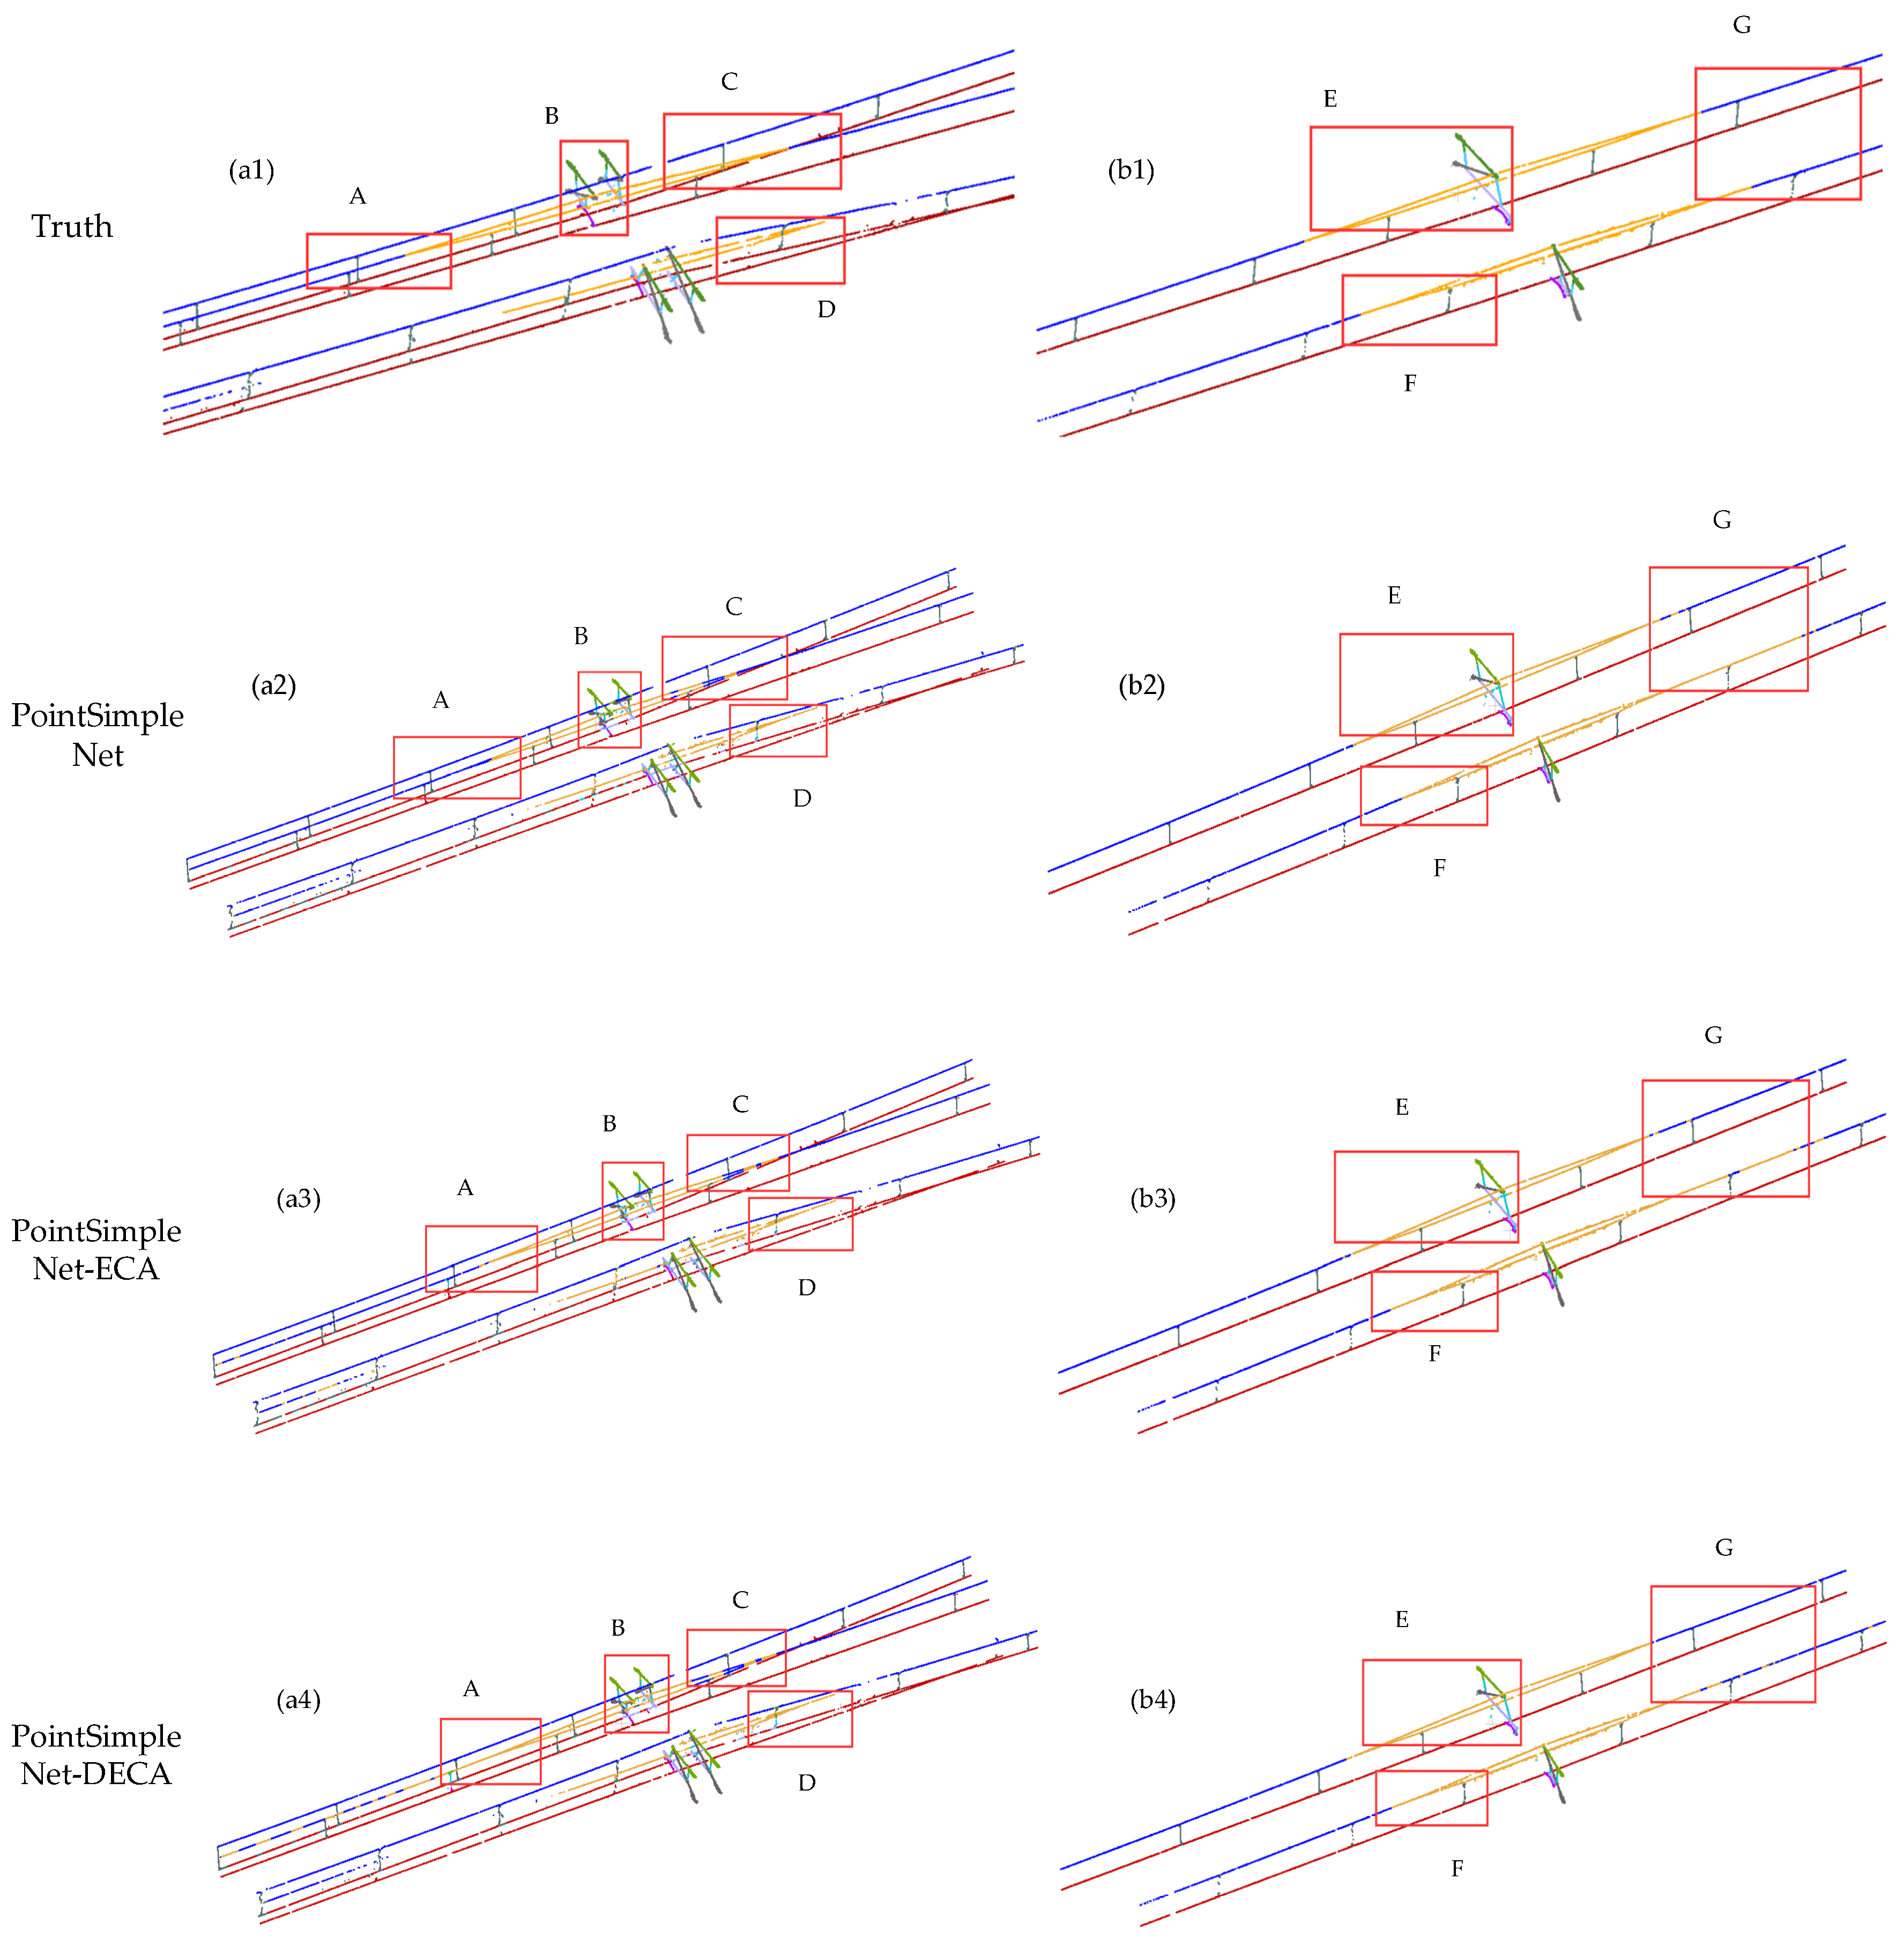
Figure 10.
Comparison results of different attention mechanisms added to the basic frame. Column (a1–a4) and column (b1–b4) are global maps of double-arm and single-arm scenes, respectively. The range delineated in the red box is enlarged to present a more detailed visual comparison at the bottom, where A, B, C, and D are the ROI in the double-arm scene, and E, F, and G are the ROI in the single-arm scene.
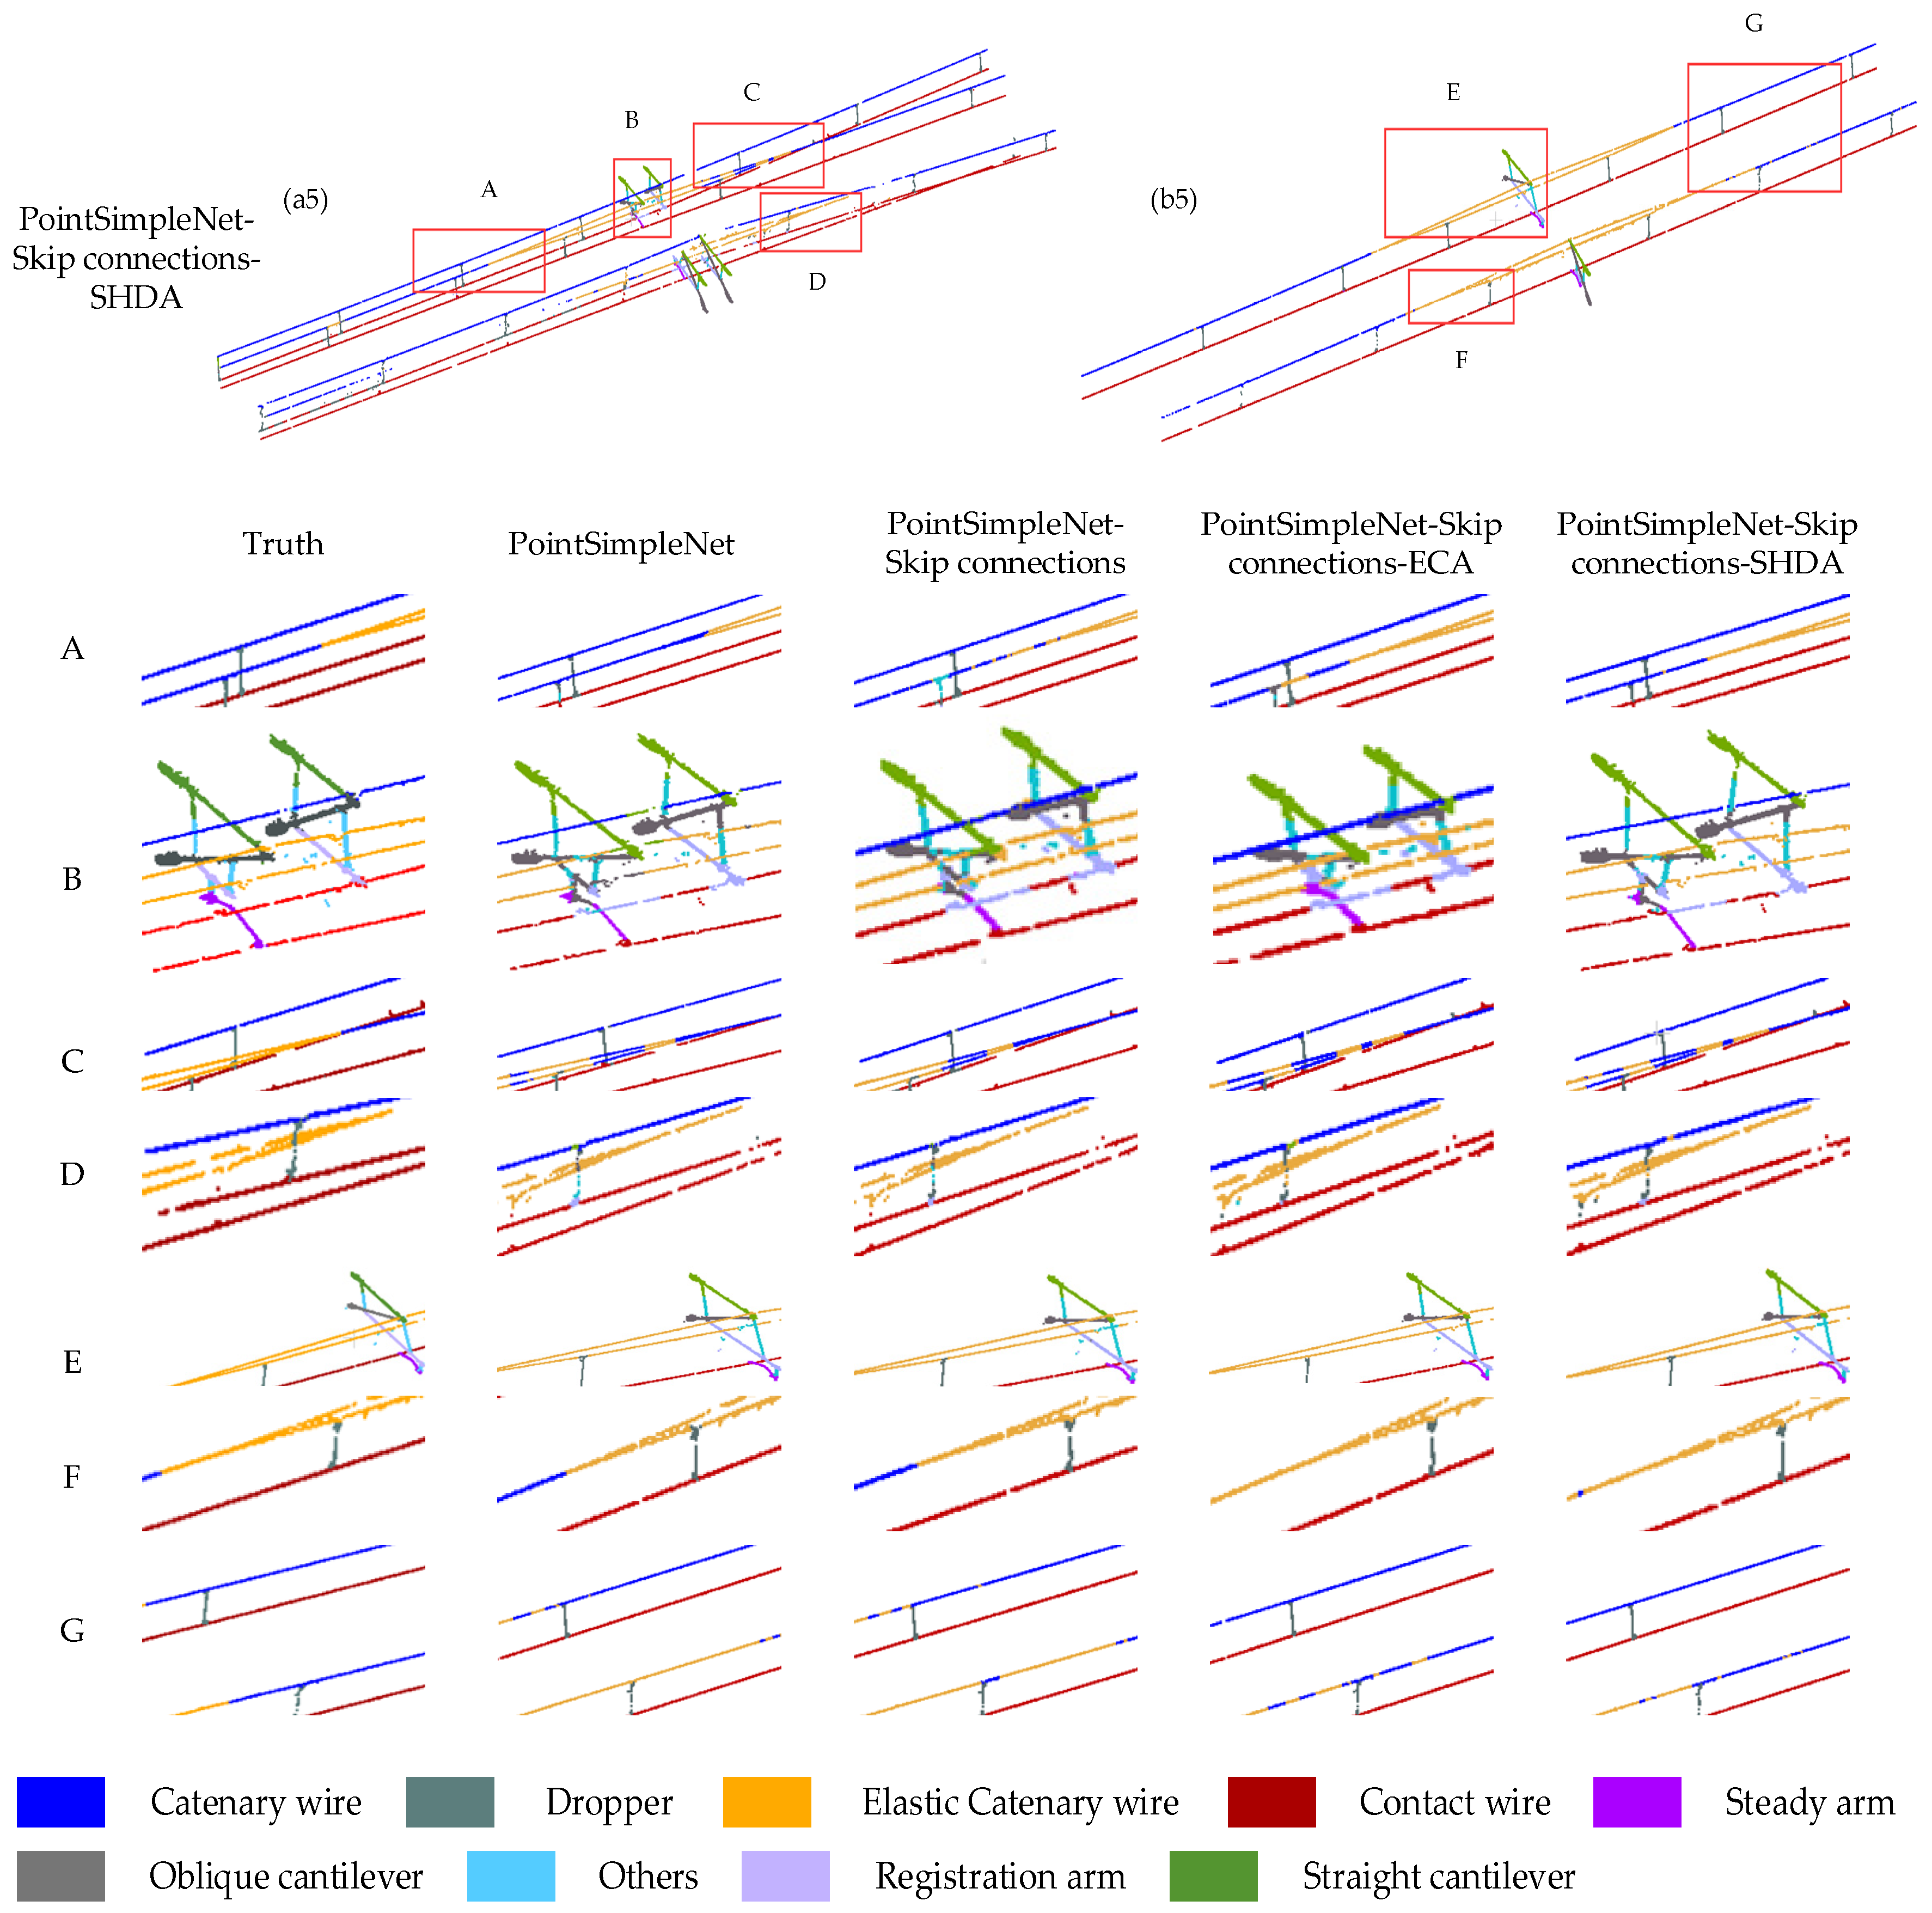
Figure 11.
Comparison results between different connection methods added to the basic frame. Columns (a1–a5) and column (b1–b5) are global maps of the double-arm scene and the single-arm scene, respectively. The range delineated in the red box is enlarged to present a more detailed visual comparison at the bottom, where A, B, C, and D are the ROI in the double-arm scene, and E, F, and G are the ROI in the single-arm scene.
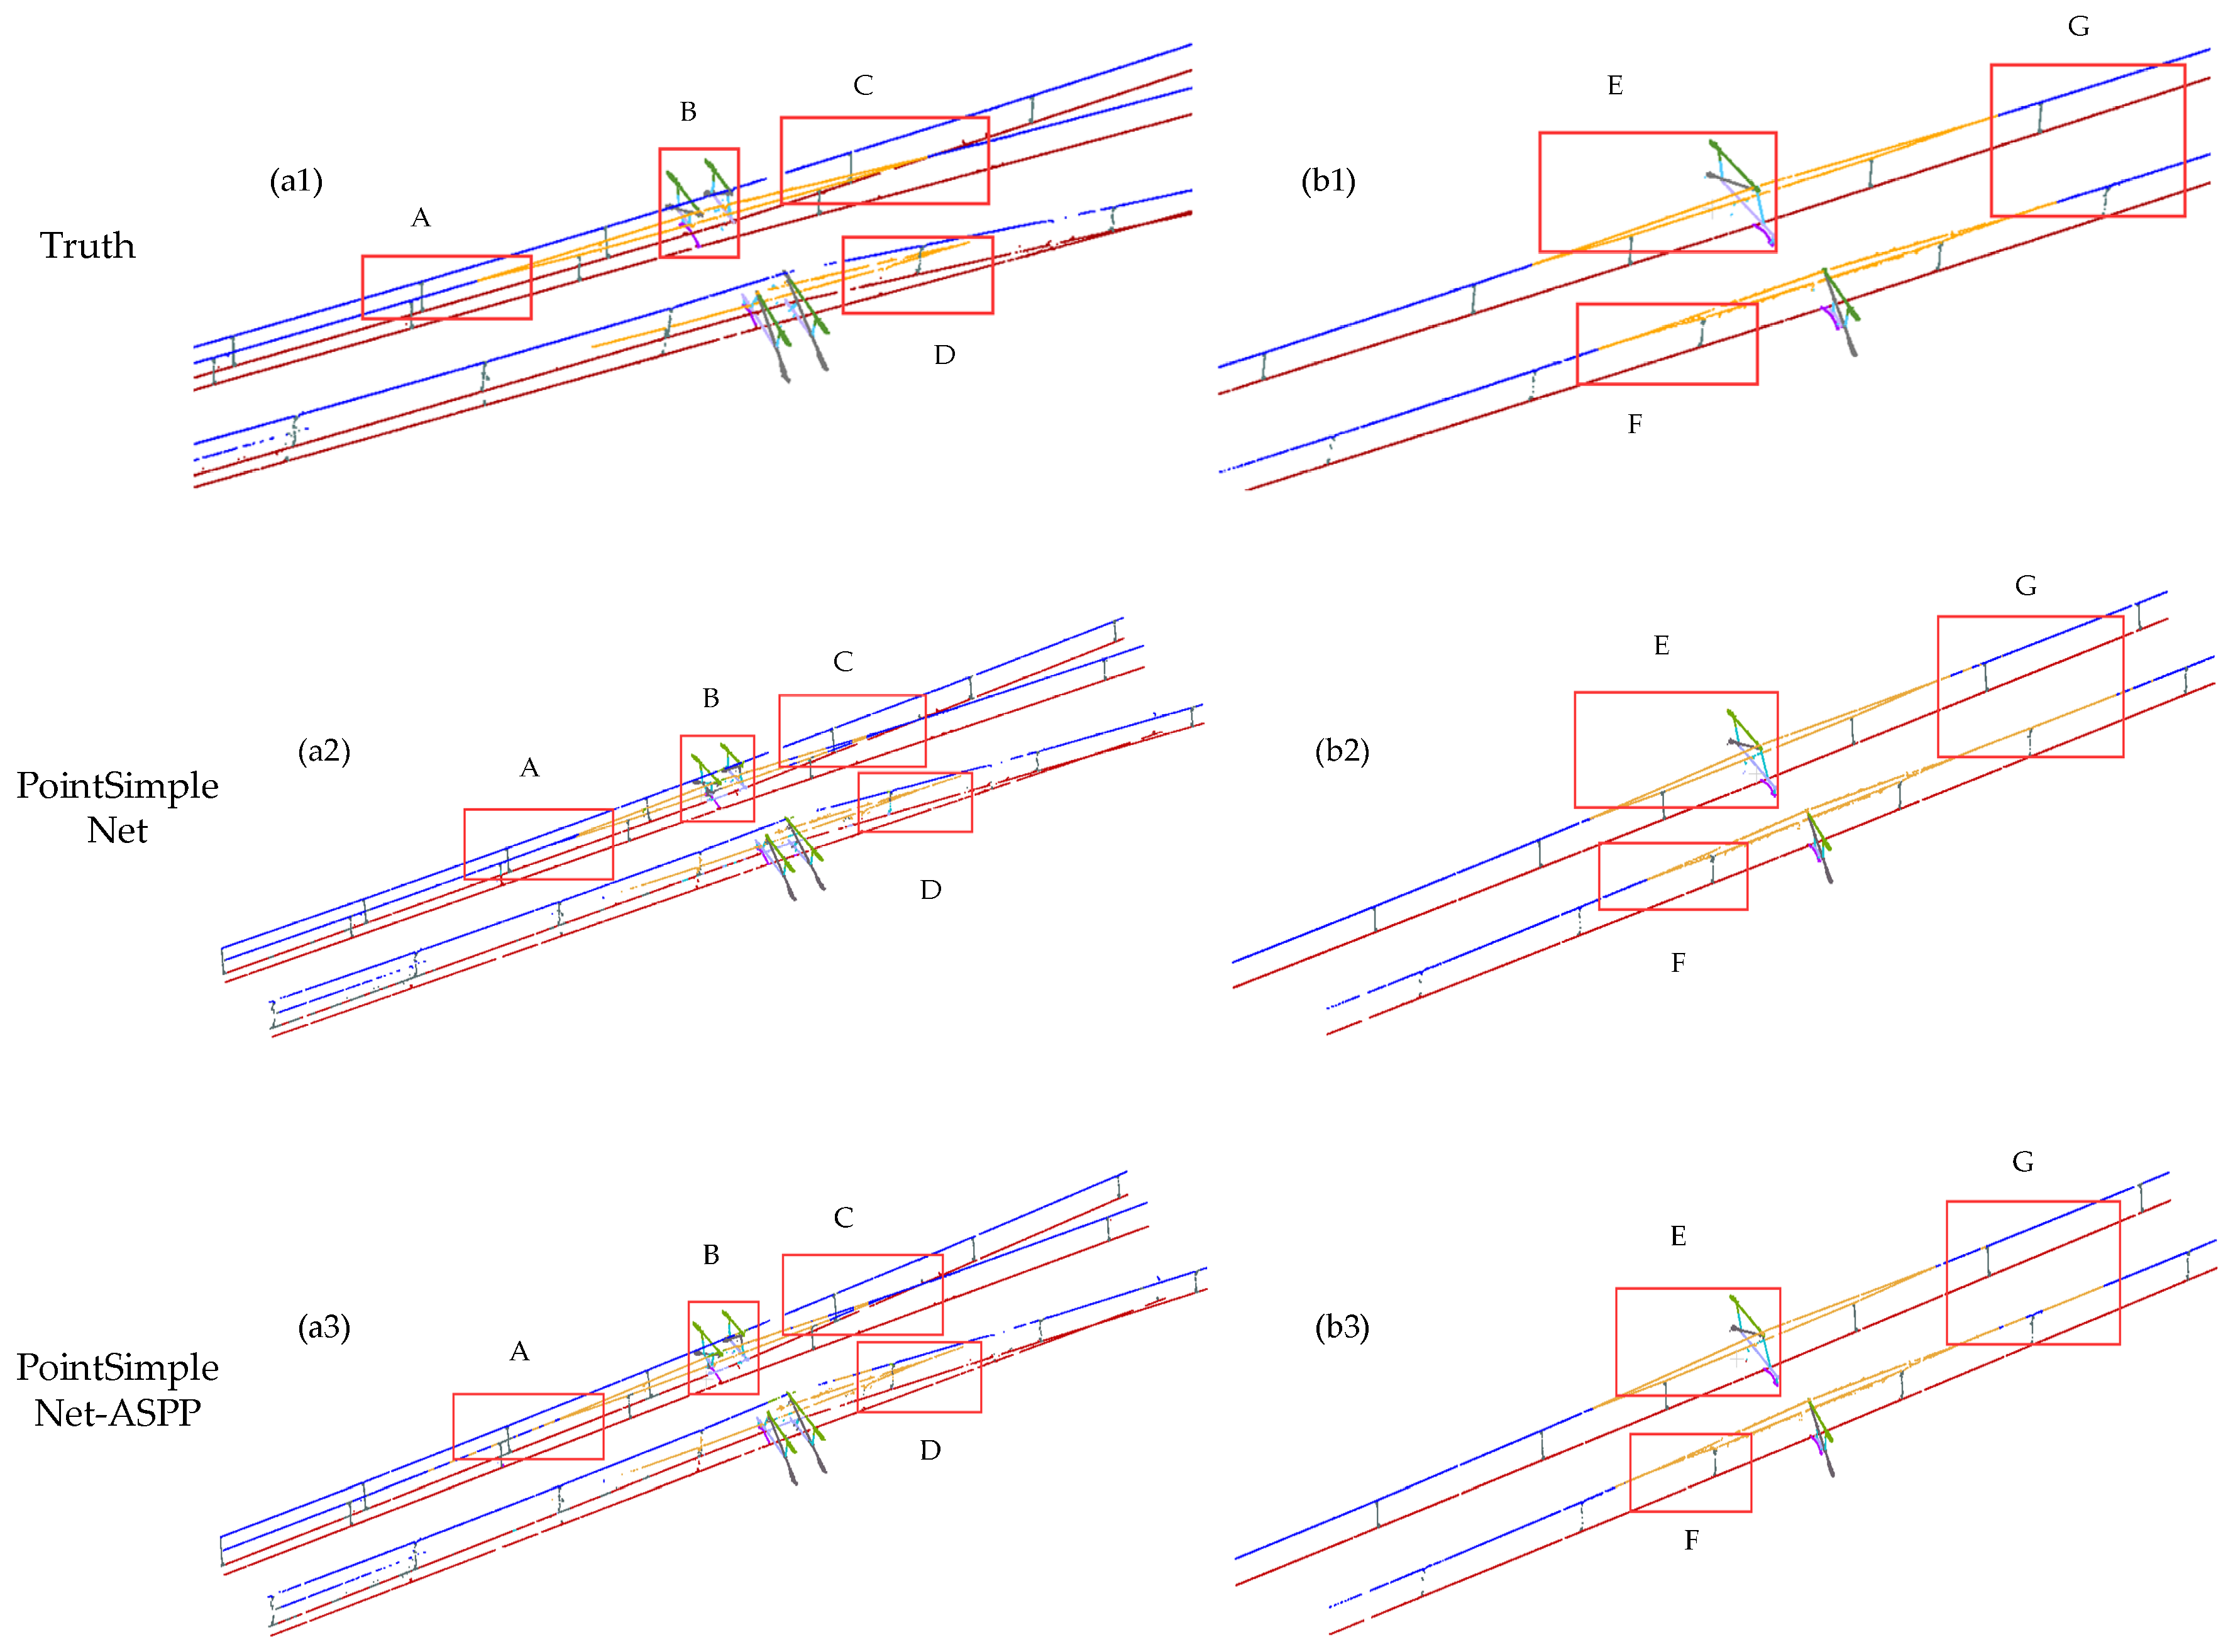
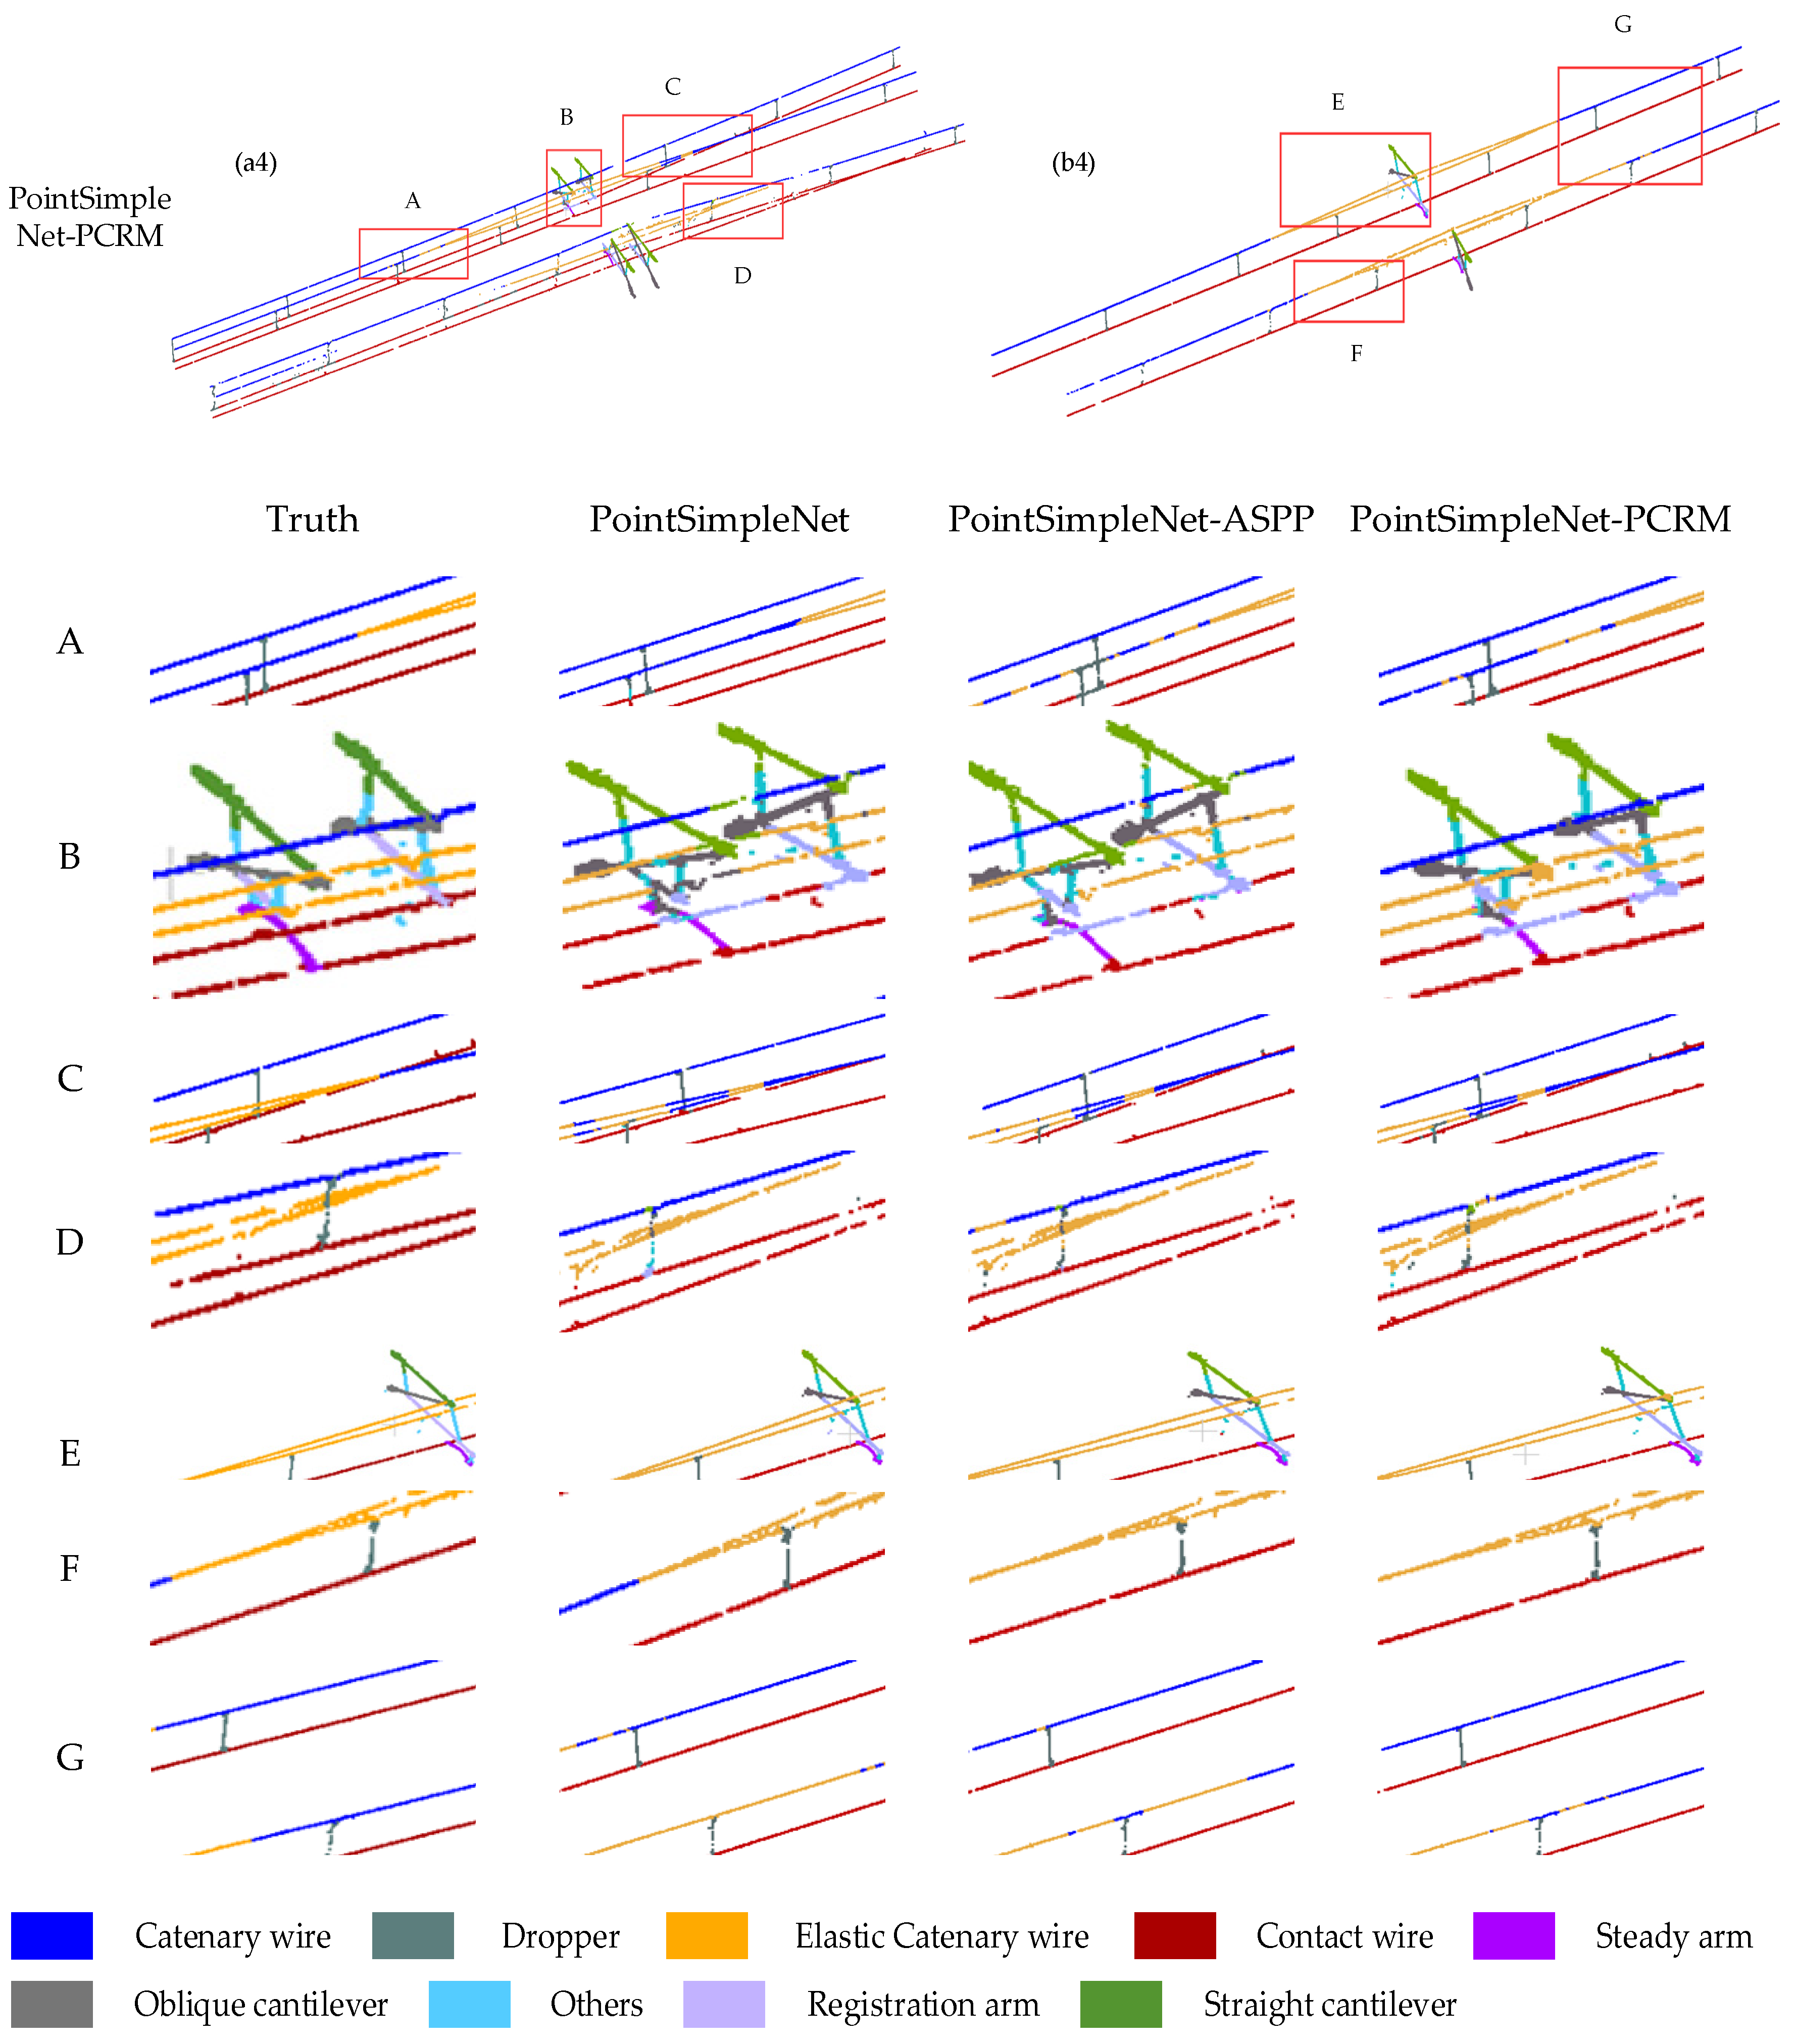
Figure 12.
Comparison results of different refinement modules. Column (a1–a4) and column (b1–b4) are global images of double-armed and single-armed structures, respectively. The range delineated in the red box is enlarged to present a more detailed visual comparison at the bottom, where A, B, C, and D are the ROI in the double-arm scene, and E, F, and G are the ROI in the single-arm scene.
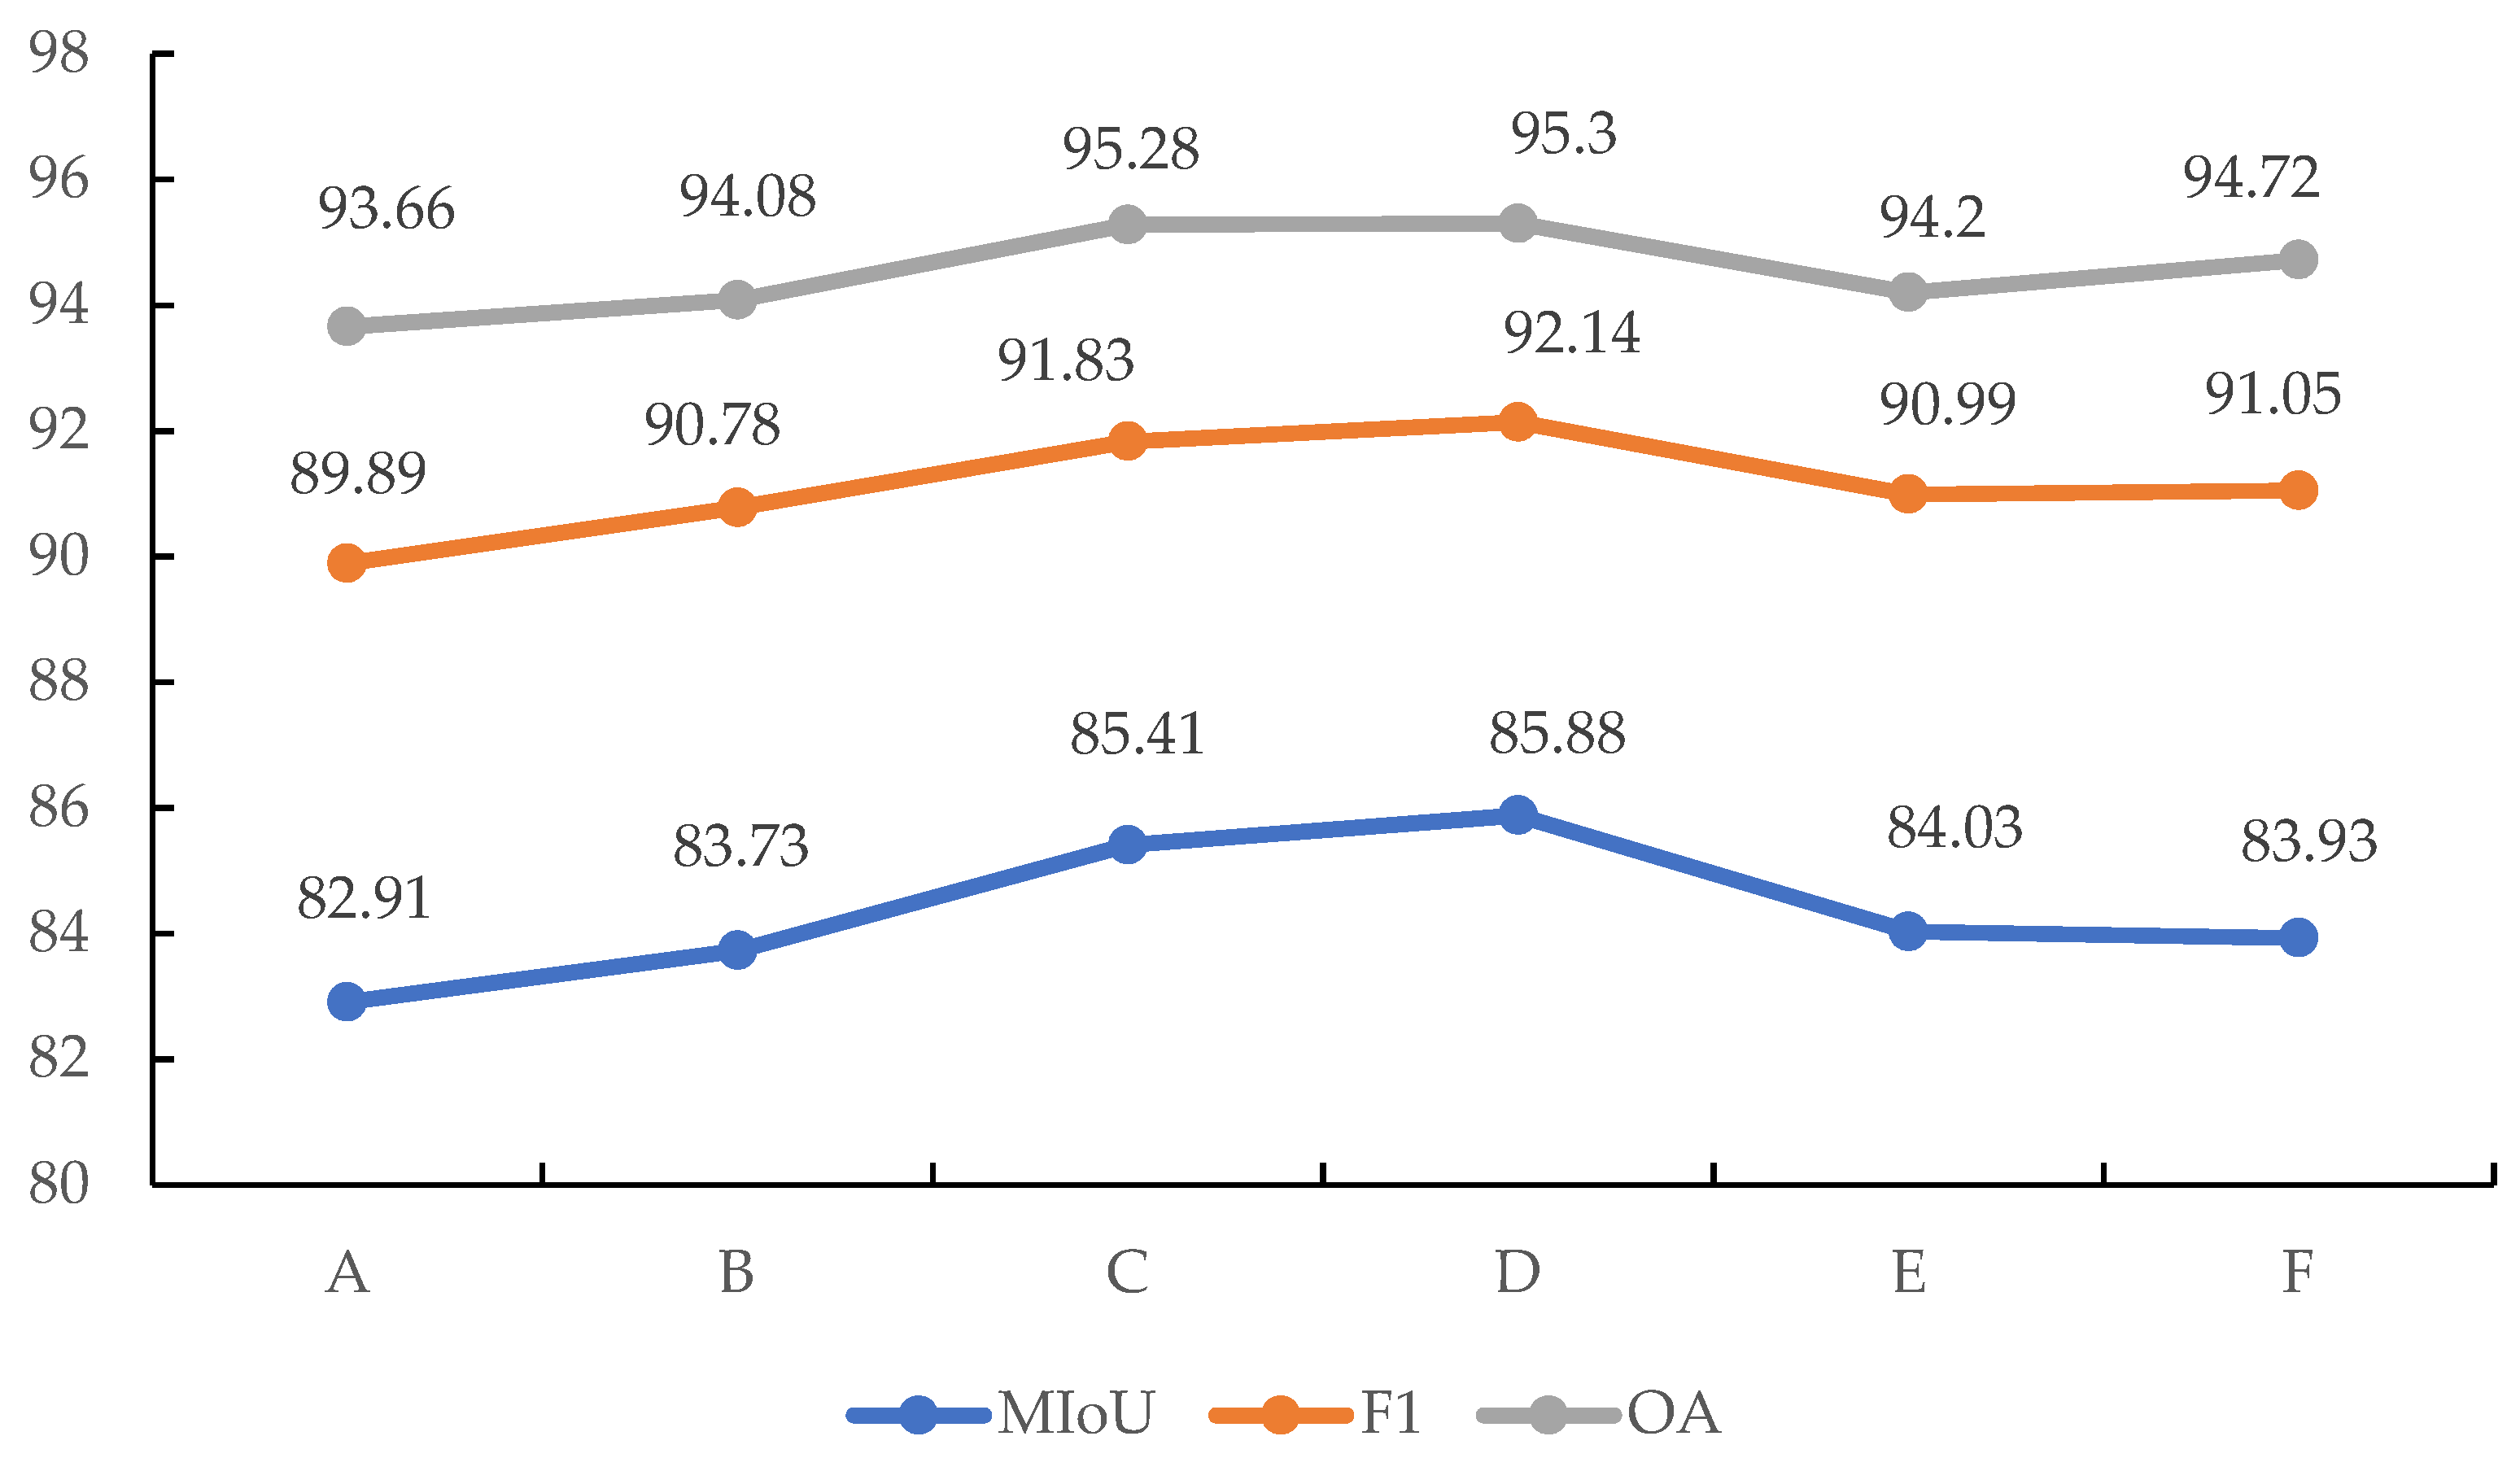
Figure 13.
Line charts of three different precision evaluations for different dilation rate combinations, where (A) refers to experiment without dilated convolution, (B) refers to the combination of dilation rate (1, 2, 4, 8), (C) refers to the combination of dilation rate (1, 2, 4, 8, 16), (D) refers to the combination of dilation rate (1, 2, 4, 8, 16, 32), (E) refers to the combination of dilation rate (1, 2, 4, 8, 16, 32, 48), and (F) refers to the dilation rate combination of (1, 2, 4, 8, 16, 32, 48, 64).
Table 1.
Data distribution introduction in the OCS dataset.
Table 1.
Data distribution introduction in the OCS dataset.
| | Single-Arm | Double-Arm | Training | Validation | Testing |
|---|
| Single-Arm | Double-Arm | Single-Arm | Double-Arm | Single-Arm | Double-Arm |
|---|
| The number of scenes | 68 | 20 | 55 | 15 | 11 | 4 | 2 | 1 |
| The number of points | 3.54 × 10⁷ | 1.4 × 10⁷ | 2.9 × 10⁷ | 1.1 × 10⁷ | 5.7 × 10⁶ | 2.8 × 10⁶ | 1.04 × 10⁶ | 7 × 10⁵ |
Table 2.
Distribution of the number of rooms for the S3DIS dataset.
Table 2.
Distribution of the number of rooms for the S3DIS dataset.
| | Area 1 | Area 2 | Area 3 | Area 4 | Area 5 | Area 6 | Total |
|---|
| Training | Validation | Testing |
|---|
| The number of rooms | 44 | 40 | 23 | 49 | 68 | 48 | 217 | 48 | 7 |
Table 3.
Precision evaluation comparison of the OCS dataset semantic segmentation. The overall accuracy evaluation of the two scenes is shown in bold.
Table 3.
Precision evaluation comparison of the OCS dataset semantic segmentation. The overall accuracy evaluation of the two scenes is shown in bold.
| | OA (%) | F1-Score (%) | MIoU (%) |
|---|
| Single-Arm | Double-Arm | Single-Arm | Double-Arm | Single-Arm | Double-Arm |
|---|
| Catenary wire | 94.61 | 96.34 | 94.41 | 96.39 | 89.43 | 93.03 |
| Steady arm | 97.81 | 94.66 | 95.04 | 93.84 | 90.55 | 88.39 |
| Oblique cantilever | 98.87 | 96.65 | 99.06 | 92.15 | 98.14 | 85.45 |
| Straight cantilever | 98.02 | 81.59 | 98.01 | 89.55 | 96.10 | 81.08 |
| Elastic catenary wire | 92.92 | 91.36 | 93.19 | 89.40 | 87.26 | 80.84 |
| Registration arm | 96.52 | 88.16 | 93.74 | 91.61 | 88.21 | 84.51 |
| Dropper | 91.69 | 68.13 | 90.72 | 73.19 | 83.02 | 57.71 |
| Contact wire | 99.53 | 98.92 | 99.67 | 97.79 | 99.35 | 95.68 |
| average | 95.77 | 93.24 | 87.68 |
Table 4.
Quantitative evaluation of the comparative methods on the OCS point cloud dataset (%). The average is underlined and the best metrics are highlighted in bold.
Table 4.
Quantitative evaluation of the comparative methods on the OCS point cloud dataset (%). The average is underlined and the best metrics are highlighted in bold.
| Method | Scene_Class | OA | Precision | Recall | MIoU | F1-Score | Time(h) |
|---|
| PointNet [24] | single-arm | 86.24 | 86.53 | 79.23 | 71.06 | 82.06 | 5 |
| double-arm | 88.50 | 75.79 | 82.46 | 65.37 | 77.74 |
| average | 87.37 | 81.16 | 80.84 | 68.22 | 79.90 |
PointNet++
[25] | single-arm | 95.90 | 91.61 | 91.06 | 86.17 | 91.12 | 4.5 |
| double-arm | 93.88 | 90.31 | 91.35 | 83.23 | 90.62 |
| average | 94.11 | 91.18 | 91.16 | 85.19 | 90.97 |
| DGCNN [27] | single-arm | 93.71 | 94.23 | 90.23 | 85.64 | 92.11 | 5 |
| double-arm | 92.40 | 88.07 | 86.45 | 77.56 | 86.61 |
| average | 93.18 | 91.76 | 88.53 | 82.13 | 89.89 |
| MFF-A [26] | single-arm | 95.89 | 94.93 | 94.25 | 89.79 | 94.54 | 5.5 |
| double-arm | 92.50 | 86.24 | 87.87 | 77.87 | 86.73 |
| average | 94.53 | 90.59 | 91.06 | 83.83 | 90.64 |
| Ours | single-arm | 96.58 | 96.25 | 94.76 | 91.51 | 95.48 | 4 |
| double-arm | 94.57 | 89.48 | 91.92 | 83.34 | 90.49 |
| average | 95.77 | 92.97 | 93.54 | 87.62 | 93.24 |
Table 5.
Quantitative evaluation (%) of comparative methods on the S3DIS point cloud dataset. The best metric is highlighted in bold.
Table 5.
Quantitative evaluation (%) of comparative methods on the S3DIS point cloud dataset. The best metric is highlighted in bold.
| Method | Precision | Recall | F1-Score | OA | MIoU | Time(h) |
|---|
| PointNet [24] | 83.29 | 81.33 | 80.69 | 92.36 | 70.69 | 7.5 |
| PointNet++(32) [25] | 90.59 | 91.56 | 90.78 | 95.45 | 79.69 | 33 |
| DGCNN [27] | 88.88 | 76.48 | 79.45 | 93.49 | 69.89 | 8 |
| MMF-A [26] | 93.99 | 92.76 | 93.28 | 96.65 | 87.96 | 9.5 |
| Ours | 96.42 | 94.94 | 95.63 | 97.72 | 91.84 | 8 |
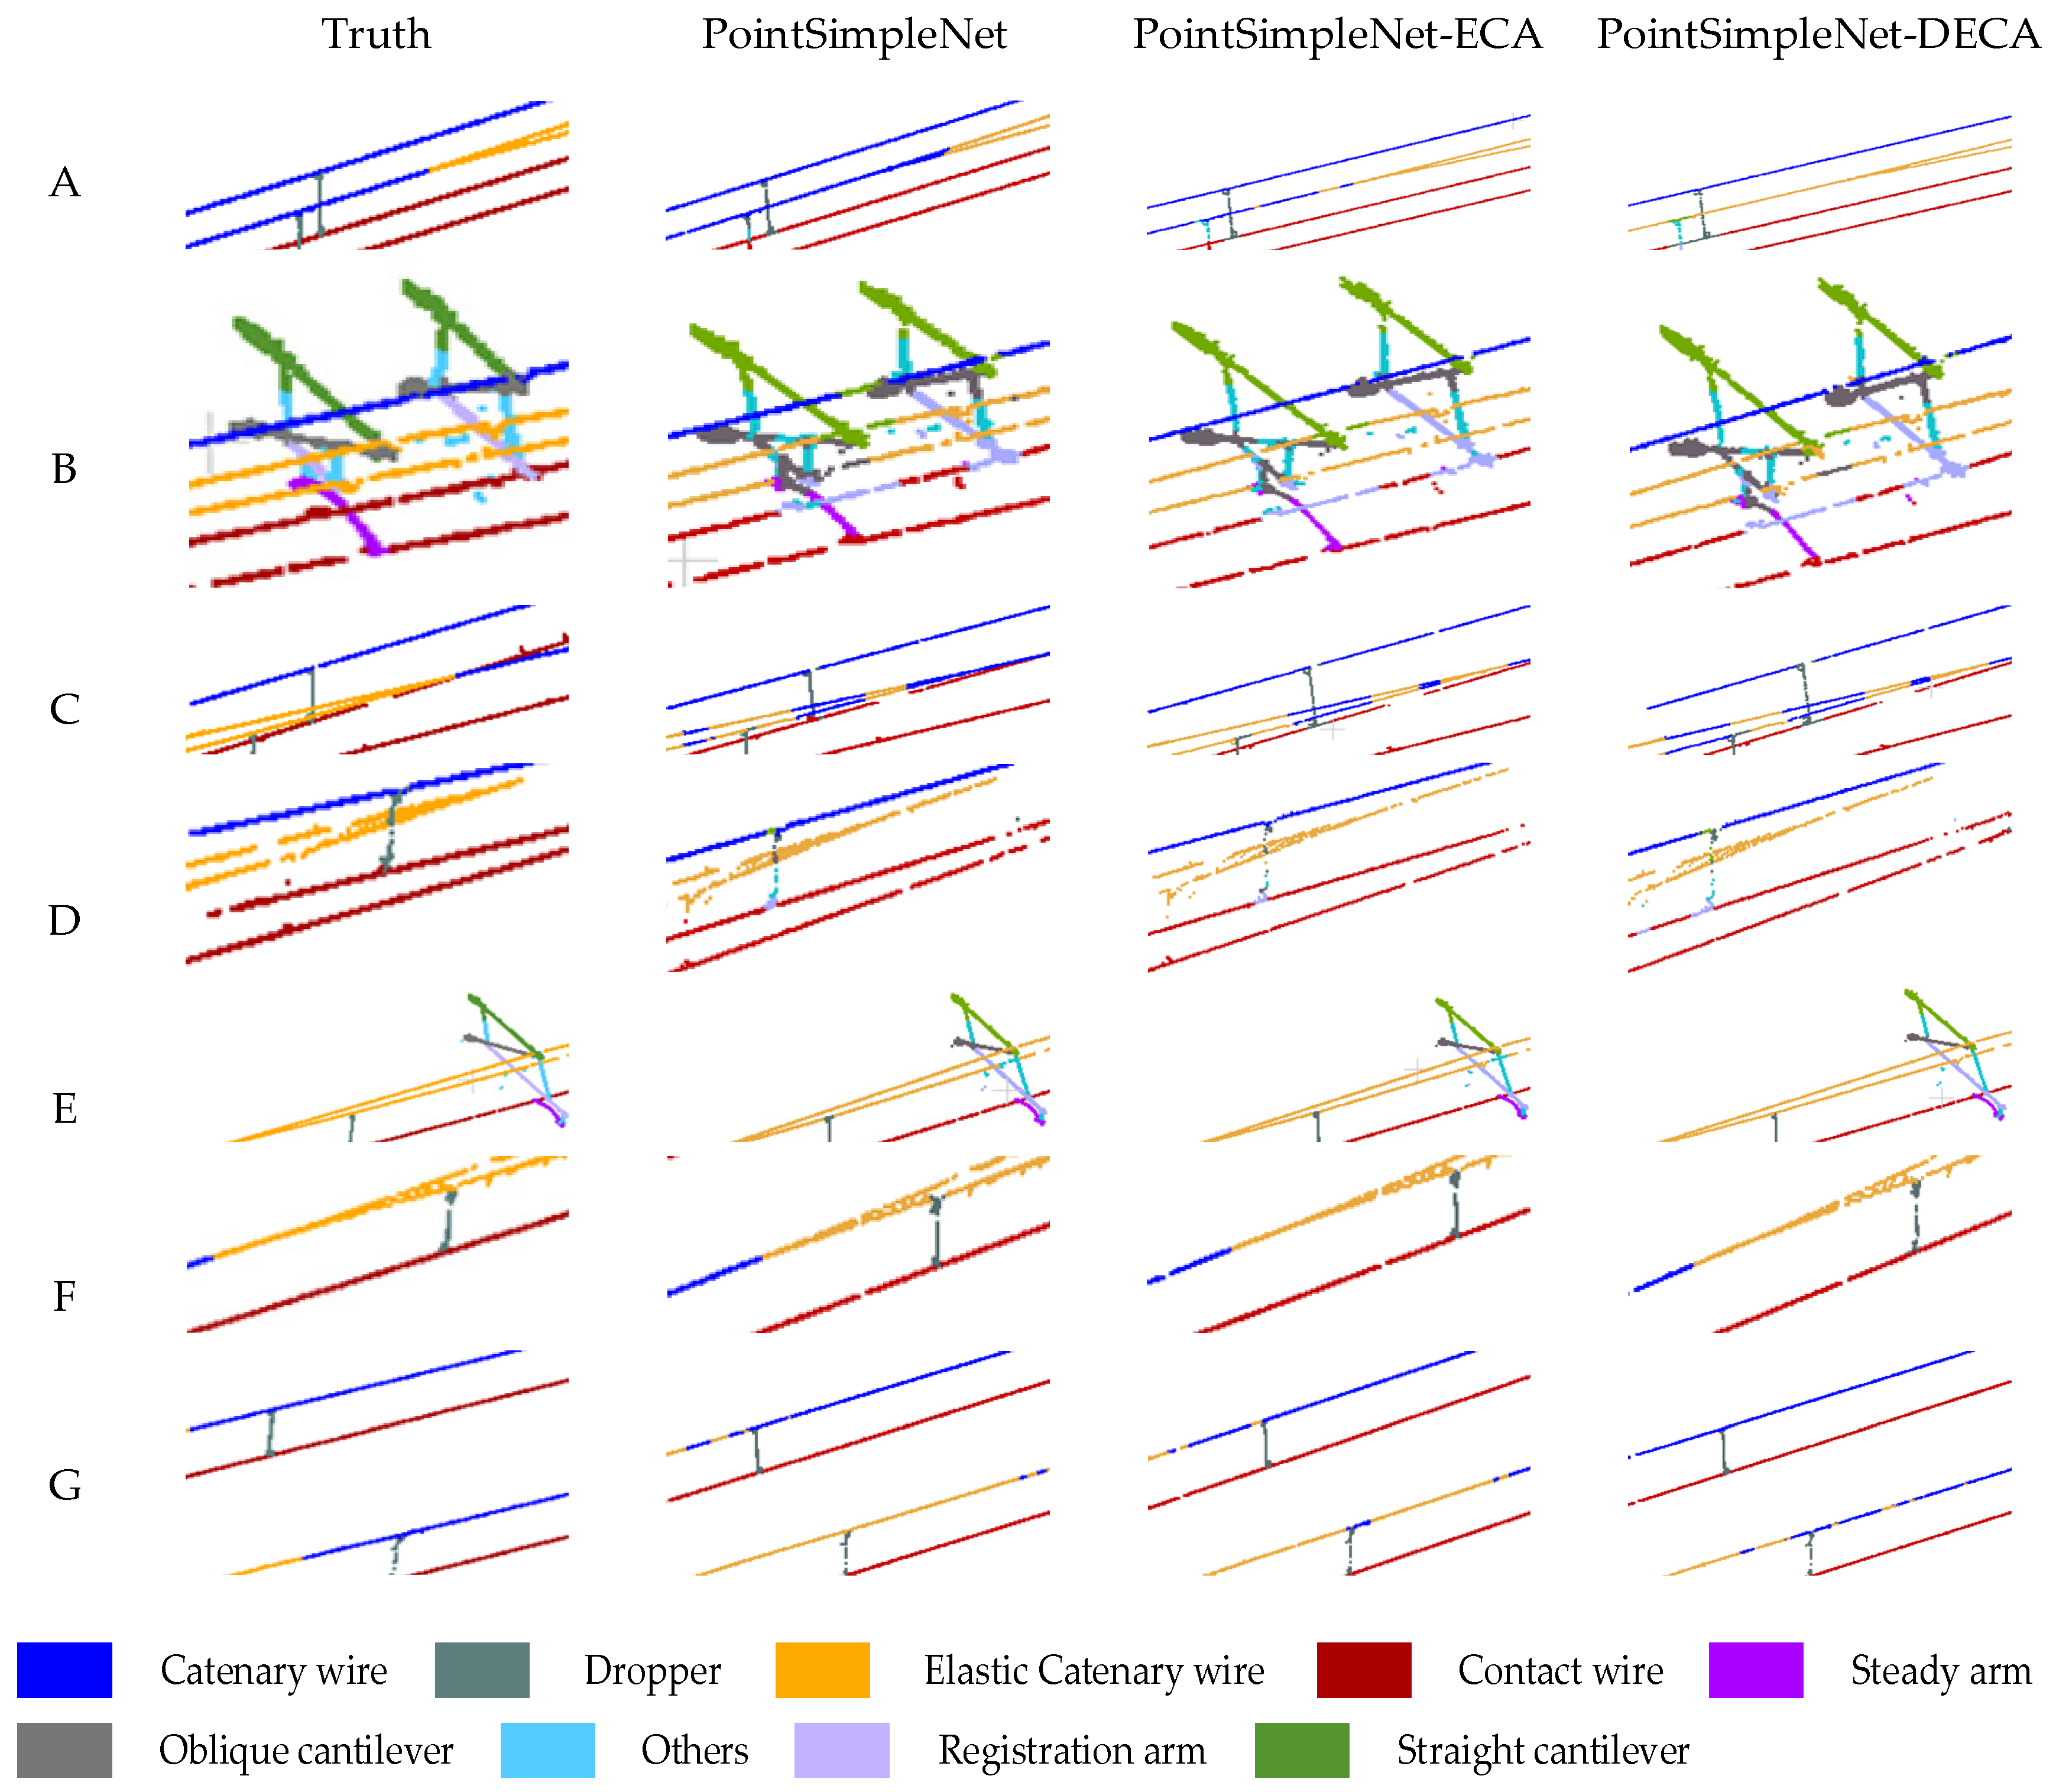
Table 6.
Quantitative evaluation of the DECA module through three groups of comparative experiments (%) on the OCS point cloud dataset. The best metrics are highlighted in bold.
Table 6.
Quantitative evaluation of the DECA module through three groups of comparative experiments (%) on the OCS point cloud dataset. The best metrics are highlighted in bold.
| Method | F1-Score | MIoU | OA |
|---|
| PointSimpleNet | 89.89 | 82.91 | 93.66 |
| PointSimpleNet -ECA | 91.79 | 85.29 | 94.51 |
| PointSimpleNet -DECA | 92.13 | 85.68 | 95.22 |
Table 7.
Quantitative evaluation of SHDA structure through four groups of comparative experiments (%) on the OCS point cloud dataset. The best metrics are highlighted in bold.
Table 7.
Quantitative evaluation of SHDA structure through four groups of comparative experiments (%) on the OCS point cloud dataset. The best metrics are highlighted in bold.
| Methods | F1-Score | MIoU | OA |
|---|
| PointSimpleNet | 89.89 | 82.91 | 93.66 |
| PointSimpleNet-skip connections | 90.21 | 82.62 | 93.74 |
| PointSimpleNet-skip connections-ECA | 91.66 | 85.08 | 94.99 |
| PointSimpleNet-skip connections-SHDA | 92.03 | 85.42 | 95.12 |
Table 8.
Quantitative evaluation of refinement module PCRM through three groups of comparative experiments (%) on the OCS point cloud dataset. The best metrics are highlighted in bold.
Table 8.
Quantitative evaluation of refinement module PCRM through three groups of comparative experiments (%) on the OCS point cloud dataset. The best metrics are highlighted in bold.
| Method | F1-Score | MIoU | OA |
|---|
| PointSimpleNet | 89.89 | 82.91 | 93.66 |
| PointSimpleNet-ASPP | 91.84 | 85.39 | 94.36 |
| PointSimpleNet-PCRM | 92.14 | 85.88 | 95.30 |


