Technical Note

Integrating UAVs and Canopy Height Models in Vineyard Management: A Time-Space Approach

1
Department of Agricultural Sciences, University of Sassari, Viale Italia 39 a, 07100 Sassari, Italy
2
Department of Economics and Law, University of Macerata, Via Armaroli 43, 62100 Macerata, Italy
3
Department for Innovation in Biological, Agro-Food and Forest Systems (DIBAF), Tuscia University, Via S. Camillo De Lellis, 01100 Viterbo, Italy
*
Author to whom correspondence should be addressed.
Remote Sens. 2022, 14(1), 130; https://doi.org/10.3390/rs14010130
Submission received: 23 November 2021 / Revised: 21 December 2021 / Accepted: 26 December 2021 / Published: 29 December 2021

Abstract

:
The present study illustrates an operational approach estimating individual and aggregate vineyards’ canopy volume estimation through three years Tree-Row-Volume (TRV) measurements and remotely sensed imagery acquired with unmanned aerial vehicle (UAV) Red-Green-Blue (RGB) digital camera, processed with MATLAB scripts, and validated through ArcGIS tools. The TRV methodology was applied by sampling a different number of rows and plants (per row) each year with the aim of evaluating reliability and accuracy of this technique compared with a remote approach. The empirical results indicate that the estimated tree-row-volumes derived from a UAV Canopy Height Model (CHM) are up to 50% different from those measured on the field using the routinary technique of TRV in 2019. The difference is even much higher in the two 2016 dates. These empirical findings outline the importance of data integration among techniques that mix proximal and remote sensing in routine vineyards’ agronomic practices, helping to reduce management costs and increase the environmental sustainability of traditional cultivation systems.

1. Introduction

Precision farming techniques assume the optimal use of inputs to improve production efficiency and sustainability [1,2,3,4]. A more efficient use of plant protection products and tools leads to fewer pollution loads to rural environments, higher crop quality, less monetary costs, and increased production rates, impacting the economic and ecological sustainability of farms in a positive manner [5,6,7,8,9,10].
The vineyard is a heterogeneous environment where spatial monitoring techniques application for biomass development and volume characterization can be integrated into a decision support system optimizing plant protection strategies—a crucial issue for precision viticulture [11,12,13,14,15,16,17,18,19,20,21,22]. Farm field measurements are routinely carried out, determining the total amount of plant protection products via simplified mathematical approaches that require direct measurement of canopy height, thickness, and distance between canopies. More specifically, the Tree-Row-Volume (TRV) technique, requiring manual measurements of the vineyard, estimates the total plant volume by ground unit (m3 ha−1) in vineyard crown height, width, and inter-row distance [23,24,25,26]. TRV is relatively well known to grape growers and agronomists. This method has been extensively used for various purposes, including (rough) estimation of the adequate dosage treatment for plant protection within a specific vineyard, leading to a more comprehensive management of the canopy. Other volume measurement systems such as leaf wall area (LWA) and Unit Canopy Row (UCR) were not considered in this study because they primarily referred to viticultural contexts with peculiar territorial or productive characteristics. Despite a consensus application to plant/row monitoring in largely variable agronomic and ecological field conditions in Europe as well as in other productive contexts, TRV determination is a labor-intensive and time-consuming task. To our knowledge, a specific analysis of model errors and uncertainties when using this routine approach is still lacking, despite the intense development of proximal techniques monitoring the vineyard’s canopy [27,28].
At the same time, a precise characterization of plants’ structure was more recently performed using remote sensing tools such as image analysis techniques, stereoscopic photography, analysis of the light spectrum, ultrasonic ranging, and optical ranging [29,30,31,32,33,34,35]. Earlier Structure from Motion (SfM) approaches provided a basic framework for 3D vineyard point clouds reconstruction, with the aim of quantifying grapevine canopy volume and leaf area index (LAI) [36,37,38]. These estimations were extensively used to optimize canopy management and pest control, especially when variable rate technology (VRT) was employed [39]. More recently, the acquisition of high-resolution unmanned aerial vehicle (UAV) RGB imagery of the canopy has proved to be an effective tool for estimating plant architecture (e.g., vegetation height, canopy, density) through computation of accurate and reliable digital models [40,41,42,43]. The use of Ground Control Points (GCPs), located within the orchard’s scene, represents an essential practice for spatial accuracy and minimization of model’s errors [44,45].
Based on these premises, the present study illustrates a methodology estimating individual and aggregate vineyard’s canopy volume through UAV remotely sensed imagery acquired with an RGB digital camera, analyzed with MATLAB 2018b scripts, and validated by ArcGIS 10.7.1 tools at various growth phases. More specifically, canopy volumes routinely measured on the field following a TRV approach were compared to remotely acquired volumes from an integrated analysis of Digital Surface Models (DSMs), Digital Terrain Models (DTMs), and Canopy High Models (CHMs) derived from SfM assessment at different time points. These results contribute to assess the reliability of the TRV technique, verifying if the estimated volumes derived from UAV detection are comparable with, or statistically different from, the figures measured in the field.

2. Materials and Methods
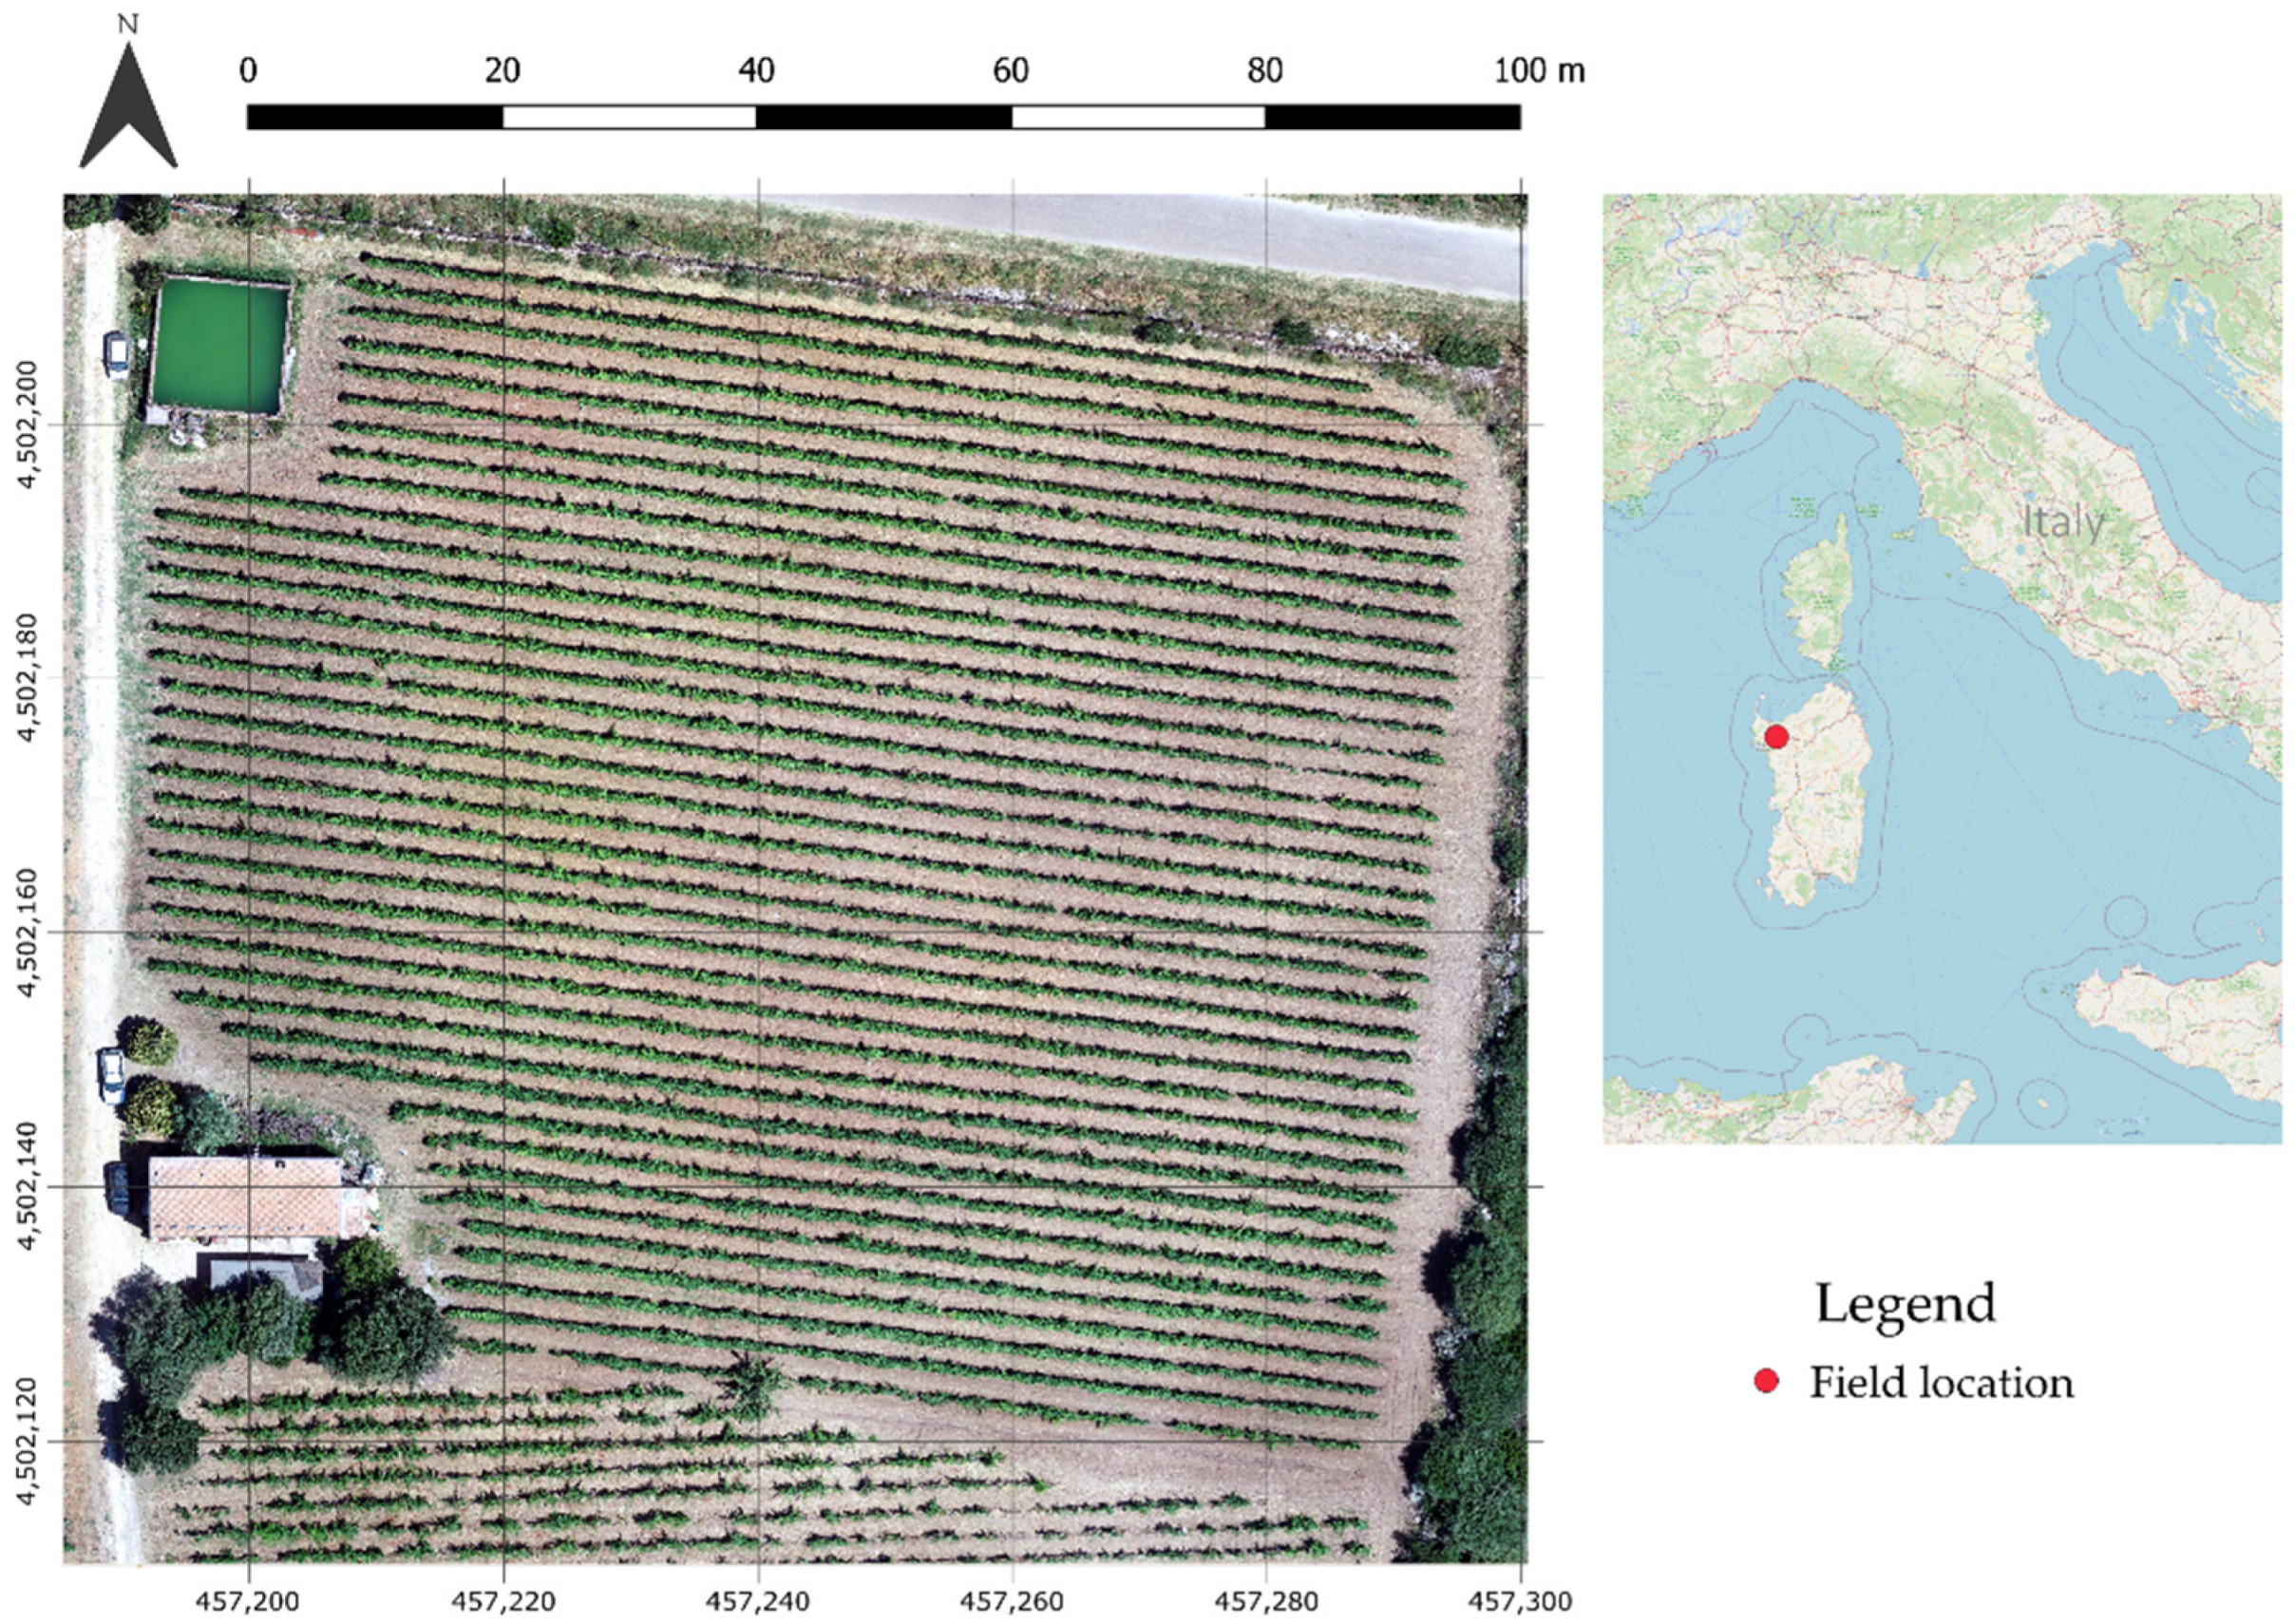
2.1. Study Area

The survey took place in an experimental field of 0.8 ha (Figure 1) in Usini, North-Eastern Sardinia, Italy (Lat. 40°40′10.13″; Long. 8°29′37.35″ WGS84 EPSG 4326), at 144 m above the sea level. The grapevines (Cagnulari cv.) were planted in a clay-loam soil with a 0.90 × 2.10 m spacing (East-West row orientation) and trained as Vertical Shoot Position (VSP). A GNSS Leica 900 RTK receiver (Leica Geosystems) was used to record the X-Y coordinates of six Ground Control Points (GCPs) for accurate georeferencing of the ortho-mosaics analyzed in this study. Twenty-four additional sample points were identified over the entire surface area and geo-referenced to characterize the canopy after every UAV flight. Field measurements were run under sunny, clear sky conditions during the vine growing season in 2016 (July and August), 2017 (July), and 2019 (June), at the same phenological phase based on the specific year’s weather profile.

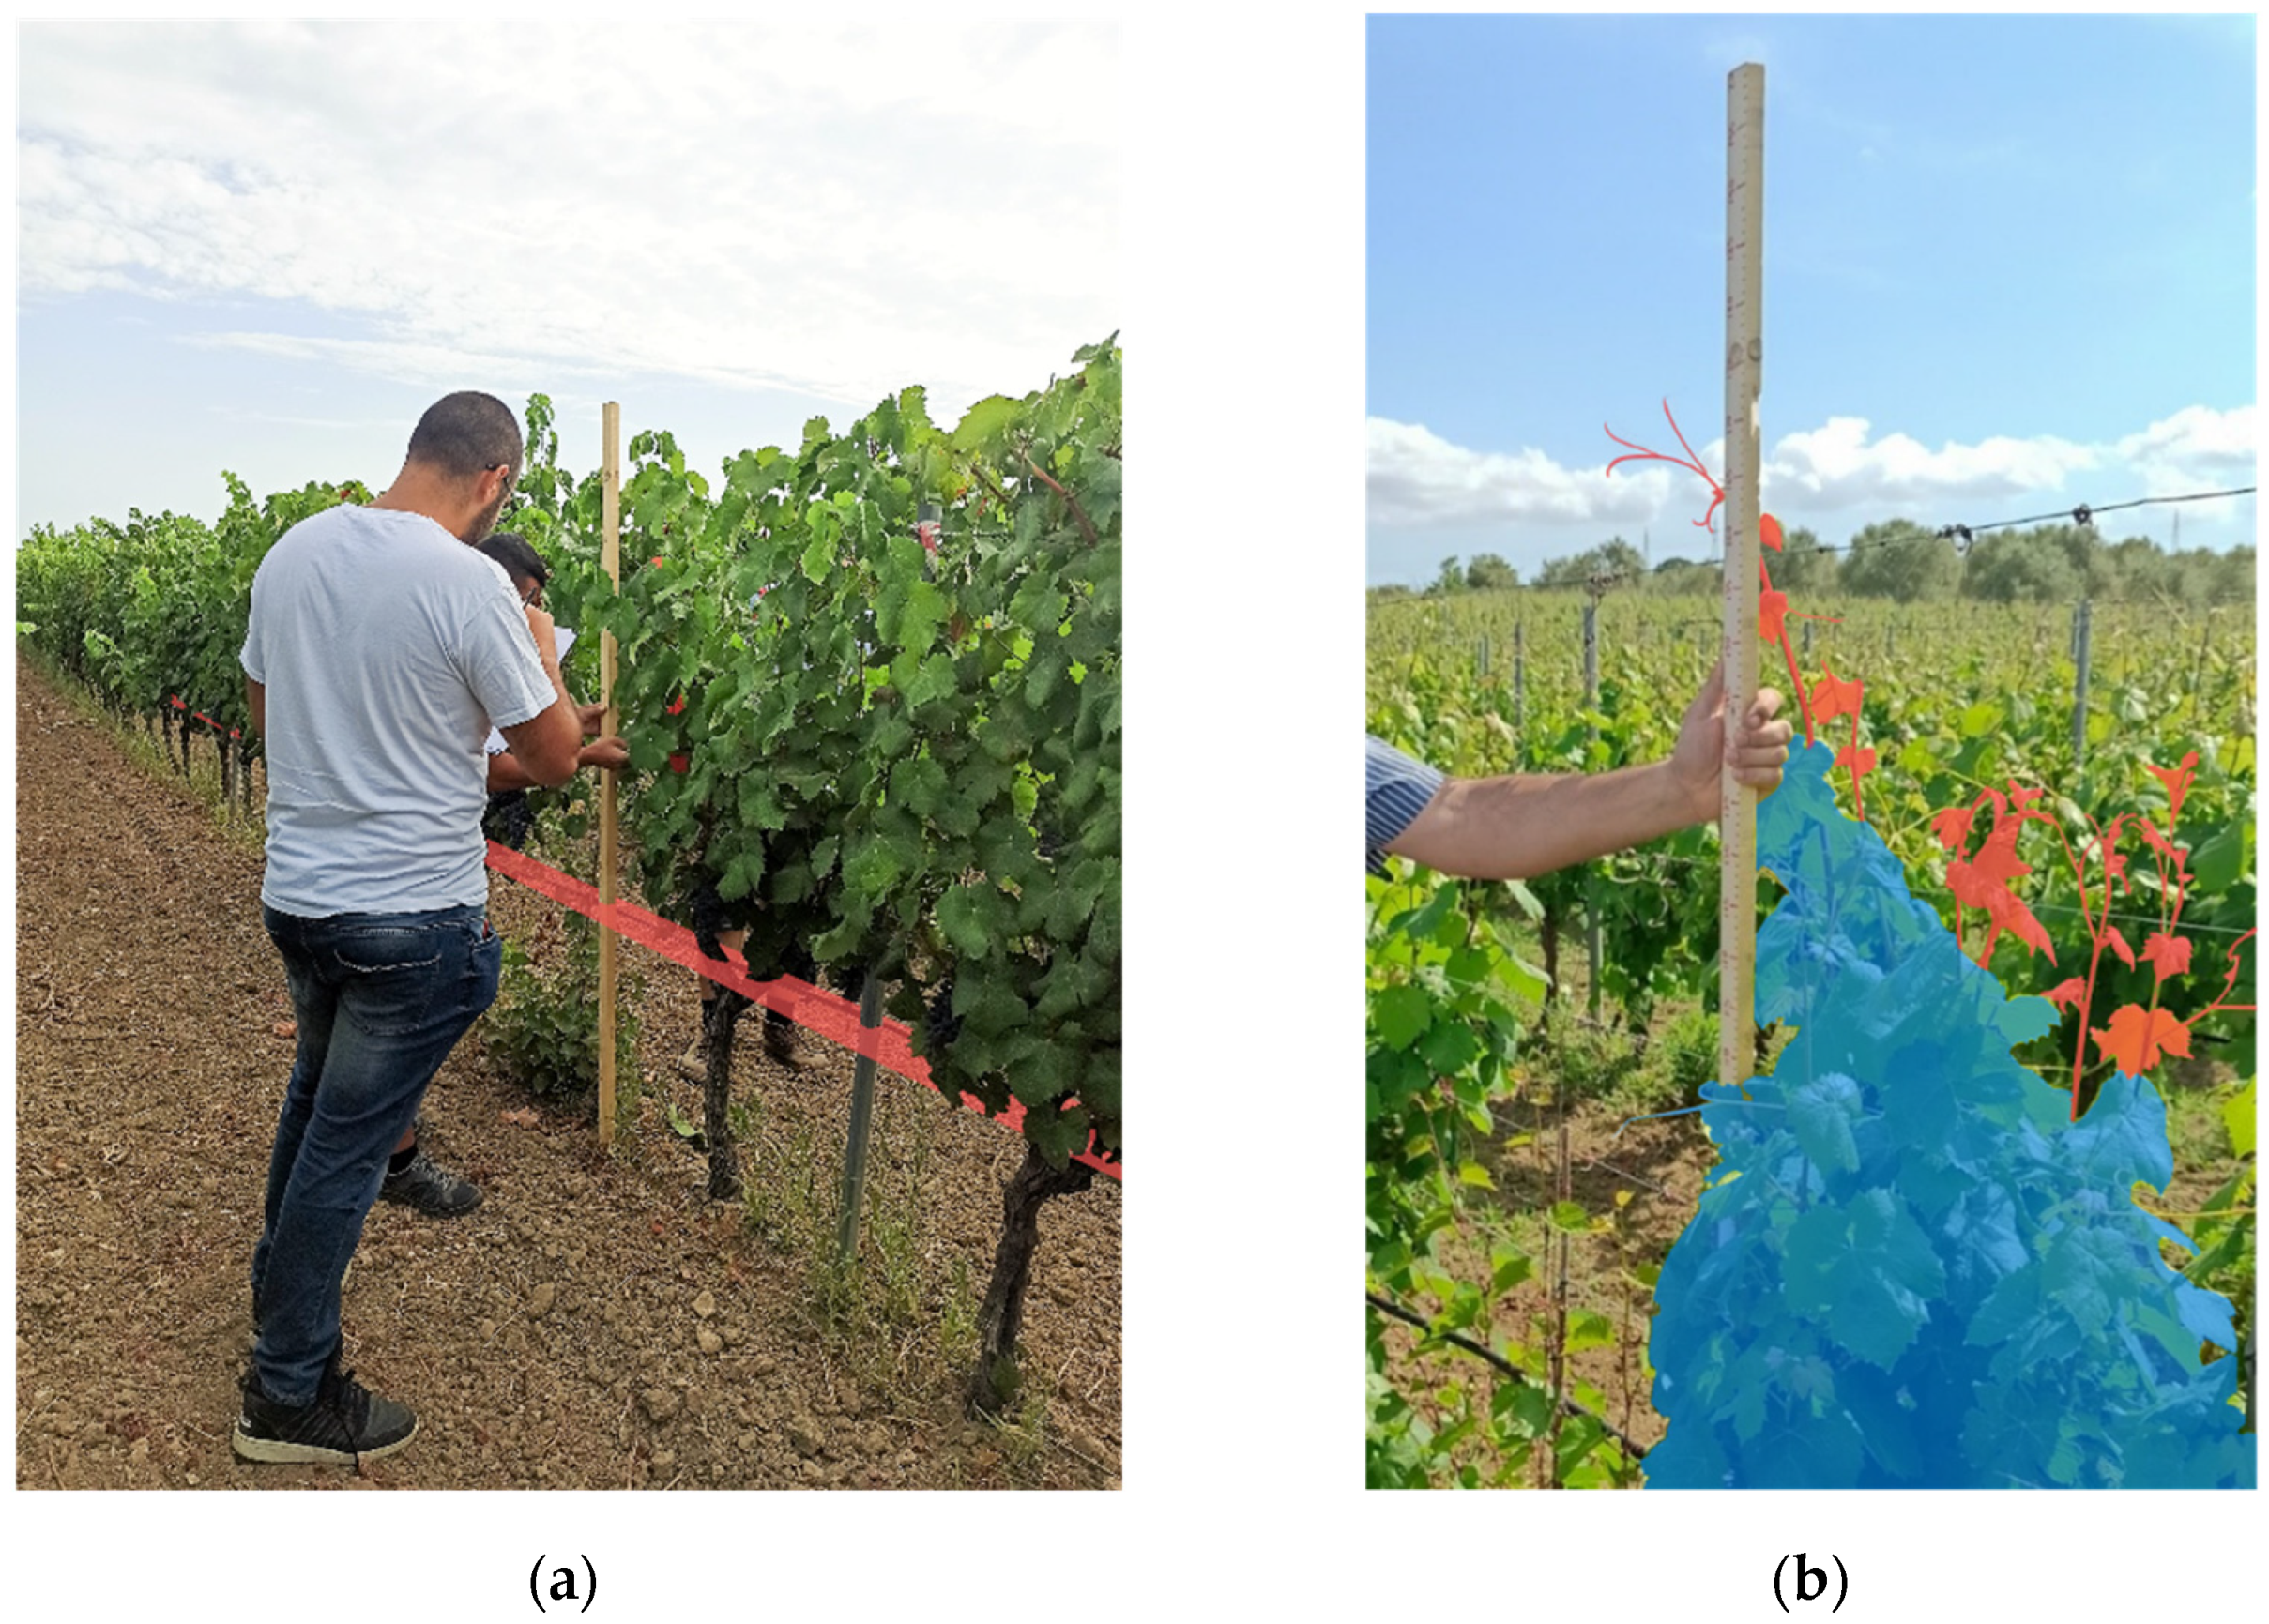
2.2. TRV-Based Field Measurements

In 2016, twelve measurements (every ten plants) for nine random rows were extracted, whereas 105 measurements (one for each plant of the row) were collected for four random rows used in 2017 and for six random rows in 2019. For TRV estimation, measurements were taken using a rolling tape marked on a wooden rod to facilitate height/width detection and limit the operator fatigue.
In 2016, field measurements were performed considering the highest and widest extension reached by the plant (even isolated shoots, highlighted in red color in Figure 2b) in a measurement point conventionally identified as the plant’s center (Figure 2a). In 2017 and 2019, the shoots outside the uniform row shape (falling inside the blue polygon in Figure 2b) were not considered during the measurement operations. Since height measurements were performed considering the distance from the ground surface to the highest part of the row—also taking account of the height of the trunk—each height measurement was referred to the canopy by subtracting 0.90 m from the total value. The “cutting height” of 0.90 m (represented by the red line parallel to the ground in Figure 2a) matches the branches production zone in the cultivation system considered in this study.
TRV was calculated [23] multiplying the average rows height and width values, by an aerial conversion factor (10,000) (1 ha = 10,000 m2), in turn divided by the inter-row width (Equation (1)):
TRV = H W 10000 I
where H is the average row height (m), W is the average row thickness (m), and I is the inter-row width (m).

2.3. UAV-Based Sensing

Data acquisition in the first survey year was carried out using a customized hexacopter equipped with a CMOS sensor Canon EOS 750D of 24 megapixels resolution, sensor size 22.3 mm × 14.9 mm, focal length 50 mm f/2.8. In the following years, a DJI Phantom 4 Pro (Shenzhen, China) equipped with RGB CMOS 1" sensor of 21 megapixels resolution, Field of View (FOV) 84°, 8.8 mm/24 mm (35 mm format equivalent), f/2.8-f/11 autofocus 1 m-∞ was adopted for field measurement. The photographic sets were acquired with a 75% front overlap and 85% side overlap at 35 m height above ground level (AGL) in 2016 and 2019, and 50 m in 2017. The different sensors and the flight altitude, combined with specific elaboration processes, involved a different Ground Sampling Distance (GSD) of the digital models in the five dates. Survey information about Day of Year (DOY), Biologische Bundesanstalt, Bundessortenamt und CHemische Industrie (BBCH), and Growing Degree Day (GDD) are summarized in Table 1.

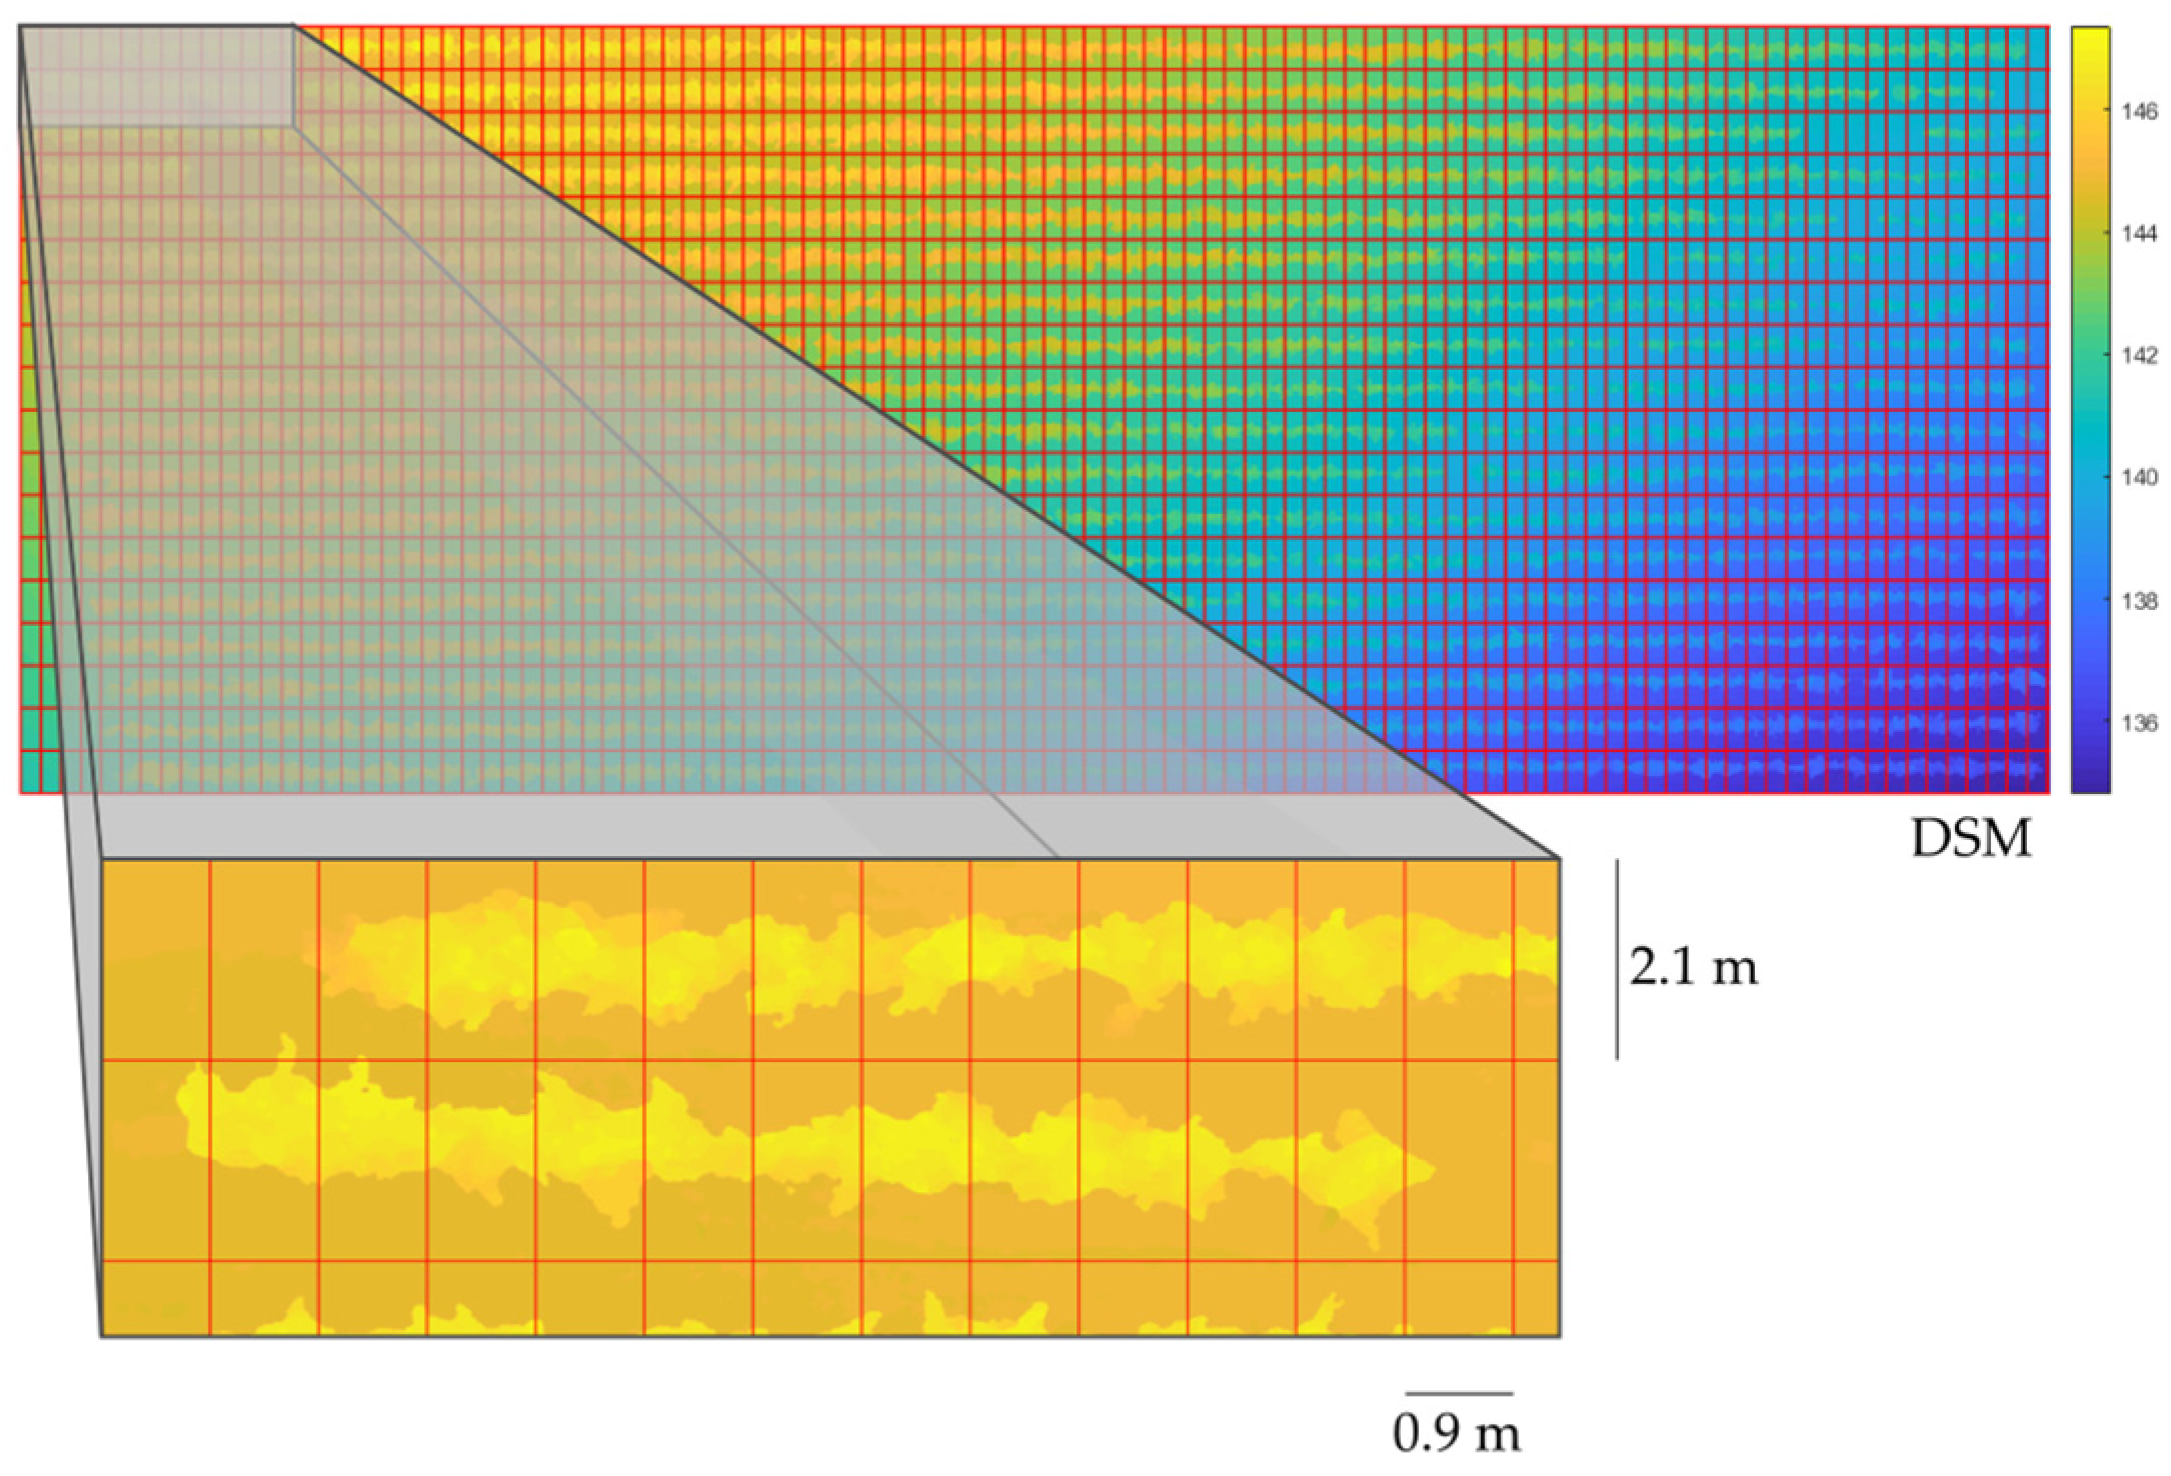
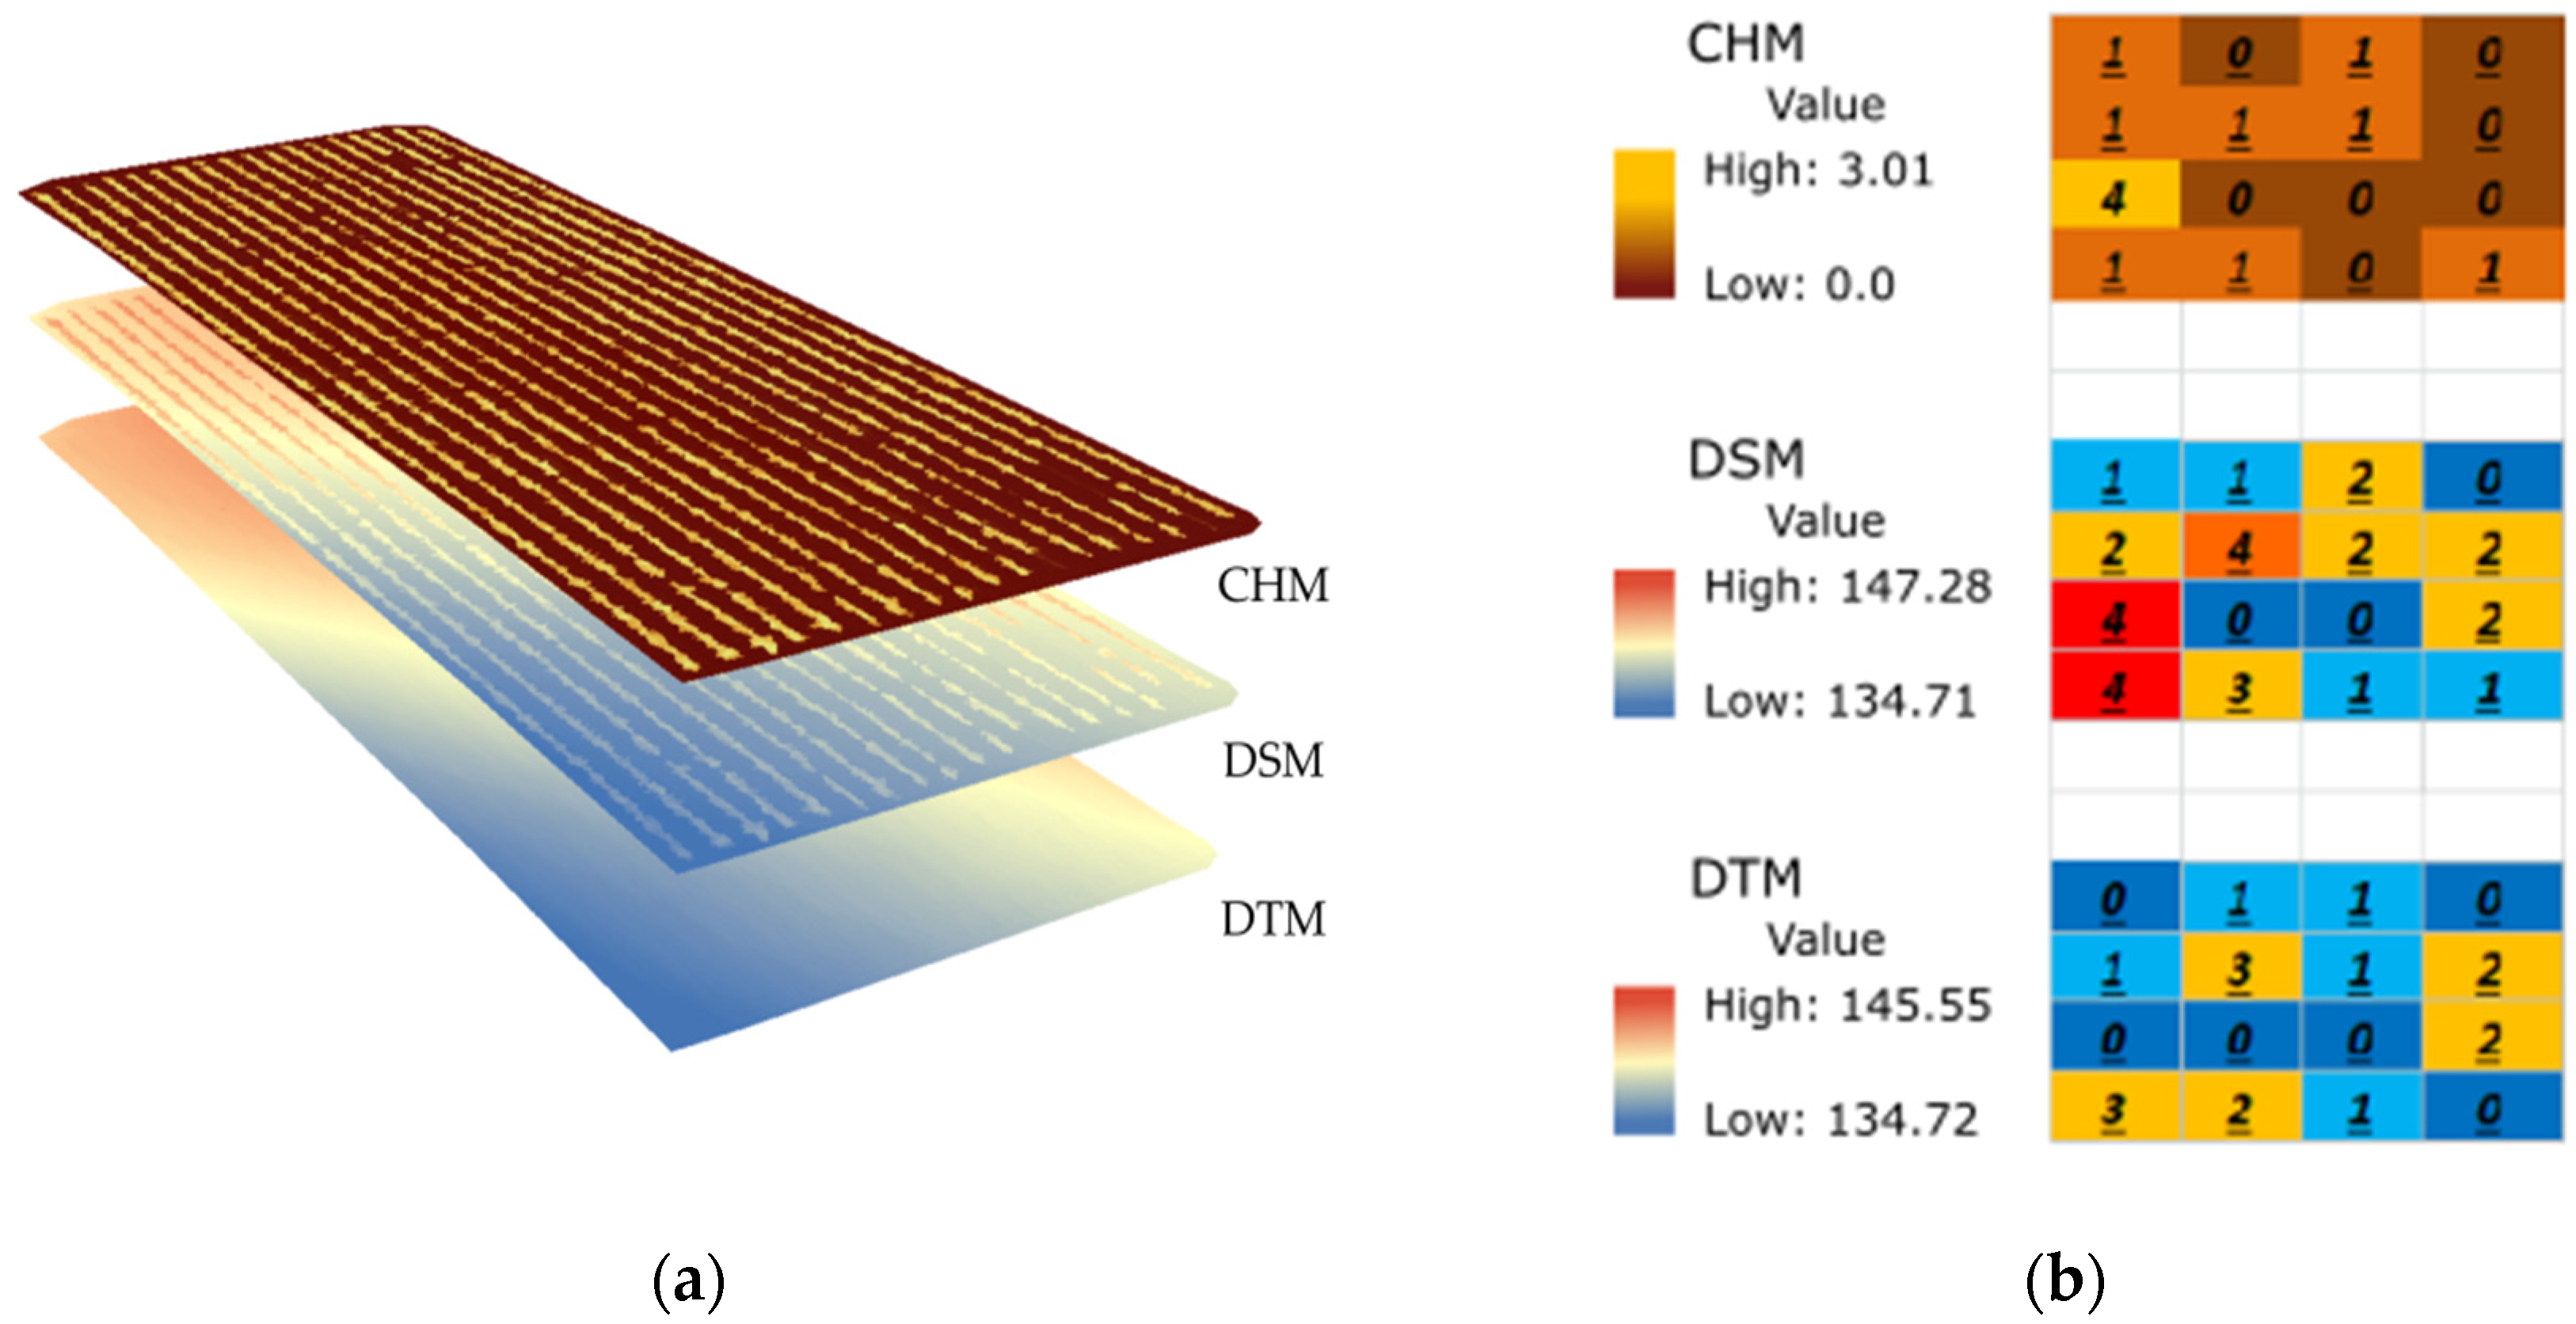
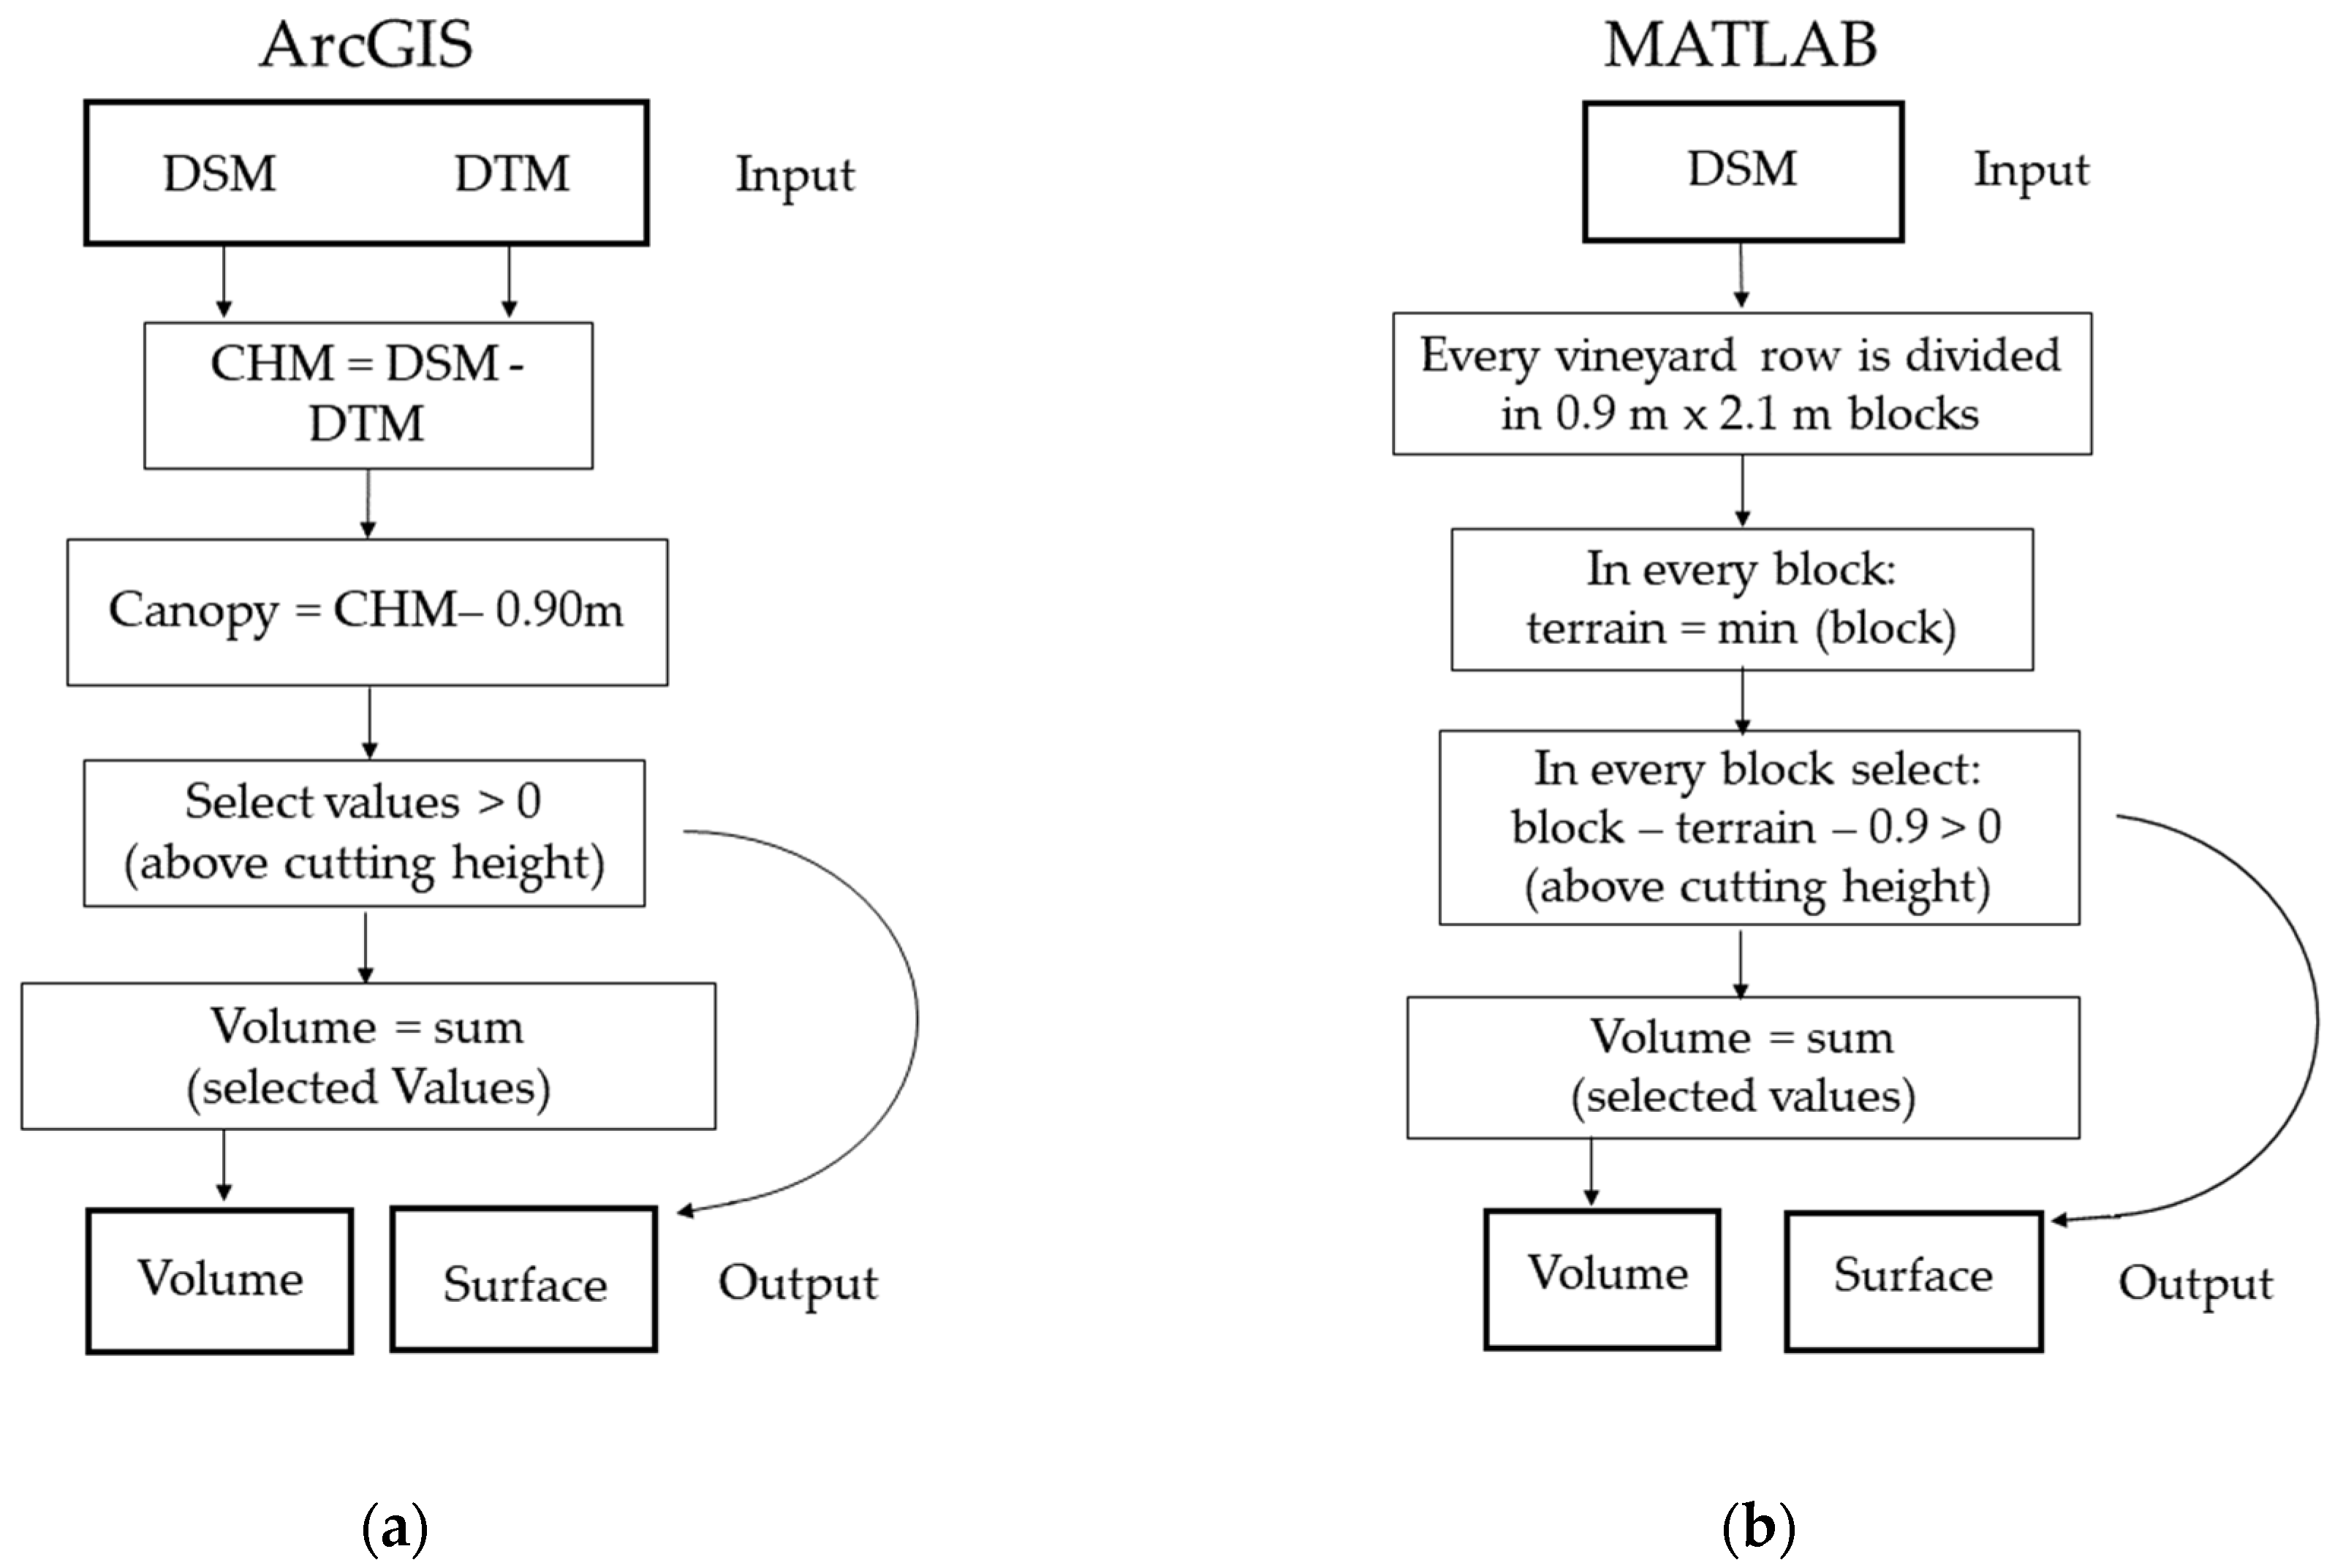
2.4. Identification of the Canopy Height Model

Standard approaches to create 3D models derived from SfM processing and CHM [44,46] adopt the absolute height of crop canopies as a target variable and define a CHM as the difference between the DSM and the DTM. In the present study, Agisoft Metashape allowed the estimation of the vineyard’s soil surface elevation profile (DTM) through the classification of the dense cloud, the essential 3D model needed to obtain the 2D digital models (DSM and DTM) in the Agisoft Metashape’s workflow. The specific tool named “Classify Ground Points” (located into the Dense Cloud Tools’ menu) for points’ classification, was used to detect the ground points and enhance the hole filling derived by the removal of the canopy points. The models’ approximation derives from the inability of nadir images, taken from above, to reconstruct the lower part of the plants (Figure 3 and Figure 4a).
Starting from the resolution of each digital model (defined by the surface occupied by a single pixel), MATLAB and ArcGIS CHMs analysis extracted the covered area height information from the vineyard rows by integrating the volume of all individual pixels that constitute the canopy. This approach generated a file containing the height values on a reference plane placed 0.90 m above the soil’s surface (represented by the red line in Figure 2a). This height matches the production zone where the branches are located, contributing to remove the influence of soil surface and the stumps, and allowing the effective measurement of the volume occupied by the canopy. The height information contained in the CHM is free from interference derived by background colors, shadows, or infesting plants, at least until their height exceeds the set limit of 0.90 m.
The MATLAB analysis was run solely on DSMs (Figure 3). The altitude of each row was estimated by averaging the visible soil values between each row. Measurements were performed creating a rows x columns pixel raster matrix of 0.26 cm/pixel in 2016, 0.90 and 1.22 cm/pixel in 2017, and 0.92 cm/pixel in 2019 (based on the Ground Sampling Distance) and dividing the raster matrix into blocks of 0.90 m × 2.10 m. The raster matrix was oriented so that the x columns and y rows were parallel and perpendicular to the vines’ rows, respectively, and each block included the canopy and a small part of the ground (Figure 3). This approach allowed the reduction of the influence of vineyard slope (represented by a pseudo-color palette ranging from purple to orange color) on the canopy height measurement, providing a reference surface that consists of pixels with the same elevation. All pixel values included in the volume estimation were obtained by extracting height information above 0.90 m from the reference plan (ground) consisting of the minimum values in each block.
ArcGIS measurements were performed by subtracting the elevation value included in the first basic input raster (DTM) from the second input raster (DSM) pixel-by-pixel value and deducting 0.90 m from each pixel height (Figure 4) using the “Raster Calculator” tool. The raster output (CHM), containing the new reference plane and the canopy, was used to calculate the volumes occupied by each row by multiplying every pixel surface to its height without any interference related to the vineyard’s slope. The Agisoft Metashape—ArcGIS CHM generation followed the same methodology of [31]. Both MATLAB and ArcGIS methods allowed an easy calculation of the green canopy cover as the percentage of field surface occupied by grapevine vegetation. The number of canopy pixels above the cutting edge of 0.90 m (as summarized in Figure 5) were counted and expressed as a per cent share in the total number of pixels in the field.

3. Results

Table 2 reports the canopy volumes determined for all grape-vine rows through field measurement and the average percentage of the Green Canopy Cover (GCC) area [47]. The measurements were performed using the TRV technique (Equation (1)) and automatic approaches based on UAV-derived digital models created using ArcGIS and MATLAB software.
The intrinsic differences between the three years reflect differential plant growth and vineyard management expressed by different volume estimation through TRV, ArcGIS, and MATLAB techniques.

3.1. TRV Measurement Results

When estimating the vineyard’s characteristics on the field, the TRV technique, based on width and height field measurements of rows, was frequently regarded as honest representation of the canopy structure. Canopy volumes estimation in 2016 was similar on both dates, and the same result was observed for 2017. In 2019, the estimated volume reached an intermediate value between 2016 and 2017. These differences are related to natural canopy growth differences among years and different measurement approaches. The number of rows and the measurements for each row played a crucial role in volume evaluation. A statistical analysis demonstrating the substantial instability of field estimation of canopy volumes, based on a subsample of rows, is reported in Figure 6. In this exercise, TRV was routinely re-calculated considering progressively smaller (randomly selected) samples of rows in the vineyard. TRV was expressed as a percentage departure from the TRV measure derived from the full sample. Particularly, heterogeneous results of this analysis carried out at the different experimental dates for 2016, 2017, and 2019, indicate a limited robustness of the TRV estimate at decreasing sample sizes. For instance, calculating TRV on sub-samples with half number rows led to a mis-estimation above 10% of the estimated value on the whole sample. Only estimations based on a sub-sample with a high (or very high) proportion of plants, in respect of the total population, provide reliable canopy volume values. These results are consistent at different survey dates over the three study years.

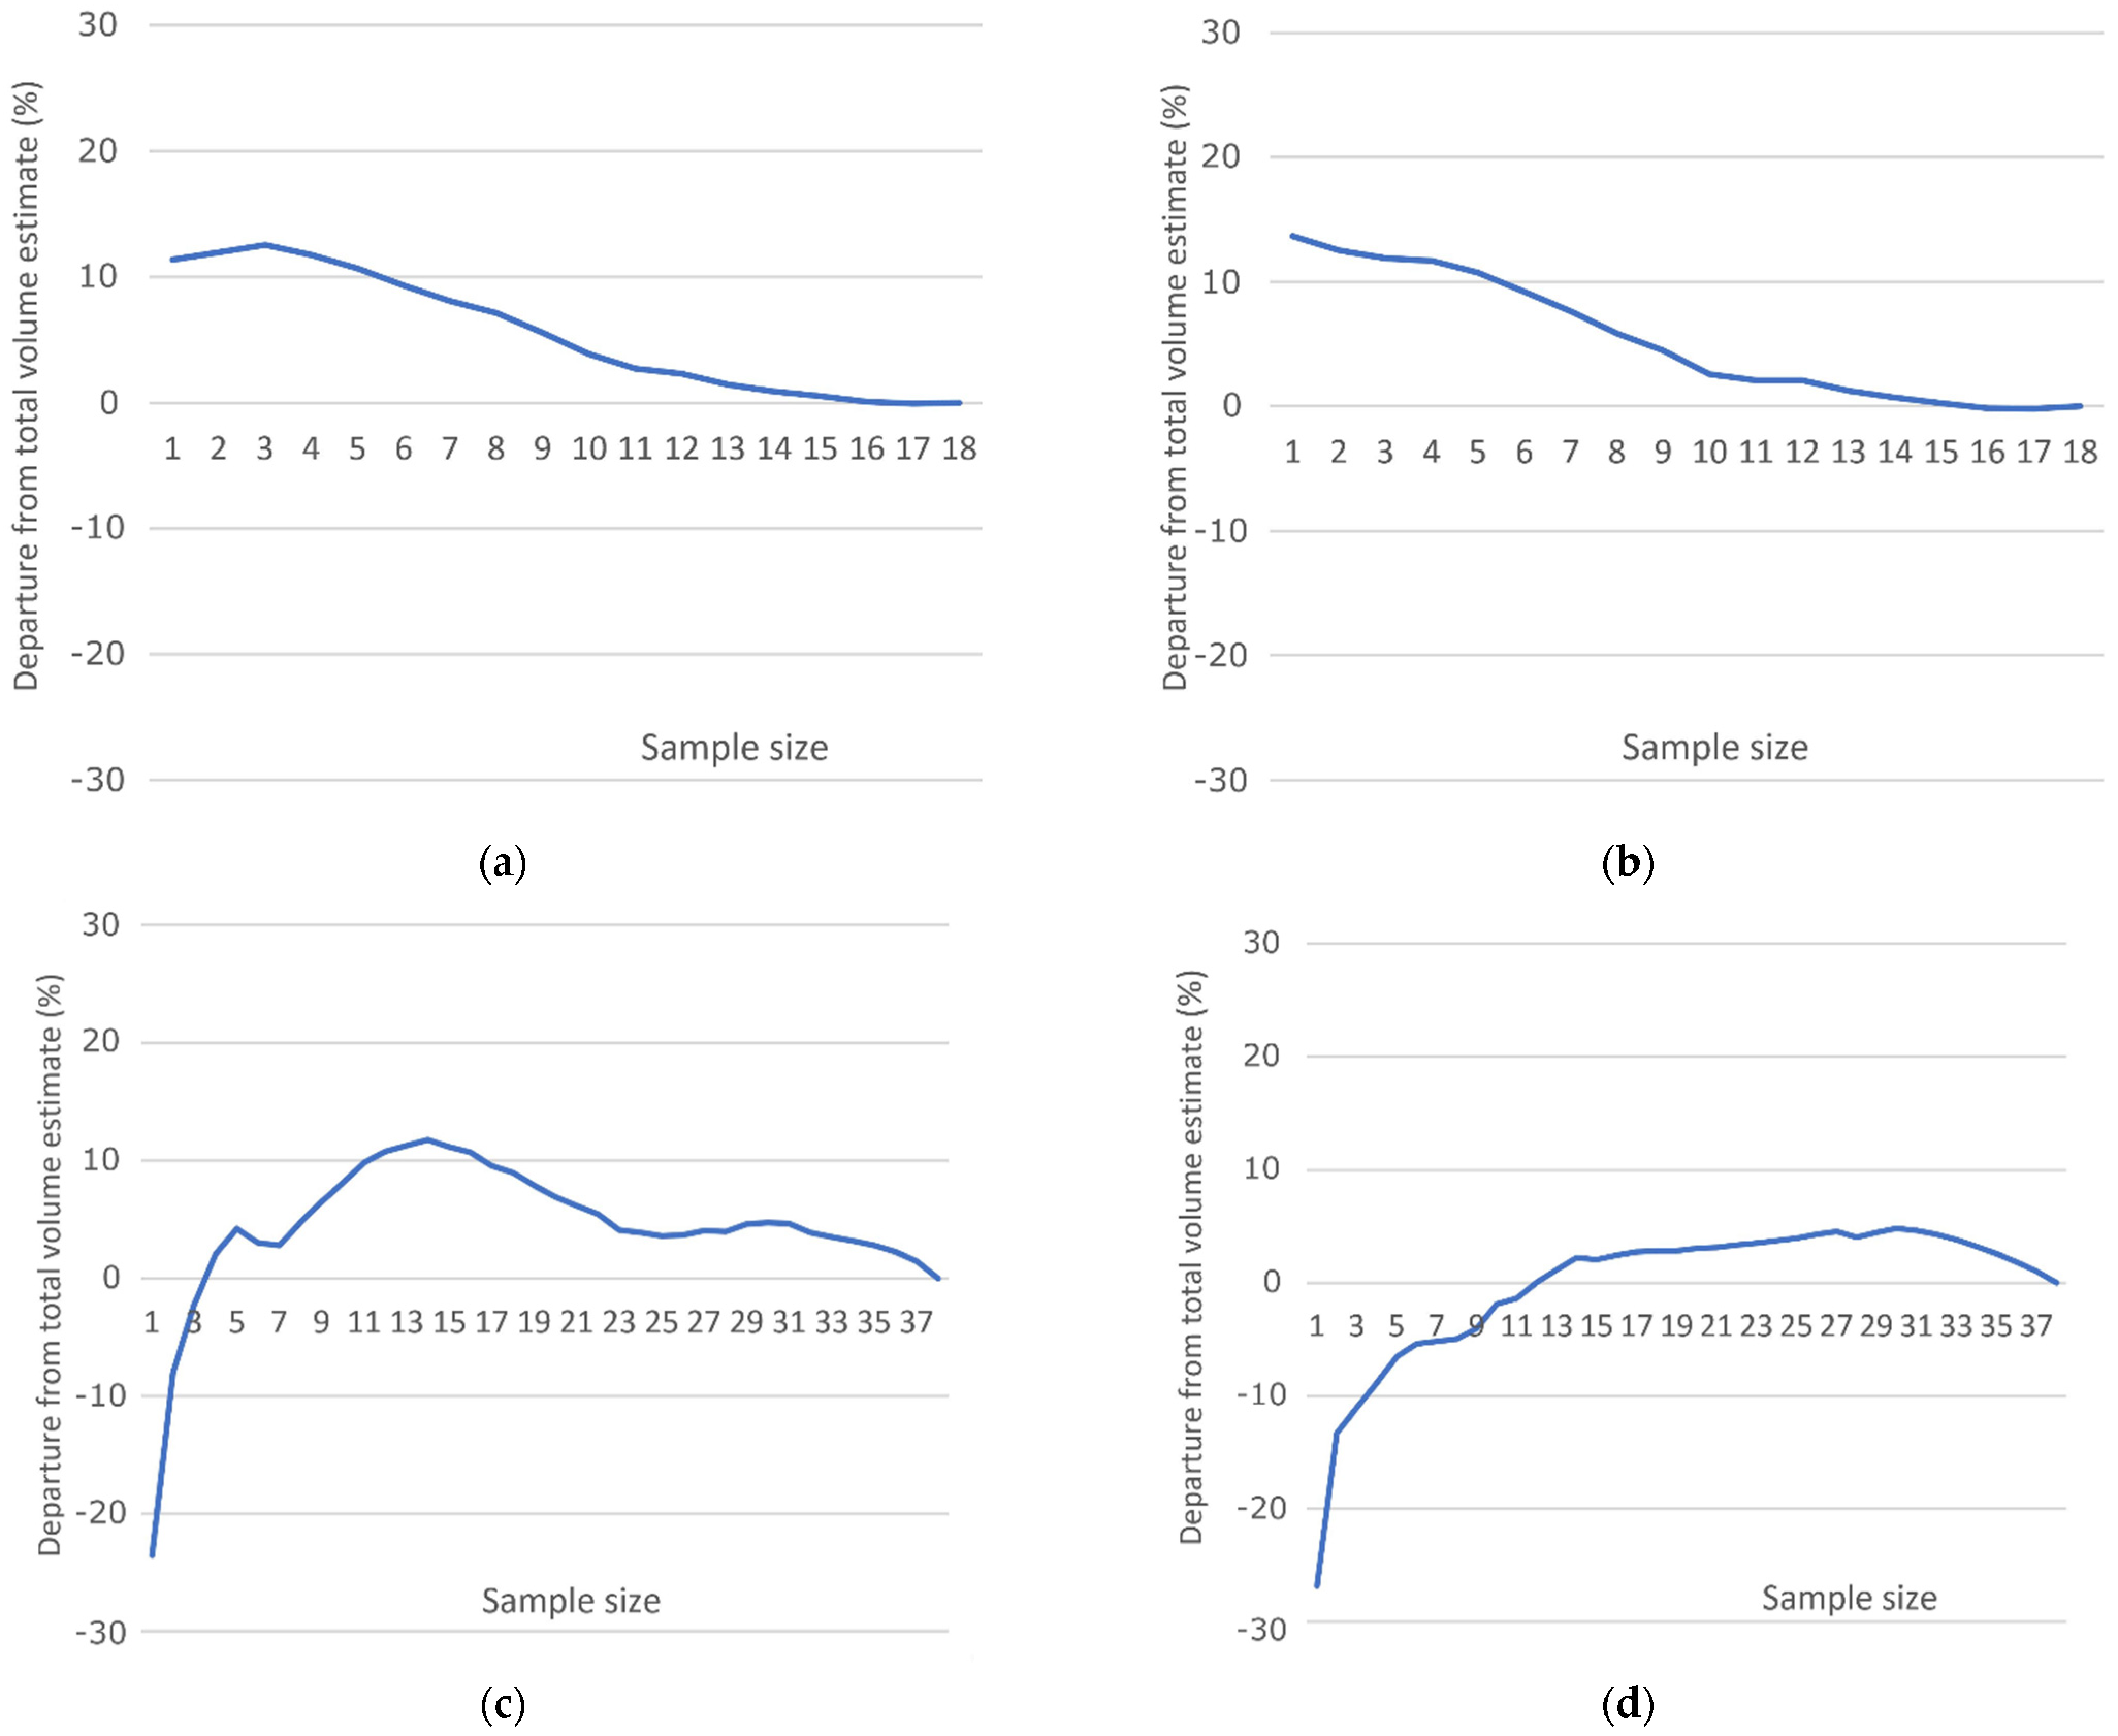
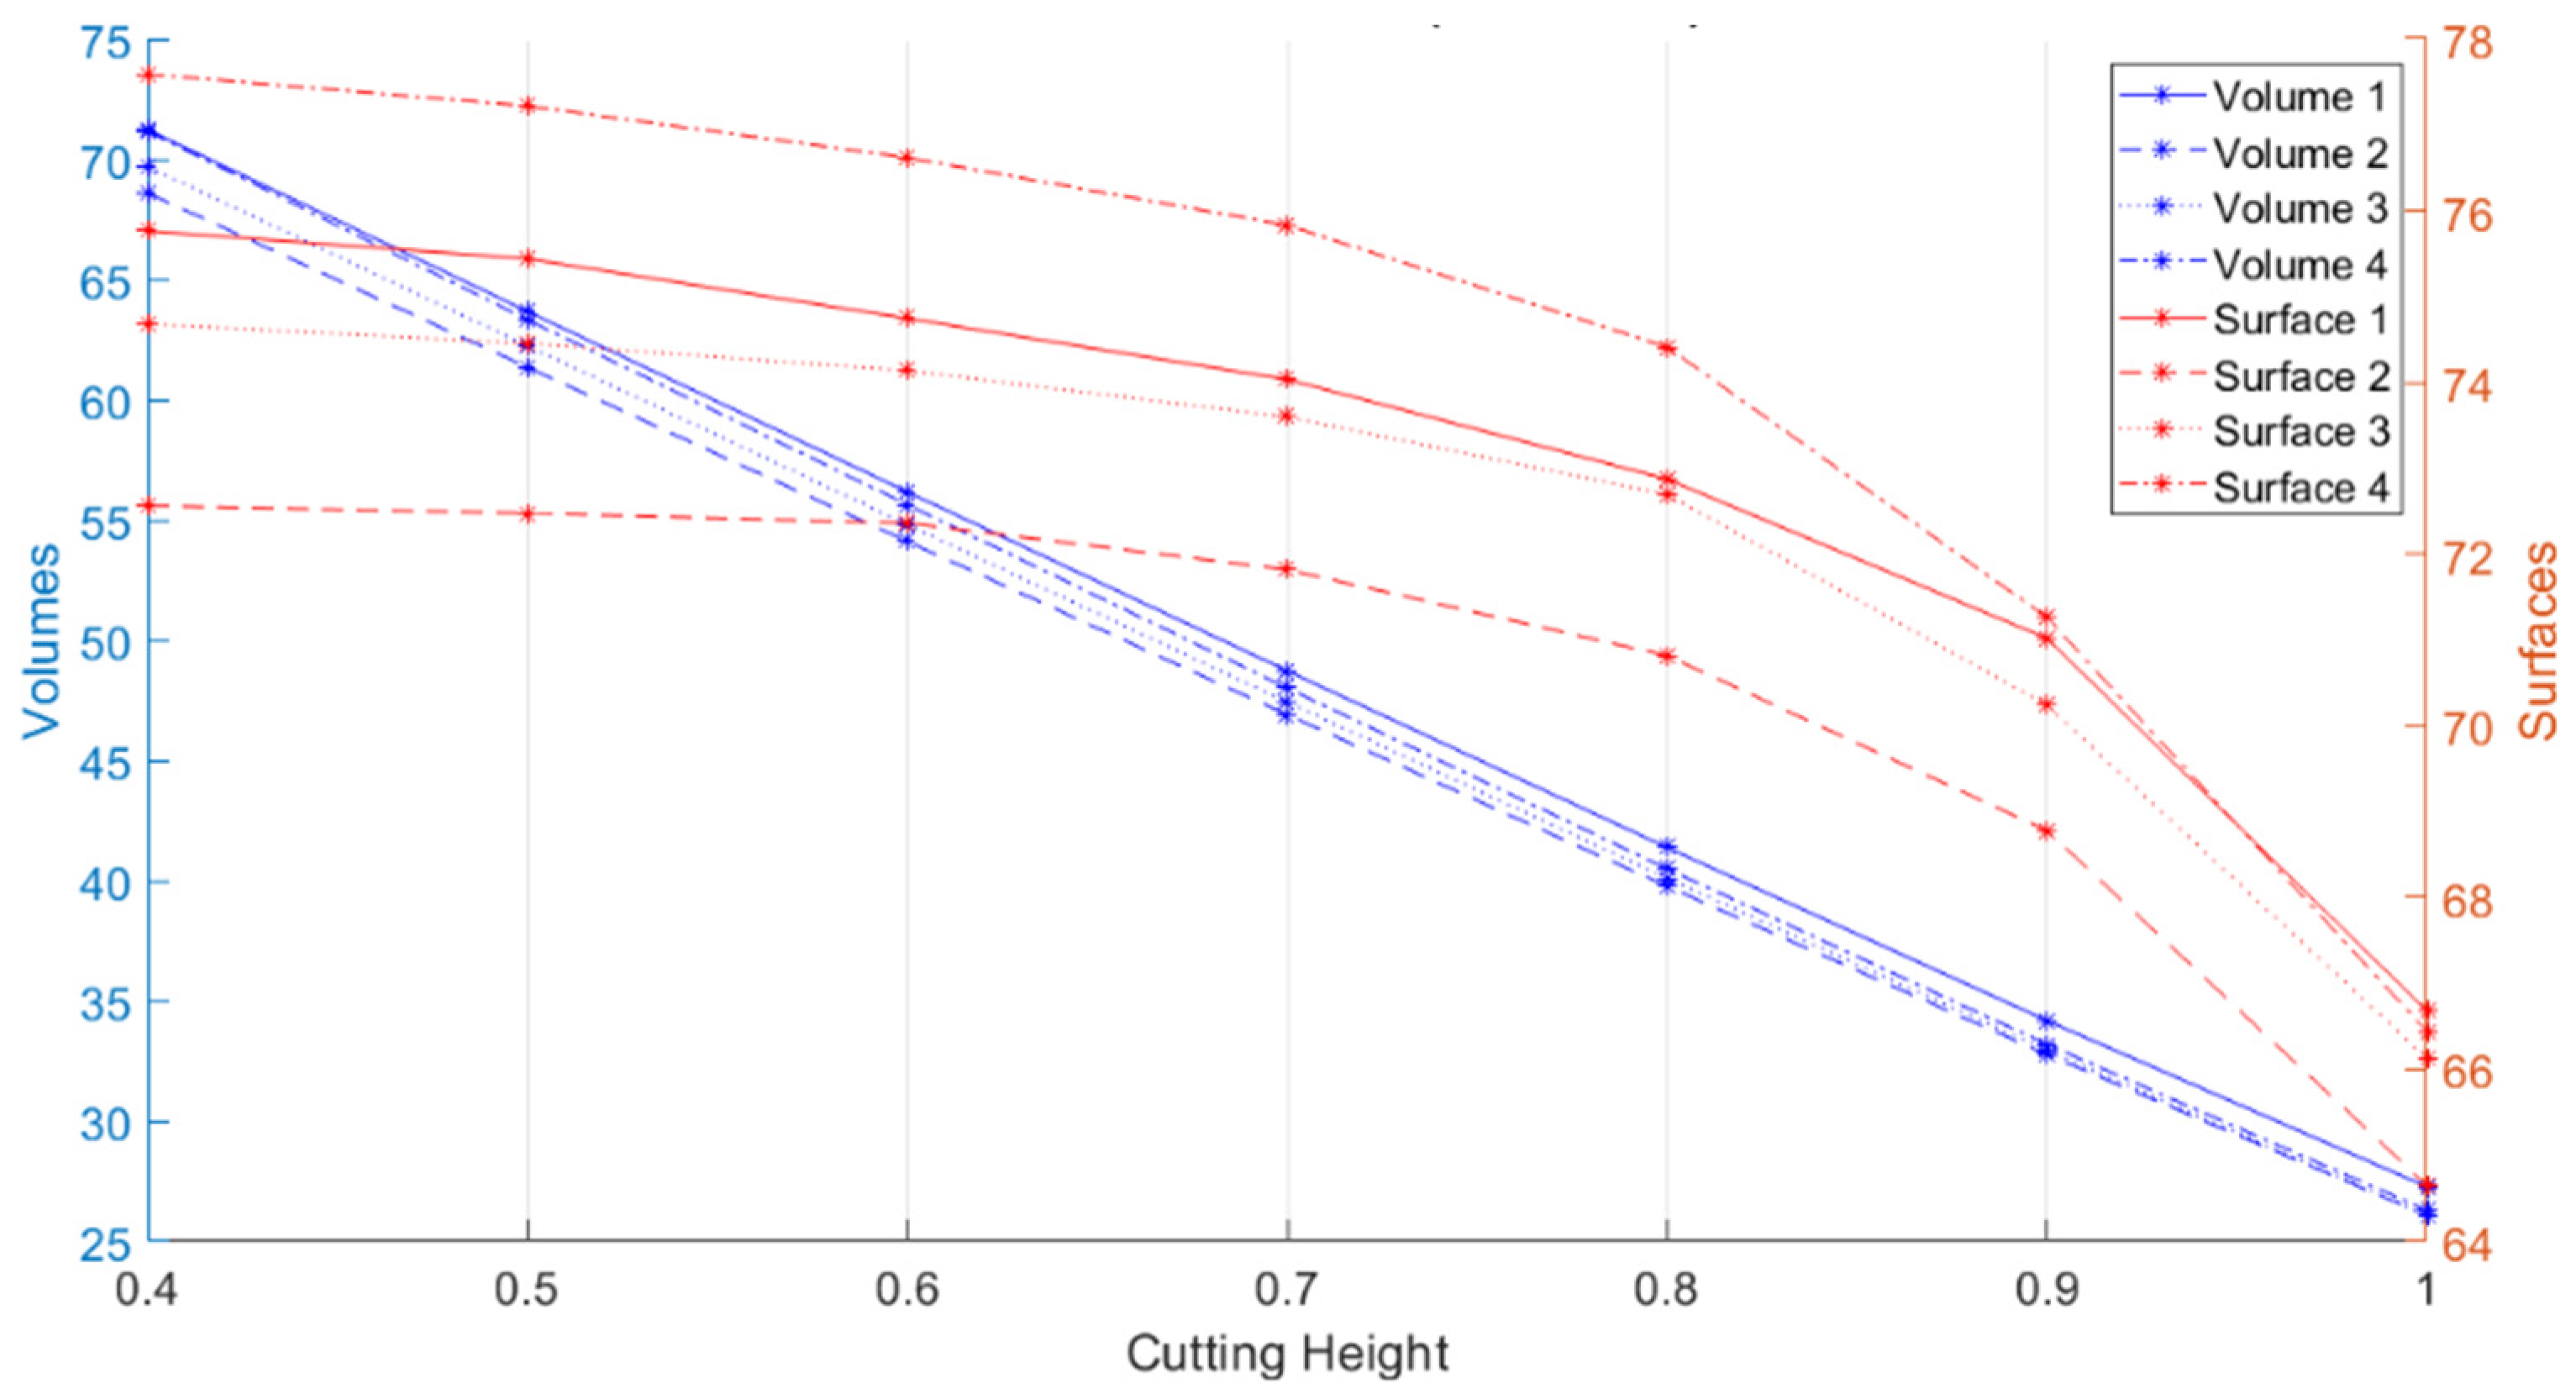
3.2. MATLAB and ArcGIS Results

Significant differences between field and remote measurements were also observed in this study. Conversely, the remotely sensed canopy volumes estimated through MATLAB and ArcGIS procedures provided similar results for the three years of investigation. Compared to TRV results, the remote sensing data appeared different at both dates in 2016 and slightly different in 2019. These discrepancies may confirm reliability and precision of the digital model to obtain canopy volume estimation compared with manual measurements. Considering non-parametric inference, differences in volume estimates derived from ArcGIS and MATLAB software were statistically insignificant (Mann Whitney U test, p > 0.05). By contrast, differences in volume estimates derived from field TRV measurement and MATLAB software (or ArcGIS software) were, in both cases, statistically significant (Mann Whitney U test, p < 0.05). The 2017 and 2019 field data had a slightly higher similarity with the values obtained through software elaboration. These results can be justified with (i) the different measure extraction process (in 2016 the measurements were performed considering the highest and widest extension reached by the plant, even isolated shoots) and (ii) the extension of measurements to all the plants of the investigated rows (four rows in 2017 and six in 2019). In 2019, 20 orange cards were uniformly applied in different plants over the field area to evaluate the precision of the CHM reconstruction. A comparison between the height values extracted by ArcGIS and MATLAB software, and those measured in the field, confirms the CHM model precision (R2 = 0.80, p < 0.001, RSME = ±10.28). The GCC range of 24% and 32% obtained in July and August was similar to the values correlated with LAI obtained by Ballesteros et al. [47] on red grapevine Tempranillo cv. and Cabernet Sauvignon cv. TRV and GCC had a similar pattern of development.
Figure 7 highlights the importance of selecting the correct cutting height during the CHM elaboration to have a representative volume of the canopy. Its variation involves a constant reduction in volume and a non-linear change in surface area due to the progressive narrowing of canopy width from the bottom part to the upper. Surface and volume variations were calculated for seven different cutting heights, ranging between 0.4 m up to 1.0 m, with 0.1 m intervals. Based on this elaboration, Figure 7 indicates how canopy volumes in June 2019 vary almost linearly, differently from the surfaces, quite limited in the early stages and decreasing afterward with the same time pattern observed for 2016 and 2017.

4. Discussion

The study aimed at estimating volume and surface variation on an experimental vineyard over three years (2016, 2017, and 2019) by correlating TRV field measurements with RGB-UAV remote sensed estimations. The combination of UAV and SfM algorithms revealed appropriate for vineyard volume and GCC calculation, contributing to a comprehensive description of grapevines canopy structure. These tools are of relevance since traditional methods for physiological variable estimation, routinely used by winemakers, are often time-consuming and require expensive and long-term procedures in both the field and laboratory [46].
Compared with classic methods for row volume calculation, such as the TRV, the proposed approach provided larger information, greater measurement detail, and a precision level not subjected to annual variability derived from different measurement approaches and operators’ skills over the years [27]. The canopy evaluation by UAV-based imagery allows a non-destructive and standardized framework [28] avoiding (or at least reducing) the sampling error intrinsic in manual measurements [47]. The intrinsic variability of manual measurements and the related sampling errors derive from the difficulty to measure the exact height and width of the canopy, often compromised by the presence of single shoots coming out from the main volume of the row and thus affecting the overall measure [31]. Furthermore, large surface extension and a high amount of sampling points determine operator’s fatigue and may lead to a high (and hardly controlled) level of measurational approximation [32]. Based on the empirical results of this study, UAVs’ high-resolution datasets provide accurate geo-referenced imagery with a high spatial and temporal resolution that is near-real-time delivered [33]. The immediate availability of data would lead farmers to consider remote sensing technology as a useful tool for timely operations [34]. Further efforts should be made to develop dedicated and user-friendly software for image analysis and automatic detection of relevant management indexes for specific agronomic practices, such as the TRV.
In this study, we proposed two simulation exercises on remotely sensed input data, respectively based on a simplified approach grounded on a user-friendly software (ArcGIS) and on a less intuitive programming scheme developed through MATLAB software. These two approaches represent different computational strategies, the former reflecting a possible software implementation for visual integration of proximal (field) and remote sensing at the vineyard/farm scale, and the latter reflecting a generalized application for batch computation and assessment over larger spatial scales [40]. Interestingly, remote measurement techniques showed comparable results in terms of the output variable (i.e., estimated row volumes), suggesting how use of a user-friendly approach and a more complex programming scheme does not affect the final estimation of the target variable [33]. However, MATLAB scheme allows calculation of the canopy volume directly from the DSM, thus overcoming the use of third-part software (in our case, Agisoft Metashape) to estimate differences between DSM and DTM as a preliminary step to the creation of the CHM.
Measurement heterogeneity was associated, in large part, with the difference between manual estimates and remote analysis methodologies [48,49,50,51,52]. Based on this evidence, and thanks to the intrinsic variability of the canopy structure across rows, it seems unreasonable to estimate TRV based on individual model rows or even representative plants, although this practice was frequently adopted to expedite fieldwork [37]. We demonstrated how whole-sample estimations are frequently biased when using a sub-sample of measures. Although earlier studies have been devoted to optimal measurement of canopy geometric features, indicating TRV techniques as a reliable reference to estimate canopy volumes [11,53], we assume that the TRV scheme cannot be used as an accurate representation of geometric canopy characteristics of the whole vineyard, due to its inability to detect heterogeneity with a reduced amount of sampling [36]. For this reason, TRV measures should be considered as unrepresentative (or largely biased) in comparison with results from UAV analysis, unless TRV is performed under a huge number of measurements, which is time-consuming and unrealistic for the purposes of standard fieldwork.
In this direction, the empirical results of this study document a significant difference between the estimated volume derived from UAV techniques and TRV field measures. A precise estimation of vineyard’s row volumes is key for (i) planning agrochemical spraying on both small- and large-scale plant protection schemes, (ii) monitoring agronomic operations associated with the crop status, and (iii) preserving the quality of the final product, especially for cultivars that require specific canopy volume extension. In this perspective, the directive 2009/127/EC [54] and 2009/128/EC [55] of the European Parliament, referring to the sustainable use of pesticide, focused on the possible strategies to contain volume distribution excess doses. Assuming the crucial role in determining pesticide doses appropriate for a given vineyards, the possible overestimation of TRV based on field measures may determine a sub-optimal (e.g., excessive) use of chemicals, with negative implications for both economic management and environmental quality of farms [28].
The remote sensing methodology illustrated here allowed for an easy detection of plants (i.e., automatically scanning the whole surface relevant to measurement), evaluating apparent variations in the thickness of the canopy [34]. Moreover, this technique allowed row segmentation by using canopy pixels selected through the CHM [33]. In the vineyard, remote sensing is also crucial to exclude the soil and surface weeds from the analysis in order to avoid the mis-estimation of canopy pixel values [31]. Computer performance did not represent a limit for processing operations, needing only 2 to 4 hours for the models proposed here—and resulting in significantly less effort than the manual field measurements [27]. Such a simple approach becomes more complex when images from the top and the derived digital models are not available. GCC values were comparable to the results of earlier studies reporting canopy coverage between 30% and 40% in similar trellis systems [56,57]. These results were achieved after shoot pruning and remained constant until harvest [47]. Since the BBCH values reported in Table 1 for the three survey years range from fruit set (BBCH-71) to veraison (BBCH-81), the GCC results of this study can be perfectly comparable with those mentioned above. To obtain a more reliable indicator of canopy status, this variable can be considered when estimating row volumes.
Disadvantages of UAV remote sensing applications lie in the inability to perform flights under adverse meteorological conditions, which might damage the UAV and provide unreliable data due to insufficient sunlight irradiation of the crop. Compared with other technology developed for similar purposes, UAVs are relatively inexpensive with critical limitations derived from the need for specific piloting skills and knowhow to process and analyze the acquired data and to convert it into useful information for winegrowers [37]. These findings suggest the need of new technical skills able to fill the gap between winegrowers and information technologies and develop user-friendly tools to spread their use, especially in rural areas specialized in high-value wine production. The main limitation is the integration of this innovation into a complex decision support system aimed at optimizing crop management, reducing costs, operator fatigue, and the release of pollutants derived by agrochemicals’ over-dosage.
The specific ArcGIS exercise developed in our study may answer this limitation, providing a simplified interface for the collection and processing of remotely sensed data and guaranteeing an easy management and integration of data recorded on the field. This technology would help farmers to control grapevine vigor and canopy growth patterns, improve support decisions for crop management, optimize pesticide and fertilizer application, and enhance yield forecasting [27]. The use of dedicated software allows for a more precise volume evaluation, analyzing the smallest details, at least in the visible parts from the top of each plant [46]. The height model resolution was demonstrated to be comparable with results derived from more expensive sensors, such as the Lidar [26,58].

5. Conclusions

This contribution focused on the possible use of additional techniques replacing TRV field estimation with remote estimation. The empirical results of our study confirm the appropriateness of integrating (or even replacing) field measures with more precise and accurate techniques when estimating orchards structural characteristics for optimization of chemical application and other agronomic practices with a direct impact on economic costs and ecological sustainability. Although field estimation of TRV is a routinary sampling methodology still applied in many agronomic contexts, we demonstrate that remote applications may provide reliable and accurate tools to estimate TRV. Based on these results, extensive use of TRV is recommended, when supported by remote sensing, to better qualify errors and heterogeneities in field estimates. This is particularly important when decisions on cost estimation, agronomic practices, and sustainability issues are uniquely taken based on information derived from TRV field assessment.
Proximal and remote sensing together represent promising tools in precision viticulture. In this perspective, further studies should propose new (or refined) techniques quantifying specific canopy characteristics (in addition to height and volume) from an expert interpretation of unmanned aerial vehicles’ images. This specific knowledge may provide the necessary information for a comprehensive understanding of structural characteristic and functional traits of vineyards, having the final objective of enhancing together economic performances and environmental sustainability of productive farms.

Author Contributions

Conceptualization, F.G., A.S., L.S. and L.G.; methodology, F.G.; software, L.G. and L.S.; validation, A.S., L.M. and L.S.; formal analysis, A.S.; investigation, F.G., A.S., L.M. and A.D.; resources, F.G.; data curation, A.D.; writing—original draft preparation, F.G.; A.S., L.G., L.S. and L.M.; writing—review and editing, L.S. and F.G.; visualization, A.S.; supervision, F.G.; project administration, F.G.; funding acquisition, F.G. All authors have read and agreed to the published version of the manuscript.

Funding

This research was funded by “Advanced Technologies for LANds management and Tools for Innovative Development of an Eco sustainable agriculture, ATLANTIDE” CUP J88D20000070002. This project has received funding from the Regione Autonoma della Sardegna (RAS), Italy, through the initiative called “Progetti di Ricerca e Sviluppo, da realizzare in Sardegna attraverso la collaborazione tra imprese e organismi di ricerca o infrastrutture di ricerca, secondo le modalità e le finalità previste dalla Deliberazione G.R. n. 6/27 del 31.1.2017 e in coerenza con la Smart Specialization Strategy (S3) della Regione Autonoma della Sardegna. Progetti di Ricerca e Sviluppo in collaborazione tra imprese e organismi di ricerca o infrastrutture di ricerca”. This research was also funded by “Leveraging CPS Composability & Modularity for Customized and Autonomous Civilian Drones”, H2020-ECSEL-2018-2-RIA-two-stage. This project has received funding from the ECSEL Joint Undertaking (JU) under grant agreement No. 826610. The JU receives support from the European Union’s Horizon 2020 research and innovation program and Spain, Austria, Belgium, Czech Republic, France, Italy, Latvia, Netherlands. Prof. Francesca Palumbo is also grateful to the University of Sassari that supported her research activities through the “fondo di Ateneo per la ricerca 2020”.

Acknowledgments

This work is part of the activities of the project “Advanced Technologies for LANds management and Tools for Innovative Development of an EcoSustainable agriculture” (ATLANTIDE). The general objective of ATLANTIDE is the complete integration between theoretical knowledge and technologies for the definition and implementation of agricultural production models that aim at efficiently combine inputs (water, fertilizers, pesticides, energy, time) with outputs (increase efficiency, improvement of quality, reduction of production losses, reduction of resource use, reduction of land use, reduction of the ecological footprint). The team of the ATLANTIDE project is made up of three Partners with strong complementarities: Topcon Agriculture S.p.A—Private Company, AbinsulaSrl—Sardinian Small-Medium Enterprise, and the Center for Innovative Agriculture, University of Sassari—Research Organization (Coordinator). This work is part of the activities of the project “ATLANTIDE” and is the topic of Work Package 7. The specific objective of WP7 Crop management of the vineyard with the combined support of precision viticulture and Artificial Intelligence (AI) technologies” is the creation of a Framework enabling the manipulation, aggregation and fusion of data from the agro-food field that allows the development from the point of view of Precision Agriculture in a European context. Filippo Gambella is also grateful to the University of Sassari that supported his research activities through the “Fondo di Ateneo per la ricerca 2020”.

Conflicts of Interest

The authors declare no conflict of interest.

References

  1. Recanatesi, F.; Clemente, M.; Grigoriadis, E.; Ranalli, F.; Zitti, M.; Salvati, L. A fifty-year sustainability assessment of Italian agro-forest districts. Sustainability 2016, 8, 32. [Google Scholar] [CrossRef] [Green Version]
  2. Biasi, R.; Brunori, E.; Ferrara, C.; Salvati, L. Towards sustainable rural landscapes? A multivariate analysis of the structure of traditional tree cropping systems along a human pressure gradient in a Mediterranean region. Agrofor. Syst. 2017, 91, 1199–1217. [Google Scholar] [CrossRef]
  3. Colantoni, A.; Paris, E.; Bianchini, L.; Ferri, S.; Marcantonio, V.; Carnevale, M.; Palma, A.; Civitarese, V.; Gallucci, F. Spent coffee ground characterization, pelletization test and emissions assessment in the combustion process. Sci. Rep. 2021, 11, 5119. [Google Scholar] [CrossRef] [PubMed]
  4. Santesteban, L.G.; Di Gennaro, S.F.; Herrero-Langreo, A.; Miranda, C.; Royo, J.B.; Matese, A. High-resolution UAV-based thermal imaging to estimate the instantaneous and seasonal variability of plant water status within a vineyard. Agric. Water Manag. 2017, 183, 49–59. [Google Scholar] [CrossRef]
  5. Delfanti, L.; Colantoni, A.; Recanatesi, F.; Bencardino, M.; Sateriano, A.; Zambon, I.; Salvati, L. Solar plants, environmental degradation and local socioeconomic contexts: A case study in a Mediterranean country. Environ. Impact Assess. Rev. 2016, 61, 88–93. [Google Scholar] [CrossRef]
  6. Bianchini, L.; Costa, P.; Dell’Omo, P.P.; Colantoni, A.; Cecchini, M.; Monarca, D. An Industrial Scale, Mechanical Process for Improving Pellet Quality and Biogas Production from Hazelnut and Olive Pruning. Energies 2021, 14, 1600. [Google Scholar] [CrossRef]
  7. Cecchini, M.; Piccioni, F.; Ferri, S.; Coltrinari, G.; Bianchini, L.; Colantoni, A. Preliminary Investigation on Systems for the Preventive Diagnosis of Faults on Agricultural Operating Machines. Sensors 2021, 21, 1547. [Google Scholar] [CrossRef]
  8. Tavankar, F.; Nikooy, M.; Latterini, F.; Venanzi, R.; Bianchini, L.; Picchio, R. The Effects of Soil Moisture on Harvesting Operations in Populus spp. Plantations: Specific Focus on Costs, Energy Balance and GHG Emissions. Sustainability 2021, 13, 4863. [Google Scholar] [CrossRef]
  9. Borgogno Mondino, E.; Gajetti, M. Preliminary considerations about costs and potential market of remote sensing from UAV in the Italian viticulture context. Eur. J. Remote Sens. 2017, 50, 310–319. [Google Scholar] [CrossRef]
  10. Vrontis, D.; Morea, D.; Basile, G.; Bonacci, I.; Mazzitelli, A. Consequences of technology and social innovation on traditional business model. Technol. Forecast. Soc. Chang. 2021, 170, 120877. [Google Scholar] [CrossRef]
  11. Di Gennaro, S.F.; Matese, A. Evaluation of novel precision viticulture tool for canopy biomass estimation and missing plant detection based on 2.5D and 3D approaches using RGB images acquired by UAV platform. Plant Methods 2020, 16, 91. [Google Scholar] [CrossRef]
  12. De Castro, A.I.; Jimenez-Brenes, F.M.; Torres-Sánchez, J.; Peña, J.M.; Borra-Serrano, I.; López-Granados, F. 3-D characterization of vineyards using a novel UAV imagery-based OBIA procedure for precision viticulture applications. Remote Sens. 2018, 10, 584. [Google Scholar] [CrossRef] [Green Version]
  13. Cinat, P.; Di Gennaro, S.F.; Berton, A.; Matese, A. Comparison of unsupervised algorithms for Vineyard Canopy segmentation from UAV multispectral images. Remote Sens. 2019, 11, 1023. [Google Scholar] [CrossRef] [Green Version]
  14. Di Gennaro, S.F.; Toscano, P.; Cinat, P.; Berton, A.; Matese, A. A precision viticulture UAV-based approach for early yield prediction in vineyard. In Precision Agriculture’19; Stafford, J.V., Ed.; Wageningen Academic Publishers: Wageningen, The Netherlands, 2019; pp. 370–378. [Google Scholar] [CrossRef]
  15. Khaliq, A.; Comba, L.; Biglia, A.; Ricauda Aimonino, D.; Chiaberge, M.; Gay, P. Comparison of satellite and UAV-based multispectral imagery for vineyard variability assessment. Remote Sens. 2019, 11, 436. [Google Scholar] [CrossRef] [Green Version]
  16. Matese, A.; Di Gennaro, S.F. Practical applications of a multisensory UAV platform based on multispectral, thermal and rgb high resolution images in precision viticulture. Agriculture 2018, 8, 116. [Google Scholar] [CrossRef] [Green Version]
  17. Pádua, L.; Adão, T.; Sousa, A.; Peres, E.; Sousa, J.J. Individual Grapevine Analysis in a Multi-Temporal Context Using UAV-Based Multi-Sensor Imagery. Remote Sens. 2020, 12, 139. [Google Scholar] [CrossRef] [Green Version]
  18. Pádua, L.; Marques, P.; Adão, T.; Guimarães, N.; Sousa, A.; Peres, E.; Sousa, J.J. Vineyard variability analysis through UAV-based vigour maps to assess climate change impacts. Agronomy 2019, 9, 581. [Google Scholar] [CrossRef] [Green Version]
  19. Pádua, L.; Marques, P.; Hruška, J.; Adão, T.; Peres, E.; Morais, R.; Sousa, J.J. Multi-temporal vineyard monitoring through UAV-based RGB imagery. Remote Sens. 2018, 10, 1907. [Google Scholar] [CrossRef] [Green Version]
  20. Pichon, L.; Besqueut, G.; Tisseyre, B. A systemic approach to identify relevant information provided by UAV in precision viticulture. Adv. Anim. Biosci. 2017, 8, 823–827. [Google Scholar] [CrossRef]
  21. Pichon, L.; Leroux, C.; Macombe, C.; Taylor, J.; Tisseyre, B. What relevant information can be identified by experts on unmanned aerial vehicles’ visible images for precision viticulture? Precis. Agric. 2019, 20, 278–294. [Google Scholar] [CrossRef]
  22. Romero, M.; Luo, Y.; Su, B.; Fuentes, S. Vineyard water status estimation using multispectral imagery from an UAV platform and machine learning algorithms for irrigation scheduling management. Comput. Electron. Agric. 2018, 147, 109–117. [Google Scholar] [CrossRef]
  23. Sutton, T.B.; Unrath, C.R. Evaluation of the tree-row-volume concept with density adjustments in relation to spray deposits in apple orchards. Plant Dis. 1984, 68, 480–484. [Google Scholar] [CrossRef]
  24. Manktelow, D.W.L.; Praat, J.P. The Tree-Row-Volume Spraying System and its Potential use in New Zealand. In Proceedings of the NZ Plant Protection Conference, Lincoln, New Zealand, 18–21 August 1997; pp. 119–124. [Google Scholar] [CrossRef] [Green Version]
  25. Gil, E.; Escolà, A.; Rosell, J.; de Martí, S.P.; Val, L. Variable Rate Application of Plant Protection Products in Vineyard using Ultrasonic Sensors. Crop Prot. 2007, 26, 1287–1297. [Google Scholar] [CrossRef] [Green Version]
  26. Andújar, D.; Moreno, H.; Bengochea-Guevara, J.; De Castro, A.; Ribeiro, A. Aerial imagery or on-ground detection? An economic analysis for vineyard crops. Comput. Electron. Agric. 2019, 157, 351–358. [Google Scholar] [CrossRef]
  27. Pallottino, F.; Menesatti, P.; Figorilli, S.; Antonucci, F.; Tomasone, R.; Colantoni, A.; Costa, C. Machine vision retrofit system for mechanical weed control in precision agriculture applications. Sustainability 2018, 10, 2209. [Google Scholar] [CrossRef] [Green Version]
  28. Fortunati, S.; Morea, D.; Mosconi, E.M. Circular economy and corporate social responsibility in the agricultural system: Cases study of the Italian agri-food industry. Agric. Econ. 2020, 66, 489–498. [Google Scholar] [CrossRef]
  29. Torres-Sánchez, J.; Peña, J.M.; De Castro, A.I.; López-Granados, F. Multi-temporal mapping of the vegetation fraction in early-season wheat fields using images from UAV. Comput. Electron. Agric. 2014, 103, 104–113. [Google Scholar] [CrossRef]
  30. Biasi, R.; Colantoni, A.; Ferrara, C.; Ranalli, F.; Salvati, L. In-between sprawl and fires: Long-term forest expansion and settlement dynamics at the wildland–urban interface in Rome, Italy. Int. J. Sustain. Dev. World Ecol. 2015, 22, 467–475. [Google Scholar] [CrossRef]
  31. Matese, A.; Di Gennaro, S.F.; Berton, A. Assessment of a canopy height model (CHM) in a vineyard using UAV-based multispectral imaging. Int. J. Remote Sens. 2017, 38, 2150–2160. [Google Scholar] [CrossRef]
  32. Matese, A.; Di Gennaro, S.F.; Santesteban, L.G. Methods to compare the spatial variability of UAV-based spectral and geometric information with ground autocorrelated data. A case of study for precision viticulture. Comput. Electron. Agric. 2019, 162, 931–940. [Google Scholar] [CrossRef]
  33. Jurado, J.M.; Pádua, L.; Feito, F.R.; Sousa, J.J. Automatic Grapevine Trunk Detection on UAV-Based Point Cloud. Remote Sens. 2020, 12, 3043. [Google Scholar] [CrossRef]
  34. Pijl, A.; Tosoni, M.; Roder, G.; Sofia, G.; Tarolli, P. Design of Terrace drainage networks using UAV-based high-resolution topographic data. Water 2019, 11, 814. [Google Scholar] [CrossRef] [Green Version]
  35. Sassu, A.; Gambella, F.; Ghiani, L.; Mercenaro, L.; Caria, M.; Pazzona, A.L. Advances in Unmanned Aerial System Remote Sensing for Precision Viticulture. Sensors 2021, 21, 956. [Google Scholar] [CrossRef] [PubMed]
  36. Mathews, A.J.; Jensen, J.L.R. Visualizing and quantifying vineyard canopy LAI using an Unmanned Aerial Vehicle (UAV) collected high density structure from motion point cloud. Remote Sens. 2013, 5, 2164–2183. [Google Scholar] [CrossRef] [Green Version]
  37. Kalisperakis, I.; Stentoumis, C.; Grammatikopoulos, L.; Karantzalos, K. Leaf Area Index Estimation in Vineyards from UAV Hyperspectral Data, 2D Image Mosaics And 3D Canopy Surface Models. Remote Sens. Spat. Inf. Sci. 2015, XL-1/W4, 299–303. [Google Scholar] [CrossRef] [Green Version]
  38. Weiss, M.; Baret, F. Using 3D point clouds derived from UAV RGB imagery to describe vineyard 3D macro-structure. Remote Sens. 2017, 9, 111. [Google Scholar] [CrossRef] [Green Version]
  39. Gil, E.; Llorens, J.; Llop, J. Precision Viticulture: Use of New Technologies to Improve Efficiency in Spray Applications in Vineyard. In Proceedings of the Technology and Management to Increase the Efficiency in Sustainable Agricultural Systems, Rosario, Argentina, 1–4 September 2009. [Google Scholar]
  40. Comba, L.; Biglia, A.; Aimonino, D.R.; Tortia, C.; Mania, E.; Guidoni, S.; Gay, P. Leaf Area Index evaluation in vineyards using 3D point clouds from UAV imagery. Precis. Agric. 2020, 21, 881–896. [Google Scholar] [CrossRef] [Green Version]
  41. Tsouros, D.C.; Bibi, S.; Sarigiannidis, P.G. A review on UAV-based applications for precision agriculture. Information 2019, 10, 349. [Google Scholar] [CrossRef] [Green Version]
  42. Tao, H.; Feng, H.; Xu, L.; Miao, M.; Long, H.; Yue, J.; Fan, L. Estimation of Crop Growth Parameters Using UAV-Based Hyperspectral Remote Sensing Data. Sensors 2020, 20, 1296. [Google Scholar] [CrossRef] [PubMed] [Green Version]
  43. Campos, J.; García-Ruíz, F.; Gil, E. Assessment of Vineyard Canopy Characteristics from Vigour Maps Obtained Using UAV and Satellite Imagery. Sensors 2021, 21, 2363. [Google Scholar] [CrossRef]
  44. Bendig, J.; Bolten, A.; Bareth, G. UAV-based imaging for multi-temporal, very high resolution crop surface models to monitor crop growth variability. Photogramm. Fernerkund. Geoinf. 2013, 6, 551–562. [Google Scholar] [CrossRef]
  45. Zarco-Tejada, P.J.; Diaz-Varela, R.; Angileri, V.; Loudjani, P. Tree height quantification using very high resolution imagery acquired from an unmanned aerial vehicle (UAV) and automatic 3D photo-reconstruction methods. Eur. J. Agron. 2014, 55, 89–99. [Google Scholar] [CrossRef]
  46. Geipel, J.; Link, J.; Claupein, W. Combined spectral and spatial modeling of corn yield based on aerial images and crop surface models acquired with an unmanned aircraft system. Remote Sens. 2014, 6, 10335–10355. [Google Scholar] [CrossRef] [Green Version]
  47. Ballesteros, R.; Ortega, J.F.; Hernández, D.; Moreno, M.Á. Characterization of Vitis vinifera L. canopy using unmanned aerial vehicle-based remote sensing and photogrammetry techniques. Am. J. Enol. Vitic. 2015, 66, 120–129. [Google Scholar] [CrossRef]
  48. Bajocco, S.; Salvati, L.; Ricotta, C. Land degradation versus fire: A spiral process? Prog. Phys. Geogr. 2011, 35, 3–18. [Google Scholar] [CrossRef]
  49. Bajocco, S.; De Angelis, A.; Salvati, L. A satellite-based green index as a proxy for vegetation cover quality in a Mediterranean region. Ecol. Indic. 2012, 23, 578–587. [Google Scholar] [CrossRef]
  50. Bajocco, S.; Ceccarelli, T.; Smiraglia, D.; Salvati, L.; Ricotta, C. Modeling the ecological niche of long-term land use changes: The role of biophysical factors. Ecol. Indic. 2016, 60, 231–236. [Google Scholar] [CrossRef]
  51. Smiraglia, D.; Ceccarelli, T.; Bajocco, S.; Salvati, L.; Perini, L. Linking trajectories of land change, land degradation processes and ecosystem services. Environ. Res. 2016, 147, 590–600. [Google Scholar] [CrossRef] [PubMed]
  52. Kazemzadeh-Zow, A.; Zanganeh Shahraki, S.; Salvati, L.; Samani, N.N. A spatial zoning approach to calibrate and validate urban growth models. Int. J. Geogr. Inf. Sci. 2017, 31, 763–782. [Google Scholar] [CrossRef]
  53. Anifantis, A.S.; Camposeo, S.; Vivaldi, G.A.; Santoro, F.; Pascuzzi, S. Comparison of UAV Photogrammetry and 3D Modeling Techniques with Other Currently Used Methods for Estimation of the Tree Row Volume of a Super-High-Density Olive Orchard. Agriculture 2019, 9, 233. [Google Scholar] [CrossRef] [Green Version]
  54. Council of the European Union; European Parliament. Directive 2009/127/EC of the European Parliament and of the Council of 21 October 2009 amending Directive 2006/42/EC with regard to machinery for pesticide application (Text with EEA relevance). Off. J. Eur. Union 2009, L310, 29–33. [Google Scholar]
  55. Council of the European Union; European Parliament. Directive 2009/128/EC of the European Parliament and Of the Council of 21 October 2009 establishing a framework for Community action to achieve the sustainable use of pesticides (Text with EEA relevance). Off. J. Eur. Union 2009, L309, 71–86. [Google Scholar]
  56. Campos, I.; Nealeb, C.M.U.; Caleraa, A.; Balbontína, C.; Piquerasa, J.G. Assessing satellite-based basal crop coefficients for irrigated grapes (Vitis vinifera L.). Agric. Water Manag. 2010, 98, 45–54. [Google Scholar] [CrossRef]
  57. López-Urrea, R.; Montoro, A.; Mañas, F.; López-Fuster, P.; Fereres, E. Evapotranspiration and crop coefficients from lysimeter measurements of mature Tempranillo wine grapes. Agric. Water Manag. 2012, 112, 13–20. [Google Scholar] [CrossRef]
  58. Sanz, R.; Rosell, J.R.; Llorens, J.; Gil, E.; Planas, S. Relationship between tree row LIDAR-volume and leaf area density for fruit orchards and vineyards obtained with a LIDAR 3D Dynamic Measurement System. Agric. For. Meteorol. 2013, 171–172, 153–162. [Google Scholar] [CrossRef] [Green Version]
Figure 1. The experimental field located in Usini, North-Eastern Sardinia, Italy (WGS84-UTM 32N–EPSG 32,632 projected coordinate system).
Remotesensing 14 00130 g001
Figure 2. (a) The measurements of height and width rows using the wooden rod. Canopy heights were calculated subtracting 0.90 m (red line) from the total measure; (b) an exemplification of the influence of isolated shoots (in red) in height and width determination during field measurements. The blue shape represents the volume estimated in 2017 and 2019, excluding the shoots out of the row’s shape considered in 2016.
Remotesensing 14 00130 g002
Figure 3. The Digital Surface Model (DSM) raster (colored with a pseudo-colors palette to emphasize the altitude of each pixel above sea level) employed during the MATLAB processing and divided into 0.90 m × 2.10 m blocks (as shown in the enlarged upper left portion of the ortho-image). Canopy and terrain pixels are represented with different colors in each block.
Remotesensing 14 00130 g003
Figure 4. (a) The three-layer typologies used to obtain canopy volumes through ArcGIS; (b) an exemplification of the Canopy Height Model (CHM) derived from the difference between DSM and Digital Terrain Model (DTM) rasters. Each square represents a pixel with the relative altitude above the sea level (DSM and DTM) and height above ground (CHM). The CHM height values were used to calculate the rows’ volumes.
Remotesensing 14 00130 g004
Figure 5. Flowcharts summarizing the two approaches implemented in this study, (a) the ArcGIS CHM workflow and (b) the MATLAB workflow.
Remotesensing 14 00130 g005
Figure 6. Statistical stability (per cent departure from whole-sample TRV estimate) of canopy volume field measurements as a function of sample size by survey date (a) 7 July 2016; (b) 2 August 2016; (c) 31 July 2017; (d) 26 June 2019.
Remotesensing 14 00130 g006
Figure 7. The absolute variation of volume (m3) and surface area (m2) of four vineyard rows with imposed cutting heights (MATLAB elaboration) in 2019.
Remotesensing 14 00130 g007
Table 1. The details of the flight surveys, ortho-mosaics’ properties, Ground Sample Distance (GSD), vineyard Day of the Year (DOY), BBCH, and Growing Degree Day (GDD) values.
YearDateOrthomosaicsVineyard Phenology
GSD (cm)RMSE (cm)DOYBBCHGDD
20167 July0.263.318979798
2 August0.263.1215811176
201717 July0.906.419879798
31 July1.225.7212811282
201926 June0.922.517771665
Table 2. The Tree-Row-Volume (TRV) field measurements compared with the grapevine volumes calculated by ArcGIS and MATLAB, and the Green Canopy Cover (GCC), at five different dates.
DateField
TRV(m3/ha)
ArcGIS
TRV(m3/ha)
MATLAB
TRV(m3/ha)
MATLAB
GCC (%)
7 July 20165971 11991189829
2 August 20165984 11649158026
17 July 20171271 21343142724
31 July 20171311 21316135330
26 June 20192360 31550157232
1 Twelve measurements repeated for nine rows were used to extract the value of TRV; 2 One hundred measurements repeated for four rows were used to extract the value of TRV; 3 One hundred measurements repeated for six rows were used to extract the value of TRV.
Publisher’s Note: MDPI stays neutral with regard to jurisdictional claims in published maps and institutional affiliations.

