Abstract
Major advancements in the monitoring of both the occurrence and impacts of space weather can be made by evaluating the occurrence and distribution of ionospheric disturbances. Previous studies have shown that the fluctuations in total electron content (TEC) values estimated from Global Navigation Satellite System (GNSS) observations clearly exhibit the intensity levels of ionospheric irregularities, which vary continuously in both time and space. The duration and intensity of perturbations depend on the geographic location. They are also dependent on the physical activities of the Sun, the Earth’s magnetic activities, as well as the process of transferring energy from the Sun to the Earth. The aim of this study is to establish ionospheric irregularity maps using ROTI (rate of TEC index) values derived from conventional dual-frequency GNSS measurements (30-s interval). The research areas are located in Southeast Asia (15°S–25°N latitude and 95°E–115°E longitude), which is heavily affected by ionospheric scintillations, as well as in other regions around the globe. The regional ROTI map of Southeast Asia clearly indicates that ionospheric disturbances in this region are dominantly concentrated around the two equatorial ionization anomaly (EIA) crests, occurring mainly during the evening hours. Meanwhile, the global ROTI maps reveal the spatial and temporal distributions of ionospheric scintillations. Within the equatorial region, South America is the most vulnerable area (22.6% of total irregularities), followed by West Africa (8.2%), Southeast Asia (4.7%), East Africa (4.1%), the Pacific (3.8%), and South Asia (2.3%). The generated maps show that the scintillation occurrence is low in the mid-latitude areas during the last solar cycle. In the polar regions, ionospheric irregularities occur at any time of the day. To compare ionospheric disturbances between regions, the Earth is divided into ten sectors and their irregularity coefficients are calculated accordingly. The quantification of the degrees of disturbance reveals that about 58 times more ionospheric irregularities are observed in South America than in the southern mid-latitudes (least affected region). The irregularity coefficients in order from largest to smallest are as follows: South America, 3.49; the Arctic, 1.94; West Africa, 1.77; Southeast Asia, 1.27; South Asia, 1.24; the Antarctic, 1.10; East Africa, 0.89; the Pacific, 0.32; northern mid-latitudes, 0.15; southern mid-latitudes, 0.06.
1. Introduction
Space-based observations and the analysis of Global Navigation Satellite Systems (GNSS) signals are well-utilized approaches to study space weather effects and the ionosphere. GNSS-derived measurements of electromagnetic waves as they pass through the ionosphere can be time-delayed due to ionospheric disturbances caused by space weather, leading to erroneous positioning results. By analyzing these effects, it is possible to assess the state of the ionosphere, namely the degree of its disturbance. In geodetic space weather research, the ionosphere and ionospheric scintillations play important roles in determining the impacts of space weather phenomena on satellite signals. One of the important parameters of the ionosphere is the total electron content (TEC), which is defined as the total number of electrons present along the ray path between a radio transmitter and a receiver. The unit of measurement is TECU, with 1 TECU corresponding to 1016 electrons per square meter. TEC can be derived from dual-frequency GNSS measurements [1], and it is an appropriate parameter to monitor possible space weather impacts. Since there are many satellites in the sky, each satellite has a corresponding TEC value called the slant TEC (STEC). Therefore, in practical use, only one unique TEC at one location is used, which is called the vertical TEC (VTEC). STEC can be easily converted to VTEC using a mapping function [2].
GNSS positioning is vulnerable to errors caused by ionospheric delay [3,4,5]. As can be seen in Figure 1, the microwave signal when passing through the highly ionized region of the ionosphere will be delayed in time due to the longer distance traveled. The causes of such apparent delays are the refraction and diffraction of signals passing through the ionosphere. These factors significantly modify both the speed and direction of the satellite signals. Nonetheless, such delays can be easily eliminated by using the multi-frequency technique [6]. In fact, the ionosphere not only contains errors due to the high TEC, but it can also cause errors in geodetic measurements due to TEC disturbances. Figure 1 shows the difference between the impacts of ionospheric delay and ionospheric irregularities on GNSS satellite signals. While ionospheric delay mainly depends on the TEC value (the greater the total number of free electrons, the greater the effect), ionospheric disturbances are far more complicated.
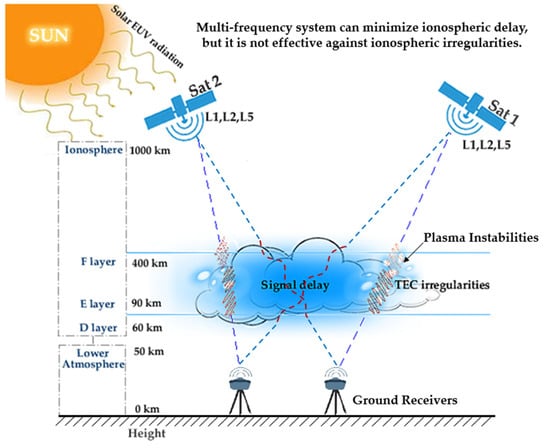
Figure 1.
The difference between ionospheric delay (due to TEC) and ionospheric scintillation (due to small-scale irregularities). Ionospheric delay can be almost completely mitigated by using multi-frequency observations [6], although this technique cannot detect or remove the scintillated signals. The main cause of both errors is disturbances in the ionosphere, which are primarily driven by solar activities. However, for ionospheric irregularities, the key drivers are plasma instabilities and the electrodynamic process.
Ionospheric irregularities are small-scale disturbances that are capable of causing a rapid modification of radio waves. Typical examples of such irregularities are scintillations [7]. Ionospheric scintillation is one of the most unpredictable and ominous errors. In scintillation environments, electronic disturbances cause the signal power to be significantly reduced. In the event of mild disturbances, this degrades the quality of observations, although when the disturbances are more severe, this can lead to cycle slips or even a complete loss of the signal (loss of lock error). Unfortunately, dual-frequency measurements cannot detect or remove this kind of error [8]. Along with the irregularities in the density and movement of free electrons in the ionosphere, the appearance and intensity of scintillations also depend on other factors, such as the operating frequency of devices, geographic location, time (day or night, season, 11 year solar cycle), and state of the Earth’s magnetic field. Ionospheric scintillations have been meticulously studied over the past several decades [9,10,11,12,13,14,15,16,17], although there are still research gaps due to the fact that in order to study this phenomenon, special GNSS receivers are required, which often work at a very high sampling rate (usually at 50 Hz). These receivers are rather expensive and not as widely available as standard receivers. However, in the absence of scintillation receivers, one is still able to use observations from conventional dual-frequency GNSS receivers to detect the irregularities in the ionosphere [17]. This method is more widely used today because of the density and global availability of normal-rate GNSS stations.
As mentioned above, due to the limited number of high-rate GNSS receivers, previous studies have mainly focused on localized regions over specific time periods. To date, there have been few specific publications on the global distribution of ionospheric disturbances using all available IGS stations [8,9,10,12,15,16]. The current global ionospheric scintillation models only give the fundamental characteristics of scintillations in different latitudinal areas of the Earth (i.e., low-latitude, mid-latitude, and high-latitude areas) [8]. However, the specific perturbation rates in different regions in each period have not yet been given. Based on these research gaps, the objective of this paper is to clearly show the distribution of ionospheric disturbances on a global scale in both time and space using the rate of the TEC index (ROTI).
The use of a conventional GNSS receiver to identify ionospheric disturbances involves the use of ROTI. ROTI was first introduced in [18] based on the definition from [9]; that is, ionospheric scintillation causes rapid fluctuations in the amplitude and phases of satellite signals due to the rapid and uneven variation in electron density within the ionosphere as the signal passes through it. ROTI is used to describe the dynamic changes in electron density and to determine the presence of irregularities in the ionosphere that can affect the electromagnetic wave signal. According to Pi, ROTI is defined as the standard deviation of the rate of TEC (ROT) over a 5 min period and is used to statistically present ionospheric irregularities using a network-based GPS monitoring system. This method uses the availability of data from normal GNSS receivers with global coverage, for instance the International GNSS Service (IGS) stations, to study ionospheric irregularities. Its main advantage over scintillation indices is that it is calculated based on measurements from standard dual-frequency observations at 30 s sampling, which have been and still are far more common than scintillation receivers. Based on the results reported in [18,19,20], it was concluded that ROTI could be used as a proxy for assessing the presence of ionospheric disturbances. There are also other methods worthy of attention that can be used to identify ionospheric disturbances, such as ACEVS [21].
In principle, the spatial distribution of ionospheric disturbances can be divided into three sectors, namely the low-latitude areas (or equatorial areas), mid-latitude areas, and high-latitude areas (or polar areas), of which the irregularities in the equator are the most complicated [22]. In the equatorial region, the ionosphere often experiences the most extreme and abnormal variations. This is, hence, called the equatorial ionization anomaly (EIA). It is well known that the EIA is characterized by an electron density trough at the magnetic equator and two crests of enhanced electron density at about ±15° magnetic latitudes [23]. The main driver of the EIA is the fountain effect. In the equatorial zone there are different physical processes that produce changes in the structure of the EIA, such as field-aligned plasma transport due to transequatorial neutral winds, photochemical processes produced by neutral composition effects, and others. At mid-latitudes, scintillations rarely occur, except during extreme ionospheric storms during the most active years of the solar cycle. Scintillation activities occur less frequently in high-latitude areas than in the equator, although are more difficult to predict because they can appear at any time of day [24].
The temporal distribution of ionospheric irregularities is divided by the day, and also depends on the months of the year and the solar cycle process [22]. In the years of intense solar activity, such as 2013–2014 during solar cycle 24 (SC24), scintillations occur at a higher frequency than in other years, in terms of both duration and intensity [8]. Electron disturbances are often strong and can greatly affect satellite measurements during strong geomagnetic storms. Nevertheless, with modern advanced techniques, we are able to predict space weather events such as geomagnetic storms on times scales of hours to about three days following the eruption of a coronal mass ejection (CME) [25]. At low latitudes, because of the Rayleigh–Taylor instability, ionospheric disturbances occur most often at night, starting just after sunset and lasting until about 02:00–03:00 local time (LT) of the following day [26]. After such an event, the level of ionization in the ionosphere will be too low to support scintillations at GNSS frequencies. During the daytime, scintillations rarely occur. Meanwhile, the occurrence of scintillations at auroral latitudes is strongly dependent on geomagnetic activity levels; scintillations can occur in all seasons and are not limited to local night-time hours as is the case for equatorial anomalies. In these regions, the irregularities move at speeds of up to ten times faster, despite the lower ionospheric density than in the equatorial regions [22].
The aim of this work is to establish ionospheric irregularity maps based on the ROTI values calculated from dual-frequency GNSS observations. Firstly, we calculate ROTI and VTEC gradient values at stations located in Southeast Asia (15°S–25°N latitude and 95°E–115°E longitude) in the second half of October 2015 (most active solar period of SC24). On several days during this period, the ionosphere was strongly disturbed based on the abnormally high number of ionospheric irregularities. The ROTI results also provide spatial (geographic coordinates) and temporal information regarding the perturbations. Based on these values, a local ROTI map for Southeast Asia is produced, as this area is considered one of the most vulnerable regions to ionospheric irregularities on Earth [11]. Thereafter, to evaluate the distributions of ionospheric scintillations at the global scale, all available IGS stations are used to create a distribution map. Section 3 shows the results, which include the distributions over time and space of scintillation activities for different areas of the world. From these results, the degrees of ionospheric disturbance in different regions are evaluated based on their irregularity coefficients.
2. Data and Method
There are two approaches to studying ionospheric irregularities. These methods use high-rate GNSS receivers to directly calculate the S4 index [8] and use dual-frequency measurements to compute the replacement indices for the S4 index, including ROTI and VTEC gradients [8]. Each method has its own advantages and disadvantages, depending on each specific case. In principle, the method of using dedicated receivers operating at very high sampling rates to directly estimate the S4 index is the most reliable. This is also the best method for studying ionospheric scintillations in small and moderate geographical areas and for instances where there is a financial constraint to the installation of scintillation receivers. However, in situations where there is a total absence of scintillation receivers or there is a need to study scintillations on a large scale, ROTI is the recommended solution. The main advantage of this method is the enormous number of standard dual-frequency GNSS receivers available at the global scale (with the number of satellites from different GNSS systems constantly increasing) compared to the limited number of scintillation receivers currently available. Therefore, within the framework of this study, with the aim of studying a large geographical area (Southeast Asia) and on a global scale, ROTI observations are selected for use. The huge amount of normal-rate GNSS data will provide invaluable information to observe ionospheric scintillations.
In this section, an algorithm is introduced and programmed to calculate ROTI from RINEX (receiver-independent exchange format) data. The rate of change of the ionospheric delay due to satellite signals received at a receiver is given from phase measurements as follows [27]:
where LGF(i) is the geometry-free phase combination at time i:
where Δt is the time difference between the epochs in minutes; f1, f2 are frequencies (Hz); L1, L2 are phase measurements in cycles; λ1, λ2 are the wavelengths in meters (λ1 = 0.19029 m, λ2 = 0.24421 m). The unit of measurement for ROT is TECU/min, which is used to trace ionospheric irregularities and to provide spatial variations in free electron density.
LGF (i) = L1 (i) × λ1 − L2 (i) × λ2
From the ROT value computed at each interval, the rate of the TEC index (ROTI) can be calculated. ROTI is defined as the standard deviation of the rate of the TEC over a certain time interval, which characterizes small-scale or rapid variations in TEC and is strongly related to scintillation [19]. The expression of ROTI is as follows:
where N is the number of epochs; is the average of ROT for the interval k:
When computing ROTI, the time interval over which a value is calculated must be taken into account. The choice of sample rate is critical for studies of small-scale irregularities, although for large-scale irregularities, the sampling rate is less important. In [27], the authors indicated the impact of different sampling rates and calculation time intervals on ROTI values. They found that ROTI values calculated using different parameter choices are strongly positively correlated, although ROTI values are quite different. The effect of a lower sample rate is to lower the ROTI value due to the loss of high-frequency parts of the ROT spectrum, while the effect of a longer calculation time interval is to remove or reduce short-lived peaks due to the inherent smoothing effects. In our study, ROTI is calculated for a time span of five minutes, as this gives a reasonably good temporal resolution while still having a good number of samples in each interval.
Usually, ROTI > 0.5 TECU/min (1 TECU refers to 1016 electrons/m2) indicates the presence of ionospheric irregularities at scale lengths of a few kilometers [28]. Considering the coexistence of large- and small-scale irregularities in equatorial irregularity structures during the early evening hours, Basu pointed out that ROTI measurements can be used to predict the presence of scintillations causing irregularities [19]. Several studies have also indicated that large- and small-scale irregularities at scale sizes of a few kilometers to several hundred meters can be investigated simultaneously with ROTI and scintillation indices [8,29,30]. The main advantage of ROTI over the standard scintillation index (S4) is that it is calculated based on measurements from normal dual-frequency GNSS receivers, for which there is a huge data set available with global coverage. The algorithm used to calculate ROTI is quite easily implemented and very straightforward. The main disadvantage is that this index does not contain information about the frequency of the irregularities, only those irregularities that exist within the range limited by the sample rate (five minutes) and measurement interval. Furthermore, the calculation of ROTI requires data from a dual-frequency receiver, whereas scintillation indices are calculated by using only a single frequency (commonly the frequency). Nevertheless, normal dual-frequency GNSS receivers are still far more common and much cheaper than scintillation receivers.
Another solution for detecting the appearance of ionospheric scintillations is to check whether there is a rapid fluctuation in the VTEC results due to the fact that GNSS signal scintillations are highly correlated with the rapid changes in TEC along the signal path. Based on the movement of GNSS satellites, VTEC spatial variations can be estimated [31]. To identify spatial gradients, Jiyun proposed a “time step method” [32]. By considering the distance between the ionospheric Pierce points (IPPs) in two successive epochs, the vertical ionospheric gradient (VTEC gradient) can be calculated. A number of different solutions have been used to compute the horizontal displacement of IPPs between two epochs. These include the method used for solving the inverse geodetic problem from the geodetic coordinates of IPPs and the method used for projecting these IPPs onto a plane via a map projection. In this study, a simple method for calculating IPP horizontal displacement is introduced as outlined below.
Assuming the Earth is flat (which is a sufficient assumption for satellites at a very high elevation) with an IPP altitude Hion = 506.7 km (the same as the height H used in the mapping function, see Figure 2), the projection of the IPP vector onto the ground plane is:
where A and z are the azimuth and zenith angles of the satellite at the epoch of observation.
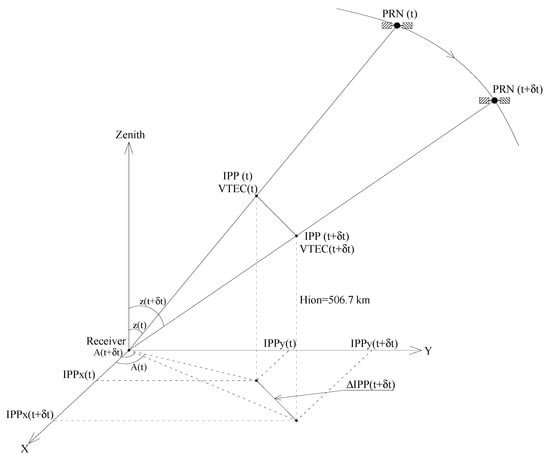
Figure 2.
Principle of determining VTEC gradient from the movement of satellites using the projection of IPP on horizontal plane. This is calculated from the displacement of the satellites after each epoch, meaning it describes both temporal and spatial gradients of VTEC.
At each epoch of observation there is one VTEC value, while the rectangular coordinates of IPP projected on the plane correspond to the respective satellite. When the satellite moves, the IPP and VTEC change respectively. From that, the IPP horizontal displacements after each epoch can be calculated as follows:
where δt is the interval of the observables (30 s for the daily standard data for IGS productions). Then, the VTEC gradient at the epoch (t + δt) is determined:
As the delays due to the different epochs are considered and divided by the corresponding separation, the estimated VTEC gradient in this case is a combination of both temporal and spatial gradients. The VTEC gradient, measured with the unit TECU/km, can be used to determine the spatial variations in VTEC, and from this information we are able to determine whether scintillation activities exist at the moments of observation.
From the above formulas and algorithms, a MATLAB software tool has been programmed to investigate the ionosphere using the RINEX data [5]. The purpose of this software is to compute certain parameters of the ionosphere, such as the VTEC, VTEC gradient, ROT, ROTI, and S4, and to then estimate the occurrence of scintillation activities. The input data for the program are the observation (*.obs) and navigation (*.nav) files. This program is available with daily data (interval 30 s) or high-rate data (1 Hz, 50 HZ, …). Figure 3 depicts the flowchart of the software tool. Its specific calculation sequence can be found in [8] and is briefly described as follows:
- Filter observations from the RINEX files: The observations are rearranged following the observed satellite and epoch, after which the data are collected according to the selected satellite and time;
- The coordinates of the selected satellite during the selected time from the navigation file are calculated;
- The user chooses whether or not to smooth the pseudo range and which observation will be used (P1, P2, or C1, C2);
- STEC is converted to VTEC and the VTEC gradient is calculated to check the possible rapid fluctuations in VTEC results;
- The IPP coordinates are computed and stored;
- The differences in pseudo-ranges derived from code and phase measurements are calculated and compared to detect the incidental cycle slip error in the phase measurements;
- ROT and ROTI are determined following Equations (1)–(4). For ROTI computation, the calculation time interval must be set up. In our research, this value is chosen as five minutes, as discussed before;
- All the results are stored in *.MAT files and can be used later for other purposes. Based on the variations in the VTEC gradient, S4, ROT, and ROTI values, the levels of scintillations can be estimated and the correlations between ionospheric scintillations and the changes in VTEC can be explored.
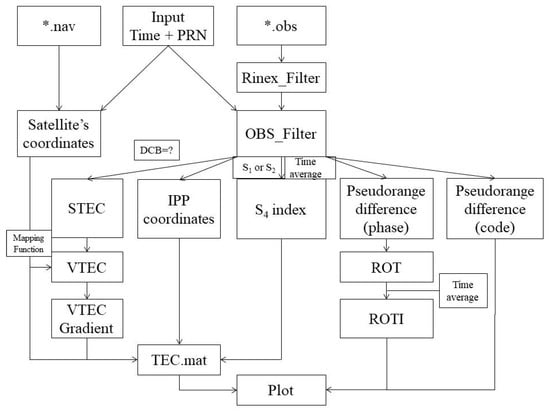
Figure 3.
Flowchart of the ionosphere software tool. The input data are the observation and navigation files of the RINEX data. The output results include certain ionospheric parameters with the aim of detecting disturbances in the ionosphere that affect the GNSS measurements.
In this study, the above program is used to calculate the ROTI to investigate ionospheric irregularities. A ROTI value greater than 0.5 TECU/min is considered a sign of disturbance in the ionosphere [28]. The data sampling rate is 30 s as the IGS standard for observations and the calculation time interval is five minutes in order to obtain a reasonably fine time resolution.
3. Results
3.1. Ionospheric Irregularity Observations Using ROT and ROTI Indices
3.1.1. Use of S4 Index to Validate the ROTI Results and Their Correlation
Figure 4 shows examples of ionospheric irregularities detected from ROT, ROTI, and S4 indices on 26 March 2015. Good similarity between the S4 index and ROT and ROTI indices can be seen in these figures. As usual, ionospheric irregularities mostly appear from 20–24 LT, following the results of previous studies [10,33,34,35,36,37]. On this day, the number of ionospheric irregularities (ROTI ≥ 0.5) detected is 799, corresponding to 5.52% of the total observations. Meanwhile, the number of scintillation events (S4 ≥ 0.3) is 407, corresponding to 4.26% of the total observations. Note that the total number of observations is different in each case, since in the calculation of ROTI, standard observations with a sampling rate of 30 s are used. Meanwhile, to determine the S4 index, we use high-rate data (50 Hz) with an interval of 0.02 s. The time span of the calculation for each method is also different, i.e., five minutes for ROTI and one minute for S4. This means 10 observations are used to derive ROTI and 3000 observations are used to derive S4. Nonetheless, the results obtained from Figure 4 still show some equivalences between S4 and ROTI, both in terms of the appearance time and intensity of ionospheric irregularities.
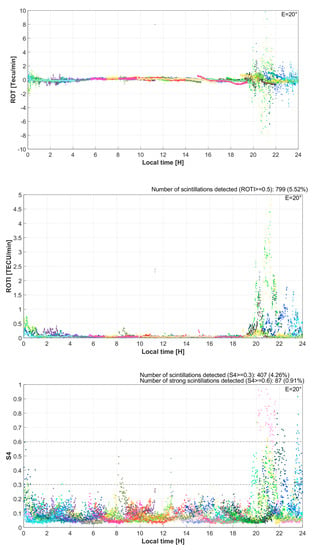
Figure 4.
ROT and ROTI indices (above) calculated from 30 s GNSS observations at Hue station (Vietnam) on 26 March 2015 clearly show ionospheric disturbances that occurred during the period of 20–24 LT. These irregularities are also validated by the S4 index (below), which is directly derived from 50 Hz data. These figures show high similarity between the S4 and ROTI results. In these figures, different colored dots correspond to different satellites, and the legend “E = 20°” in the upper right corner indicates the satellite elevation cut-off used.
From the results of S4 and ROTI calculations at Hanoi and Hue stations in Vietnam during the period of 15–28 March 2015, we can also derive the correlation coefficients between S4 and ROTI results (regarding the percentage of detection) at these two stations, which are 0.92 and 0.86, respectively. Figure 5 illustrates the good agreement between these two indices during the study period.
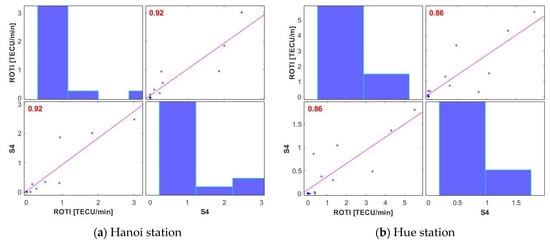
Figure 5.
Correlation coefficient (percentage of electronic disturbances compared to the total of the observations) between ROTI and S4 at Hanoi (a) and Hue (b) stations during the period of 15–28 March 2015. The similarity between these two indices at Hanoi station is 0.92, slightly higher than at Hue station with 0.86. Both of these indices demonstrate good conformity between ROTI and S4 indices.
3.1.2. Reasonable Choices of Satellite Elevation Threshold and Time Span of ROTI Calculation
Normally, measurements with low satellite elevation are often sensitive measurements that are susceptible to various sources of error, of which the most common source of error is multi-path error. The detection of plasma ionospheric irregularities is no exception. Therefore, to study the effects of the different satellite elevations used on the determination of ionospheric irregularities from GNSS measurements, we compare the numbers of ionospheric irregularities detected using different satellite elevation cut-off levels, including 0°, 10°, 20°, 30°, and 40°. In all of these examinations, the time span of the ROTI calculation is fixed to five minutes. The results are shown in Figure 6 and listed in Table 1.

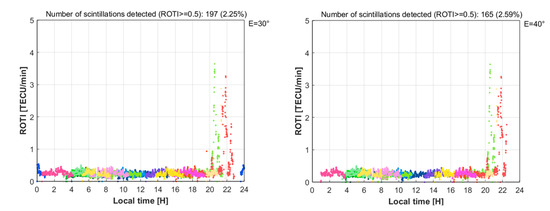
Figure 6.
Comparison of scintillation events with different elevation thresholds at Hanoi station (Vietnam) on 24 October 2015. It can be seen that the different threshold elevations give very different amounts of detectable irregularities, with the threshold elevation of 20° eliminating most of the multipath noise while keeping essentially the required number of observations.

Table 1.
Comparison of scintillation events with different elevation thresholds (time span calculation is five minutes).
From Figure 6, it can be seen that when using low satellite elevation (especially in the case of E = 0°), many disturbances are detected, which are scattered across different times of the day. Their causes are thought to originate from sources other than ionospheric scintillation errors. Here, E = 20° and E = 30° give almost the same numbers of ionospheric irregularities (199 and 197 detected, respectively). However, if we choose E = 30°, the number of total observations received is significantly reduced (this can be achieved using the percentage calculated in the last column of Table 1). Therefore, the proposed equilibrium option is E = 20°, which is also consistent with the conventional regulations when processing data in other GNSS applications.
Based on this result, the satellite elevation cut-off of 20° is used to investigate the effects of choosing different time spans for ROTI calculations on the numbers of ionospheric irregularities detected. The time intervals selected for the inspection are 1, 5, 10, 15, and 20 min. The results can be found in Figure 7 and Table 2.

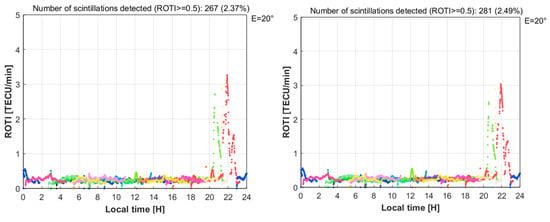
Figure 7.
Comparison of scintillation events with different time spans for ROTI calculations (top-left: 1 min; top-middle: 5 min; top-right: 10 min; bottom-middle: 15 min; bottom-right: 20 min). The greater the calculation time span, the more disturbances are detected, except for the 1 min calculation, which does not involve enough observations to capture such small-scale irregularities. The 5 min time span gives the highest reliability and is also consistent with the conventional ROTI calculations shown in published studies [18,27,38,39].

Table 2.
Comparison of scintillation events with the different time spans used for ROTI calculations (elevation cut-off is 20°).
It can be seen that when choosing a time span of five minutes, the number of ionospheric irregularities detected is minimal (199), and when the time span is larger, this number also increases accordingly. When selecting a time span equal to one minute, it can be seen from Figure 7 that there are quite a lot of ROTI values with large amplitudes (approximately 0.5 TECU/min) across the whole calculation period. This is because in each ROTI calculation, only two measurements are used, as the interval for GNSS observations is 0.5 min. Such measurements are not sufficient to ensure the detection of short-term fluctuations (if they exist) in the VTEC calculation results; therefore, the results obtained do not reflect the small-scale disturbances in the ionosphere. As discussed before, the time span for the ROTI calculation should be chosen to ensure a reasonable temporal resolution and a good number of observations for each interval calculation. Additionally, note that in most articles that use the ROTI index, the authors often use a time span of five minutes, as this refers to Pi [18]. Based on all of these factors, in our subsequent calculations related to the ROTI index, the selected time span calculation is fixed at five minutes, along with a commonly used satellite elevation threshold of 20°.
3.1.3. Ionospheric Disturbances in the Southeast Asia Region during the Second Half of March and October 2015
Figure 8 shows examples of the detection of ionospheric irregularities using the ROTI during a period of high solar activity, i.e., the last two weeks of October 2015, at two stations, Hue (Vietnam) and CUSV (Singapore). The numbers of ionospheric irregularities detected at the two stations equal 7394 and 8364, respectively. As usual, they are observed in the evening and rarely occur during the daytime. Note that the percentages shown in these figures are the percent rates of disturbed observations (with corresponding ROTI ≥ 0.5 TECU/min) out of all observations, with these values usually reaching a maximum of no more than 5% each day.

Figure 8.
ROTI observations during the period of 18–31 October 2015 at Hue (left) and CUSV (right) stations. It can be seen that ionospheric disturbances occurred densely during this period. These was also one of the periods when the Sun was most active during the last solar cycle and almost all GNSS stations in the Southeast Asia region were strongly affected.
Similar results to Figure 8 were also obtained at other IGS stations in the Southeast Asia area during this period [8], demonstrating the ionosphere in this area was strongly disturbed during the period of 18–31 October 2015. Table 3 and Table 4 provide the numbers of ionospheric irregularities detected during the two most turbulent periods of the solar cycle 24, i.e., October and March 2015. The indices used are the S4 index and ROTI, while thresholds used to to assess the ionosphere turbulences are 0.3 and 0.5 (TECU/min), respectively. To facilitate the evaluation of the irregularities in the ionosphere, these tables also provide the numbers of ionospheric scintillations detected from ROTI maps, which were established from all available IGS stations (indicated in the last column) in the Southeast Asia region.

Table 3.
Statistics for the S4 and ROTI indices and the ionospheric disturbances derived from the regional ROTI maps during the period of 18–31 October 2015.

Table 4.
Statistics for the S4 and ROTI indices and the ionospheric disturbances derived from the regional ROTI maps during the period of 15–28 March 2015.
From Table 3 and Table 4, we can see that the numbers of ionospheric disturbances detected in the periods of 15–28 March and 18–31 October are 18,349 and 37,178, respectively, with corresponding percentages of 12.5% and 29.2%. Comparing these numbers between the two periods, it can be seen that although the St. Patrick’s day storm that occurred in March 2015 is considered to be the strongest geomagnetic storm in SC24 (based on its ap index), the turbulence level of the ionosphere during this period was not equal to that in October of the same year. In the second half of March, the ionospheric disturbances were detected across only a few days, with these disorders occurring on almost all days during the last two weeks of October, with even greater intensity.
In Table 4, it can be seen that on 16, 19, and 24–28 of March, extremely strong ionospheric disturbances were observed at both Hanoi and Hue stations. Meanwhile, on the remaining days 17, 18, and 20–23, very few ionospheric disturbances were detected. Similar results were also recognized at BAKO, CUSV, NTUS, and XMIS stations in the research area. These results are in accordance with the total numbers of ionospheric irregularities obtained from ROTI maps. At all six stations during the nights of March 17 and 18, ionospheric disturbances hardly grew because of the development of an ionospheric disturbance dynamo and the enhancement of a westward electric field. These phenomena stimulated the ionospheric F-layer to move downward, meaning the ionospheric disturbances were prevented.
Figure 9 illustrates typical examples of ionospheric irregularities at certain stations over several days during the last two weeks of October 2015. In these plots, we also include VTEC gradients along with ROTI index values. While the ROTI unit is TECU/min, this is only capable of expressing fluctuations in ionospheric disturbances over time. The VTEC gradient, with its corresponding unit of TECU/km, can express both temporal and spatial irregularities in the ionosphere. Therefore, in Figure 9, a similarity can be seen in the occurrence times for ionospheric scintillations (i.e., 20–24 LT), although the intensity levels cannot be compared with each other because of the differences in the essence of the two indices—the ROTI shows the fluctuations in TEC per minute, while the VTEC gradient indicates TEC fluctuations per kilometer.
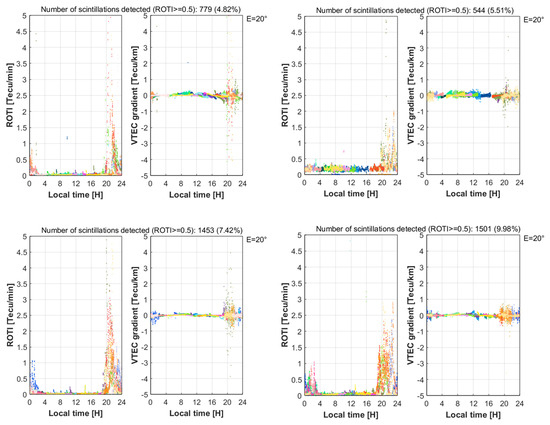
Figure 9.
Ionospheric irregularities including ROTI and VTEC gradient values at BAKO station on 19 October (top-left), HCM station on 20 October (top-right), CUSV station on 26 October (bottom-left), and at HUE station on 31 October (bottom-right). While the ROTI shows the temporal distribution of ionospheric disturbances, the VTEC gradient indicates both spatial and temporal distributions of plasma ionospheric irregularities.
3.2. Regional Ionospheric Irregularity Maps for Southeast Asia
Figure 10 shows ROTI maps over the Southeast Asia region over four days (19, 20, 26, and 31) in October 2015. The research area is in the range of 15°S–25°N latitude and 95°E–115°E longitude; thus, this area covers the whole EIA region. As can be seen in these maps, the geographic latitude areas from 0° to 5° do not have many observations due to the lack of stations in these areas. The purpose of creating this type of map is to find out the features of ionospheric irregularities, including locations, characteristics, and occurrence times. It can also show the exact number of observations (and the percentage of the total number of observations) affected by ionospheric scintillation errors.
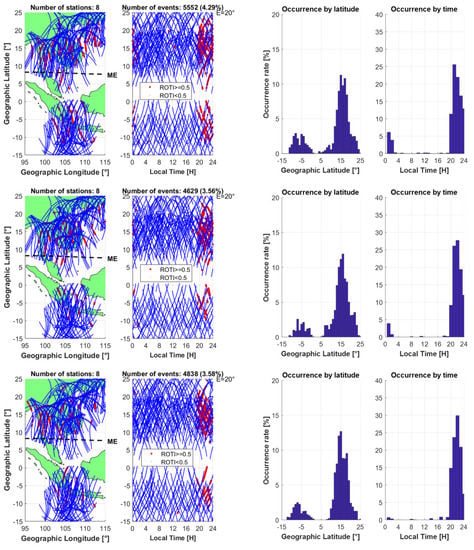
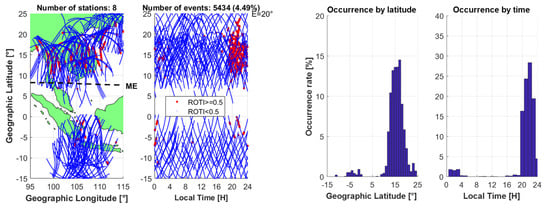
Figure 10.
Regional ROTI maps and the occurrence rates of ionospheric scintillations in Southeast Asia on 19, 20, 26, and 31 October in 2015, listed in order from top to bottom:. In these figures, plots on the left side are the regional ROTI maps, while plots on the right side show the percentages of the occurrence of ionospheric irregularities both in terms of latitude and time. ME stands for the magnetic equator. The dots in the ROTI maps represent satellite footprints tracking the intersections between the line of sight (LOS) from satellites to receivers and the singer layer model (SLM) of the ionosphere at an altitude of 450 km. The red dots indicate observations with ROTI of no less than 0.5 TECU/min, which is the sign of ionospheric disturbances, while the blue ones show the quiet status of the ionosphere (ROTI < 0.5 TECU/min). Data for these maps are the GNSS measurements from all available IGS stations in the research area (usually 8 stations). The total number of ionospheric irregularities detected and the percentage of all observed measurements are also given in the top of the ROTI maps and are listed in columns 10 and 11 of Table 3. Meanwhile, the plots of ionospheric scintillation occurrences on the right side show the appearance percentages in terms of latitude (resolution of 1°) and time (resolution of one hour), which are the percentages of all detected ionospheric irregularities, not of all observed measurements.
3.3. Global Ionospheric Irregularity Maps
Expanding on the previous section, a global ionospheric irregularity map was developed using data from all existing IGS stations to study ionospheric irregularities on a global scale. Currently, there are more than 500 IGS stations located worldwide [40], as can be seen in Figure 11. Normally, for the computation of ROT and ROTI indices with data from all of these stations in one day, the calculation time can last for a couple of days. As such, we tried to prepare this kind of map for a certain number of days. The chosen dates are those days when the ionosphere was thought to be strongly disturbed, i.e., 26 March and 19 October in 2015; 30 June, 8 September, and 31 December in 2017; and certain other days in 2013 and 2014.
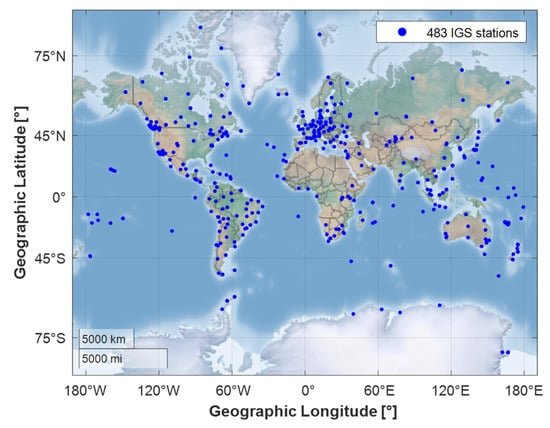
Figure 11.
The distribution diagram of all available IGS stations on 26 March 2015 showing the uneven distribution of IGS stations in different regions of the Earth. Here, most of the ocean areas have almost no stations.
The obtained results show that on quiet days, the established maps are rather tedious and the distribution rule of ionospheric irregularities is not as clear as expected. Among the results obtained, the most typical example of the distribution of ionospheric irregularities on a global scale is selected to be shown here; that is, the global ROTI map established on 26 March 2015. The total number of IGS stations used was 483. Figure 12 shows the satellite footprint tracking of all of these stations with the satellite elevation cut-off of 20°. Note that the number of detected irregularities depends on the number of observations or the number of stations. Therefore, the results in areas with a higher density of IGS stations (such as Europe and America) have higher reliability. In contrast, in the ocean or central African areas, the results may not completely reflect the reality due to the lack of monitoring samples.
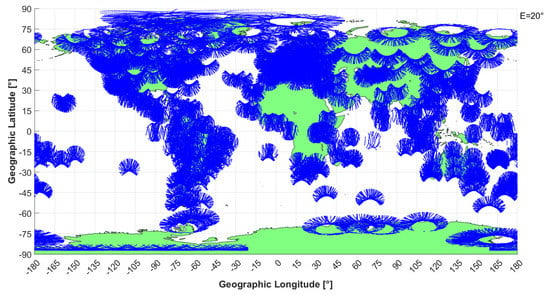
Figure 12.
The footprint tracking of satellites at all 483 IGS stations on 26 March 2015. As can be seen, the density of IGS stations is not uniform globally. In addition to the ocean regions without any GNSS stations, in some land areas, the number of IGS stations is also very sparse, particularly in Africa, the Russian Federation, Antarctica, and China. The density of IGS stations is highest in Western Europe, North America, and South America, and somewhat in the Pacific Islands, Australia, and East Asia.
Figure 13 and Figure 14 show the distributions of global ionospheric disturbances over space and time, respectively, on 26 March 2015, in which only ROTI values greater than 0.5 TECU/min are presented (sign of ionospheric irregularities). To exclude other noise sources, we only accept observations with satellite elevation angles (E) greater than 20°. The results show that on this day, about 2% of all observations were affected by scintillations. At first glance, the North Pole and South America are the two red areas with the most disturbances. In the ocean areas, the lack of monitoring stations means there is a basis for evaluation. To estimate the levels of disturbance at different latitudes, we divide the Earth into five latitude areas. The perturbation results can be found on the right side of Figure 13. Similarly, in Figure 14, in the equatorial region, we divide the detected ionospheric irregularities into two periods: daytime (from 02:00 to 19:00) and nighttime (from 19:00 to 02:00 the next day) in local time. The statistical result of 97% shows a very significant difference between these two time periods. A more detailed analysis of these results will be given in Section 4.
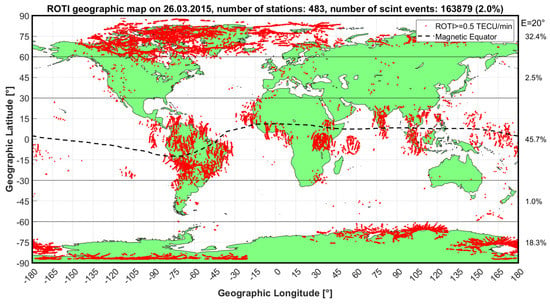
Figure 13.
Spatial distribution of global ionospheric irregularities (only ROTI ≥ 0.5 TECU/min are displayed). The total number of ionospheric irregularities detected (163,879) corresponds to approximately 2.0% of the total number of observations obtained on this day. The regions most likely to be affected by ionospheric disturbances are South America and the Arctic.
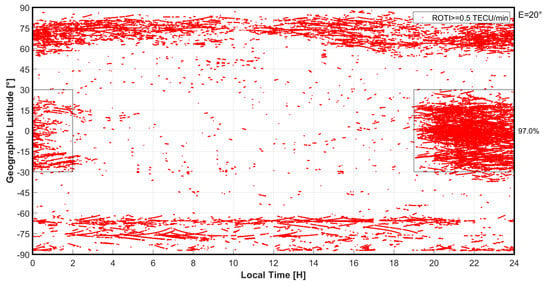
Figure 14.
Temporal distribution of global ionospheric irregularities, showing clear differentiation by latitudinal region. In the low-latitude regions, about 97.0% of ionospheric irregularities detected appear during the evening hours, i.e., from 19 LT to 2 LT the next day. The remaining 3.0% only occur scattered during different times of the day.
By showing Figure 15 and Figure 16, we can continue to analyze the distribution of ROTI values by location, including by latitude (Figure 15) and longitude (Figure 16). The occurrences rate (%) given is the percentage corresponding to the total ionospheric irregularities detected on 26 March, not the percentage of the total number of observations.
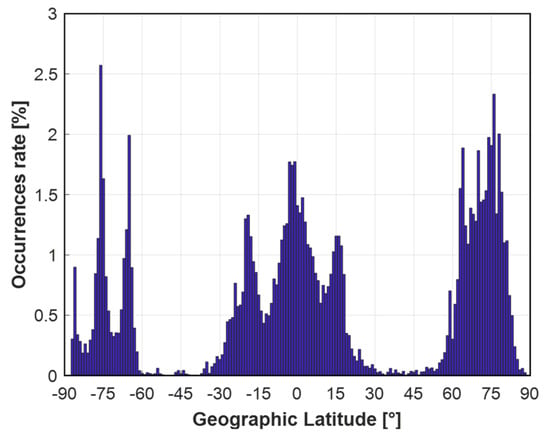
Figure 15.
Distribution of ROTI values by latitude (only ROTI ≥ 0.5 TECU/min are counted). It can be seen that ionospheric irregularities are mainly concentrated in the equatorial and high-latitude regions but rarely occur in the mid-latitude areas. In the low-latitude areas, ionospheric irregularities tend to appear symmetrically over the equator, while in the high-latitude regions in the Northern Hemisphere, a higher number of ionospheric irregularities can be seen compared to the Southern Hemisphere.
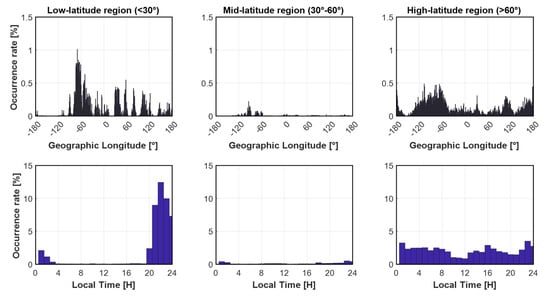
Figure 16.
Distribution of ROTI values by longitude (above) and by time (below) in three different zones of the Earth (only ROTI ≥ 0.5 TECU/min are counted). While the mid-latitude areas show almost no irregularities, as was predicted, the high-latitude areas are the regions where ionospheric irregularities can occur randomly at any longitude and at any time of the day. The appearance rule is most straightforward in the low-latitude regions, with the appearances occurring only at night and mostly concentrated at a longitude of 60°W (the South America region).
4. Discussion
In Section 3.2, the local ionospheric irregularity map of the Southeast Asia region provides both spatial and temporal distributions of ionospheric scintillations. From Table 3 and Figure 10, some noteworthy remarks about ionospheric irregularities in the Southeast Asia region can be made as follows.
During the period of 18–31 October 2015, ionospheric disturbances appeared quite frequently on days 19, 20, 24, 26, 28, and 31, with all reaching over 3% of the total observations. On the remaining days (except on day 22, with ionospheric disturbances being moderate at 2.3%), the ionosphere remained in a relatively quiet state, with the percentages of ionospheric irregularities being approximately or less than 1%. According to the results, October was also recorded as the period with the strongest intensity of ionospheric irregularities in 2015, even more than was observed during the March 2015 St. Patrick’s day geomagnetic storm.
Regarding the spatial distribution, the ionospheric irregularities were mostly concentrated in the areas near and around the two anomaly crests of EIA. Paying close attention, ionospheric irregularities often occurred continuously over a certain period with a specific satellite, meaning that at the same location not all observations for all satellites were affected by the ionospheric scintillation error. Ionospheric irregularities were found to occur more often in the Northern than Southern Hemisphere. This might be partly due to the fact that more stations were located in the Northern Hemisphere than in the Southern Hemisphere.
Regarding the temporal distribution, the ionospheric irregularities occurred mostly after the sunset, between 20:00 and 00:00 local time, during which the period of 21–22 LT alone accounted for about half of the total number of ionospheric scintillations detected.
As shown in Section 3.3, the total number of ionospheric irregularities detected was 163,879, corresponding to approximately 2.0% of the total number of observations obtained on this day. The regions most likely to be affected by the ionospheric disturbances were South America, Africa, Southeast Asia, and the Arctic. This is in agreement with the published research results on the global spatial distribution of ionospheric scintillation [41,42,43]. A comparison of the distribution of scintillation occurrences in different regions of the world can be found in [44]. In this section, for a comparison of occurrence density values of ionospheric irregularities at different latitudes of the Earth, the Earth is divided into five different latitudinal bands from the north to the south as follows: the northern high latitudes (latitudes > 60°N), northern mid-latitudes (latitudes between 30°N and 60°N), low latitudes or equatorial regions (latitudes between 30°S and 30°N), southern mid-latitudes (latitudes between 30°S and 60°S), and southern high latitudes (latitudes < 60°S). The occurrence density results are given on the right side in Figure 13. The results indicate that ionospheric irregularities mainly occur in the low latitude areas, accounting for nearly half (45.7%) of the total ionospheric irregularities detected, followed by the two pole areas, with the northern pole being superior to the southern pole (32.4% and 18.3%, respectively). As expected, the high latitude areas are the least likely to experience ionospheric disturbances. Only about 3.5% of the total number of ionospheric irregularities were detected in these areas, of which the northern high latitudes (with 2.5%) accounted for the majority.
From the global distribution map of ionospheric disturbances (Figure 13), it is clear that the equatorial region is the most susceptible to the effects of ionospheric irregularities. Here, the numbers of disturbances recorded in different longitude regions are also significantly different. To compare and evaluate the disturbance levels of each region, this area is divided into six corresponding longitude sectors, as shown in Figure 17 and Table 5: South America, from 100°W to 30°W; West Africa, from 30°W to 20°E, East Africa, from 20°E to 70°E; South Asia, from 70°E to 90°E; Southeast Asia, from 90°E to 130°E; the Pacific, from 130°E to 100°W. The latitude and longitude limits of these regions are given in columns 2 and 3 of Table 5. From these limits, we can calculate the percentages of the respective regions’ areas relative to the entire Earth (column 4).

Figure 17.
Percentages of ionospheric disturbance in different sectors of the equatorial region. South America accounts for the majority of disturbances at 22.6%, followed by West Africa at 8.2%. Southeast Asia and East Africa have roughly the same amounts of disturbances with 4.7% and 4.1%m respectively. The vast Pacific Ocean area accounts for only 3.8% of the total disturbances, while South Asia is the region that accounts for the least amount of irregularities (only 2.3%).

Table 5.
Comparison of the levels of ionospheric disturbances in different parts of the world.
The results of the perturbation count show that within the equatorial region, South America is the most vulnerable area (22.6% of total irregularities), followed by West Africa (8.2%), Southeast Asia (4.7%), East Africa (4.1%), the Pacific (3.8%), and South Asia (2.3%). The above results are expressed as percentages of the total global perturbation, not the total perturbation of the equatorial region alone, so their sum is exactly 45.7%, which corresponds to the perturbation rate of this region. However, the perturbation percentage above does not accurately reflect the degree of ionospheric disturbances in the regions because the areas of the evaluated regions are different. To do so, the irregularity coefficient for different regions is calculated according to Formula (8). The results are given in column 6 of Table 5. In this table, the irregularity coefficients of all ten sectors are given in order from highest to lowest.
Table 5 shows that the most affected region globally is South America, with an irregularity coefficient almost twice as high as the second most affected region, the Arctic, and about 58 times greater than the least affected area, the southern mid-latitudes. The irregularity coefficients in order from largest to smallest are as follows: South America, 3.49; the Arctic, 1.94; West Africa, 1.77; Southeast Asia, 1.27; South Asia, 1.24; the Antarctic, 1.10; East Africa, 0.89; the Pacific, 0.32; northern mid-latitudes, 0.15; southern mid-latitudes, 0.06. As expected, the mid-latitude areas both to the south and north have very low irregularity coefficients (less than 0.2%). This coefficient in the Pacific Ocean is also quite low, at only 0.32%, although this result is mainly due to the lack of IGS stations in the ocean areas. The two regions of Asia have quite similar irregularity coefficients (approximately 1.25), while West Africa shows much higher perturbation levels than East Africa (1.77 compared to 0.89, respectively). In general, regions in the Northern Hemisphere have significantly higher perturbations than regions in the Southern Hemisphere, of which the Arctic region alone accounts for nearly one-third of the total global disturbances.
5. Conclusions
Using ROTI observations to study ionospheric scintillations enables one to take advantage of a huge number of dual-frequency GNSS data on a global scale, for which there are currently about 500 IGS stations. For the first time, a global ionospheric irregularity map using ROTI calculated from a single day’s data from all existing IGS stations has been produced. From the global ROTI map on March 26 2015, the temporal and spatial distributions of ionospheric irregularities were concluded at certain main points as follows. The occurrence rule for ionospheric scintillations in low-latitude areas is very transparent, namely that they predominantly (about 97%) appear during the evening hours (this is easily noticeable in Figure 16 for the low-latitude areas). This is in contrast to the high-latitude areas, where ionospheric scintillations can occur at any time of the day, as can be seen in Figure 14 and Figure 16. For the mid-latitude regions, due to the very limited number of ionospheric irregularities detected, a rule for the temporal distribution could not be formed. For the spatial distribution, the Arctic region showed the highest percentage of disturbances, accounting for almost one-third of the total global disturbances. To compare the perturbation rates in different regions, we divided the Earth into ten sectors and calculated the corresponding irregularity coefficient for each region. The result showed that the region most affected by ionospheric disturbances was South America, with an irregularity coefficient about 58 times higher than the least affected region, the southern mid-latitudes.
Author Contributions
Conceptualization, all authors; methodology, C.T.N.; software, C.T.N.; validation, C.T.N., S.T.O. and N.T.L.; formal analysis, C.T.N.; investigation, C.T.N.; data curation, C.T.N. and N.T.L.; writing—original draft preparation, C.T.N.; writing—review and editing, all authors; supervision, H.S. and J.W. All authors have read and agreed to the published version of the manuscript.
Funding
This research was supported by the German-Taiwanese project DEAREST funded by DFG (reference number: SCHU 1103/15-1). The APC was funded by GFZ.
Informed Consent Statement
Informed consent was obtained from all subjects involved in the study.
Data Availability Statement
Data available in a publicly accessible repository.
Acknowledgments
The authors thank the International GNSS Service (IGS) for providing GNSS data. Besides, to validate the results, we partly used the high-rate GNSS data provided by the Vietnam Academic of Science and Technology (VAST). We also thank the reviewers and editors very much for taking their time to thoroughly review our article.
Conflicts of Interest
The authors declare no conflict of interest.
References
- Oluwadare, T.S.; Thai, C.N.; Akala, A.O.-O.; Heise, S.; Alizadeh, M.; Schuh, H. Characterization of GPS-TEC over African equatorial ionization anomaly (EIA) region during 2009–2016. Adv. Space Res. 2018, 63, 282–301. [Google Scholar] [CrossRef]
- Alizadeh, M.M.; Wijaya, D.; Hobiger, T.; Weber, R.; Schuh, H. Ionospheric effects on microwave signals. In Atmospheric Effects in Space Geodesy; Böhm, J., Schuh, H., Eds.; Springer: Berlin/Heidelberg, Germany, 2013; ISBN 978-3-642-36931-5. [Google Scholar]
- Klobuchar, J.A. Ionospheric Time-Delay algorithm for single-frequency 803 GPS users. IEEE Trans. Aerosp. Electron. Syst. 1987, 23, 325–331. [Google Scholar] [CrossRef]
- Aragon-Angel, A.; Zürn, M.; Rovira-Garcia, A. Galileo ionospheric correction algorithm: An optimization study of NeQuick-G. Radio Sci. 2019, 54, 1156–1169. [Google Scholar] [CrossRef]
- Yuan, Y.; Wang, N.; Li, Z.; Huo, X. The BeiDou Global Broadcast Ionospheric Delay Correction Model (BDGIM) and Its Preliminary Performance Evaluation Results. Navigation 2019, 66, 55–69. [Google Scholar] [CrossRef] [Green Version]
- Su, K.; Jin, S.; Hoque, M.M. Evaluation of Ionospheric Delay Effects on Multi-GNSS Positioning Performance. Remote Sens. 2019, 11, 171. [Google Scholar] [CrossRef] [Green Version]
- Aol, S.; Buchert, S.; Jurua, E. Ionospheric irregularities and scintillations: A direct comparison of in situ density observations with ground-based L-band receivers. Earth Planets Space 2020, 72, 1–15. [Google Scholar] [CrossRef]
- Nguyen, T.C. Use of the East Asia GPS Receiving Network to Observe Ionospheric VTEC Variations, Scintillation and EIA Features during the Solar Cycle 24. Ph.D. Thesis, Technische Universität Berlin, Berlin, Germany, 2021. [Google Scholar] [CrossRef]
- Aarons, J. Equatorial scintillations: A review. IEEE Trans. Antennas Propag. 1977, 25, 729–736. [Google Scholar] [CrossRef]
- Abadi, P.; Saito, S.; Srigutomo, W. Low-latitude scintillation occurrences around the equatorial anomaly crest over Indonesia. Ann. Geophys. 2014, 32, 7–17. [Google Scholar] [CrossRef] [Green Version]
- Polekh, N.; Zolotukhina, N.; Kurkin, V.; Zherebtsov, G.; Shi, J.; Wang, G.; Wang, Z. Dynamics of ionospheric disturbances during the 17–19 March 2015 geomagnetic storm over East Asia. Adv. Space Res. 2017, 60, 2464–2476. [Google Scholar] [CrossRef]
- Alfonsi, L.; Wernik, A.; Materassi, M.; Spogli, L. Modelling ionospheric scintillation under the crest of the equatorial anomaly. Adv. Space Res. 2017, 60, 1698–1707. [Google Scholar] [CrossRef]
- McCaffrey, A.M.; Jayachandran, P.T. Determination of the Refractive Contribution to GPS Phase “Scintillation”. J. Geophys. Res. Space Phys. 2019, 124, 1454–1469. [Google Scholar] [CrossRef]
- Bhattacharyya, A.; Beach, T.L.; Basu, S.; Kintner, P.M. Nighttime equatorial ionosphere: GPS scintillations and differential carrier phase fluctuations. Radio Sci. 2000, 35, 209–224. [Google Scholar] [CrossRef]
- Cervera, M.A.; Thomas, R.M. Latitudinal and temporal variation of equatorial ionospheric irregularities determined from GPS scintillation observations. Ann. Geophys. 2006, 24, 3329–3341. [Google Scholar] [CrossRef]
- Spogli, L.; Alfonsi, L.; De Franceschi, G.; Romano, V.; Aquino, M.H.O.; Dodson, A. Climatology of GPS ionospheric scintillations over high and mid-latitude European regions. Ann. Geophys. 2009, 27, 3429–3437. [Google Scholar] [CrossRef]
- Nguyen, V.K.; Rovira-Garcia, A.; Juan, J.M.; Sanz, J.; González-Casado, G.; La, T.V.; Ta, T.H. Measuring phase scintillation at different frequencies with conventional GNSS receivers operating at 1 Hz. J. Geod. 2019, 93, 1985–2001. [Google Scholar] [CrossRef] [Green Version]
- Pi, X.; Mannucci, A.J.; Lindqwister, U.J.; Ho, C.M. Monitoring of global ionospheric irregularities using the Worldwide GPS Network. Geophys. Res. Lett. 1997, 24, 2283–2286. [Google Scholar] [CrossRef]
- Basu, S.; Groves, K.; Quinn, J.; Doherty, P. A comparison of TEC fluctuations and scintillations at Ascension Island. J. Atmos. Sol. -Terr. Phys. 1999, 61, 1219–1226. [Google Scholar] [CrossRef]
- Beach, T.L.; Kintner, P.M. Simultaneous Global Positioning System observations of equatorial scintillations and total electron content fluctuations. J. Geophys. Res. Space Phys. 1999, 104, 22553–22565. [Google Scholar] [CrossRef]
- Yuan, Y.; Ou, J. Auto-covariance estimation of variable samples (ACEVS) and its application for monitoring random ionospheric disturbances using GPS. J. Geod. 2001, 75, 438–447. [Google Scholar] [CrossRef]
- SBAS Ionospheric Working Group. Effect of Ionospheric Scintillations on GNSS–A White Paper; Stanford University: Stanford, CA, USA, 2010; pp. 2–11. [Google Scholar]
- Stolle, C.; Manoj, C.; Lühr, H.; Maus, S.; Alken, P. Estimating the daytime Equatorial Ionization Anomaly strength from electric field proxies. J. Geophys. Res. Space Phys. 2008, 113. [Google Scholar] [CrossRef]
- Guo, K.; Veettil, S.V.; Weaver, B.J.; Aquino, M. Mitigating high latitude ionospheric scintillation effects on GNSS Precise Point Positioning exploiting 1-s scintillation indices. J. Geod. 2021, 95, 30. [Google Scholar] [CrossRef]
- Wu, C.-C.; Liou, K.; Lepping, R.P.; Hutting, L.; Plunkett, S.; Howard, R.A.; Socker, D. The first super geomagnetic storm of solar cycle 24: “The St. Patrick’s day event (17 March 2015)”. Earth Planets Space 2016, 68, 151. [Google Scholar] [CrossRef] [Green Version]
- Shinagawa, H.; Jin, H.; Miyoshi, Y.; Fujiwara, H.; Yokoyama, T.; Otsuka, Y. Daily and seasonal variations in the linear growth rate of the Rayleigh-Taylor instability in the ionosphere obtained with GAIA. Prog. Earth Planet. Sci. 2018, 5, 16. [Google Scholar] [CrossRef]
- Jacobsen, K.S. The impact of different sampling rates and calculation time intervals on ROTI values. J. Space Weather. Space Clim. 2014, 4, A33. [Google Scholar] [CrossRef] [Green Version]
- Ma, G.; Maruyama, T. A super bubble detected by dense GPS network at east Asian longitudes. Geophys. Res. Lett. 2006, 33. [Google Scholar] [CrossRef]
- Zou, Y.; Wang, D. A study of GPS ionospheric scintillations observed at Guilin. J. Atmos. Sol.-Terr. Phys. 2009, 71, 1948–1958. [Google Scholar] [CrossRef]
- Yang, Z.; Liu, Z. Correlation between ROTI and Ionospheric Scintillation Indices using Hong Kong low-latitude GPS data. GPS Solut. 2015, 20, 815–824. [Google Scholar] [CrossRef]
- Abhakara, P. Ionospheric Irregularities as Observed from the GPS Reference Station in Singapore; Master of Electrical Engineering Program, Cornell University: New York, NY, USA, 2004. [Google Scholar]
- Jiyun, L.; Pullen, S.; Datta-Barua, S.; Enge, P. Assessment of Nomial Ionosphere Spatial Decorrelation for LASS. In Proceedings of the IEEE/ION PLANS, San Diego, CA, USA, 25–27 April 2006; pp. 506–514. [Google Scholar]
- Anderson, D.N. Forecasting the occurrence of ionospheric scintillation activity in the equatorial ionosphere on a day-to-day basis. GPS Solut. 2003, 7, 200–202. [Google Scholar] [CrossRef]
- Beniguel, Y.; Hamel, P. A global ionosphere scintillation propagation model for equatorial regions. J. Space Weather. Space Clim. 2011, 1, A04. [Google Scholar] [CrossRef]
- Guo, K.; Aquino, M.; Veettil, S.V. Ionospheric scintillation intensity fading characteristics and GPS receiver tracking performance at low latitudes. GPS Solut. 2019, 23, 43. [Google Scholar] [CrossRef] [Green Version]
- Huang, L.; Wang, J.; Jiang, Y.; Chen, Z.; Zhao, K. A study of GPS ionospheric scintillations observed at Shenzhen. Adv. Space Res. 2014, 54, 2208–2217. [Google Scholar] [CrossRef]
- Le, H.M.; Tran, T.L.; Amory-Mazaudier, C.; Fleury, R.; Bourdillon, A.; Hu, J.; Vu, T.H.; Nguyen, C.T.; Le, T.T.; Nguyen, H.T. Continuous GPS network in Vietnam and results of study on the total electron content in the South East Asian region. Vietnam J. Earth Sci. 2016, 38, 153–165. [Google Scholar]
- Xiong, B.; Wan, W.-X.; Ning, B.-Q.; Yuan, H.; Li, G.-Z. A Comparison and Analysis of theS4Index, C/N and Roti over Sanya. Chin. J. Geophys. 2007, 50, 1414–1424. [Google Scholar] [CrossRef]
- Jacobsen, K.S.; Dähnn, M. Statistics of ionospheric disturbances and their correlation with GNSS positioning errors at high latitudes. J. Space Weather. Space Clim. 2014, 4, A27. [Google Scholar] [CrossRef] [Green Version]
- IGS—International GNSS Service. Available online: https://igs.org/network/#station-map-list (accessed on 1 October 2021).
- Basu, S.; MacKenzie, E.; Sa, B. Ionospheric constraints on VHF/UHF communications links during solar maximum and minimum periods. Radio Sci. 1988, 23, 363–378. [Google Scholar] [CrossRef]
- Basu, S.; Groves, K.; Sultan, P. Specification and forecasting of scintillations in communication/navigation links: Current status and future plans. J. Atmos. Sol.-Terr. Phys. 2002, 64, 1745–1754. [Google Scholar] [CrossRef]
- Kintner, P.M.; Humphreys, T.; Hinks, J. GNSS and Ionospheric Scintillation, How to Survive the Next Solar Maximum; Trade Magazine Article; Cornell University: Ithaca, NY, USA; University of Texas at Austin: Austin, TX, USA, 2009. [Google Scholar]
- Tsai, L.-C.; Su, S.-Y.; Liu, C.-H. Global morphology of ionospheric F-layer scintillations using FS3/COSMIC GPS radio occultation data. GPS Solut. 2016, 21, 1037–1048. [Google Scholar] [CrossRef]
Publisher’s Note: MDPI stays neutral with regard to jurisdictional claims in published maps and institutional affiliations. |
© 2021 by the authors. Licensee MDPI, Basel, Switzerland. This article is an open access article distributed under the terms and conditions of the Creative Commons Attribution (CC BY) license (https://creativecommons.org/licenses/by/4.0/).