Abstract
Sea-level monitoring is important for the safety of coastal cities and analysis of ocean and climate. Sea levels can be estimated based using the global navigation satellite system–interferometry reflectometry (GNSS–IR). The frequency in a signal-to-noise ratio (SNR) arc has been found to be related to the height between the GNSS antenna and reflecting surface, which is called reflector height (RH, ). The height variation of the reflecting surface causes an error, and this error is the most significant error in the GNSS–IR sea-level retrieval. The key to the correction of height variation error lies in the determination of the RH variation rate . The classical correction method determines based on tide analysis of a coarse RH series over a longer time period. Therefore, inherits errors in coarse RH series, which contains significant bias during a storm surge, and correcting this requires data accumulation. This study proposes a correction method of height variation error based on just one SNR arc based on wavelet analysis and least-square estimation. First, using wavelet analysis, instantaneous frequencies are extracted in one SNR arc; these frequencies are then converted to RH series. Second, using least-square estimation, and are conjointly solved based on the RH series from wavelet analysis. Data of GNSS site HKQT located in Hong Kong, China, during a period of time that includes Typhoon Hato were used. The root-mean-square errors (RMSEs) of retrievals were 21.5 cm for L1, 9.5 cm for L2P, 9.3 cm for L2C, and 7.6 cm for L5 of GPS; 16.8 cm for L1C, 14.1 cm for L1P, 12.6 cm for L2C, and 10.7 cm for L2P of GLONASS; 15.7 cm for L1, 11.2 cm for L5, 12.2 cm for L7, and 9.6 cm for L8 of Galileo. Results showed this method can correct the height variation error based on just one SNR arc, can avoid the inheritance of errors, and can be used during periods of storm surge.
1. Introduction
Continuous and accurate sea-level monitoring is important for the safety of coastal cities and the analysis of ocean and climate. Traditional monitoring technology based on tide gauges requires additional technology usually GNSS to relate the sea level to a certain frame [1]. Satellite altimetry technology cannot obtain offshore sea levels and has a low temporal resolution. With the development of the global navigation satellite system (GNSS), a technology called GNSS–interferometry reflectometry (GNSS–IR) has been used for sea-level monitoring [2,3]. This technology is based on offshore geodetic GNSS receivers and can complete environment monitoring according to the characteristics of signal-to-noise ratio (SNR) observations [2,3]. GNSS–IR technology can achieve automatic, low-cost, and continuous sea-level monitoring, and the monitoring results are automatically fixed under a stable frame [1,2,3].
The field of GNSS reflectometry has, since its inception by Martin-Neira, expanded to several subfields [4]. In 2000, Anderson demonstrated the potential for sea-level retrieval using a geodetic global position system (GPS) receiver [5]. The early development of GNSS–IR was really based on global position system (GPS). In 2013, Larson et al. proposed a theory and the classical GPS–IR method that can monitor the environment based on geodetic GPS receivers [2]. The classical GPS–IR retrieval method relates the overall multipath frequency in the SNR arc to the height between GNSS antenna and reflecting surface, which is called reflector height (RH, ) and then to sea level. At present, GPS, GLONASS, Galileo, and Beidou signals can be used to retrieve sea levels [6,7,8,9,10].
There are many error sources in GNSS–IR sea-level retrievals. The errors caused by sea surface height variation and the atmosphere have been cognized and corresponding correction methods have been presented, while other error sources such as orbit, signal, and receiver hardware have not been clearly cognized. The height variation error was introduced by Larson, and a corresponding correction based on two iterations was proposed [3]. The first iteration determines the RH variation rate based on coarse RH series. The second iteration removes the error value based on from coarse RH series. Subsequently, Löfgren et al. used empirical tidal coefficients to improve the correction method for height variation error [11]. In 2017, Larson et al. improved the correction using tide analysis, which does not require empirical tidal coefficients [12]. There are two main effects of the atmosphere on the propagation of radio waves: The changeable index of refraction with height causes the signal path to deviate from a straight line, and the speed of propagation is lower in the atmosphere than in vacuum. These effects would cause elevation of the bending error and tropospheric delay error [13]. Anderson first proposed that the signal bending caused by atmospheric refraction may cause a bias in sea-level retrievals [4]. Santamaría-Gómez and Watson et al. used a refraction correction formula to correct this bias in elevation [14]. Williams et al. used the VMF1 mapping function model and the GPT2w tropospheric delay model to correct the tropospheric delay error [15].
Height variation error was the most significant error of the errors noted above. The key to height variation error correction lies in the determination of the RH variation rate . The classical correction method determines based on tide analysis of a coarse RH series over a time period. Therefore, would inherit errors in coarse RH series and exhibit significant bias during a storm surge. This correction also requires a period of data accumulation. To correct these shortcomings of the classical correction method, we attempted to derive as much information as possible from one SNR arc and complete the correction based on the relevant information, instead of using tide analysis of a coarse RH sequence to correct the height variation error. We proposed a correction method of height variation error based on just one SNR arc based on wavelet analysis and least-square estimation. The wavelet analysis method can be used to extract instantaneous frequencies in one SNR arc [10,16,17] and then to estimate sea levels using related frequencies. Therefore, we used wavelet analysis to obtain RHs based on extracted instantaneous frequencies and then used least-square estimation to conjointly solve and from these RHs and correct the height variation error.
2. Theory
When there is only one multipath reflection, the path difference between the direct signal and the reflected signal is , where is the elevation angle. Therefore, the phase difference between them is [2,3,10]
where is the wavelength of the GNSS signal. The frequency information f is hidden in the phase difference,
where is the angular frequency. If the variation of in the corresponding time of the input data is ignored, that is, under the assumption that the reflecting surface is stationary for a certain period of time, Equation (2) can be written as
where is the RH converted from frequency under the static assumption, and it is subject to many errors. Equation (3) can be simplified as . Traditionally, the Lomb–Scargle periodogram (LSP) method is used to extract the frequency of the detrended SNR arc [18,19]. However, the sea level is constantly changing, so the irrationality of this assumption would lead to a height variation error [3,11,12]. In addition, during signal propagation, the atmosphere causes an elevation bending error and a tropospheric delay error [13,14,15].
2.1. Height Variation Error
When considering variations in sea levels, the parameter of RH variation rate is introduced. is rederived as follows [3]:
where is the RH under consideration of sea-level variation, and . By comparing Equations (3) and (4), the relationship between and can be obtained.
The term must be removed from , and the key to the correction effect is whether can be correctly determined. The classical method for determining is based on tide analysis for coarse RH series [3,11,12]. However, because of height variation error in the coarse RH series, this error would be inherited by derived from coarse RH series. Furthermore, under disaster conditions such as storm surges, the movement of sea level does not conform to the daily tidal periodicities, so this method cannot be used to determine .
2.2. Elevation Bending Error
After decades of development in the principles of atmospheric refraction, many refraction correction models have been proposed [20]. Considering the computational complexity and correction effect, we chose the Bennett model to correct the signal bending error in elevations [20]. Under standard meteorological parameters, with a temperature of 10 °C and a pressure of 1010 mb, the elevation correction (units of minutes) is
where . When considering changes in temperature and pressure, the elevation correction is
where is the temperature (°C), and is the pressure (mb). The corrected elevation is , where is the calculated elevation from the antenna and satellite.
2.3. Tropospheric Delay Error
Williams and Nievinski used the global temperature and pressure (GPT2w) model [21] and the VMF1 mapping model [22,23] to correct the tropospheric delay error [15]. The relative delay is
where
where is the zenith delay difference across the antenna and surface positions, and is the mapping function, which is indicated separately for the hydrostatic and wet components. The tropospheric delay bias caused by can be obtained from the derivation of Equation (3).
Based on Equation (10), the tropospheric delay error can be corrected from by subtracting .
3. Methods
3.1. Wavelet Analysis Retrieval
Wavelet analysis was first used to extract instantaneous frequencies in one SNR arc, and frequencies were converted to an RH series [24]. A detailed description of the wavelet analysis of the SNR data can be found in [10,16]. A wavelet spectrogram can be used to analyze the SNR arc with nonstationary power at different frequencies. The frequencies can be converted to RH based on the equation . Here, an example of a wavelet spectrogram of an SNR arc is presented (Figure 1).
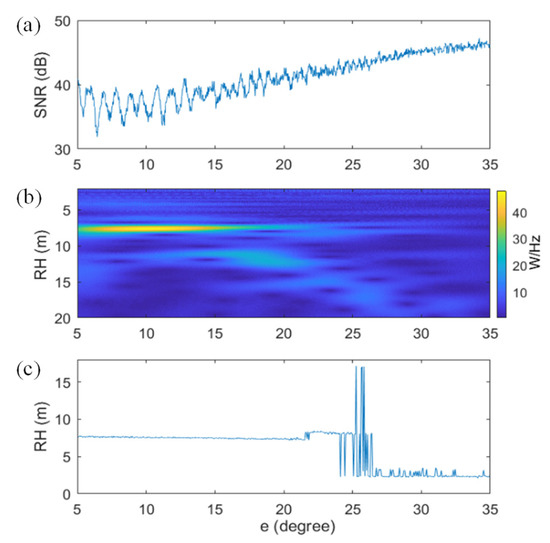
Figure 1.
Wavelet spectrogram and the peak RH series of GPS L2C from PRN 3 satellite on DOY 237, 2017: (a) the SNR arc of GPS L2C from PRN 3 satellite on DOY 237, 2017; (b) the corresponding wavelet spectrogram; (c) the corresponding peak RH series.
The wavelet spectrogram in Figure 1b shows that the energy is concentrated in the region where RH is between 7 and 8 m, and is between 5° and 23°. The RH with the most energy at each was selected to form the peak RH series, as shown in Figure 1c. In Figure 1c, the RH series is relatively smooth in the significant energy area, where is between 5° and 23°, while in the energy-insignificant area where exceeds 23°, the RH series jumps sharply. In this work, the peak RHs in the effective RH range were used, and the effective RH range was 3–10 m.
3.2. Least-Square Estimation
Using the wavelet analysis retrieval method described in Section 3.1, a peak RH series was obtained from one SNR arc. We then used the least-square estimation to correct errors and to avoid outliers in the peak RH series; the least-square estimation has been used in GNSS–IR previously [8,25,26]. In previous research, a sliding window was first used to separate LSP RHs in different windows, and then the least-square estimation was used to conjointly solve and [8,25,26]. In the present work, least-square estimation was used to conjointly solve and based on the peak RHs of one SNR arc. We improved the related equations to adapt to the requirements of this work.
The th RH of the peak RH series of th SNR arc of the th signal is indicated as , and corresponds to epochs , elevation angle , and tropospheric delay correction . For peak RHs of the th SNR arc, the following equation set can be obtained based on Equations (5) and (9):
where and are the estimated RH of th SNR arc of th signal and the corresponding height variation rate, respectively, and is the corresponding epoch. Equation (11) can be abbreviated in terms of the matrix
where , and . The least-square estimation can be used to solve Equation (12). Considering the error characteristics of RH retrievals, we used a special least-square estimation method—namely, the robust regression method, to solve it. More detailed information is provided in [8].
4. Experimental Analysis
4.1. Site and Data
Site HKQT is located on an island in Hong Kong, China (22.2910° N, 114.2132° E), and the site environment is shown in Figure 2. It is equipped with a TRIMBLE NETR5 receiver connected to a Trimble TRM59800.00 antenna. We used the recorded data with a sampling interval of 5 s at an elevation angle between 5° and 35° and azimuth between 0° and 105°. A co-located tide gauge recorded data with a 1 min sampling interval. Typhoon Hato landed in Hong Kong on 23 August, that is, day-of-year (DOY) 235, in 2017. To verify the effectiveness of this method during storm surges, we selected a period of time that includes Typhoon Hato, i.e., DOY 224–244, in 2017.
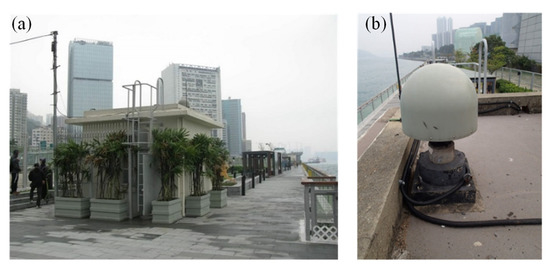
Figure 2.
(a) Photo of the building on top of which the GNSS receiver was erected and (b) photo of GNSS receiver.
The site can receive data from GPS, GLONASS, Galileo, and Beidou, but in the selected time period and at the selected elevations and azimuths, there were few Beidou data. Therefore, we used GPS, GLONASS, and Galileo data for the retrieval. The header section of observation types in the observation file of HKQT is shown in Figure 3. The corresponding descriptions of the received SNR types are shown in Table 1. As shown in Figure 3 and Table 1, the SNR types received by HKQT were S1C for L1, S2W for L2P, S2X for L2C, and S5X for L5 for GPS; S1C of G1C, S1P of G1P, S2C of G2C, and S2P of G2P for GLONASS; S1X of E1, S5X of E5, S7X of E7, and S8X of E8 for Galileo.

Figure 3.
Header section of observation types in the observation file of HKQT. In the first column, “G, R, E” represent GPS, GLONASS, and Galileo. The second column represents the number of the observation type of the corresponding constellation. The code in the remaining columns represents the observation types of the corresponding constellation. Codes beginning with “C” represent the pseudorange observation; codes beginning with “D” represent Doppler observations; codes beginning with “L” represent the phase observation; codes beginning with “S” represent SNR observations.

Table 1.
System, frequency band, frequency, phase code, and SNR code of each signal for HKQT [27].
4.2. Retrieval Results
Based on the above theory and method, the RHs were retrieved from the SNRs of GPS, GLONASS, and Galileo. As mentioned in Section 2, the constant for transforming RH to sea level can be determined through the frame transformation parameters. Based on the frame transformation parameters and site height given in (http://www.ioc-sealevelmonitoring.org/, 10 June 2021), the constant used to convert RH to sea level was 7.797 m. However, inter-frequency biases were found in RHs of different signals [13,28]. Therefore, owing to the inter-frequency bias, the constants of different GNSS signals were estimated based on the average differences between the RH retrievals and the measured sea-level records. These constants, used to retrieve sea levels, are shown in Table 2, and the retrieval results for the different signals are shown in Figure 4. The inter-frequency biases can be deduced from constants, as shown in Figure 4. In order to better show the retrieval performance of different signals, the root-mean-square errors (RMSEs) and the correlation coefficients (CORRs) between sea-level retrievals and sea-level measurements, and the number of retrieval points are summarized in Table 2.

Table 2.
Numbers of RH retrievals, constant, inter-frequency bias, RMSE, and CORR between sea-level retrievals and sea-level measurement for each signal.
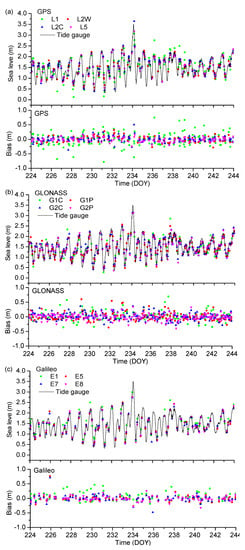
Figure 4.
Sea level retrievals and sea-level measurements and biases between them for (a) GPS; (b) GLONASS; (c) Galileo.
Sea level retrievals of each signal exhibited a good correspondence with the measured sea levels (Figure 4). The accuracy of L5 was higher than L2C and L2P follows, and L1 was lowest for GPS (Table 2). The lowest accuracy of GLONASS was G1C, G1P, and G2C follows, and G2P was the best. The lower accuracies of Galileo were E1 and E7, and better accuracies were apparent for E5 and E8. Lower frequencies always corresponded to SNR types with better accuracy (Table 1 and Table 2). The antenna gain pattern and the effect of random surface roughness were both frequency dependent [29,30], and these may have caused this correspondence. The channel access method, the code chipping rate, encryption, and the receiver manufacturer/model may also have affected the quality of SNR oscillation [12,26].
In addition to the RMSE differences of different signals, there were also inter-frequency biases between retrievals of different signals (Table 2). These systematic biases appeared to have a linear relationship with frequency/wavelength. Strandberg suggested that such an inter-frequency bias might be caused by electromagnetic bias, combined interaction of the Fresnel reflection coefficients, and the antenna pattern and shift of power between the two circular polarizations [13].
4.3. Error Analysis
To recognize the characteristics of errors in GNSS–IR sea-level retrieval, the retrievals with and without correction of height variation error, bending error, and tropospheric delay error are analyzed in this section.
- A.
- Analysis of height variation error
The bending error and tropospheric delay error were corrected, and the retrievals with and without correction of the height variation error are shown in Figure 5. The retrievals in Figure 5a were corrected with height variation error based on Equation (11), and the retrievals in Figure 5c were calculated without considering the height variation error, that is, based on the following equation transformed from Equation (11) by ignoring the term of height variation error.
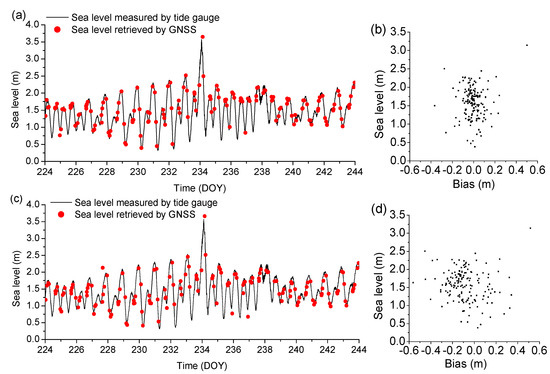
Figure 5.
GPS L2C retrievals with and without correction of height variation error: (a) retrieved sea levels with correction of height variation error and measured sea-level series; (b) bias of retrievals in (a) versus sea-level measurement; (c) retrieved sea levels without correction of height variation error and measured sea-level series; (d) bias of retrievals in (c) versus sea-level measurement.
The solution strategy of Equation (13) is the same as that in Equation (11).
For retrievals with correction of height variation error in Figure 5a, the RMSE was 9.3 cm, and CORR was 97.81%. For retrievals without correction of height variation error in Figure 5c, the RMSE was 18.7 cm, and CORR was 92.66%. The biases in Figure 5b are more concentrated near 0 m than the biases in Figure 5d. The results demonstrated that the height variation error was an error with a large impact on GNSS–IR sea-level retrieval, and it affected the uncertainty of the retrievals, attaining error levels of centimeters to decimeters with different sea states.
- B.
- Analysis of bending error and tropospheric delay error
Figure 6 shows one SNR arc with the change in bending corrected and uncorrected elevations, and the corresponding wavelet spectrogram and peak RH series. The magnitude of the gross errors in Figure 6e is larger than that of Figure 6f. There was a difference of approximately 3 cm between the RHs with and without elevation bending correction (Figure 6g,f). To better show the effect of elevation bending correction, the peak RHs from wavelet spectrograms with and without elevation bending correction were used to estimate sea level, and the sea-level estimations (Figure 7). The points of gross errors of sea-level retrievals with elevation bending correction were significantly less than those of retrievals without elevation bending correction (Figure 7). This indicates that after the bending correction, the multipath frequencies were more apparent, leading to fewer gross errors.
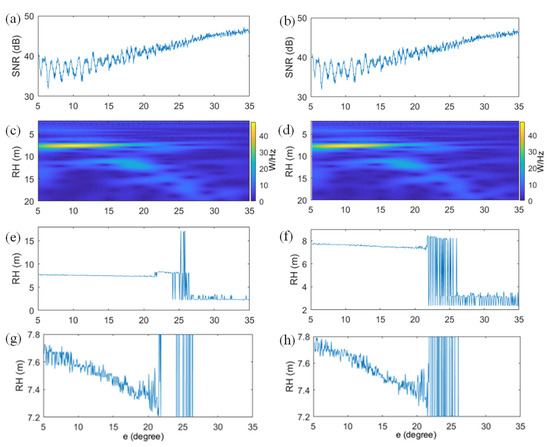
Figure 6.
SNR arc, the corresponding wavelet spectrogram, and the corresponding peak RH series with and without elevation bending correction: (a) the SNR arc with bending uncorrected elevation of GPS L2C from PRN 3 satellite on DOY 237, 2017; (b) the SNR arc with bending corrected elevation of GPS L2C from PRN 3 satellite on DOY 237, 2017; (c) the wavelet spectrogram of SNR arc in (a); (d) the wavelet spectrogram of SNR arc in (b); (e) the peak RH series of (c); (f) the peak RH series of (d); (g) the peak RH series of (c) with RH in range of 7.2 m to 7.8 m; (h) the peak RH series of (d) with RH in range of 7.2 m to 7.8 m.
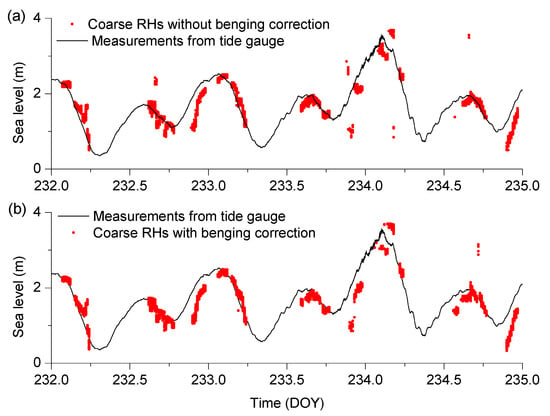
Figure 7.
Sea levels estimated from peak RHs from wavelet spectrograms with and without elevation bending correction between DOY 232 and 235, 2017: (a) sea levels estimated from peak RHs from wavelet spectrograms without elevation bending correction; (b) sea levels estimated from peak RHs from wavelet spectrograms with elevation bending correction.
Elevation bending error and tropospheric delay error can cause scale bias and average bias in GNSS–IR retrievals [12,13,15]. To show these characteristics of biases and the effect of corresponding correction methods, this study applied four strategies to retrieve: (i) without correction of bending error and tropospheric delay error; (ii) with correction of bending error and without correction of tropospheric delay error; (iii) without correction of bending error and correction of tropospheric delay error; (iv) correction of bending error and tropospheric delay error. The left images of Figure 8 show an example of the retrievals calculated in these four strategies. The right images of Figure 8 are the Van de Casteele diagrams [31] of retrievals in corresponding left images. The Van de Casteele diagram is an efficient approach to describe the variation of bias with sea level.
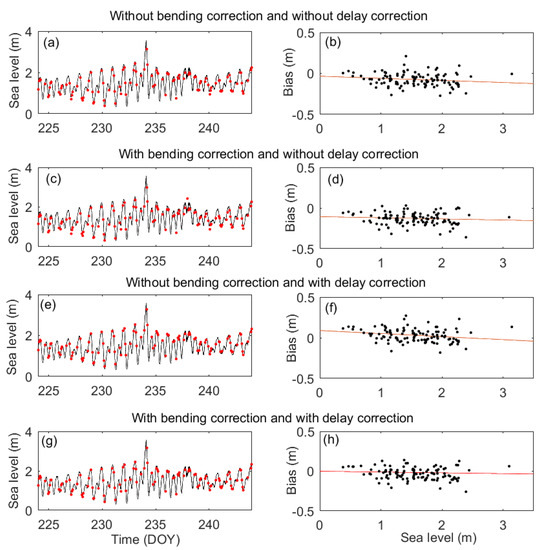
Figure 8.
GPS L5 sea-level retrievals with and without bending correction or tropospheric delay correction, and the corresponding biases vs. sea-level measurements for HKQT: (a) sea-level retrievals without bending correction and tropospheric delay correction; (b) biases of retrievals in (a) versus sea-level measurements; (c) sea-level retrievals with bending correction and without tropospheric delay correction; (d) biases of retrievals in (c) versus sea-level measurements; (e) sea-level retrievals without bending correction and with tropospheric delay correction; (f) biases of retrievals in (e) versus sea-level measurements; (g) sea-level retrievals with bending correction and tropospheric delay correction; (h) biases of retrievals in (g) versus sea-level measurements.
In Figure 8b, the retrievals without bending error correction and tropospheric delay error have scale bias and slight average bias. Figure 8d,f show that, with only one correction of the bending error or the tropospheric delay error, retrievals exhibited significant scale or average biases. Figure 8h shows that after the correction of both the bending error and tropospheric delay error, the retrievals exhibited no obvious scale or average biases.
5. Conclusions
This study proposed a correction method of height variation error based on one SNR arc for GNSS–IR sea-level retrieval. In contrast to the classical method that has to obtain SNR observations for a long time for tide analysis and then corrects the height variation error, this method can correct the height variation error based on just one SNR arc. In addition, the classical height variation correction method determines based on the tide analysis of a coarse RH series. Therefore, would inherit errors in the coarse RH series and exhibit a large bias during a storm surge. This method can conjointly solve and for RH retrievals from wavelet analysis and, thus, can avoid the inheritance of errors and can be used during a storm surge. This study also analyzed the characteristics of height variation error, elevation bending error, tropospheric delay error, and the effects of related correction methods. The results demonstrated that the height variation error is an error with a large impact on GNSS–IR sea-level retrieval, and this will affect the uncertainty of the retrievals; the bending error and tropospheric delay error would cause scale bias or average bias, and the corresponding corrections can eliminate or weaken these biases.
The SNR data of HKQT during the same time period has previously been used to retrieve sea levels [32]. Peng et al. used the classical method to retrieve sea levels based on data of GPS L1, L2C, and L5 signals with corrections of the bending error and the height variation correction. The RMSEs of the retrieval results were 18.4 cm for L1, 15.6 cm for L2C, and 12.6 cm for L5, respectively. The accuracy of L1 in this study was lower, while the accuracies of L2C and L5 were higher. As SNR quality affects the effect of wavelet analysis [10,16], better SNR quality would generally result in better performance of the wavelet analysis retrieval.
Author Contributions
X.W. and X.H. provided the initial idea for this study; Z.N. and S.C. collected related data; X.W. analyzed the experimental results and wrote the paper. All authors have read and agreed to the published version of the manuscript.
Funding
This work is supported by the National Nature Science Foundation of China (41804005), the Natural Science Foundation of Jiangsu Province (BK20190496), and Fundamental Research Funds for the Central Universities (B200202015). Thanks to Editage (www.editage.cn, 30 October 2021) for English language editing.
Institutional Review Board Statement
Not applicable.
Informed Consent Statement
Not applicable.
Data Availability Statement
The Survey and Mapping Office of Hong Kong Lands Department provides GNSS data (http://www.geodetic.gov.hk/sc/gi/gsi_index.htm, 18 October 2021), and the University of Hawaii Sea-Level Center and the Intergovernmental Oceanographic Commission provides tide gauge records (http://www.ioc-sealevelmonitoring.org/, 18 October 2021).
Conflicts of Interest
The authors declare no conflict of interest.
References
- Schöne, T.; Schön, N.; Thaller, D. IGS tide gauge benchmark monitoring pilot project (TIGA): Scientific benefits. J. Geod. 2009, 83, 249–261. [Google Scholar] [CrossRef]
- Larson, K.M.; Löfgren, J.S.; Haas, R. Coastal sea level measurements using a single geodetic GPS receiver. Adv. Space Res. 2013, 51, 1301–1310. [Google Scholar] [CrossRef] [Green Version]
- Larson, K.M.; Ray, R.D.; Nievinski, F.G.; Freymueller, J.T. The accidental tide gauge: A GPS reflection case study from Kachemak Bay, Alaska. IEEE Geosci. Remote Sens. Lett. 2013, 10, 1200–1204. [Google Scholar] [CrossRef] [Green Version]
- Martin-Neira, M.A. Passive Reflectometry and Interferometry System (PARIS): Application to Ocean Altimetry. ESA J. 1993, 17, 331–355. [Google Scholar]
- Anderson, K.D. Determination of water level and tides using interferometric observations of GPS signals. J. Atmos Ocean. Technol. 2000, 17, 1118–1127. [Google Scholar] [CrossRef]
- Löfgren, J.S.; Haas, R. Sea level measurements using multi-frequency GPS and GLONASS observations. EURASIP J. Adv. Signal Proc. 2014, 2015, 50. [Google Scholar] [CrossRef] [Green Version]
- Jin, S.G.; Qian, X.D.; Wu, X. Sea level change from BeiDou Navigation Satellite System-Reflectometry (BDS-R): First results and evaluation. Glob. Planet. Chang. 2017, 149, 20–25. [Google Scholar] [CrossRef]
- Wang, X.; He, X.; Zhang, Q. Evaluation and combination of quad-constellation multi-GNSS multipath reflectometry applied to sea level retrieval. Remote Sens. Environ. 2019, 231, 111229–111249. [Google Scholar] [CrossRef]
- Strandberg, J.; Hobiger, T.; Haas, R. Improving GNSS-R sea level determination through inverse modeling of SNR data. Rad. Sci. 2016, 51, 1286–1296. [Google Scholar] [CrossRef] [Green Version]
- Wang, X.; He, X.; Zhang, Q. Coherent superposition of multi-GNSS wavelet analysis periodogram for sea-level retrieval in GNSS multipath reflectometry. Adv. Space Res. 2020, 65, 1781–1788. [Google Scholar] [CrossRef]
- Löfgren, J.S.; Haas, R.; Scherneck, H.G. Sea level time series and ocean tide analysis from multipath signals at five GPS sites in different parts of the world. J. Geodyn. 2014, 80, 66–80. [Google Scholar] [CrossRef] [Green Version]
- Larson, K.M.; Ray, R.D.; Williams, S. A ten-year comparison of water levels measured with a geodetic GPS receiver versus a conventional tide gauge. J. Atmos Ocean. Technol. 2017, 34, 295–307. [Google Scholar] [CrossRef] [Green Version]
- Strandberg, J. New Methods and Applications for Interferometric GNSS Reflectometry; Chalmers University of Technology: Gothenburg, Sweden, 2020. [Google Scholar]
- Santamaría-Gómez, A.; Watson, C. Remote leveling of tide gauges using GNSS reflectometry: Case study at Spring Bay, Australia. GPS Solut. 2016, 21, 451–459. [Google Scholar] [CrossRef]
- Williams, S.D.P.; Nievinski, F.G. Tropospheric delays in ground-based GNSS multipath reflectometry—Experimental evidence from coastal sites. J. Geophys. Res. Solid Earth 2017, 122. [Google Scholar] [CrossRef] [Green Version]
- Wang, X.; Zhang, Q.; Zhang, S. Sea level estimation from SNR data of geodetic receivers using wavelet analysis. GPS Solut. 2019, 23, 1–14. [Google Scholar] [CrossRef]
- Wang, X.; Zhang, Q.; Zhang, S. Azimuth selection for sea level measurements using geodetic GPS receivers. Adv. Space Res. 2018, 61, 1546–1557. [Google Scholar] [CrossRef]
- Lomb, N.R. Least-squares frequency analysis of unequally spaced data. Astrophys. Space Sci. 1976, 39, 447–462. [Google Scholar] [CrossRef]
- Scargle, J.D. Studies in astronomical time series analysis. II. Statistical aspects of spectral analysis of unevenly spaced data. Astrophys. J. 1982, 302, 757–763. [Google Scholar] [CrossRef]
- Bennett, G.G. The calculation of astronomical refraction in marine navigation. J. Navig. 1982, 35, 255–259. [Google Scholar] [CrossRef]
- Böhm, J.; Möller, G.; Schindelegger, M.; Pain, G.; Weber, R. Development of an improved empirical model for slant delays in the troposphere (GPT2w). GPS Solut. 2015, 19, 433–441. [Google Scholar] [CrossRef] [Green Version]
- Boehm, J.; Schuh, H. Vienna mapping functions in VLBI analyses. Geophys. Res. Lett. 2004, 31, 603–608. [Google Scholar] [CrossRef]
- Boehm, J.; Werl, B.; Schuh, H. Troposphere mapping functions for GPS and very long baseline interferometry from European Centre for Medium-Range Weather Forecasts operational analysis data. J. Geophys. Res. Solid Earth 2006, 111, 406–415. [Google Scholar] [CrossRef]
- Abry, P. Ondelettes et turbulence. In Multirésolutions, Algorithmes de Décomposition, Invariance d’Échelles; Diderot Editeur: Paris, France, 1997. [Google Scholar]
- Roussel, N.; Ramillien, G.; Frappart, F.; Darrozes, J.; Gay, A.; Biancale, R.; Striebig, N.; Hanquiez, V.; Bertin, X.; Allain, D. Sea level monitoring and sea state estimate using a single geodetic receiver. Remote Sens. Environ. 2015, 171, 261–277. [Google Scholar] [CrossRef]
- Tabibi, S.; Geremia-Nievinski, F.; Dam, T.V. Statistical Comparison and Combination of GPS, GLONASS, and Multi-GNSS Multipath Reflectometry Applied to Snow Depth Retrieval. IEEE Trans. Geosci. Remote Sens. 2017, 1–13. [Google Scholar] [CrossRef]
- Werner, G.; Lou, E. RINEX (The Receiver Independent Exchange Format), Version 3.01. 2009. Available online: ftp://igs.org/pub/data/format/rinex301.pdf (accessed on 20 June 2019).
- Wang, X.; He, X.; Xiao, R.; Song, M.; Jia, D. Millimeter to centimeter scale precision water-level monitoring using GNSS reflectometry: Application to the South-to-North Water Diversion Project, China. Remote Sens. Environ. 2021, 265, 112645. [Google Scholar] [CrossRef]
- Jonscher, A.K. A new understanding of the dielectric relaxation of solids. J. Mater. Sci. 1981, 16, 2037–2060. [Google Scholar] [CrossRef]
- Nievinski, F.G.; Larson, K.M. Inverse Modeling of GPS Multipath for Snow Depth Estimation—Part II: Application and Validation. IEEE Trans. Geosci. Remote Sens. 2014, 52, 6564–6573. [Google Scholar] [CrossRef]
- Martin Miguez, B.; Testut, L.; Wo¨ppelmann, G. The Van de Casteele test revisited: An efficient approach to tide gauge error characterization. J. Atmos. Ocean. Technol. 2008, 25, 1238–1244. [Google Scholar] [CrossRef]
- Peng, D.; Hill, E.M.; Li, L.; Switzer, A.D.; Larson, K.M. Application of GNSS interferometric reflectometry for detecting storm surges. GPS Solut. 2019, 23, 1–11. [Google Scholar] [CrossRef] [Green Version]
Publisher’s Note: MDPI stays neutral with regard to jurisdictional claims in published maps and institutional affiliations. |
© 2021 by the authors. Licensee MDPI, Basel, Switzerland. This article is an open access article distributed under the terms and conditions of the Creative Commons Attribution (CC BY) license (https://creativecommons.org/licenses/by/4.0/).