
Meta-Analysis in Using Satellite Precipitation Products for Drought Monitoring: Lessons Learnt and Way Forward


Abstract
:
1. Introduction
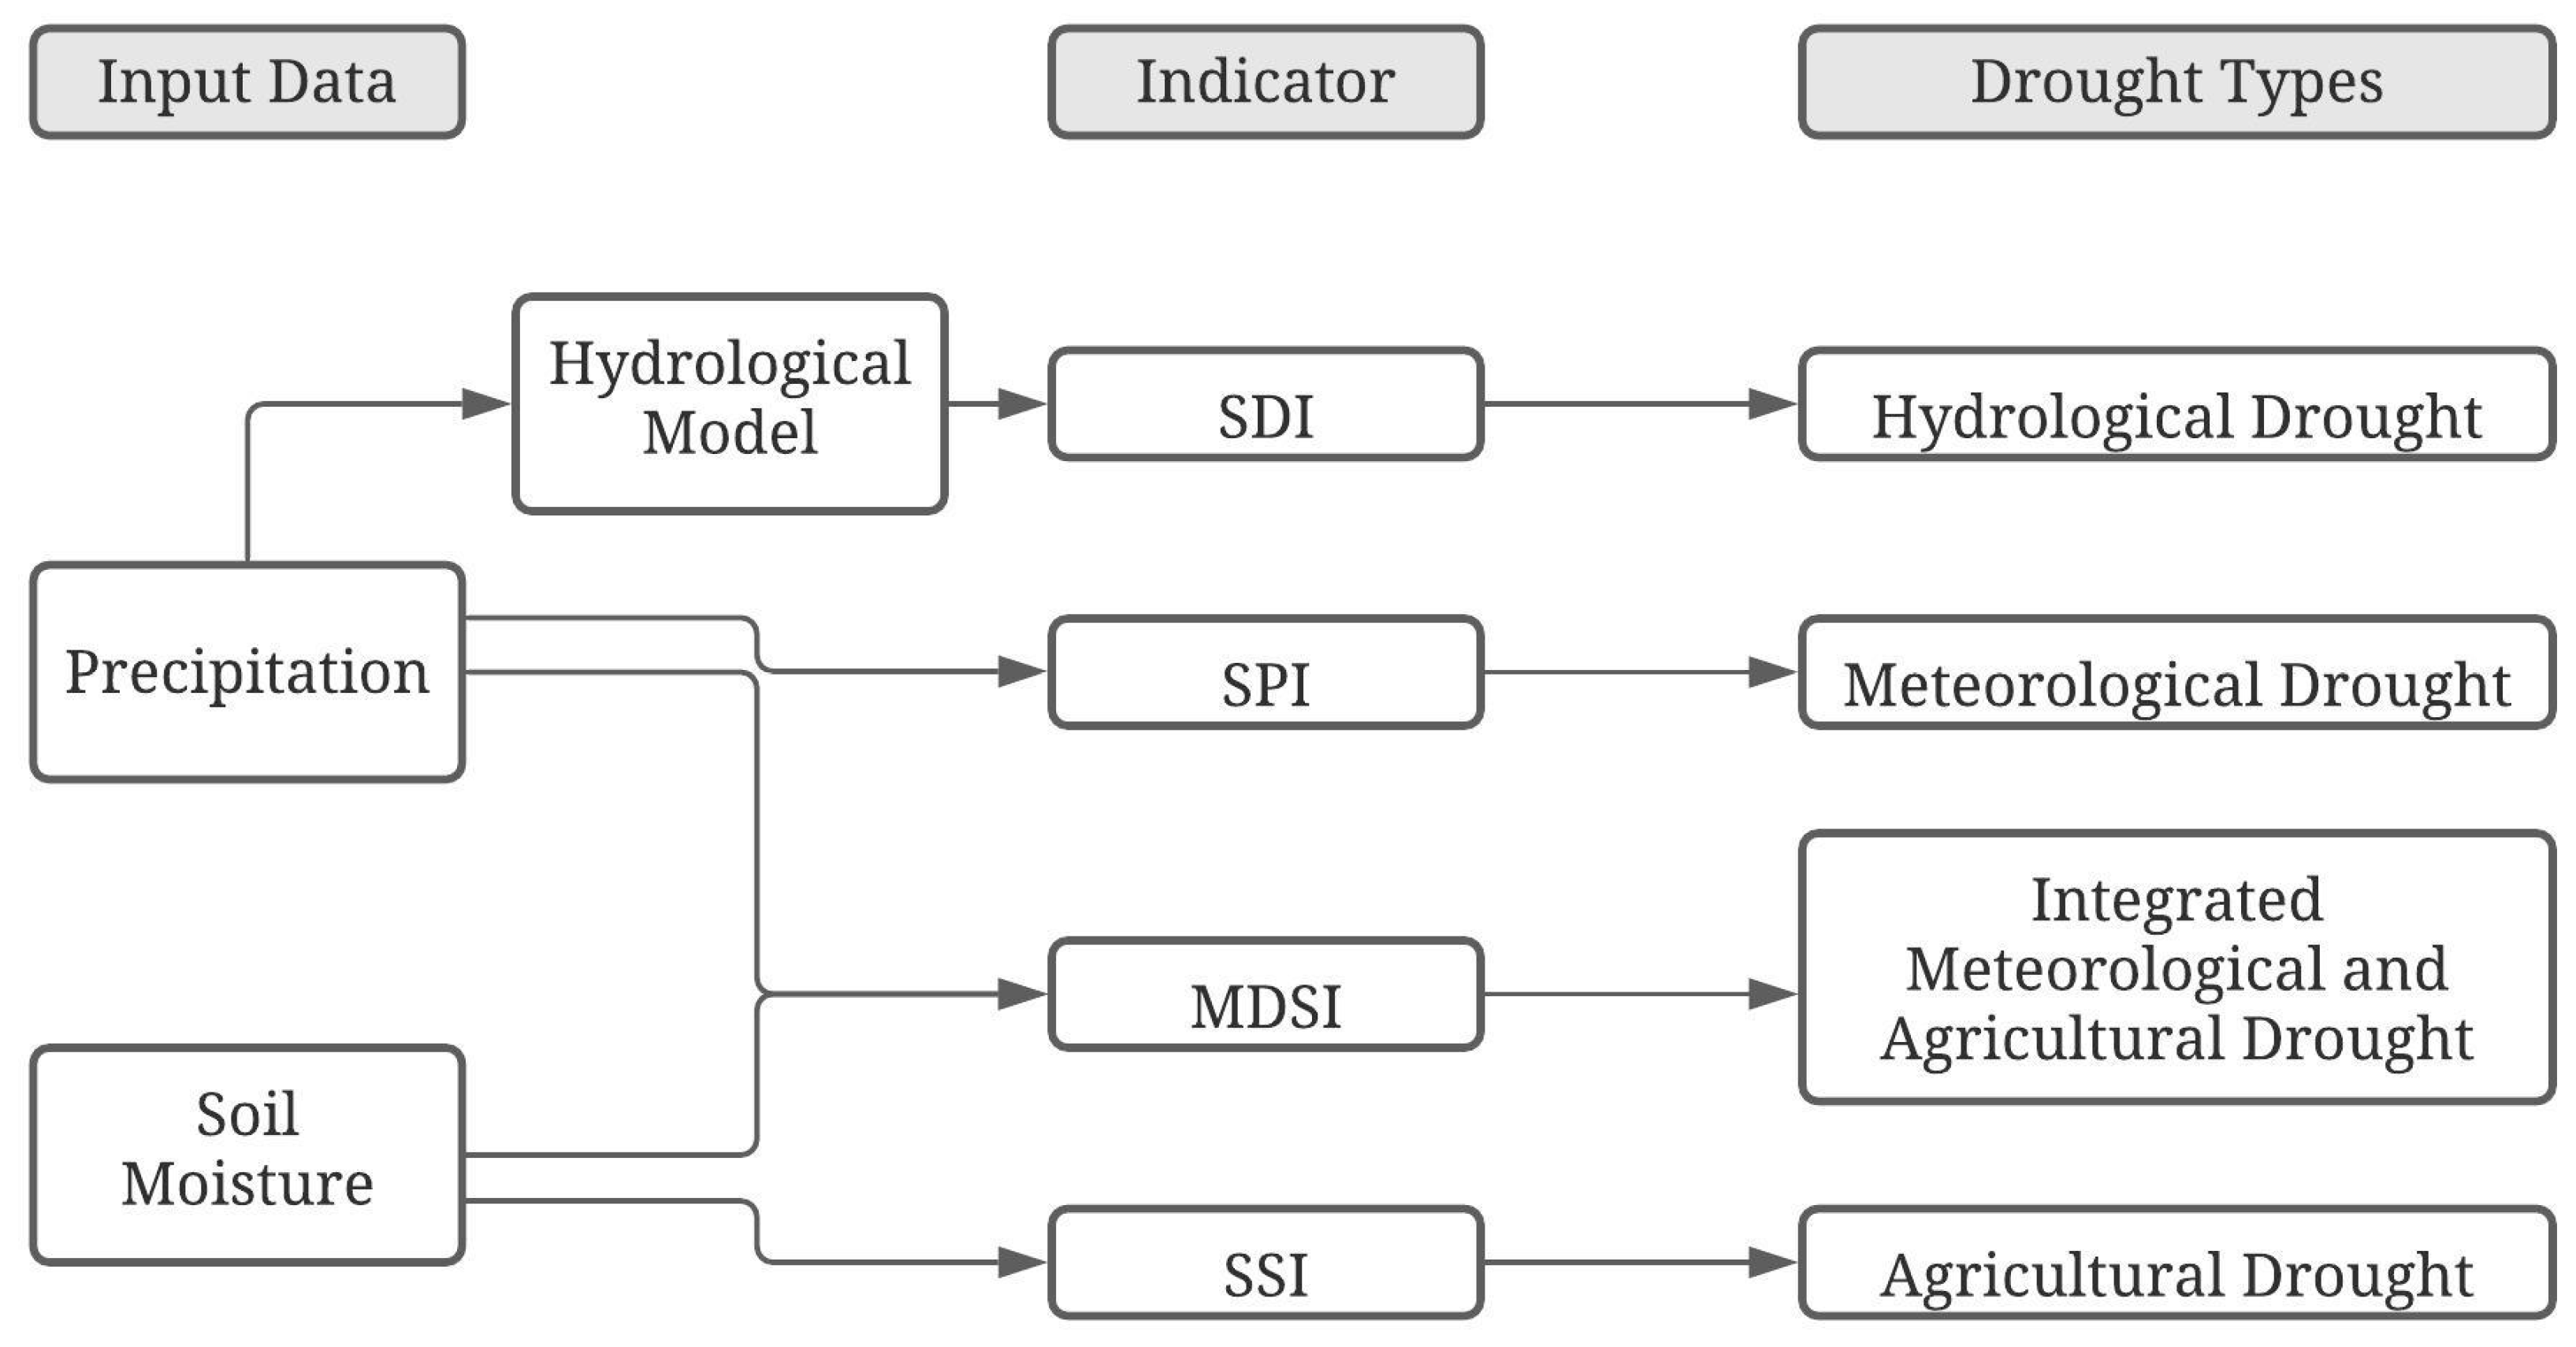
2. Drought Monitoring: The State of the Art
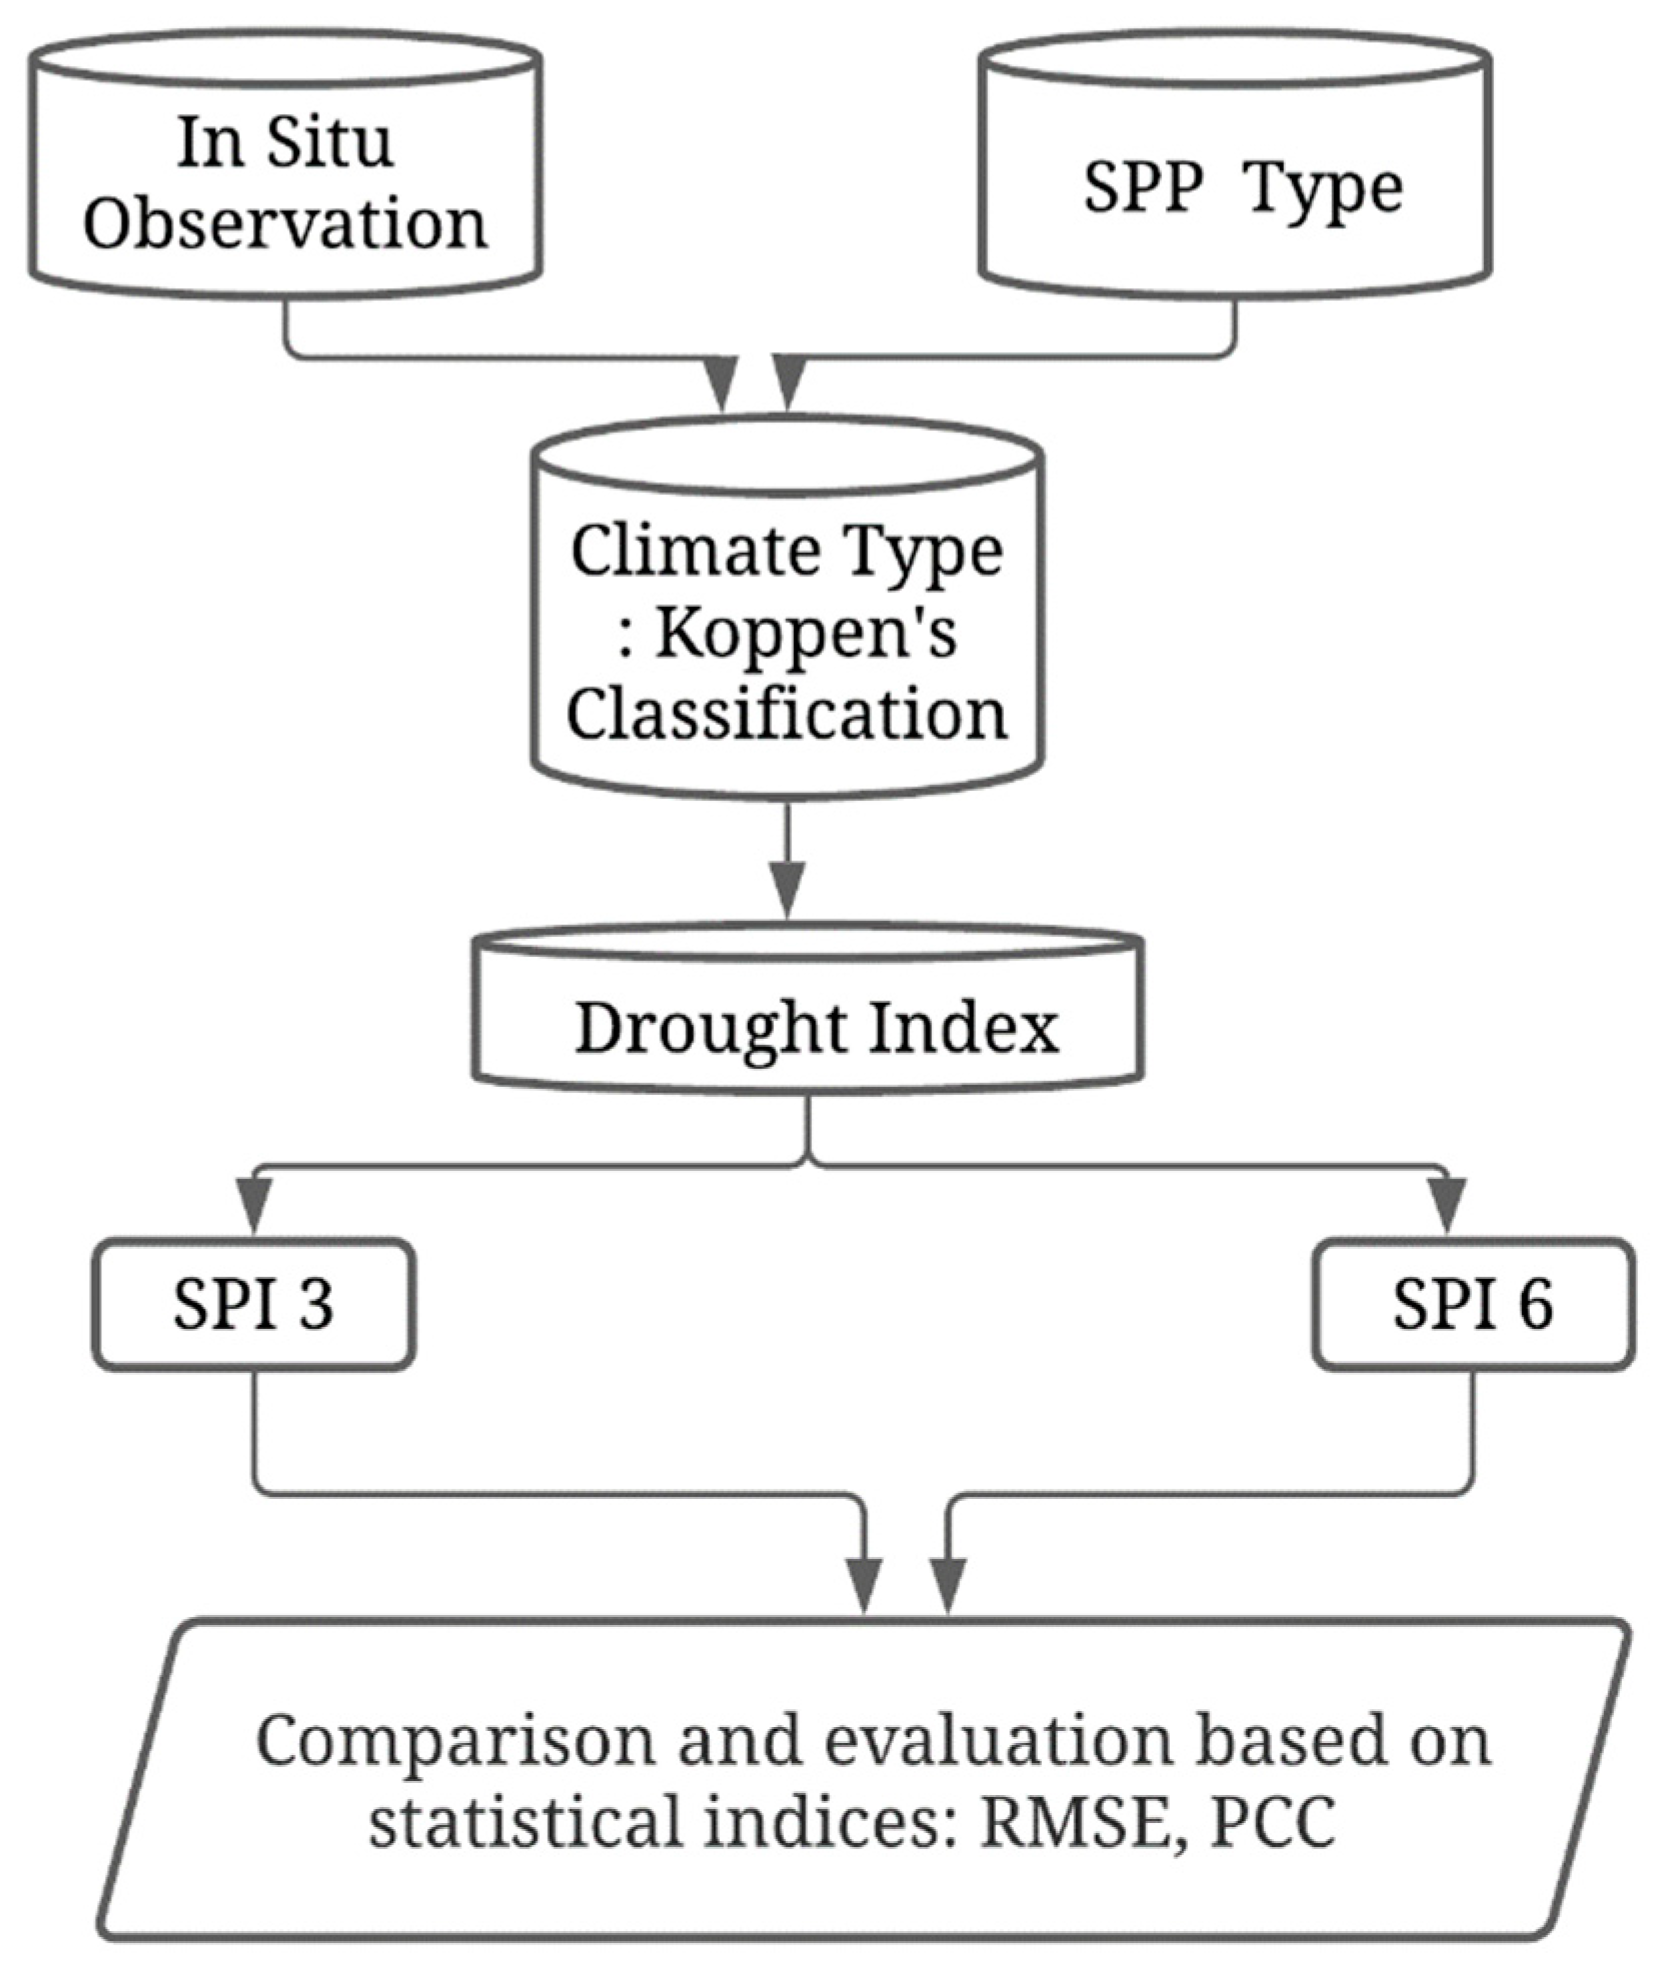
3. Review Methodology
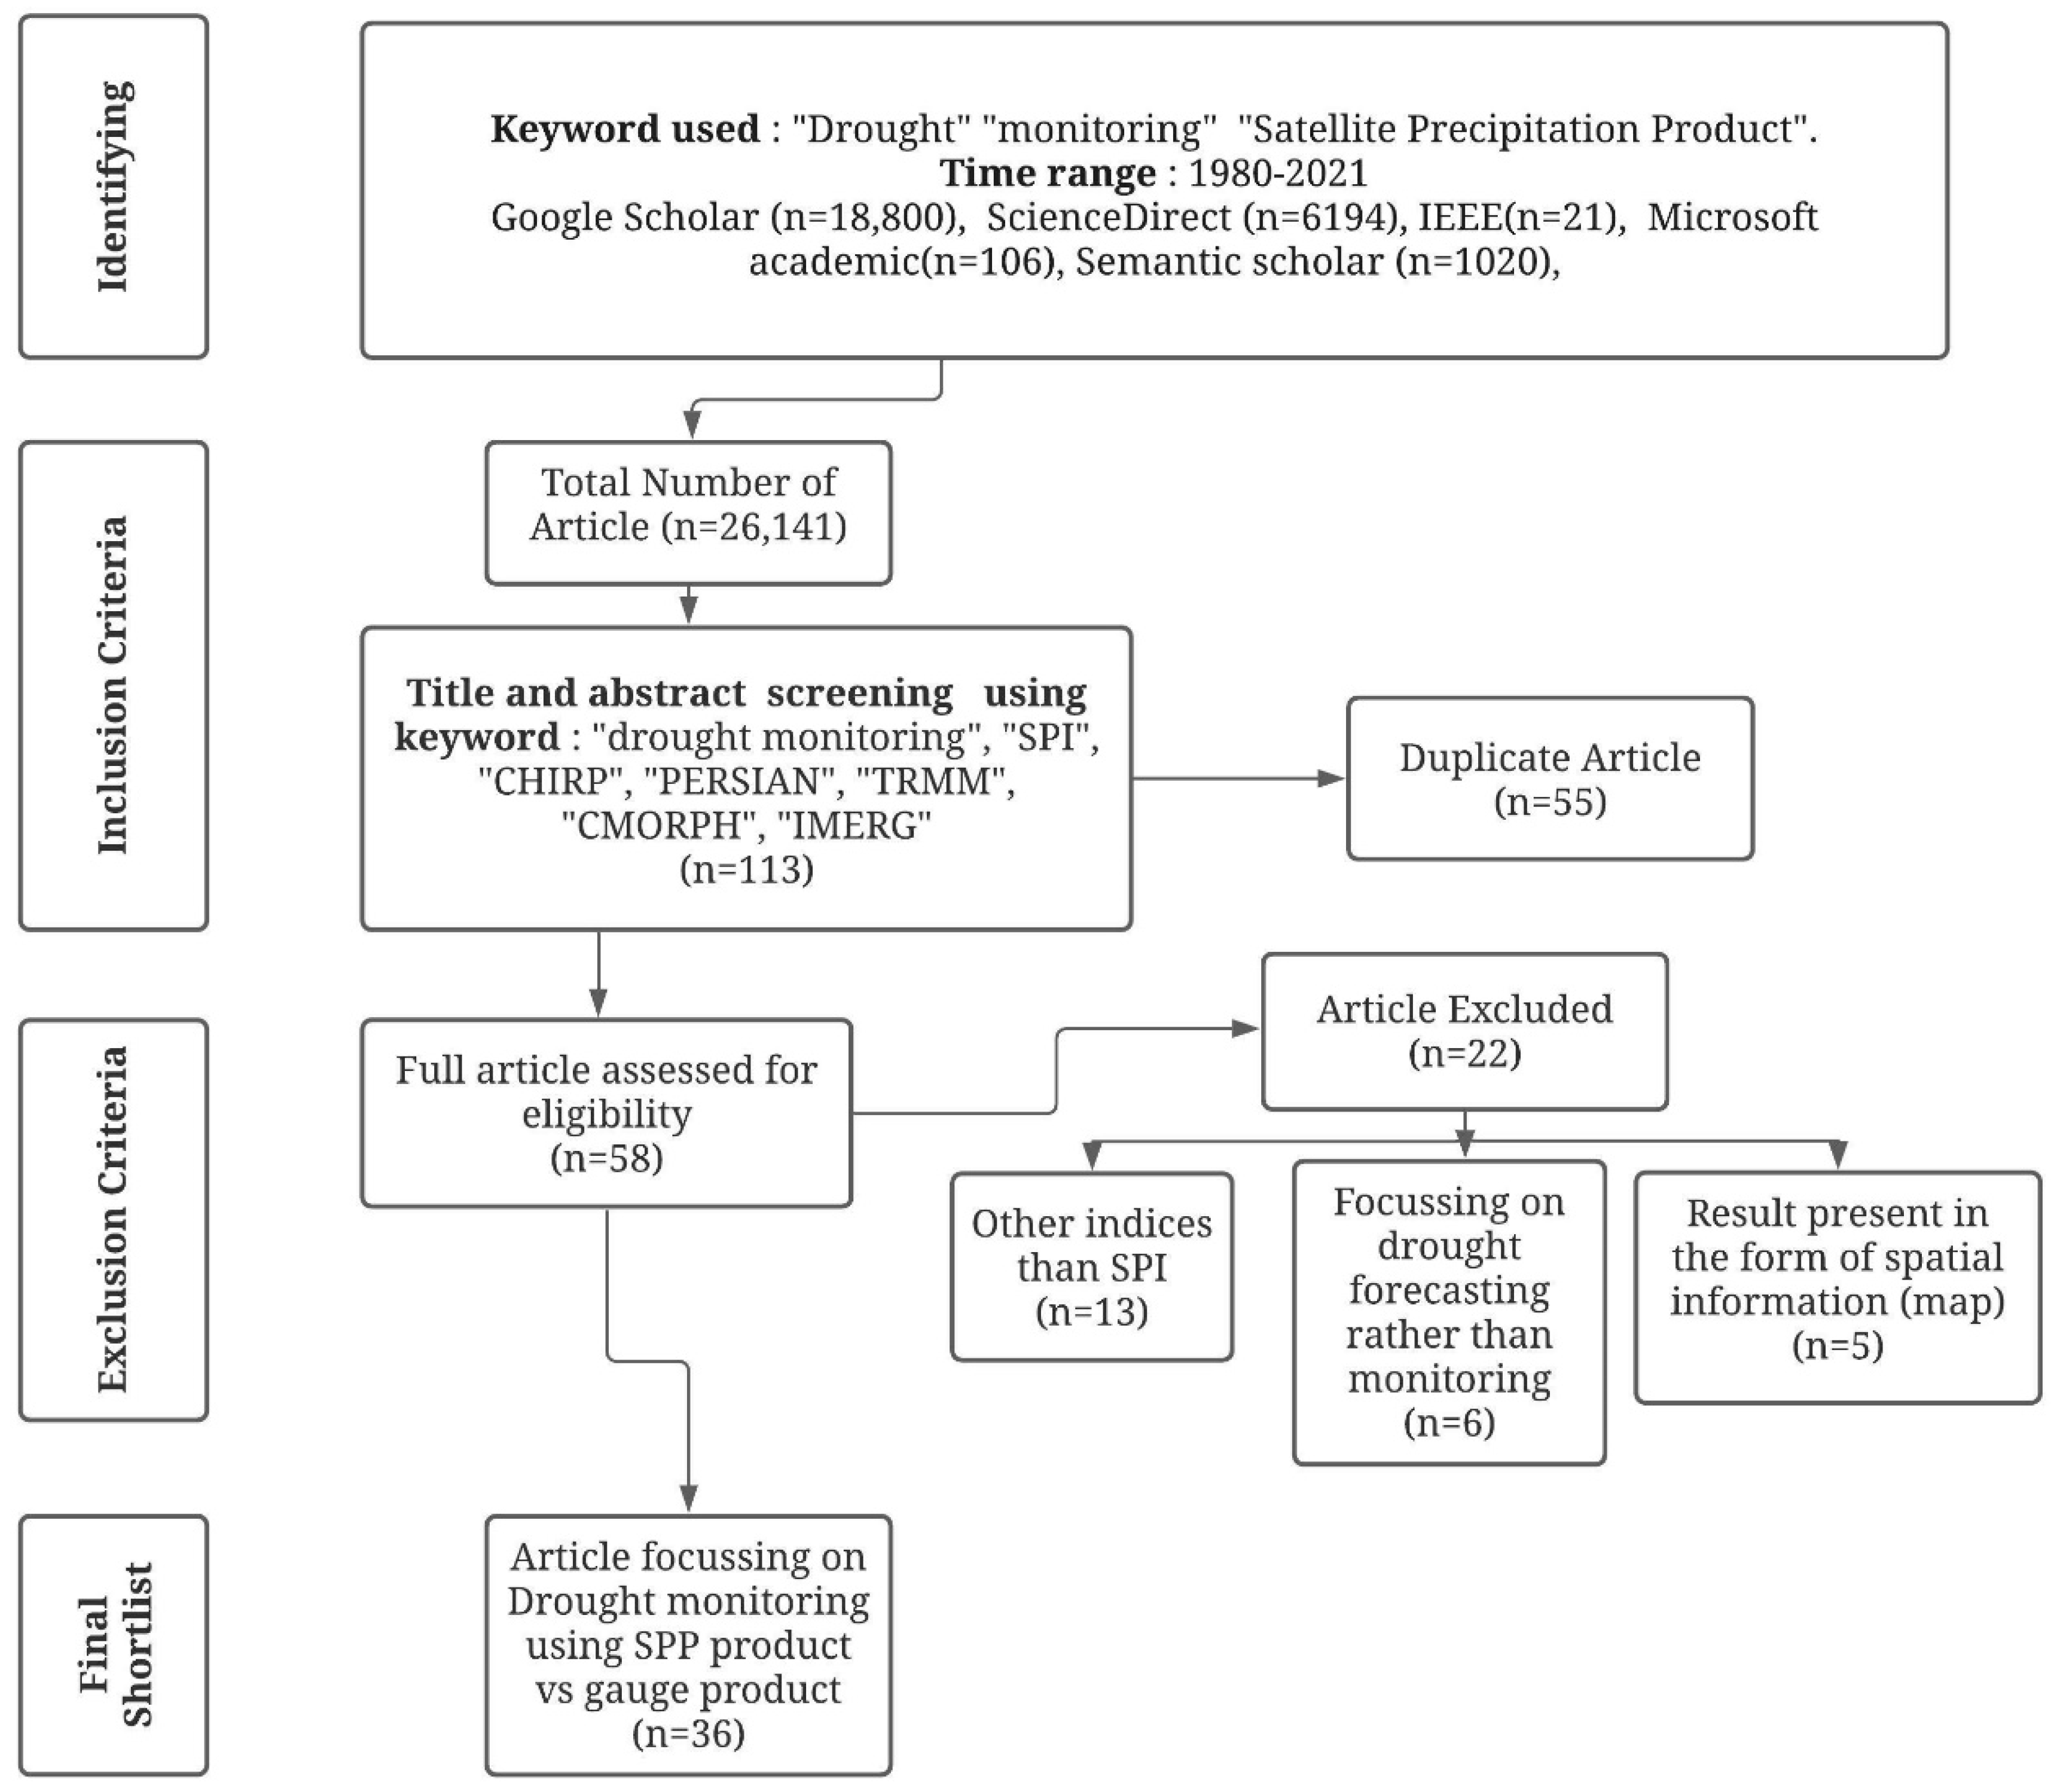
3.1. Methodology for Selection and Screening of Articles
3.2. Performance Analysis of SPPs in Drought Monitoring
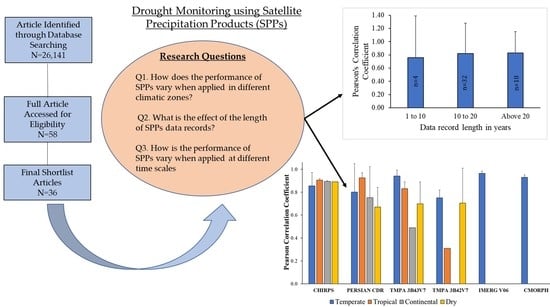
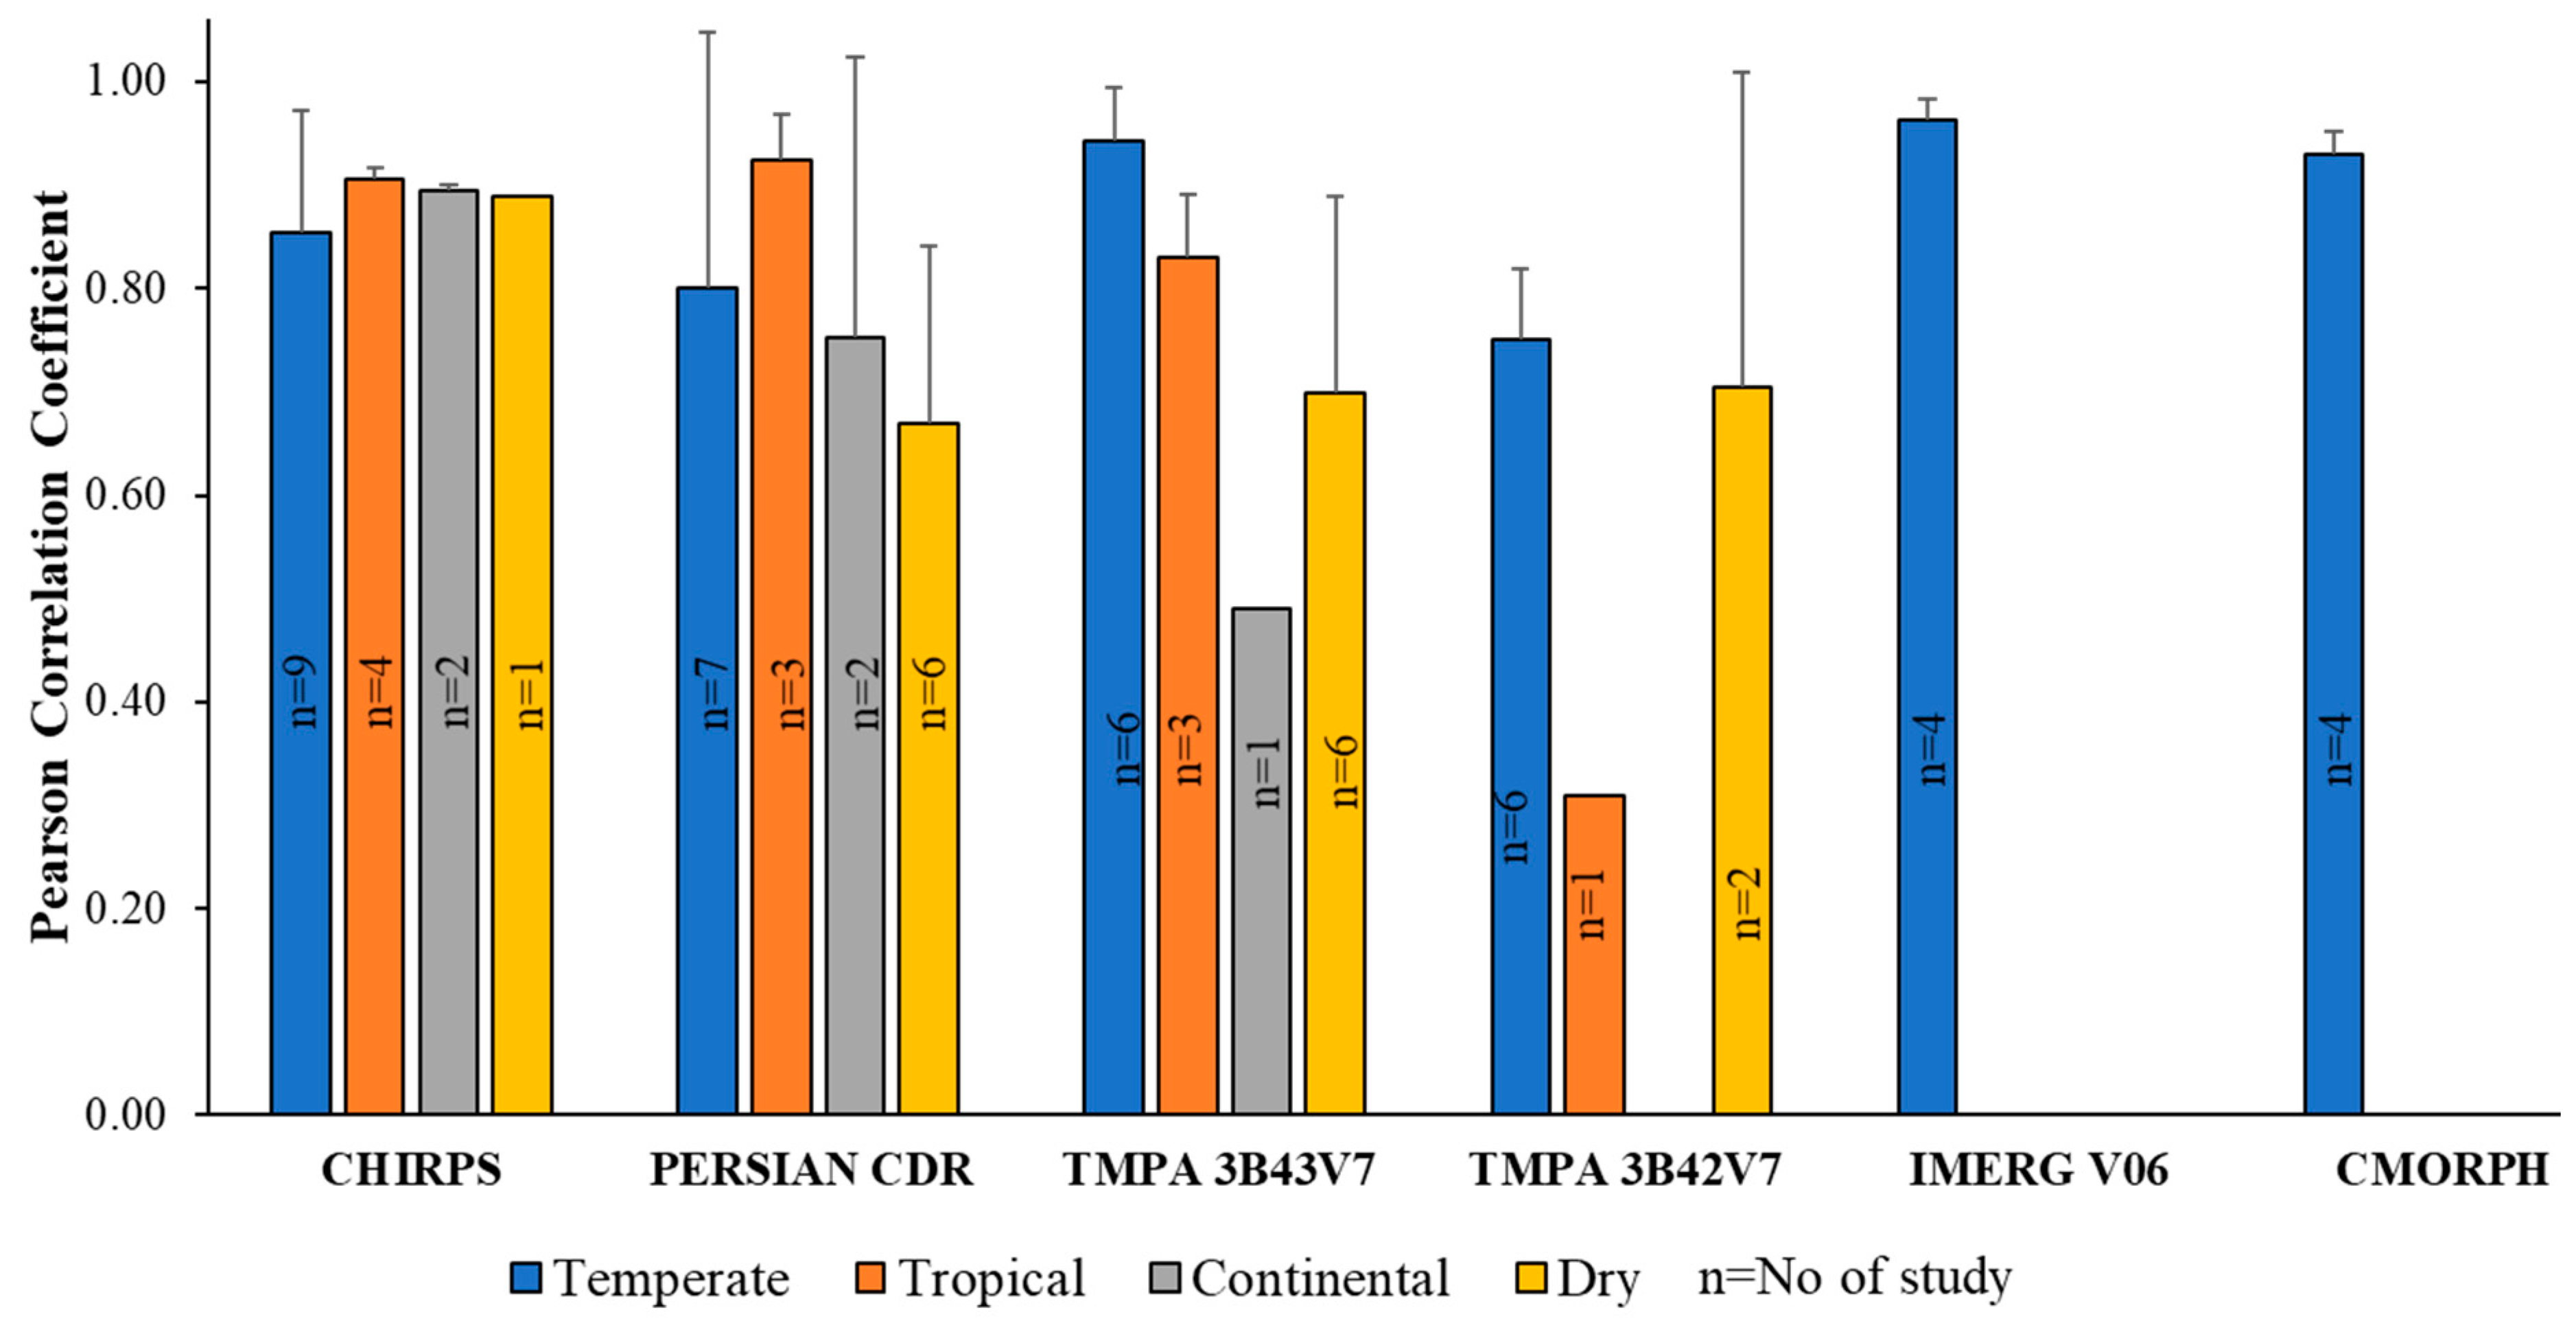
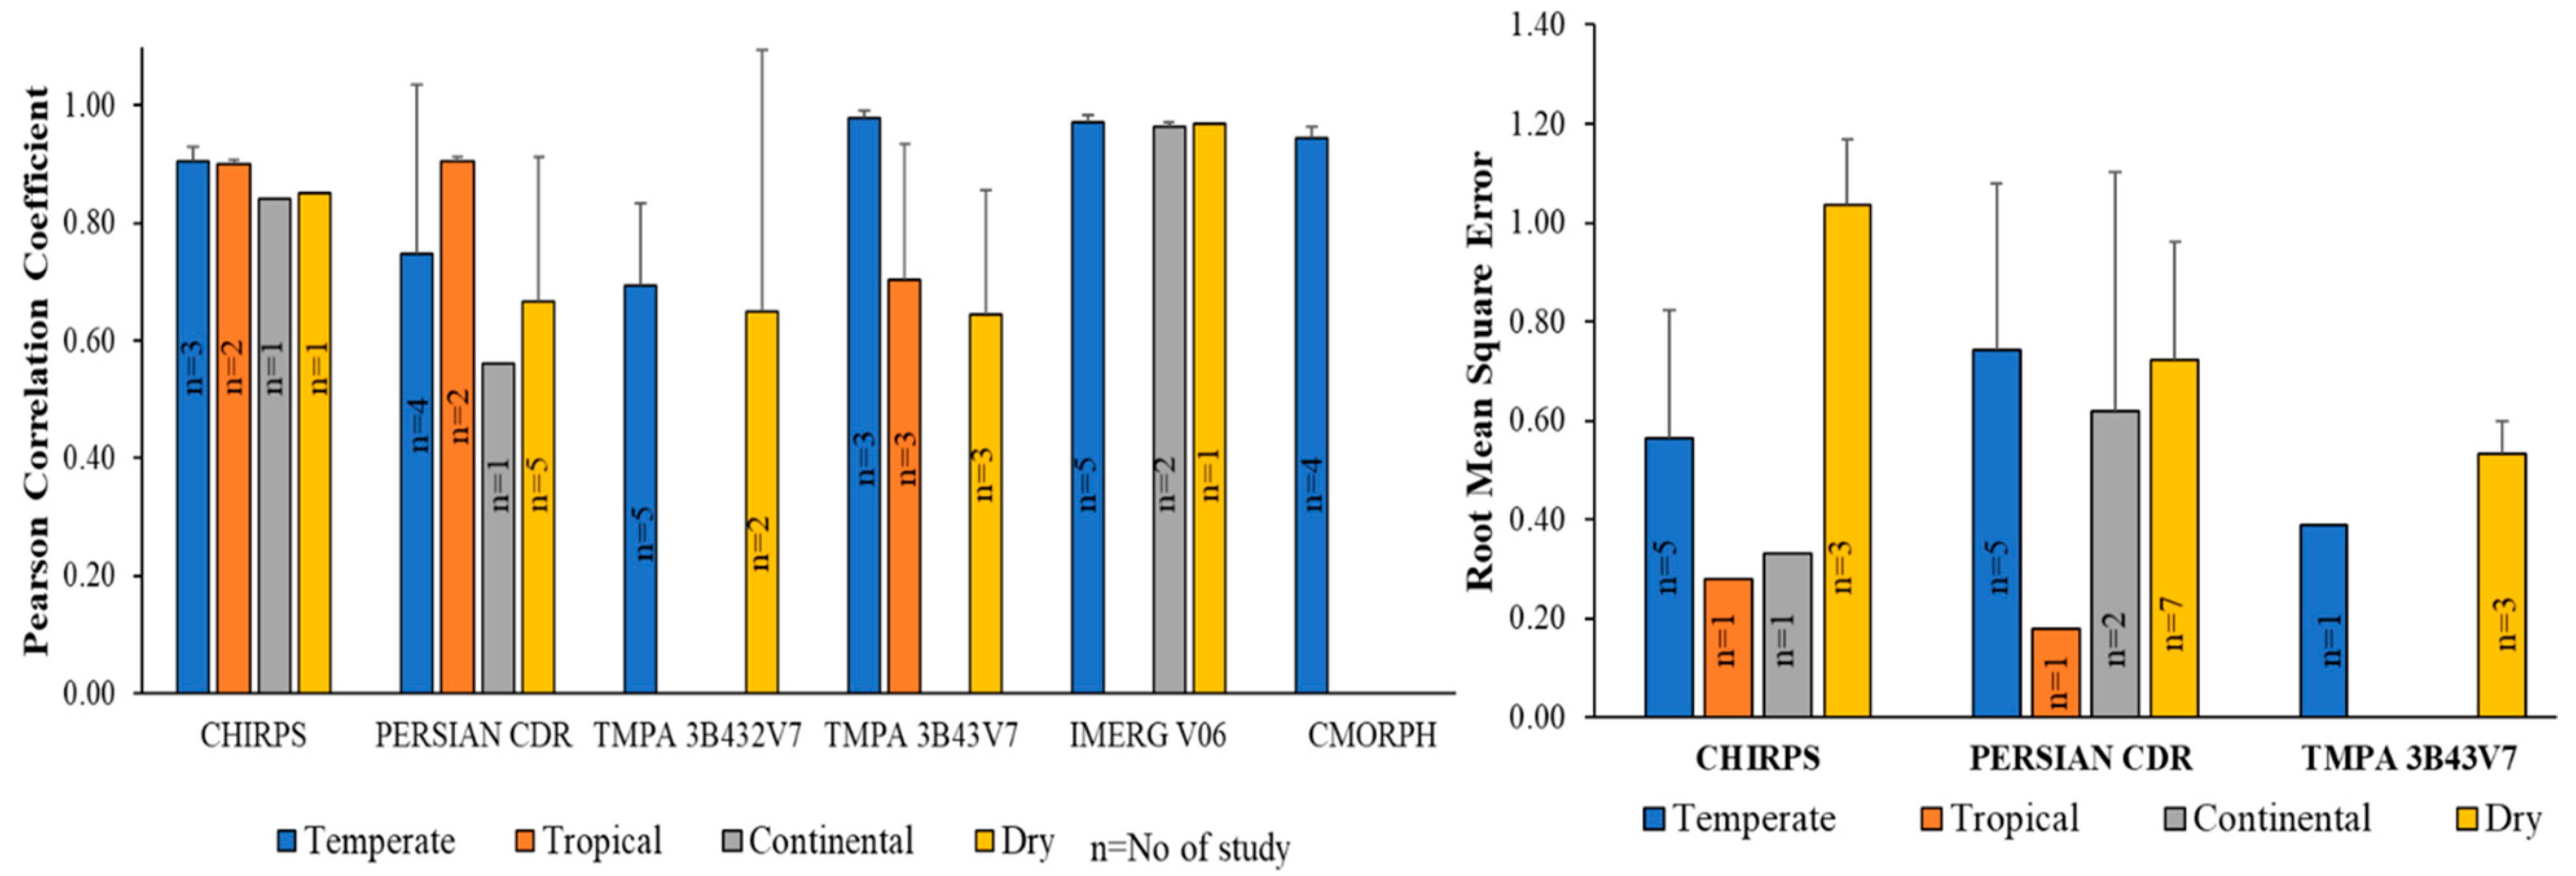
3.2.1. Effect of Climatic Zones on the Performance of SPPs in Drought Monitoring
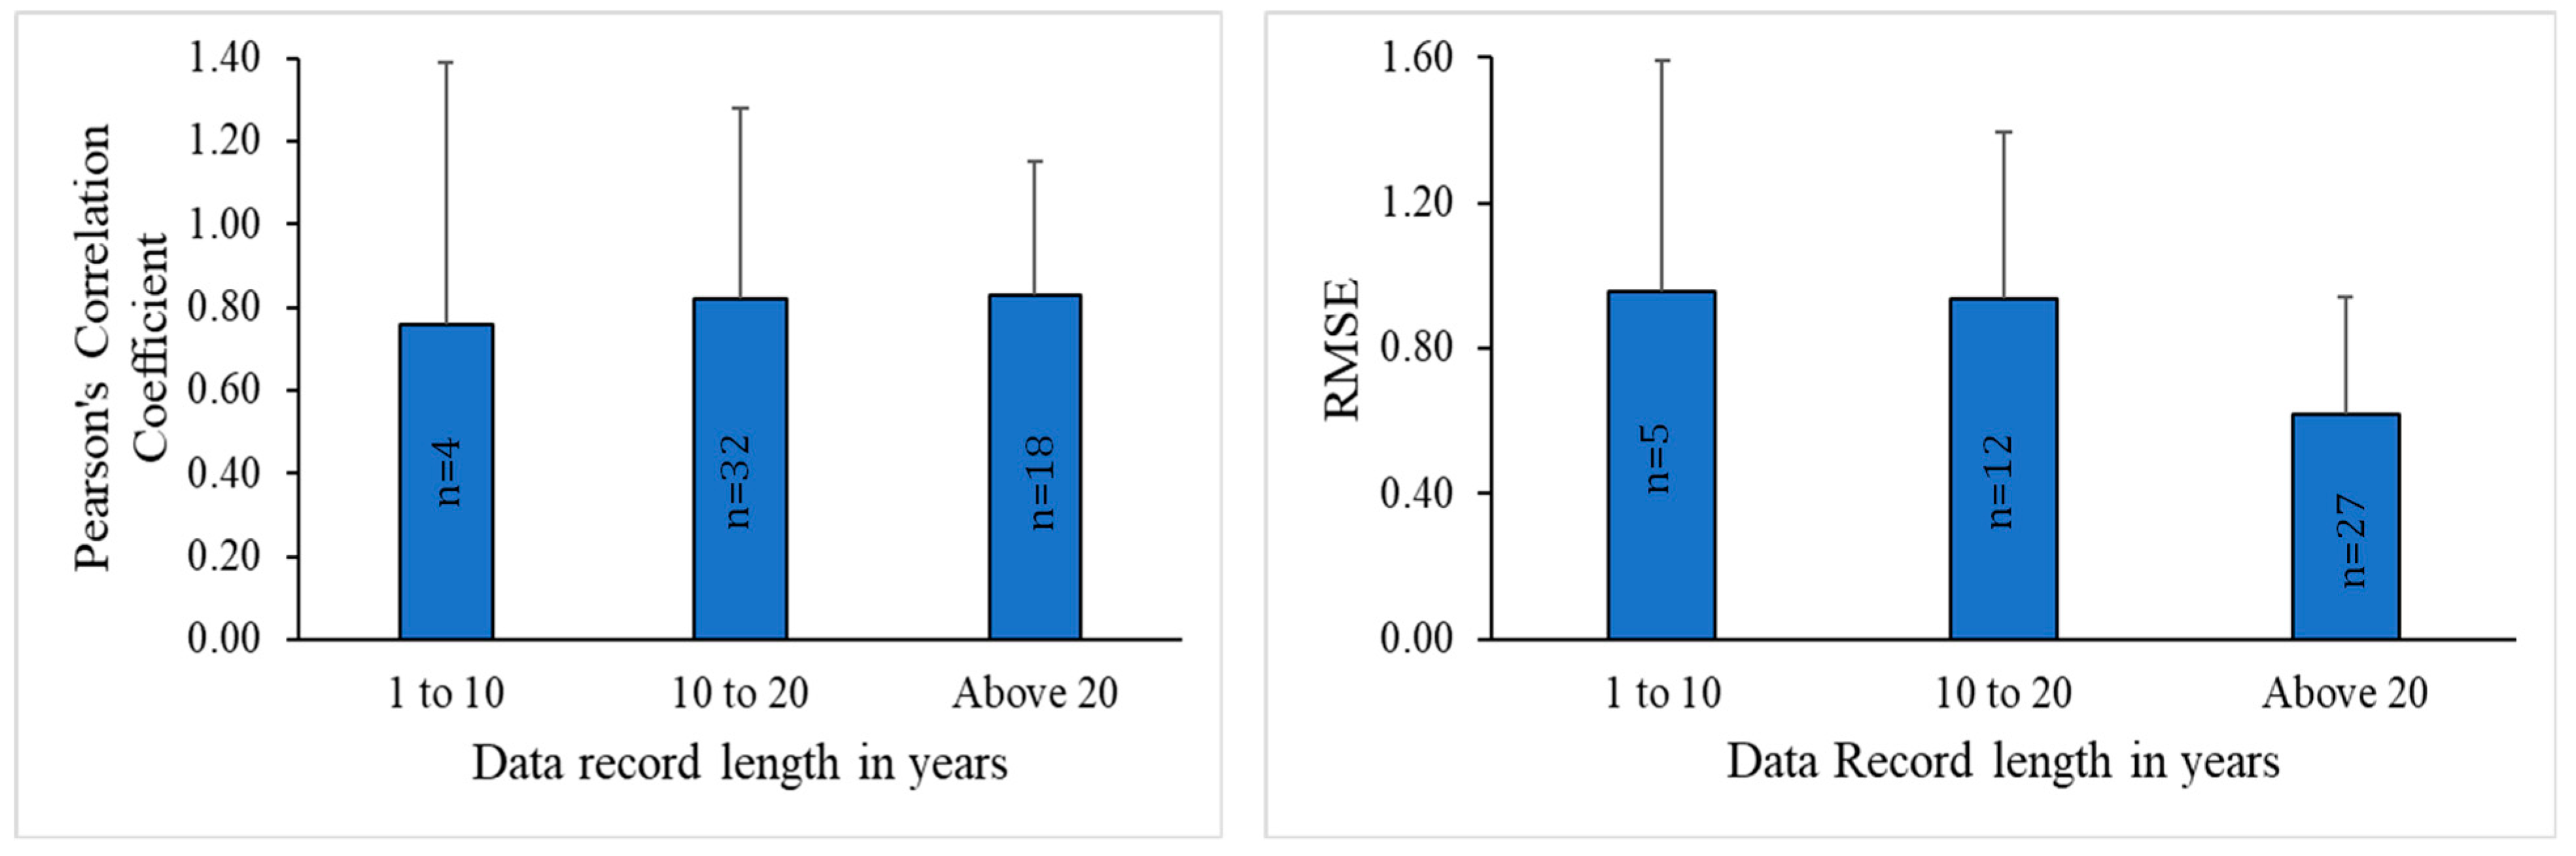
3.2.2. Effect of Data Record Length on the Performance of SPPs in Drought Monitoring
3.2.3. Effect of Time Scales on the Performance of SPPs in Drought Monitoring
4. Results
4.1. Overall Performance of SPPs in Drought Monitoring
4.2. Effect of Climatic Zones on the Performance of SPPs in Drought Monitoring
4.3. Effect of Data Record Length on the Performance of SPPs in Drought Monitoring
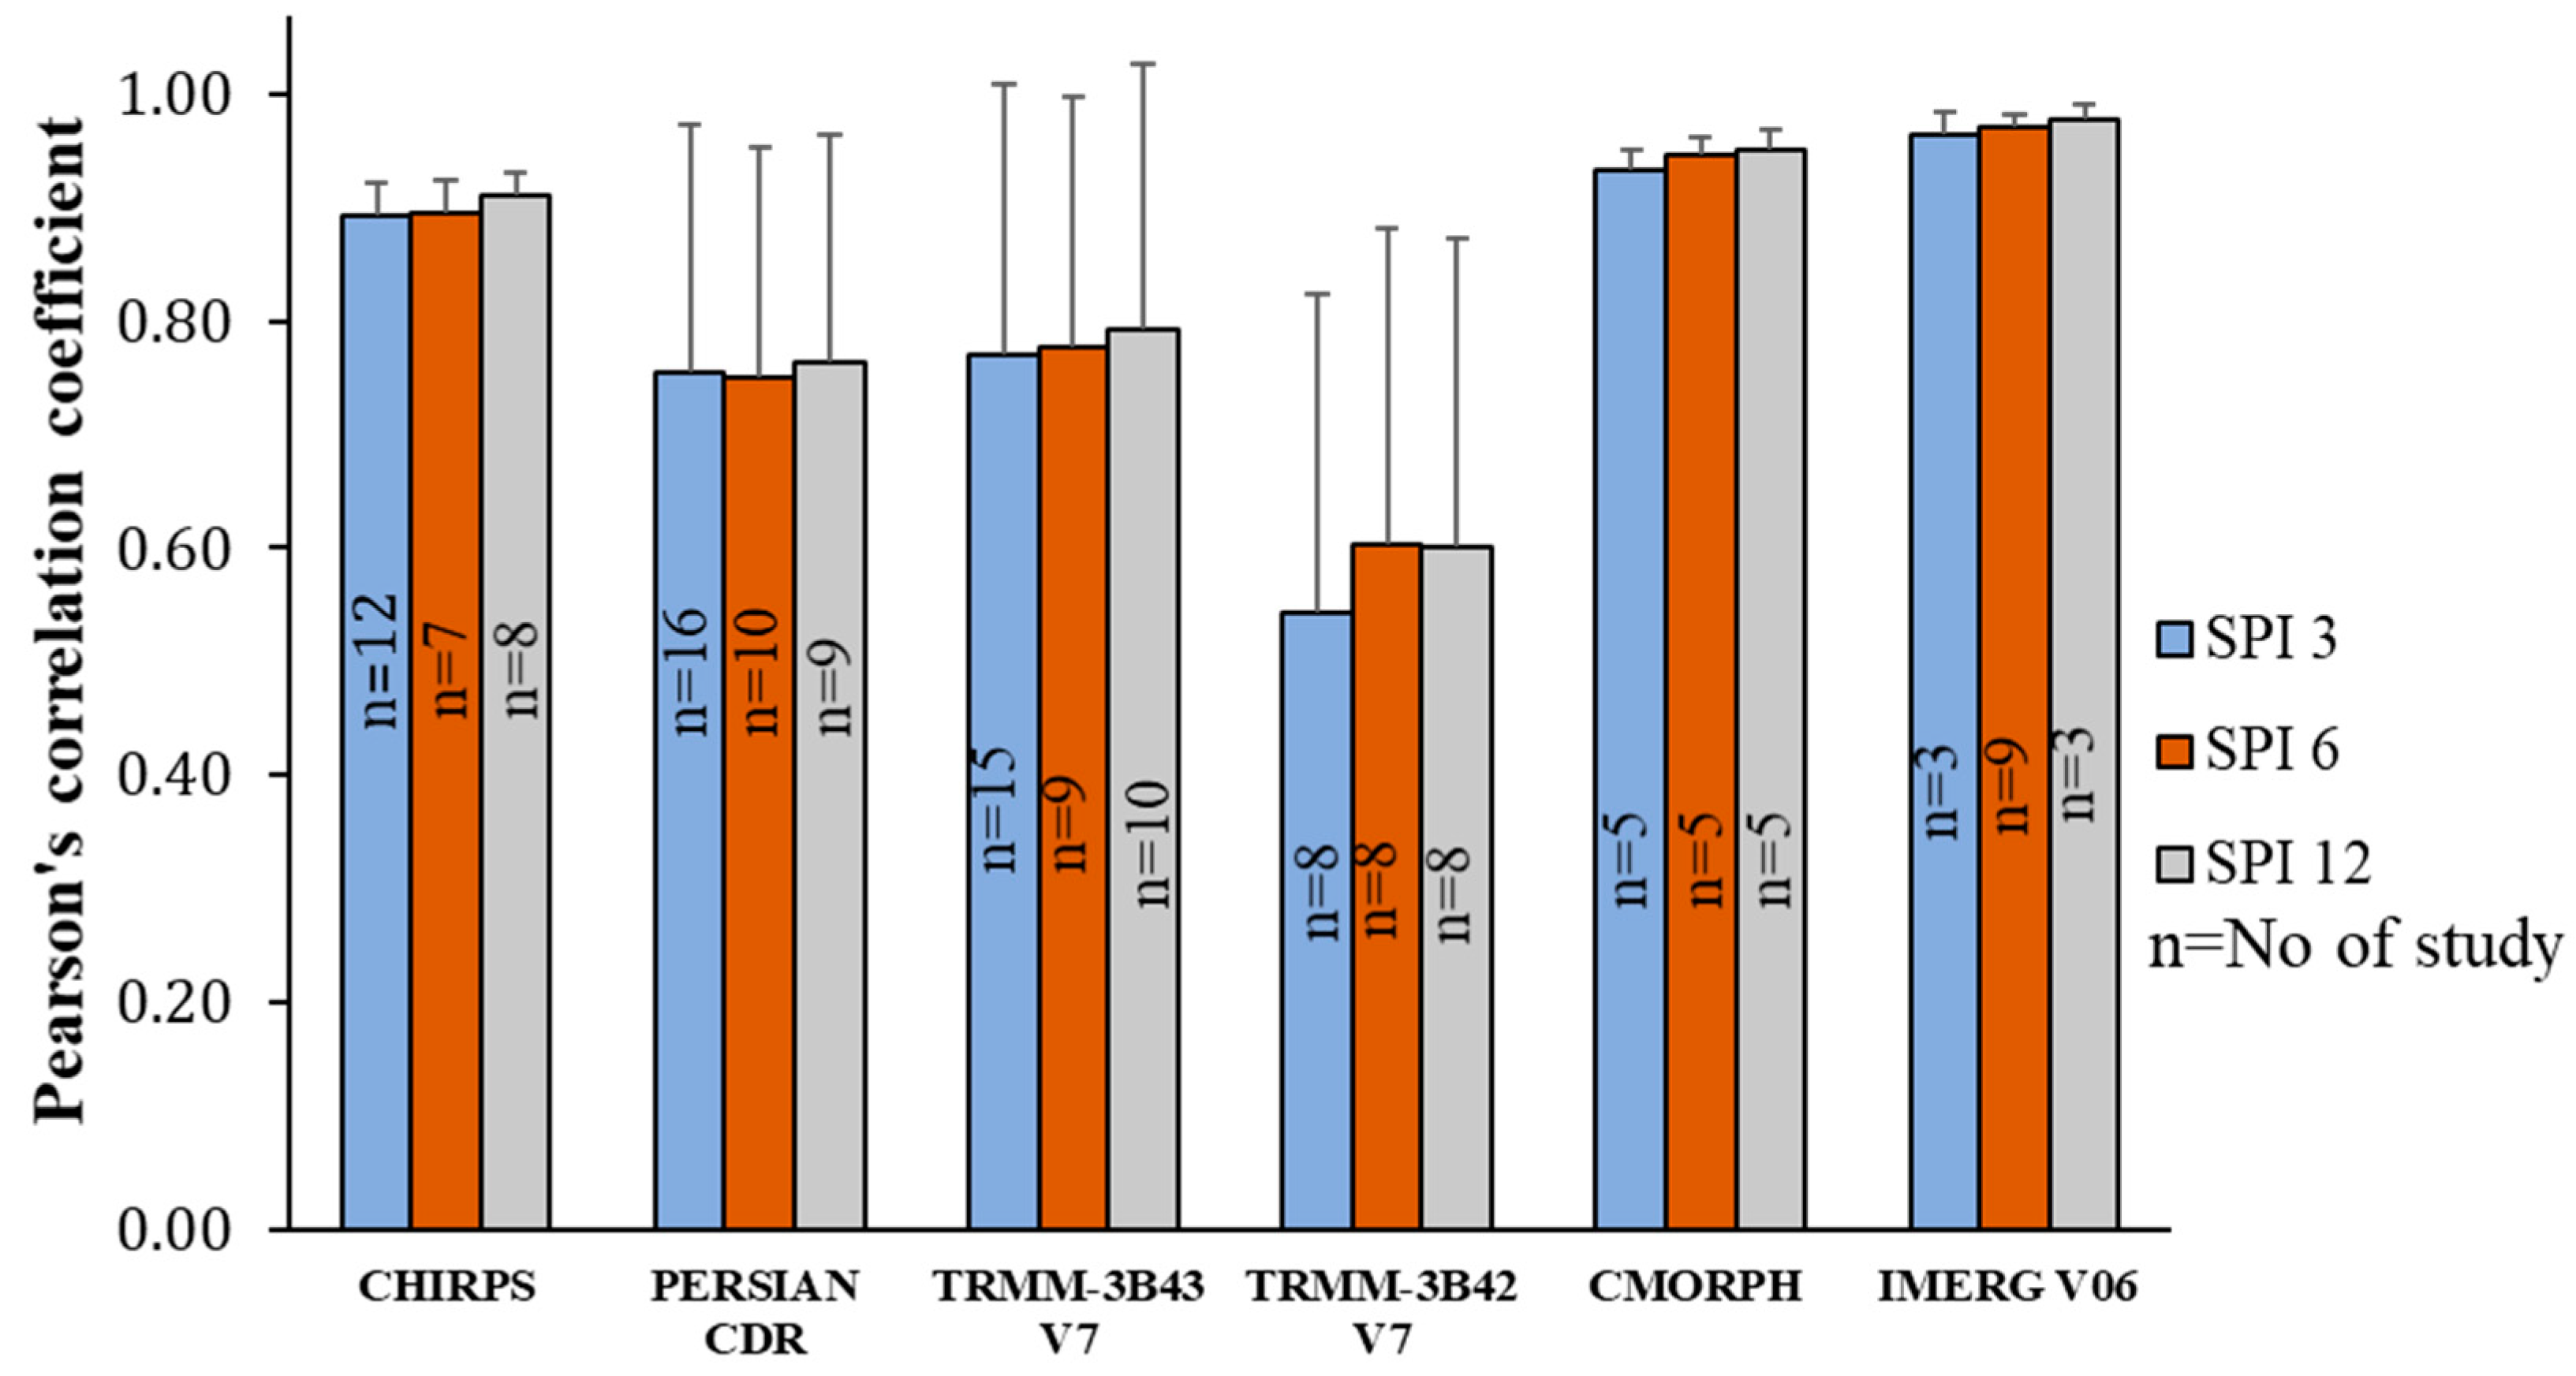
4.4. Effect of Time Scales on the Performance of SPPs in Drought Monitoring
5. Discussion
6. Conclusions and Way Forward
- Identify the best climatological condition under which SPPs can be successfully used for drought monitoring.
- Focus on merging SPPs with other satellite data of high spatial and temporal scale (e.g., soil moisture and vegetation water content) to enhance the precipitation estimation and drought monitoring process.
- Application of various data processing methods such as wavelet packet transform (WPT), discrete wavelet transform (DWT), etc., should be attempted in SPPs to enhance the machine learning performance in blending SPPs with in situ data.
- Bias correction such as quantile mapping etc. should be applied to SPPs before SPI estimation to improve their performance.
Author Contributions
Funding
Data Availability Statement
Conflicts of Interest
References
- Trenberth, K.E.; Dai, A.; Rasmussen, R.M.; Parsons, D.B. The changing character of precipitation. Bull. Am. Meteorol. Soc. 2003, 84, 1205–1218. [Google Scholar] [CrossRef]
- Su, F.; Hong, Y.; Lettenmaier, D.P. Evaluation of TRMM Multisatellite Precipitation Analysis (TMPA) and its utility in hydrologic prediction in the La Plata Basin. J. Hydrometeorol. 2008, 9, 622–640. [Google Scholar] [CrossRef] [Green Version]
- Gao, F.; Zhang, Y.; Ren, X.; Yao, Y.; Hao, Z.; Cai, W. Evaluation of CHIRPS and its application for drought monitoring over the Haihe River Basin, China. Nat. Hazards 2018, 92, 155–172. [Google Scholar] [CrossRef]
- Shrestha, N.K.; Qamer, F.M.; Pedreros, D.; Murthy, M.S.R.; Wahid, S.M.; Shrestha, M. Evaluating the accuracy of Climate Hazard Group (CHG) satellite rainfall estimates for precipitation based drought monitoring in Koshi basin, Nepal. J. Hydrol. Reg. Stud. 2017, 13, 138–151. [Google Scholar] [CrossRef]
- Joyce, R.J.; Janowiak, J.E.; Arkin, P.A.; Xie, P. CMORPH: A method that produces global precipitation estimates from passive microwave and infrared data at high spatial and temporal resolution. J. Hydrometeorol. 2004, 5, 487–503. [Google Scholar] [CrossRef]
- Funk, C.; Peterson, P.; Landsfeld, M.; Pedreros, D.; Verdin, J.; Shukla, S.; Husak, G.; Rowland, J.; Harrison, L.; Hoell, A. The climate hazards infrared precipitation with stations—A new environmental record for monitoring extremes. Sci. Data 2015, 2, 150066. [Google Scholar] [CrossRef] [PubMed] [Green Version]
- Huffman, G.J.; Bolvin, D.T.; Braithwaite, D.; Hsu, K.; Joyce, R.; Xie, P.; Yoo, S.-H. NASA global precipitation measurement (GPM) integrated multi-satellite retrievals for GPM (IMERG). Algorithm Theor. Basis Doc. Version 2015, 4, 26. [Google Scholar]
- Ashouri, H.; Hsu, K.-L.; Sorooshian, S.; Braithwaite, D.K.; Knapp, K.R.; Cecil, L.D.; Nelson, B.R.; Prat, O.P. PERSIANN-CDR: Daily precipitation climate data record from multisatellite observations for hydrological and climate studies. Bull. Am. Meteorol. Soc. 2015, 96, 69–83. [Google Scholar] [CrossRef] [Green Version]
- Kummerow, C.; Barnes, W.; Kozu, T.; Shiue, J.; Simpson, J. The tropical rainfall measuring mission (TRMM) sensor package. J. Atmos. Ocean. Technol. 1998, 15, 809–817. [Google Scholar] [CrossRef]
- Tang, G.; Ma, Y.; Long, D.; Zhong, L.; Hong, Y. Evaluation of GPM Day-1 IMERG and TMPA Version-7 legacy products over Mainland China at multiple spatiotemporal scales. J. Hydrol. 2016, 533, 152–167. [Google Scholar] [CrossRef]
- Mahmoud, M.T.; Mohammed, S.A.; Hamouda, M.A.; Mohamed, M.M. Impact of topography and rainfall intensity on the accuracy of imerg precipitation estimates in an arid region. Remote Sens. 2021, 13, 13. [Google Scholar] [CrossRef]
- Abdelmoneim, H.; Soliman, M.R.; Moghazy, H.M. Evaluation of TRMM 3B42V7 and CHIRPS Satellite Precipitation Products as an Input for Hydrological Model over Eastern Nile Basin. Earth Syst. Environ. 2020, 4, 685–698. [Google Scholar] [CrossRef]
- Hong, Z.; Han, Z.; Li, X.; Long, D.; Tang, G.; Wang, J. Generation of an Improved Precipitation Dataset from Multisource Information over the Tibetan Plateau. J. Hydrometeorol. 2021, 22, 1275–1295. [Google Scholar]
- Hayes, M.J.; Svoboda, M.D.; Wardlow, B.D.; Anderson, M.C.; Kogan, F. Drought monitoring: Historical and current perspectives. In Remote Sensing of Drought: Innovative Monitoring Approaches; Wardlow, B.D., Anderson, M.C., Verdin, J.P., Eds.; CRC Press: Boca Raton, FL, USA, 2012; Chapter 1; pp. 1–19. [Google Scholar]
- Sharma, A.; Goyal, M.K. Assessment of drought trend and variability in India using wavelet transform. Hydrol. Sci. J. 2020, 65, 1539–1554. [Google Scholar] [CrossRef]
- Long, D.; Scanlon, B.R.; Longuevergne, L.; Sun, A.Y.; Fernando, D.N.; Save, H. GRACE satellite monitoring of large depletion in water storage in response to the 2011 drought in Texas. Geophys. Res. Lett. 2013, 40, 3395–3401. [Google Scholar] [CrossRef] [Green Version]
- Jentsch, A.; Beierkuhnlein, C. Research frontiers in climate change: Effects of extreme meteorological events on ecosystems. Comptes Rendus Geosci. 2008, 340, 621–628. [Google Scholar] [CrossRef]
- Dai, A. Drought under global warming: A review. Wiley Interdiscip. Rev. Clim. Chang. 2011, 2, 45–65. [Google Scholar] [CrossRef] [Green Version]
- Dutta, P.; Hinge, G.; Marak, J.D.K.; Sarma, A.K. Future climate and its impact on streamflow: A case study of the Brahmaputra river basin. Model. Earth Syst. Environ. 2020, 7, 2475–2490. [Google Scholar] [CrossRef]
- Mishra, A.K.; Singh, V.P. A review of drought concepts. J. Hydrol. 2010, 391, 202–216. [Google Scholar] [CrossRef]
- Bonal, D.; Burban, B.; Stahl, C.; Wagner, F.; Hérault, B. The response of tropical rainforests to drought—lessons from recent research and future prospects. Ann. For. Sci. 2016, 73, 27–44. [Google Scholar] [CrossRef] [Green Version]
- Yang, Y.; Guan, H.; Batelaan, O.; McVicar, T.R.; Long, D.; Piao, S.; Liang, W.; Liu, B.; Jin, Z.; Simmons, C.T. Contrasting responses of water use efficiency to drought across global terrestrial ecosystems. Sci. Rep. 2016, 6, 23284. [Google Scholar] [CrossRef] [PubMed] [Green Version]
- Pandey, V.; Srivastava, P.K.; Mall, R.K.; Munoz-Arriola, F.; Han, D. Multi-satellite precipitation products for meteorological drought assessment and forecasting in Central India. Geocarto Int. 2020. [Google Scholar] [CrossRef]
- Hinge, G.; Sharma, A. Comparison of wavelet and machine learning methods for regional drought prediction. In Proceedings of the EGU General Assembly Conference Abstracts, Vienna, Austria, 25–30 April 2021. [Google Scholar] [CrossRef]
- Alijanian, M.; Rakhshandehroo, G.R.; Mishra, A.; Dehghani, M. Evaluation of remotely sensed precipitation estimates using PERSIANN-CDR and MSWEP for spatio-temporal drought assessment over Iran. J. Hydrol. 2019, 579, 124189. [Google Scholar] [CrossRef]
- Luo, X.; Wu, W.; He, D.; Li, Y.; Ji, X. Hydrological simulation using TRMM and CHIRPS precipitation estimates in the lower Lancang-Mekong river basin. Chin. Geogr. Sci. 2019, 29, 13–25. [Google Scholar] [CrossRef] [Green Version]
- Guo, H.; Bao, A.; Liu, T.; Chen, S.; Ndayisaba, F. Evaluation of PERSIANN-CDR for meteorological drought monitoring over China. Remote Sens. 2016, 8, 379. [Google Scholar] [CrossRef] [Green Version]
- Huffman, G.J.; Bolvin, D.T.; Nelkin, E.J.; Wolff, D.B.; Adler, R.F.; Gu, G.; Hong, Y.; Bowman, K.P.; Stocker, E.F. The TRMM Multisatellite Precipitation Analysis (TMPA): Quasi-global, multiyear, combined-sensor precipitation estimates at fine scales. J. Hydrometeorol. 2007, 8, 38–55. [Google Scholar] [CrossRef]
- Wang, F.; Yang, H.; Wang, Z.; Zhang, Z.; Li, Z. Drought evaluation with CMORPH satellite precipitation data in the Yellow River Basin by using gridded standardized precipitation evapotranspiration index. Remote Sens. 2019, 11, 485. [Google Scholar] [CrossRef] [Green Version]
- Jiang, S.; Wei, L.; Ren, L.; Xu, C.-Y.; Zhong, F.; Wang, M.; Zhang, L.; Yuan, F.; Liu, Y. Utility of integrated IMERG precipitation and GLEAM potential evapotranspiration products for drought monitoring over mainland China. Atmos. Res. 2021, 247, 105141. [Google Scholar] [CrossRef]
- Wilhite, D. Drought monitoring and early warning: Concepts, progress and future challenges. World Meteorol. Organ. WMO 2006, 1006, 26. [Google Scholar]
- Svoboda, M.D.; Fuchs, B.A. Handbook of Drought Indicators and Indices; World Meteorological Organization: Geneva, Switzerland, 2016; ISBN 9187823241. [Google Scholar]
- McKee, T.B.; Doesken, N.J.; Kleist, J. The relationship of drought frequency and duration to time scales. In Proceedings of the 8th Conference on Applied Climatology, Anaheim, CA, USA, 17–22 January 1993; Volume 17, pp. 179–183. [Google Scholar]
- Hayes, M.; Svoboda, M.; Wall, N.; Widhalm, M. The Lincoln declaration on drought indices: Universal meteorological drought index recommended. Bull. Am. Meteorol. Soc. 2011, 92, 485–488. [Google Scholar] [CrossRef] [Green Version]
- Hao, Z.; AghaKouchak, A.; Nakhjiri, N.; Farahmand, A. Global integrated drought monitoring and prediction system. Sci. Data 2014, 1, 140001. [Google Scholar] [CrossRef]
- Brown, J.F.; Wardlow, B.D.; Tadesse, T.; Hayes, M.J.; Reed, B.C. The Vegetation Drought Response Index (VegDRI): A new integrated approach for monitoring drought stress in vegetation. GISci. Remote Sens. 2008, 45, 16–46. [Google Scholar] [CrossRef]
- Anderson, M.C.; Zolin, C.A.; Sentelhas, P.C.; Hain, C.R.; Semmens, K.; Yilmaz, M.T.; Gao, F.; Otkin, J.A.; Tetrault, R. The Evaporative Stress Index as an indicator of agricultural drought in Brazil: An assessment based on crop yield impacts. Remote Sens. Environ. 2016, 174, 82–99. [Google Scholar] [CrossRef]
- Zhang, X.; Chen, N.; Li, J.; Chen, Z.; Niyogi, D. Multi-sensor integrated framework and index for agricultural drought monitoring. Remote Sens. Environ. 2017, 188, 141–163. [Google Scholar] [CrossRef] [Green Version]
- AghaKouchak, A.; Farahmand, A.; Melton, F.S.; Teixeira, J.; Anderson, M.C.; Wardlow, B.D.; Hain, C.R. Remote sensing of drought: Progress, challenges and opportunities. Rev. Geophys. 2015, 53, 452–480. [Google Scholar] [CrossRef] [Green Version]
- Trenberth, K.E.; Dai, A.; Van Der Schrier, G.; Jones, P.D.; Barichivich, J.; Briffa, K.R.; Sheffield, J. Global warming and changes in drought. Nat. Clim. Chang. 2014, 4, 17–22. [Google Scholar] [CrossRef]
- Rubel, F.; Kottek, M. Observed and projected climate shifts 1901-2100 depicted by world maps of the Köppen-Geiger climate classification. Meteorol. Z. 2010, 19, 135. [Google Scholar] [CrossRef] [Green Version]
- Edwards, D.C. Characteristics of 20th Century Drought in the United States at Multiple Time Scales; Air Force Inst of Tech., Wright-Patterson AFB: Dayton, OH, USA, 1997. [Google Scholar]
- Sorooshian, S.; AghaKouchak, A.; Arkin, P.; Eylander, J.; Foufoula-Georgiou, E.; Harmon, R.; Hendrickx, J.M.H.; Imam, B.; Kuligowski, R.; Skahill, B. Advanced concepts on remote sensing of precipitation at multiple scales. Bull. Am. Meteorol. Soc. 2011, 92, 1353–1357. [Google Scholar] [CrossRef]
- Kummerow, C.; Hong, Y.; Olson, W.S.; Yang, S.; Adler, R.F.; McCollum, J.; Ferraro, R.; Petty, G.; Shin, D.-B.; Wilheit, T.T. The evolution of the Goddard Profiling Algorithm (GPROF) for rainfall estimation from passive microwave sensors. J. Appl. Meteorol. 2001, 40, 1801–1820. [Google Scholar] [CrossRef]
- Wei, L.; Jiang, S.; Ren, L.; Zhang, L.; Wang, M.; Duan, Z. Preliminary Utility of the Retrospective IMERG Precipitation Product for Large-Scale Drought Monitoring over Mainland China. Remote Sens. 2020, 12, 2993. [Google Scholar] [CrossRef]
- Xiao, S.; Xia, J.; Zou, L. Evaluation of multi-satellite precipitation products and their ability in capturing the characteristics of extreme climate events over the Yangtze River Basin, China. Water 2020, 12, 1179. [Google Scholar] [CrossRef] [Green Version]
- Guo, H.; Bao, A.; Liu, T.; Ndayisaba, F.; He, D.; Kurban, A.; De Maeyer, P. Meteorological drought analysis in the Lower Mekong Basin using satellite-based long-term CHIRPS product. Sustainability 2017, 9, 901. [Google Scholar] [CrossRef] [Green Version]
- Wu, W.; Li, Y.; Luo, X.; Zhang, Y.; Ji, X.; Li, X. Performance evaluation of the CHIRPS precipitation dataset and its utility in drought monitoring over Yunnan Province, China. Geomat. Nat. Hazards Risk 2019, 10, 2145–2162. [Google Scholar] [CrossRef] [Green Version]
- Bouaziz, M.; Medhioub, E.; Csaplovisc, E. A machine learning model for drought tracking and forecasting using remote precipitation data and a standardized precipitation index from arid regions. J. Arid Environ. 2021, 189, 104478. [Google Scholar] [CrossRef]
- De Brito, C.S.; da Silva, R.M.; Santos, C.A.G.; Neto, R.M.B.; Coelho, V.H.R. Monitoring meteorological drought in a semiarid region using two long-term satellite-estimated rainfall datasets: A case study of the Piranhas River basin, northeastern Brazil. Atmos. Res. 2021, 250, 105380. [Google Scholar] [CrossRef]
- Zhong, R.; Chen, X.; Lai, C.; Wang, Z.; Lian, Y.; Yu, H.; Wu, X. Drought monitoring utility of satellite-based precipitation products across mainland China. J. Hydrol. 2019, 568, 343–359. [Google Scholar] [CrossRef]
- Zambrano, F.; Wardlow, B.; Tadesse, T.; Lillo-Saavedra, M.; Lagos, O. Evaluating satellite-derived long-term historical precipitation datasets for drought monitoring in Chile. Atmos. Res. 2017, 186, 26–42. [Google Scholar] [CrossRef]
- Wei, L.; Jiang, S.; Ren, L.; Yuan, F.; Zhang, L. Performance of Two Long-Term Satellite-Based and GPCC 8.0 precipitation products for drought monitoring over the Yellow River Basin in China. Sustainability 2019, 11, 4969. [Google Scholar] [CrossRef] [Green Version]
- Prodhan, F.A.; Zhang, J.; Bai, Y.; Sharma, T.P.P.; Koju, U.A. Monitoring of Drought Condition and Risk in Bangladesh Combined Data From Satellite and Ground Meteorological Observations. IEEE Access 2020, 8, 93264–93282. [Google Scholar] [CrossRef]
- Rahman, K.U.; Shang, S.; Zohaib, M. Assessment of Merged Satellite Precipitation Datasets in Monitoring Meteorological Drought over Pakistan. Remote Sens. 2021, 13, 1662. [Google Scholar] [CrossRef]
- Suliman, A.H.A.; Awchi, T.A.; Al-Mola, M.; Shahid, S. Evaluation of remotely sensed precipitation sources for drought assessment in Semi-Arid Iraq. Atmos. Res. 2020, 242, 105007. [Google Scholar] [CrossRef]
- De Jesús, A.; Breña-Naranjo, J.A.; Pedrozo-Acuña, A.; Alcocer Yamanaka, V.H. The use of TRMM 3B42 product for drought monitoring in Mexico. Water 2016, 8, 325. [Google Scholar] [CrossRef]
- Jiang, S.; Ren, L.; Zhou, M.; Yong, B.; Zhang, Y.; Ma, M. Drought monitoring and reliability evaluation of the latest TMPA precipitation data in the Weihe River Basin, Northwest China. J. Arid Land 2017, 9, 256–269. [Google Scholar] [CrossRef] [Green Version]
- Zhu, Q.; Luo, Y.; Zhou, D.; Xu, Y.-P.; Wang, G.; Gao, H. Drought monitoring utility using satellite-based precipitation products over the Xiang River Basin in China. Remote Sens. 2019, 11, 1483. [Google Scholar] [CrossRef] [Green Version]
- Tao, H.; Fischer, T.; Zeng, Y.; Fraedrich, K. Evaluation of TRMM 3B43 precipitation data for drought monitoring in Jiangsu Province, China. Water 2016, 8, 221. [Google Scholar] [CrossRef] [Green Version]
- Tan, M.L.; Tan, K.C.; Chua, V.P.; Chan, N.W. Evaluation of TRMM product for monitoring drought in the Kelantan River Basin, Malaysia. Water 2017, 9, 57. [Google Scholar] [CrossRef] [Green Version]
- Zhao, Q.; Chen, Q.; Jiao, M.; Wu, P.; Gao, X.; Ma, M.; Hong, Y. The temporal-spatial characteristics of drought in the Loess Plateau using the remote-sensed TRMM precipitation data from 1998 to 2014. Remote Sens. 2018, 10, 838. [Google Scholar] [CrossRef] [Green Version]
- Yan, G.; Liu, Y.; Chen, X. Evaluating satellite-based precipitation products in monitoring drought events in southwest China. Int. J. Remote Sens. 2018, 39, 3186–3214. [Google Scholar] [CrossRef]
- Tan, M.L.; Chua, V.P.; Tan, K.C.; Brindha, K. Evaluation of TMPA 3B43 and NCEP-CFSR precipitation products in drought monitoring over Singapore. Int. J. Remote Sens. 2018, 39, 2089–2104. [Google Scholar] [CrossRef]
- Naumann, G.; Barbosa, P.; Carrao, H.; Singleton, A.; Vogt, J. Monitoring drought conditions and their uncertainties in Africa using TRMM data. J. Appl. Meteorol. Climatol. 2012, 51, 1867–1874. [Google Scholar] [CrossRef] [Green Version]
- Chen, S.; Zhang, L.; Zhang, Y.; Guo, M.; Liu, X. Evaluation of Tropical Rainfall Measuring Mission (TRMM) satellite precipitation products for drought monitoring over the middle and lower reaches of the Yangtze River Basin, China. J. Geogr. Sci. 2020, 30, 53–67. [Google Scholar] [CrossRef] [Green Version]
- Yan, N.; Wu, B.; Chang, S.; Bao, X. Evaluation of TRMM Precipitation Product for Meteorological Drought Monitoring in Hai Basin. IOP Conf. Ser. Earth Environ. Sci. 2014, 17, 12093. [Google Scholar] [CrossRef] [Green Version]
- Geleta, C.D.; Deressa, T.A. Evaluation of Climate Hazards Group InfraRed Precipitation Station (CHIRPS) satellite-based rainfall estimates over Finchaa and Neshe Watersheds, Ethiopia. Eng. Rep. 2021, 3, e12338. [Google Scholar]
- Gebremicael, T.G.; Mohamed, Y.A.; van der Zaag, P.; Berhe, A.G.; Haile, G.G.; Hagos, E.Y.; Hagos, M.K. Comparison and validation of eight satellite rainfall products over the rugged topography of Tekeze-Atbara Basin at different spatial and temporal scales. Hydrol. Earth Syst. Sci. Discuss. 2017. [Google Scholar] [CrossRef] [Green Version]
- Wu, H.; Hayes, M.J.; Wilhite, D.A.; Svoboda, M.D. The effect of the length of record on the standardized precipitation index calculation. Int. J. Climatol. J. R. Meteorol. Soc. 2005, 25, 505–520. [Google Scholar] [CrossRef] [Green Version]
- Lu, J.; Jia, L.; Menenti, M.; Yan, Y.; Zheng, C.; Zhou, J. Performance of the standardized precipitation index based on the TMPA and CMORPH precipitation products for drought monitoring in China. IEEE J. Sel. Top. Appl. Earth Obs. Remote Sens. 2018, 11, 1387–1396. [Google Scholar] [CrossRef]
- Mohammed, S.A.; Hamouda, M.A.; Mahmoud, M.T.; Mohamed, M.M. Performance of GPM-IMERG precipitation products under diverse topographical features and multiple-intensity rainfall in an arid region. Hydrol. Earth Syst. Sci. Discuss. 2020. [Google Scholar] [CrossRef] [Green Version]
- Rahman, K.U.; Shang, S.; Shahid, M.; Li, J. Developing an ensemble precipitation algorithm from satellite products and its topographical and seasonal evaluations over Pakistan. Remote Sens. 2018, 10, 1835. [Google Scholar] [CrossRef] [Green Version]
- Bai, X.; Wu, X.; Wang, P. Blending long-term satellite-based precipitation data with gauge observations for drought monitoring: Considering effects of different gauge densities. J. Hydrol. 2019, 577, 124007. [Google Scholar] [CrossRef]
- Lin, P.; Pan, M.; Allen, G.H.; de Frasson, R.P.; Zeng, Z.; Yamazaki, D.; Wood, E.F. Global estimates of reach-level bankfull river width leveraging big data geospatial analysis. Geophys. Res. Lett. 2020, 47, e2019GL086405. [Google Scholar] [CrossRef]
- Lin, A.; Wang, X.L. An algorithm for blending multiple satellite precipitation estimates with in situ precipitation measurements in Canada. J. Geophys. Res. Atmos. 2011, 116. [Google Scholar] [CrossRef] [Green Version]
- Jin, B.; Wu, Y.; Miao, B.; Wang, X.L.; Guo, P. Bayesian spatiotemporal modeling for blending in situ observations with satellite precipitation estimates. J. Geophys. Res. Atmos. 2014, 119, 1806–1819. [Google Scholar] [CrossRef]
- Das, P.; Naganna, S.R.; Deka, P.C.; Pushparaj, J. Hybrid wavelet packet machine learning approaches for drought modeling. Environ. Earth Sci. 2020, 79, 221. [Google Scholar] [CrossRef]
- Saber, M.; Yilmaz, K.K. Evaluation and bias correction of satellite-based rainfall estimates for modelling flash floods over the Mediterranean region: Application to Karpuz River Basin, Turkey. Water 2018, 10, 657. [Google Scholar] [CrossRef] [Green Version]
- Habib, E.; Haile, A.T.; Sazib, N.; Zhang, Y.; Rientjes, T. Effect of bias correction of satellite-rainfall estimates on runoff simulations at the source of the Upper Blue Nile. Remote Sens. 2014, 6, 6688–6708. [Google Scholar] [CrossRef] [Green Version]
- Katiraie-Boroujerdy, P.-S.; Rahnamay Naeini, M.; Akbari Asanjan, A.; Chavoshian, A.; Hsu, K.; Sorooshian, S. Bias Correction of Satellite-Based Precipitation Estimations Using Quantile Mapping Approach in Different Climate Regions of Iran. Remote Sens. 2020, 12, 2102. [Google Scholar] [CrossRef]
- Sohn, B.J.; Han, H.-J.; Seo, E.-K. Validation of satellite-based high-resolution rainfall products over the Korean Peninsula using data from a dense rain gauge network. J. Appl. Meteorol. Climatol. 2010, 49, 701–714. [Google Scholar] [CrossRef]
- Maggioni, V.; Massari, C. On the performance of satellite precipitation products in riverine flood modeling: A review. J. Hydrol. 2018, 558, 214–224. [Google Scholar] [CrossRef]
- Serrat-Capdevila, A.; Valdes, J.B.; Stakhiv, E.Z. Water management applications for satellite precipitation products: Synthesis and recommendations. JAWRA J. Am. Water Resour. Assoc. 2014, 50, 509–525. [Google Scholar] [CrossRef]


| SPI Value | Classification |
|---|---|
| >2 | Extremely wet |
| 1.50 to 1.99 | Very Wet |
| 1.00 to 1.49 | Moderately wet |
| −0.99 to 0.99 | Near Normal |
| −1.0 to −1.49 | Moderately dry |
| −1.5 to −1.99 | Severely dry |
| <−2.0 | Extremely dry |
| Reference | Country | Analyzed Period | SPP Type | Time Scale | SPI In Situ vs. SPI with SPP | |
|---|---|---|---|---|---|---|
| PCC | RMSE | |||||
| [23] | India | 1998–2016 | CHIRPS | SPI 3 | 0.87 | NA |
| [47] | China | 1981–2016 | CHIRPS | SPI 1,3,6,12 | 0.85–0.89 | 0.34–0.39 |
| [48] | China | 1981–2015 | CHIRPS | SPI 1,3,6,12 | 0.92–0.94 | NA |
| [4] | Nepal | 1981–2010 | CHIRPS | SPI 1 | 0.57 | NA |
| [3] | China | 1981–2015 | CHIRPS | SPI 3,6 | 0.84–0.89 | NA |
| [49] | Tunisia | 1981–2019 | CHIRPS | SPI 12 | 0.85 | 0.443 |
| [50] | Brazil | 1994–2017 | CHIRPS | SPI 6,12 | 0.85–0.94 | 0.33–0.54 |
| [51] | China | 1983–2015 | CHIRPS | SPI 3 | 0.89–0.92 | 0.23–0.33 |
| [52] | Chile | 1981–2015 | CHIRPS | SPI 3,6 | 0.63–1.13 | |
| [53] | China | 1983–2016 | CHIRPS | SPI 1,3,12 | 0.84–0.89 | 0.25–0.28 |
| [54] | Bangladesh | 2001–2016 | CHIRPS | SPI 3,6 | 0.90 | 0.43–0.44 |
| [46] | China | 2003–2017 | CHIRPS | SPI 1,3,6,12 | 0.85–0.94 | NA |
| [23] | India | 1998–2016 | PERSIANN CDR | SPI 3 | 0.88 | NA |
| [27] | China | 1983–2014 | PERSIANN CDR | SPI 6 | 0.4–0.9 | NA |
| [51] | China | 1983–2015 | PERSIANN CDR | SPI 3 | 0.94–0.97 | 0.18–2.8 |
| [50] | Brazil | 1994–2017 | PERSIANN CDR | SPI 6,12 | 0.94–0.96 | 0.29–0.35 |
| [25] | Iran | 1983–2012 | PERSIANN CDR | SPI 3,6,12 | 0.27–0.80 | 0.62–1.05 |
| [53] | China | 1983–2016 | PERSIANN CDR | SPI 1,3,12 | 0.95–0.96 | 0.15–0.18 |
| [46] | China | 2003–2017 | PERSIANN CDR | SPI 1,3,6,12 | 0.85–0.95 | NA |
| [55] | Pakistan | 2000–2015 | PERSIANN CDR | SPI 1,3,12 | NA | 1.29–1.73 |
| [54] | Bangladesh | 2001–2016 | PERSIANN CDR | SPI 3,6 | 0.90–0.91 | 0.43 |
| [52] | Chile | 1983–2015 | PERSIANN CDR | SPI 3,6 | NA | 0.63–1.06 |
| [56] | Iraq | 1983–2016 | PERSIANN CDR | SPI 3,6,12 | 0.28–0.70 | −0.49–0.46 |
| References | Country | Analyzed Period | SPP Type | Time Scale | SPI In Situ vs. SPI with SPP | |
|---|---|---|---|---|---|---|
| PCC | RMSE | |||||
| [57] | Mexico | 1998–2014 | TRMM-3B42 V7 | SPI 1,3,6,12 | 0.06–0.79 | NA |
| [58] | China | 1998–2013 | TRMM-3B42 V7 | SPI 3,6,12 | 0.92–0.97 | NA |
| [59] | China | 2015–2017 | TRMM-3B42 V7 | SPI 1,3,6,12 | 0.23–0.84 | 0.39–0.56 |
| [46] | China | 2003–2017 | TRMM-3B42 V7 | SPI 1,3,6,12 | 0.64–0.84 | NA |
| [55] | Pakistan | 2000–2015 | TRMM-3B42 V7 | SPI 1,3,12 | NA | 1.10–1.76 |
| [23] | India | 1998–2016 | TRMM-3B43 V7 | SPI 3 | 0.88 | NA |
| [56] | Iraq | 1998–2017 | TRMM-3B43 V7 | SPI 3,6,12 | 0.32–0.90 | 0.21–0.60 |
| [60] | China | 1998–2014 | TRMM-3B43 V7 | SPI 3,6,12 | 0.92–0.98 | NA |
| [61] | Malaysia | 1998–2014 | TRMM-3B43 V7 | SPI 3,6,12 | 0.42–0.49 | NA |
| [62] | China | 1998–2014 | TRMM-3B43 V7 | SPI 3,12 | 0.89–0.91 | NA |
| [63] | China | 1998–2013 | TRMM-3B43 V7 | SPI 1,3,6,12 | 0.98–0.99 | NA |
| [64] | Singapore | 1998–2014 | TRMM-3B43 V7 | SPI 1,3,6,12 | 0.76–0.80 | 0.63–0.69 |
| [65] | Africa | 1998–2010 | TRMM-3B43 V7 | SPI 3 | 0.51–0.82 | NA |
| [66] | China | 1998–2016 | TRMM-3B43 V7 | SPI 1,3,6,12 | 0.96–0.98 | NA |
| [54] | Bangladesh | 2001–2016 | TRMM-3B43 V7 | SPI 3,6 | 0.90 | 0.41–0.42 |
| [67] | China | 1998–2010 | TRMM-3B43 V7 | SPI 3 | 0.93 | NA |
| References | Country | Analyzed Period | SPP Type | Time Scale | SPI In Situ vs. SPI with SPP | |
|---|---|---|---|---|---|---|
| PCC | RMSE | |||||
| [46] | China | 2003–2017 | IMERG | SPI 1,3,6,12 | 0.96–0.99 | NA |
| [45] | China | 2000–2017 | IMERG | SPI 6 | 0.96–0.99 | 0.05–0.07 |
| [55] | Pakistan | 2000–2015 | IMERG | SPI 1,2 12 | NA | 1.12–1.63 |
| [46] | China | 2003–2017 | CMORPH | SPI 1,3,6,12 | 0.92–0.98 | NA |
| [59] | China | 2015–2017 | CMORPH | SPI 1,3,6,12 | 0.84–0.93 | 0.15–0.56 |
Publisher’s Note: MDPI stays neutral with regard to jurisdictional claims in published maps and institutional affiliations. |
© 2021 by the authors. Licensee MDPI, Basel, Switzerland. This article is an open access article distributed under the terms and conditions of the Creative Commons Attribution (CC BY) license (https://creativecommons.org/licenses/by/4.0/).
Share and Cite
Hinge, G.; Mohamed, M.M.; Long, D.; Hamouda, M.A. Meta-Analysis in Using Satellite Precipitation Products for Drought Monitoring: Lessons Learnt and Way Forward. Remote Sens. 2021, 13, 4353. https://doi.org/10.3390/rs13214353
Hinge G, Mohamed MM, Long D, Hamouda MA. Meta-Analysis in Using Satellite Precipitation Products for Drought Monitoring: Lessons Learnt and Way Forward. Remote Sensing. 2021; 13(21):4353. https://doi.org/10.3390/rs13214353
Chicago/Turabian StyleHinge, Gilbert, Mohamed M. Mohamed, Di Long, and Mohamed A. Hamouda. 2021. "Meta-Analysis in Using Satellite Precipitation Products for Drought Monitoring: Lessons Learnt and Way Forward" Remote Sensing 13, no. 21: 4353. https://doi.org/10.3390/rs13214353
APA StyleHinge, G., Mohamed, M. M., Long, D., & Hamouda, M. A. (2021). Meta-Analysis in Using Satellite Precipitation Products for Drought Monitoring: Lessons Learnt and Way Forward. Remote Sensing, 13(21), 4353. https://doi.org/10.3390/rs13214353