Abstract
Nearshore bathymetric data are used in many coastal monitoring applications, but acquisition conditions can be challenging. Shipborne surveys are prone to the risk of grounding in shallow waters, and scheduled airborne surveys often fail to coincide with optimal atmospheric and water conditions. As an alternative, since its launch in 2018, ICESat-2 satellite laser profile altimetry data provide free and readily available data on a 91-day repeat cycle, which may contain incidental bathymetric returns when suitable environmental conditions prevail. In this paper, the vertical accuracy of extracted, refraction-adjusted ICESat-2 nearshore marine bathymetric data is evaluated at four test sites in a Northern hemisphere, temperate latitude location. Multiple ICEsat-2 bathymetric values that occurred in close horizontal proximity to one another were averaged at a spatial scale of 1 m and compared with Multibeam Echosounder bathymetric survey data and Global Navigation Satellite System reference data. Mean absolute errors of less than 0.15 m were observed up to depths of 5 m, with errors of less than 0.24 m (to 6 m), 0.39 m (to 7 m) and 0.52 m (to 10 m). The occurrence of larger bathymetric errors with depth, which increase to 0.54 m at maximum photon depths of 11 m, appears to be primarily related to reduced numbers of geolocated photons with depth. The accuracies achieved up to 6 m suggest that the manual extraction, refraction adjustment and bathymetric filtering steps were effective. Overall, the results suggest that ICESat-2 bathymetric data accuracy may be sufficient to be considered for use in nearshore coastal monitoring applications where shipborne and airborne bathymetric data might otherwise be applied.
1. Introduction
Accurate nearshore bathymetric data are required in many coastal monitoring applications. However, nearshore airborne bathymetric surveying is often challenged by environmental factors that can hinder bathymetric data acquisition, leading to incomplete bathymetric mapping coverage [1]. For example, Multibeam Echosounder (MBES) bathymetric surveys are typically limited to depths of more than 10 m in order to minimise the risk of survey vessels running aground and to optimise the sonar beam swath width [2,3]. Airborne LiDAR Bathymetry (ALB) can typically produce bathymetric accuracies of 0.3 m for 95% of soundings to depths of approximately 30 m [4,5,6,7]. However, nearshore ALB bathymetric laser reflection is often constrained by water column turbidity [8], water surface perturbation or breaking waves at data acquisition time [9]. Satellite optical imaging offers the opportunity to choose optimal imagery from multiple orbits, facilitating bathymetric mapping using empirical [10,11,12] and model inversion approaches [13,14]. However, these are typically characterised by lower accuracies than MBES and ALB bathymetric surveys [4,5,6,7], achieving between 0.5 and 1 m RMSE for depths of 10 m [15]. An alternative data source that has become recently available is Ice, Cloud and land Elevation Satellite-2 (ICESat-2) data. The ICESat-2 laser altimeter satellite instrument acquires laser data on a 91-day repeat cycle [16] and it appears to offer potential as a source of useful nearshore bathymetric profile data in tropical waters [17] and lakes [18]. Its potential in a mid-latitude temperate context is considered here.
The ICESat-2 was launched by the National Aeronautics and Space Administration in September 2018 [19]. Its primary operational aim is the provision of global satellite Light Detection and Ranging (LiDAR) profile data for the quantification of elevation changes in land ice, sea ice and global vegetation canopies [16]. ICESat-2 utilises a 532 nm wavelength (green) laser, operating at a pulse repetition frequency of 10,000 Hz. Consequently, it possesses an incidental capacity to detect bathymetry [20] when atmospheric and water conditions permit [17,18].
Furthermore, the manner in which the ICESat-2 laser returns are captured offers the potential for multiple geolocated photons per metre in shallow water. The Advanced Topographic Laser Altimeter System (ATLAS) onboard the ICEsat-2 defines the geolocation (elevation and geographic position) of individual reflected photons using a photon-counting telescope [19]. Multiple reflected photons are therefore typically geolocated from each laser pulse footprint. The details regarding how photon geolocation is implemented are addressed in detail elsewhere [16,17,18,19,20,21,22]. However, in simplified terms, the individual latitude, longitude and ellipsoidal height of each geolocated photon are defined within the ATLAS instrument by combining laser pointing vectors, pulse emission timing and round-trip photon time of flight, along with data on the ICESat-2 platform position, orientation, attitude and orbital velocity [16].
A proportion of these geolocated photons may be reflected from the seabed [17,18] and these may potentially provide sufficient bathymetric accuracy to be useful in some coastal monitoring applications. Within raw ICESat-2 data, bathymetric photons are affected by water column refraction, which results in an overestimation of depth and a horizontal offset [17]. Parrish et al. [17] extracted bathymetric returns from subtropical ICESat-2 marine geolocated photon data by developing and applying a mathematical refraction adjustment strategy that accounts for the bathymetric overestimation error. They also observe a small angular refractive component, which results in a maximum horizontal error of up to 0.09 m at the maximum depth of 30 m [17]. However, the maximum depths in which the ICESat-2 is useful in our study area are just a little more than one-third of this depth, so the horizontal component is not considered here. The authors of [17] subsequently compare ICESat-2 bathymetric accuracy with co-located ALB data, observing bathymetric residuals of less than 0.6 m root mean square error (RMSE) in subtropical marine depths to 30 m. This is reasonably close to the 0.3 m accuracies that may be achieved using ALB [4,5,6,7], which suggests that ICESat-2 might be useful in circumstances where ALB data or shipborne Multibeam data are unavailable.
To date, assessments of ICEsat-2 bathymetric accuracy [17,18] have reported errors across the full depth range for which data are available. This study assesses ICESat-2 marine bathymetric data accuracy across a range of depths, in a temperate latitude marine context where water clarity may be suboptimal for bathymetric laser penetration. Bathymetric accuracy is quantified relative to nearshore high-accuracy MBES bathymetric data and low-tide intertidal Global Navigation Satellite System (GNSS) data. ICESat-2 bathymetric accuracy is evaluated at the maximum depth range, at successive depth ranges and within discrete depth bands, at four test sites (Figure 1).

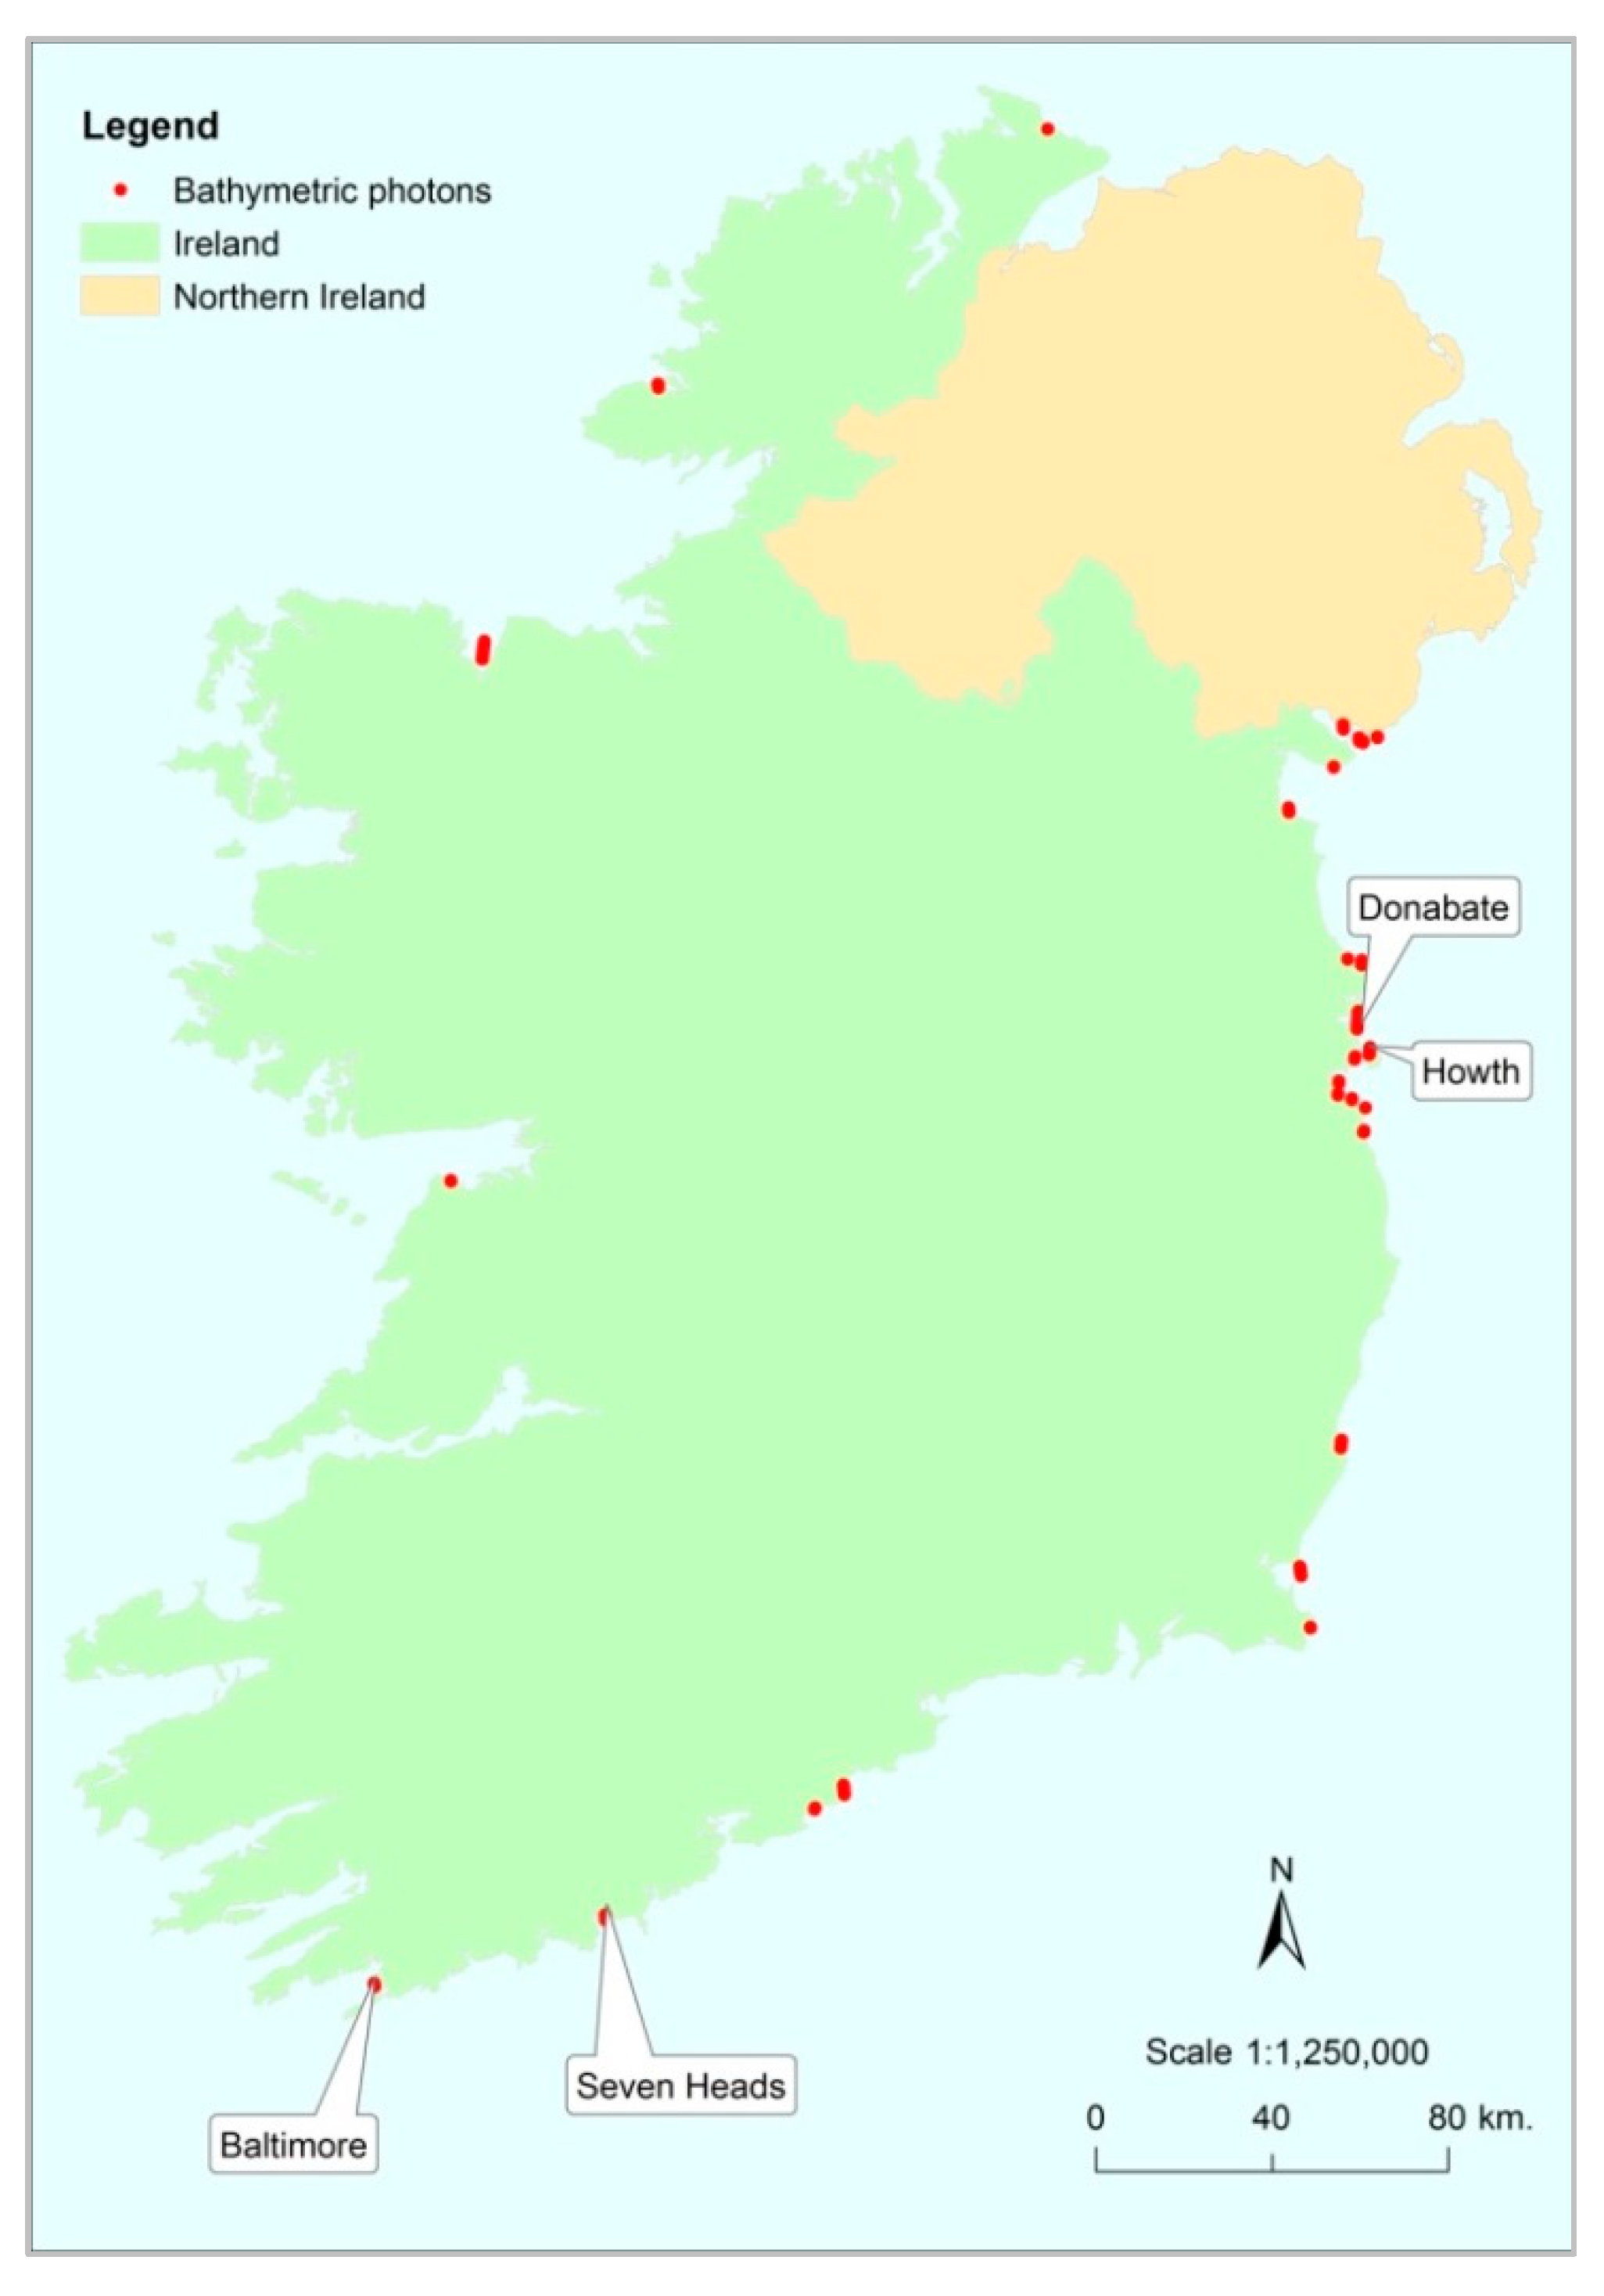
Figure 1.
Location map of all 28 ICESat-2 profiles that contained extractable bathymetric photons (to May 2021), with all four accuracy test sites labelled by site location name.
In summary, the principal aims of this paper are:
- To evaluate ICESat-2 marine bathymetric performance in a mid-latitude temperate context;
- To assess accuracy at a range of depths, using external bathymetric reference data;
- To describe an ICESat-2 bathymetric data processing chain that may be of interest to prospective users of ICESat-2 bathymetric data.
2. Materials and Methods
2.1. Materials
2.1.1. ICESat-2 Data: Coverage
The ATLAS instrument onboard the ICESat-2 satellite acquires profile data from a polar orbiting altitude of 500 km (310 miles), completing 1387 unique global orbits (separated by 28.8 km at the equator) every 91 days [20]. Each laser pulse that is issued from ATLAS is split into six sub-beams that are grouped in three beam pairs. The beams within each pair are separated by 90 m, each beam pair being offset from adjacent pairs by a distance of 3.3 km across track at the equator [19]. The data gaps between the outermost pairs of beams from adjacent orbits are approximately 22.2 km at the equator [19], converging at the poles. The ICESat-2 also possesses an off-track pointing capability that can be implemented on demand to perform profile acquisition at 3.6 km increments off-nadir, up to a maximum of 10.8 km at either side of nadir at the equator [19]. Therefore, ICESat-2 profile data may be available at intervals of between 3.3 km and less than 20 km in mid-latitudes.
2.1.2. ICESat-2 Data: Geolocated Photon Sampling Density
Of the approximately 300 trillion laser photons that are issued within each ICESat-2 laser pulse [20], up to 12 are reflected and counted [16] from each laser pulse ground footprint. Each sequential ICESat-2 laser pulse is located only 0.7 m down-track from the preceding pulse [23]. Consequently, many more than 12 geolocated photons typically occur in any 17 m along-track section of an ICESat-2 profile at the ground surface. A maximum of 15 geolocated photons were observed per metre in water depths less than 1 m at one of our accuracy test sites. However, it is important to stress that water surface perturbations and breaking waves [9] and water column turbidity [8] can limit laser penetration of the water column. Therefore, some sections of marine profiles in may contain no geolocated photons at all.
2.1.3. MBES Bathymetric Reference Data
High-accuracy, shallow-water (less than 10 m) bathymetric MBES data were used to determine the relative accuracy of ICESat-2 bathymetric data. The MBES survey data were acquired from the shallow-water GSI Research Vessel R.V. Geo’ as part of the Irish Integrated Mapping for the Sustainable Development of Ireland’s Marine Resource (INFOMAR) programme in July 2017 as part of operational seabed mapping within INFOMAR [1]. Bathymetric corrections were applied to the MBES survey data by INFOMAR in CARIS HIPS, initially reducing the bathymetric value data to lowest astronomical tide (LAT) values, which were subsequently transformed to ellipsoidal heights using the Vertical Offshore Reference Framework (VORF). VORF provides a high-resolution digital model of all the reference surfaces (LAT, onshore datums and ellipsoid) for Britain and Ireland, and a software package that allows for conversion between them [24]. Depth error uncertainty in the processed MBES data was quantified at less than 0.10 m to depths of 10 m [25].
Two ICESat-2 bathymetric data profiles, located near Baltimore (Site 1) and Seven Heads (Site 2) in southwest Ireland (Figure 1) presented partial spatial overlaps with the MBES data, presenting opportunities for accuracy assessment. These MBES data sets are characterised by horizontal spatial resolutions of 1 m (Site 1 MBES data) and 5 m (Site 2 MBES data). Comparisons of ICESat-2 and MBES values were limited to ICEat-2 and MBES data points that were separated by a maximum horizontal separation of less than 1 m at the Baltimore test site, and a maximum horizontal separation of less than 2.5 m at the Seven Heads test site. It is important to note that the southwest coast of Ireland is typified by a sandy/rocky seabed and reasonably clear water conditions [26]. Consequently, these southwestern ICESat-2 profiles were characterised by deeper bathymetric penetration than two further test sites, which were located (Figure 1) in the typically more turbid waters of the east coast.
2.1.4. GNSS Bathymetric Reference Data
The two east coast ICESat-2 bathymetric data profiles, located (Figure 1) near Howth (Site 3) and Donabate (Site 4) were characterised by multiple bathymetric geolocated photons per metre down to water depths of between 4 m and 5 m. However, these ICESat-2 bathymetric profiles did not spatially overlap with existing MBES data or any other bathymetric survey data. Therefore, GNSS reference data were acquired (July 2021) by walking the bathymetric sections of the ICESat-2 profile tracks during a very low tide.
The GNSS elevation survey transects were obtained using a Trimble R4 system. Measurements were taken at regular 1-m intervals using the Trimble VRS Now™ acquisition mode. VRS Now™ provides instant access to real-time kinematic (RTK) corrections utilizing a network of permanent (fixed) continuously operating reference stations [27]. Positional (X,Y) and ellipsoidal metres elevation (Z) accuracies were all less than 0.02 m. Therefore, the GNSS data were considered to be absolute reference elevation values for the purpose of comparison with the extracted ICESat-2 bathymetric data.
2.2. Methods
2.2.1. ICESat-2: Geolocated Photon Data Download Access
The ICESat-2 data used in this study were downloaded as comma separated values (csv) text files from the OpenAltimetry ICESat-2 data portal [28]. These data ranged in dates from October 2018 to May 2021. It is important to emphasise that terrestrial, water surface and bathymetric geolocated photons are not differentiated within the ICESat-2 geolocated photon cloud. However, candidate profiles for a selected region of interest may be viewed as photon cloud plots in the side view within the OpenAltimetry portal, visually checking for the presence of bathymetric returns before a geolocated photon cloud is downloaded. A review of all available marine profiles in the 2018–2021 date range presented 28 ICESat-2 profiles that contained some discernible nearshore bathymetric data on the Irish coast (Figure 1). The great majority of nearshore marine profiles (perhaps of the order of 95%) contained no coherent bathymetric data.
2.2.2. ICESat-2 Bathymetric Extraction
Due to the conflation of non-bathymetric geolocated photons, some data processing was required in order to extract bathymetric geolocated photon data. At the time of writing, no automatic method is available to extract bathymetric photons from ICESat-2 geolocated photon cloud data. Consequently, a semi-manual method was applied, employing existing simple geoprocessing methods that are available within many commercial and open-source geospatial analysis software packages. Bathymetric extraction involved the following steps:
- Filtering geolocated photons by ICESat-2 signal-to-noise Ratio class;
- Applying a temporary 3D rotation to the 3D geolocated photon cloud;
- Conducting manual bathymetric extraction using a 2D geometric query;
- Applying a bathymetric averaging filter to remove near-duplicate values.
- 1.
- Manual Bathymetric Extraction: Filtering by SNR Class
The ATLAS system onboard ICESat-2 classifies geolocated photons by a signal-to-noise ratio [16]. This SNR classification is contained within the .csv data downloadable from the OpenAltimetry portal [28]. Probable solar background photons are typified by SNR scores of zero and possible background solar reflection photons are largely contained within SNR classes 1 and 2. SNR classes 3 and 4 predominantly correspond with undifferentiated geolocated photons that have been reflected from terrestrial features, water surfaces and bathymetric features [23]. SNR classes 0, 1 and 2 (Figure 2a) may be segregated and removed using any software package that has a table sorting, filtering or structured query language (SQL) capability, retaining the undifferentiated geolocated photons that correspond with terrestrial, water and bathymetric feature surfaces.

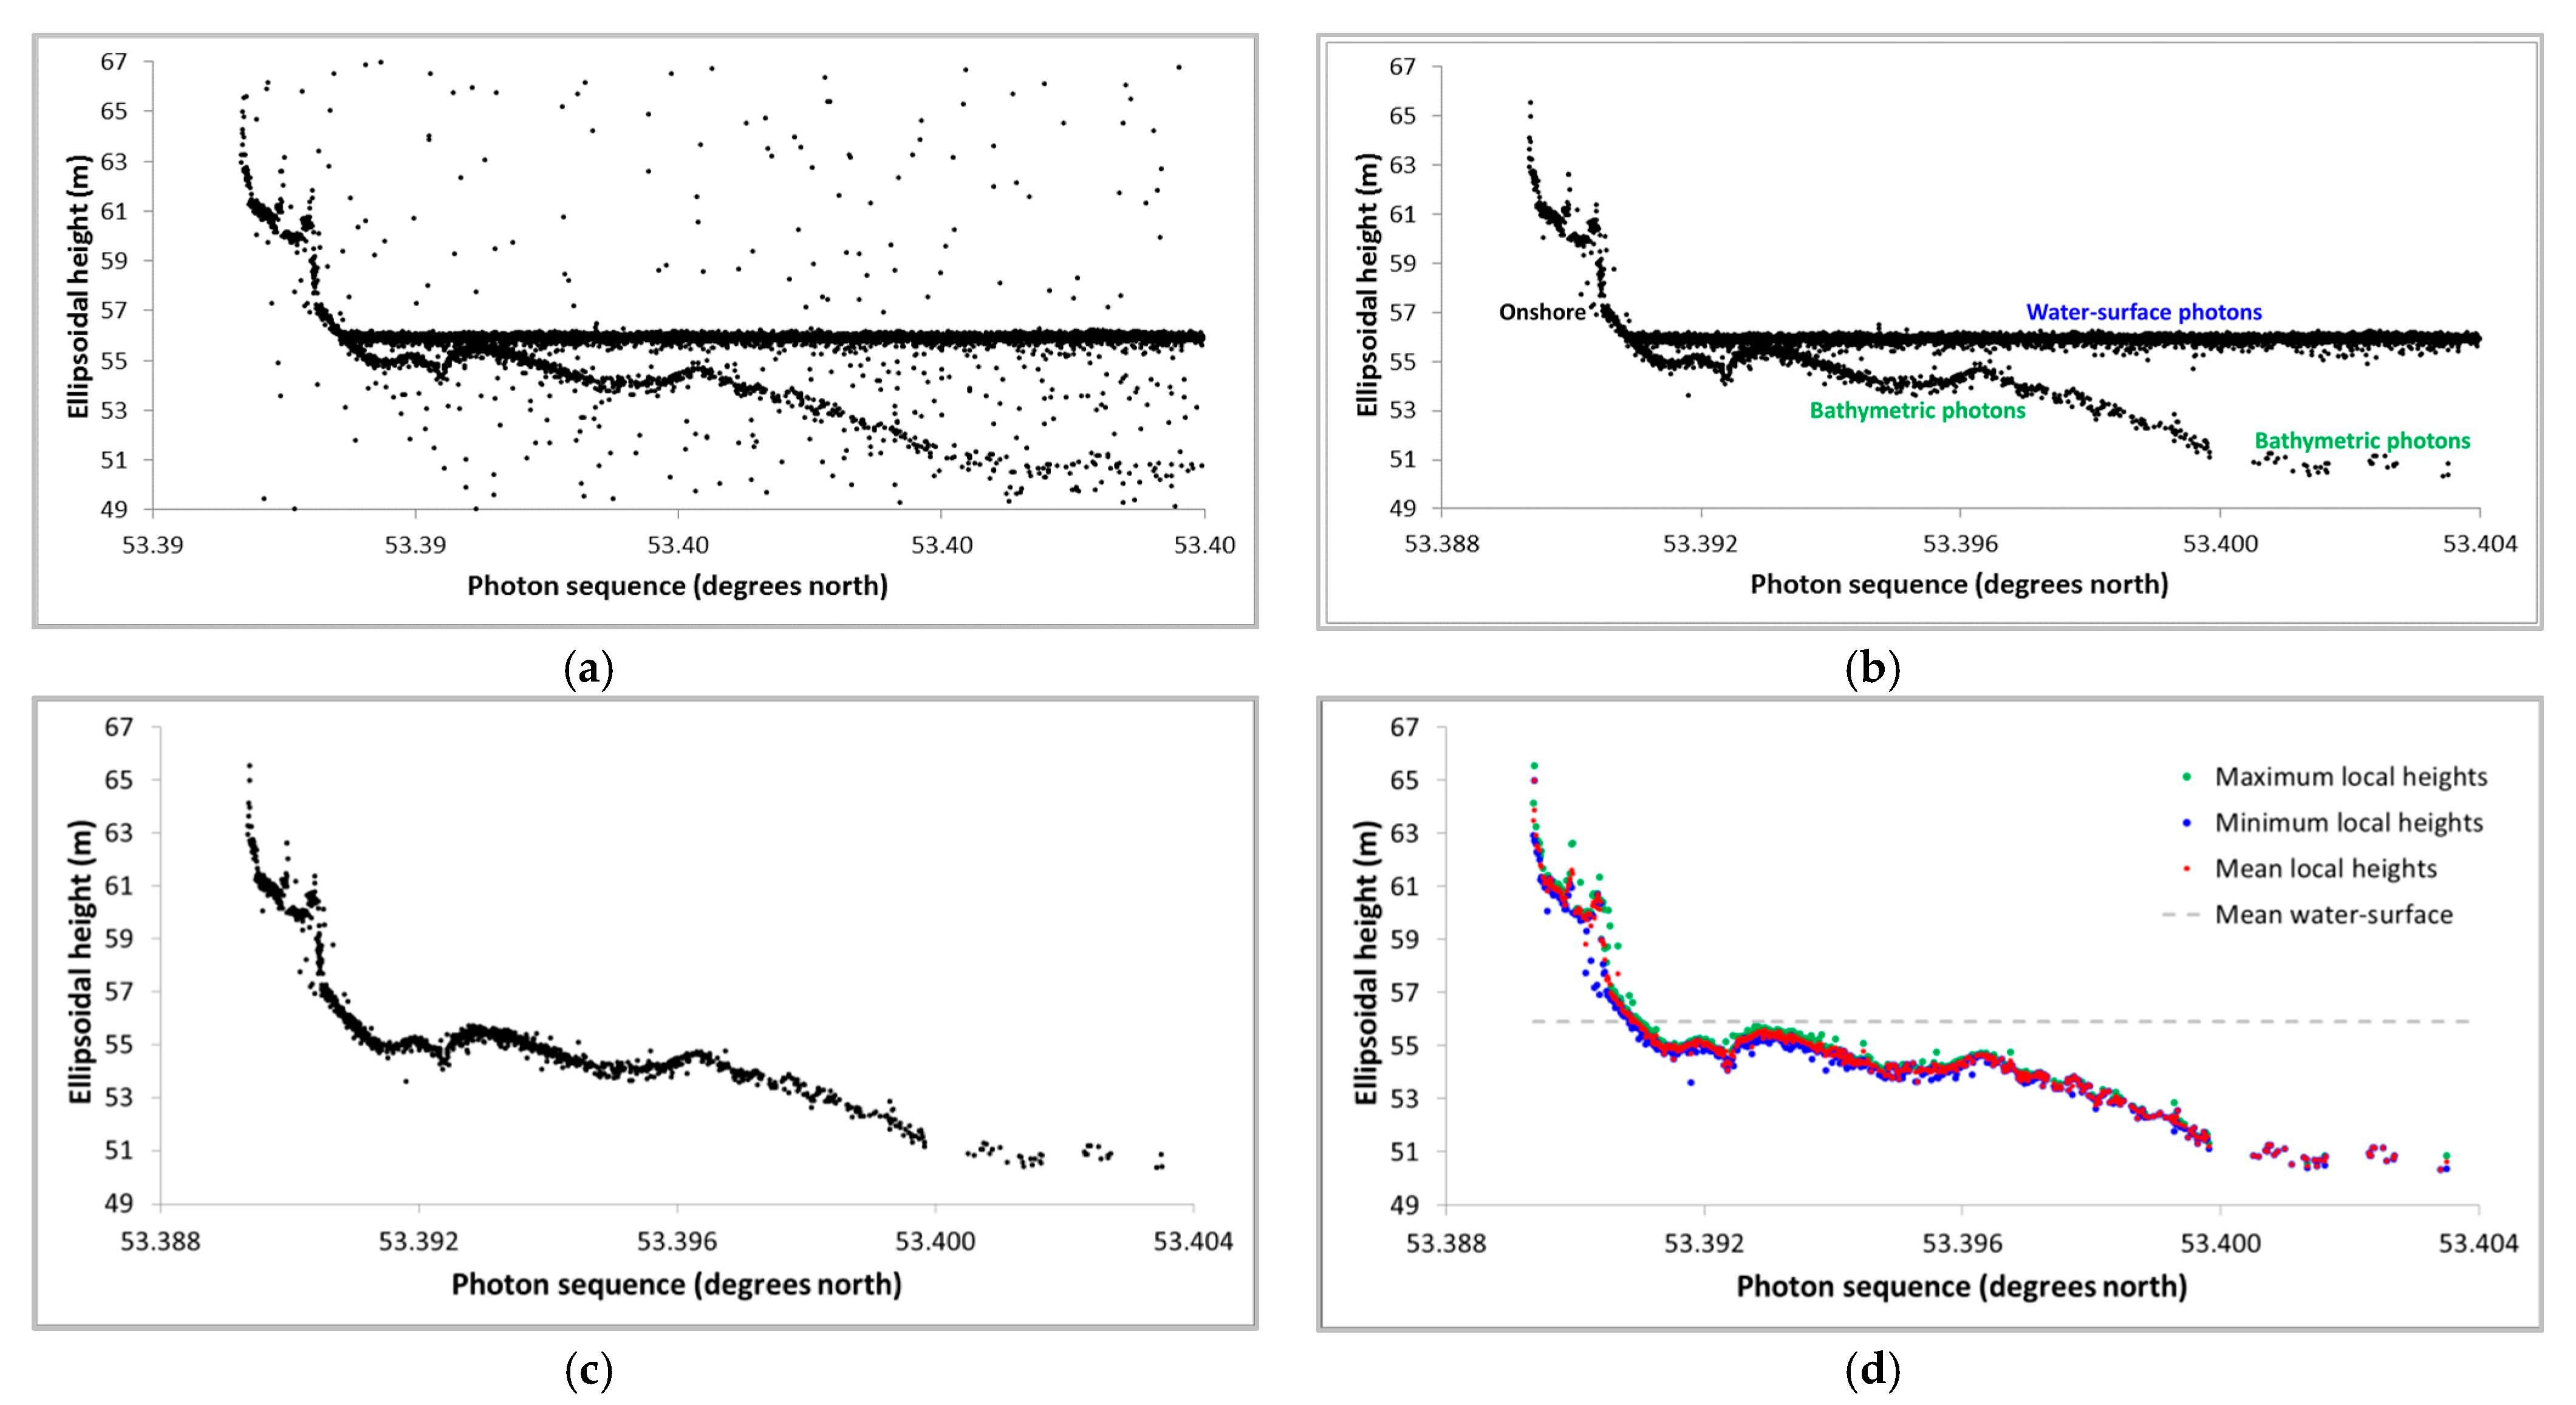
Figure 2.
(a) Cross-sectional view of an unfiltered geolocated photon cloud from Site 3 on the east coast of Ireland, showing bathymetric, water surface and onshore geolocated photons in addition to background geolocated photons. (b) High-SNR geolocated photon classes (SNR classes 3 and 4) only, (c) unfiltered photons extracted by visually interpreted bounding polygon at Site 3, and (d) mean filtered ICESat-2 points and maximum and minimum photons.
- 2.
- Manual Bathymetric Extraction: Temporary 3D Rotation
A 3D coordinate rotation was applied to the SNR-filtered photon cloud to prepare it for bathymetric extraction. This temporary process (the latitude longitude coordinates were retained) standardised the horizontal geographic coordinates of all geolocated photons to the same units (metres) as the photon ellipsoidal heights. The 3D rotation was implemented simply by mapping the along-track northings coordinates (metres) and the photon heights (metres above ellipsoid) to a 2D plane in ArcGIS 10.x. The same procedure may be applied using the basic point-mapping functionality of any commonly used geospatial mapping software package.
- 3.
- Manual Bathymetric Extraction: 2D geometric query
Bathymetric photons were extracted from the 3D-rotated photon cloud by encapsulating the points with a user-defined 2D geometric query polygon that enclosed (by visual interpretation) only the bathymetric points (Figure 2c). This offered flexibility in shallow-water situations where water surface, water column and bathymetric geolocated photons were often partially spatially conflated (Figure 2b). The process was undertaken using ArcGIS 10.x but may be conducted in any one of several commonly used commercial or open-source geospatial analysis packages. The bathymetric geolocated photons were then retained as a new bathymetric-only text (csv) file for post-extraction filtering.
- 4.
- Post-Extraction Point Local Filtering
An xy local bathymetric mean filter was subsequently implemented in Python 3.x to reduce bathymetric variability in the common situation where multiple bathymetrically similar geolocated photons occurred at the same xy location (Figure 2d). The filter traverses the extracted section of a profile, temporarily grouping photons that are separated by a horizontal distance of 1 metre of one another, calculating a mean bathymetric value within each 1-m photon group. The horizontal position coordinates of the single filtered ICESat-2 bathymetric value from each 1-m radius grouping are rounded to the median metre value within each photon group.
2.2.3. ICESat-2 Bathymetric (Water Column) Refraction Error Adjustment
Due to the primary focus of ICESat-2 being ice and vegetation surfaces [20], any bathymetric data that incidentally occur within an ICESat-2 profile will be subject to inherent depth overestimation errors that derive from water refractive index being greater than 1 [17]. Parrish et al. [17] discuss this refraction error in detail, developing and applying a refraction adjustment factor that accounts for this inherent overestimation of depth in ocean water [17]. In simplified terms, this overestimation error is proportional to depth in a linear sense. The basic operation of the refraction adjustment is to apply a proportional adjustment, where the uncorrected ellipsoidal height of a bathymetric geolocated photon overestimates the actual depth by a factor of 0.25416 for a saltwater refractive index of 1.341 [17]. This adjustment factor was applied to bathymetric data extracted from four accuracy testing sites (Figure 1).
2.2.4. Conducting the Refraction Adjustment
Adjusting for water surface refraction error begins with the determination of local refraction-affected depth. Our implementation of the Parrish et al. [17] refraction adjustment quantifies local vertical water column (raw) depth by determining the vertical ellipsoidal height difference between the bathymetric geolocated photons and their vertical neighbour geolocated photons at the water surface. Water surface photons are extracted separately, using the same extraction procedure that was applied to the bathymetric points.
The unadjusted (refraction-affected) depth of each bathymetric geolocated photon (bz) may be expressed as the vertical height difference between it and the water surface (wz). In order to account for depth variations due to surface swell and wind-driven waves, the local (unadjusted) depth is defined relative to a (10 point) along-track moving average applied to the extracted water surface photons (wz). Applying the Parrish et al. [17] refraction adjustment factor (DF) to this vertical height difference, the refraction-adjusted water depth (Dra) may be expressed as is outlined in Equation (1).
Dra = (wz − bz)/(1 + DF)
The refraction-adjusted depths are used to adjust the raw bathymetric ellipsoidal height values, resulting in a new set of refraction-adjusted ICESat-2 bathymetric data at each of the four accuracy test locations. It should be noted that Parrish et al. [17] do also identify a small angular planimetric refraction-dependent displacement error (amounting to approximately 0.09 m at depths of 30 m) for both ICESat-2 off-nadir beam pairs (Figure 1). For the standard view angles within the ±3.3 km swath, if the data were using the special tilt facility, this would be larger. However, since all of the bathymetric data that are considered in this study are for refraction-adjusted depths less than 11.35 m and collected with the standard on-track pointing, the angular planimetric displacement error component that is possible at these depths is considered negligible and is ignored here.
2.2.5. Quantification of ICESat-2 Bathymetric Accuracy
The bathymetric accuracies of the raw and refraction-adjusted data were compared with external MBES and GNSS data at four test sites (Figure 1). Bathymetric errors were expressed as the mean absolute error (MAE) and root mean square (RMS) error. The MAE method is outlined in simple form in Equation (2), where the absolute error (Δx) can be determined from the actual value (x0), the measured value (x) and the number of observations (n) as follows:
Δx = (x0 − x)/n
The RMSE calculation method is outlined in Equation (3) below, where Pi is the predicted value and Oi is the observed value and n is the number of data points.
RMSE = √((Σ (Pi − Oi)2) / n)
3. Results
An examination of available ICESat-2 profiles [28] identified 28 profiles that contained discernible bathymetric geolocated photons (Figure 1). Most of these were confined to very shallow water, but four profiles reached (refraction-adjusted) depths of between 0 m and 11 m, providing opportunities for ICESat-2 bathymetric accuracy quantification (Table 1).

Table 1.
Four sites at which ICESat-2 bathymetric accuracy was compared with external reference MBES and GNSS data, with information regarding reference data spatial resolution and the horizontal separation between each ICESat-2 bathymetric point and its paired reference point.
The two deepest-reaching profiles (both of which were acquired in June 2019) were spatially coincident with nearshore INFOMAR MBES data acquired (23 months earlier) in July 2017 (Table 1). A further two profiles (acquired in May 2019) provided sufficient nearshore geolocated photons for accuracy comparison but had no spatial overlaps with any existing external bathymetric reference data set. However, it was possible to acquire a low-tide GNSS survey at these latter sites (26 months later) in July 2021 (Table 1). The MBES and GNSS data were characterised by ellipsoidal elevation accuracies of better than 0.1 m [25] and 0.02 m [29], respectively, so they are treated here as absolute ellipsoidal height reference data for the purposes of assessing ICESat-2 bathymetric accuracy.
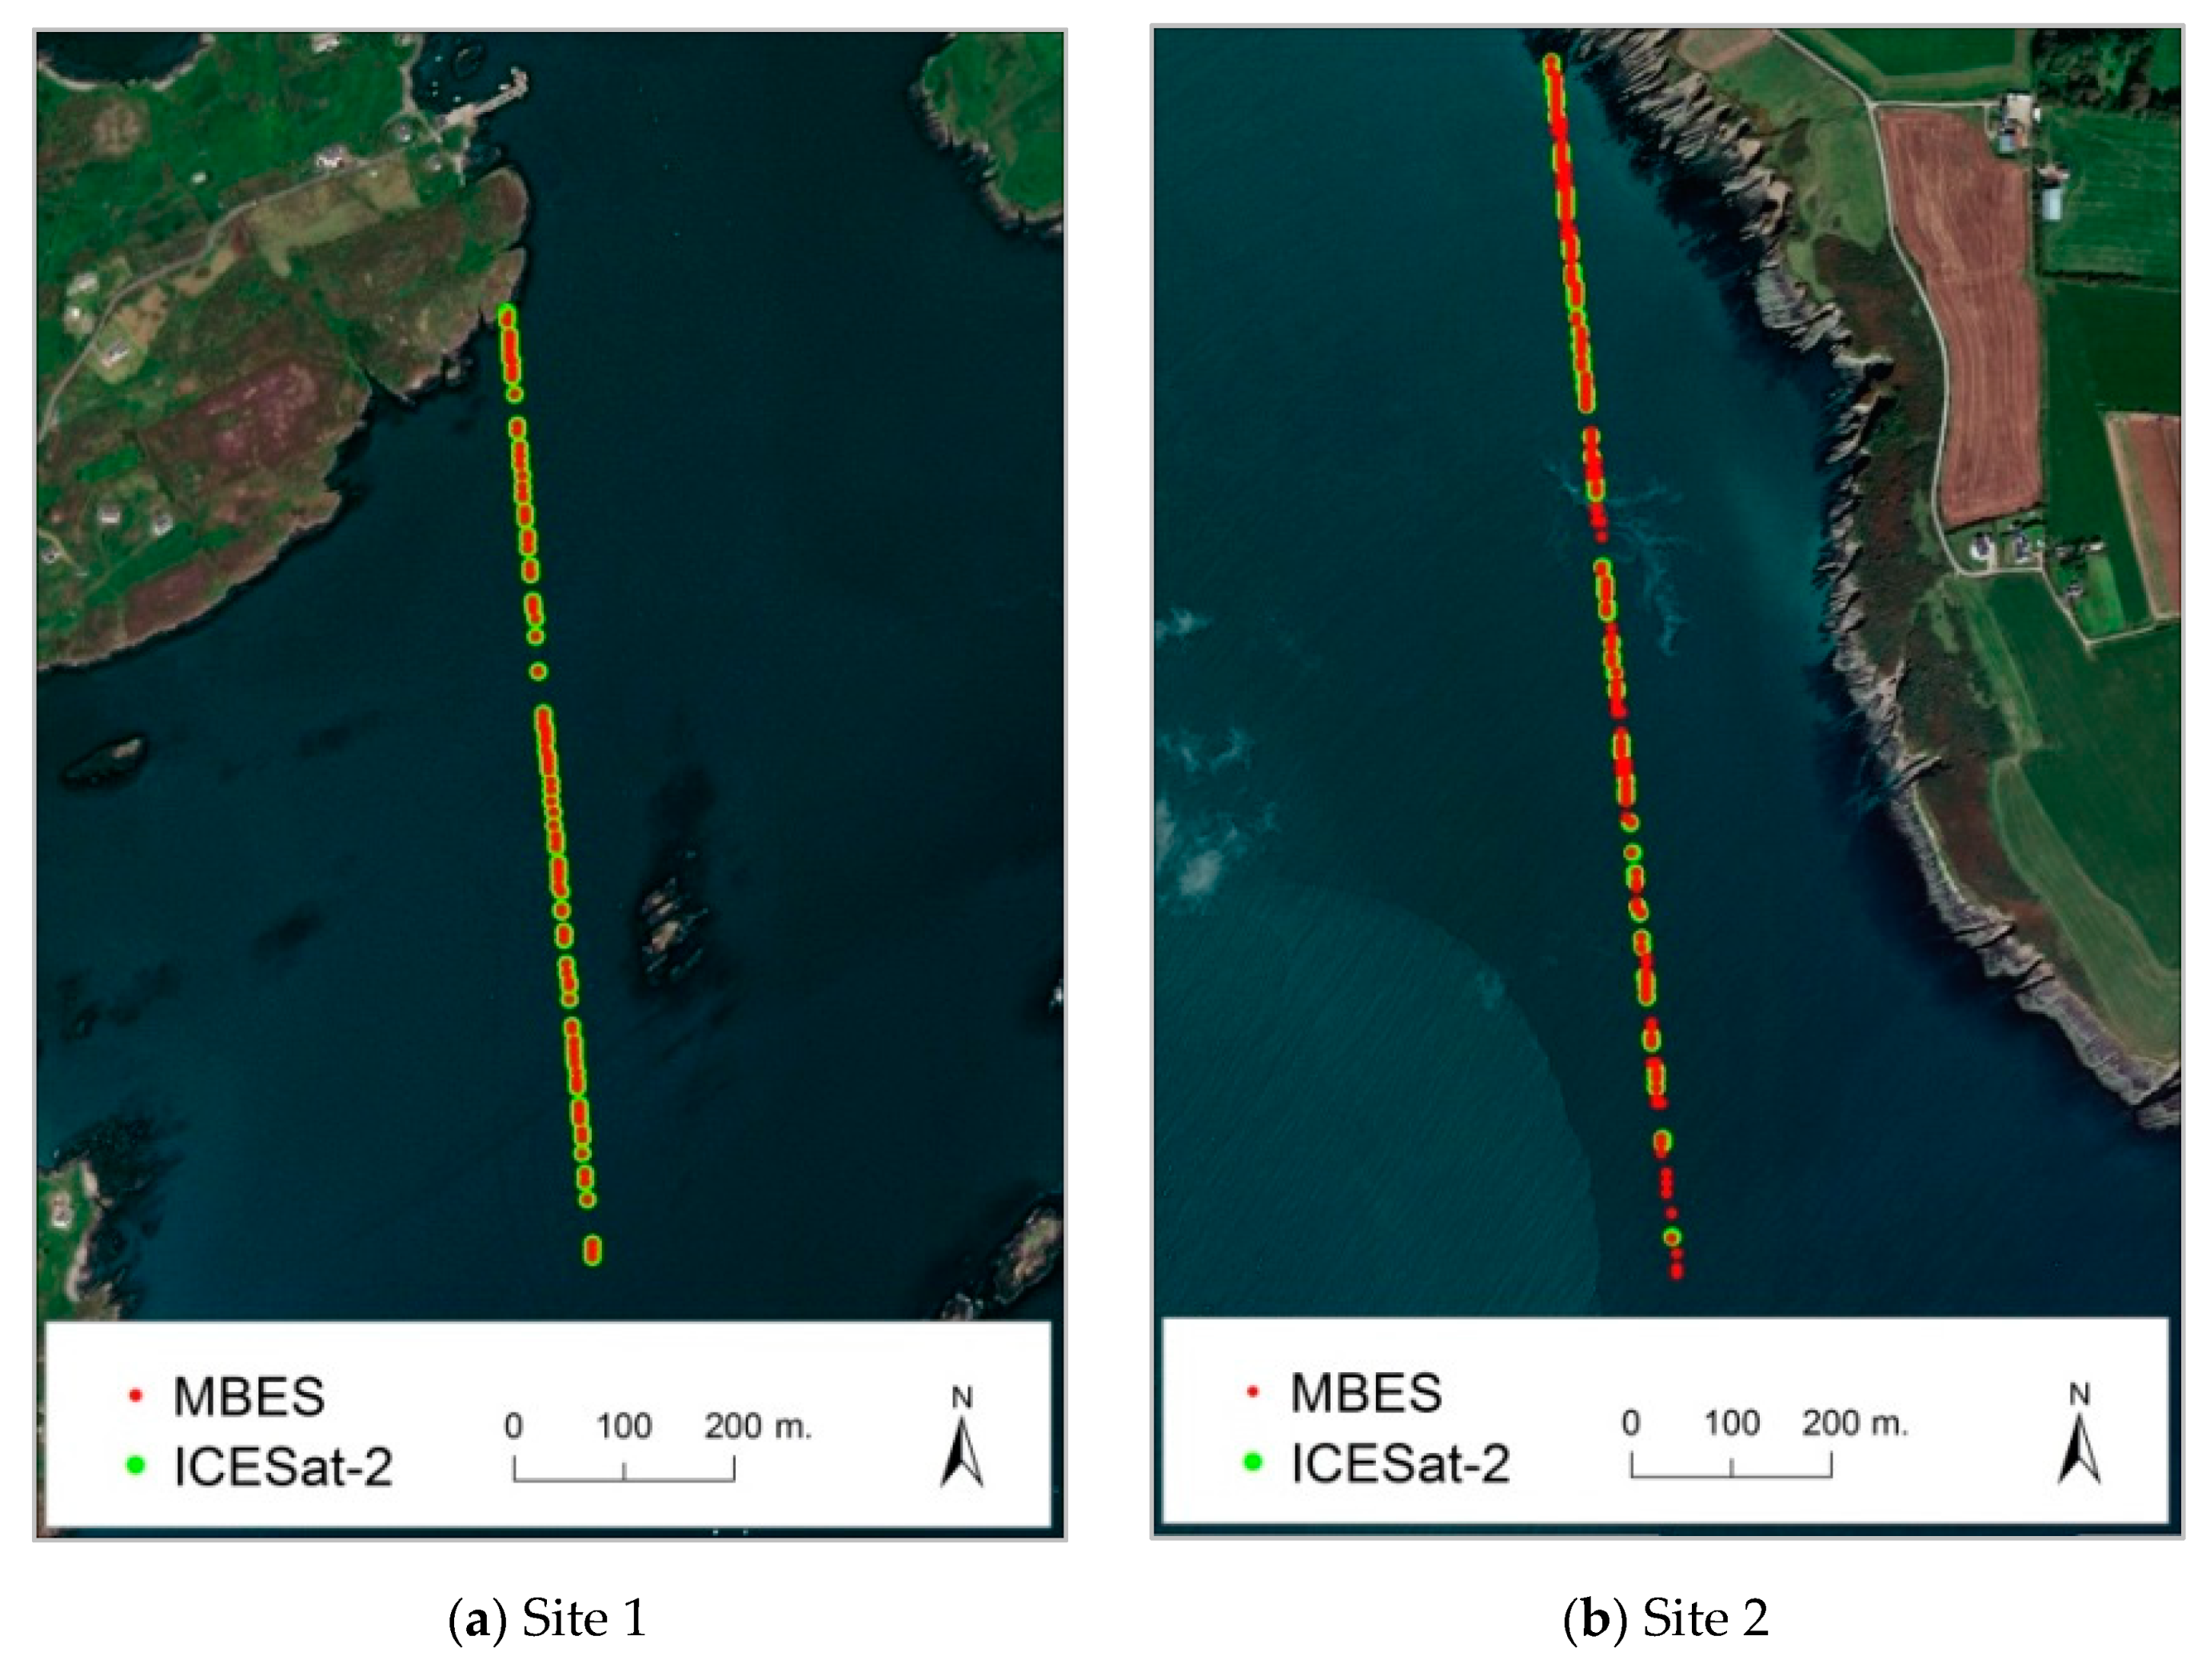
Each ICESat-2 bathymetric point at each test site was paired (in ArcGIS 10.x) by proximity with its single nearest horizontal neighbouring MBES or GNSS point (Table 1) within a horizontal distance of less than the spatial resolution of the reference data set (Figure 3). The accuracy of each ICESat-2 bathymetric geolocated photon was subsequently quantified relative to its paired reference point at each test site.
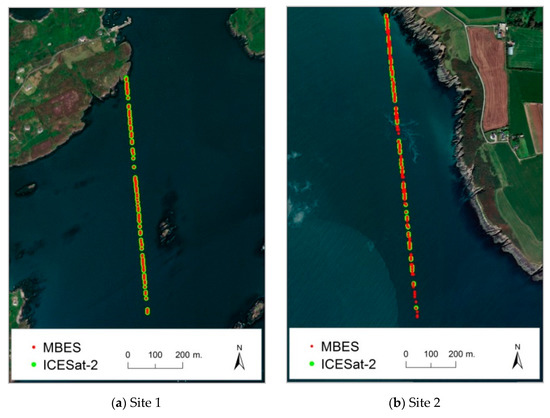
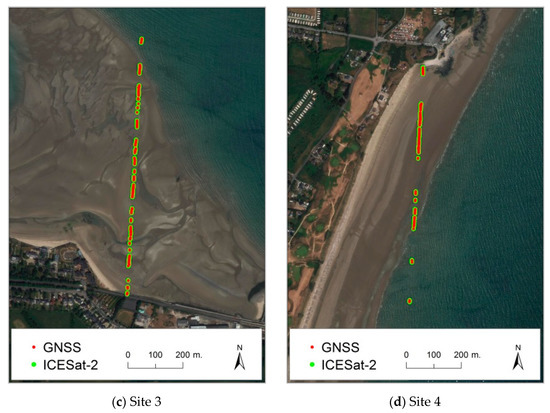
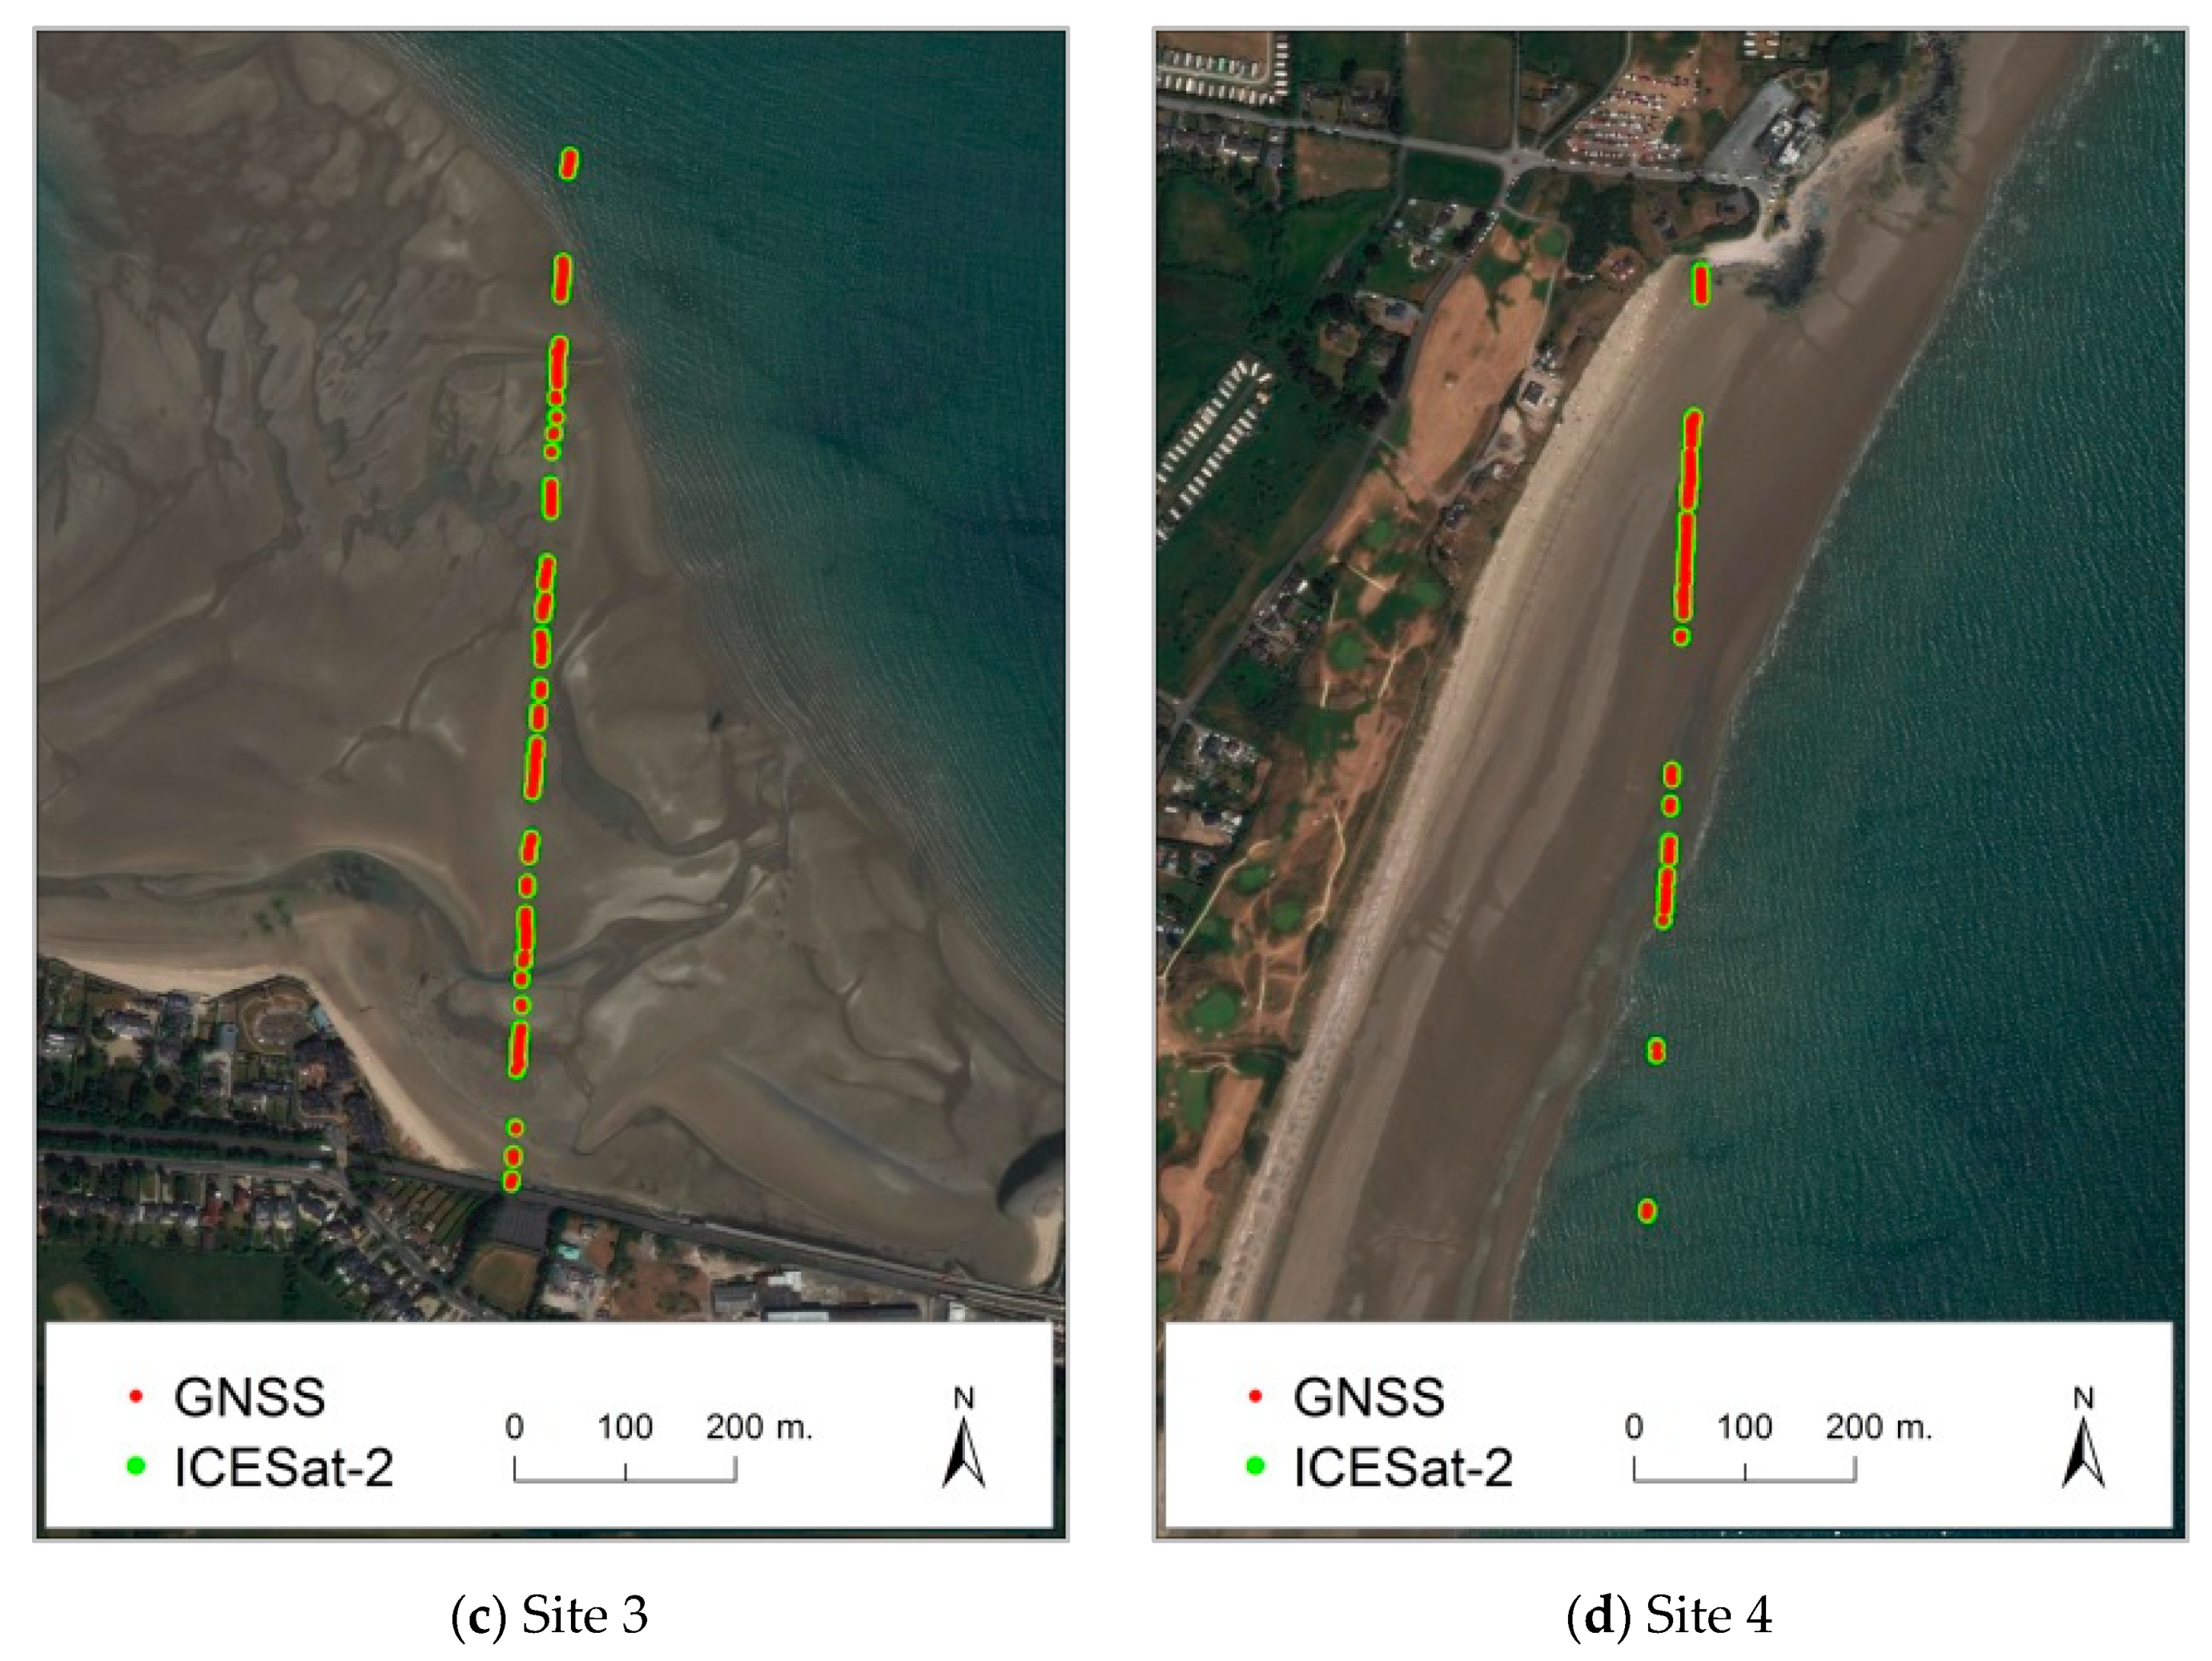
Figure 3.
(a) Site 1 (Baltimore) ICESat-2 and MBES 1-m neighbours, (b) Site 2 (Seven Heads) ICESat-2 and MBES 1-m neighbours, (c) Site 3 (Howth) ICESat-2 and MBES 1-m neighbours, and (d) Site 4 (Donabate) ICESat-2 and MBES 1-m neighbours. (Background images courtesy of ESRI Digital Globe map service in ArcGIS 10.x.)
Three bathymetric accuracy tests were conducted at each test site:
- ICESat-2 bathymetric accuracy quantification across the full depth range of ICESat-2 points that could be paired with a nearby MBES of GNSS comparison point;
- Determination of ICESat-2 bathymetric accuracy ranging from minimum depth to progressive (incrementally deeper) water column depths;
- Evaluation of ICESat-2 bathymetric accuracy within successive discrete 1-m depth bands.
3.1. ICESat-2 Bathymetric Accuracy Assessment across the Full Depth Range
Refraction-adjusted ICESat-2 bathymetric errors at the deeper water test sites (Table 2) indicated accuracies of 0.23 m (MAE) to depths of approximately 7 m and 0.56 m (MAE) to a depth of 11 m (Table 2). Results from the shallow-water tests sites were approximately 0.25 m (MAE) to depths of 3 m (Table 2), though we believe that these sites may have been affected by changes in beach profile in the time period between ICESat-2 and GNSS comparison data being acquired, see Discussion Section. Overall, the errors observed to maximum depth at all four sites suggested that errors may increase with depth, with a general tendency for overestimation of depth. The relationship of error to depth is thus examined further in this study.
Table 2.
Refraction-adjusted bathymetric accuracy across the full depth range that is represented within the extracted ICESat-2 bathymetric data from each test site.
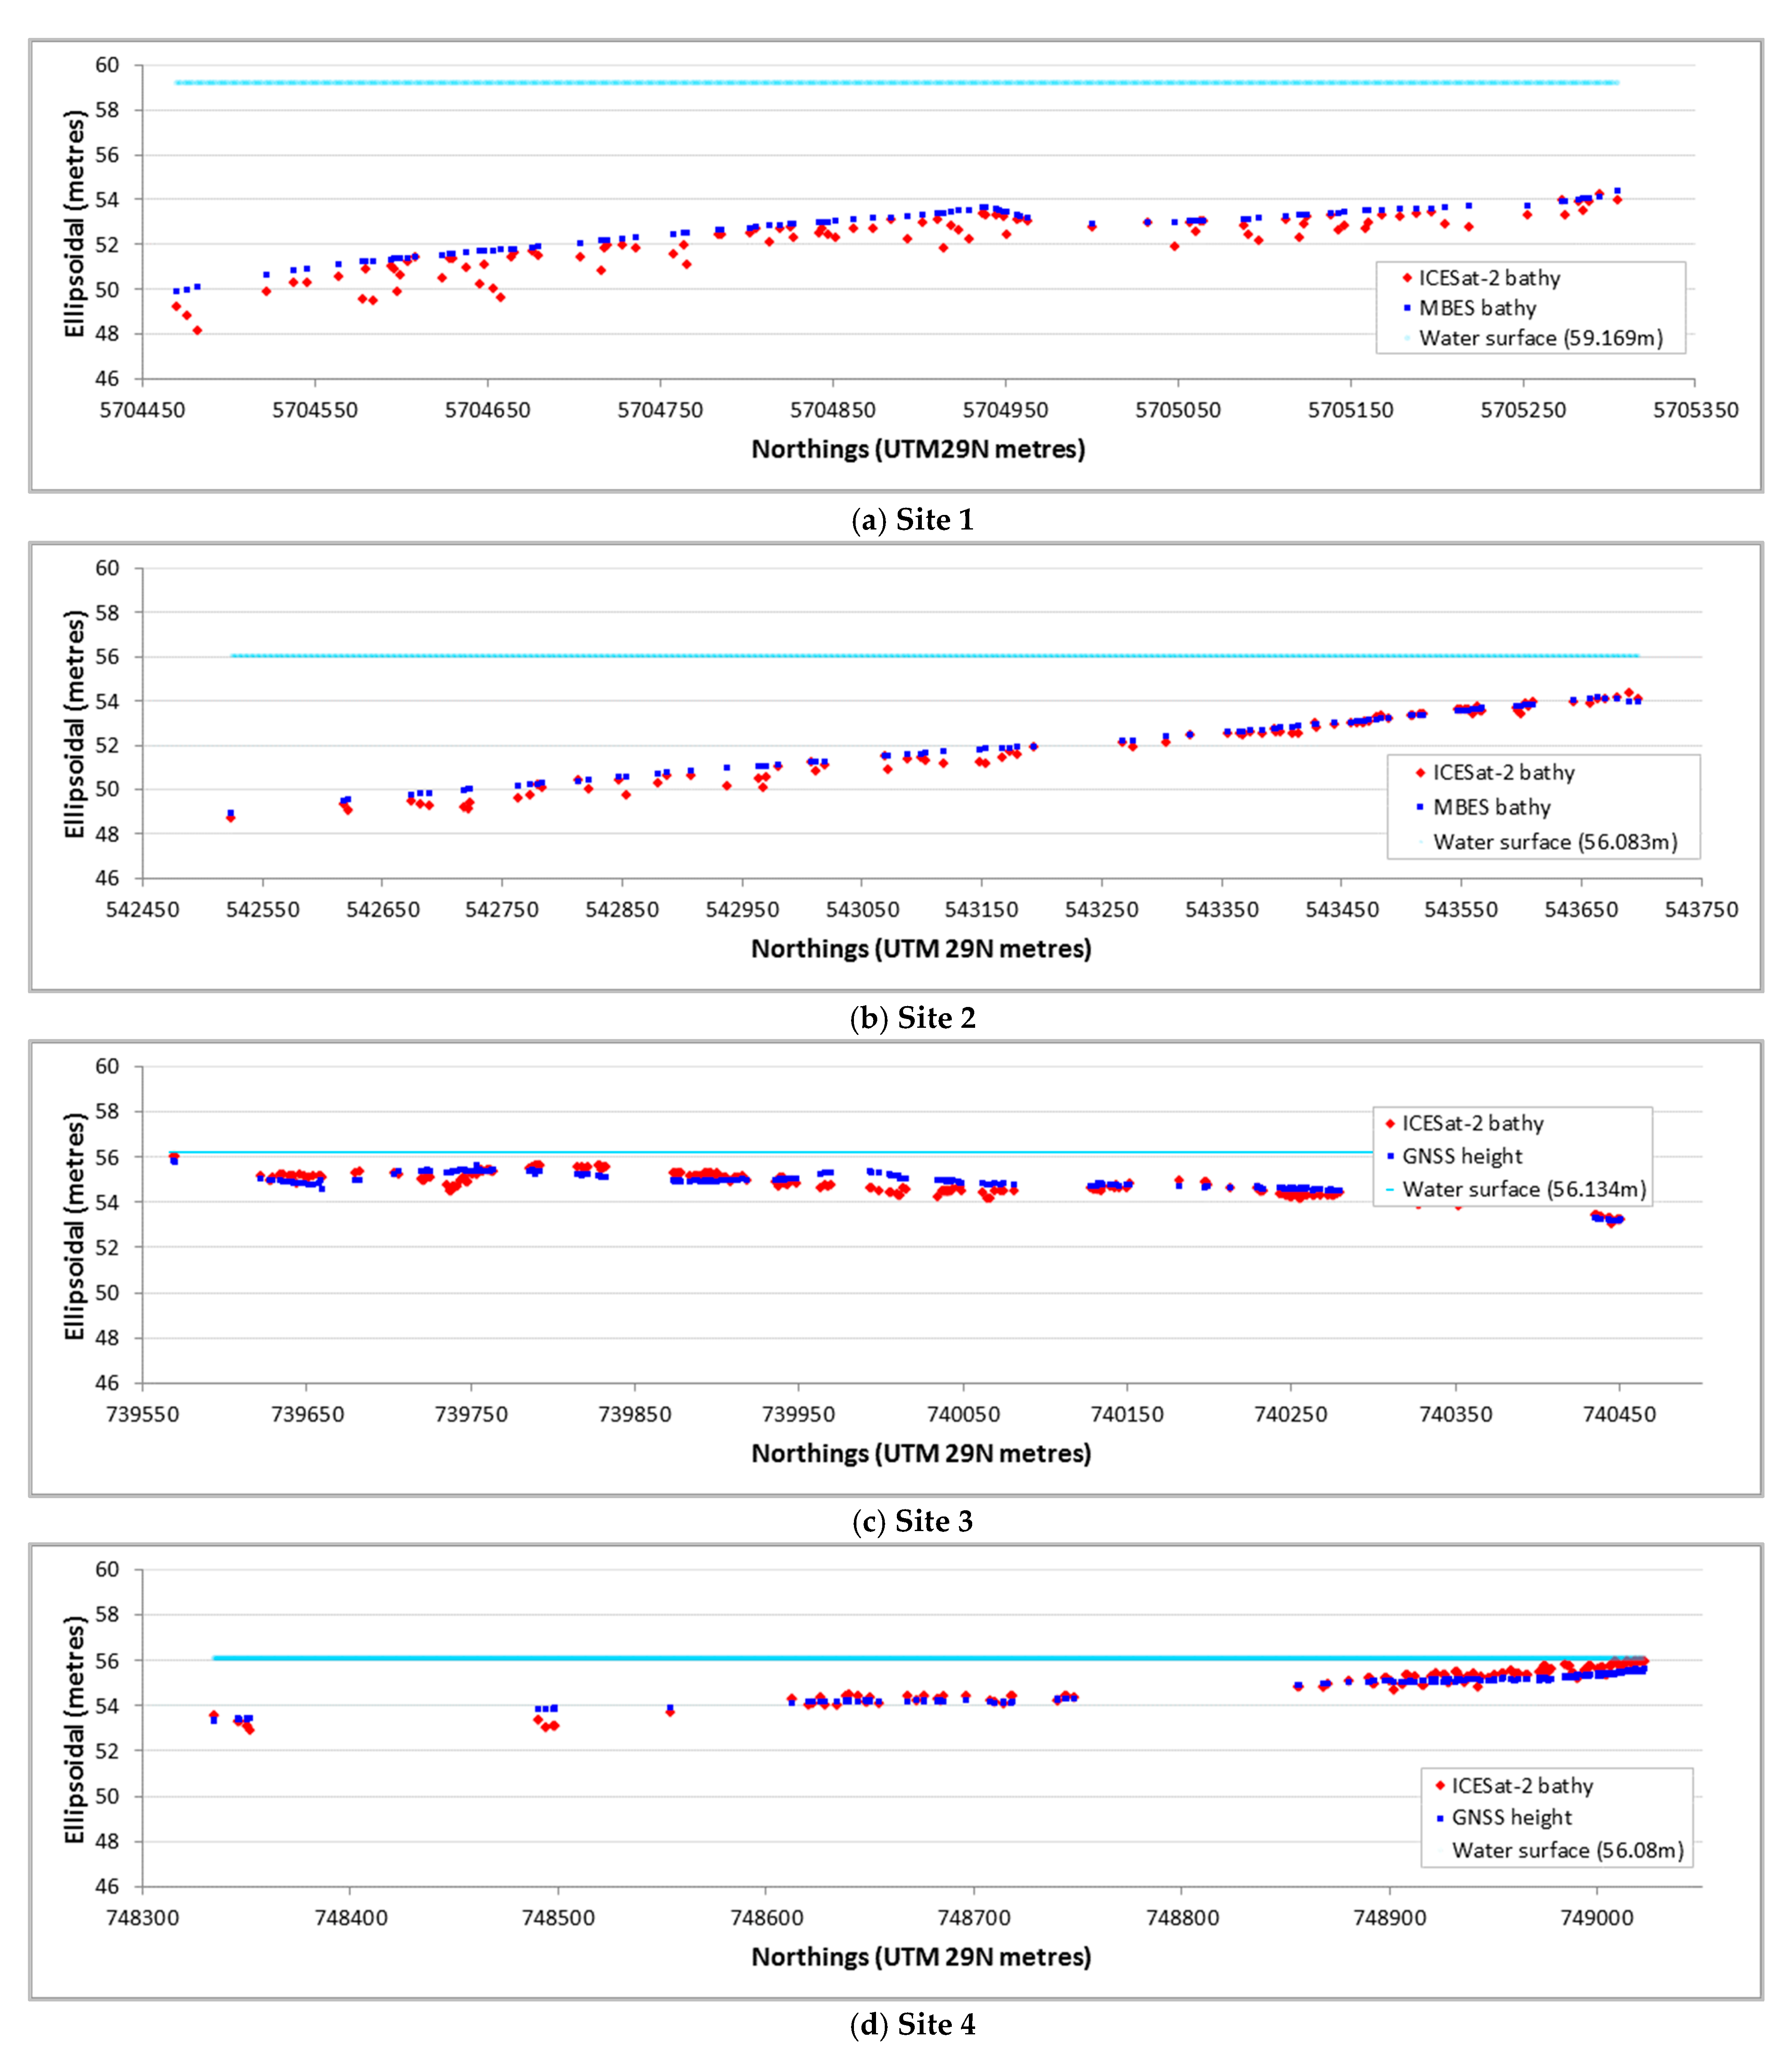
The relationship between ICESat-2 bathymetric values and the reference MBES and GNSS data is shown in Figure 4. In general terms, ICESat-2 bathymetric errors appear to demonstrate some dependence upon depth, particularly at the two deeper test sites.
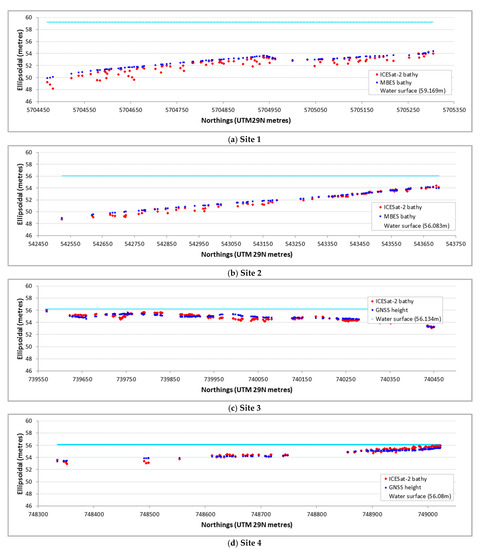
Figure 4.
(a) Site 1 (Baltimore) ICESat-2 (red) and MBES (blue) bathymetric data, (b) Site 2 (Seven Heads) ICESat-2 (red) and MBES (blue) bathymetric data, (c) Site 3 (Howth) ICESat-2 (red) and GNSS (blue) bathymetric data, and (d) Site 4 (Donabate) ICESat-2 (red) and MBES (blue) bathymetric data.
3.2. ICESat-2 Bathymetric Accuracy to Progressive Water Column Depths
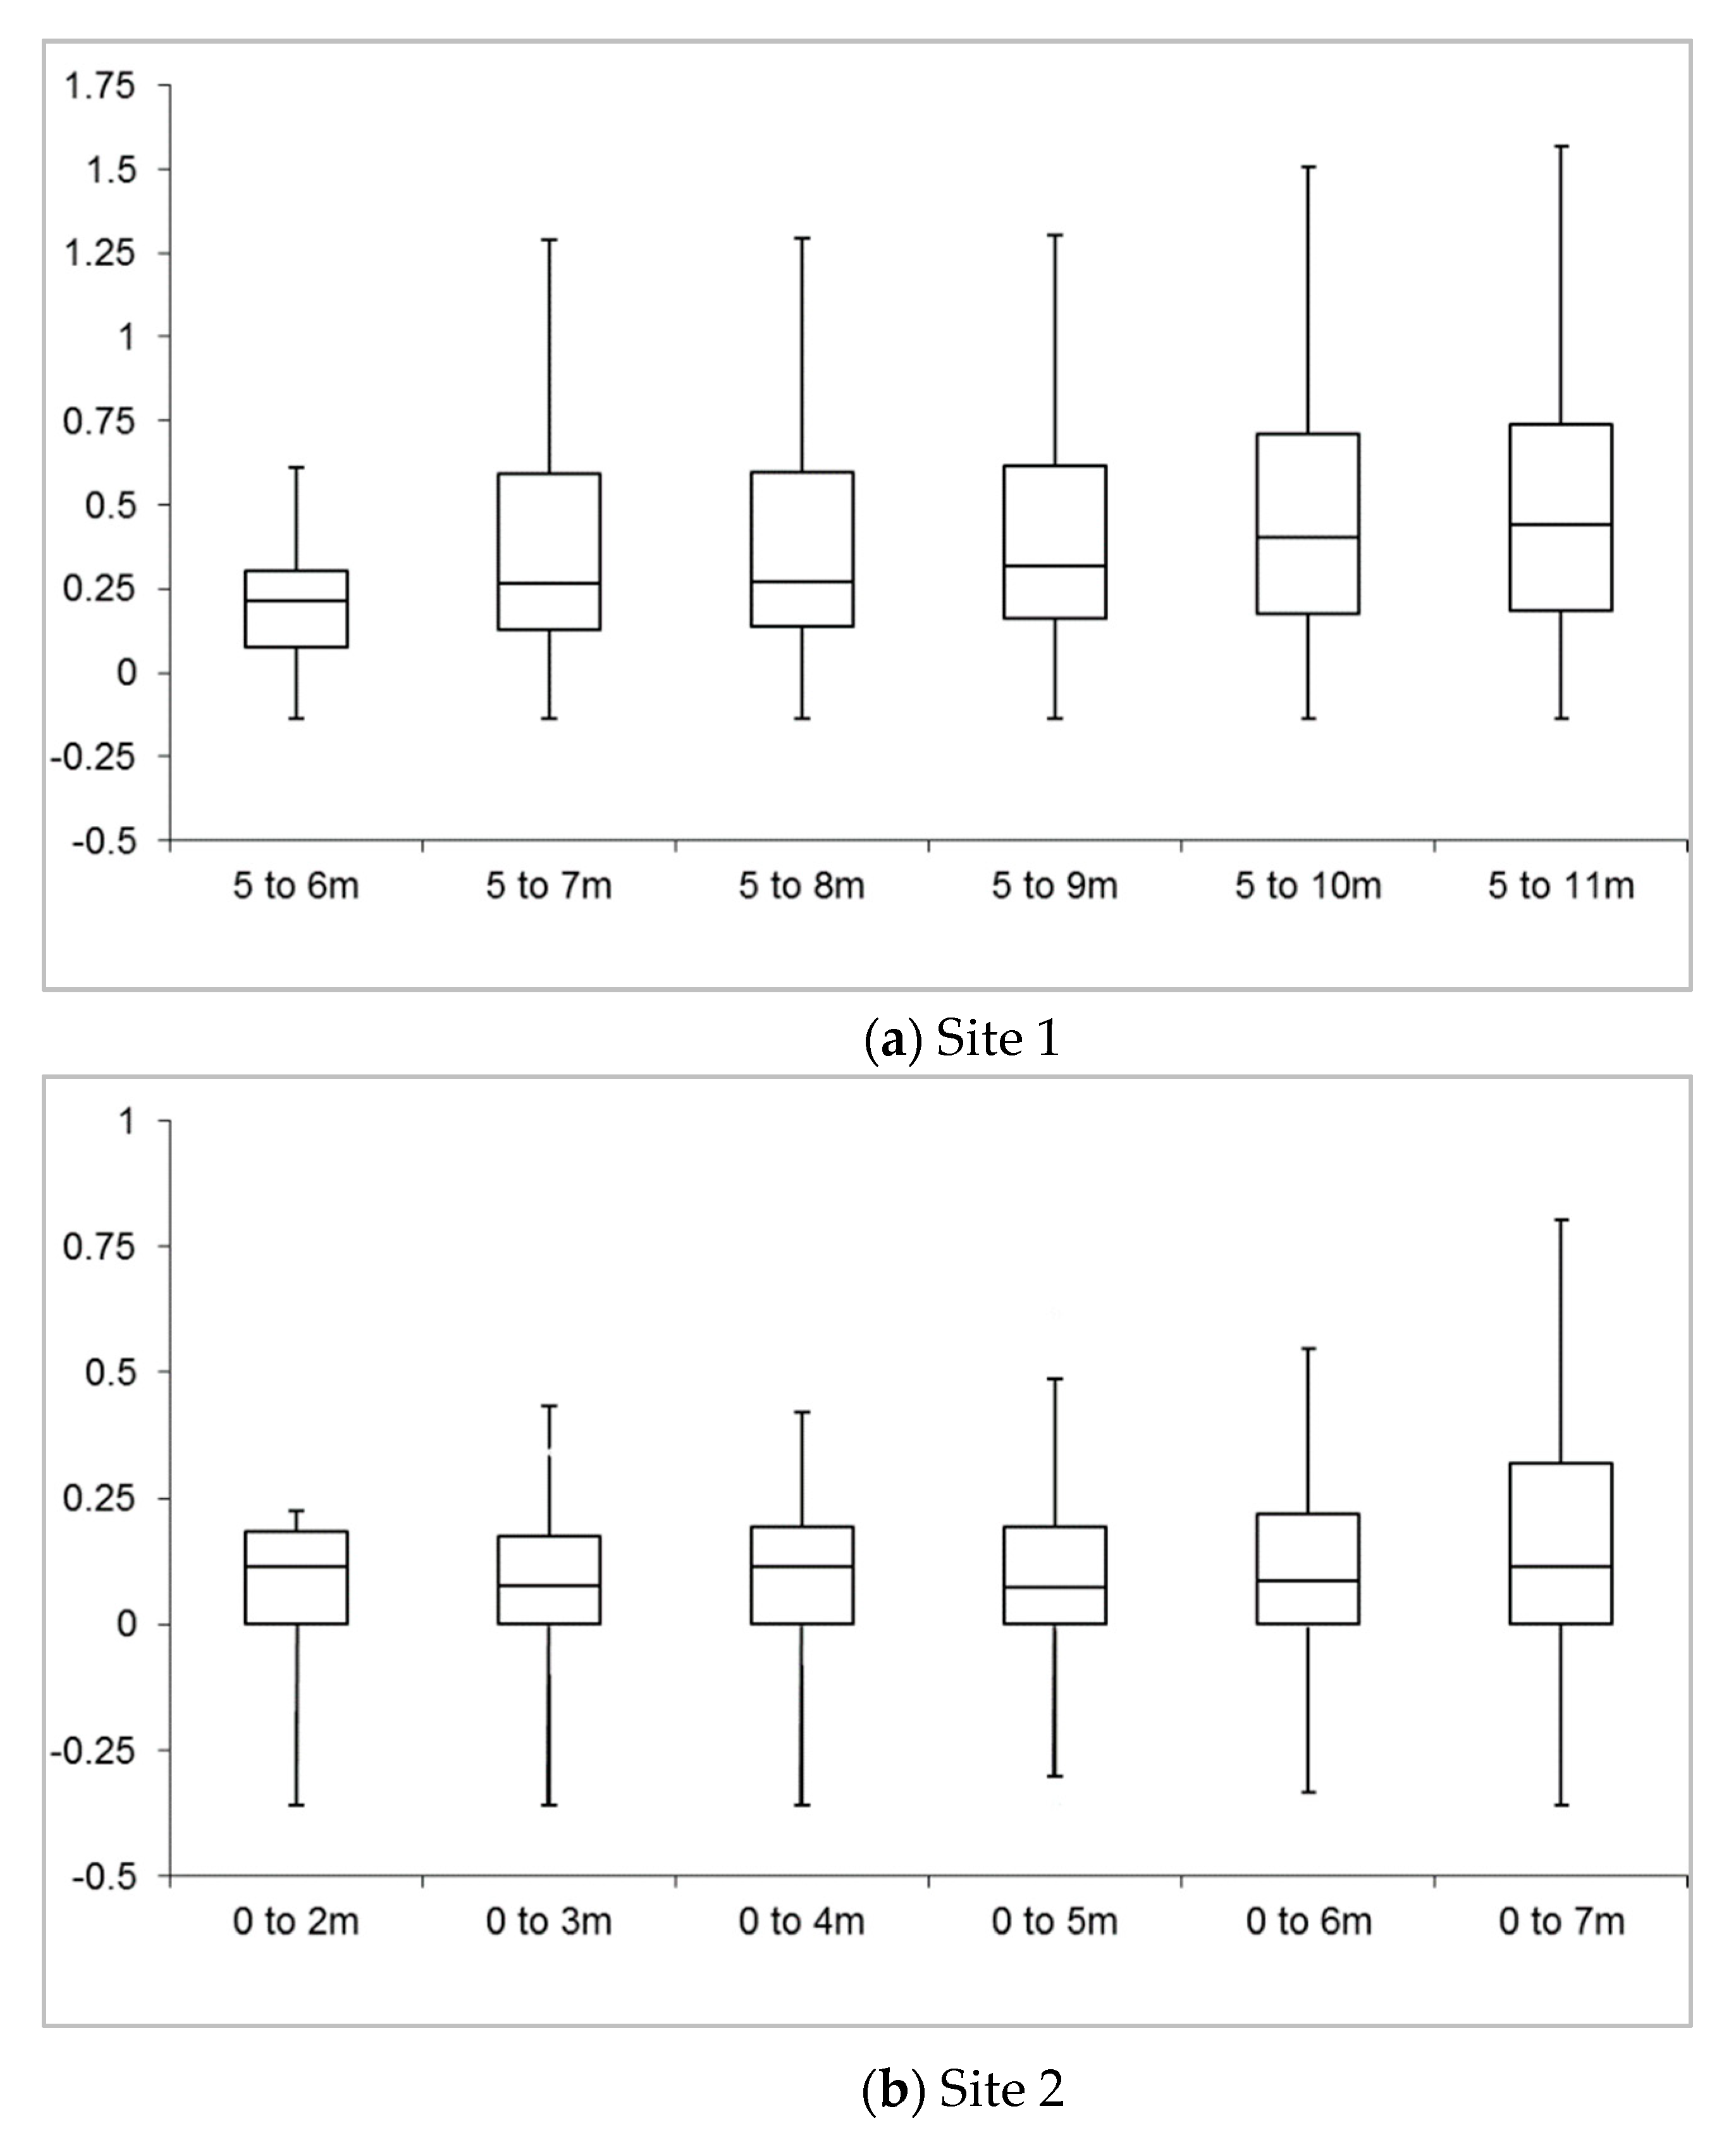
A closer examination of ICESat-2 refraction-adjusted bathymetric accuracies at progressive water column depths indicated a general trend of increasing errors with increased water column depths at all four test sites (Table 3). For example, at Site 2, bathymetric errors from the minimum depth (1.75 m) to 2 m, to 3 m, to 4 m and to 5 m depth ranges (Table 3 and Figure 5) were all less than 0.15 m (MAE), with MAE errors in the 0–6 m and 0–7 m ranges being only slightly larger at 0.23 m (Table 3). At Site 1, MAE bathymetric errors between the minimum depth (4.96 m) and 6 m were 0.24 m, with errors increasing to 0.40 m at 8 m and 0.54 m at 11 m (Table 3). Errors from 0 m to the maximum depth (3 m) at the two east coast shallow-water test sites were all less than 0.32 m (MAE). This explains why the overall MAE for Site 1 reported in Table 2 was higher than the other sites, since Site 1 only consisted of deeper data points.
Table 3.
ICESat-2 bathymetric accuracy from zero to progressive depth ranges at all four test sites.
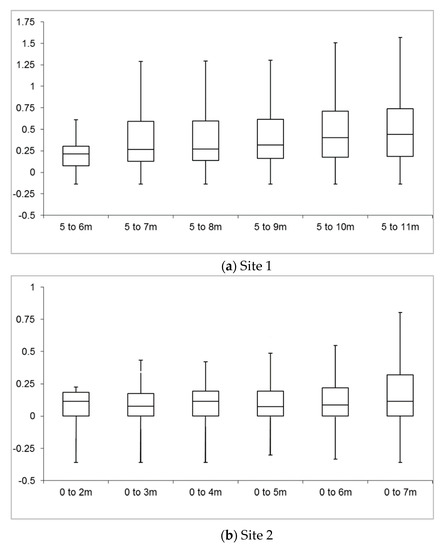

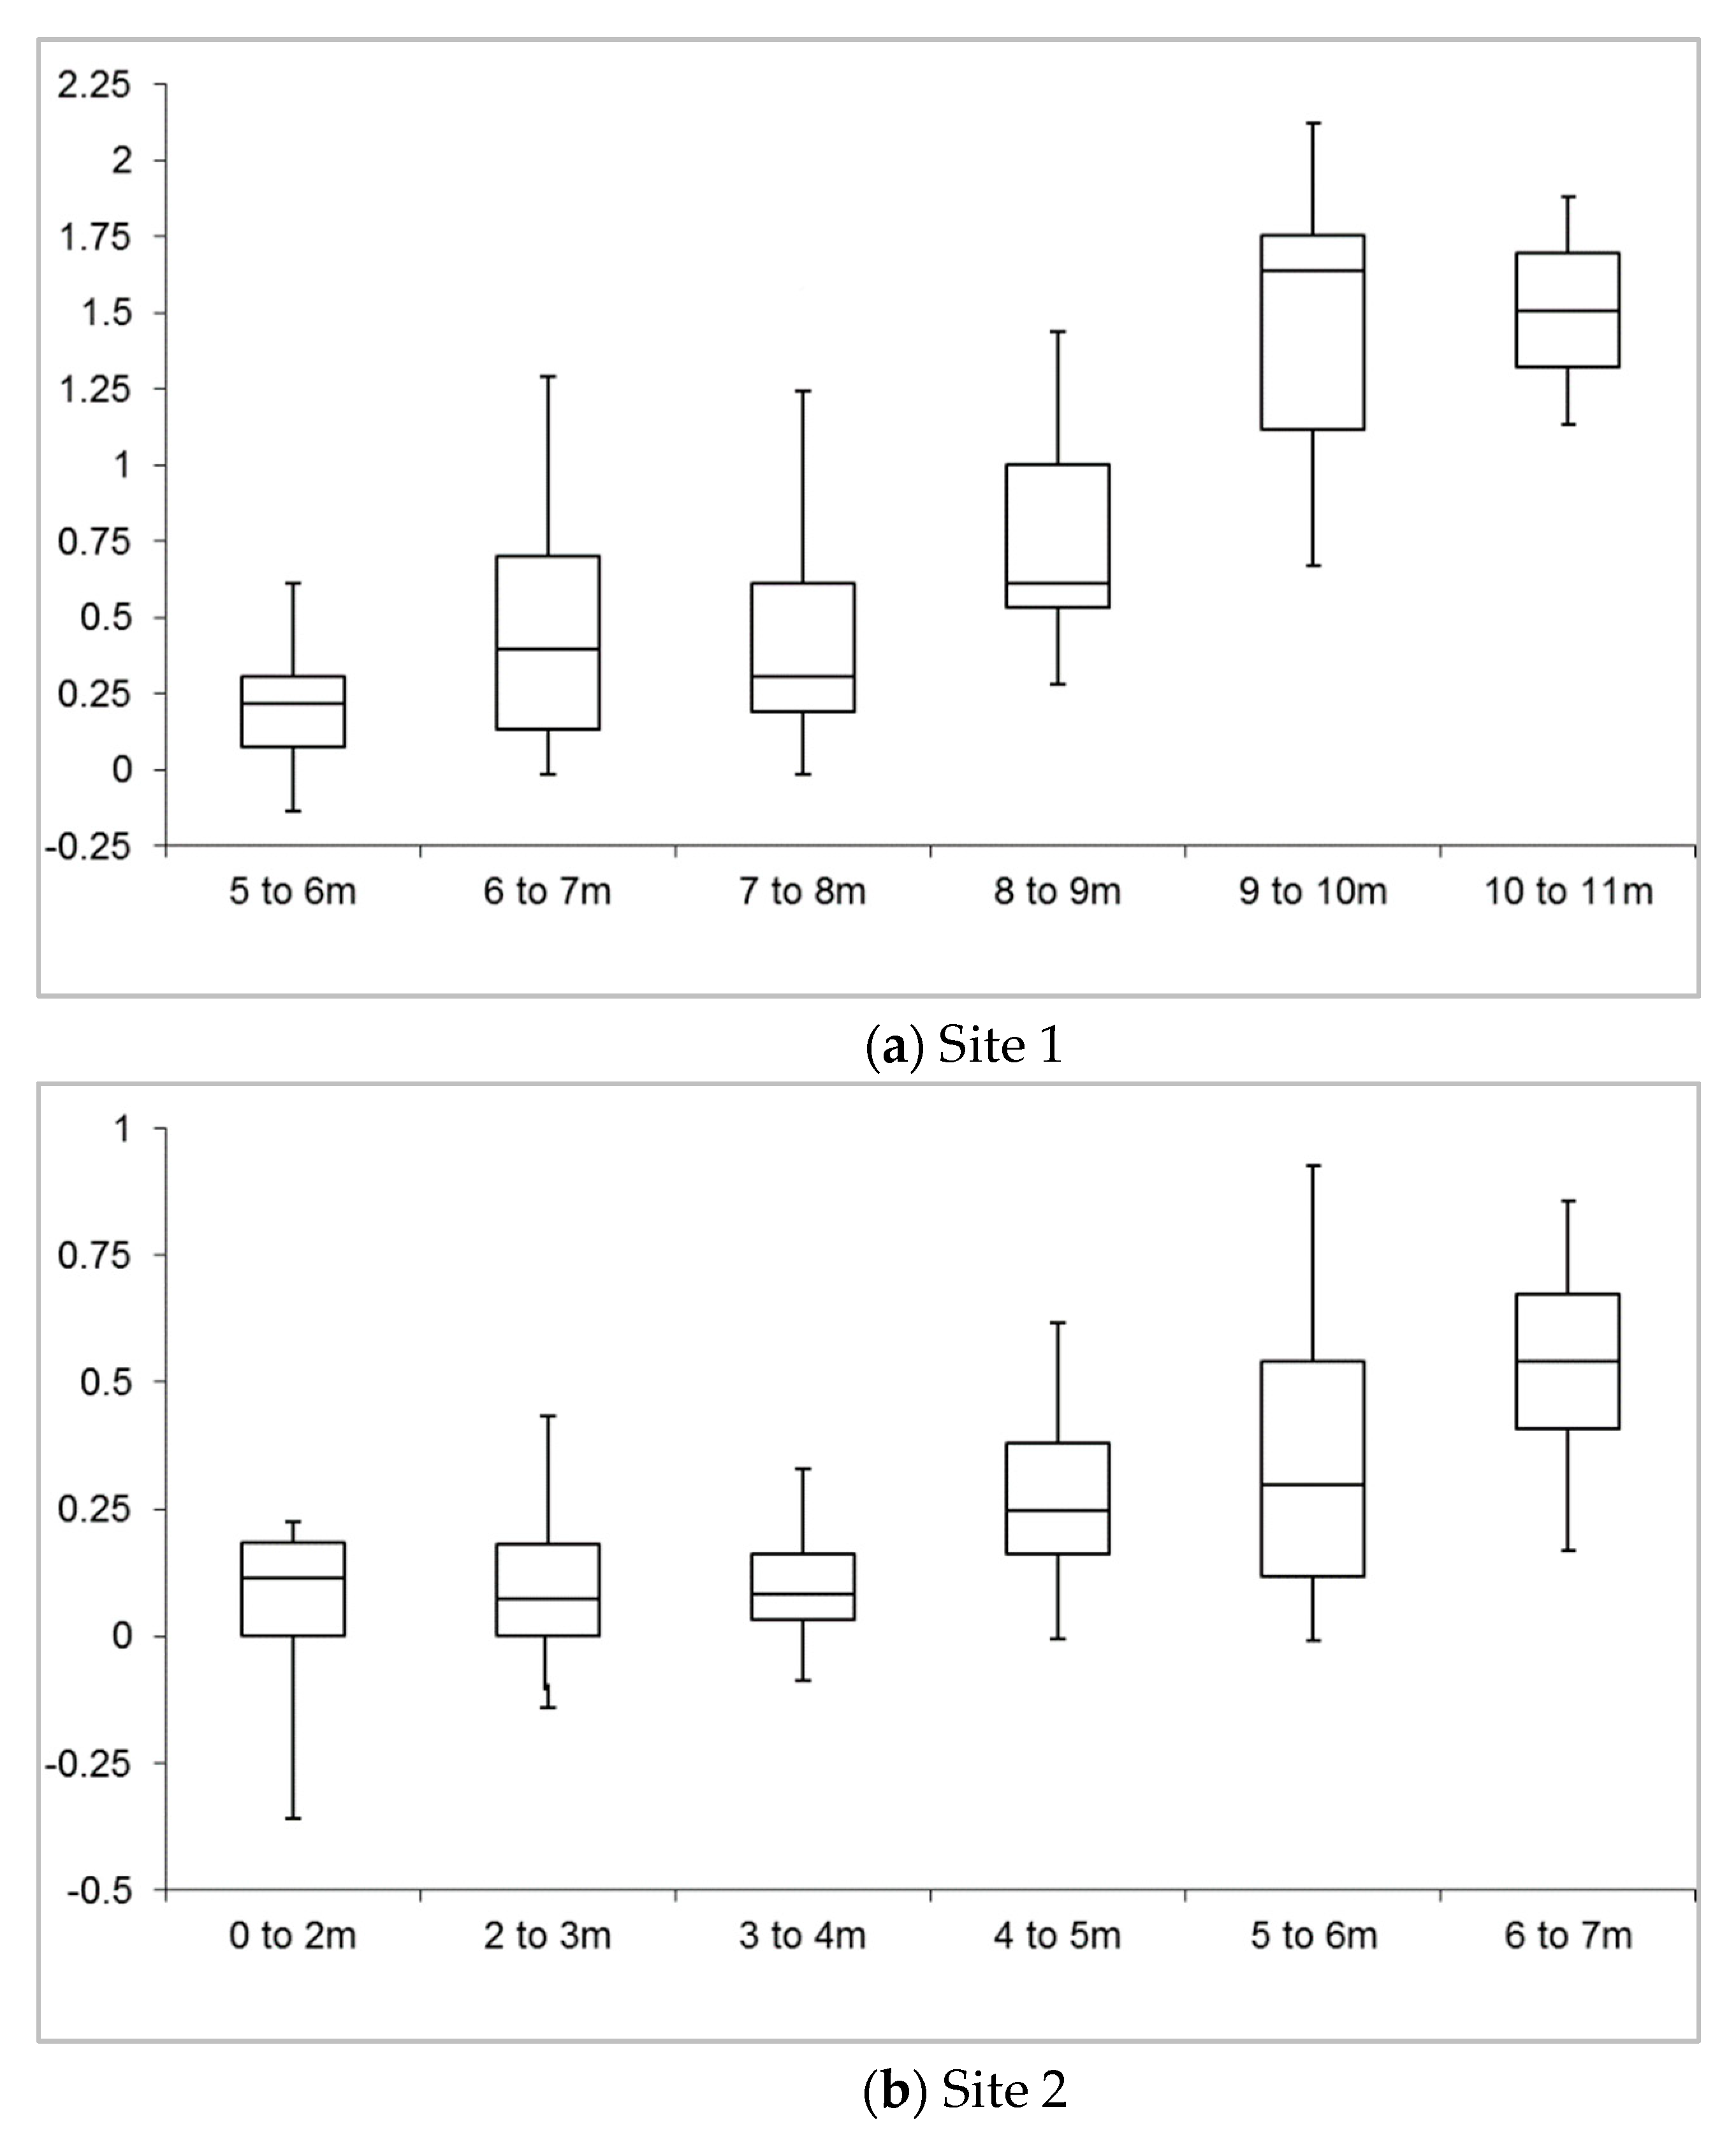
Figure 5.
(a) Site 1 (Baltimore) box and whisker plot detailing bathymetric errors from minimum depth to progressive water column depths and (b) Site 2 (Seven Heads) box and whisker plot detailing bathymetric errors from minimum depth to progressive water column depths. (c) Site 3 (Howth) box and whisker plot detailing bathymetric errors from minimum depth to progressive water column depths and (d) Site 4 (Donabate) box and whisker plot detailing bathymetric errors from minimum depth to progressive water column depths.
3.3. ICESat-2 Bathymetric Accuracy in Discrete One-Metre Depth Bands
An additional assessment of ICESat-2 bathymetric error was also applied within discrete 1-m depth bands (Table 4) to determine if there are specific transition depths at which bathymetric errors can be observed to diverge substantially (Figure 6). The results from Sites 1 and 2 were quite similar to one another and support one another to some degree.
Table 4.
ICESat-2 bathymetric accuracy in discrete one-metre depth bands for all test sites. The number of ICESat-2 bathymetric points that were available and checked against reference MBES and GNSS data (i.e., the number of check points) are detailed for each depth band at each test site.
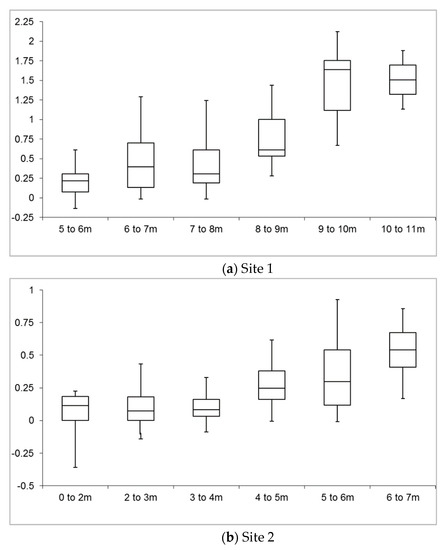
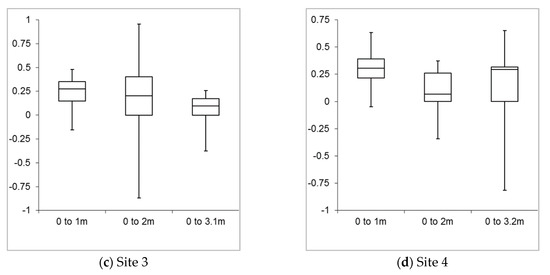
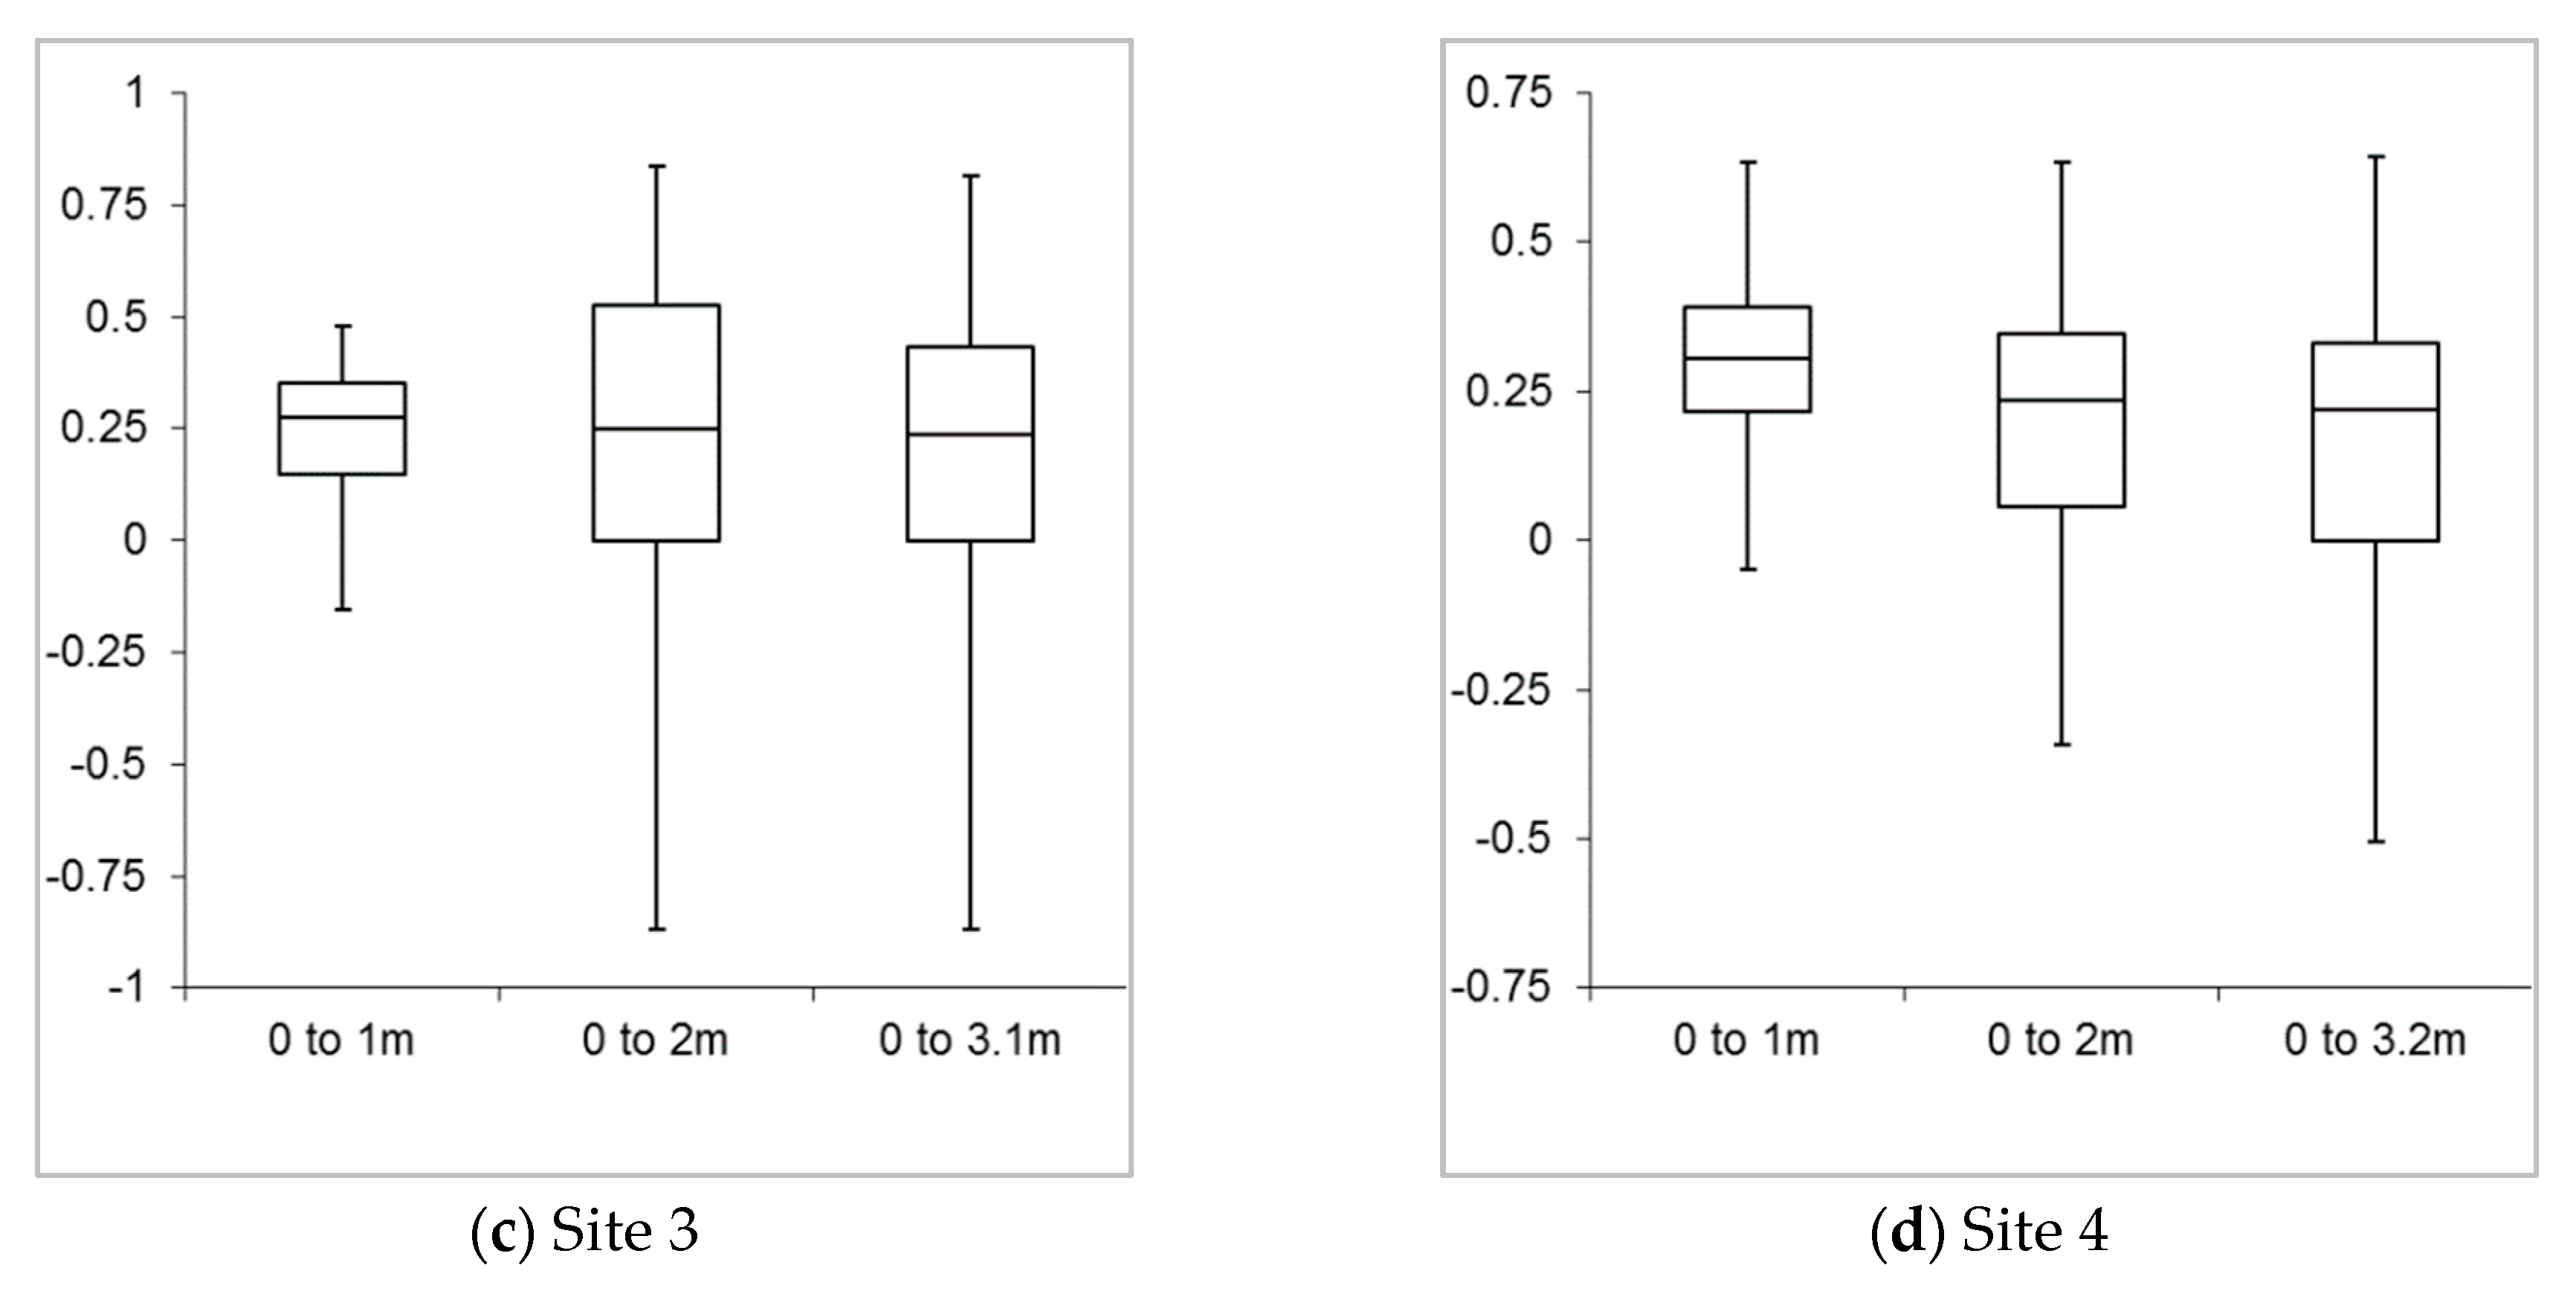
Figure 6.
(a) Site 1 (Baltimore) box and whisker plot detailing absolute bathymetric errors in discrete 1-m depth bands, (b) Site 2 (Seven Heads) box and whisker plot detailing the same, (c) Site 3 (Howth) box and whisker plot detailing the same, and (d) Site 4 (Donabate) box and whisker plot detailing the same as above.
At Site 1, bathymetric errors in the shallowest depths (i.e., between 5 m and 6 m range) were all less than 0.25 m. A transition to errors of the order of 0.45 m magnitude is evident in the 6–7 m and the 7–8 m depth bands. Bathymetric errors increase to greater than 0.76 m in the 8–9 m depth band, with errors doubling beyond this in the 9–10 m and the 10–11 m depth bands (Table 4). However, only a very small number of ICESat-2 bathymetric points were available (7 and 2 points, respectively) in these latter depth bands. With regard to Site 2, quite small ICESat-2 bathymetric errors of less than 0.18 m were noted within each discrete 1-m depth band down to 5 m, with a gradual trend for increasing bathymetric error within each 1-m band down to 5 m depth (Figure 6). Bathymetric errors increased to 0.35 m in the 5–6 m depth band and 0.53 m in the 6–7 m depth band (Figure 6).
The magnitudes of bathymetric errors from the shallow-water east coast sites were generally similar to one another. At Site 3, ICESat-2 bathymetric errors within the discrete 0– 1 m and 1–2 m depth bands (Table 4) were all less than 0.29 m (MAE), but bathymetric errors in the 2–3 m depth band were less than half this, at 0.13 m. In reference to Site 4, ICESat-2 bathymetric errors in the 0–1 m and the 2–3 m depth bands (Table 4) were all less than 0.32 m (MAE). However, ICESat-2 bathymetric errors in the 1–2 m depth band were approximately half this, at 0.14 m. The results in Table 4 are presented in illustrative form in Figure 6.
4. Discussion
With regard to the principal aims stated at the outset of this paper, the primary results may be briefly summarised as follows: Firstly, relatively small ICESat-2 marine bathymetric errors of up to 0.15 m were observed to depths of 5 m, with errors of 0.25 m being noted up to depths of 6 m and 0.54 m up to depths of 11 m. Secondly, a relationship between depth and bathymetric accuracy was observed, which was particularly within discrete 1-m depth bands. This appears to be primarily related to the decreasing number of geolocated photons that are typically available for bathymetric averaging from multiple local photons at increasing depths. Lastly, the ICESat-2 bathymetric data processing chain that was implemented, using commonly used geospatial software packages, was effective and may consequently be of interest to other prospective users of ICESat-2 bathymetric data.
With respect to the first question, i.e., if ICESat-2 bathymetric performance was sufficient to achieve useful accuracies in mid-latitude temperate waters, the occurrence of ICESat-2 bathymetric errors of less than 0.15 m (MAE) up to depths of 5 m and 0.25 m (MAE) up to depths of 6 m (Table 3) suggest that the answer to our question is yes. These accuracies are of similar magnitude to the 0.3 m accuracies (typically reported for 95% of LiDAR soundings) highlighted for Airborne LiDAR Bathymetry within many studies elsewhere [6,7] and specifically in Irish waters [5]. This suggests that ICESat-2 bathymetric data may be implemented in mid-latitude coastal monitoring applications that require accurate nearshore bathymetric profile data. For example, several recent publications have successively applied ICESat-2 bathymetric profile data to provide calibration data for empirical SDB analyses in tropical waters [30,31,32], and ICESat-2 bathymetry has been used to independently assess the accuracy of model inversion methods [33].
The second question, i.e., if ICESat-2 bathymetric accuracies vary by depth, produced some additional useful results. Bathymetric errors (up to depths of 6 m) of the order of 0.18 m were noted at Site 2 and 0.24 m at Site 1. Bathymetric errors increased further to approximately 0.38 m up to depths of 7 m and to 0.54 up to depths of 11 m at Site 1, which was our deepest test site (Table 3). A summary overview of ICESat-2 bathymetric accuracies from all four test sites is presented below (Table 5), which outlines the depths to which a range of accuracy levels were observed at all four test sites.
Table 5.
ICEsat-2 bathymetric accuracy bands, detailed by depth at all four accuracy test sites.
Note that Table 5 refers to bathymetric errors to progressively deepening water column depths. Our separate analysis of bathymetric errors within discrete 1-m depths bands (Figure 6) indicates that bathymetric errors increase disproportionately with depth. Errors are approximately 0.35 m between 5 and 6 m, and errors between 8 and 9 m are almost double this, at approximately 0.75 m, while ICESat-2 bathymetric errors in the 10–11 m depth band double once more to 1.5 m.
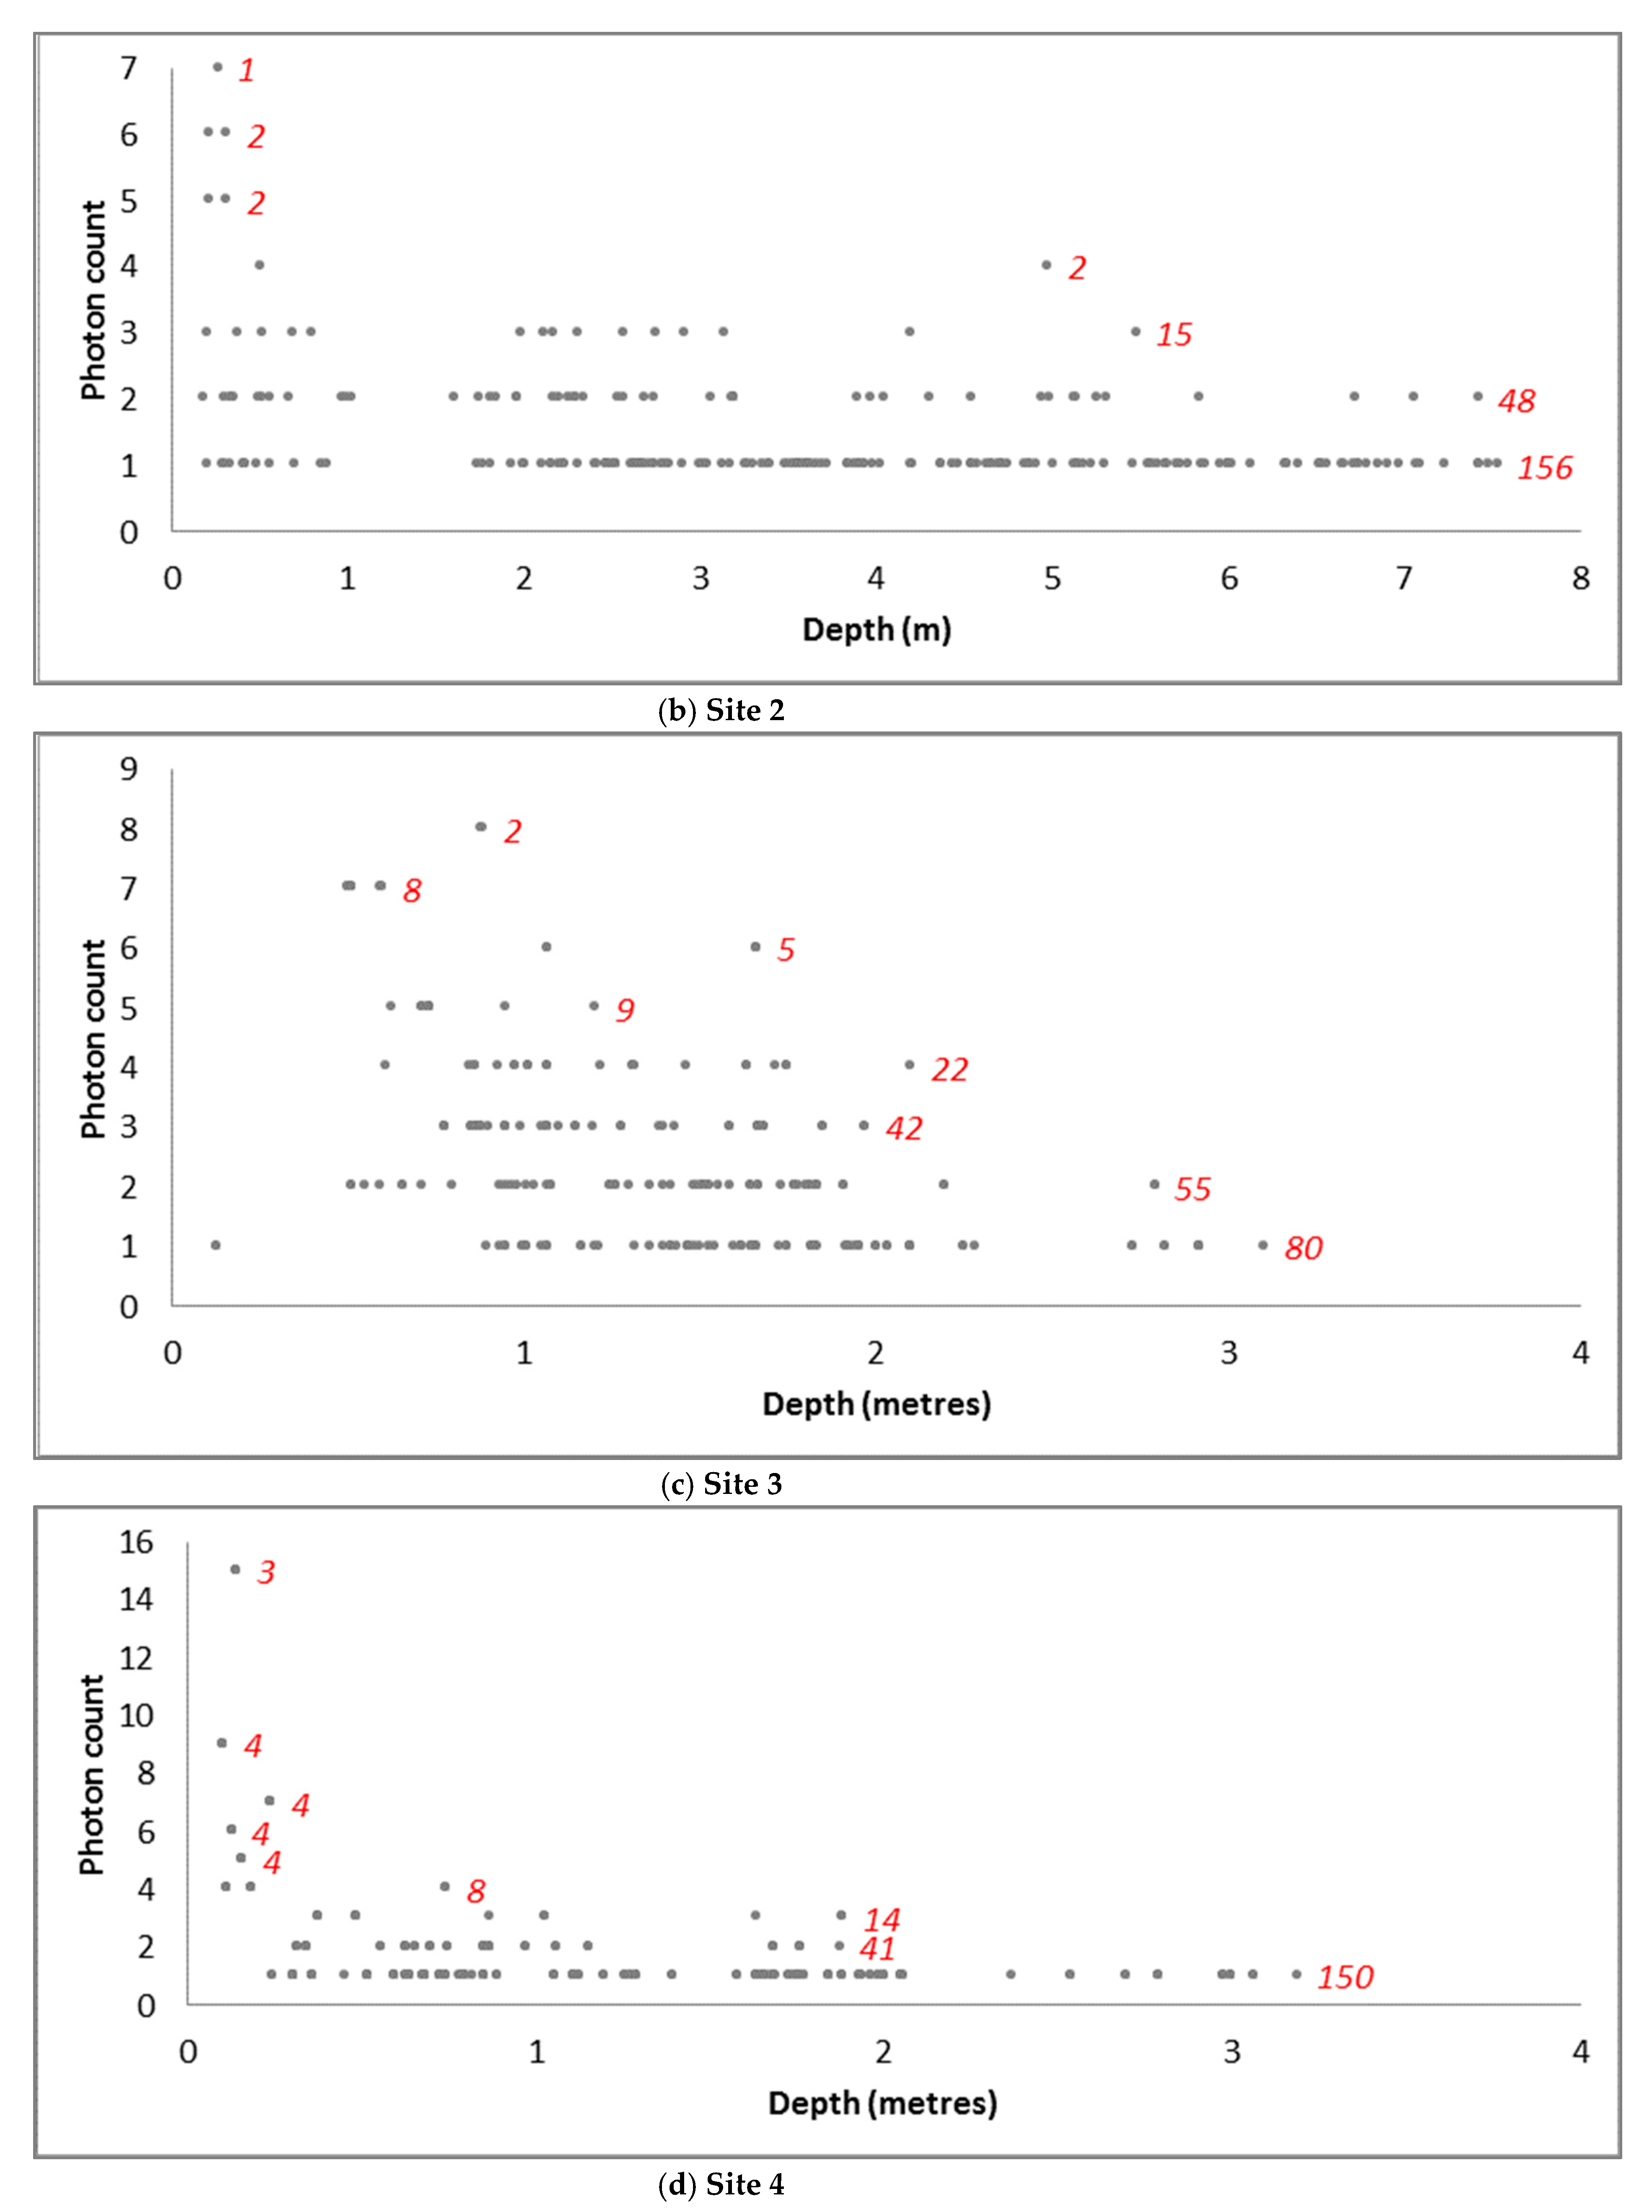
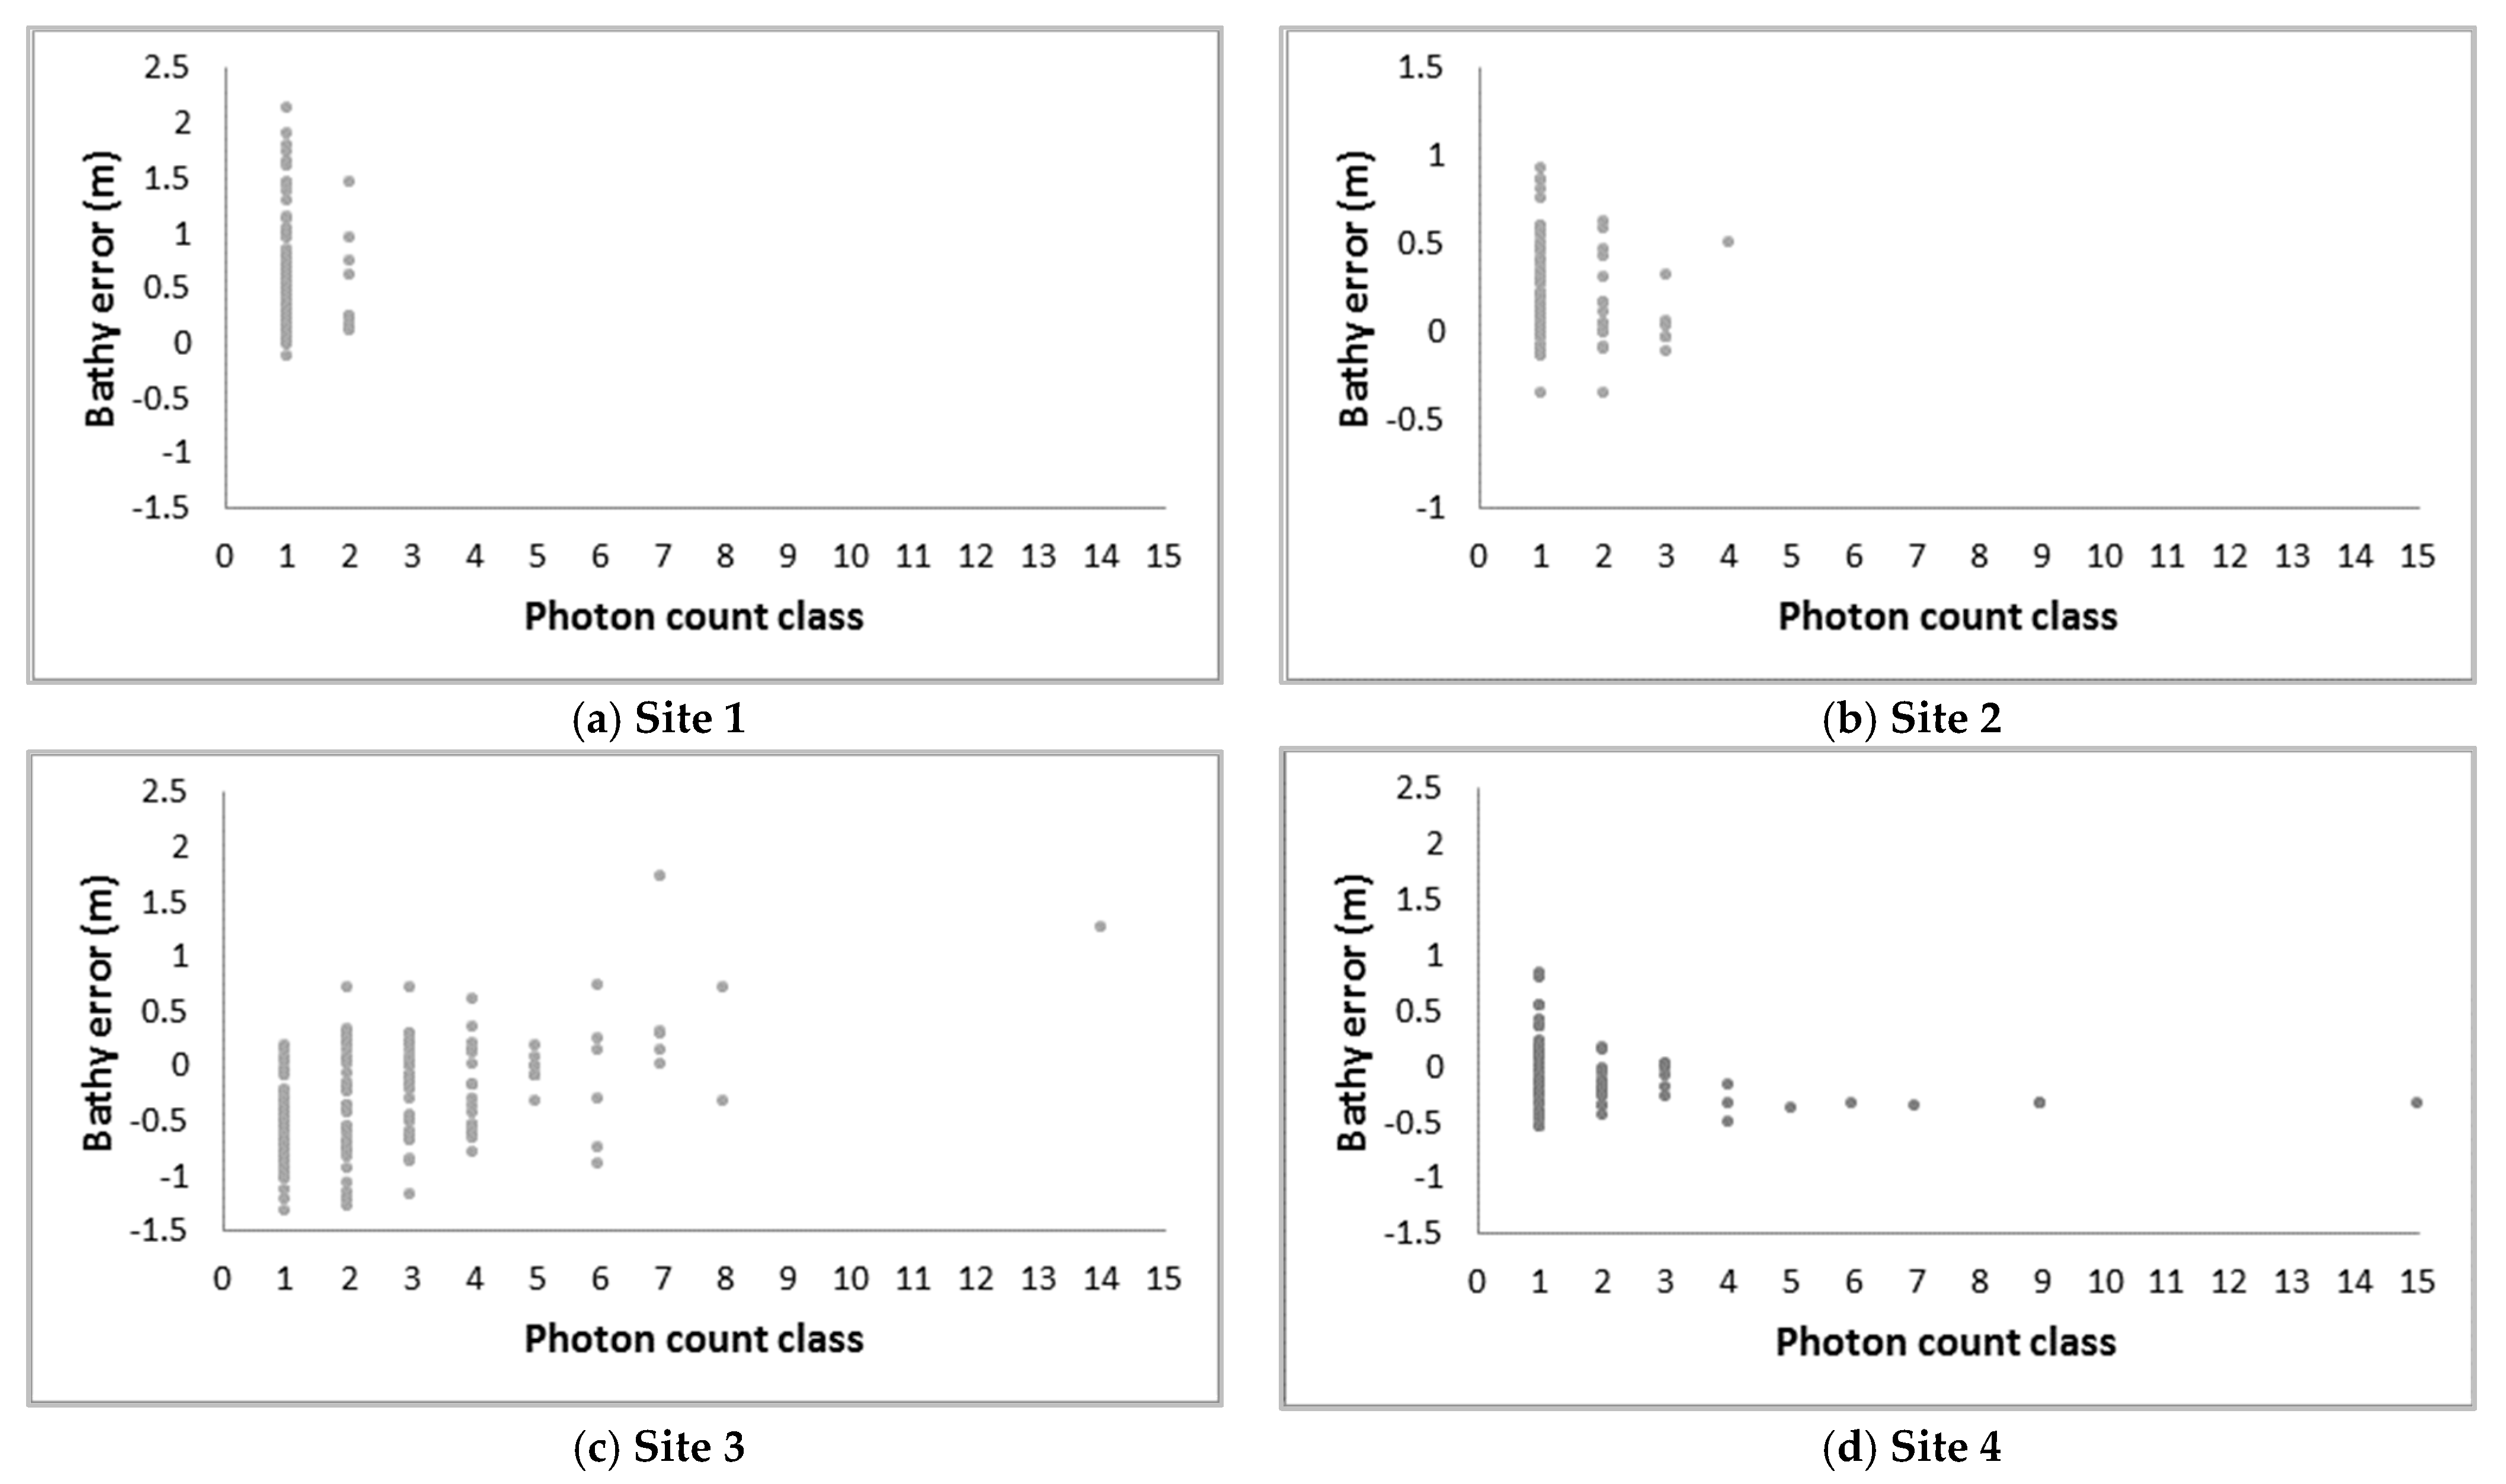
Our analysis (Figure 7) suggests that the incidence of larger bathymetric errors in deeper water is related to the presence of smaller numbers of geolocated photons in deeper water (Figure 7). The geolocated photons that corresponded with the seabed at all four test sites were typically characterised by some local vertical variability (Figure 8). We observed that multiple similar (but not identical) bathymetric values often occur at very close to the same horizontal positions, particularly in shallow water (Figure 8). The post-extraction filter was applied to the data-derived mean bathymetric values in cases where multiple geolocated photons were located within a 1-m horizontal radius of one another, generating a single ICESat-2 bathymetric value from up to 15 (though usually far fewer) separate near co-located photons (Figure 2d). Higher bathymetric accuracies were observed where multiple near co-located photons were available for bathymetric averaging.
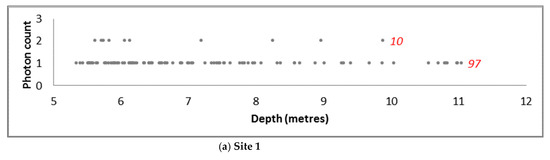
Figure 7.
Unfiltered geolocated photon counts by depth at (a) Site 1, (b) Site 2, (c) Site 3, and (d) Site 4. Red numeric labels denote the absolute numbers of photons in each photon count category at each test site.
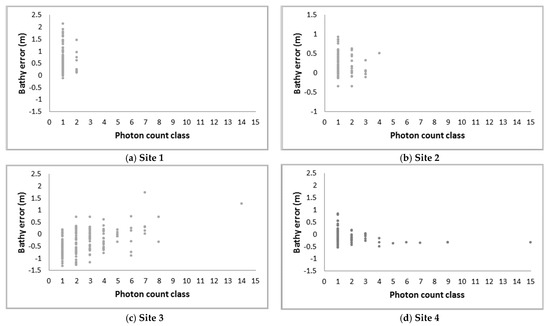
Figure 8.
Bathymetric errors (in metres) in relation to the number of geolocated photons that were available for bathymetric averaging within 1-m radius of one another at (a) Site 1, (b) Site 2, (c) Site 3, and (d) Site 4.
Critically, determining a mean bathymetric value in deeper water was often limited to one or two geolocated photons only (Figure 7). Plotting local (1-m radius) photon counts by depth (Figure 7) demonstrates that the largest local photon counts were associated with the shallowest depths, and that deeper photons were generally characterised by the lowest photon counts. The number of geolocated photons that were available in 1-m depth bands at all four test sites is outlined in Figure 7. The y-axis denotes the number of geolocated photons that were used to produce the filtered bathymetric values, and the x-axis denotes the 1-m depth bands at each test site. The total number of photons (across all depths) in each ‘photon count’ category is denoted by a red numeric label.
Generally speaking, the larger the number of available geolocated photons, the closer their average approached the correct bathymetric value (i.e., the MBES and GNSS bathymetric reference data values). Where only one geolocated photon was available for averaging, the post-filtered ICESat-2 bathymetric values may represent more of the (unknown) random error within individual geolocated photons.
The bathymetric averaging approach that was implemented here was intended to deal with the issue of bathymetric variability among multiple geolocated bathymetric photons that are located within close horizontal proximity to one another (Figure 2d). Consequently, there may be scope for improving the accuracy of the filtered ICESat-2 bathymetric data by more closely considering the vertical distribution of bathymetric values that are represented among 1-m radial groupings of geolocated photons. In cases where more than two geolocated photons are present, applying averaging alone may overlook situations in which a majority of photons are closer to the local maximum or local bathymetric minimum. Vertical separations between geolocated photons in radial photon sets, median values or modal values may all provide additional useful information, with the potential to achieve better bathymetric accuracies. These may represent useful avenues for future research. Likewise, developing a mechanism for adjusting the horizontal range across which geolocated photons are grouped (for bathymetric averaging) in deeper water may be worthy of future consideration. Furthermore, since ICESat-2 bathymetric values do appear to be overestimated in our deeper water data (Figure 6a,b) and profile cross-section plots (Figure 4a,b), a percentile estimate, which rejects the upper tail of estimates, may be advantageous. Deeper waters offer more opportunities for photon scattering due to the longer water column path length, and such scattering will lead to longer photon return paths. This may explain the tendency for overestimation of bathymetry in deeper waters; however, the probability of backscatter (and hence underestimation of depth) also occurs, so the net effect of the water optical properties is complex [34] (Figure 4).
Data availability is a potential limiting factor for bathymetric applications of ICESat-2. The number of marine ICESat-2 profile segments that contained coherent bathymetric returns around the coast of Ireland was quite limited. Our evaluation of ICESat-2 was conducted within an Irish research project [35] where water column turbidity [36] the effect of wind [37] and Atlantic swell [38] on the water surface can all be expected to occur. Therefore, more bathymetric data may be expected in other mid-latitude contexts that are less affected by these environmental constraints [33]. Notwithstanding the aforementioned constraints in Irish waters, 28 relatively continuous nearshore segments of ICESat-2 marine profiles (multiple local nearshore segments were often associated with a single ICESat-2 orbit event) contained sufficiently coherent bathymetric returns (visually determined before the data download) to be worthy of bathymetric extraction (Figure 1). This amounted to perhaps 5% of all the nearshore marine profile segments that were available within the 3-year data range (September 2018 to September 2021). Multiple nearshore segments were often derived from a single satellite orbit event, which may be indirectly observed in Figure 1. Therefore, it is difficult to estimate how many orbits may produce useable bathymetric data. Consequently, the acquisition of ICESat-2 bathymetric data may be expected to be episodic, being more likely in sheltered bays than in exposed locations. Nonetheless, the 91-day repeat cycle of ICESat-2 presents more potential opportunities to acquire data in a single calendar year than can realistically be expected for ALB or MBES surveys. Therefore, where environmental conditions are favourable and where MBES or ALB data are unavailable, ICESat-2 constitutes a source of accurate bathymetric data.
ICESat-2 bathymetric data have recently been applied in a number of studies [30,31,32] to provide calibration data for empirical SDB modelling and mapping. The applicability of this approach may be limited to localised sheltered locations, where constraining environmental factors are largely absent. This is because the potential for accurate calibration typically reduces with distance from the training data [15]. Nonetheless, in situations where ALB or MBES data are not available; ICESat-2 may present up to six ICESat-2 bathymetric profiles (across a 10 km swath). Opportunities may be somewhat limited in more turbid mid-latitude waters, such as around Ireland [36]. However, where conditions are more favourable, ICESat-2 bathymetry will provide greater potential. ICESat-2 bathymetric data may also be of use as an additional independent validation of SDB maps produced by methods that do not require bathymetric calibration data [33], since for this application, the ad hoc nature of its location is less important.
One final issue that needs to be discussed is the discrepancies that we observed in the bathymetric profiles at the two shallow-water test sites, especially at Site 3 (Figure 4c,d). Unfortunately, no pre-existing external bathymetric reference data were available that could be used for accuracy comparison at Sites 3 and 4. Consequently, GNSS data were acquired when very low-tide conditions permitted survey access. However, even these conditions constrained GNSS data acquisition to ICESat-2 data depths of approximately 3 m, where bathymetric accuracies of 0.3 m were observed (Table 3). These results did provide a general basis for concluding that ICESat-2 offers scope for shallow-water applications in the more turbid water conditions that typify the Irish east coast (Monteys et al., 2015). However, these bathymetric errors were more than double the levels that were observed at the same depth range at Site 2 (i.e., 0.13 m), and with respect to Site 3, areas of clear discrepancy between the ICESat-2 data and GNSS were apparent (Figure 4c). Nonetheless, these larger bathymetric errors at Sites 3 and 4 appear likely to have been caused by intertidal changes in beach profile that occurred within the 26-month period that separated the ICESat-2 bathymetric data and the GNSS survey data. No analysis of beach sediment transport was undertaken at any of the four accuracy testing sites. However, visual interpretation of the ICESat-2 profiles at Sites 3 (Figure 4c) and 4 (Figure 4d) does suggest that beach material at both sites may be subject to intertidal movement. This analysis is supported by the apparent presence of a meandering intertidal steam course at Site 3 and the existence of parallel sand bars at Site 4. Evidence of the intertidal movement of beach sediment was also incidentally observed onsite by the GNSS survey team. Note that the imagery in Figure 3c,d (provided within the ArcGIS 10.x mapping application as mixed-source imagery via the ESRI Digital Globe service) is included to provide locational context only, and does not necessarily correspond to the actual situation of data acquisition. Therefore, the most that can be concluded perhaps is that, while a 26-month time interval between acquisition of the ICESat-2 and GNSS survey data did provide a useful basis for evaluating bathymetric shallow-water sites, it was clearly not optimal.
In reference to other locations around the Irish coast where ICESat-2 bathymetric data were extracted (Figure 1), none of the remaining 24 (out of a total of 28) extracted ICESat-2 profile segments provided overlaps with existing bathymetric comparison data. The majority of these profile segments were located along the east and south coast (Figure 1), presenting too few ICESat-2 bathymetric data points to warrant their own GNSS comparison surveys. A few additional deeper-water profile segments were extracted on the west coast (Figure 1), but no bathymetric comparison data were available for these locations, and these sites were inaccessible for GNSS ground survey.
The final aim of this study was to describe the processing chain that was applied to extract bathymetric geolocated photons, to adjust for water column refraction and to filter the geolocated photon data. The semi-manual methods that were applied in this paper are not presented as an optimal solution for bathymetric extraction, refraction adjustment and local multi-photon bathymetric filtering. However, at the time of writing, no automated method for ICESat-2 bathymetric extraction is yet available in a publicly published form. Furthermore, the accuracies that were achieved may suggest that the (commonly used and repeatable) methods that are detailed within here might provide useful reference material for prospective users of ICESat-2 bathymetric data.
5. Conclusions
The primary aims of this study were to evaluate the potential performance of ICESat-2 marine bathymetric data in a mid-latitude temperate context, determining if accuracies varied by depth, and reporting the ICESat-2 bathymetric data processing chain that was implemented in a manner that could be repeated in the future. Based upon the results from accuracy testing at four test sites, ICESat-2 bathymetric data appear to perform satisfactorily in mid-latitude temperate waters. ICESat-2 bathymetric errors of less than 0.15 m were noted up to depths of 5 m, with errors increasing to less than 0.25 m up to a depth of 6 m and less than 0.54 m up to a depth of 11 m. Deeper bathymetric laser penetration was evident at the west coast test sites (Sites 1 and 2) than at the east coast test sites, with accuracy validation being possible to maximum depths of greater than 11 m. Overall, the results suggest potential for using ICESat-2 profile data to obtain accurate bathymetry up to depths of approximately 10 m. While the study was confined to Irish waters only, the observed accuracies may provide a basis for considering the prospects to encounter similar accuracies in other mid-latitude contexts. While ICESat-2 can provide transect data only, the accuracies that were observed were closely comparable to the 0.3 m accuracy (typically for 95% of LiDAR soundings) that is commonly reported for Airborne LiDAR Bathymetry. The 91-day repeat cycle of the ICESat-2 satellite does make it theoretically possible to acquire up to six parallel profiles of bathymetric data from one orbit and up to four repeat orbits at one location within a single calendar year. However, in practice, the availability of profiles containing bathymetric may be best in more sheltered locations.
With regard to error at different depths, a clear tendency was observed for the smallest errors to occur in shallow water, with the largest errors being predominantly confined to deeper water. Availability of fewer geolocated photons in deeper water limited the potential for local bathymetric averaging in depths beyond 11 m. Generally speaking, the greater the number of geolocated photons that were located within a 1-m horizontal radius, the more closely their averaged bathymetric values converged with the reference MBES and GNSS nearshore bathymetric data from the four test sites. The largest bathymetric errors were observed in depths between 9 m and 11 m, where the maximum number of near co-located geolocated photons was typically limited to one.
The accuracies observed to depths of 6 m (0.25 m MAE or better) and to depths of up to 11 m depth (0.54 m MAE) suggested ICESat-2 bathymetric data might be productively applied to calibrate SDB modelling and mapping in mid-latitude waters where MBES and ALB data acquisition is difficult and where environmental conditions favour bathymetric acquisition. With regard to the data processing chain, the semi-manual methods that were applied for ICESat-2 bathymetric extraction, water column refraction adjustment and local bathymetric filtering achieved satisfactory accuracies. Particular attention was paid to using commonly available geospatial tools only. Therefore, the data processing workflow that was implemented may be some interest to prospective users ICESat-2 bathymetric data elsewhere.
Author Contributions
Conceptualization, S.C., X.M. and J.D.H.; methodology, S.C., X.M. and J.D.H.; software, S.C.; validation, S.C., X.M. and Y.C.-C.; formal analysis, S.C., X.M. and J.D.H.; investigation, S.C., X.M. and Y.C.-C.; resources, S.C., X.M. and B.K.; data curation, S.C., X.M. and Y.C.-C.; writing—original draft preparation, S.C.; writing—review and editing, S.C., X.M., J.D.H. and B.K.; visualization, S.C., X.M. and J.D.H.; supervision, X.M. and B.K.; project administration, S.C., X.M and B.K.; funding acquisition, S.C. All authors have read and agreed to the published version of the manuscript.
Funding
This research was funded by Geological Survey Ireland, grant number 2019-PD-90027.
Data Availability Statement
The data presented in this study are available on request from the corresponding author.
Acknowledgments
The authors wish to acknowledge that Academic supervision by co-author Brian Kelleher at Dublin City University was supported by Science Foundation Ireland, co-funded by the Geological Survey of Ireland and the Marine Institute (Investigator Programme, grant number 16/IA/45209) and iCRAG (SFI Research Centre, 13/RC/2092_P2).
Conflicts of Interest
The authors declare no conflict of interest.
References
- O’Toole, R.; Judge, M.; Sacchetti, F.; Furey, T.; Mac Craith, E.; Sheehan, K.; Kelly, S.; Cullen, S.; McGrath, F.; Monteys, X. Mapping Ireland’s coastal, shelf and deep-water environments using illustrative case studies to highlight the impact of seabed mapping on the generation of blue knowledge. Geol. Soc. Lond. U. K. Spec. Publ. 2020, 505, 97–123. [Google Scholar] [CrossRef]
- Kotilainen, A.T.; Kaskela, A.M. Comparison of airborne LiDAR and shipboard acoustic data in complex shallow water environments: Filling in the white ribbon zone. Mar. Geol. 2017, 385, 250–259. [Google Scholar] [CrossRef]
- Leon, J.X.; Phinn, S.R.; Hamylton, S.; Saunders, M.I. Filling the ‘white ribbon’—A multisource seamless digital elevation model for Lizard Island, northern Great Barrier Reef. Int. J. Remote Sens. 2013, 34, 6337–6354. [Google Scholar] [CrossRef]
- Zhao, J.; Zhao, X.; Zhang, H.; Zhou, F. Improved model for depth bias correction in airborne LiDAR bathymetry systems. Remote Sens. 2017, 9, 710. [Google Scholar] [CrossRef] [Green Version]
- Coveney, S.; Monteys, X. Integration potential of INFOMAR airborne LIDAR bathymetry with external onshore LIDAR data sets. J. Coast. Res. 2011, 62, 19–29. [Google Scholar] [CrossRef]
- Perry, G.J. Post-processing in laser airborne bathymetry systems. In Proceedings of the ROPME/PERSGA/IHB Workshop on Hydrographic Activities in the ROPME Sea area and Red Sea, Kuwait City, Kuwait, 24–27 October 1999; Volume 13, pp. 24–27. [Google Scholar]
- Finkl, C.W.; Benedet, L.; Andrews, J.L. Interpretation of seabed geomorphology based on spatial analysis of high-density airborne laser bathymetry. J. Coast. Res. 2005, 21, 501–514. [Google Scholar] [CrossRef] [Green Version]
- Saylam, K.; Brown, R.A.; Hupp, J.R. Assessment of depth and turbidity with airborne Lidar bathymetry and multiband satellite imagery in shallow water bodies of the Alaskan North Slope. Int. J. Appl. Earth Obs. Geoinf. 2017, 58, 191–200. [Google Scholar] [CrossRef]
- Karlsson, T.; Pe’eri, S.; Axelsson, A. The impact of sea state condition on airborne LiDAR bathymetry measurements. In Laser Radar Technology and Applications XVII; International Society for Optics and Photonics: Baltimore, MD, USA, 2012; Volume 8379, p. 837913. [Google Scholar]
- Stumpf, R.P.; Holderied, K.; Sinclair, M. Determination of water depth with high-resolution satellite imagery over variable bottom types. Limnol. Oceanogr.-Methods 2003, 48, 547–556. [Google Scholar] [CrossRef]
- Hamylton, S.M.; Hedley, J.D.; Beaman, R.J. Derivation of high-resolution bathymetry from multispectral satellite imagery: A comparison of empirical and optimisation methods through geographical error analysis. Remote Sens. 2015, 7, 16257–16273. [Google Scholar] [CrossRef] [Green Version]
- Cahalane, C.; Magee, A.; Monteys, X.; Casal, G.; Hanafin, J.; Harris, P. A comparison of Landsat 8, RapidEye and Pleiades products for improving empirical predictions of satellite-derived bathymetry. Remote Sens. Environ. 2019, 233, 111414. [Google Scholar] [CrossRef]
- Hedley, J.D.; Roelfsema, C.M.; Chollett, I.; Harborne, A.R.; Heron, S.F.; Weeks, S.; Skirving, W.J.; Strong, A.E.; Eakin, C.M.; Christensen, T.R.; et al. Remote sensing of coral reefs for monitoring and management: A review. Remote Sens. 2016, 8, 118. [Google Scholar] [CrossRef] [Green Version]
- Dekker, A.G.; Phinn, S.R.; Anstee, J.; Bissett, P.; Brando, V.E.; Casey, B.; Fearns, P.; Hedley, J.; Klonowski, W.; Lee, Z.P.; et al. Intercomparison of Shallow Water Bathymetry, Hydro-Optics, and Benthos Mapping Techniques in Australian and Caribbean Coastal Environment. Limnol. Oceanogr.-Methods 2011, 9, 396–425. [Google Scholar] [CrossRef] [Green Version]
- Casal, G.; Hedley, J.D.; Monteys, X.; Harris, P.; Cahalane, C.; McCarthy, T. Satellite-derived bathymetry in optically complex waters using a model inversion approach and Sentinel-2 data. Estuar. Coast. Shelf Sci. 2020, 241, 106814. [Google Scholar] [CrossRef]
- Neumann, T.A.; Martino, A.J.; Markus, T.; Bae, S.; Bock, M.R.; Brenner, A.C.; Brunt, K.M.; Cavanaugh, J.; Fernandes, S.T.; Hancock, D.W.; et al. The Ice, Cloud and Land Elevation Satellite-2 Mission: A Global Geolocated Photon Product. Remote Sens. Environ. 2019, 233, 11325. [Google Scholar] [CrossRef]
- Parrish, C.E.; Magruder, L.A.; Neuenschwander, A.L.; Forfinski-Sarkozi, N.; Alonzo, M.; Jasinski, M. Validation of ICESat-2 ATLAS bathymetry and analysis of ATLAS’s bathymetric mapping performance. Remote Sens. 2019, 11, 1634. [Google Scholar] [CrossRef] [Green Version]
- Li, Y.; Gao, H.; Jasinski, M.F.; Zhang, S.; Stoll, J.D. Deriving high-resolution reservoir bathymetry from ICESat-2 prototype photon-counting LiDAR and landsat imagery. IEEE Trans. Geosci. Remote Sen. 2019, 57, 7883–7893. [Google Scholar] [CrossRef]
- Markus, T.; Neumann, T.; Martino, A.; Abdalati, W.; Brunt, K.; Csatho, B.; Farrell, S.; Fricker, H.; Gardner, A.; Harding, D.; et al. The Ice, Cloud, and land Elevation Satellite-2 (ICESat-2): Science requirements, concept, and implementation. Remote Sens. Environ. 2017, 190, 260–273. [Google Scholar] [CrossRef]
- NSIDC (National Snow and Ice Data Center). ATLAS/ICESat-2 L2 A Global Geolocated Photon Data, Version 3, 2021. Available online: https://nsidc.org/data/atl03 (accessed on 18 March 2021).
- Neumann, T.; Brenner, A.; Hancock, D.; Robbins, J.; Saba, J.; Harbeck, K.; Gibbons, A.J.N.A. Ice, Cloud, and Land Elevation Satellite–2 (ICESat-2) Project: Algorithm Theoretical Basis Document (ATBD) for Global Geolocated Photons (ATL03); National Aeronautics and Space Administration, Goddard Space Flight Center: Greenbelt, MD, USA, 2019. [Google Scholar]
- Degnan, J.J. Photon-counting multikilohertz microlaser altimeters for airborne and spaceborne topographic measurements. J. Geodyn. 2002, 34, 503–549. [Google Scholar] [CrossRef] [Green Version]
- Popescu, S.C.; Zhou, T.; Nelson, R.; Neuenschwander, A.; Sheridan, R.; Narine, L.; Walsh, K.M. Photon counting LiDAR: An adaptive ground and canopy height retrieval algorithm for ICESat-2 data. Remote Sens. Environ. 2018, 208, 154–170. [Google Scholar] [CrossRef]
- Iliffe, J.C.; Ziebart, M.K.; Turner, J.F.; Talbot, A.J.; Lessnoff, A.P. Accuracy of vertical datum surfaces in coastal and offshore zones. Surv. Rev. 2013, 45, 254–262. [Google Scholar] [CrossRef]
- Ernstsen, V.B.; Noormets, R.; Hebbeln, D.; Bartholomä, A.; Flemming, B.W. Precision of high-resolution multibeam echo sounding coupled with high-accuracy positioning in a shallow water coastal environment. Geo-Mar. Lett. 2006, 26, 141–149. [Google Scholar] [CrossRef]
- Peters, J.L.; Butschek, F.; O’Connell, R.; Cummins, V.; Murphy, J.; Wheeler, A.J. Geological seabed stability model for informing Irish offshore renewable energy opportunities. Adv. Geosci. 2020, 54, 55–65. [Google Scholar] [CrossRef]
- OSI. Active GNSS Station Data. Available online: https://gnss.osi.ie/ (accessed on 3 June 2021).
- NSIDC. OpenAltimetry ICESat-2 Data Download Portal. Available online: https://openaltimetry.org/data/icesat2/ (accessed on 14 June 2021).
- Trimble. Trimble R4 S User Guide, Version 1 Revision C, Trimble Incorporated, Colorardo, USA. Available online: https://www.d3e.fr/pdf/Trimble%20R4S_userguide.pdf (accessed on 25 May 2021).
- Babbel, B.J.; Parrish, C.E.; Magruder, L.A. ICESat-2 elevation retrievals in support of satellite-derived bathymetry for global science applications. Geophys. Res. Lett. 2021, 48, e2020GL090629. [Google Scholar] [CrossRef]
- Ma, Y.; Xu, N.; Liu, Z.; Yang, B.; Yang, F.; Wang, X.H.; Li, S. Satellite-derived bathymetry using the ICESat-2 lidar and Sentinel-2 imagery datasets. Remote Sens. Environ. 2020, 250, 112047. [Google Scholar] [CrossRef]
- Albright, A.; Glennie, C. Nearshore Bathymetry From Fusion of Sentinel-2 and ICESat-2 Observations. IEEE Geosci. Remote Sens. Lett. 2020, 18, 900–904. [Google Scholar] [CrossRef]
- Hedley, J.D.; Velázquez-Ochoa, R.; Enríquez, S. Seagrass depth distribution mirrors coastal development in the Mexican Caribbean—An automated analysis of 800 satellite images. Front. Mar Sci. 2021, 1449, in press. [Google Scholar] [CrossRef]
- Richter, K.; Mader, D.; Westfeld, P.; Maas, H.G. Refined geometric modeling of laser pulse propagation in airborne LiDAR bathymetry. PFG-J. Photogramm. Rem. 2021, 89, 1–17. [Google Scholar]
- Coveney, S.; Monteys, X.; Kelleher, B.; Hedley, J.D. Bathymetric extraction from ICESAT-2 Advanced Topographic Laser Altimeter System photon returns: Depth penetration in diverse geophysical contexts. In Proceedings of the EGU General Assembly Conference Abstracts, Online, 4–8 May 2020; p. 10390. [Google Scholar]
- Monteys, X.; Harris, P.; Caloca, S.; Cahalane, C. Spatial prediction of coastal bathymetry based on multispectral satellite imagery and multibeam data. Remote Sens. 2015, 7, 13782–13806. [Google Scholar] [CrossRef] [Green Version]
- Met Eireann. What We Measure: Wind, Met Eireann. Available online: https://www.met.ie/climate/what-we-measure/wind (accessed on 21 August 2021).
- Met Eireann. Forecasts: Marine Waves. Available online: https://www.met.ie/forecasts/marine-incland-lakes/waves (accessed on 21 August 2021).


Publisher’s Note: MDPI stays neutral with regard to jurisdictional claims in published maps and institutional affiliations. |
© 2021 by the authors. Licensee MDPI, Basel, Switzerland. This article is an open access article distributed under the terms and conditions of the Creative Commons Attribution (CC BY) license (https://creativecommons.org/licenses/by/4.0/).