
Satellite-Based Human Settlement Datasets Inadequately Detect Refugee Settlements: A Critical Assessment at Thirty Refugee Settlements in Uganda


Abstract
:
1. Introduction
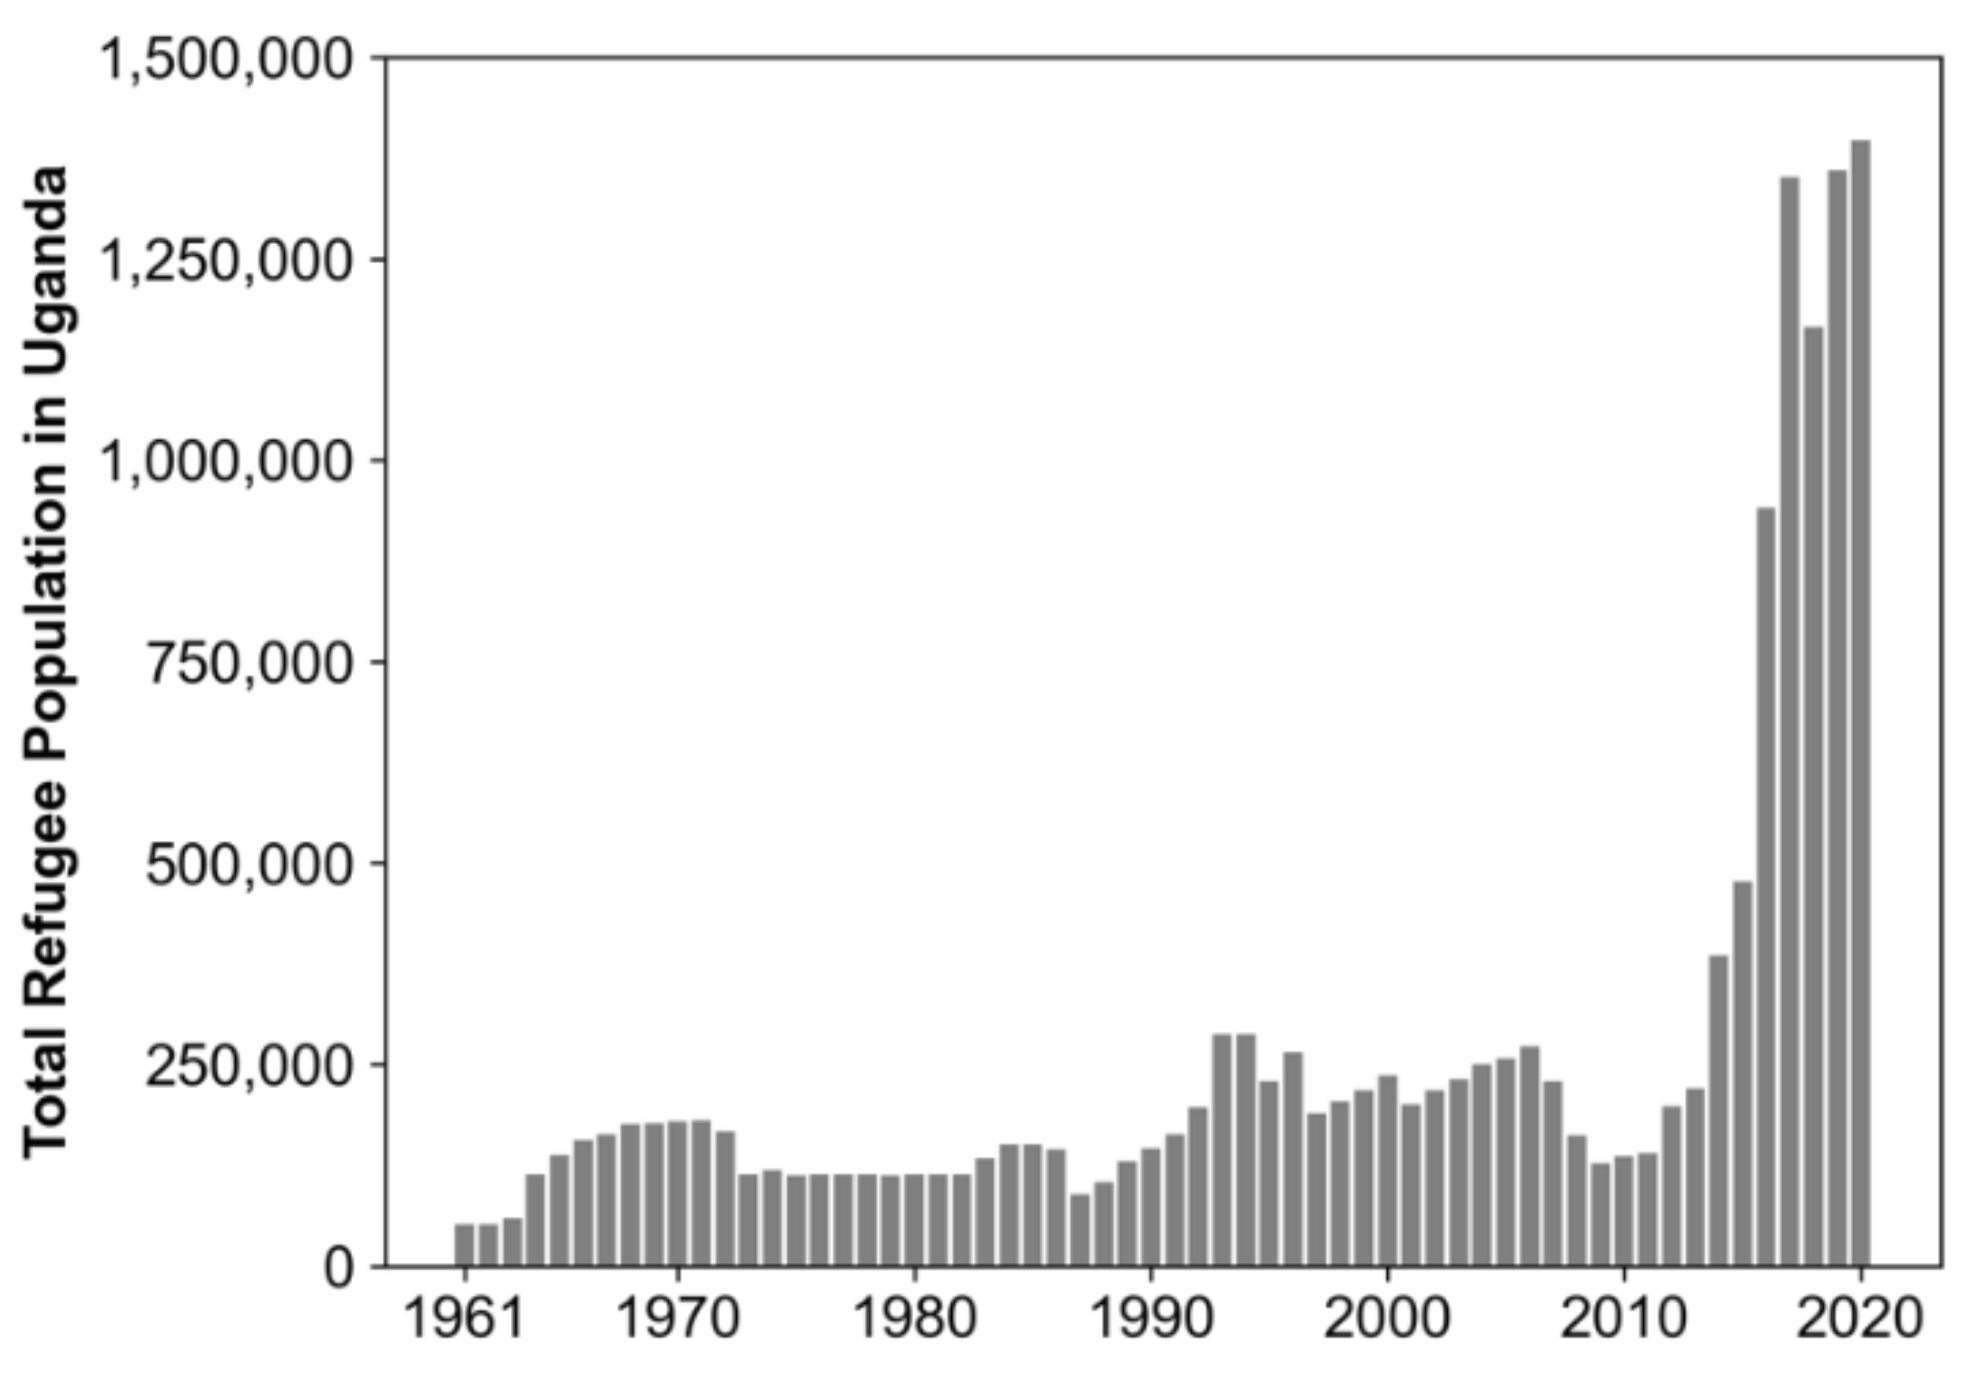
2. Study Area
3. Materials and Data
3.1. UNHCR Refugee Settlement Boundary Data
3.2. Human Settlement Datasets
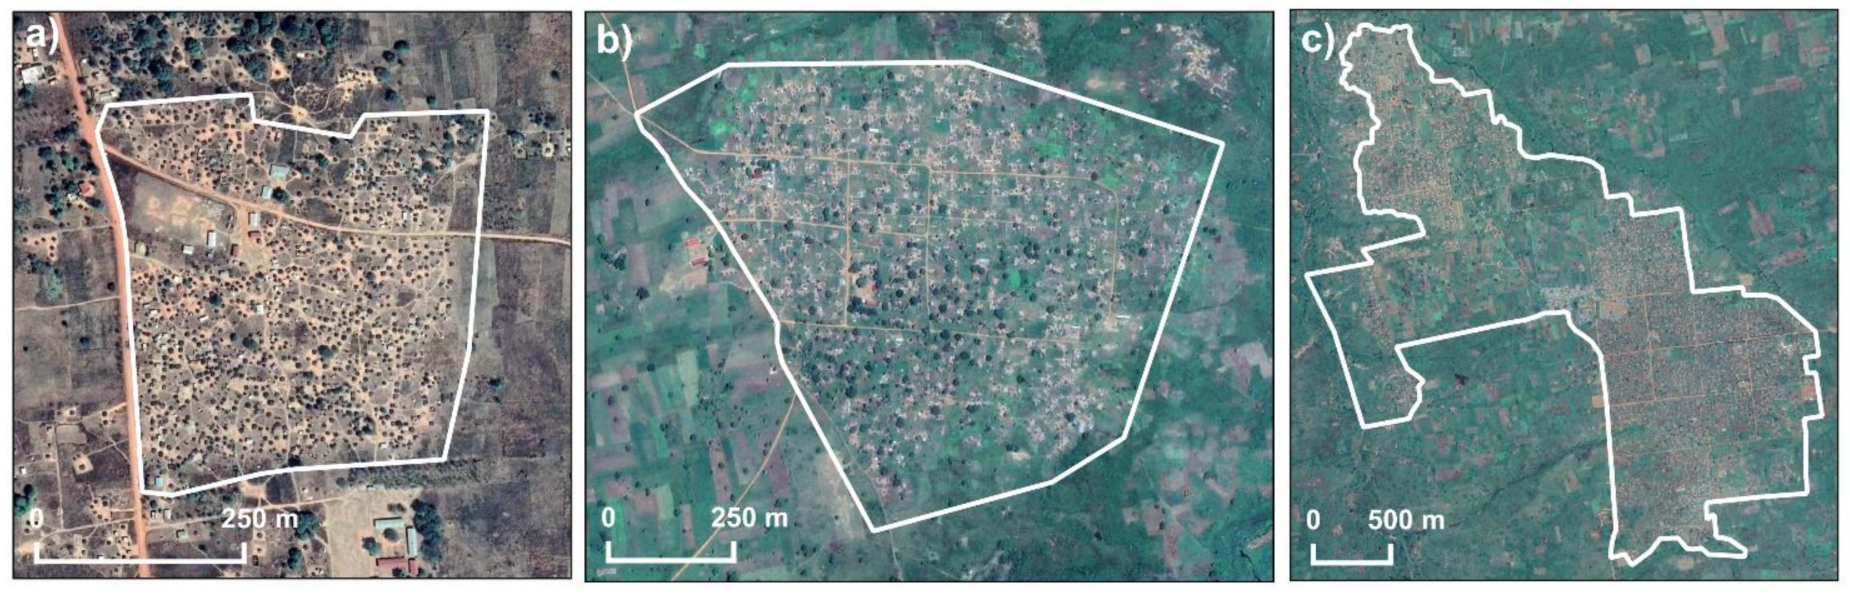
3.3. Refugee Settlement Building Footprint Data
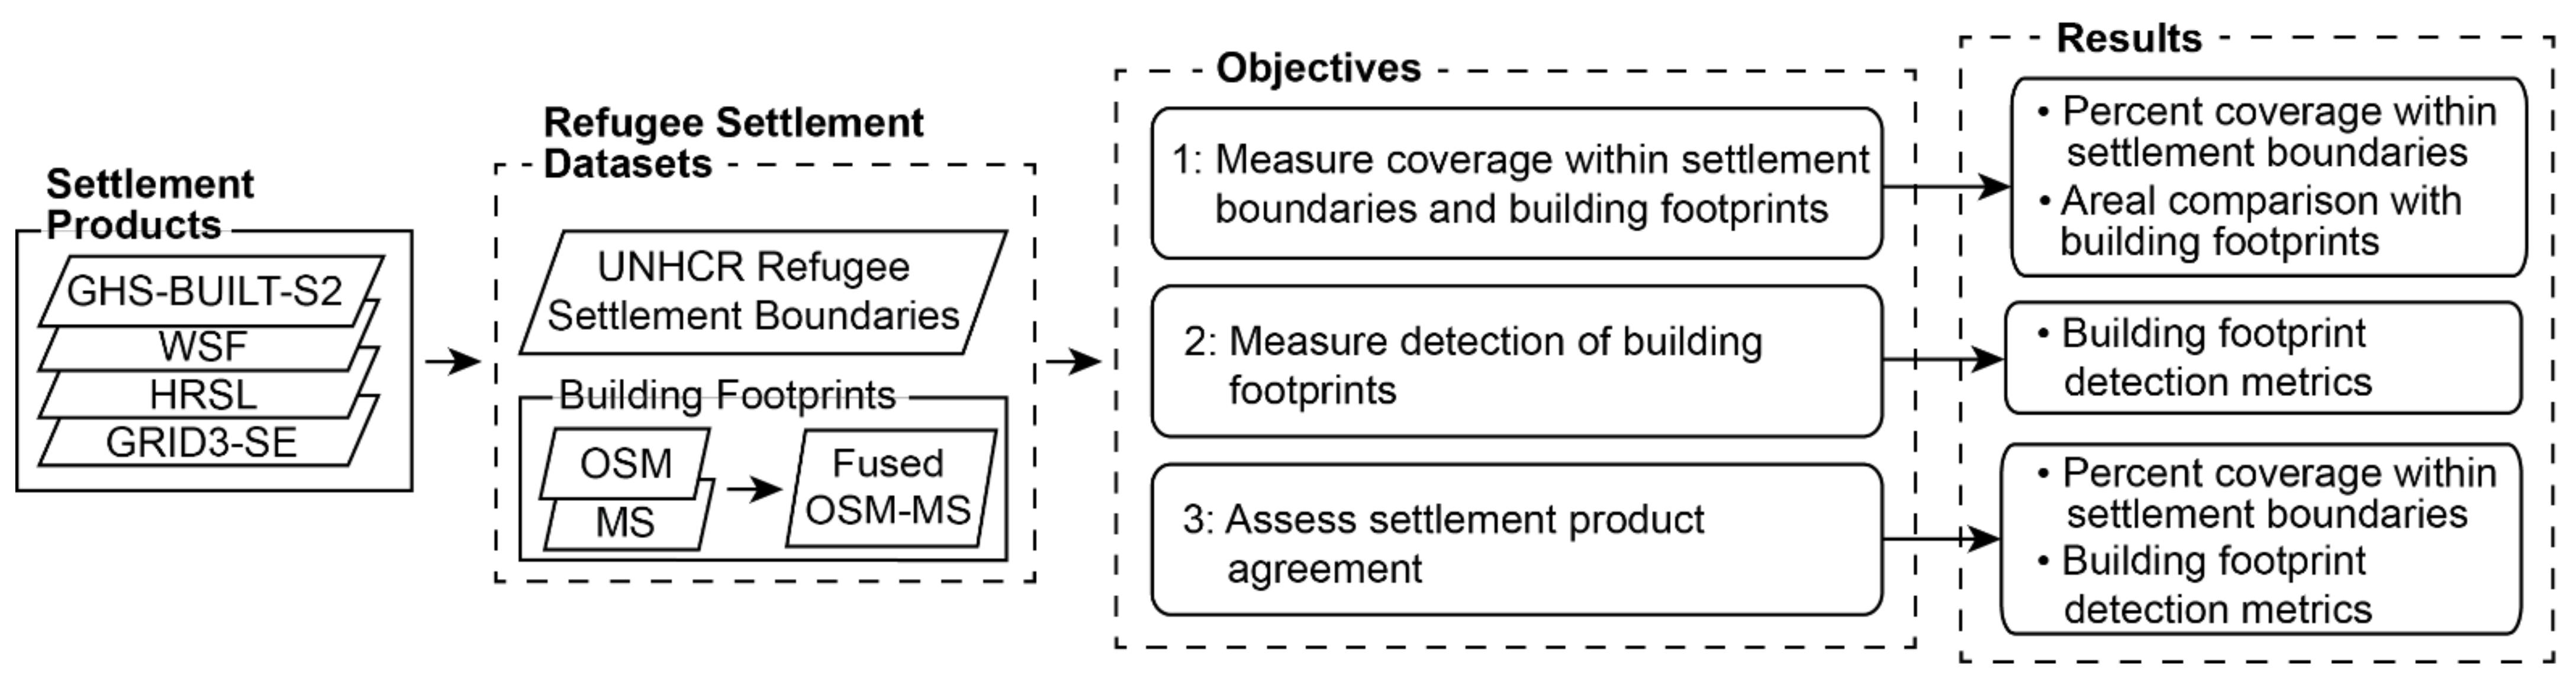
4. Methods
4.1. Objective 1: Measure Areal Coverage within Refugee Settlements
4.2. Objective 2: Measure Detection of Building Footprints within Refugee Settlements
4.3. Objective 3: Assess Agreement among Settlement Products
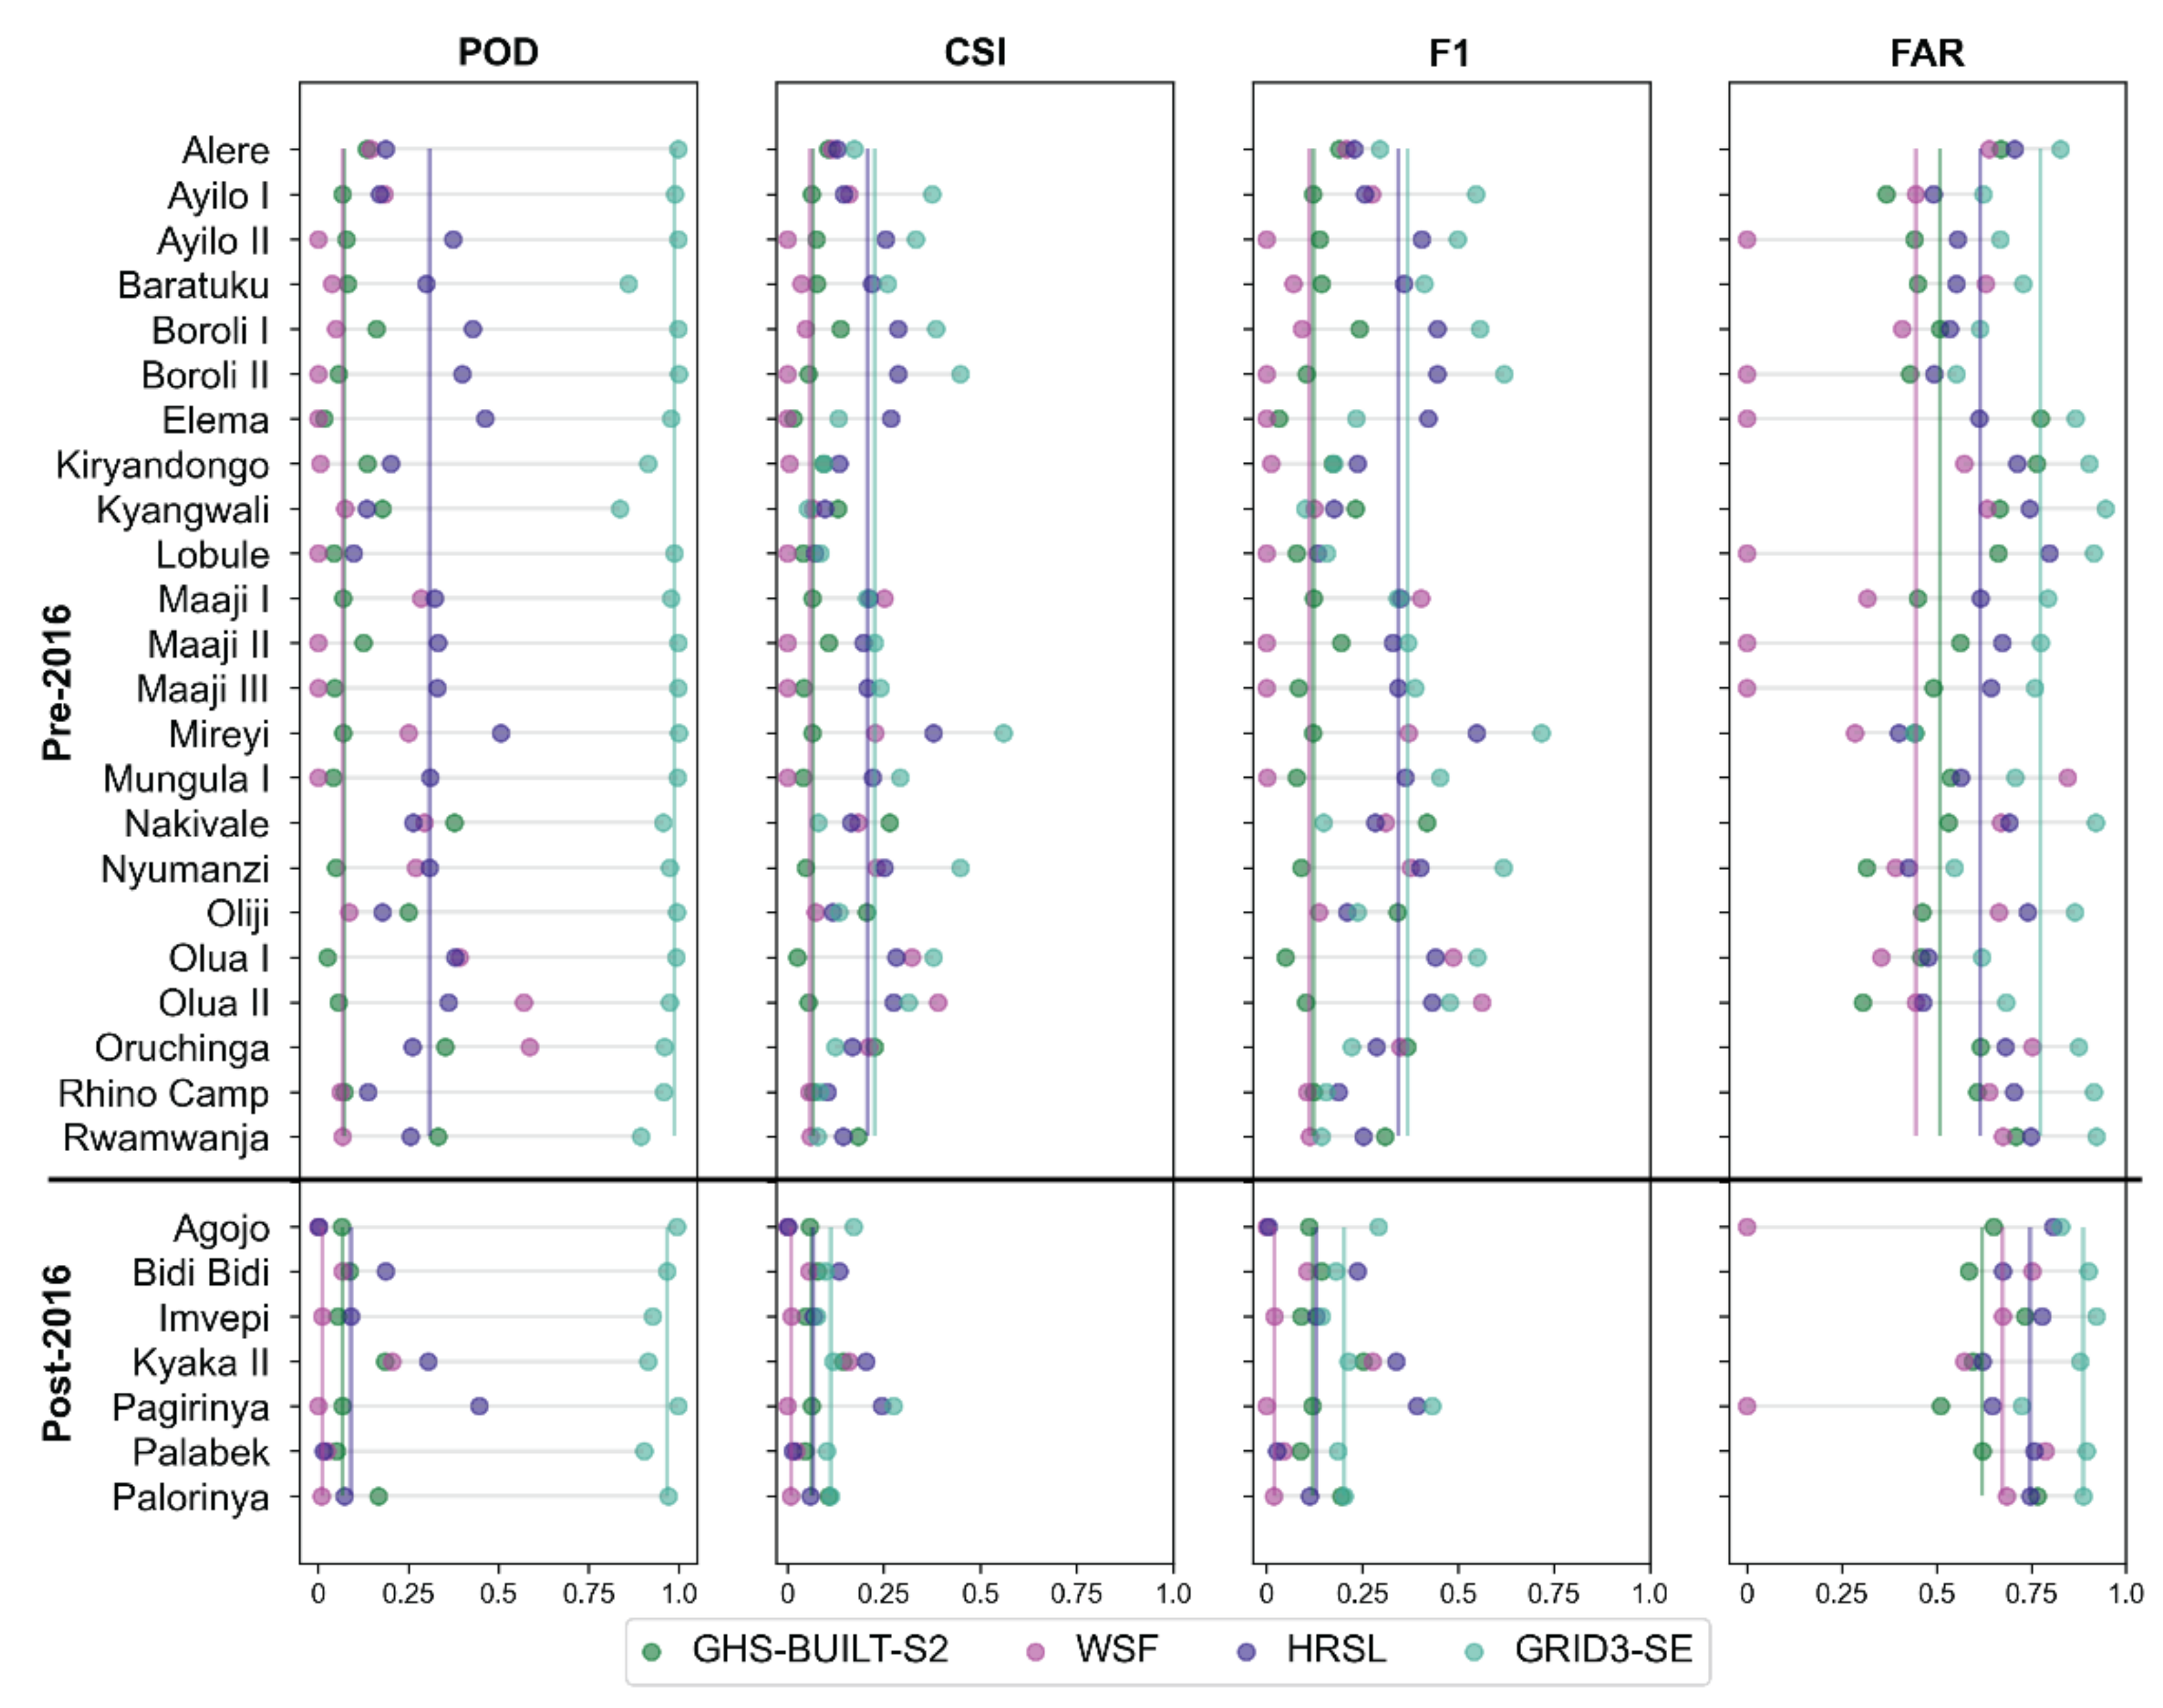
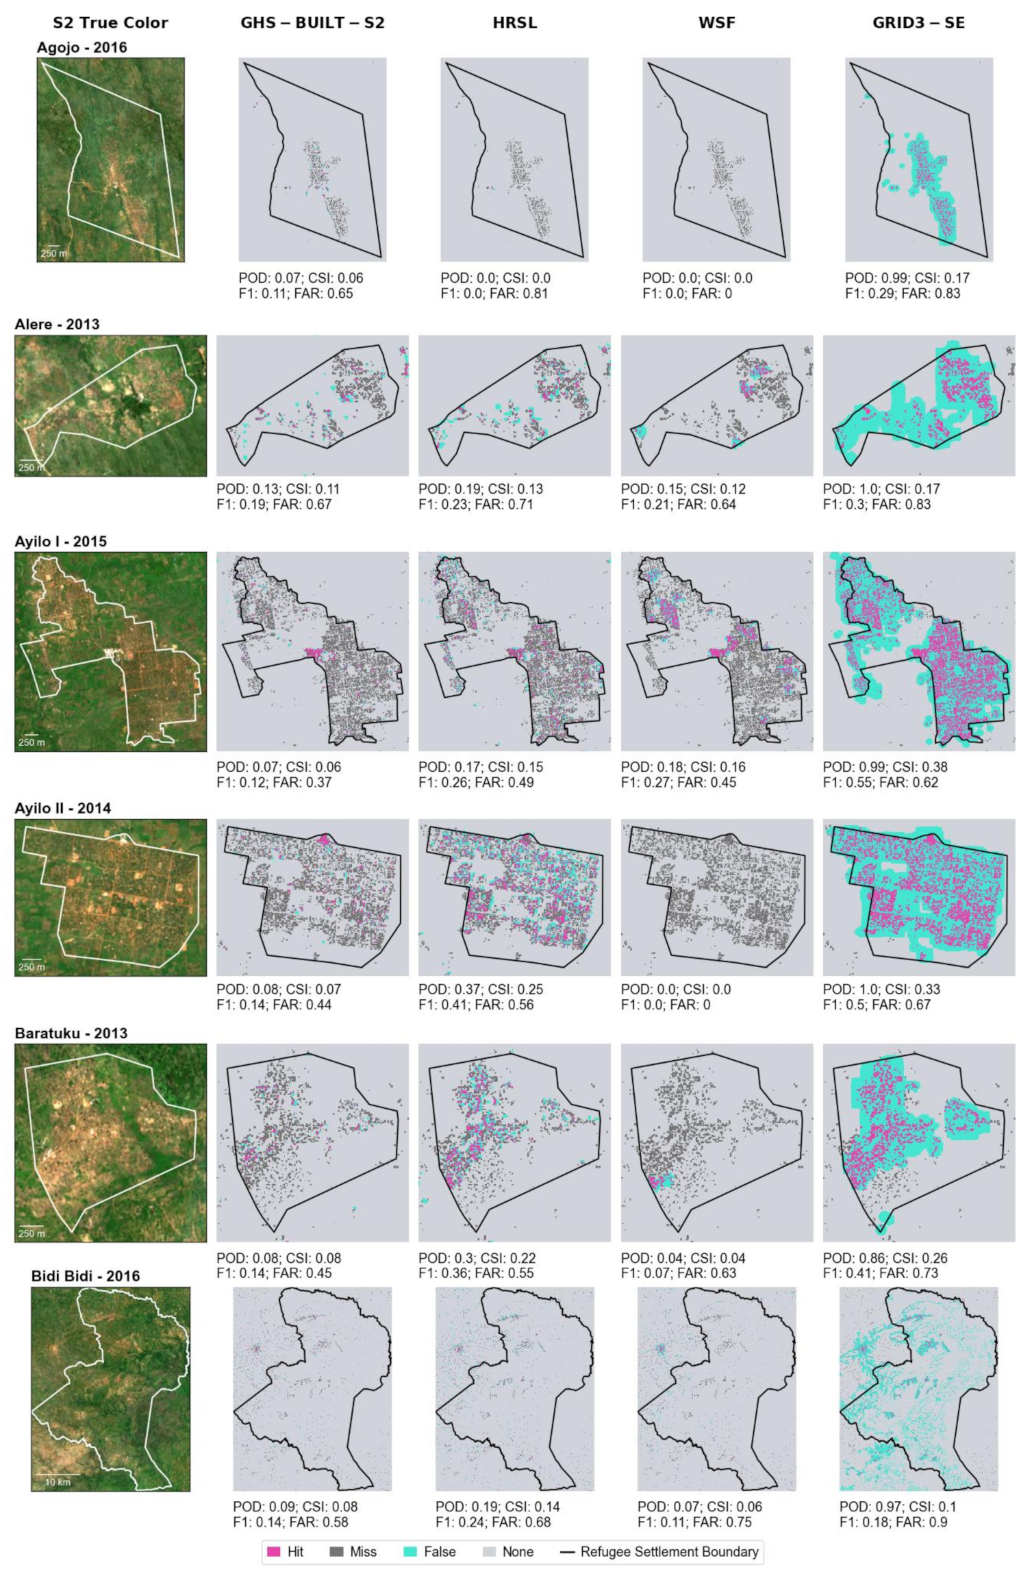
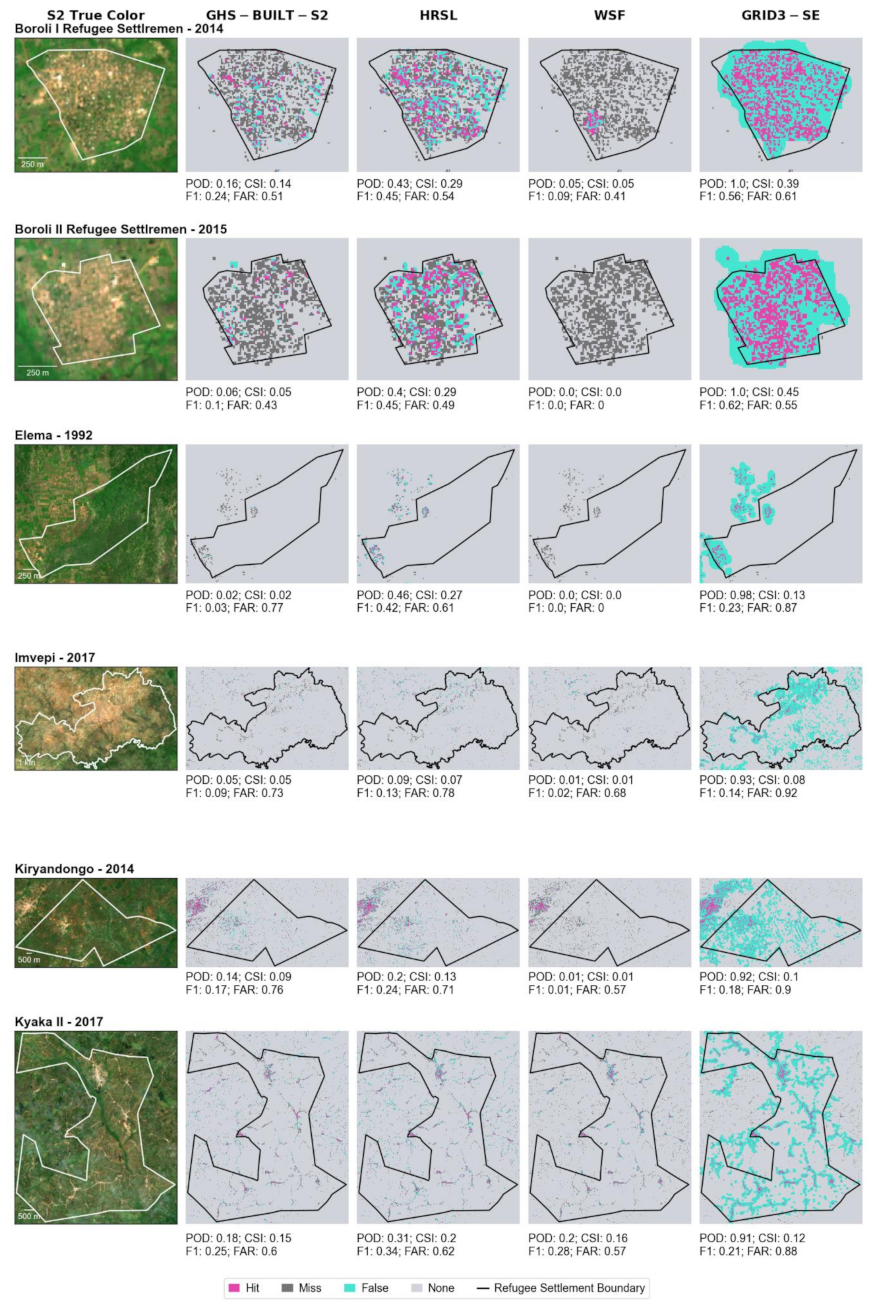
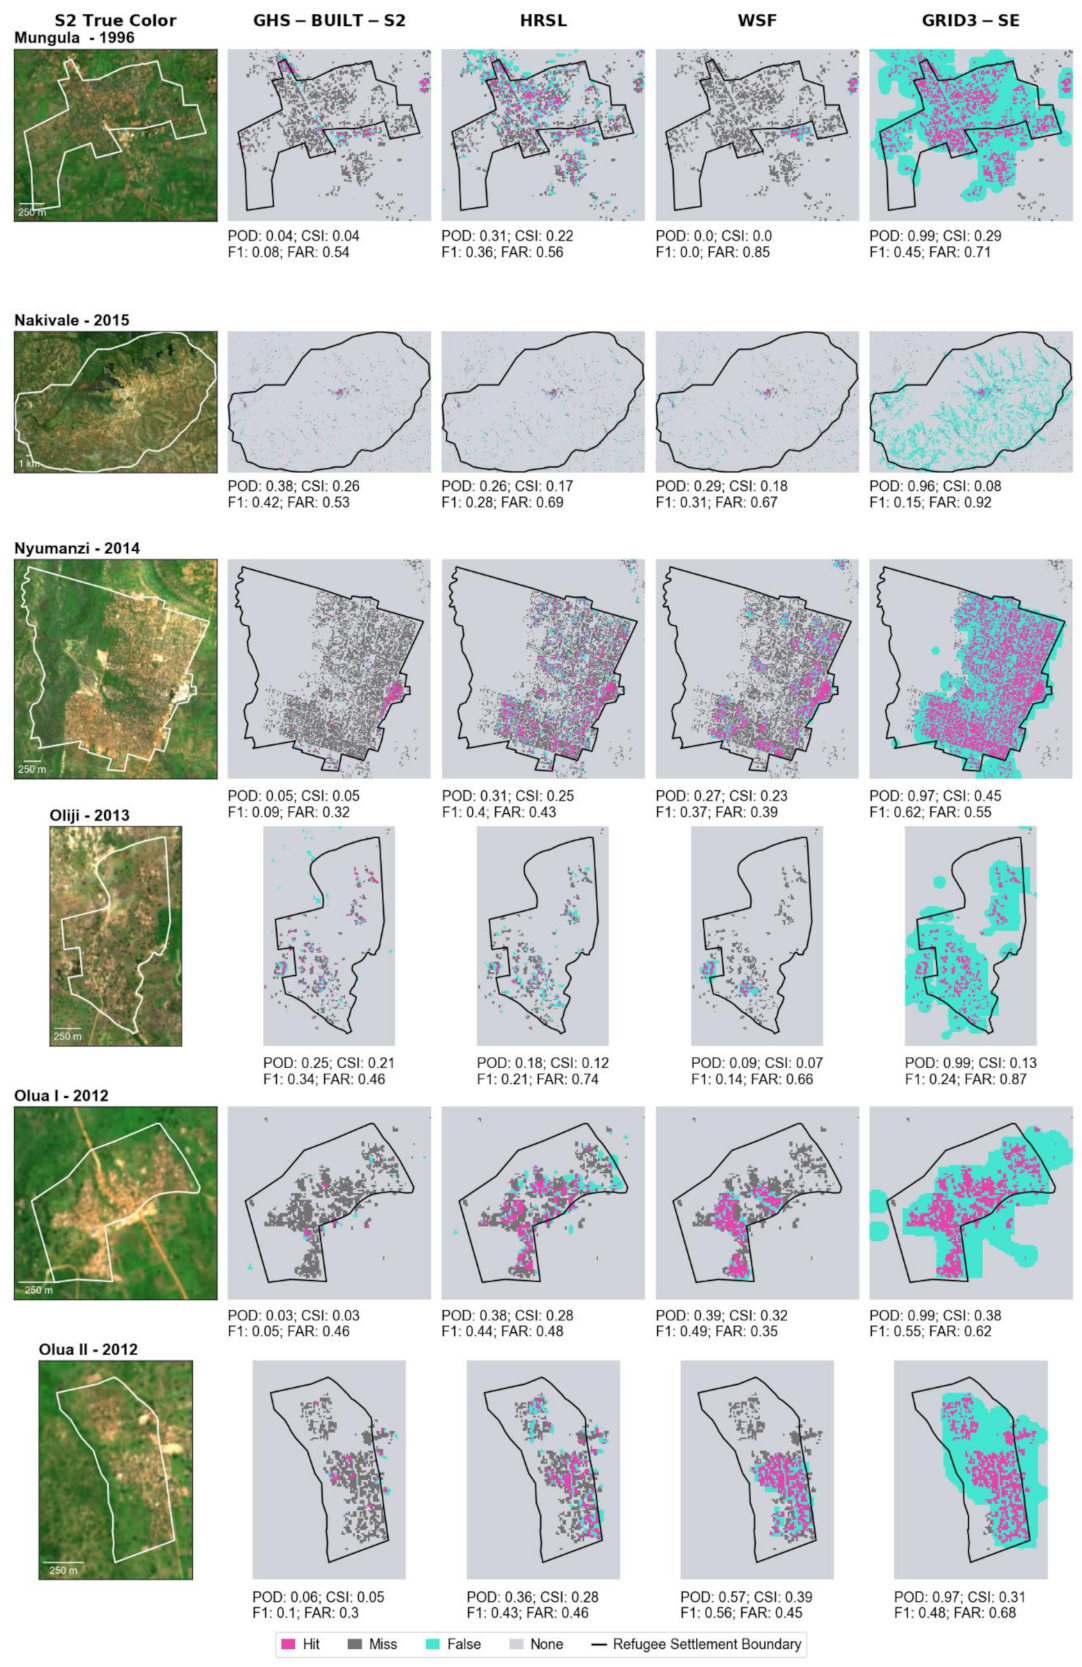
5. Results
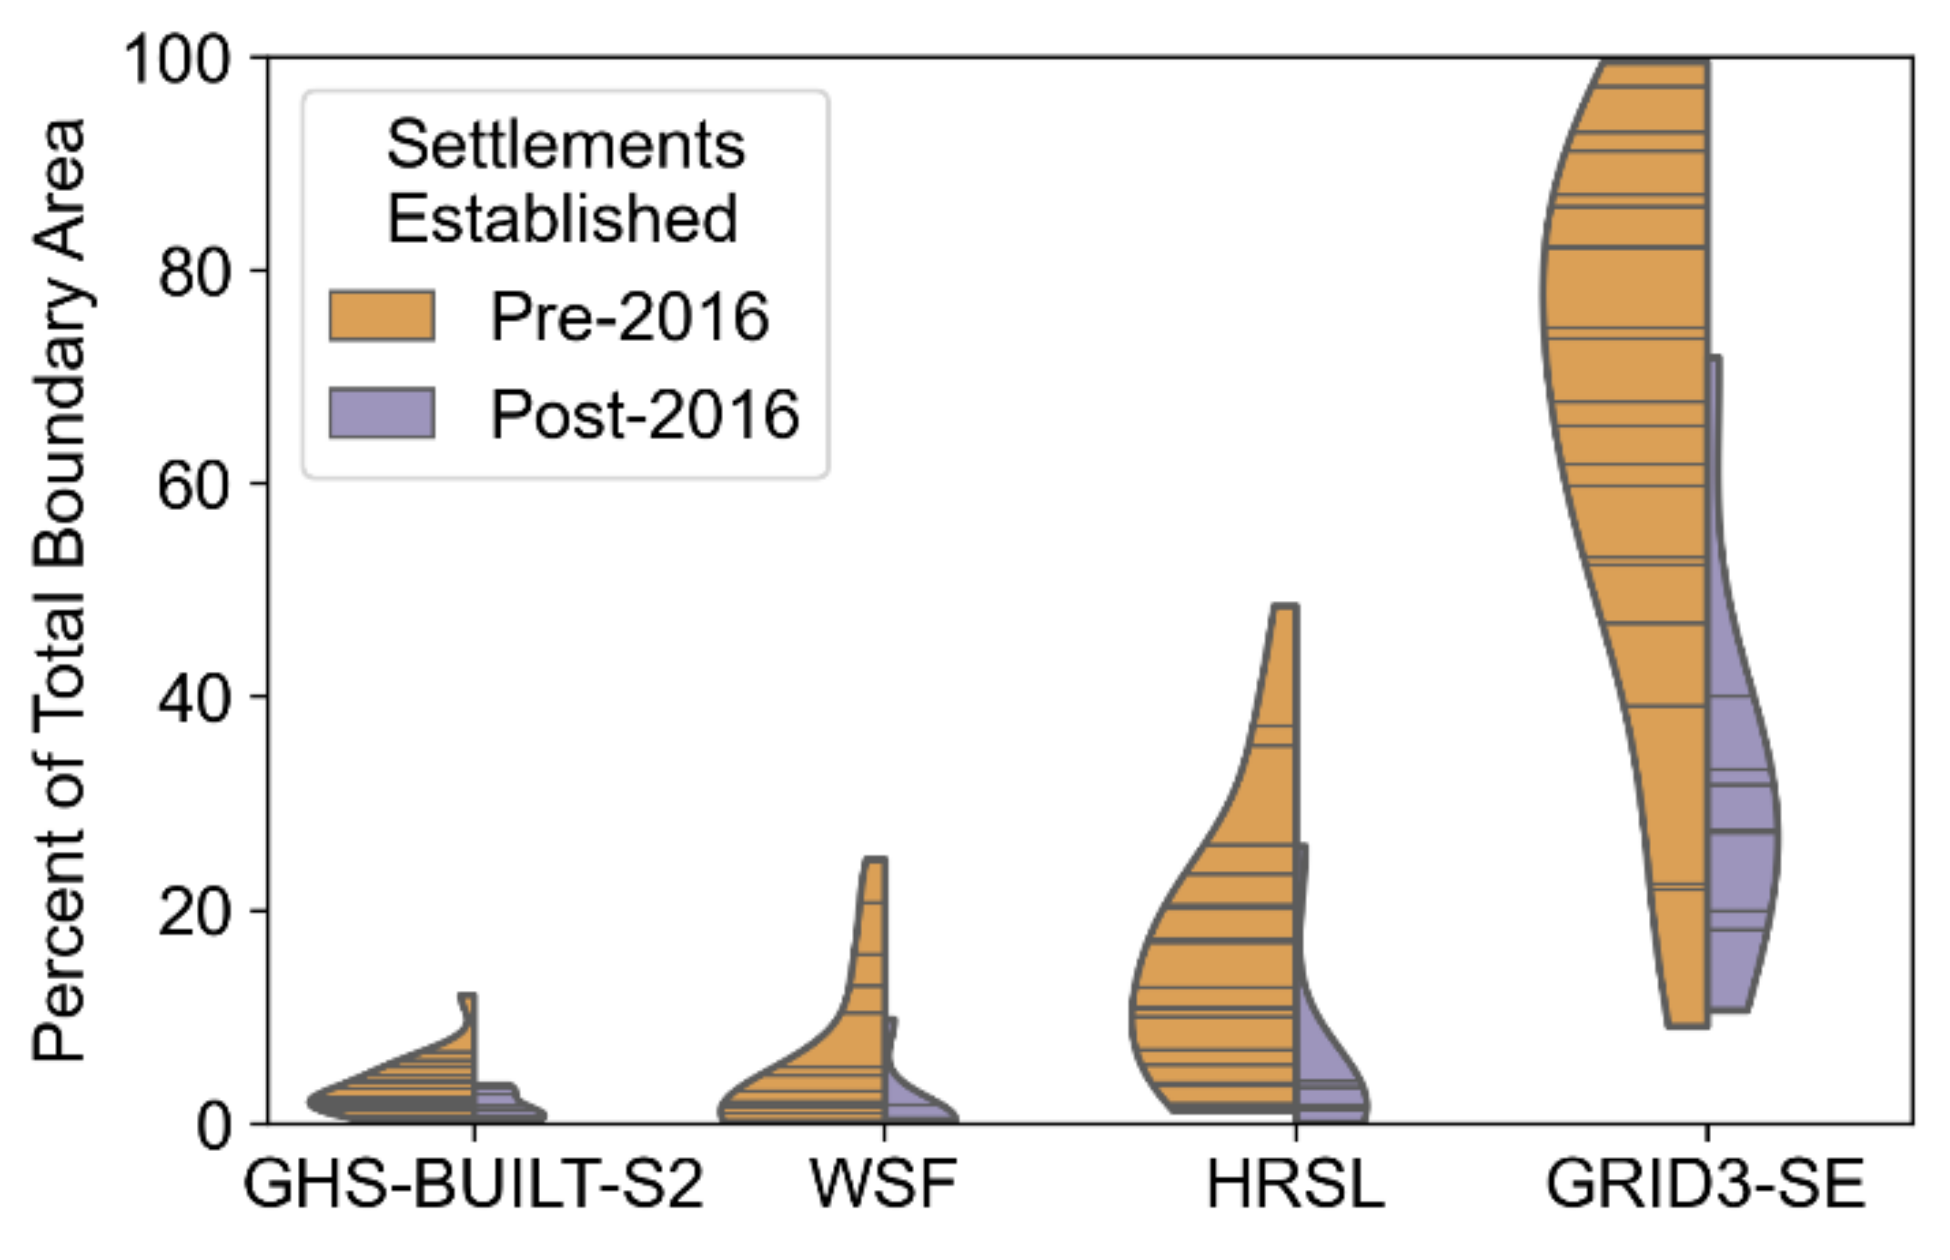
5.1. Objective 1: Measure Areal Coverage within Refugee Settlements
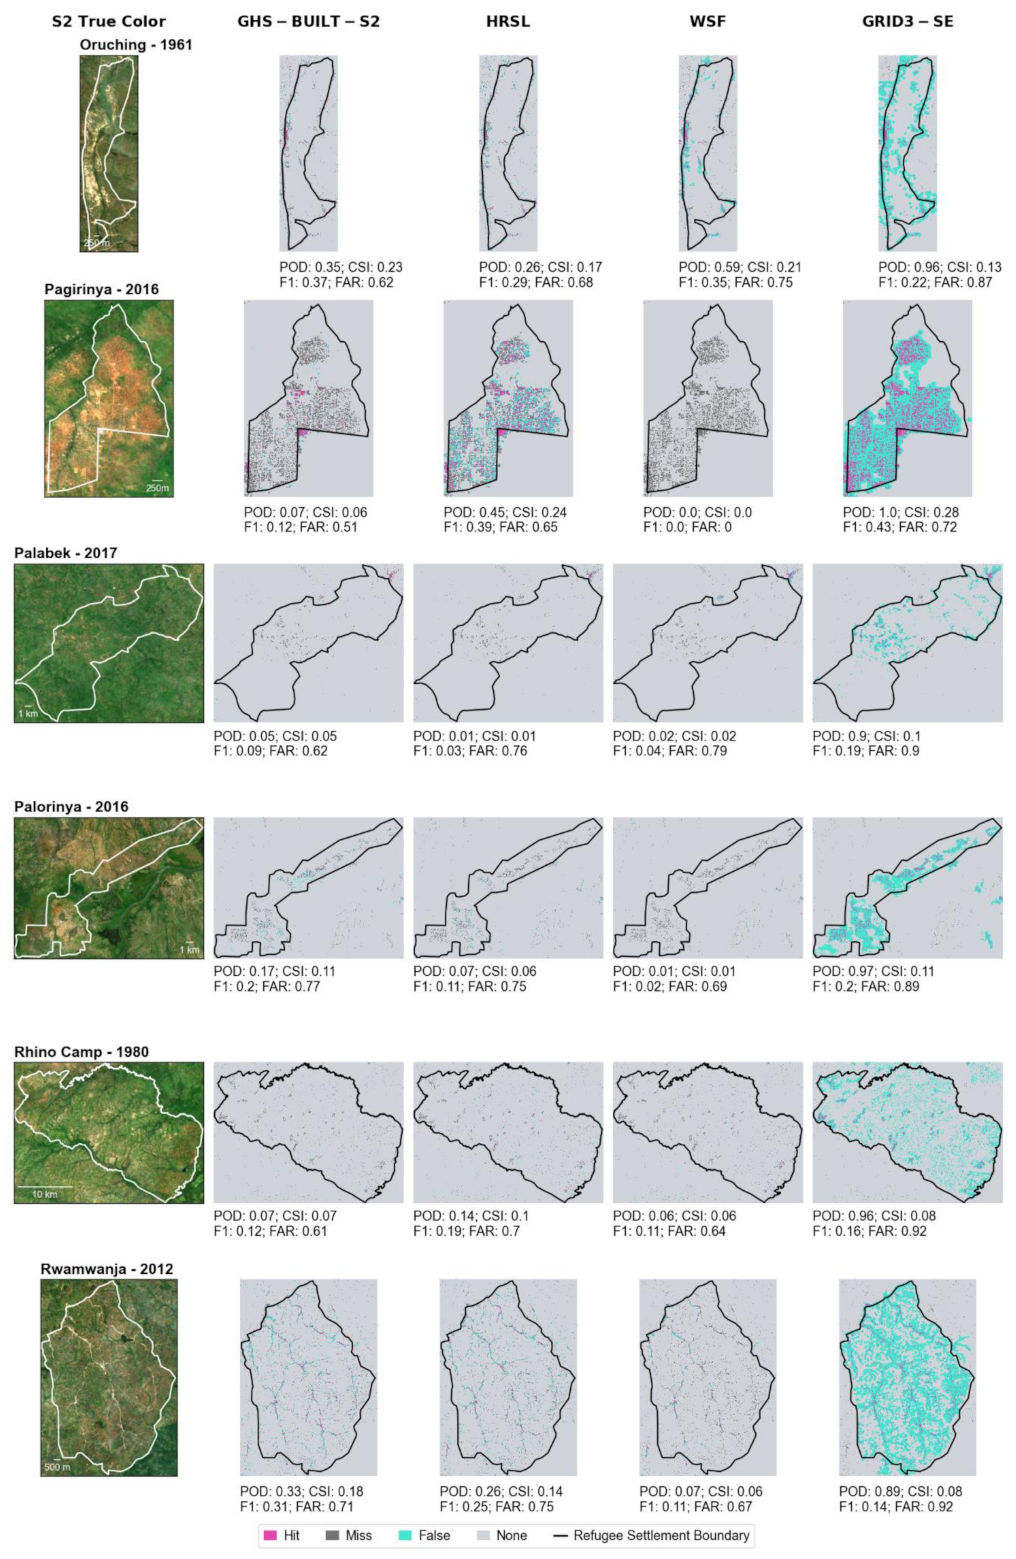
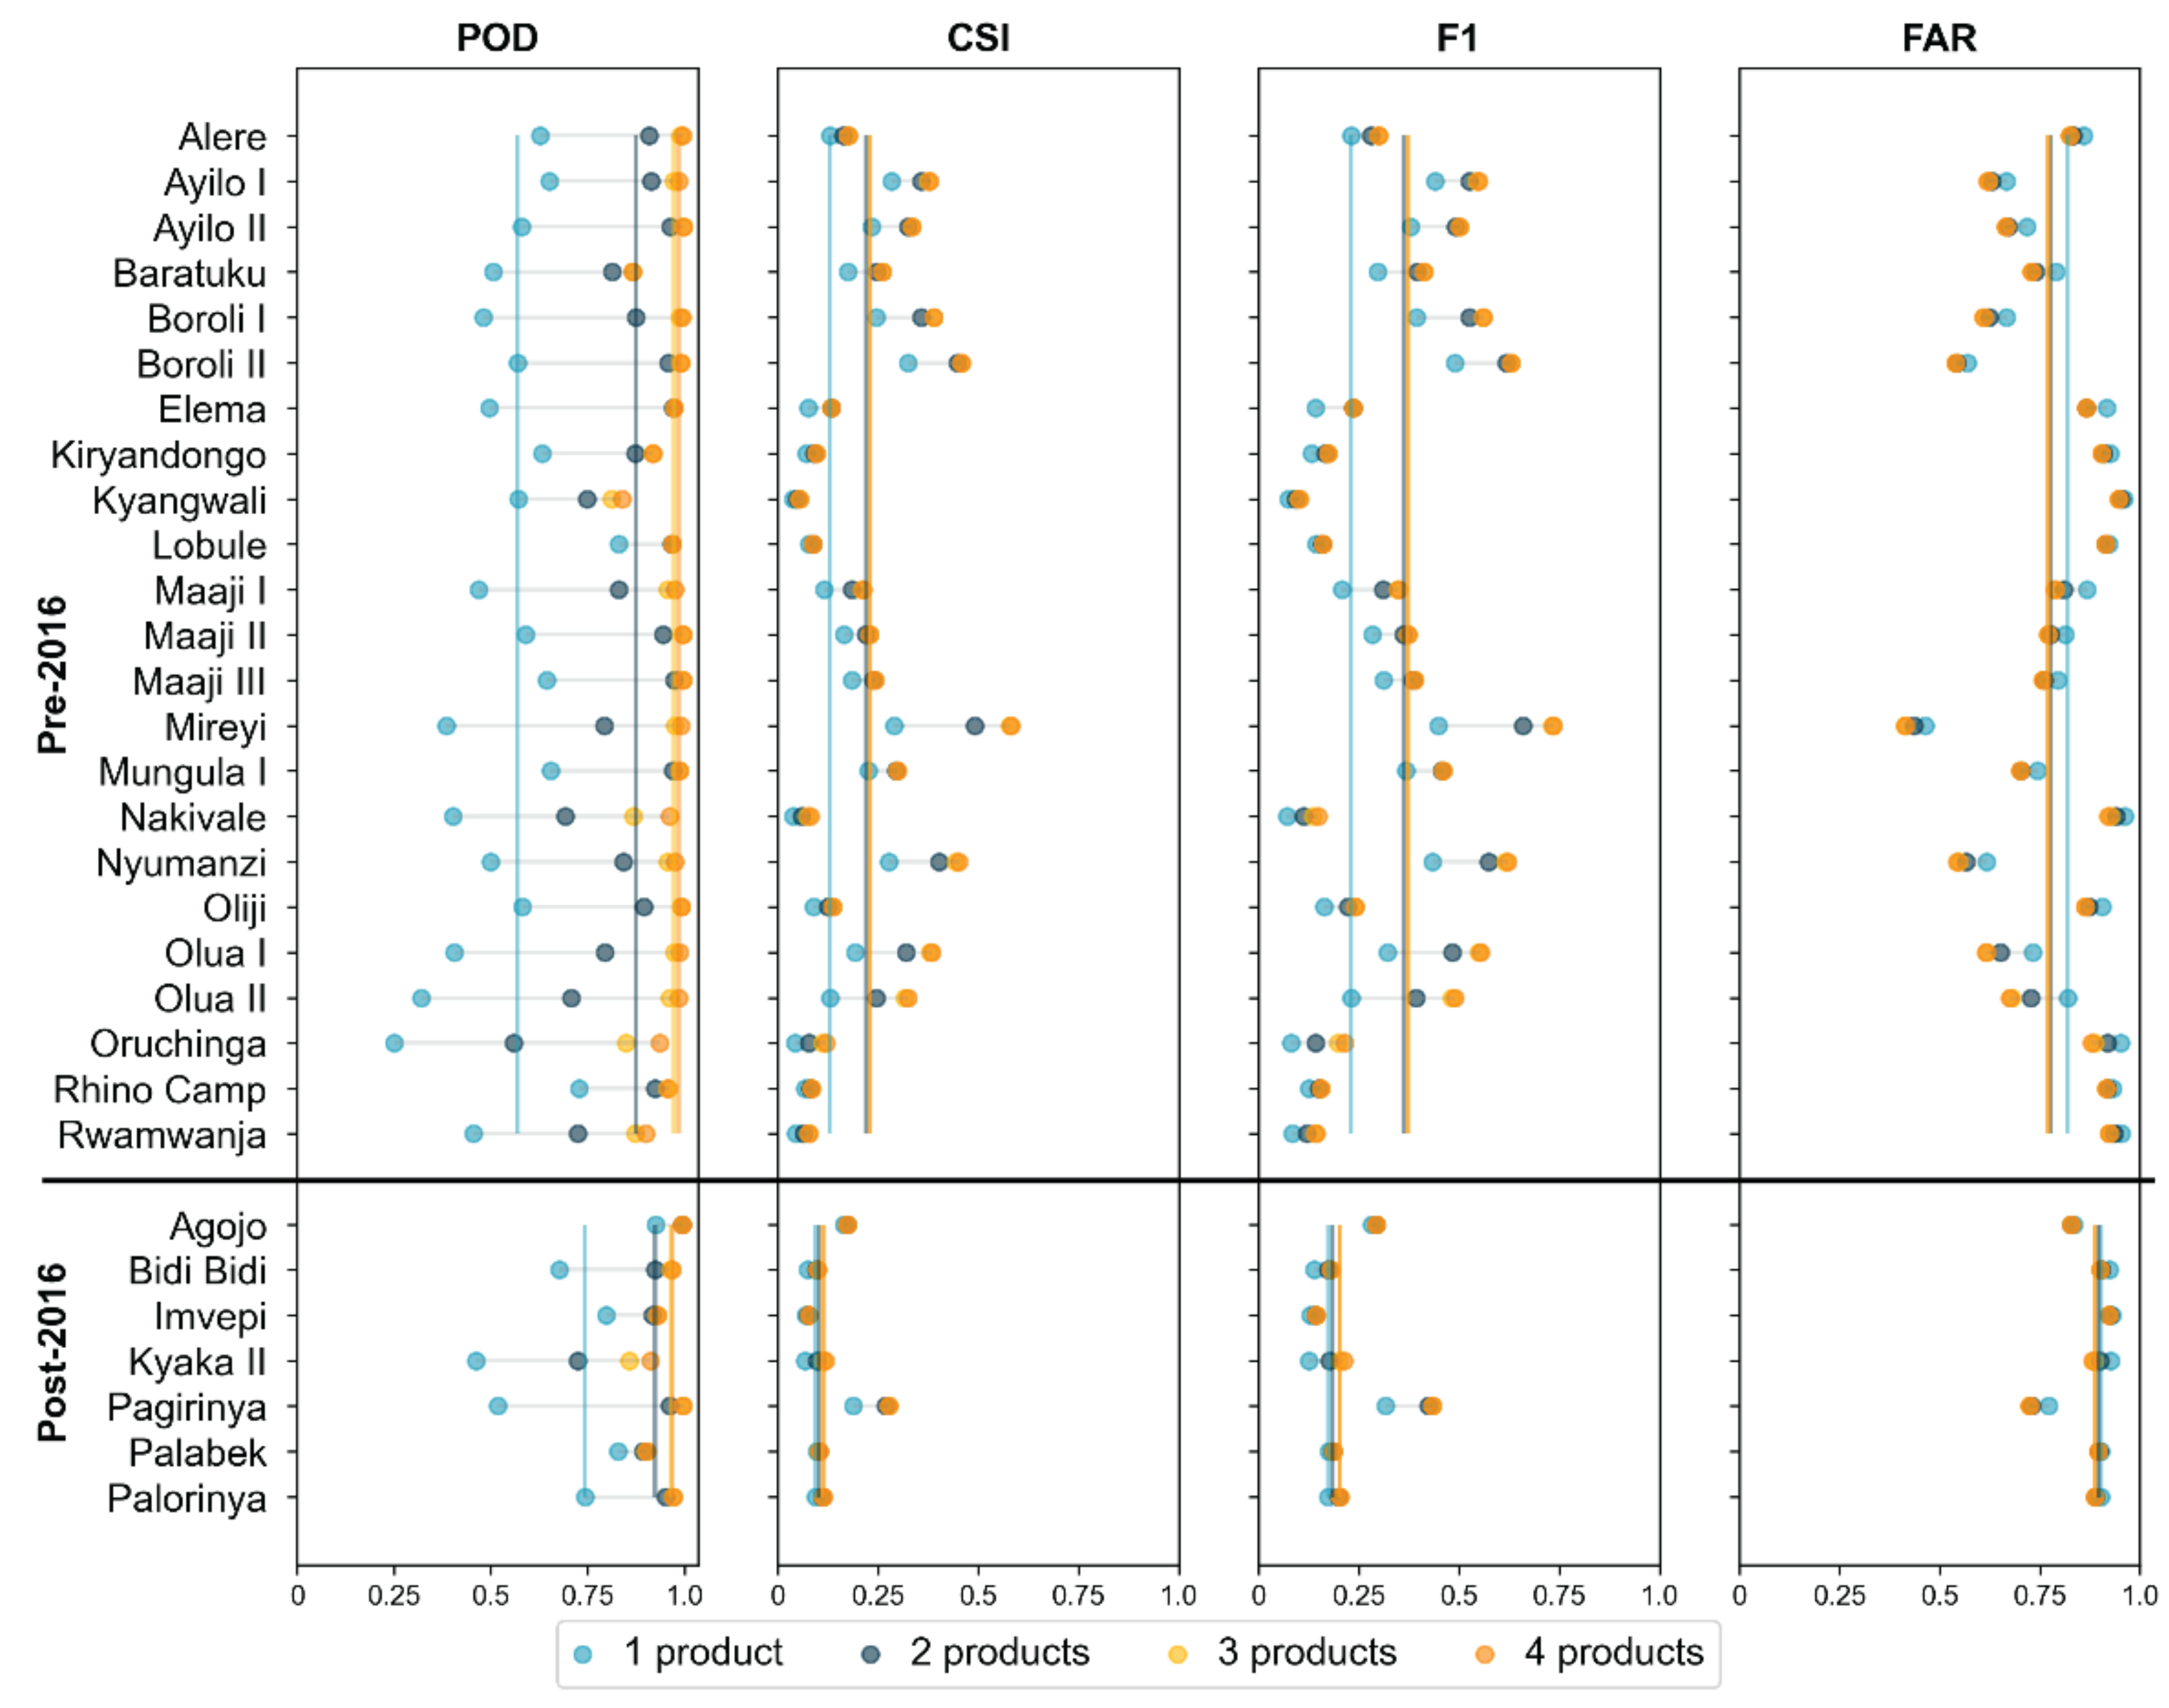
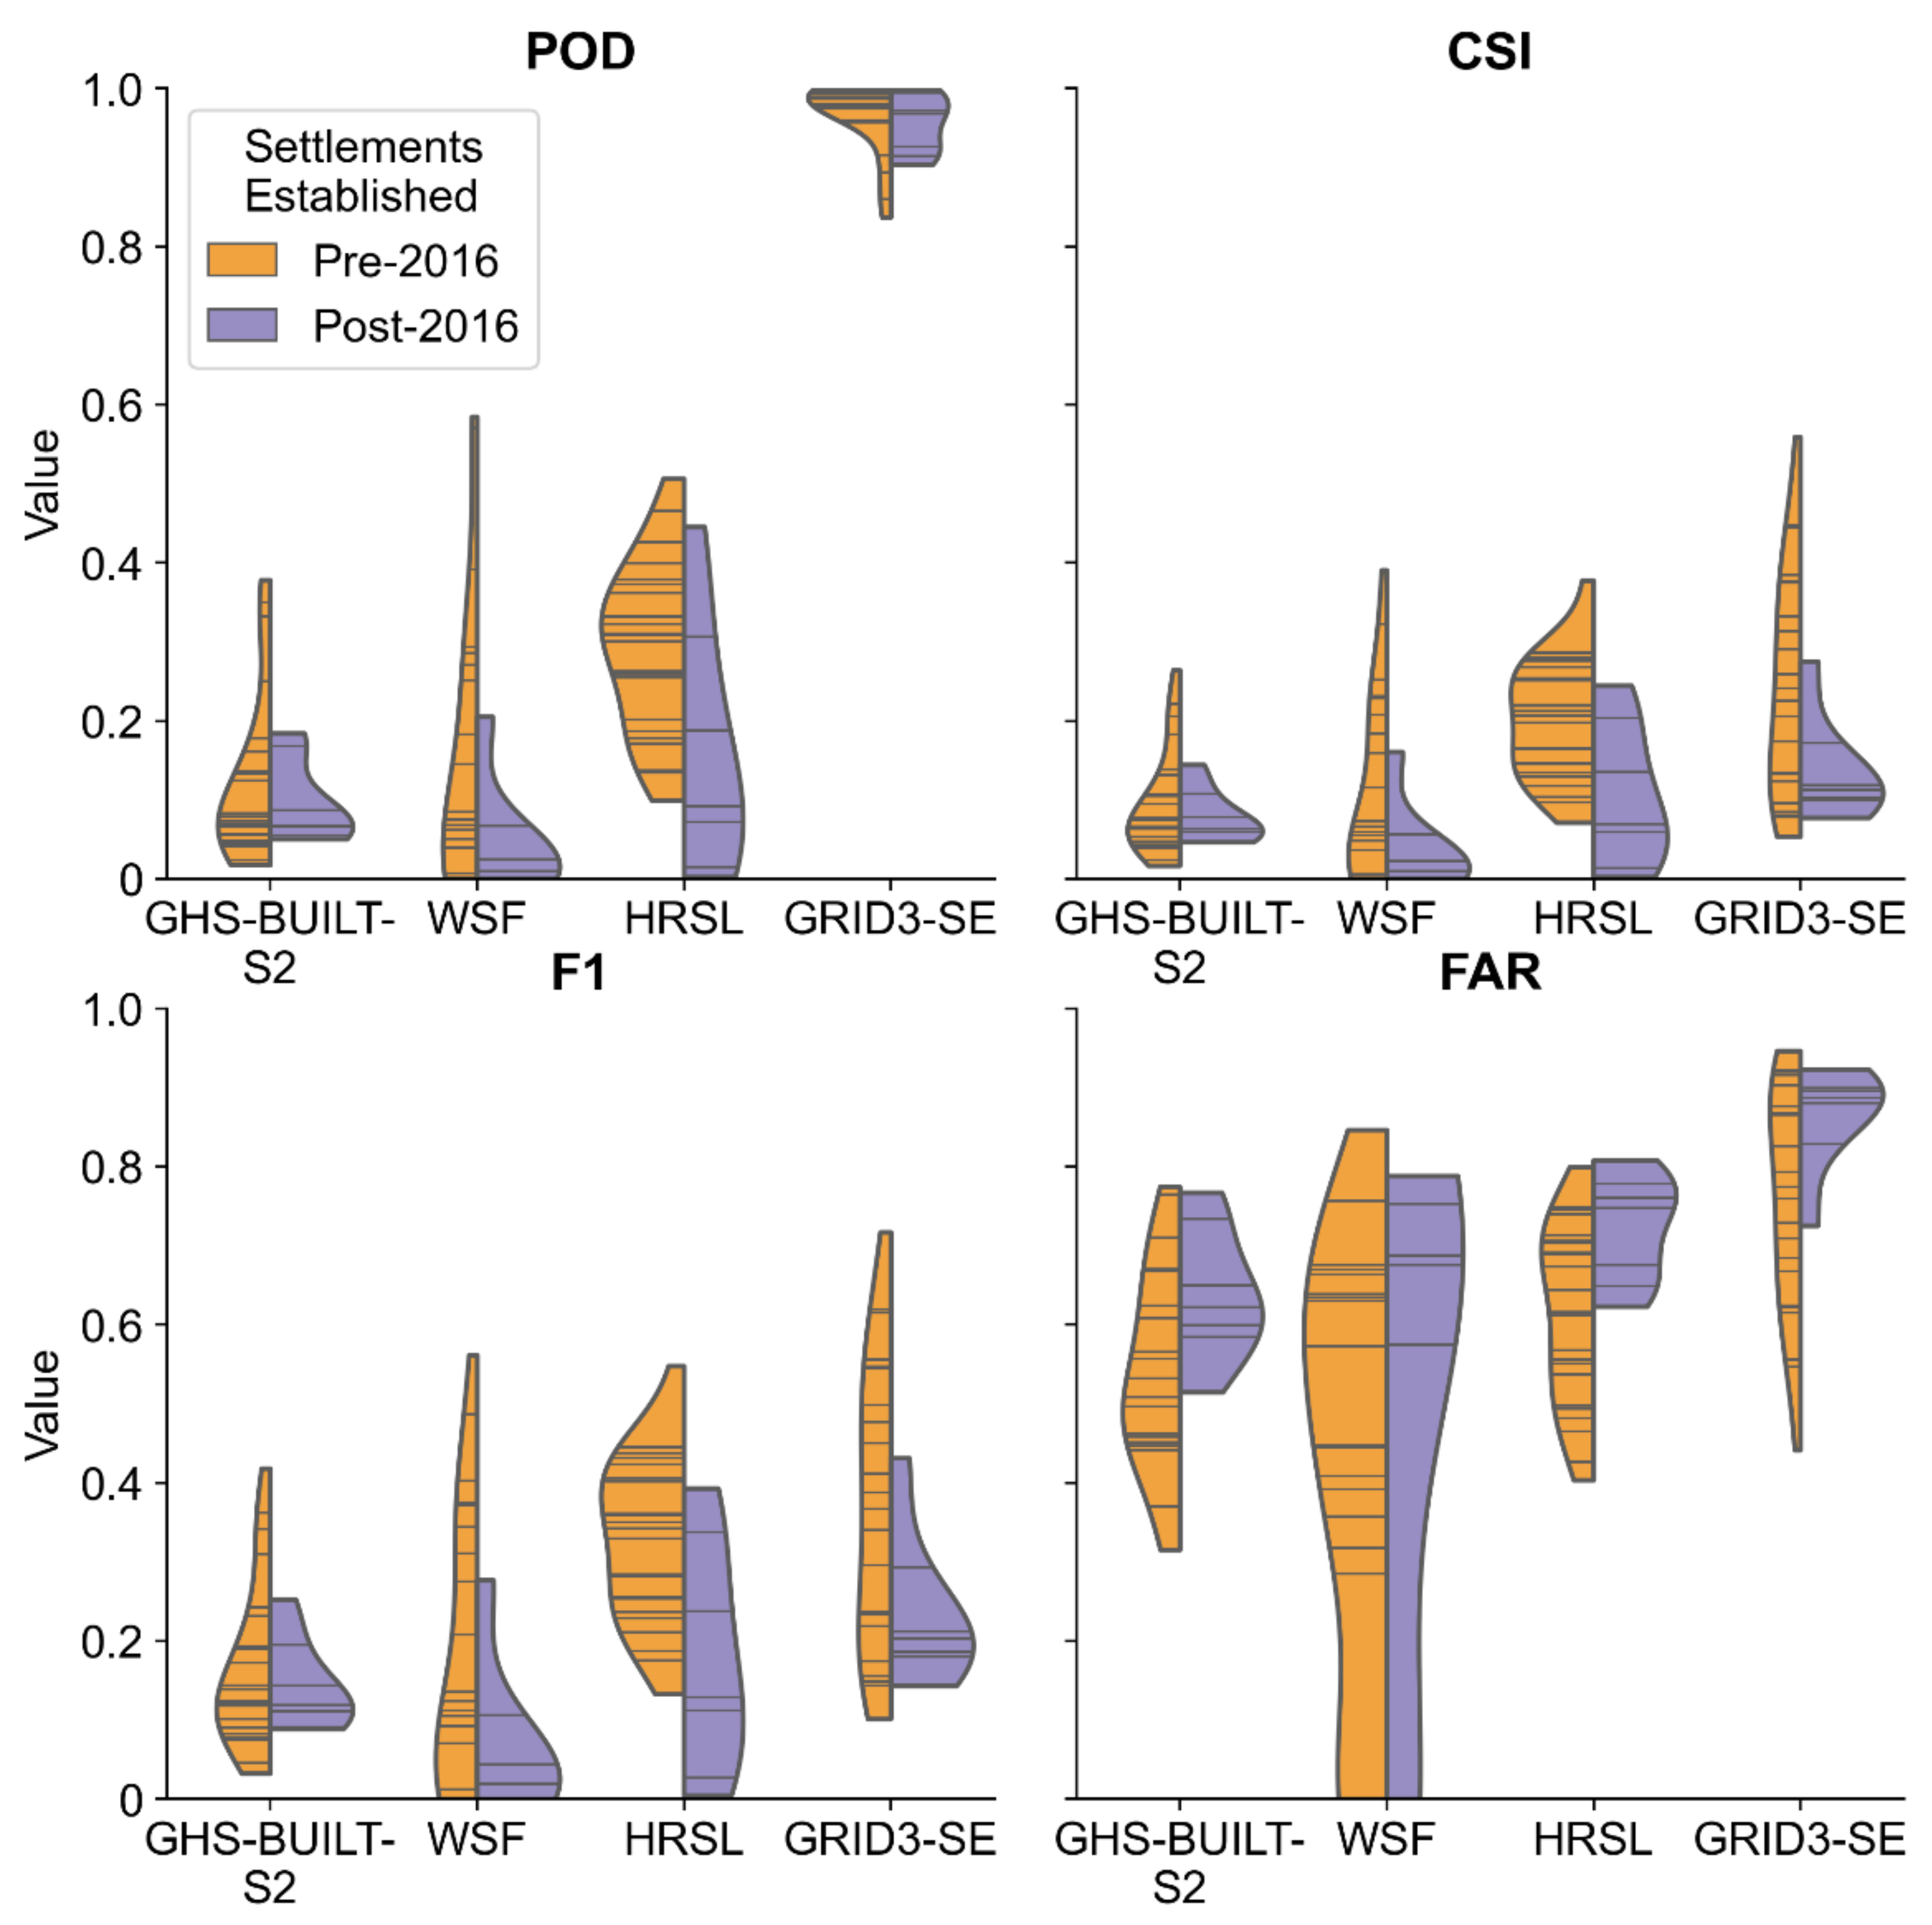
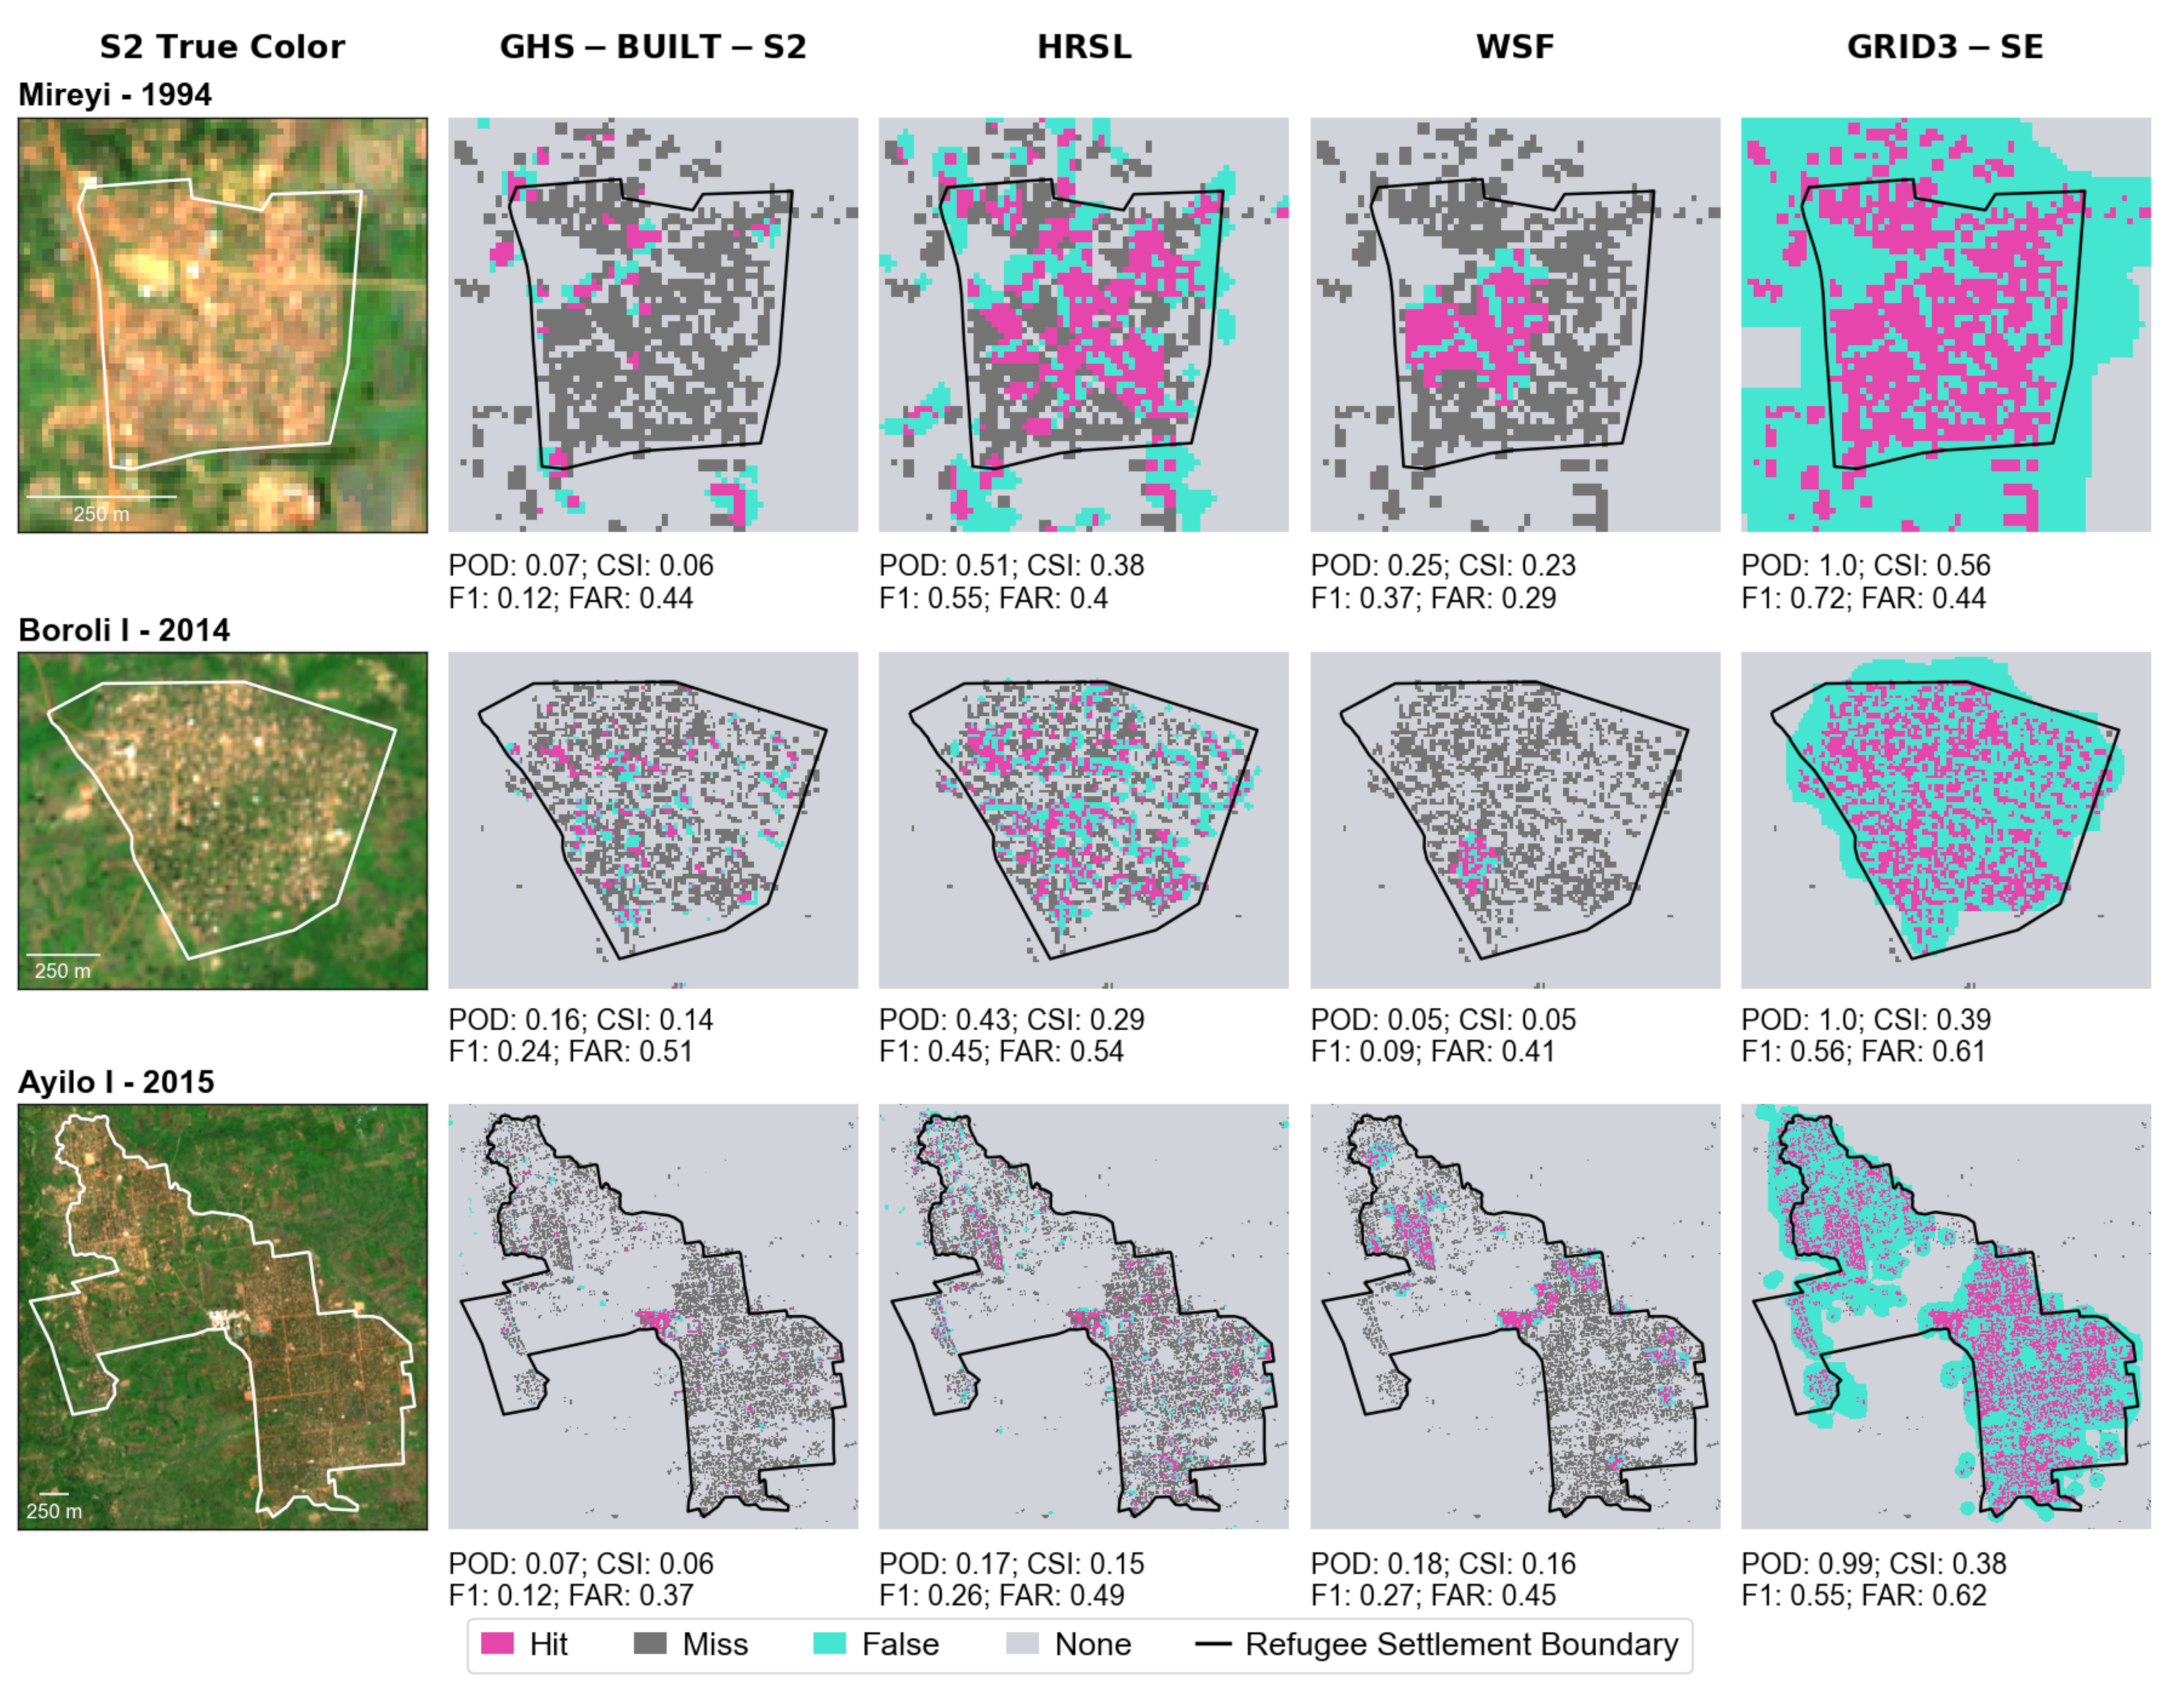
5.2. Objective 2: Measure Detection of Building Footprints within Refugee Settlements
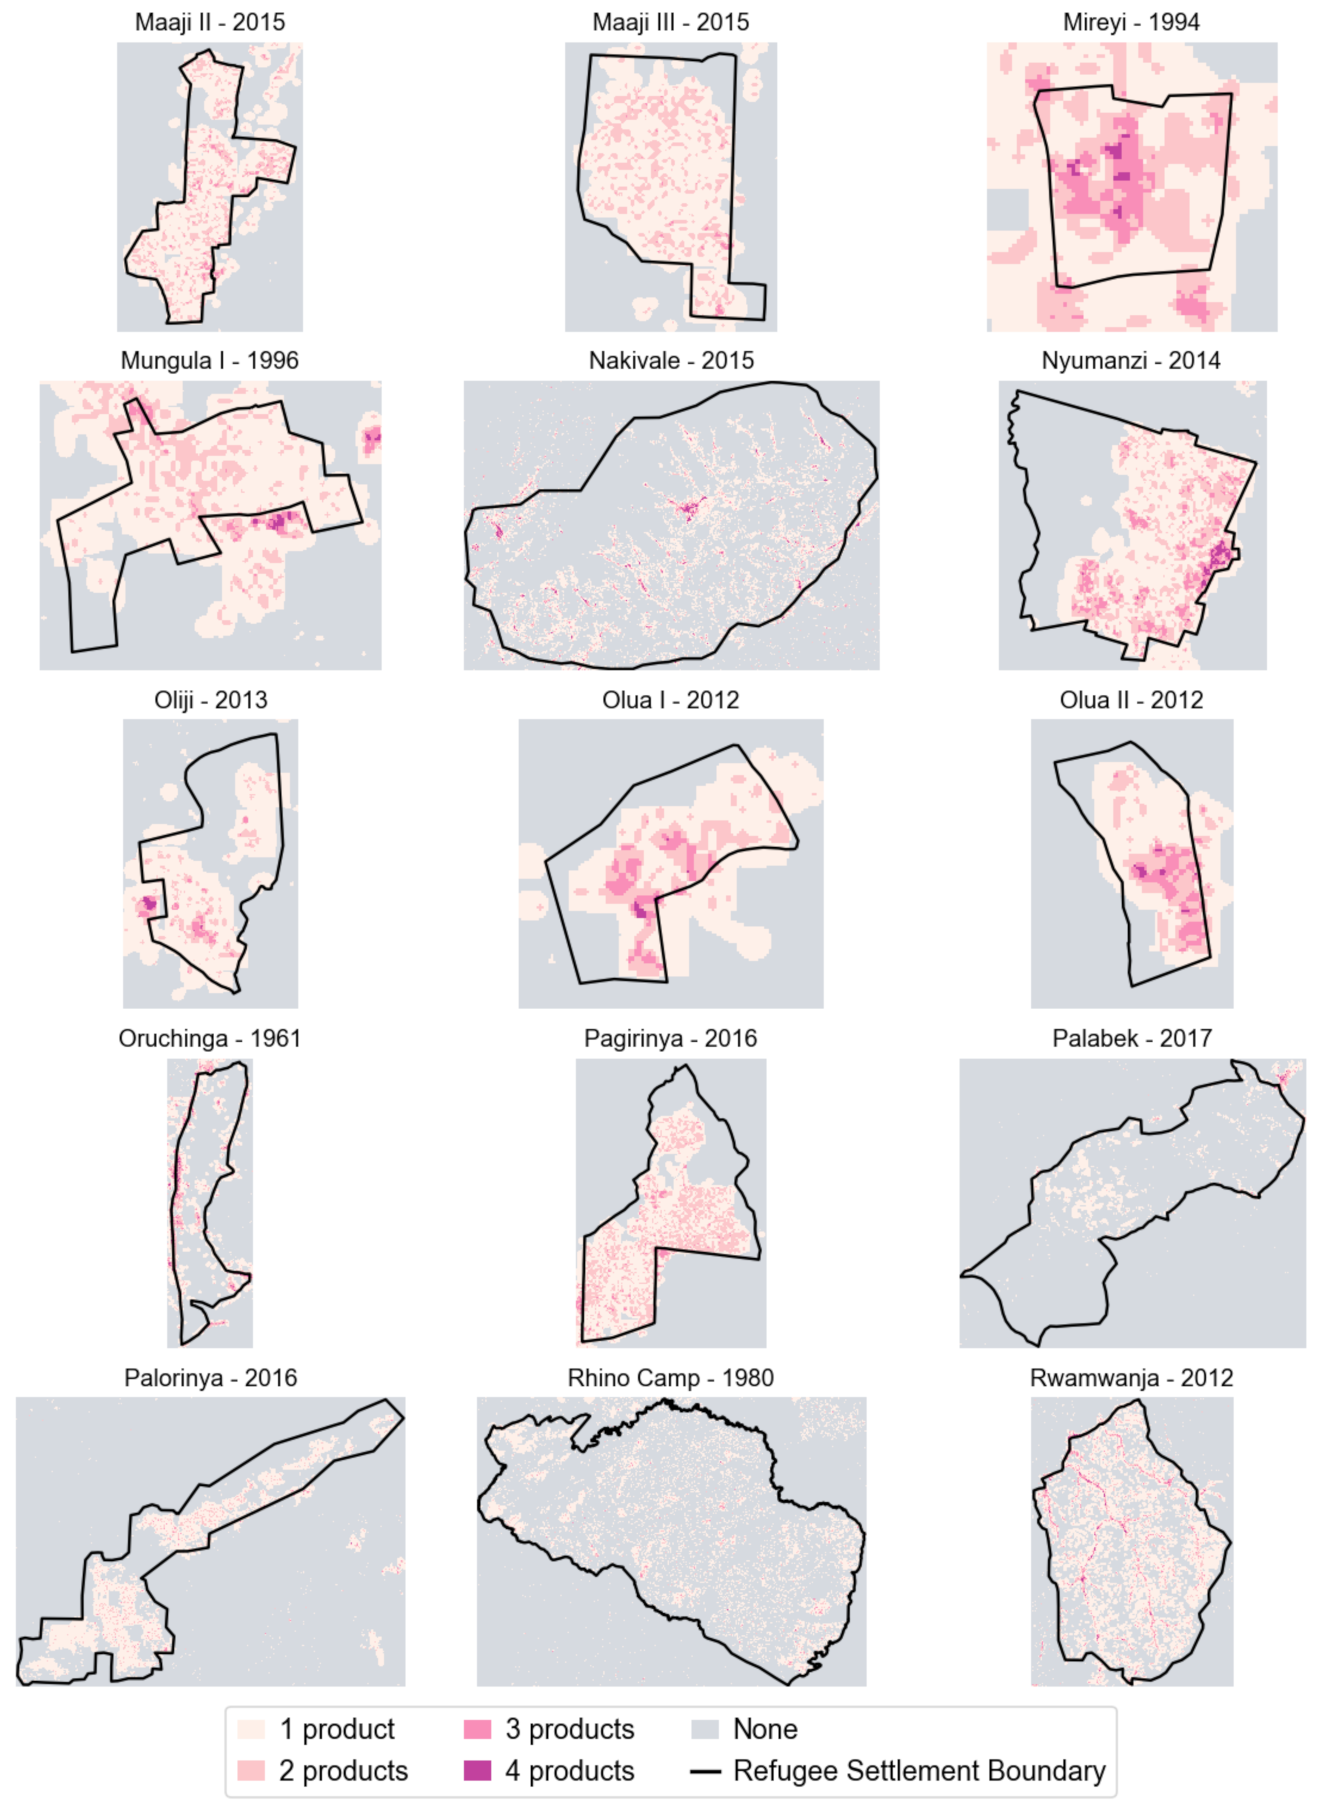
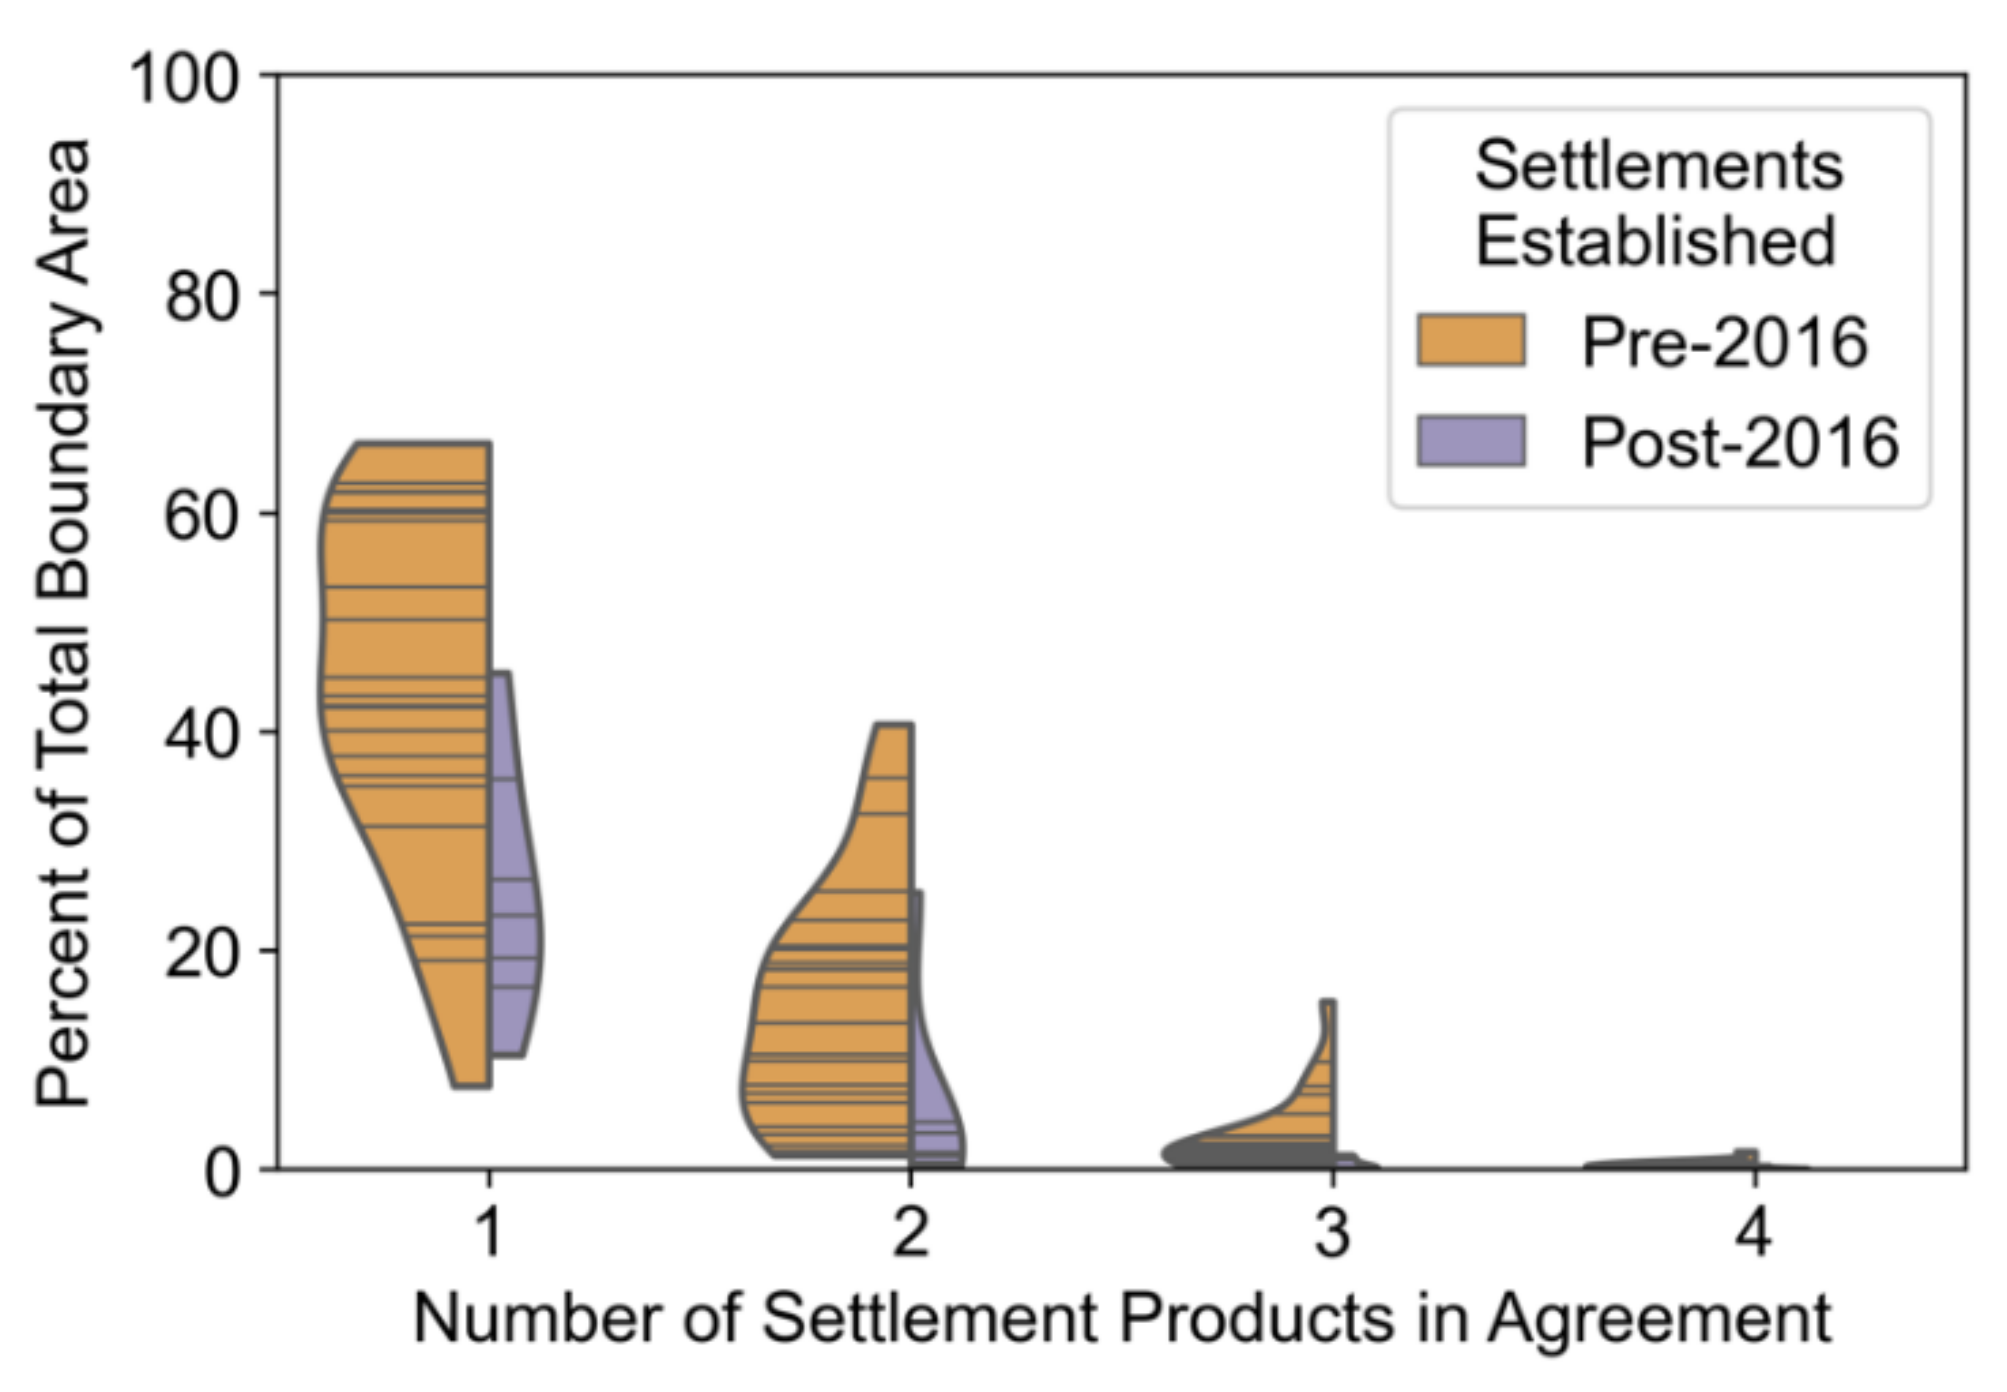
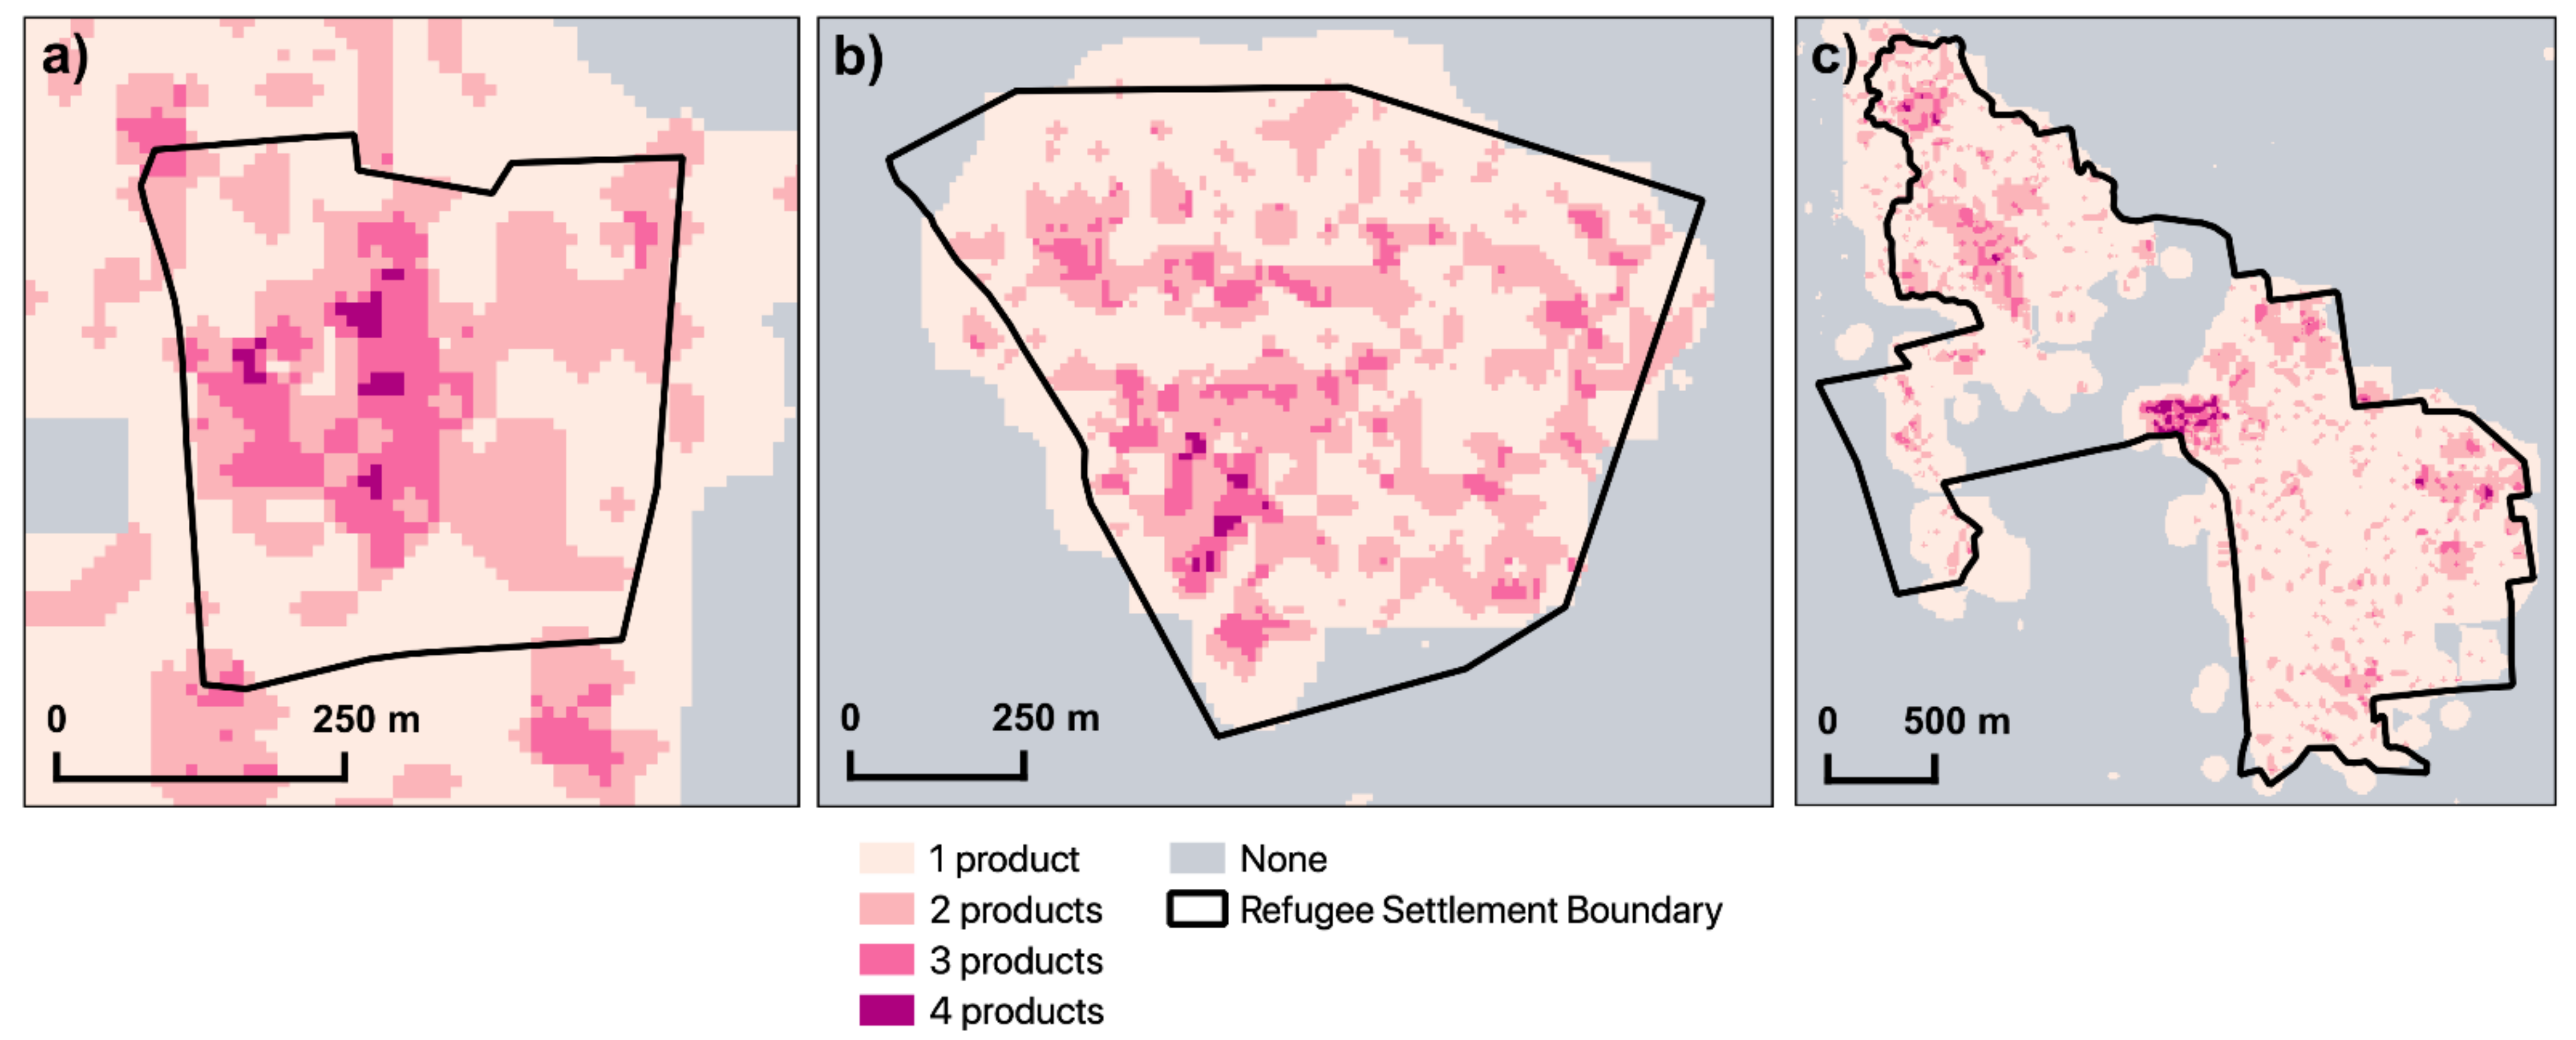
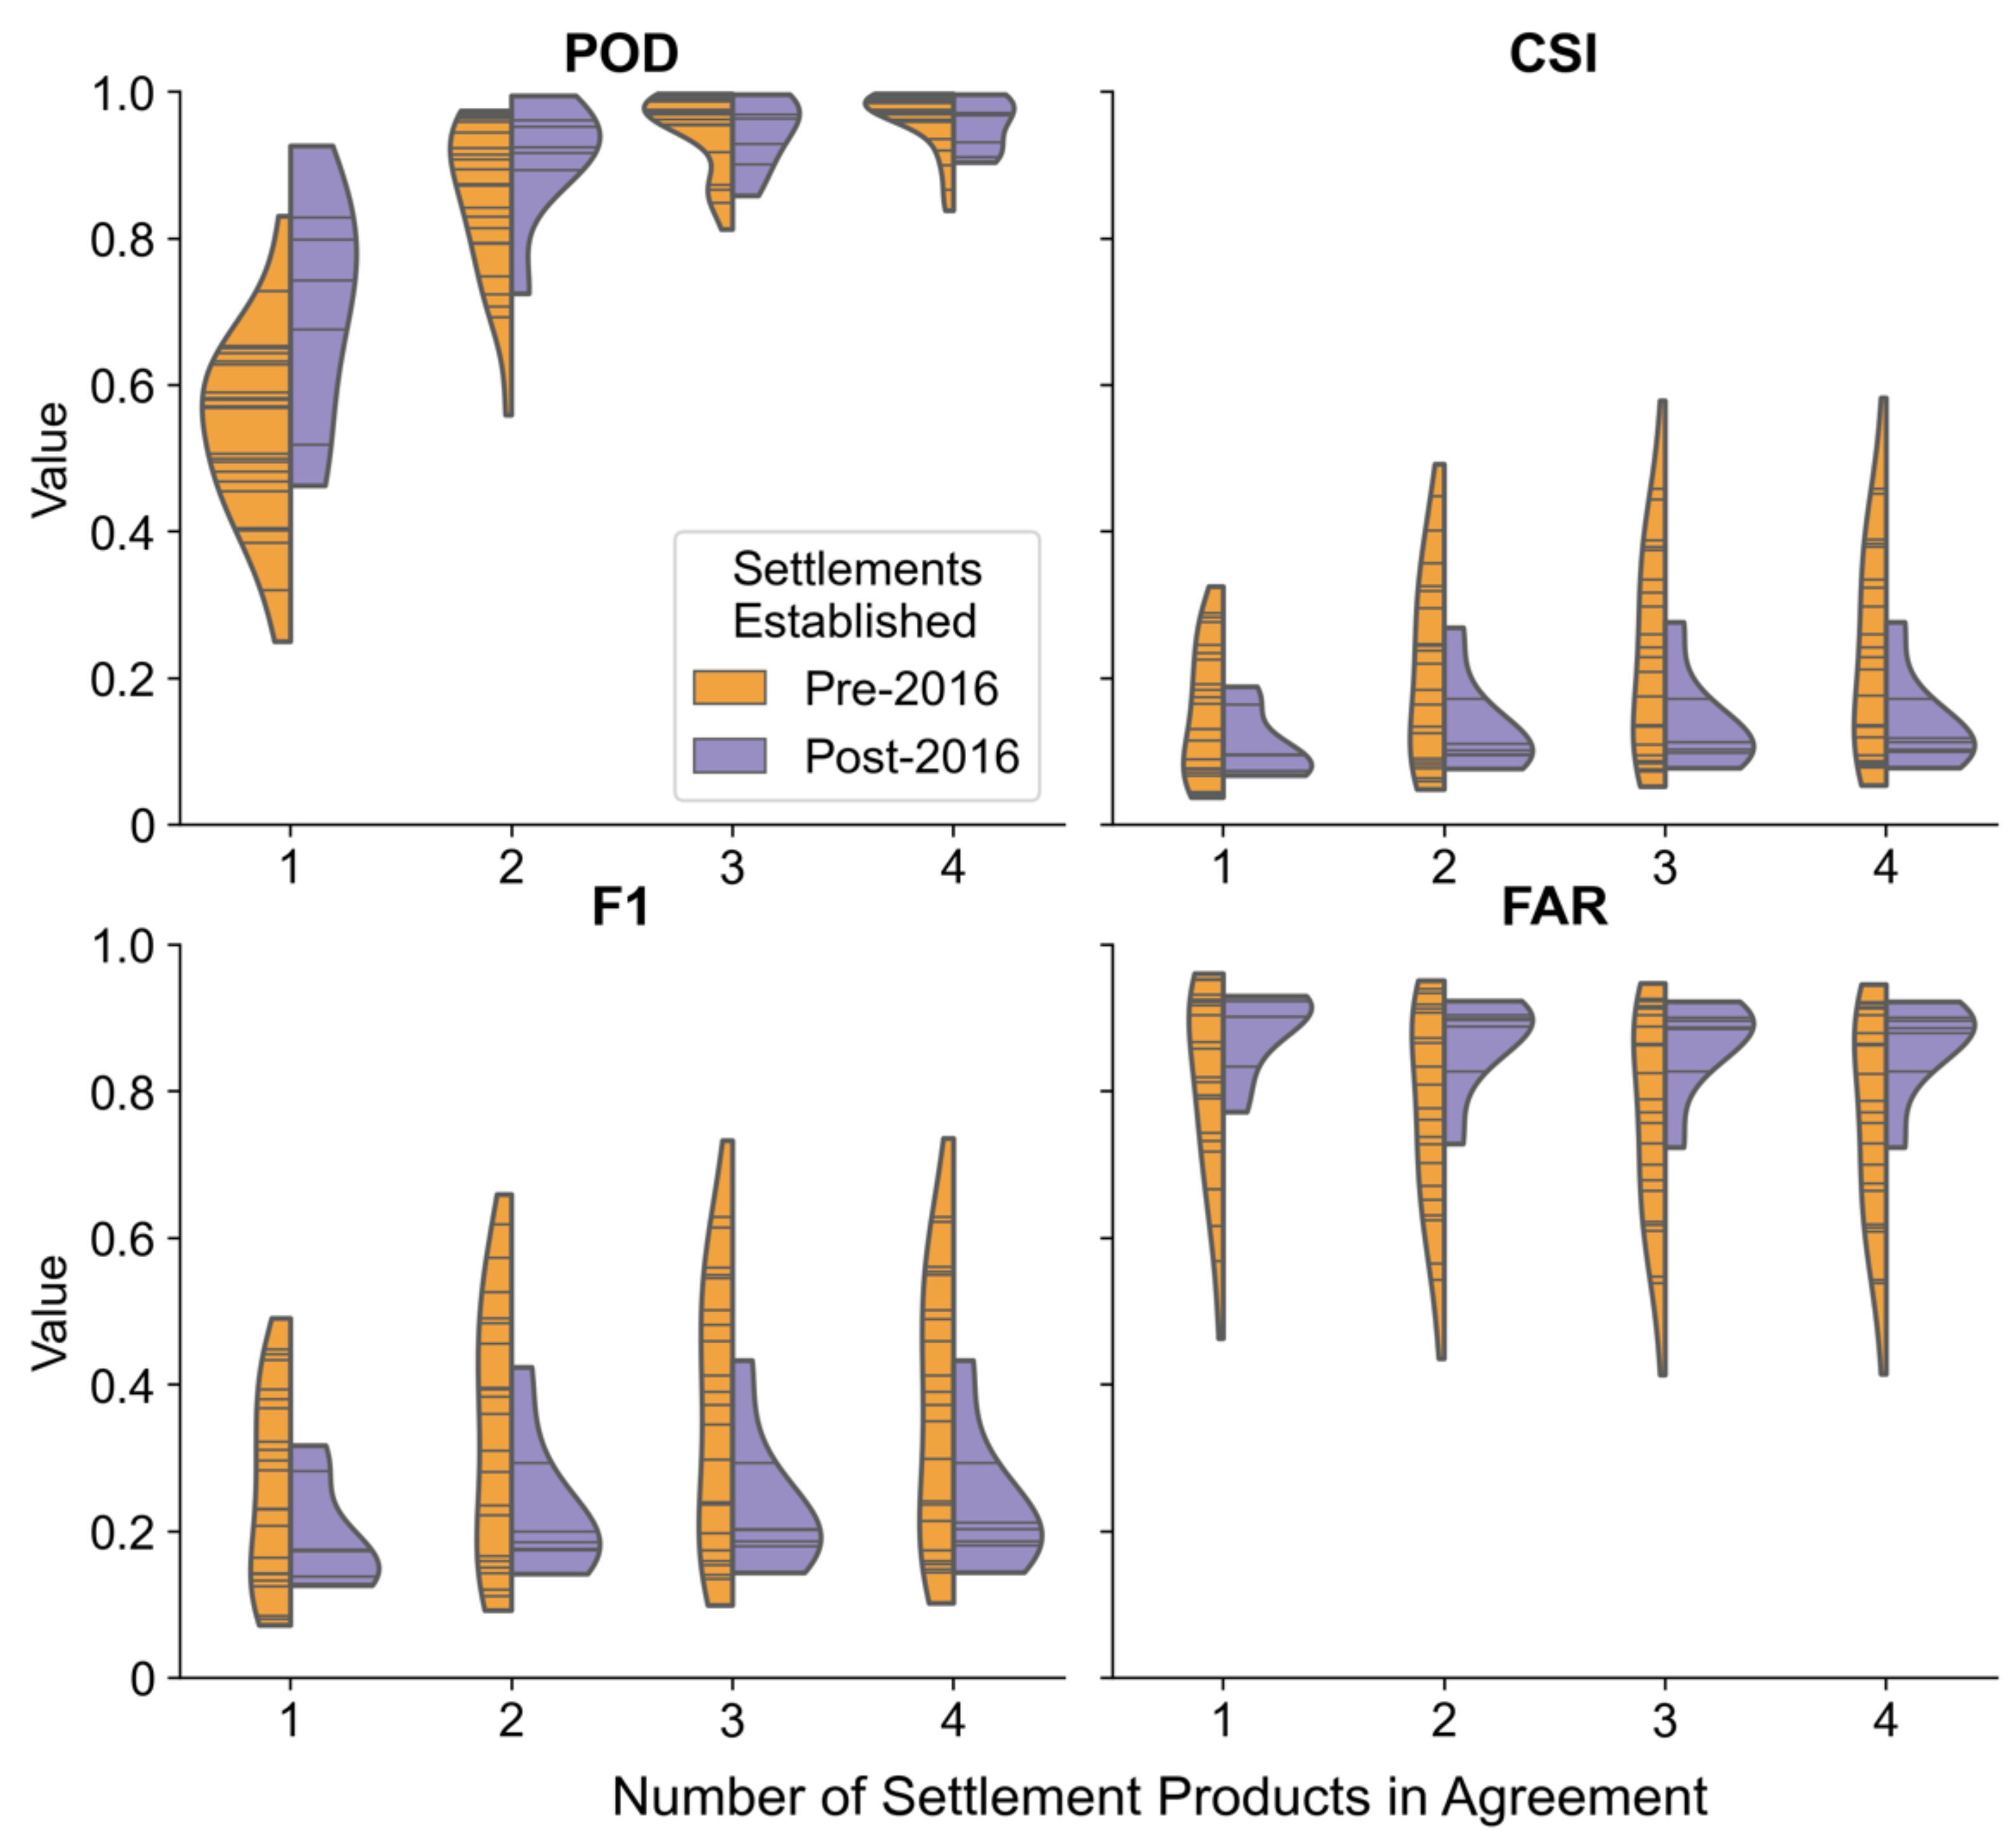
5.3. Objective 3: Assess Agreement among Settlement Products
6. Discussion
7. Conclusions
Author Contributions
Funding
Data Availability Statement
Acknowledgments
Conflicts of Interest
Appendix A

References
- Pesaresi, M.; Huadong, G.; Blaes, X.; Ehrlich, D.; Ferri, S.; Gueguen, L.; Halkia, M.; Kauffmann, M.; Kemper, T.; Lu, L.; et al. A global human settlement layer from optical HR/VHR RS data: Concept and first results. IEEE J. Sel. Top. Appl. Earth Obs. Remote Sens. 2013, 6, 2102–2131. [Google Scholar] [CrossRef]
- Corbane, C.; Syrris, V.; Sabo, F.; Politis, P.; Melchiorri, M.; Pesaresi, M.; Soille, P.; Kemper, T. Convolutional neural networks for global human settlements mapping from sentinel-2 satellite imagery. Neural Comput. Appl. 2021, 33, 6697–6720. [Google Scholar] [CrossRef]
- Marconcini, M.; Metz-Marconcini, A.; Üreyen, S.; Palacios-Lopez, D.; Hanke, W.; Bachofer, F.; Zeidler, J.; Esch, T.; Gorelick, N.; Kakarla, A.; et al. Outlining where humans live, the world settlement footprint 2015. Sci. Data 2020, 7, 242. [Google Scholar] [CrossRef] [PubMed]
- Facebook Connectivity Lab; CIESIN. High Resolution Settlement Layer. Available online: https://ciesin.columbia.edu/data/hrsl/ (accessed on 5 July 2021).
- CIESIN; Flowminder Foundation; UN Population Fund; WorldPop, University of Southampton. Mapping and Classifying Settlement Locations; Columbia University: Palisades, NY, USA, 2020. [Google Scholar]
- Klotz, M.; Kemper, T.; Geiß, C.; Esch, T.; Taubenböck, H. How good is the map? A multi-scale cross-comparison framework for global settlement layers: Evidence from central Europe. Remote Sens. Environ. 2016, 178, 191–212. [Google Scholar] [CrossRef] [Green Version]
- Corbane, C.; Pesaresi, M.; Kemper, T.; Politis, P.; Florczyk, A.J.; Syrris, V.; Melchiorri, M.; Sabo, F.; Soille, P. Automated Global delineation of human settlements from 40 years of Landsat satellite data archives. Big Earth Data 2019, 3, 140–169. [Google Scholar] [CrossRef]
- Melchiorri, M.; Florczyk, A.J.; Freire, S.; Schiavina, M.; Pesaresi, M.; Kemper, T. Unveiling 25 years of planetary urbanization with remote sensing: Perspectives from the global human settlement layer. Remote Sens. 2018, 10, 768. [Google Scholar] [CrossRef] [Green Version]
- Esch, T.; Bachofer, F.; Heldens, W.; Hirner, A.; Marconcini, M.; Palacios-Lopez, D.; Roth, A.; Üreyen, S.; Zeidler, J.; Dech, S.; et al. Where we live—A summary of the achievements and planned evolution of the global urban footprint. Remote Sens. 2018, 10, 895. [Google Scholar] [CrossRef] [Green Version]
- Leasure, D.R.; Jochem, W.C.; Weber, E.M.; Seaman, V.; Tatem, A.J. National population mapping from sparse survey data: A hierarchical Bayesian modeling framework to account for uncertainty. Proc. Natl. Acad. Sci. USA 2020, 117, 24173–24179. [Google Scholar] [CrossRef] [PubMed]
- Leyk, S.; Gaughan, A.E.; Adamo, S.B.; de Sherbinin, A.; Balk, D.; Freire, S.; Rose, A.; Stevens, F.R.; Blankespoor, B.; Frye, C.; et al. The spatial allocation of population: A review of large-scale gridded population data products and their fitness for use. Earth Syst. Sci. Data 2019, 11, 1385–1409. [Google Scholar] [CrossRef] [Green Version]
- Lloyd, C.T.; Chamberlain, H.; Kerr, D.; Yetman, G.; Pistolesi, L.; Stevens, F.R.; Gaughan, A.E.; Nieves, J.J.; Hornby, G.; MacManus, K.; et al. Global spatio-temporally harmonised datasets for producing high-resolution gridded population distribution datasets. Big Earth Data 2019, 3, 108–139. [Google Scholar] [CrossRef] [Green Version]
- Freire, S.; Schiavina, M.; Florczyk, A.J.; MacManus, K.; Pesaresi, M.; Corbane, C.; Borkovska, O.; Mills, J.; Pistolesi, L.; Squires, J.; et al. Enhanced data and methods for improving open and free global population grids: Putting ‘leaving no one behind’ into practice. Int. J. Digit. Earth 2020, 13, 61–77. [Google Scholar] [CrossRef] [Green Version]
- Palacios-Lopez, D.; Bachofer, F.; Esch, T.; Marconcini, M.; MacManus, K.; Sorichetta, A.; Zeidler, J.; Dech, S.; Tatem, A.J.; Reinartz, P. High-resolution gridded population datasets: Exploring the capabilities of the world settlement footprint 2019 imperviousness layer for the african continent. Remote Sens. 2021, 13, 1142. [Google Scholar] [CrossRef]
- Melchiorri, M.; Pesaresi, M.; Florczyk, A.J.; Corbane, C.; Kemper, T. Principles and applications of the global human settlement layer as baseline for the land use efficiency indicator—SDG 11.3.1. ISPRS Int. J. Geo-Inf. 2019, 8, 96. [Google Scholar] [CrossRef] [Green Version]
- Aguilar, R.; Kuffer, M. Cloud computation using high-resolution images for improving the SDG indicator on open spaces. Remote Sens. 2020, 12, 1144. [Google Scholar] [CrossRef] [Green Version]
- Corbane, C.; Martino, P.; Panagiotis, P.; Aneta, F.J.; Michele, M.; Sergio, F.; Marcello, S.; Daniele, E.; Gustavo, N.; Thomas, K. The grey-green divide: Multi-temporal analysis of greenness across 10,000 urban centres derived from the Global Human Settlement Layer (GHSL). Int. J. Digit. Earth 2020, 13, 101–118. [Google Scholar] [CrossRef]
- Ehrlich, D.; Kemper, T.; Pesaresi, M.; Corbane, C. Built-up area and population density: Two essential societal variables to address climate hazard impact. Environ. Sci. Policy 2018, 90, 73–82. [Google Scholar] [CrossRef]
- Formetta, G.; Feyen, L. Empirical evidence of declining global vulnerability to climate-related hazards. Glob. Environ. Chang. 2019, 57, 101920. [Google Scholar] [CrossRef]
- Mazzoleni, M.; Mård, J.; Rusca, M.; Odongo, V.; Lindersson, S.; Baldassarre, G.D. Floodplains in the Anthropocene: A global analysis of the interplay between human population, built environment, and flood severity. Water Resour. Res. 2021, 57, e2020WR027744. [Google Scholar] [CrossRef]
- Pesaresi, M.; Ehrlich, D.; Ferri, S.; Florczyk, A.; Freire, S.; Haag, F.; Halkia, M.; Julea, A.M.; Kemper, T.; Soille, P. Global human settlement analysis for disaster risk reduction. Int. Arch. Photogramm. Remote Sens. Spat. Inf. Sci. 2015, XL-7/W3, 837–843. [Google Scholar] [CrossRef] [Green Version]
- Sabo, F.; Corbane, C.; Florczyk, A.J.; Ferri, S.; Pesaresi, M.; Kemper, T. Comparison of built-up area maps produced within the global human settlement framework. Trans. GIS 2018, 22, 1406–1436. [Google Scholar] [CrossRef]
- Gerten, C.; Fina, S.; Rusche, K. The sprawling planet: Simplifying the measurement of global urbanization trends. Front. Environ. Sci. 2019, 7, 140. [Google Scholar] [CrossRef]
- Mück, M.; Klotz, M.; Taubenböck, H. Validation of the DLR global urban footprint in rural areas: A case study for Burkina Faso. In Proceedings of the 2017 Joint Urban Remote Sensing Event (JURSE), Dubai, United Arab Emirates, 6–8 March 2017; pp. 1–4. [Google Scholar]
- Li, J.; Zhang, H.; Wang, C.; Wu, F.; Li, L. Spaceborne SAR data for regional urban mapping using a robust building extractor. Remote Sens. 2020, 12, 2791. [Google Scholar] [CrossRef]
- United Nations Department of Economic and Social Affairs, Population Division. World Urbanization Prospects: The 2018 Revision (ST/ESA/SER.A/420); United Nations: New York, NY, USA, 2019. [Google Scholar]
- UNHCR. Global Trends: Forced Displacement in 2020; UNHCR: Geneva, Switzerland, 2021. [Google Scholar]
- Devictor, X.; Do, Q.-T. How many years have refugees been in exile? Popul. Dev. Rev. 2017, 43, 355–369. [Google Scholar] [CrossRef]
- UNHCR. Protracted Refugee Situations 2004; UNHCR: Geneva, Switzerland, 2004. [Google Scholar]
- Van Den Hoek, J.; Friedrich, H.K.; Ballasiotes, A.; Peters, L.E.R.; Wrathall, D. Development after displacement: Evaluating the utility of Openstreetmap data for monitoring sustainable development goal progress in refugee settlements. ISPRS Int. J. Geo-Inf. 2021, 10, 153. [Google Scholar] [CrossRef]
- Aravena Pelizari, P.; Spröhnle, K.; Geiß, C.; Schoepfer, E.; Plank, S.; Taubenböck, H. Multi-sensor feature fusion for very high spatial resolution built-up area extraction in temporary settlements. Remote Sens. Environ. 2018, 209, 793–807. [Google Scholar] [CrossRef]
- Jenerowicz, M.; Wawrzaszek, A.; Drzewiecki, W.; Krupiński, M.; Aleksandrowicz, S. Multifractality in humanitarian applications: A case study of internally displaced persons/refugee camps. IEEE J. Sel. Top. Appl. Earth Obs. Remote Sens. 2019, 12, 4438–4445. [Google Scholar] [CrossRef]
- Spröhnle, K.; Tiede, D.; Schoepfer, E.; Füreder, P.; Svanberg, A.; Rost, T. Earth observation-based dwelling detection approaches in a highly complex refugee camp environment—A comparative study. Remote Sens. 2014, 6, 9277–9297. [Google Scholar] [CrossRef] [Green Version]
- Ghorbanzadeh, O.; Tiede, D.; Wendt, L.; Sudmanns, M.; Lang, S. Transferable Instance segmentation of dwellings in a refugee camp—Integrating CNN and OBIA. Eur. J. Remote Sens. 2021, 54, 127–140. [Google Scholar] [CrossRef]
- Tiede, D.; Krafft, P.; Füreder, P.; Lang, S. Stratified template matching to support refugee camp analysis in OBIA workflows. Remote Sens. 2017, 9, 326. [Google Scholar] [CrossRef] [Green Version]
- Tiede, D.; Schwendemann, G.; Alobaidi, A.; Wendt, L.; Lang, S. Mask R-CNN-based building extraction from VHR satellite data in operational humanitarian action: An example related to covid-19 response in Khartoum, Sudan. Trans. GIS 2021, 25, 1213–1227. [Google Scholar] [CrossRef]
- Ghorbanzadeh, O.; Tiede, D.; Dabiri, Z.; Sudmanns, M.; Lang, S. Dwelling extraction in refugee camps using CNN–first experiences and lessons learnt. Int. Arch. Photogramm. Remote Sens. Spat. Inf. Sci. 2018, XLII-1, 161–166. [Google Scholar] [CrossRef] [Green Version]
- Green, B.; Blanford, J. Refugee Camp Population Estimates Using Automated Feature Extraction. 2020. Available online: http://hdl.handle.net/10125/64009 (accessed on 1 December 2020).
- Lang, S.; Füreder, P.; Riedler, B.; Wendt, L.; Braun, A.; Tiede, D.; Schoepfer, E.; Zeil, P.; Spröhnle, K.; Kulessa, K.; et al. Earth observation tools and services to increase the effectiveness of humanitarian assistance. Eur. J. Remote Sens. 2020, 53, 67–85. [Google Scholar] [CrossRef] [Green Version]
- Quinn, J.A.; Nyhan, M.M.; Navarro, C.; Coluccia, D.; Bromley, L.; Luengo-Oroz, M. Humanitarian applications of machine learning with remote-sensing data: Review and case study in refugee settlement mapping. Philos. Trans. R. Soc. Math. Phys. Eng. Sci. 2018, 376, 20170363. [Google Scholar] [CrossRef] [PubMed] [Green Version]
- Braun, A.; Fakhri, F.; Hochschild, V. Refugee camp monitoring and environmental change assessment of Kutupalong, Bangladesh, based on radar imagery of Sentinel-1 and ALOS-2. Remote Sens. 2019, 11, 2047. [Google Scholar] [CrossRef] [Green Version]
- Aung, T.S.; Overland, I.; Vakulchuk, R.; Xie, Y. Using satellite data and machine learning to study conflict-induced environmental and socioeconomic destruction in data-poor conflict areas: The case of the Rakhine conflict. Environ. Res. Commun. 2021, 3, 025005. [Google Scholar] [CrossRef]
- Jaafar, H.; Ahmad, F.; Holtmeier, L.; King-Okumu, C. Refugees, water balance, and water stress: Lessons learned from Lebanon. Ambio 2020, 49, 1179–1193. [Google Scholar] [CrossRef] [Green Version]
- Ahmed, B.; Rahman, M.S.; Sammonds, P.; Islam, R.; Uddin, K. Application of geospatial technologies in developing a dynamic landslide early warning system in a humanitarian context: The Rohingya refugee crisis in Cox’s Bazar, Bangladesh. Geomat. Nat. Hazards Risk 2020, 11, 446–468. [Google Scholar] [CrossRef]
- Maystadt, J.-F.; Mueller, V.; Van Den Hoek, J.; van Weezel, S. Vegetation changes attributable to refugees in Africa coincide with agricultural deforestation. Environ. Res. Lett. 2020, 15, 044008. [Google Scholar] [CrossRef]
- Friedrich, H.K.; Van Den Hoek, J. Breaking ground: Automated disturbance detection with Landsat time series captures rapid refugee settlement establishment and growth in north Uganda. Comput. Environ. Urban Syst. 2020, 82, 101499. [Google Scholar] [CrossRef]
- Rossi, M.; Rembold, F.; Bolognesi, M.; Nori, M.; Mureithi, S.; Nyberg, G. Mapping land enclosures and vegetation cover changes in the surroundings of Kenya’s Dadaab refugee camps with very high resolution satellite imagery. Land Degrad. Dev. 2019, 30, 253–265. [Google Scholar] [CrossRef]
- Alix-Garcia, J.; Walker, S.; Bartlett, A.; Onder, H.; Sanghi, A. Do refugee camps help or hurt hosts? The case of Kakuma, Kenya. J. Dev. Econ. 2018, 130, 66–83. [Google Scholar] [CrossRef]
- Lüthje, F.; Tiede, D.; Füreder, P. Don’t see the dwellings for the trees: Quantifying the effect of tree growth on multi-temporal dwelling extraction in a refugee camp. Proc. GI_Forum 2015, 1, 406–415. [Google Scholar] [CrossRef]
- United Nations Division of Programme Support and Management. Shelter Design Catalogue; UNHCR: Geneva, Switzerland, 2016. [Google Scholar]
- Herold, M.; Roberts, D.A.; Gardner, M.E.; Dennison, P.E. Spectrometry for urban area remote sensing—Development and analysis of a spectral library from 350 to 2400 Nm. Remote Sens. Environ. 2004, 91, 304–319. [Google Scholar] [CrossRef]
- Cole, G. Pluralising geographies of refuge. Prog. Hum. Geogr. 2021, 45, 88–110. [Google Scholar] [CrossRef]
- Acolin, A.; Kim, A.M. Algorithmic justice and groundtruthing the remote mapping of informal settlements: The example of Ho Chi Minh City’s periphery. Environ. Plan. B Urban Anal. City Sci. 2021, 2399808321998708. [Google Scholar] [CrossRef]
- UNHCR. UNHCR Global Trends 2018; UNHCR: Geneva, Switzerland, 2019. [Google Scholar]
- Government of Uganda. Uganda National Action Plan to Implement the Global Compact on Refugees and Its Comprehensive Refugee Response Framework (CRRF); Government of Uganda: Kampala, Uganda, 2018.
- UNHCR. Uganda Country Refugee Response Plan: The Integrated Response Plan for Refugees From South Sudan, Burundi And The Democratic Republic of the Congo, January 2019–December 2020 (Revised in March 2019); UNHCR: Geneva, Switzerland, 2019. [Google Scholar]
- UNHCR. Camp Planning Standards (Planned Settlements). Available online: https://emergency.unhcr.org/entry/45581/camp-planning-standards-planned-settlements (accessed on 5 July 2021).
- Barau, I.; Zubairu, M.; Mwanza, M.N.; Seaman, V.Y. Improving polio vaccination coverage in nigeria through the use of geographic information system technology. J. Infect. Dis. 2014, 210, S102–S110. [Google Scholar] [CrossRef] [Green Version]
- Esch, T.; Heldens, W.; Hirner, A.; Keil, M.; Marconcini, M.; Roth, A.; Zeidler, J.; Dech, S.; Strano, E. Breaking new ground in mapping human settlements from space—The global urban footprint. ISPRS J. Photogramm. Remote Sens. 2017, 134, 30–42. [Google Scholar] [CrossRef] [Green Version]
- Li, X.; Gong, P.; Zhou, Y.; Wang, J.; Bai, Y.; Chen, B.; Hu, T.; Xiao, Y.; Xu, B.; Yang, J.; et al. Mapping global urban boundaries from the Global Artificial Impervious Area (GAIA) data. Environ. Res. Lett. 2020, 15, 094044. [Google Scholar] [CrossRef]
- Yeboah, G.; Porto de Albuquerque, J.; Troilo, R.; Tregonning, G.; Perera, S.; Ahmed, S.A.K.S.; Ajisola, M.; Alam, O.; Aujla, N.; Azam, S.I.; et al. Analysis of openstreetmap data quality at different stages of a participatory mapping process: Evidence from slums in Africa and Asia. ISPRS Int. J. Geo-Inf. 2021, 10, 265. [Google Scholar] [CrossRef]
- Microsoft Microsoft Releases 18M Building Footprints in Uganda and Tanzania to Enable AI Assisted Mapping. Available online: https://blogs.bing.com/maps/2019-09/microsoft-releases-18M-building-footprints-in-uganda-and-tanzania-to-enable-ai-assisted-mapping/ (accessed on 1 July 2021).
- OpenStreetMap WikiProject Uganda/Microsoft Building Imports for UBOS Pilot Census Preparation—OpenStreetMap Wiki. Available online: https://wiki.openstreetmap.org/wiki/WikiProject_Uganda/Microsoft_building_imports_for_UBOS_pilot_census_preparation (accessed on 1 July 2021).
- Schaefer, J.T. The critical success index as an indicator of warning skill. Weather Forecast. 1990, 5, 570–575. [Google Scholar] [CrossRef] [Green Version]
- Moore, B.; McKee, J.J. The impact of seasonality on multi-scale feature extraction techniques. Int. J. Digit. Earth 2020, 13, 9–21. [Google Scholar] [CrossRef]
- Sliuzas, R.; Kuffer, M.; Kemper, T. Assessing the quality of global human settlement layer products for Kampala, Uganda. In Proceedings of the 2017 Joint Urban Remote Sensing Event (JURSE), Dubai, United Arab Emirates, 6–8 March 2017; pp. 1–4. [Google Scholar]


| Settlement Name | Year Established | Population | Settlement Boundary Area (km2) | Building Footprint Area (km2) |
|---|---|---|---|---|
| Agojo | 2016 | 7167 | 6.7 | 0.23 |
| Alere | 2013 | 6882 | 1.2 | 0.16 |
| Ayilo I | 2015 | 26,051 | 4.9 | 1.54 |
| Ayilo II | 2014 | 14,623 | 2.9 | 0.84 |
| Baratuku | 2013 | 7049 | 2.2 | 0.26 |
| Bidi Bidi | 2016 | 232,726 | 790.6 | 14.93 |
| Boroli I | 2014 | 10,098 | 0.7 | 0.26 |
| Boroli II | 2015 | 5138 | 0.4 | 0.17 |
| Elema | 1992 | 991 | 3.2 | 0.04 |
| Imvepi | 2017 | 69,192 | 96.7 | 2.24 |
| Kiryandongo | 2014 | 67,704 | 41.7 | 1.70 |
| Kyaka II | 2017 | 123,831 | 45.1 | 1.64 |
| Kyangwali | 1960 | 123,025 | 96.3 | 2.08 |
| Lobule | 2013 | 5547 | 2.2 | 0.13 |
| Maaji I | 1997 | 548 | 0.3 | 0.04 |
| Maaji II | 2015 | 17,518 | 3.3 | 0.68 |
| Maaji III | 2015 | 16,046 | 2.6 | 0.52 |
| Mireyi | 1994 | 7067 | 0.2 | 0.11 |
| Mungula I | 1996 | 5028 | 1.1 | 0.28 |
| Nakivale | 2015 | 133,192 | 458.2 | 8.56 |
| Nyumanzi | 2014 | 40,877 | 5.2 | 1.51 |
| Oliji | 2013 | 1420 | 1.1 | 0.09 |
| Olua I | 2012 | 5359 | 0.5 | 0.12 |
| Olua II | 2012 | 4241 | 0.4 | 0.10 |
| Oruchinga | 1961 | 7909 | 10.7 | 0.44 |
| Pagirinya | 2016 | 36,784 | 7.2 | 1.43 |
| Palabek | 2017 | 53,806 | 207.1 | 2.56 |
| Palorinya | 2016 | 122,805 | 114.7 | 5.37 |
| Rhino Camp | 1980 | 121,171 | 490.3 | 9.79 |
| Rwamwanja | 2012 | 72,997 | 79.2 | 3.66 |
| OSM–MS Building Footprints (Reference) | |||
|---|---|---|---|
| Settlement | Non-Settlement | ||
| Human Settlement Product | Settlement | Hit (TP) | False Alarm (FP) |
| Non-Settlement | Miss (FN) | None (TN) | |
| Detection Metric | Equation |
|---|---|
| Probability of detection (POD) | |
| Critical success index (CSI) | |
| F1-score (F1) | |
| False alarm rate (FAR) |
| Number of Settlement Products in Agreement | ||||
|---|---|---|---|---|
| Settlement Establishment | 1 | 2 | 3 | |
| GHS-BUILT-S2 | Pre-2016 | 0.00 | 0.28 | 0.66 |
| Post-2016 | 0.00 | 0.30 | 0.68 | |
| HRSL | Pre-2016 | 0.00 | 0.51 | 0.75 |
| Post-2016 | 0.00 | 0.52 | 0.70 | |
| WSF | Pre-2016 | 0.00 | 0.21 | 0.59 |
| Post-2016 | 0.00 | 0.18 | 0.62 | |
| GRID3-SE | Pre-2016 | 0.99 | 1.00 | 1.00 |
| Post-2016 | 1.00 | 1.00 | 1.00 | |
Publisher’s Note: MDPI stays neutral with regard to jurisdictional claims in published maps and institutional affiliations. |
© 2021 by the authors. Licensee MDPI, Basel, Switzerland. This article is an open access article distributed under the terms and conditions of the Creative Commons Attribution (CC BY) license (https://creativecommons.org/licenses/by/4.0/).
Share and Cite
Van Den Hoek, J.; Friedrich, H.K. Satellite-Based Human Settlement Datasets Inadequately Detect Refugee Settlements: A Critical Assessment at Thirty Refugee Settlements in Uganda. Remote Sens. 2021, 13, 3574. https://doi.org/10.3390/rs13183574
Van Den Hoek J, Friedrich HK. Satellite-Based Human Settlement Datasets Inadequately Detect Refugee Settlements: A Critical Assessment at Thirty Refugee Settlements in Uganda. Remote Sensing. 2021; 13(18):3574. https://doi.org/10.3390/rs13183574
Chicago/Turabian StyleVan Den Hoek, Jamon, and Hannah K. Friedrich. 2021. "Satellite-Based Human Settlement Datasets Inadequately Detect Refugee Settlements: A Critical Assessment at Thirty Refugee Settlements in Uganda" Remote Sensing 13, no. 18: 3574. https://doi.org/10.3390/rs13183574
APA StyleVan Den Hoek, J., & Friedrich, H. K. (2021). Satellite-Based Human Settlement Datasets Inadequately Detect Refugee Settlements: A Critical Assessment at Thirty Refugee Settlements in Uganda. Remote Sensing, 13(18), 3574. https://doi.org/10.3390/rs13183574