
Building Structure Mapping on Level Terrains and Sea Surfaces in Vietnam


Abstract
:1. Introduction
2. Methods
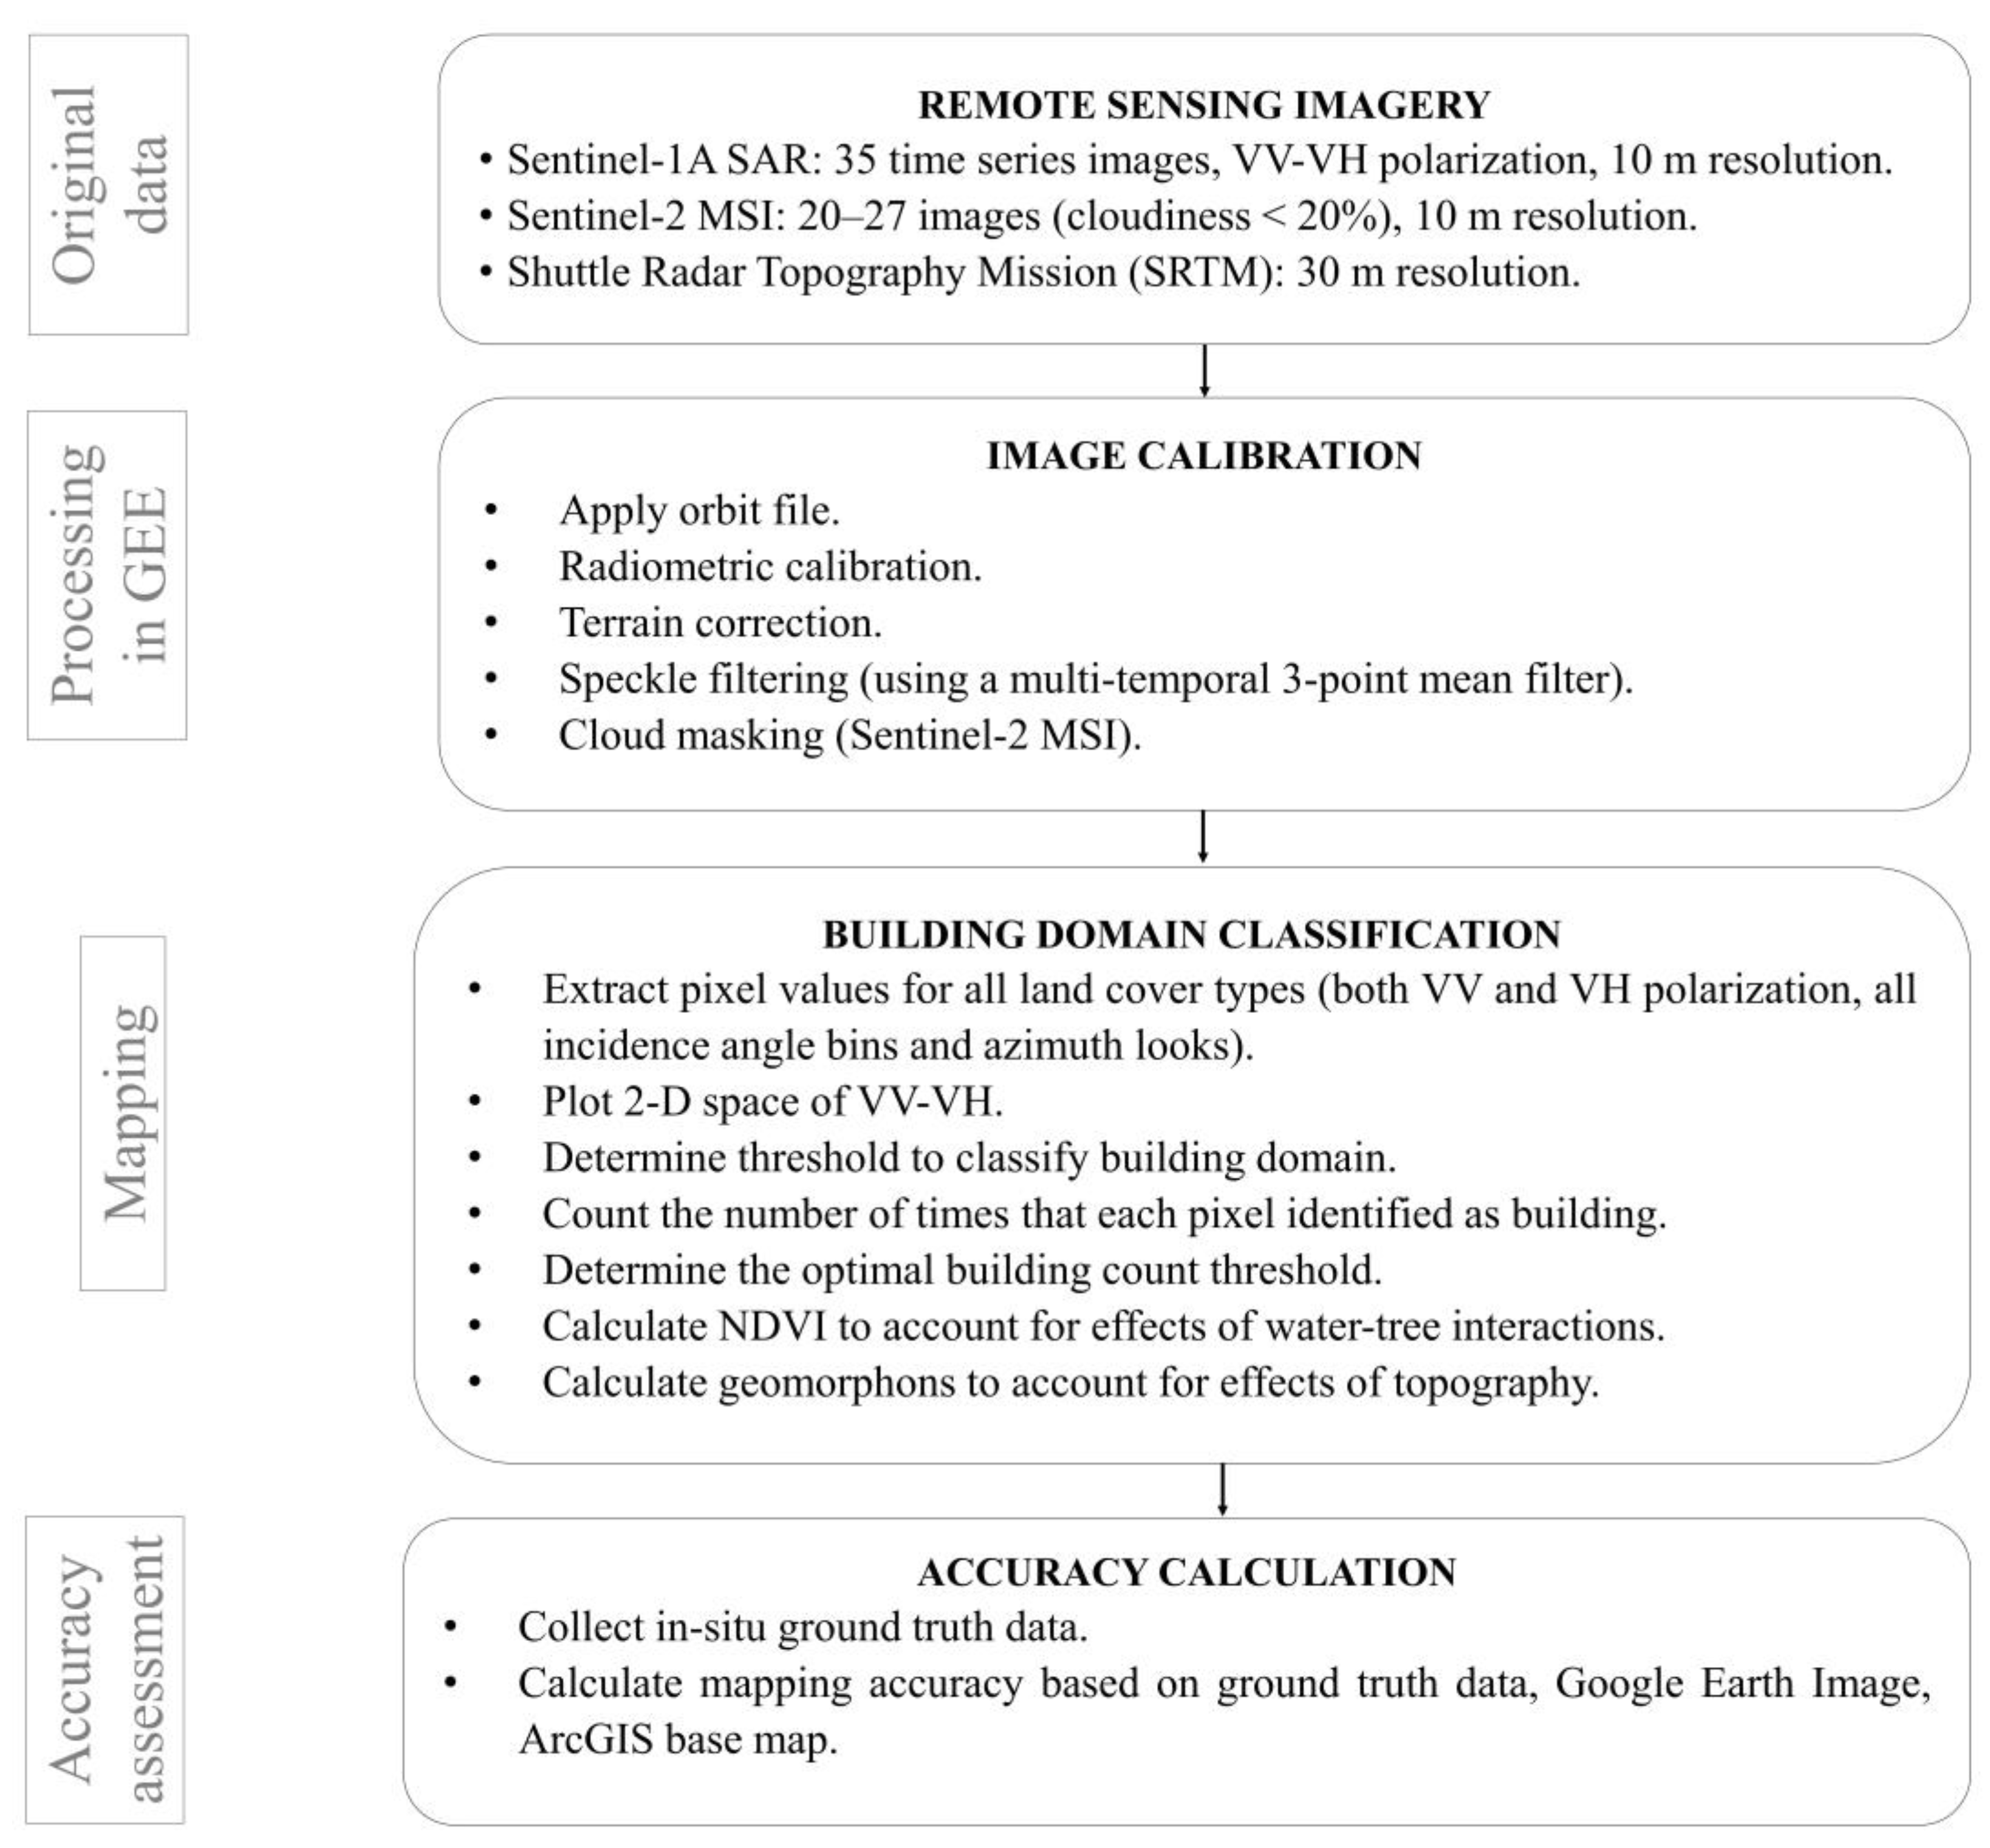
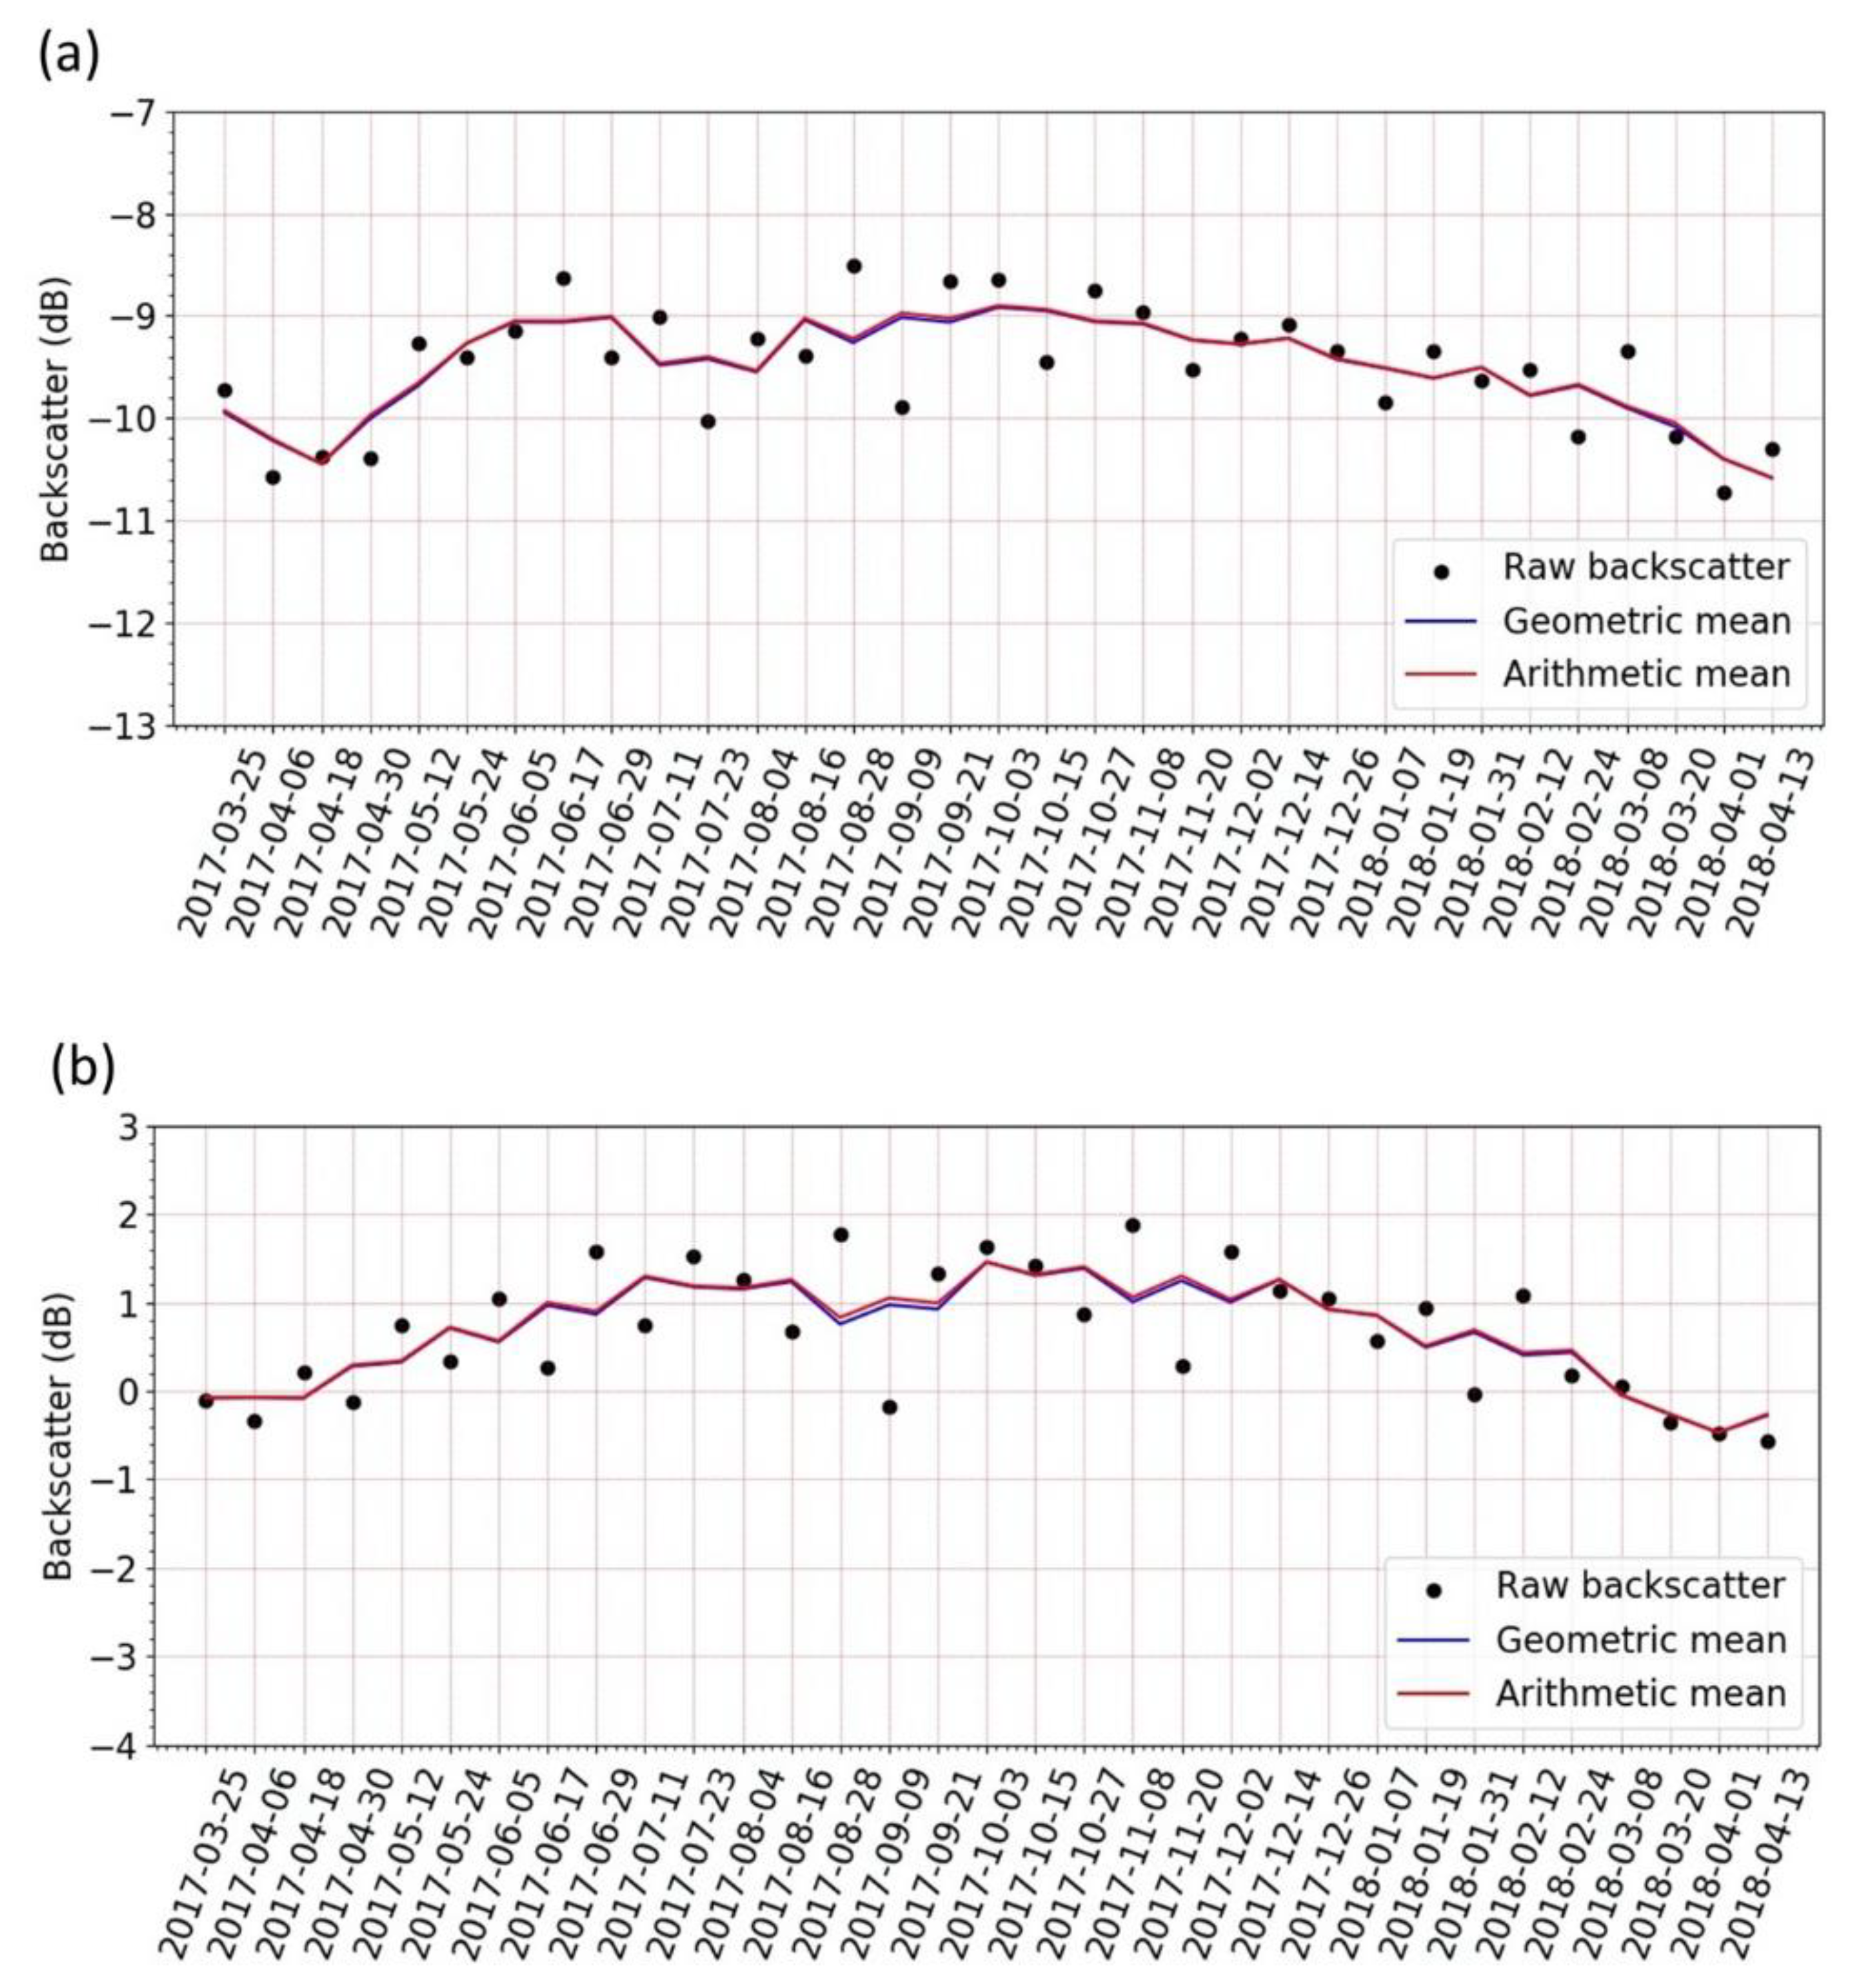
2.1. Image Processing
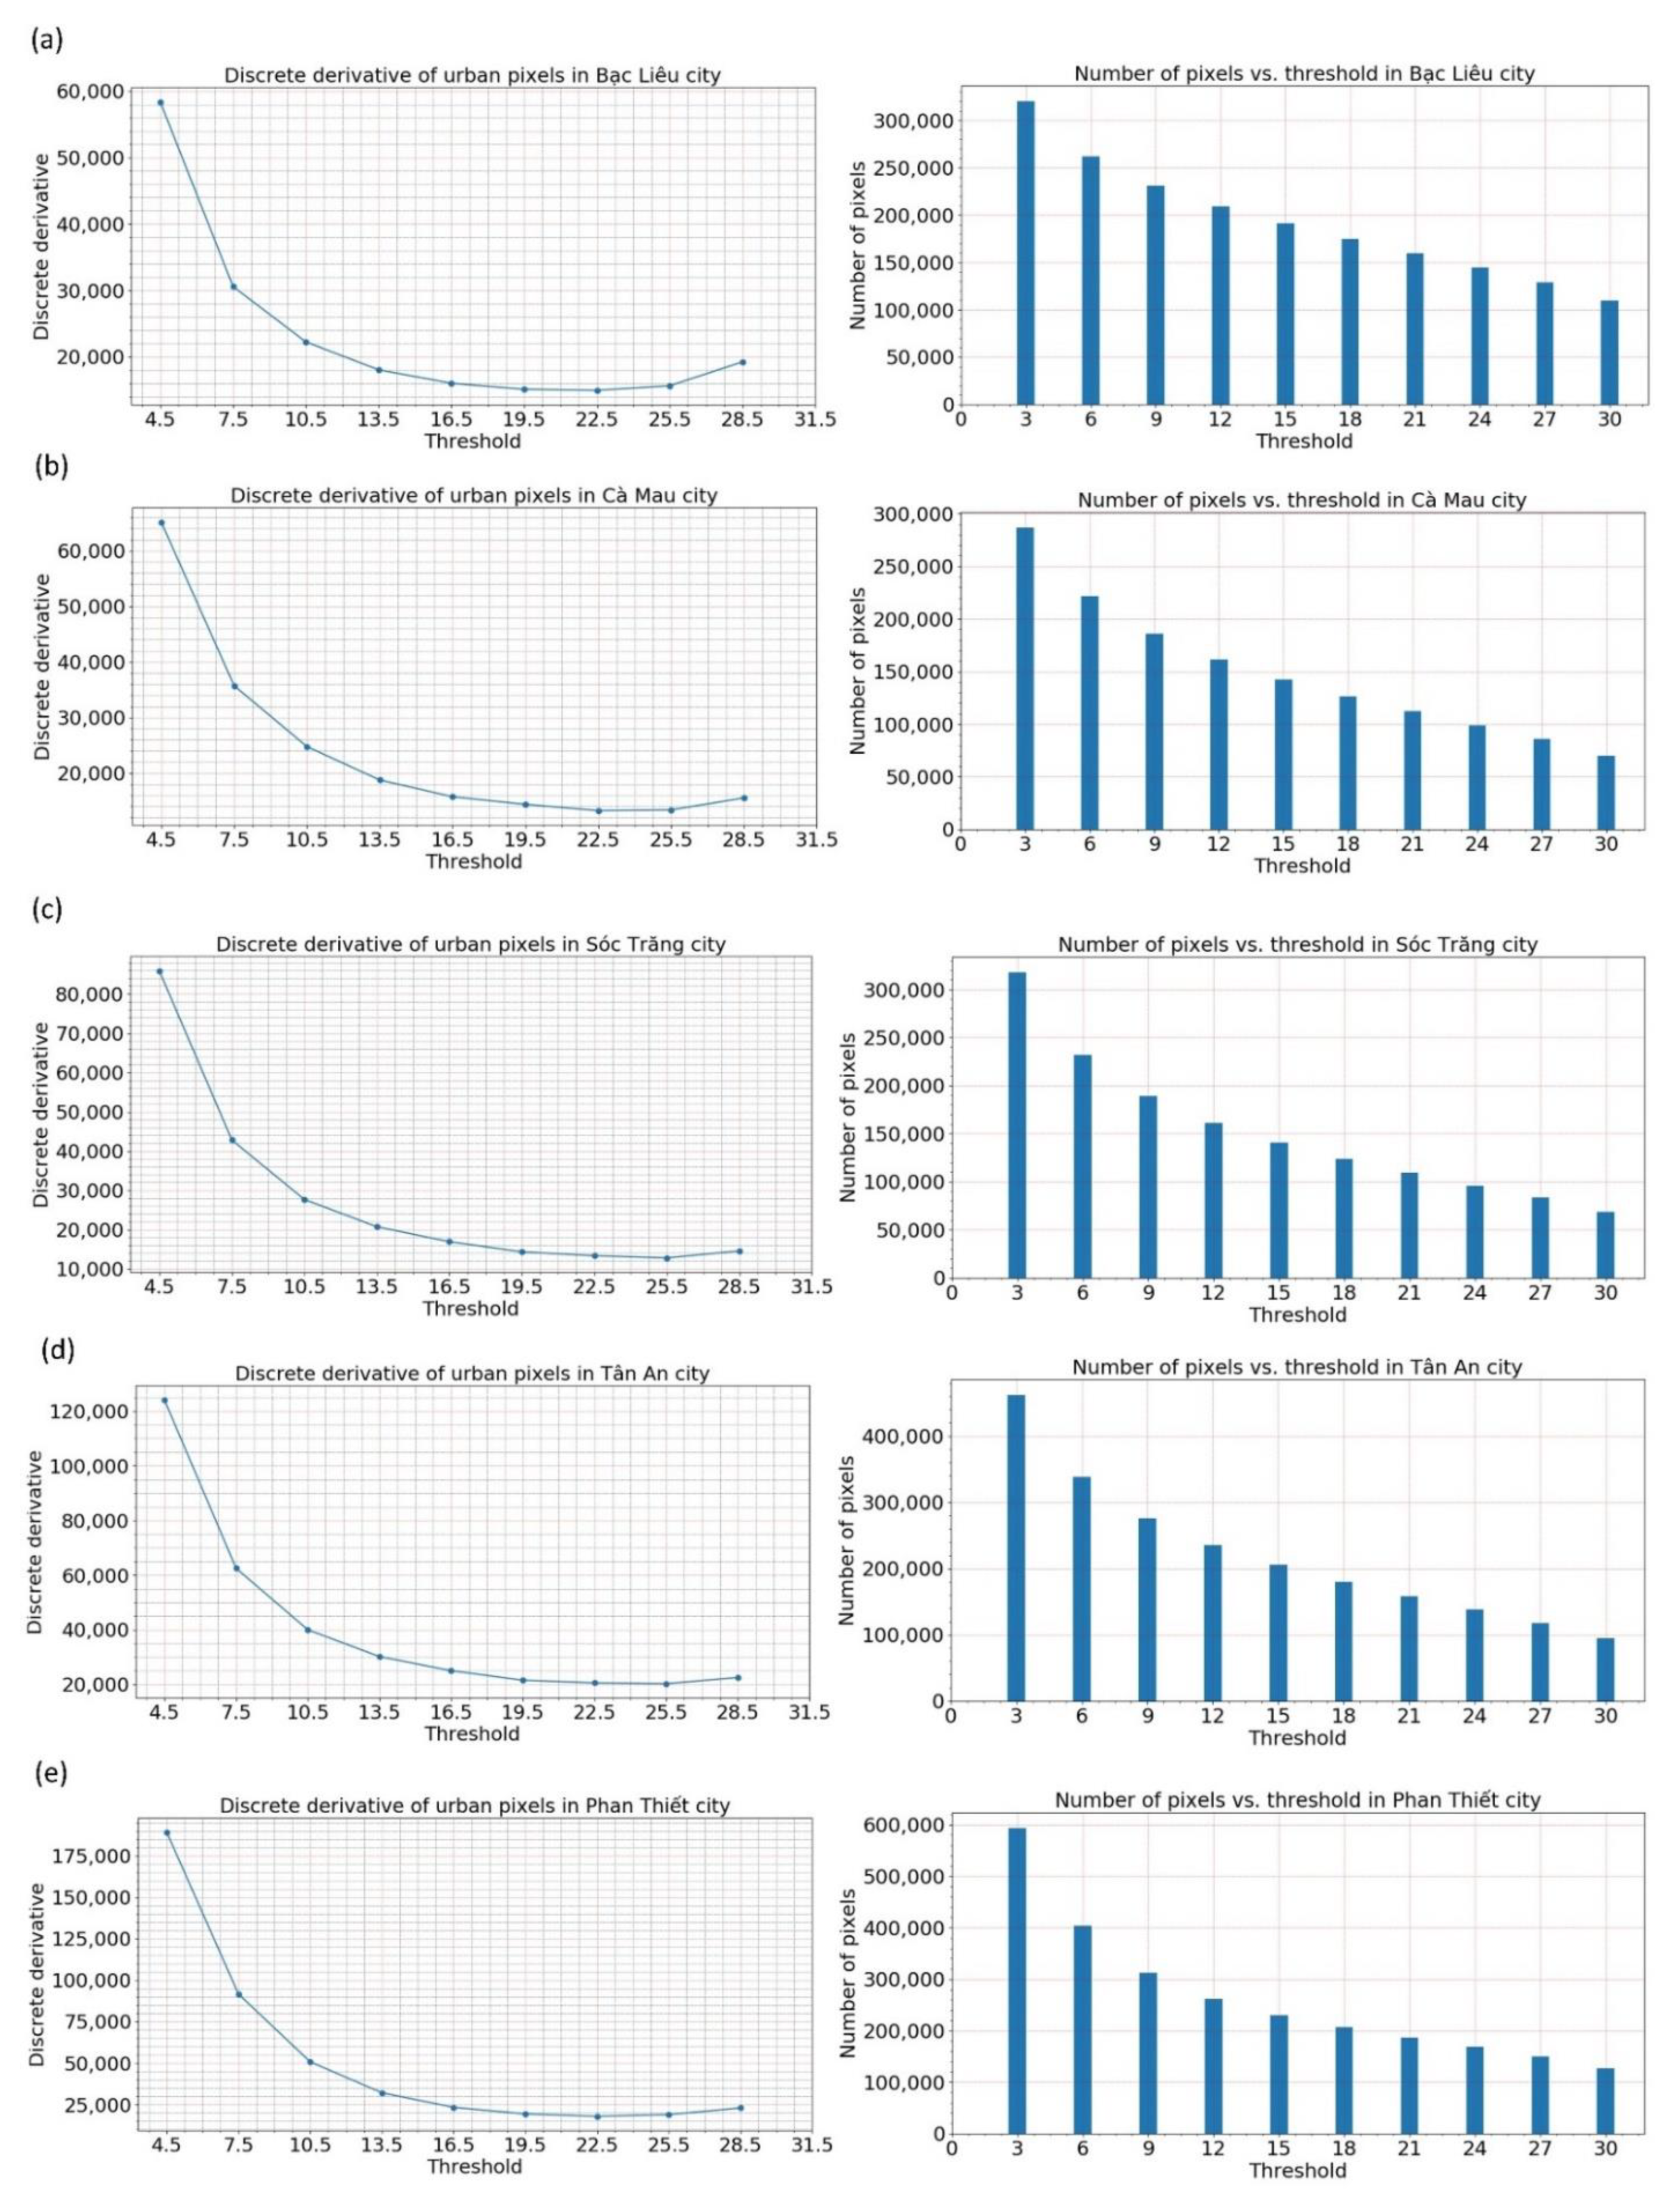
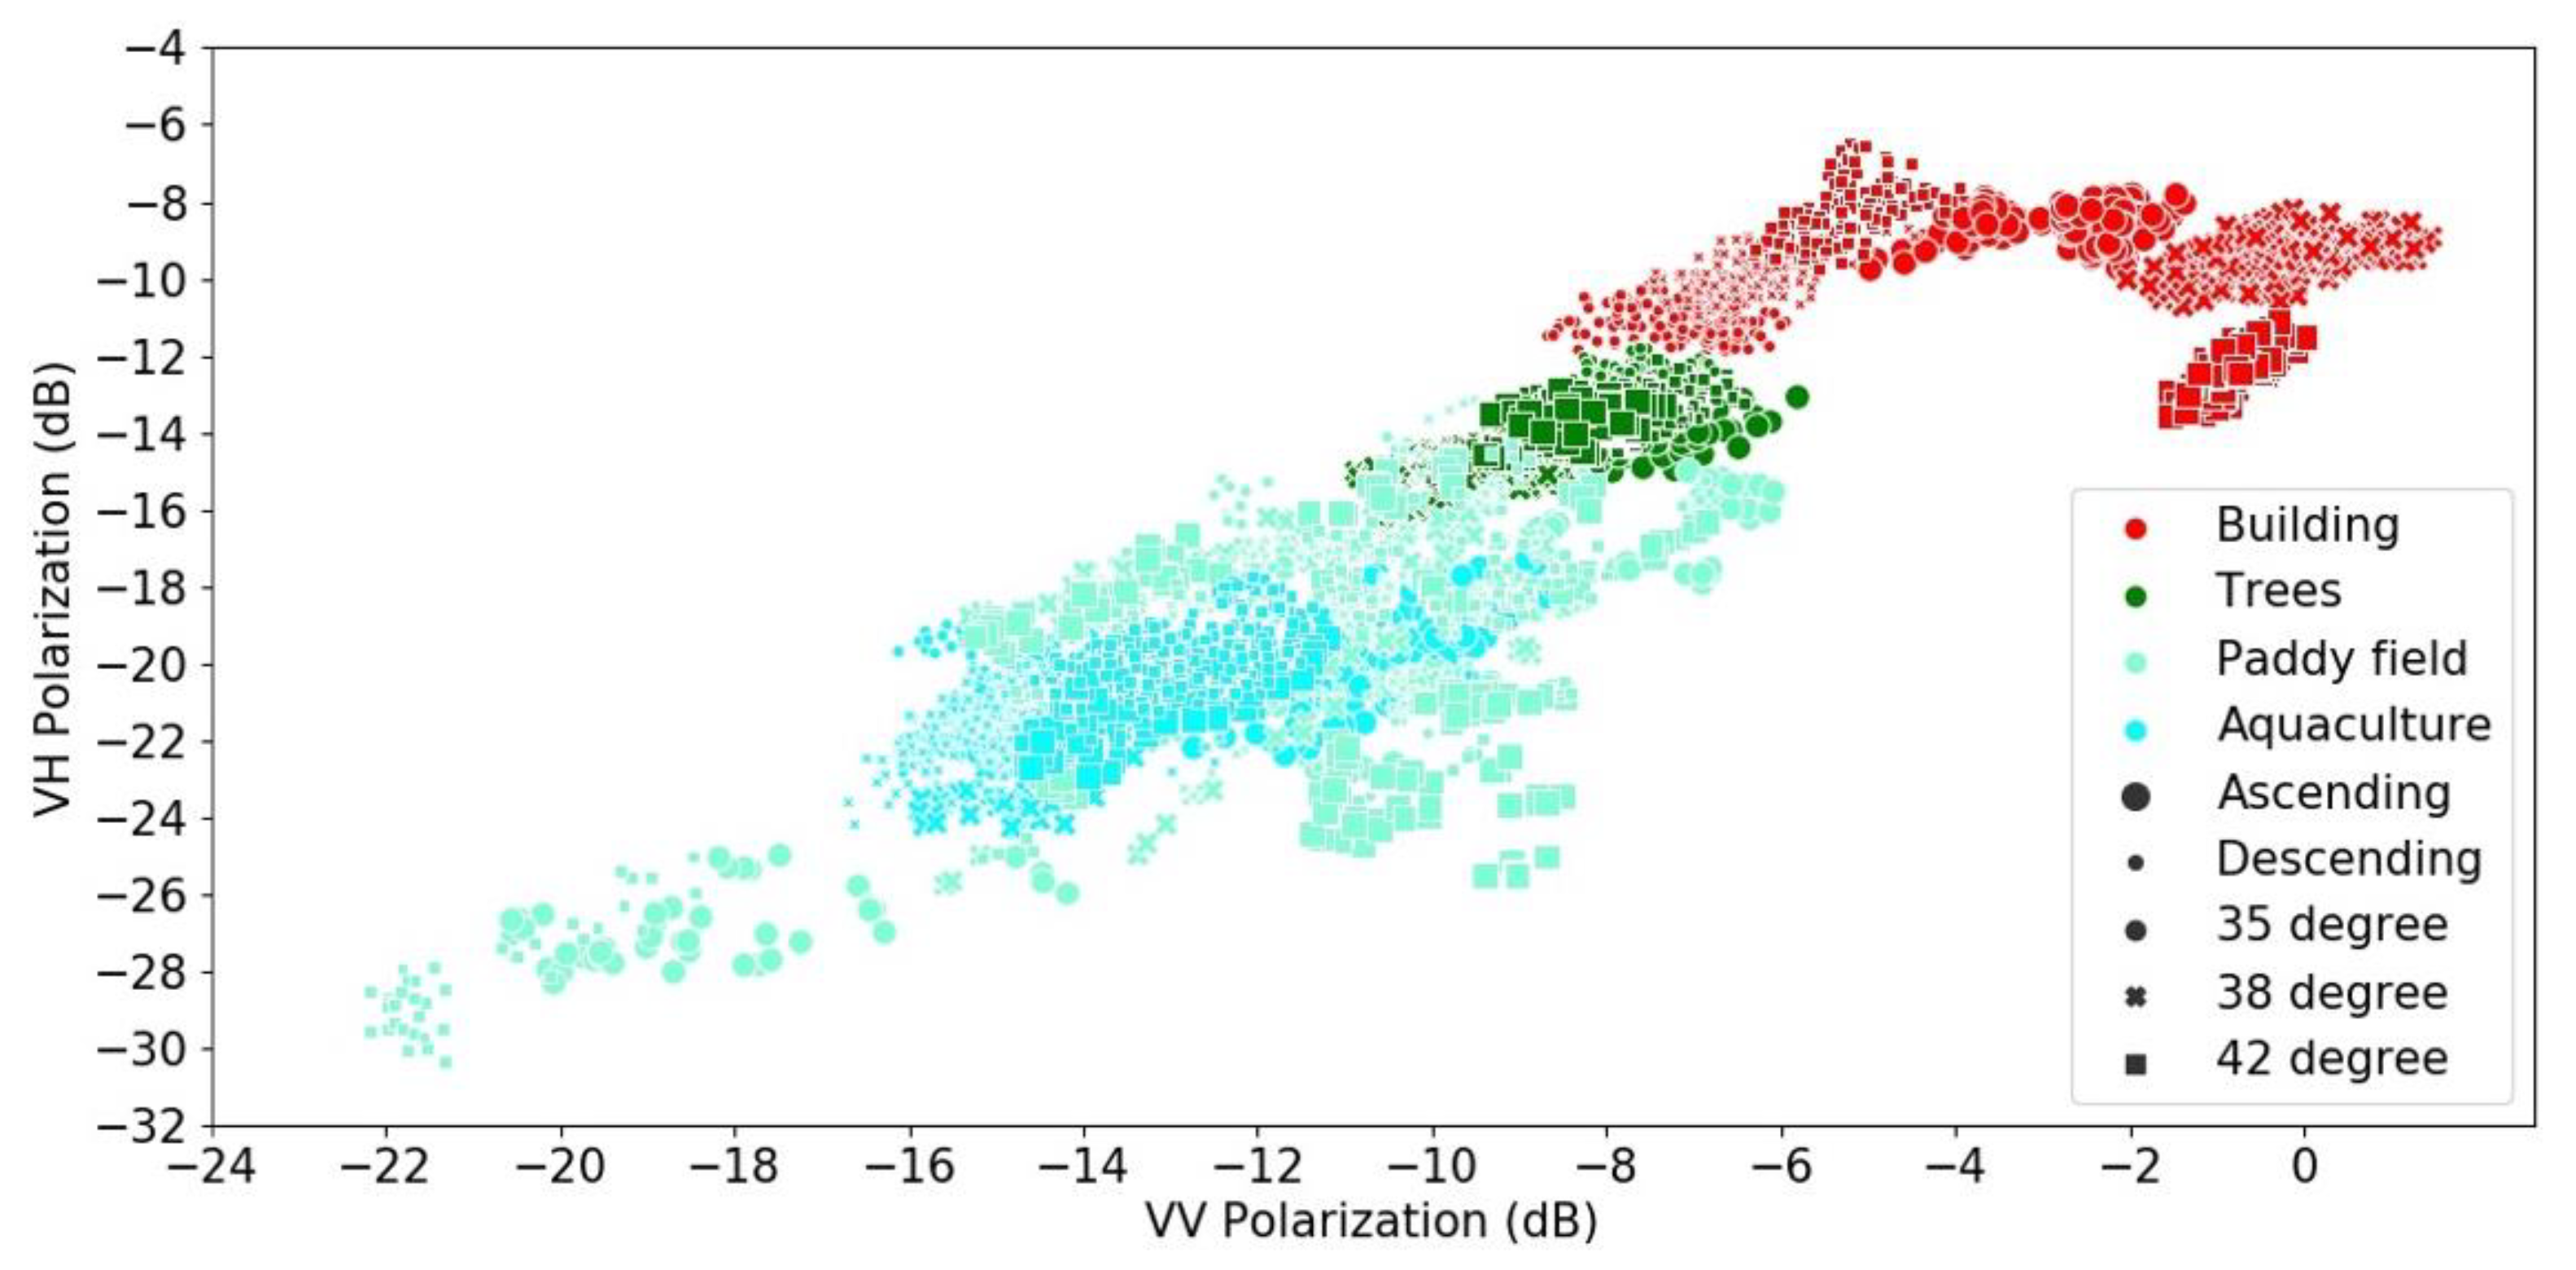
2.2. Mapping
2.3. Ground Truth Data Collection and Accuracy Assessment
2.4. Building Structures on Land
2.5. Building Structures on Sea Surface
3. Results
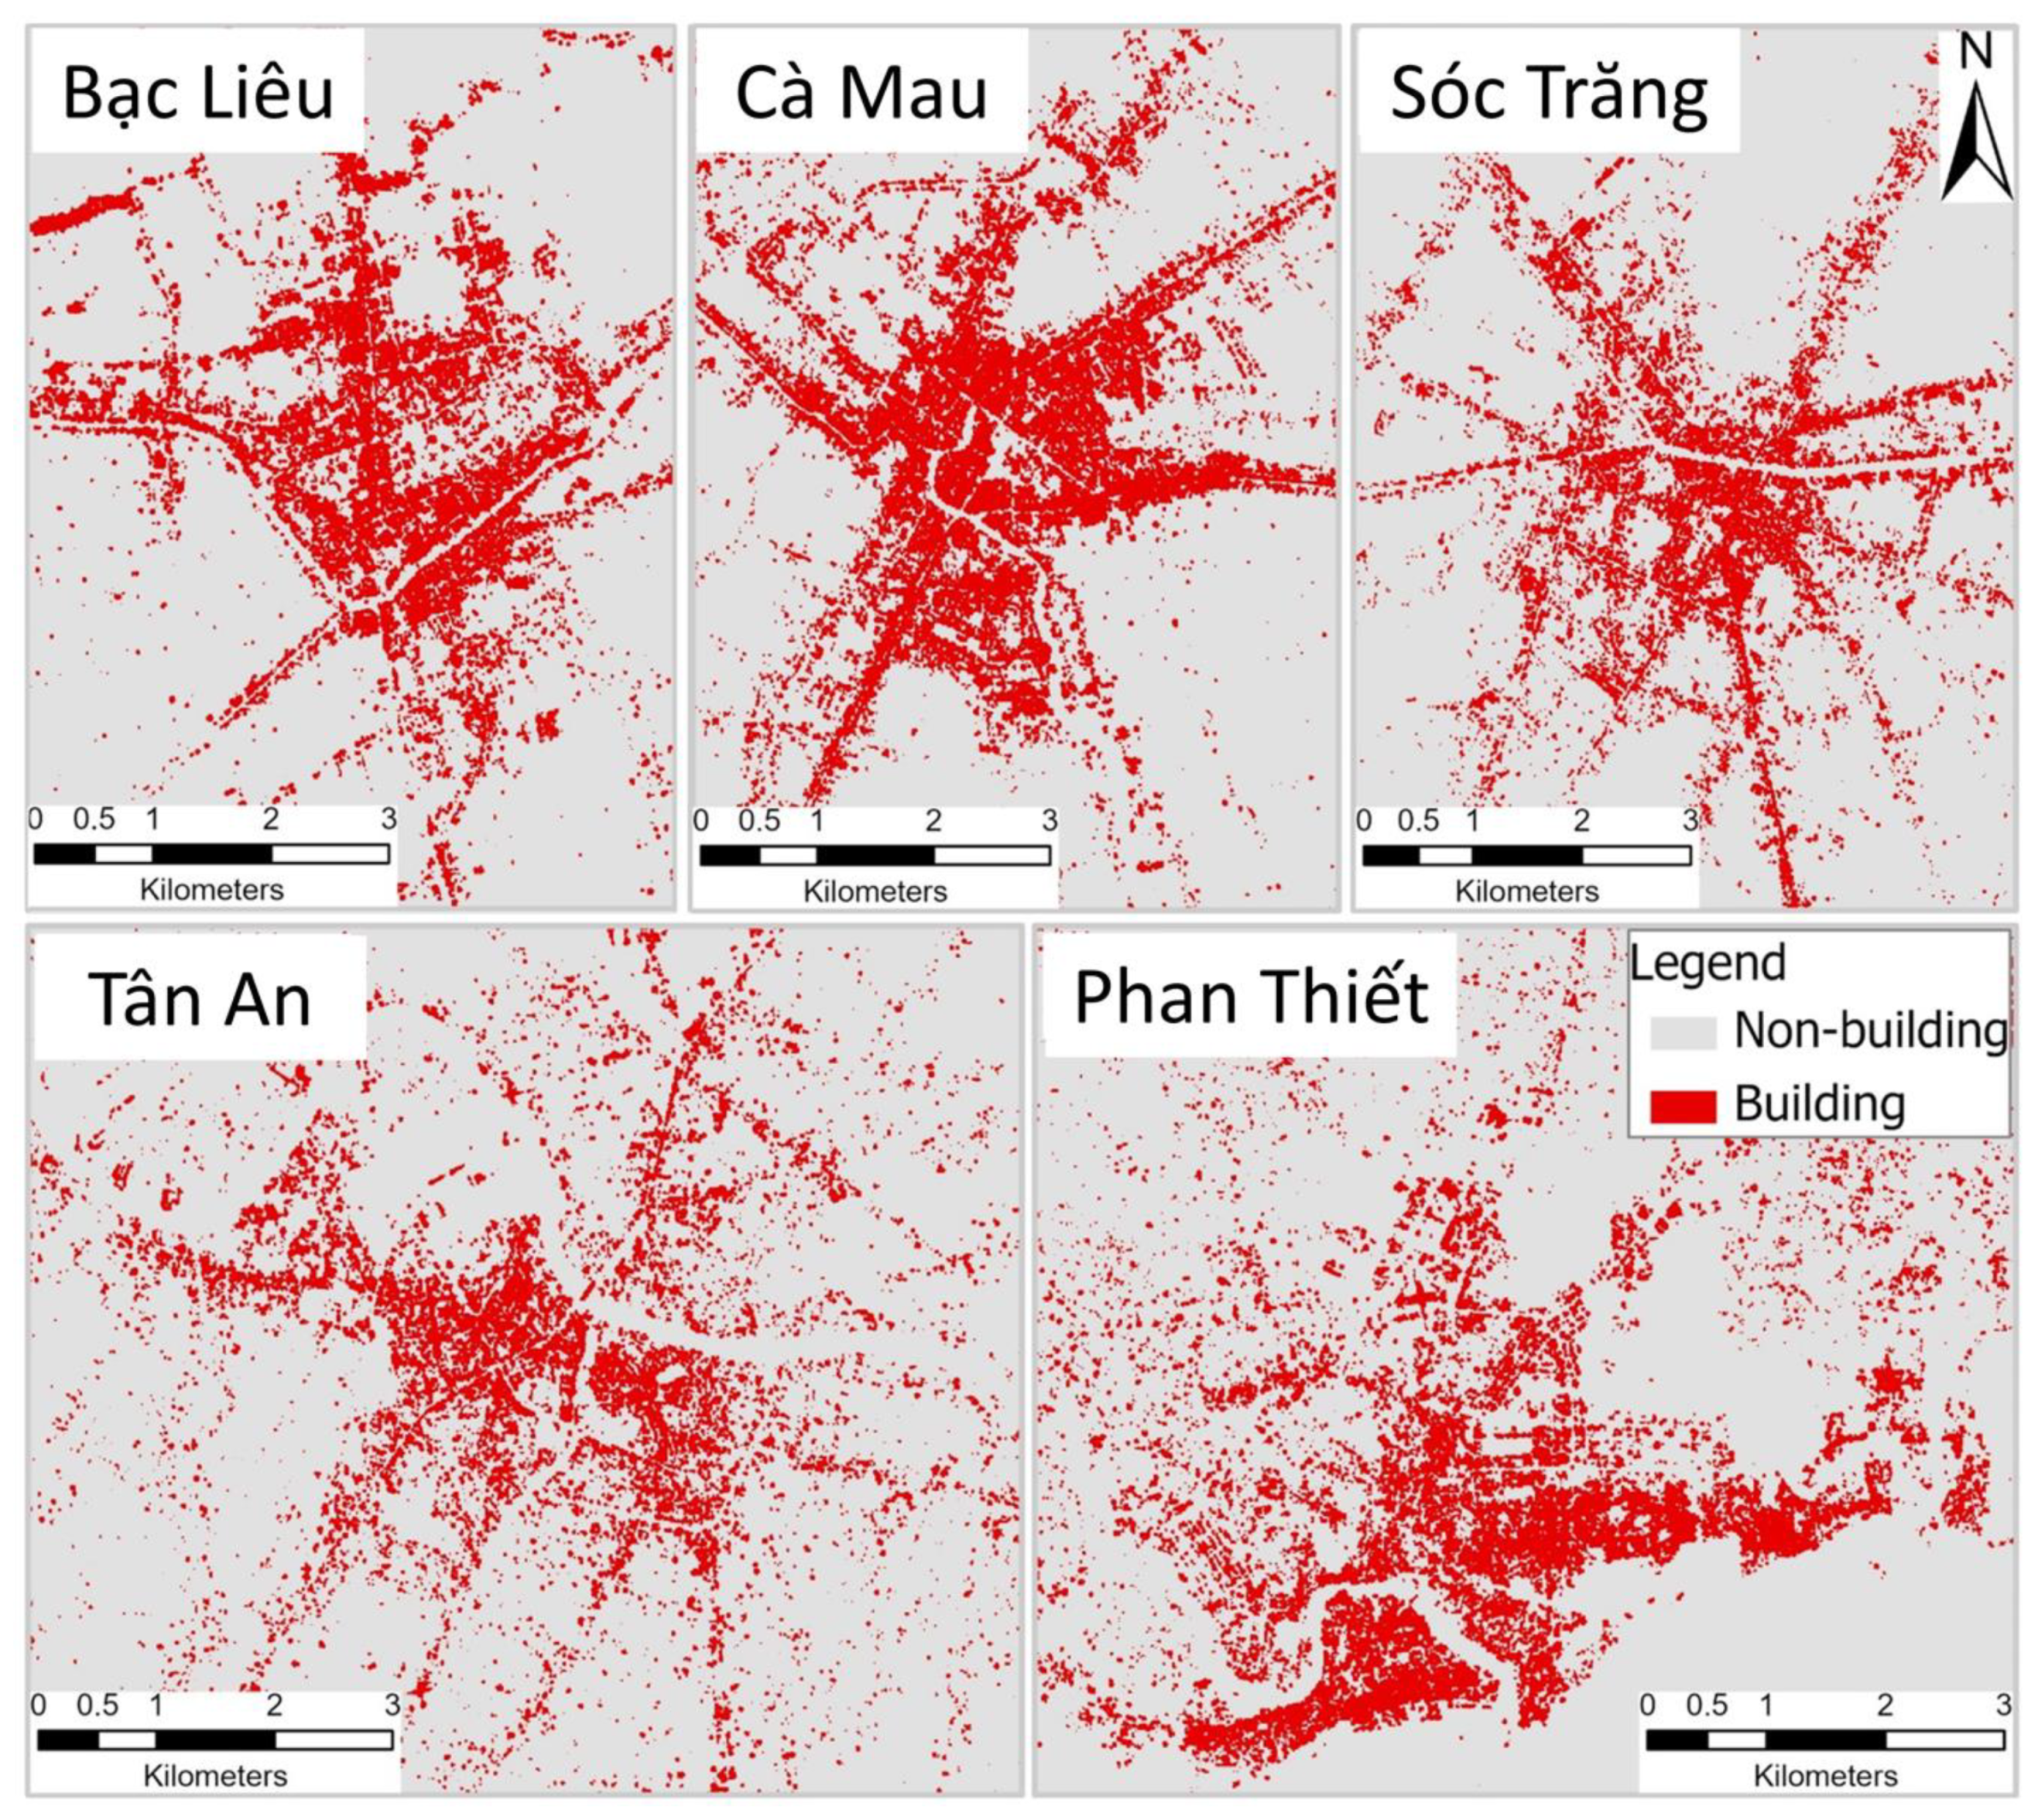
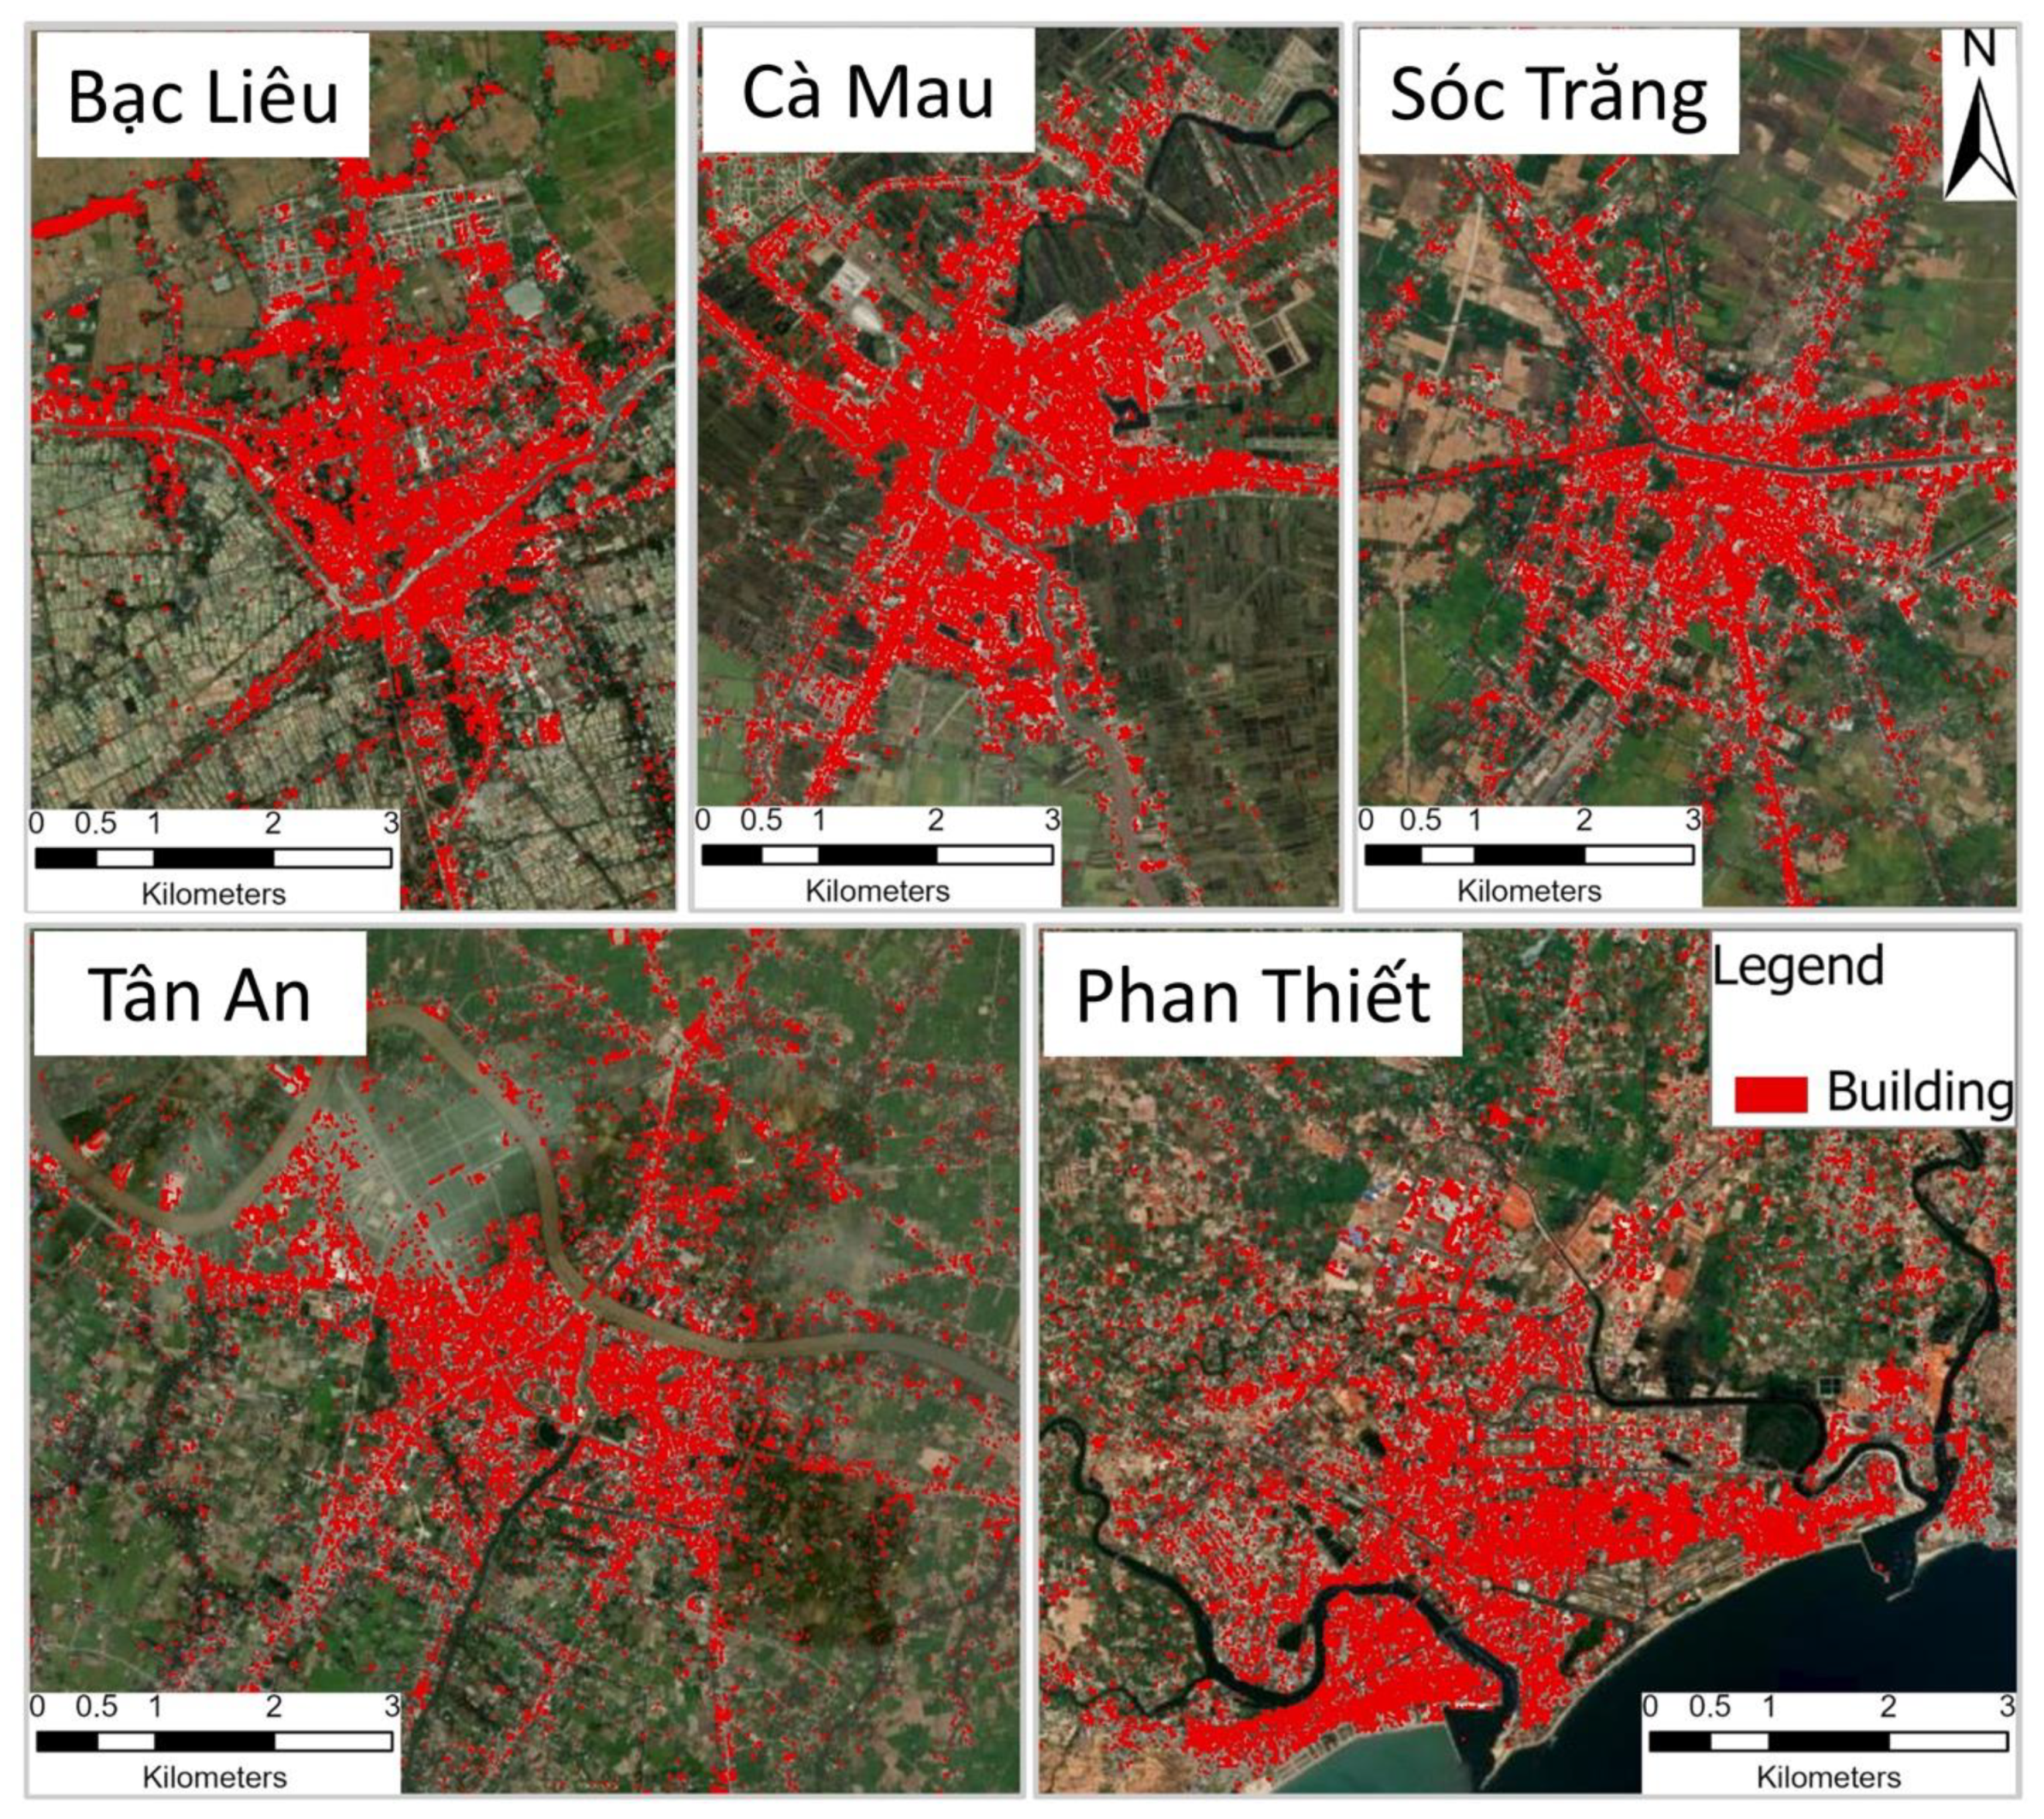
3.1. Results for Building Structures on Land
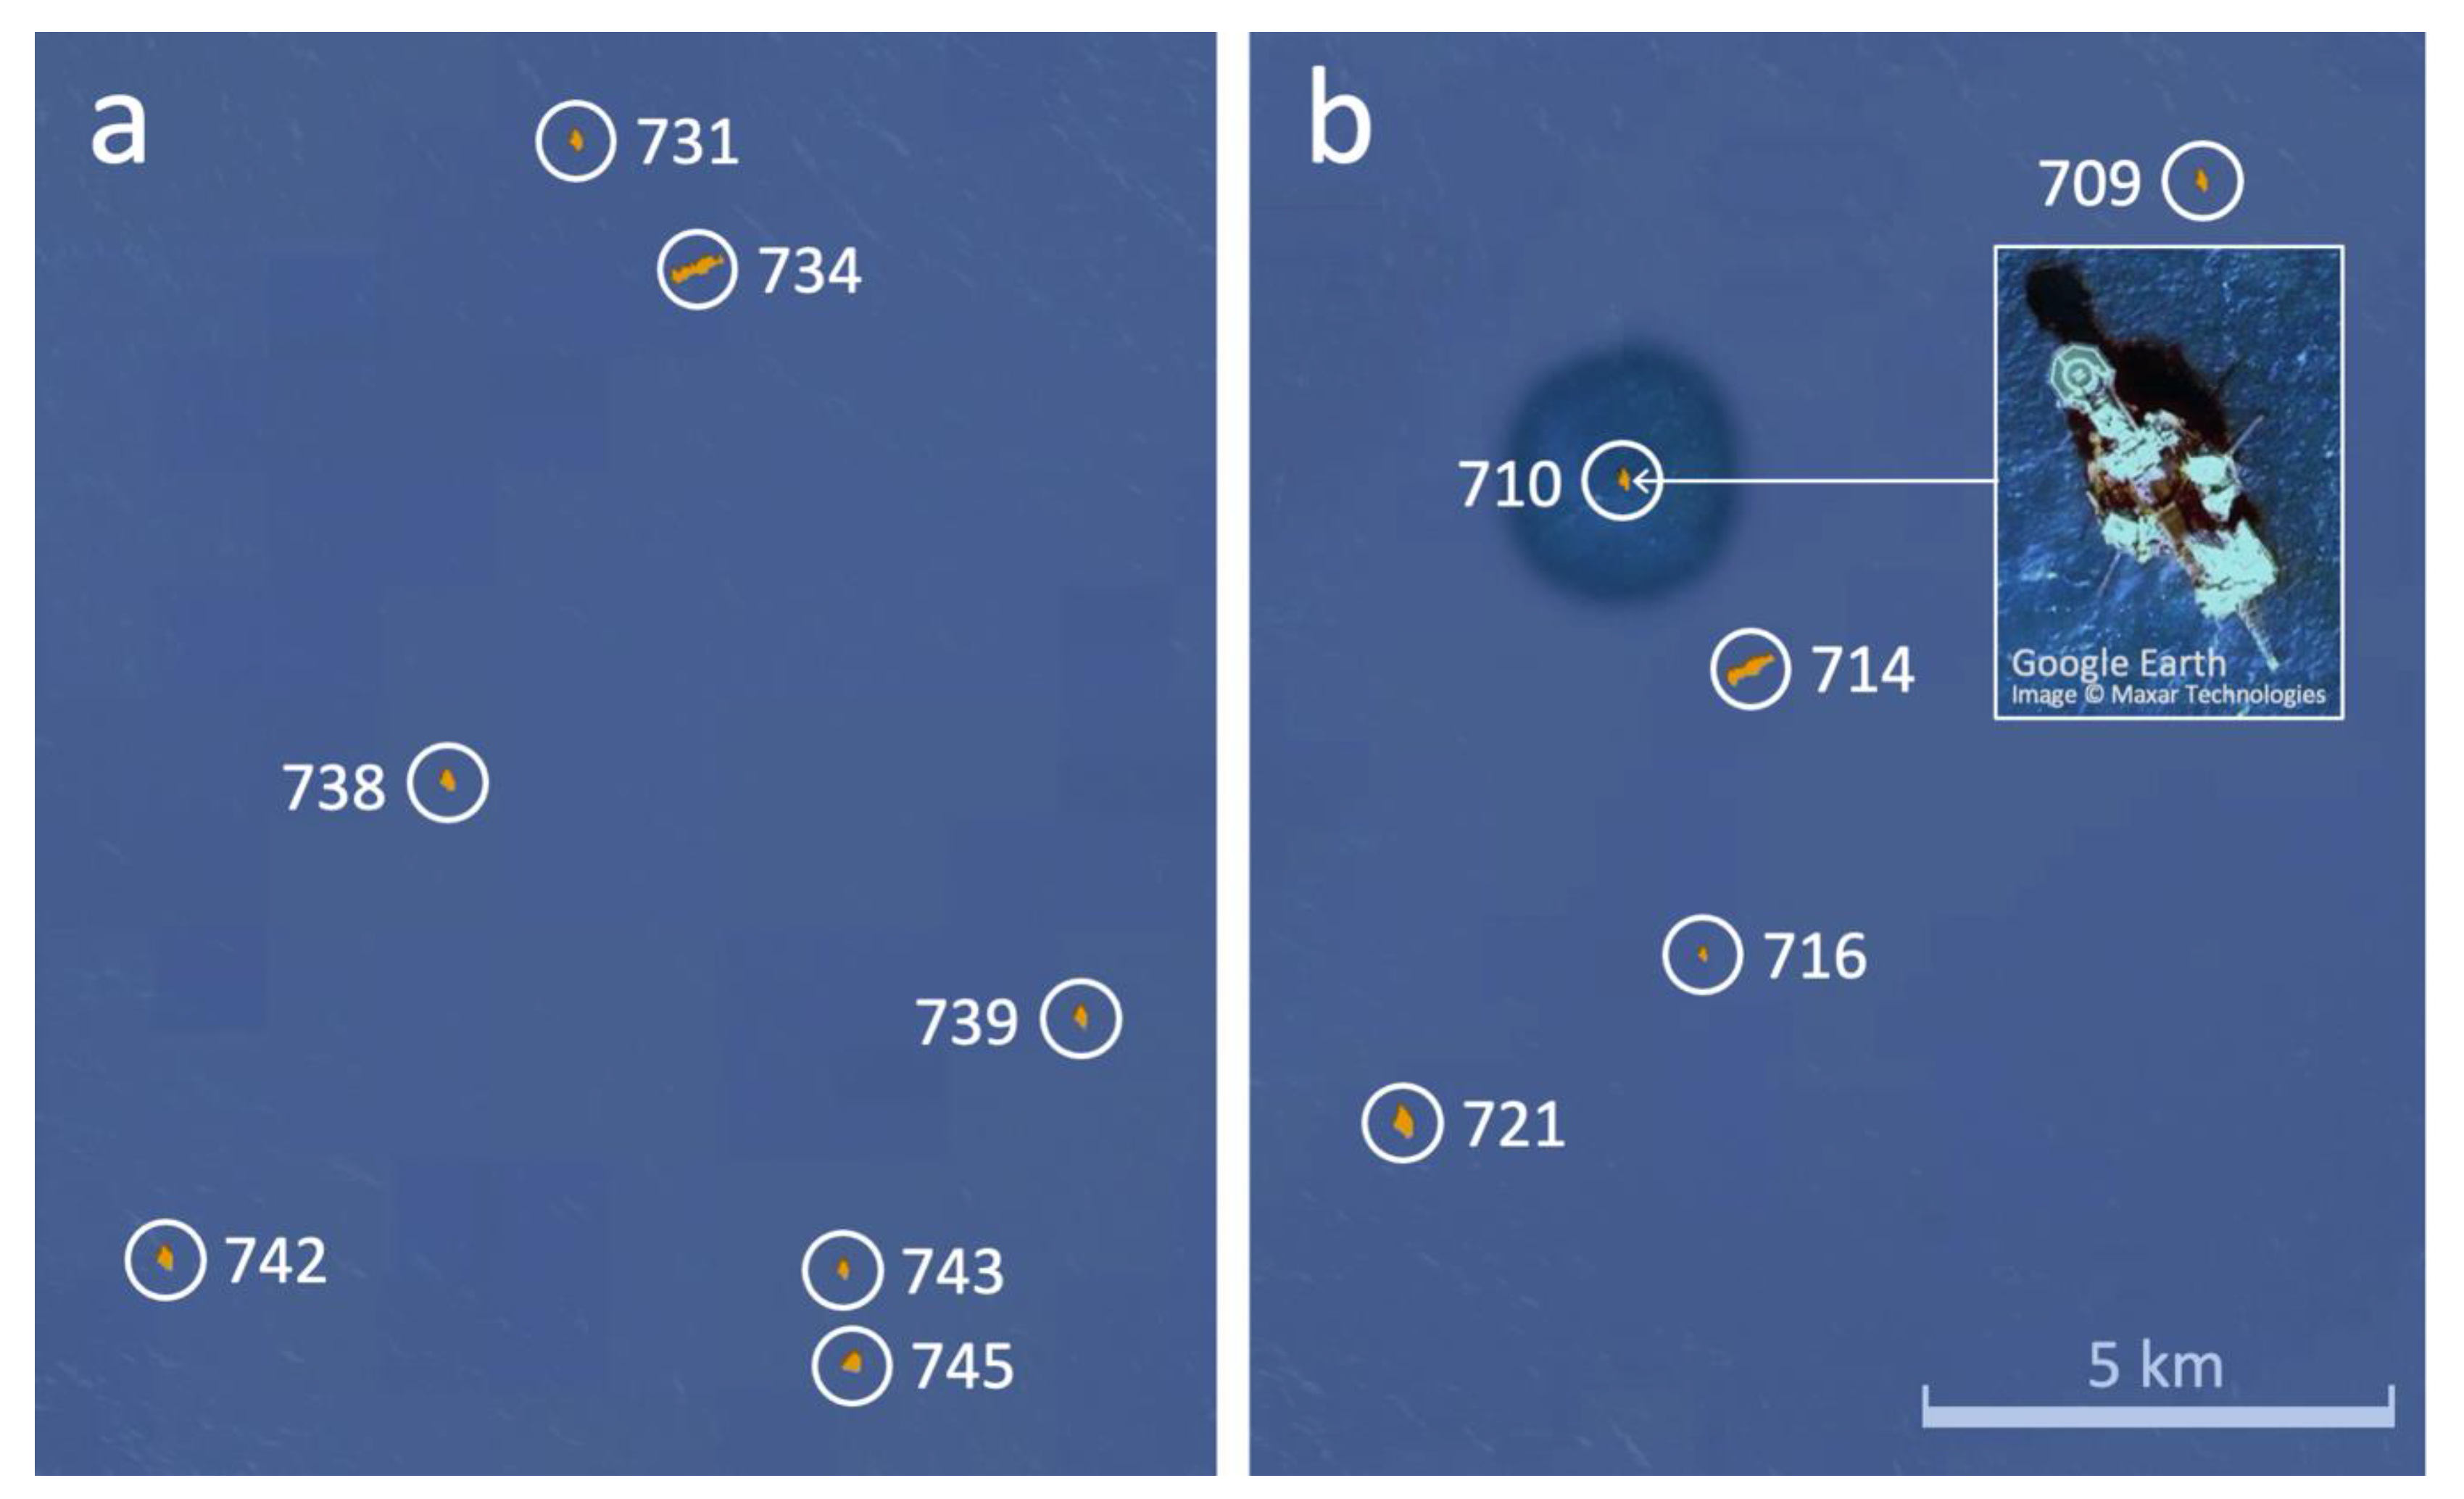
3.2. Results for Building Structures on the Sea Surface
4. Discussion
5. Conclusions
- The novel use of satellite Sentinel-1 SAR data in the two-dimensional polarization domain enables the method to be robust against confounding factors such as variations due to different incidence and azimuth angles, due to water-tree radar signal interactions (with synergistic Sentinel-2 MSI data), and due to different landforms on complex typography (with the geomorphon concept), without having to rely on more complicated methods such as neural networks that may introduce non-linearity, non-uniqueness, or extraneous outcomes.
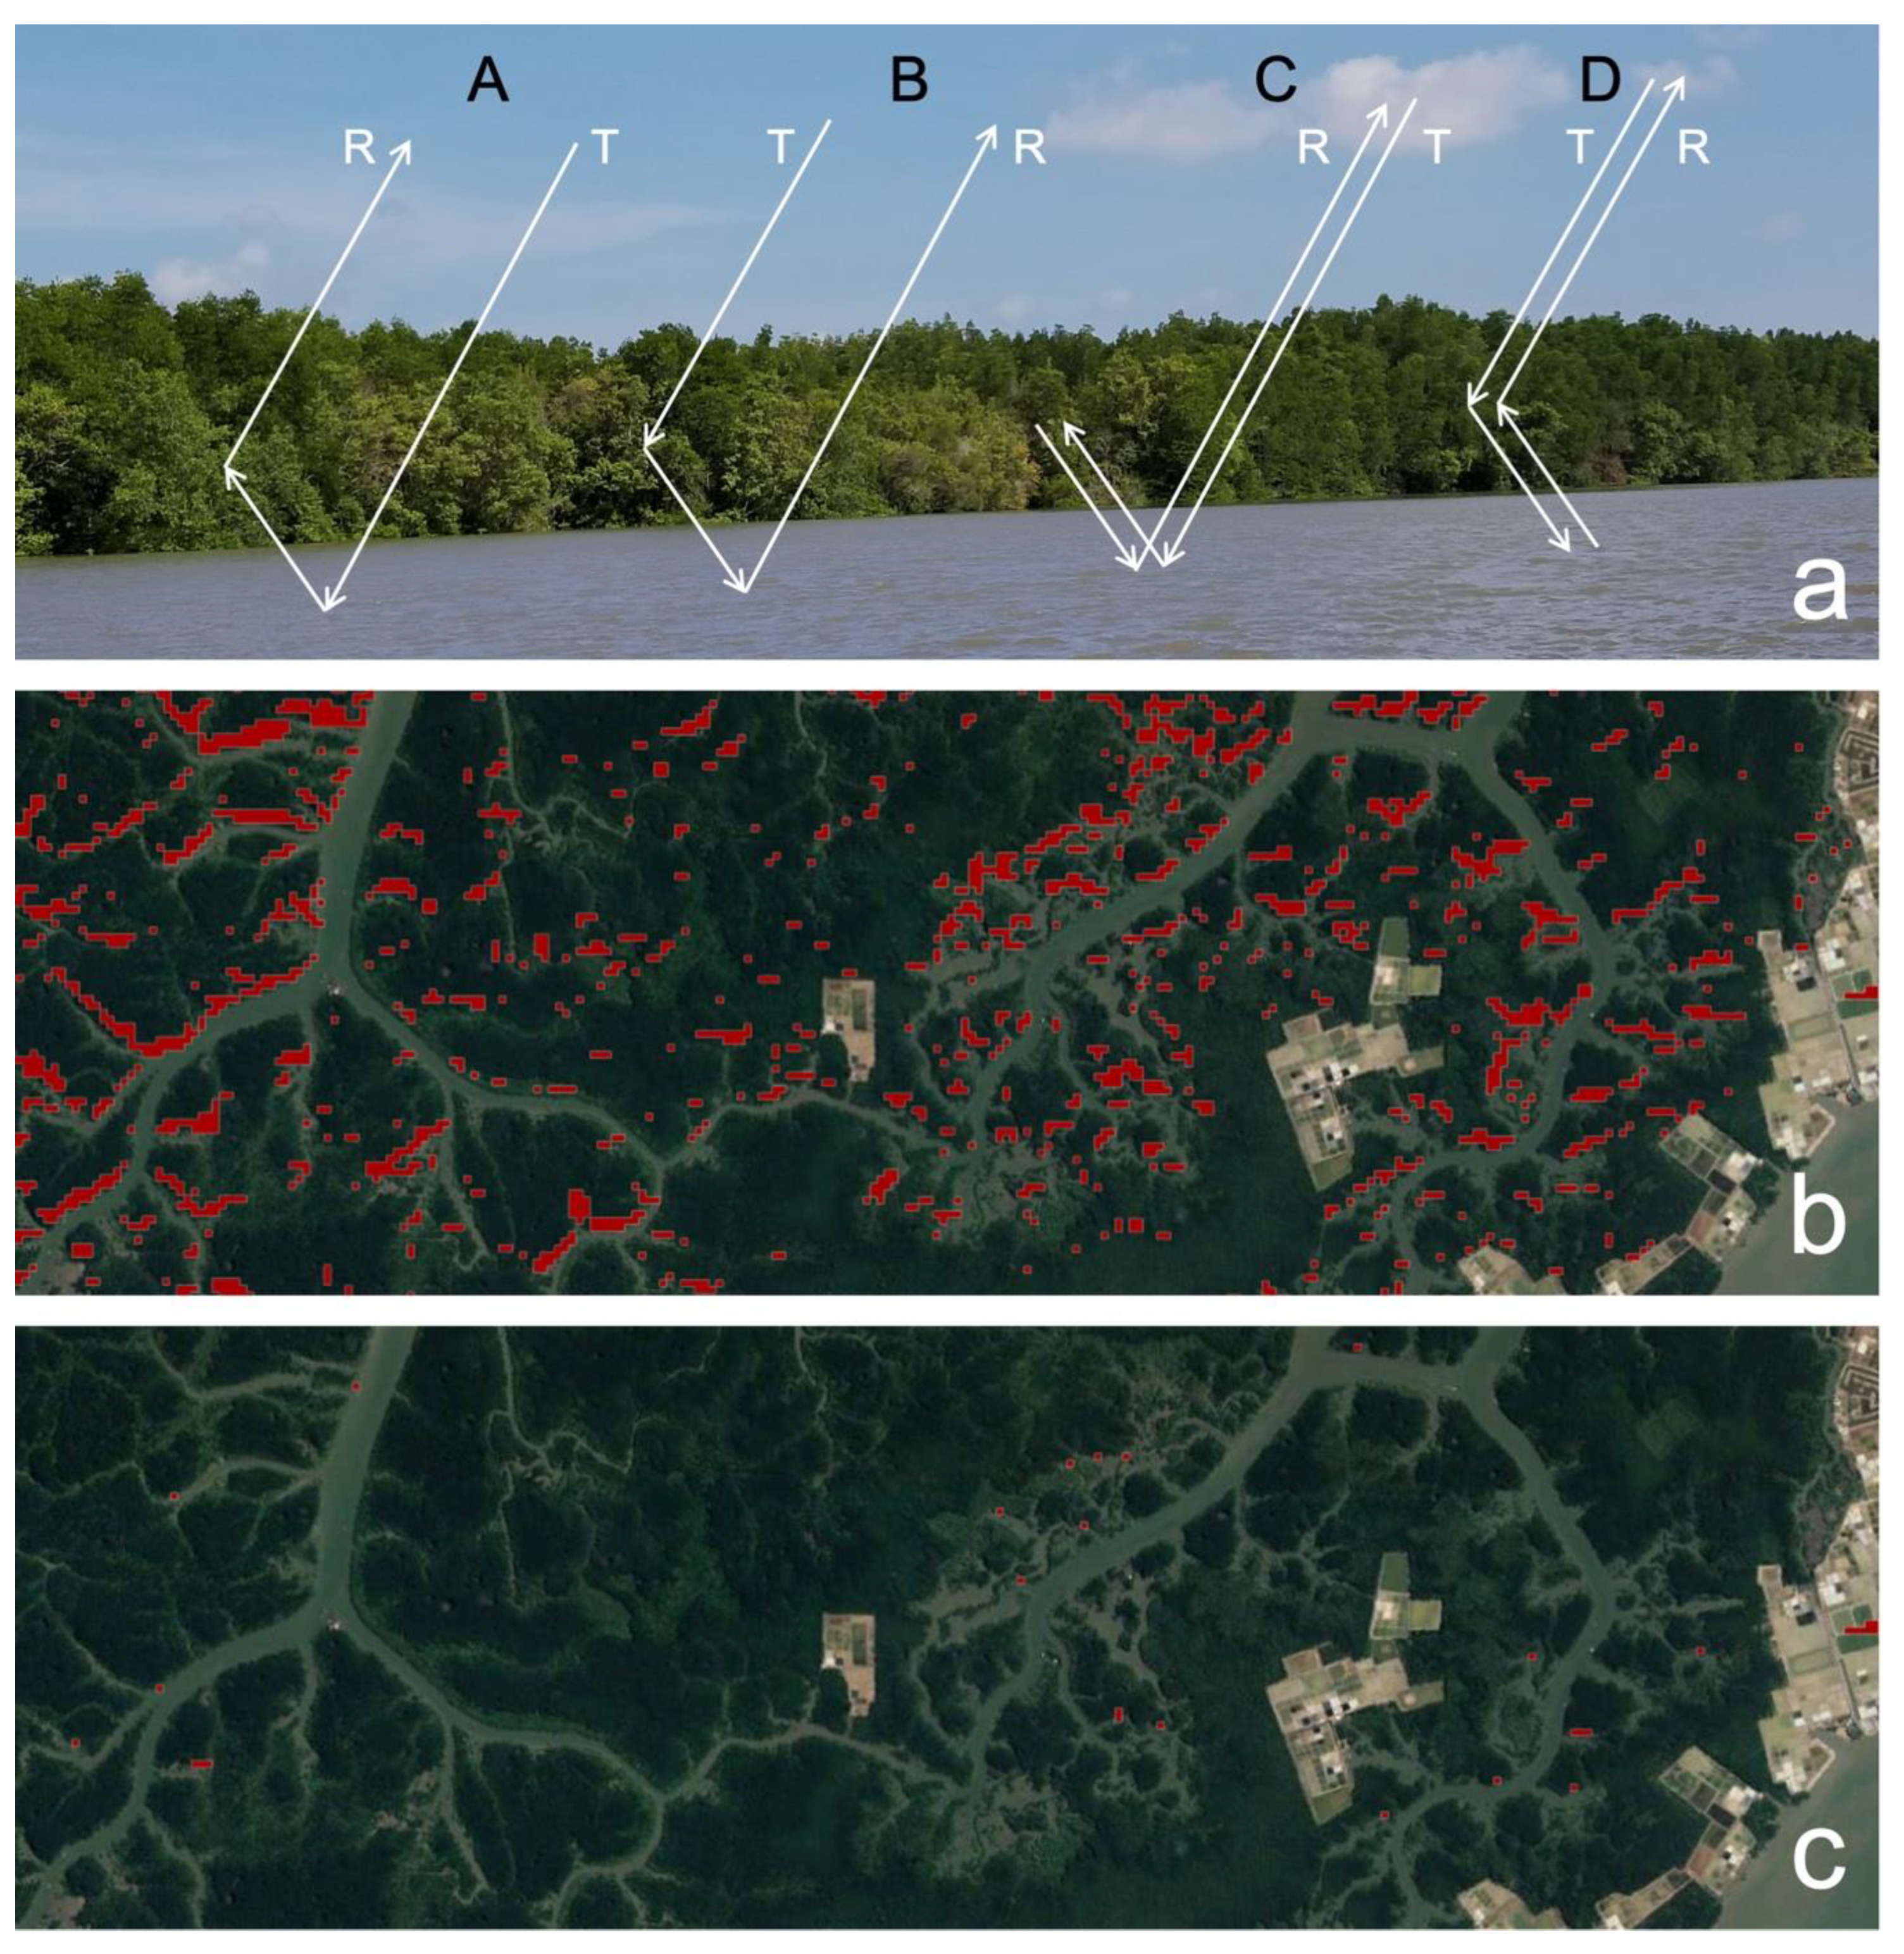
- A demonstration of the ability of radar backscatter signatures to detect building structures is founded on radar responses to true physical structures of buildings [5,6], rather than optical colors or spectral appearances of land cover types. As our method is based on radar signatures of physical building structures, it can successfully capture the characteristics of urban building patterns corresponding to different urban development classes and socioeconomic status (see Table 1 and Table 2), and in different rural-urban landscapes in both inland and coastal regions with wet and arid environmental conditions, or over sea surfaces under different wind and wave effects.
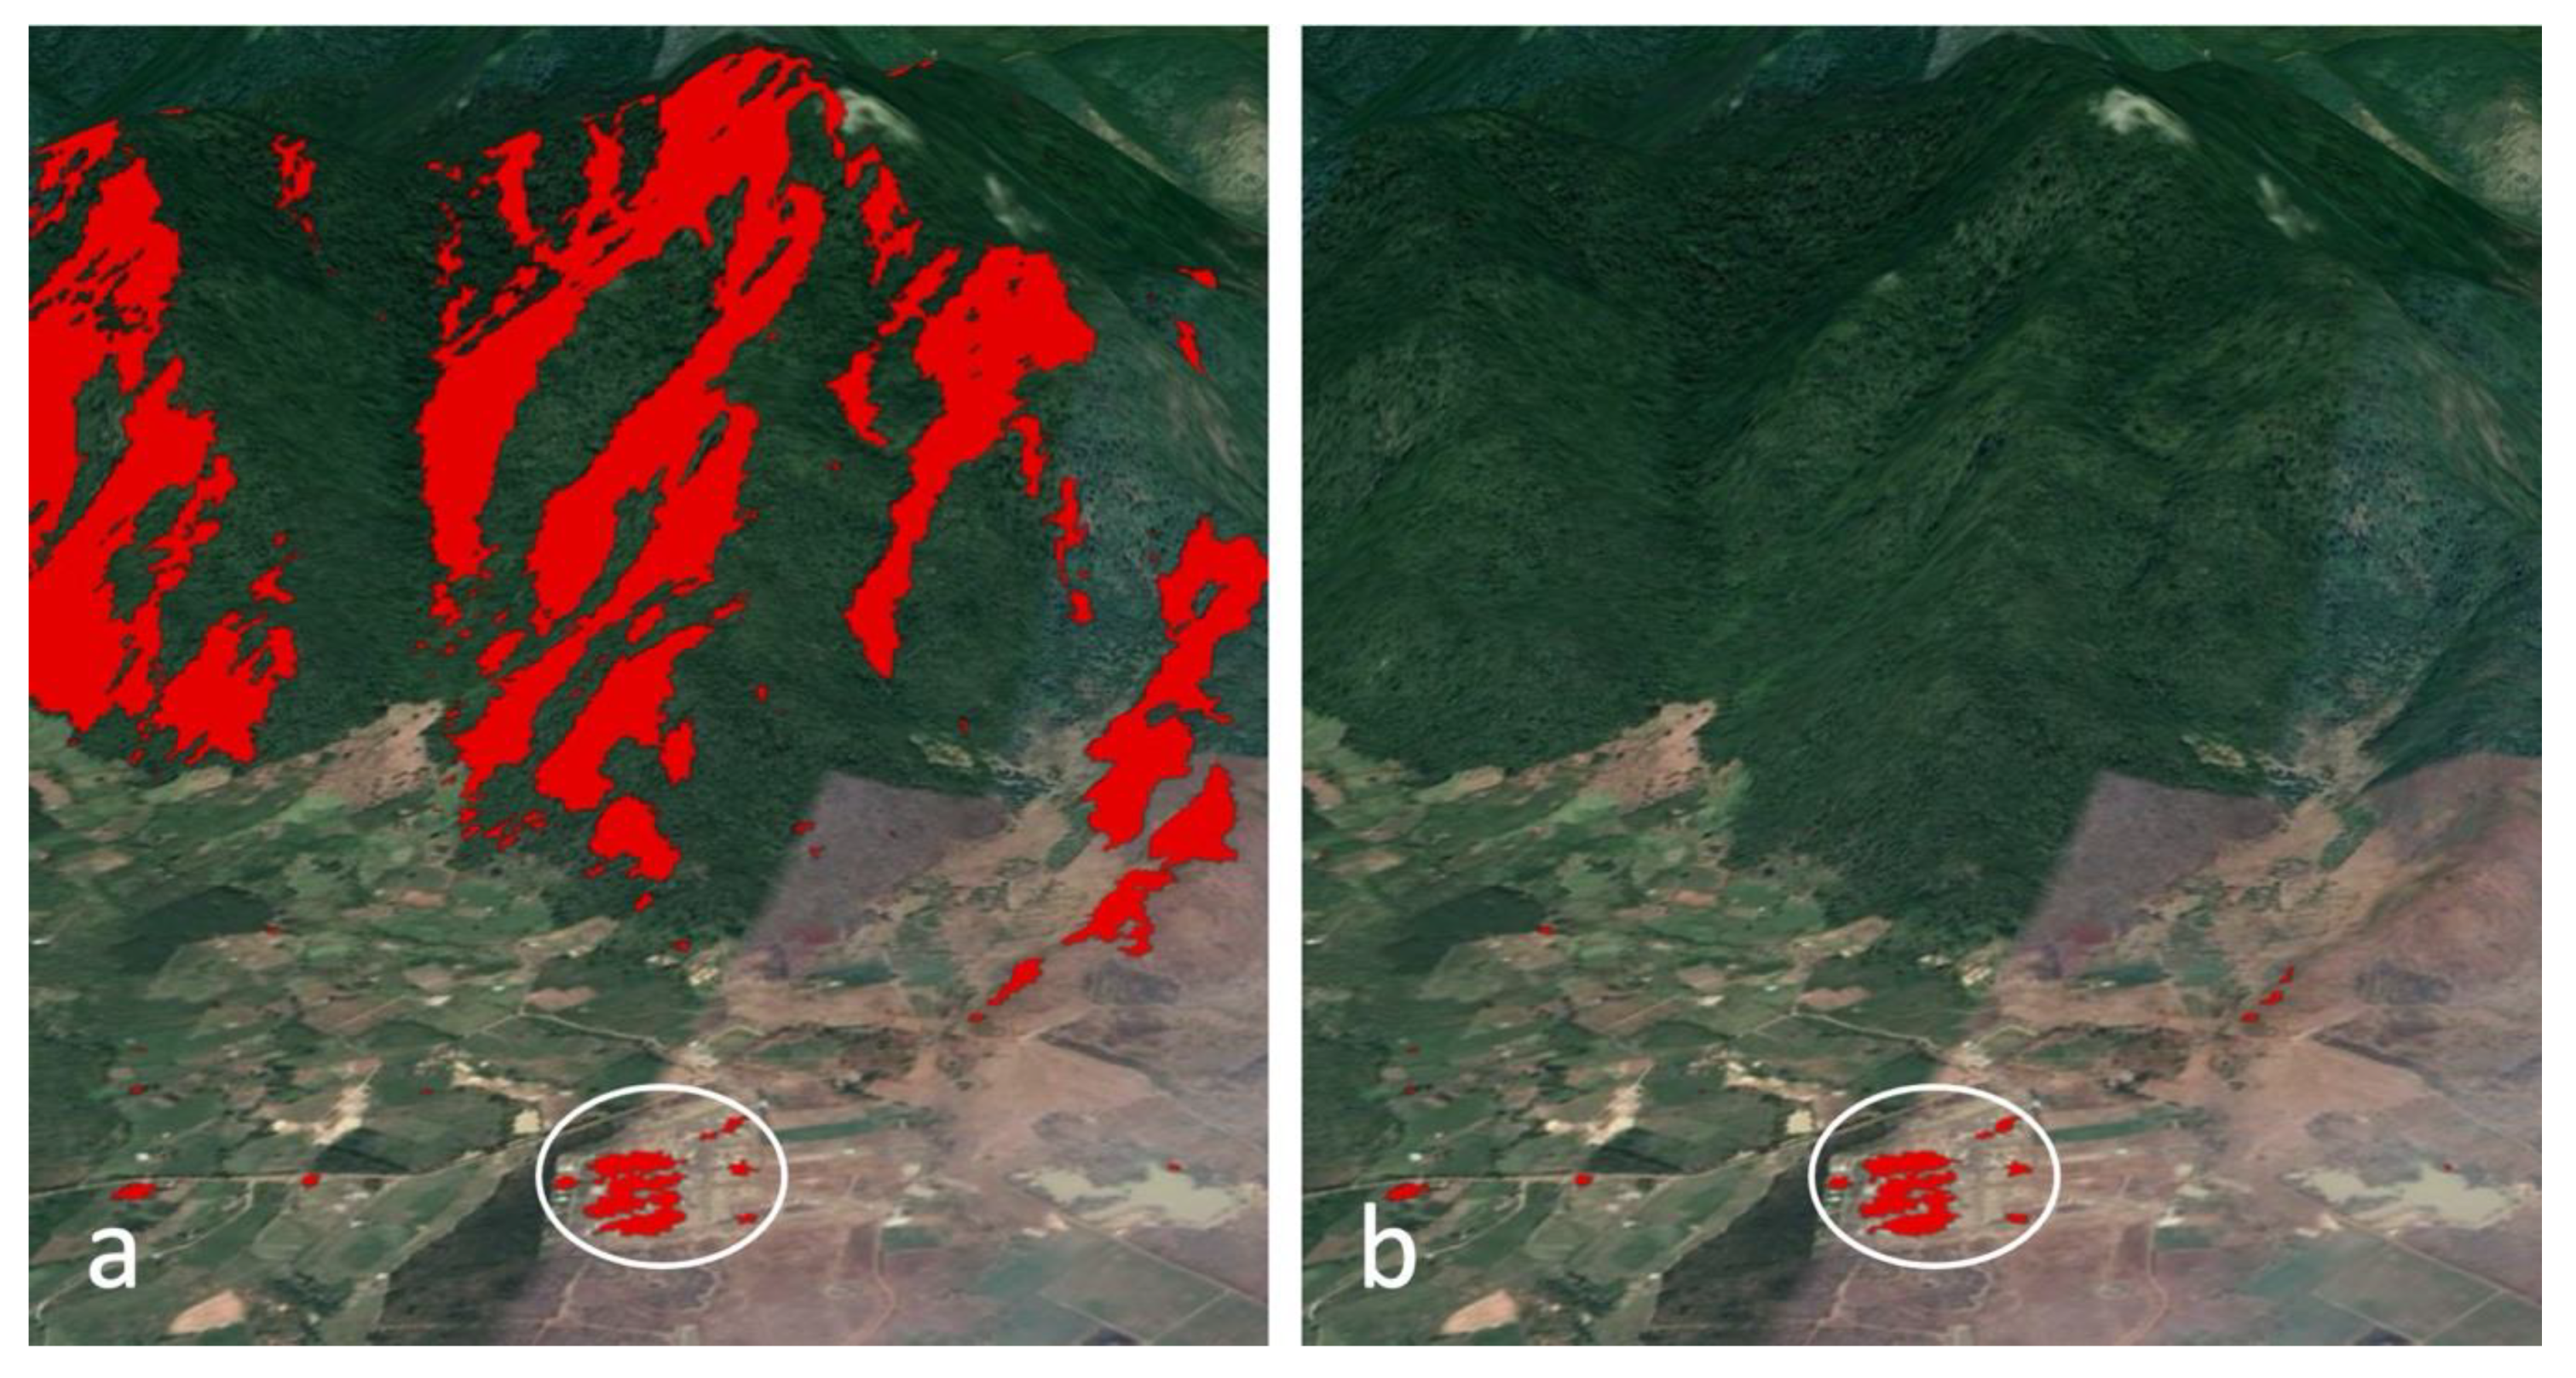
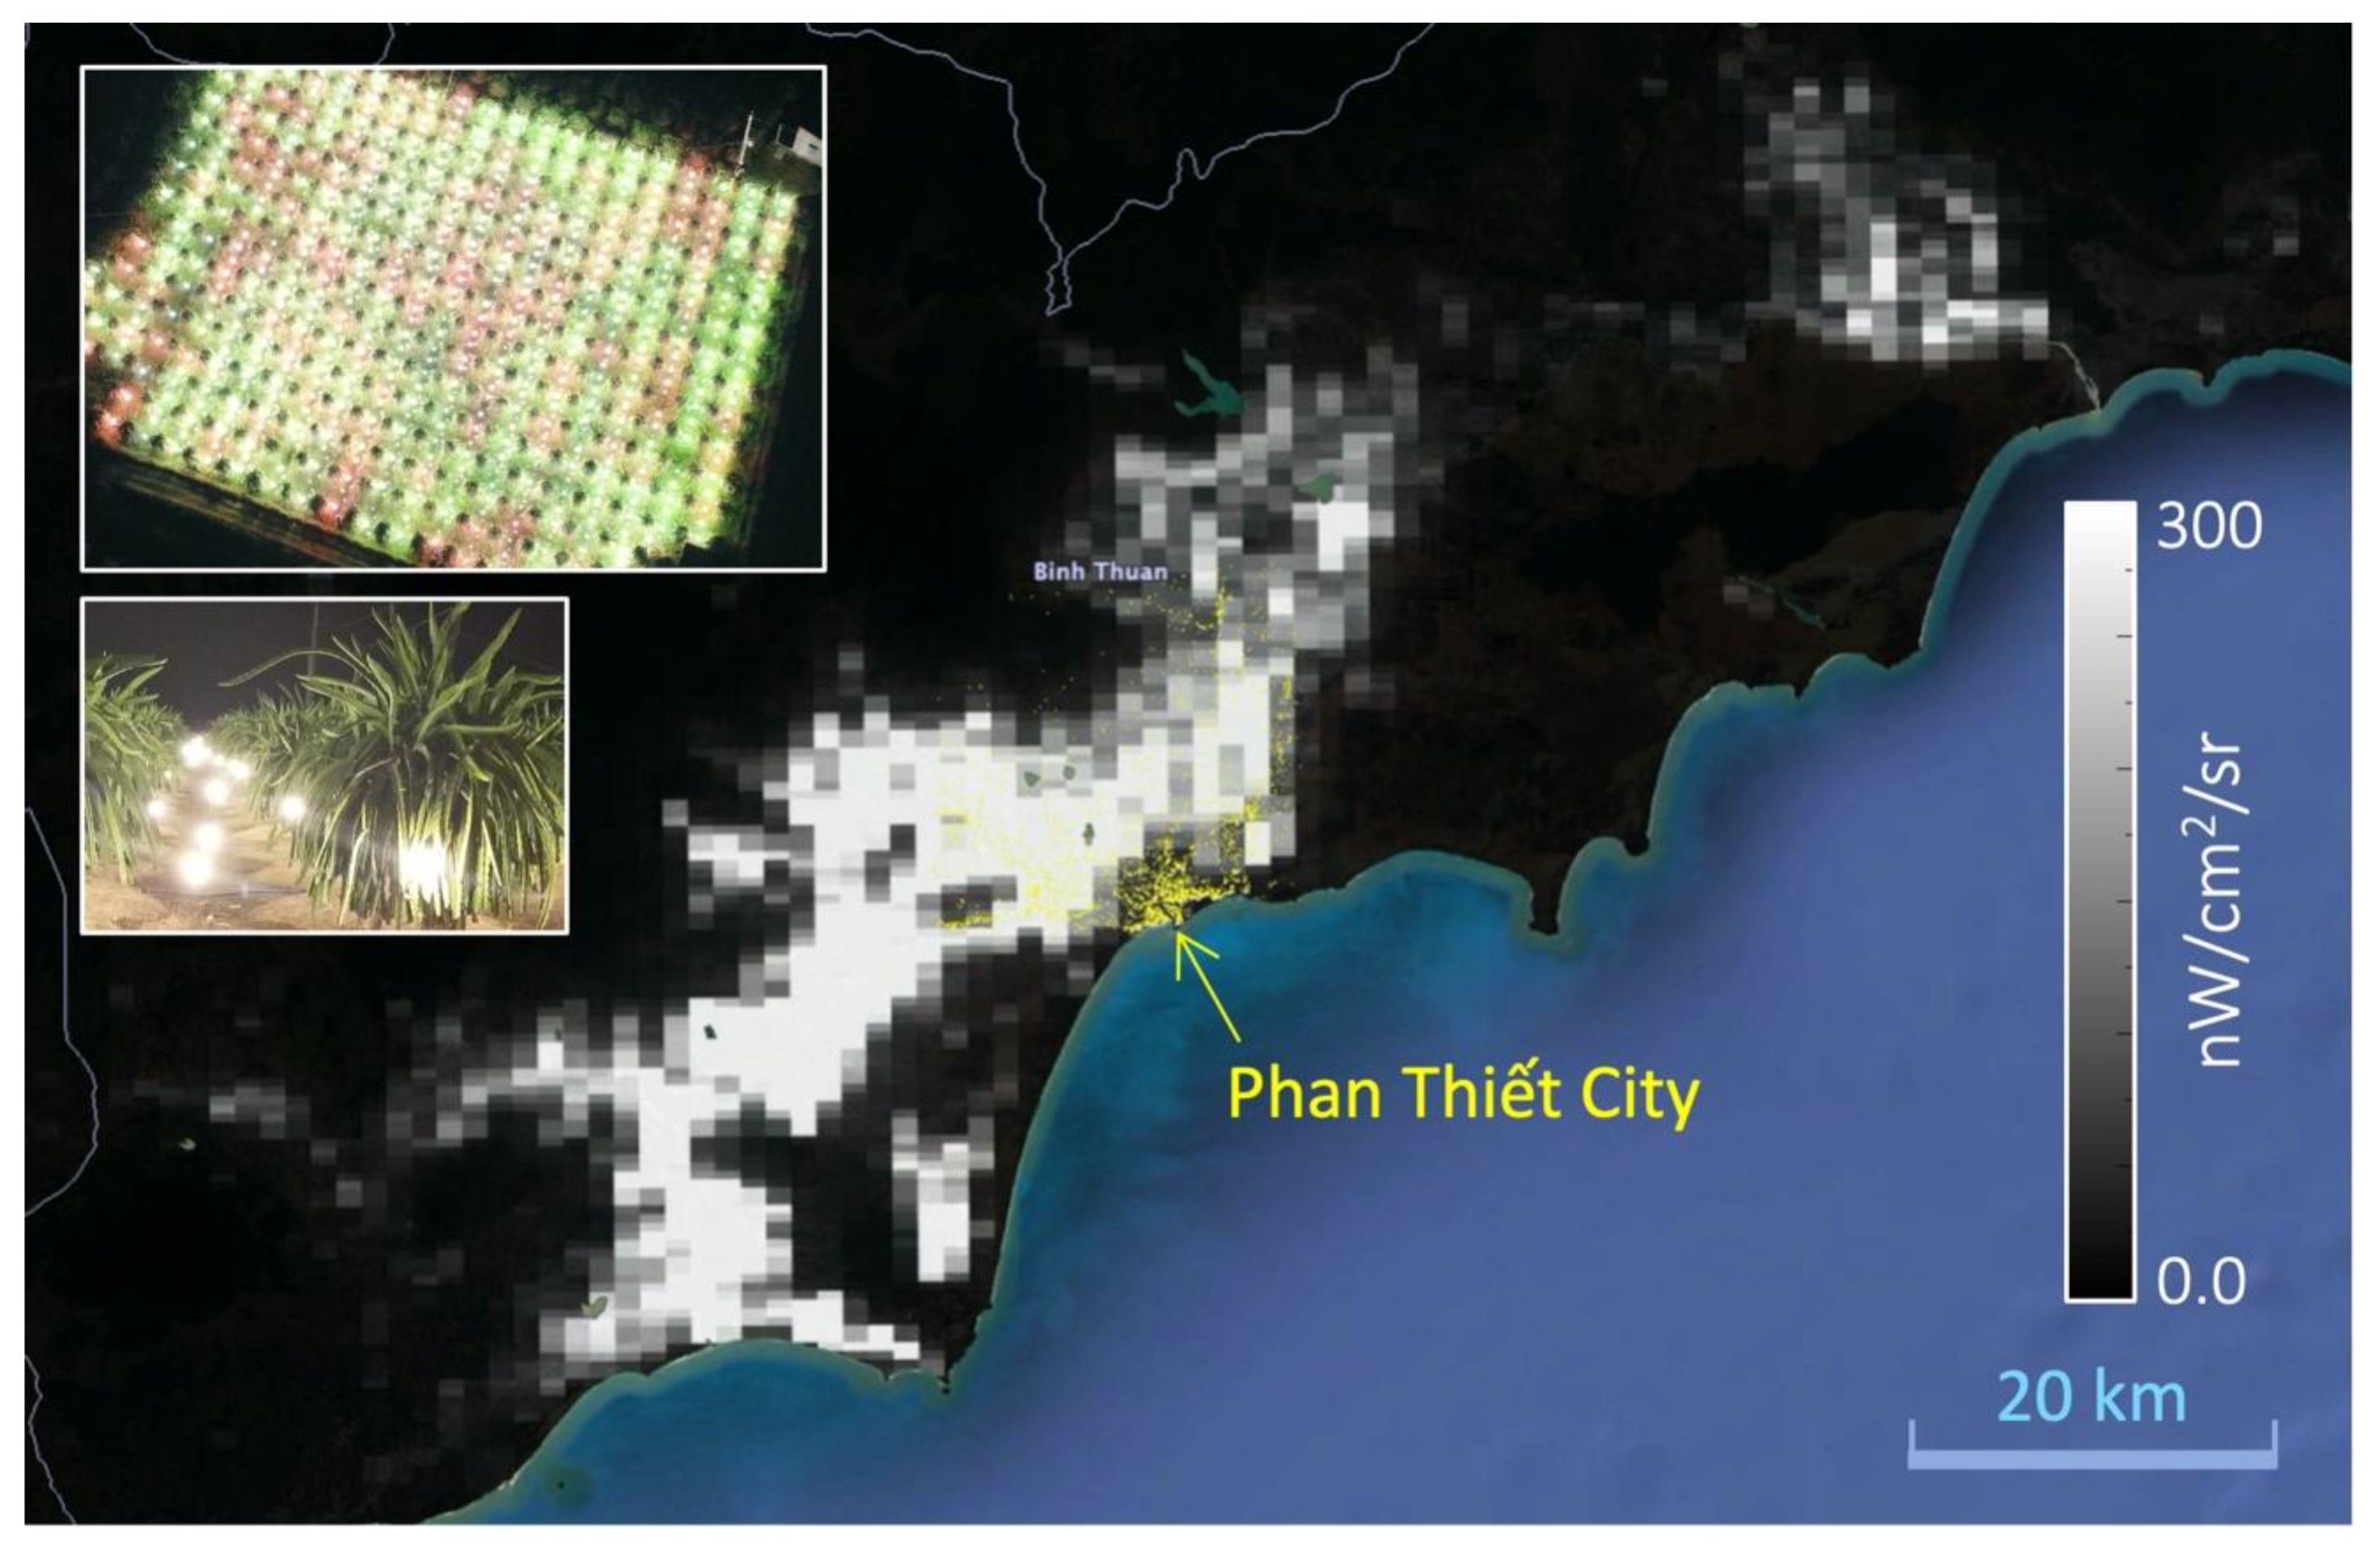
- Founded on time-series satellite SAR data records consistently tracked at each pixel location, the method successfully detects and maps persistent (rather than temporary) building structures, which truly represent sustained human settlements in order to circumvent the shortfalls of the proxy indicator derived from NTL data [4], as illustrated in the case of Phan Thiết city versus the dragon fruit plantations in Bình Thuận (Figure 8). Such spatial data products of physical building structures are crucial for urban mapping applications, in particular for accurate estimations of FFCO2 emission required for the successful implementation of the UNFCCC Paris Agreement. In fact, the U.S. National Academies of Sciences, Engineering, and Medicine recognizes that the improvement in greenhouse gas (GHG, including FFCO2) measurement and monitoring is foundational to the control of global GHG emissions [39].
Author Contributions
Funding
Acknowledgments
Conflicts of Interest
Appendix A
References
- Lwin, K.; Murayama, Y.A. GIS Approach to Estimation of Building Population for Micro-Spatial Analysis. Trans. GIS 2009, 13, 401–414. [Google Scholar] [CrossRef]
- Mathews, A.J.; Frazier, A.E.; Nghiem, S.V.; Neumann, G.; Zhao, Y. Satellite Scatterometer Estimation of Urban Built-up Volume: Validation with Airborne Lidar Data. Int. J. Appl. Earth Obs. Geoinf. 2019, 77, 100–107. [Google Scholar] [CrossRef]
- Xiao, Y.; Zhan, Q. A Review of Remote Sensing Applications in Urban Planning and Management in China. 2009 Jt. Urban Remote Sens. Event 2009, 1–5. [Google Scholar] [CrossRef]
- Gaughan, A.E.; Oda, T.; Sorichetta, A.; Stevens, F.R.; Bondarenko, M.; Bun, R.; Krauser, L.; Yetman, G.; Nghiem, S.V. Evaluating Nighttime Lights and Population Distribution as Proxies for Mapping Anthropogenic CO 2 Emission in Vietnam, Cambodia and Laos. Environ. Res. Commun. 2019, 1, 091006. [Google Scholar] [CrossRef]
- Sorichetta, A.; Nghiem, S.V.; Masetti, M.; Linard, C.; Richter, A. Transformative Urban Changes of Beijing in the Decade of the 2000s. Remote Sens. 2020, 12, 625. [Google Scholar] [CrossRef] [Green Version]
- Nghiem, S.V.; Balk, D.; Rodriguez, E.; Neumann, G.; Sorichetta, A.; Small, C.; Elvidge, C.D. Observations of Urban and Suburban Environments with Global Satellite Scatterometer Data. ISPRS J. Photogramm. Remote Sens. 2009, 64, 367–380. [Google Scholar] [CrossRef]
- Ban, Y.; Webber, L.; Gamba, P.; Paganini, M. EO4Urban: Sentinel-1A SAR and Sentinel-2A MSI Data for Global Urban Services. In Proceedings of the 2017 Joint Urban Remote Sensing Event (JURSE), Dubai, United Arab Emirates, 6–8 March 2017; pp. 1–4. [Google Scholar] [CrossRef]
- Lisini, G.; Salentinig, A.; Du, P.; Gamba, P. SAR-Based Urban Extents Extraction: From ENVISAT to Sentinel-1. IEEE J. Sel. Top. Appl. Earth Obs. Remote Sens. 2018, 11, 2683–2691. [Google Scholar] [CrossRef]
- Gamba, P.; Lisini, G. Fast and Efficient Urban Extent Extraction Using ASAR Wide Swath Mode Data. IEEE J. Sel. Top. Appl. Earth Obs. Remote Sens. 2013, 6, 2184–2195. [Google Scholar] [CrossRef]
- Esch, T.; Marconcini, M.; Felbier, A.; Roth, A.; Heldens, W.; Huber, M.; Schwinger, M.; Taubenböck, H.; Müller, A.; Dech, S. Urban Footprint Processor—Fully Automated Processing Chain Generating Settlement Masks From Global Data of the TanDEM-X Mission. IEEE Geosci. Remote Sens. Lett. 2013, 10, 1617–1621. [Google Scholar] [CrossRef] [Green Version]
- Esch, T.; Bachofer, F.; Heldens, W.; Hirner, A.; Marconcini, M.; Palacios-Lopez, D.; Roth, A.; Üreyen, S.; Zeidler, J.; Dech, S.; et al. Where We Live-A Summary of the Achievements and Planned Evolution of the Global Urban Footprint. Remote Sens. 2018, 10, 895. [Google Scholar] [CrossRef] [Green Version]
- Zhang, K.; Fu, X.; Lv, X.; Yuan, J. Unsupervised Multitemporal Building Change Detection Framework Based on Cosegmentation Using Time-Series SAR. Remote Sens. 2021, 13, 471. [Google Scholar] [CrossRef]
- Manzoni, M.; Monti-Guarnieri, A.; Molinari, M.E. Joint exploitation of spaceborne SAR images and GIS techniques for urban coherent change detection. Remote Sens. Environ. 2021, 253. [Google Scholar] [CrossRef]
- Holobâcă, I.-H.; Ivan, K.; Alexe, M. Extracting built-up areas from Sentinel-1 imagery using land-cover classification and texture analysis. Int. J. Remote Sens. 2019, 40, 8054–8069. [Google Scholar] [CrossRef]
- Corbane, C.; Lemoine, G.; Pesaresi, M.; Kemper, T.; Sabo, F.; Ferri, S.; Syrris, V. Enhanced automatic detection of human settlements using Sentinel-1 interferometric coherence. Int. J. Remote Sens. 2018, 39, 842–853. [Google Scholar] [CrossRef]
- Kong, J.A. Electromagnetic Wave Theory, 2nd ed.; Wiley-Interscience: New York, NY, USA, 1990. [Google Scholar]
- Nghiem, S.V.; Borgeaud, M.; Kong, J.A.; Shin, R.T. Polarimetric Remote Sensing of Geophysical Media with Layer Random Medium Model. In Progress in Electromagnetics Research; Kong, J.A., Ed.; Elsevier: Amsterdam, The Netherlands, 1990; Volume 3, pp. 1–73. [Google Scholar]
- Nghiem, S.V.; Li, F.K.; Lou, S.H.; Neumann, G.; McIntosh, R.E.; Carson, S.C.; Carswell, J.R.; Walsh, E.J.; Walsh, E.J.; Donelan, M.A.; et al. Observations of Radar Backscatter at Ku and C Bands in the Presence of Large Waves during the Surface Wave Dynamics Experiment. IEEE Trans. Geosci. Remote Sens. 1995, 33, 708–721. [Google Scholar] [CrossRef]
- Carswell, J.R.; Mcintosh, R.E.; Carson, S.C.; Li, F.K.; Neumann, G.; Nghiem, S.V.; Mclaughlin, D.J.; Wilkerson, J.C.; Black, P.G. Airborne Scatterometers: Investigating Ocean Backscatter under Low- and High-Wind Conditions. Proc. IEEE 1994, 82, 1835–1860. [Google Scholar] [CrossRef]
- Phung, H.-P.; Nguyen, L.-D.; Thong, N.-H.; Thuy, L.-T.; Apan, A.A. Monitoring Rice Growth Status in the Mekong Delta, Vietnam Using Multitemporal Sentinel-1 Data. J. Appl. Remote Sens. 2020, 14, 1. [Google Scholar] [CrossRef] [Green Version]
- Jasiewicz, J.; Stepinski, T.F. Geomorphons—A Pattern Recognition Approach to Classification and Mapping of Landforms. Geomorphology 2013, 182, 147–156. [Google Scholar] [CrossRef]
- Veselský, M.; Bandura, P.; Burian, L.; Harciníková, T.; Bella, P. Semi-automated recognition of planation surfaces and other flat landforms: A case study from the Aggtelek Karst, Hungary. Open Geosci. 2015, 7, 799–811. [Google Scholar] [CrossRef]
- da Silveira, C.T.; Silveira, R.M.P.; Trentin, R.; Robaina, L.E.D. Automated Classification of Landform Elements in the State Of Parana (Brazil) Applying the Proposal of the Geomorphons. Rev. Brasi. Geomorf. 2018, 19, 33–57. [Google Scholar] [CrossRef]
- Gawrysiak, L.; Kociuba, W. Application of geomorphons for analysing changes in the morphology of a proglacial valley (case study: The Scott River, SW Svalbard). Geomorph 2020, 371, 107449. [Google Scholar] [CrossRef]
- Shuttle Radar Topography Mission, The Mission to Map the World. Available online: https://www2.jpl.nasa.gov/srtm/ (accessed on 11 November 2020).
- Kramm, T.; Hoffmeister, D.; Curdt, C.; Maleki, S.; Khormali, F.; Kehl, M. Accuracy Assessment of Landform Classification Approaches on Different Spatial Scales for the Iranian Loess Plateau. ISPRS Int. J. Geo Inf. 2017, 6, 366. [Google Scholar] [CrossRef] [Green Version]
- Barsi, A.; Kugler, Z.; László, I.; Szabó, G.; Abdulmutalib, H.M. Accuracy Dimensions in Remote Sensing. Int. Arch. Photogramm. Remote Sens. Spat. Inf. Sci. ISPRS Arch. 2018, 42, 61–67. [Google Scholar] [CrossRef] [Green Version]
- Xây Dựng, T.P. Bạc Liêu Trở Thành Đô Thị Loại I Vào Năm 2025. Available online: https://nongnghiep.vn/xay-dung-tp-bac-lieu-tro-thanh-do-thi-loai-i-vao-nam-2025-d272784.html (accessed on 10 September 2020).
- Mau, C. Thành Phố Trẻ Hội Nhập, Phát Triển. Available online: http://moc.gov.vn/vn/tin-tuc/1184/63988/ca-mau--thanh-pho-tre-hoi-nhap--phat-trien.aspx (accessed on 13 November 2020).
- Công Bố Chương Trình Phát Triển Đô Thị TP. Sóc Trăng Đến Năm 2030. Available online: http://baosoctrang.org.vn/thanh-pho-soc-trang-tren-duong-phat-trien/cong-bo-chuong-trinh-phat-trien-do-thi-tp-soc-trang-den-nam-2030-40825.html (accessed on 13 November 2020).
- Long, A. Phát Triển Đô Thị, Tạo Động Lực Thúc Đẩy Kinh Tế. Available online: http://moc.gov.vn/vn/tin-tuc/1184/64077/long-an--phat-trien-do-thi--tao-dong-luc-thuc-day-kinh-te.aspx (accessed on 13 November 2020).
- Xây Dựng Đô Thị Phan Thiết Phát Triển Bền Vững và Thân Thiện Với Môi Trường. Available online: http://phanthiet.gov.vn/bai-viet/xay-dung-do-thi-phan-thiet-phat-trien-ben-vung-va-than-thien-voi-moi-truong-3626.html (accessed on 13 November 2020).
- Congress Committee. Về Phân Loại Đô Thị; Congress Committee: Ha Noi, Vietnam, 2016. [Google Scholar]
- Earth Observation Group. See the World at Night, VIIRS Nighttime Light. Available online: https://eogdata.mines.edu/products/vnl/ (accessed on 29 April 2021).
- Rockwell, N.C.; Lagaris, J.C. The Structure of Phytochrome: A Picture Is Worth a Thousand Spectra. Plant Cell 2006, 18, 4–14. [Google Scholar] [CrossRef] [PubMed] [Green Version]
- Zee, F.; Yen, C.-R.; Nishina, M. Pitaya (Dragon Fruit, Strawberry Pear); FN-9; University of Hawaii: Honolulu, HI, USA, 2004; 3p. [Google Scholar]
- Paull, R.E.; Chen, N.J. Overall Dragon Fruit Production and Global Marketing, FTTC Agricultural Marketing Policy. Taipei, Taiwan. 2019. Available online: http://ap.fftc.agnet.org/ap_db.php?id=1036&print=1 (accessed on 4 May 2020).
- ESA. Sentinel-1. Available online: https://sentinel.esa.int/web/sentinel/missions/sentinel-1 (accessed on 3 May 2021).
- National Academies of Sciences, Engineering, and Medicine. Research on Approaches Critical to Managing Climate Risk. In Global Change Research Needs and Opportunities for 2022–2031; The National Academies Press: Washington, DC, USA, 2021; Volume 4, pp. 37–42. [Google Scholar] [CrossRef]
- Mathews, A.J.; Nghiem, S.V. Examining urban built-up volume: Three-dimensional analyses with lidar and radar data. In Urban Remote Sensing: Monitoring, Synthesis and Modeling in the Urban Environment, 2nd ed.; Yang, X., Ed.; Wiley: Hoboken, NJ, USA, 2021; in press. [Google Scholar]

| No. | Standard | Unit | Urban Class | ||||||
|---|---|---|---|---|---|---|---|---|---|
| Special | I | II | III | IV | V | ||||
| State | Province | ||||||||
| 1 | Population in urban and suburban | 1000 people | ≥6000 | ≥5000 | ≥1000 | ≥500 | ≥200 | ≥100 | 4–50 |
| 5000 | 1000 | 500 | 200 | 100 | 50 | ||||
| 2 | Population in urban | 1000 people | ≥4000 | ≥3000 | ≥500 | ≥200 | ≥100 | ≥50 | |
| 3000 | 500 | 200 | 100 | 50 | 20 | ||||
| No. | Standard | Unit | Urban Class | |||||
|---|---|---|---|---|---|---|---|---|
| Special | I | II | III | IV | V | |||
| I | Infrastructure standard | |||||||
| I.1 | Housing | |||||||
| 1 | Average floor area | m2 floor/person | ≥29 | ≥29 | ≥29 | ≥29 | ≥29 | ≥29 |
| 26.5 | 26.5 | 26.5 | 26.5 | 26.5 | 26.5 | |||
| 2 | House rate | % | 100 | ≥95 | ≥95 | ≥95 | ≥90 | ≥90 |
| 90 | 90 | 90 | 90 | 85 | 85 | |||
| I.2 | Public infrastructure | |||||||
| 1 | Settlement land, open-green land, parks, traffic land | m2/person | 61 | 61 | 61 | 78 | 78 | 78 |
| 54 | 54 | 54 | 61 | 61 | 61 | |||
| 2 | Education | buildings | ≥40 | ≥30 | ≥20 | ≥10 | ≥4 | ≥2 |
| 30 | 20 | 10 | 4 | 2 | 1 | |||
| 3 | Culture | buildings | ≥20 | ≥14 | ≥10 | ≥6 | ≥4 | ≥2 |
| 14 | 10 | 6 | 4 | 2 | 1 | |||
| 4 | Sports | buildings | ≥15 | ≥10 | ≥7 | ≥5 | ≥3 | ≥2 |
| 10 | 7 | 5 | 3 | 2 | 1 | |||
| Cities | N_Building (pixels) | N_others (pixels) | False Negative Rate (FNR) (%) | False Positive Rate (FPR) (%) |
|---|---|---|---|---|
| Bạc Liêu | 320 | 330 | 8.6 | 5.2 |
| Cà Mau | 306 | 344 | 9.5 | 5.5 |
| Sóc Trăng | 310 | 340 | 11.4 | 6.1 |
| Tân An | 318 | 332 | 11.9 | 7.0 |
| Phan Thiết | 338 | 312 | 13.3 | 8.2 |
| All cities | 1592 | 1658 | Average FNR = 10.9% | Average FPR = 6.4% |
| Oil Field | Structure ID | Longitude (o) | Latitude (o) |
|---|---|---|---|
| Sư Tử Đen | 709 | 108.4377899 | 10.46973133 |
| 710 | 108.3818665 | 10.44124126 | |
| 714 | 108.3938675 | 10.42325497 | |
| 716 | 108.3894806 | 10.39616489 | |
| 721 | 108.3605118 | 10.38012123 | |
| Bạch Hổ | 731 | 107.9596634 | 9.984884262 |
| 734 | 107.9711685 | 9.972677231 | |
| 738 | 107.947319 | 9.923978806 | |
| 739 | 108.0084839 | 9.901568413 | |
| 742 | 107.9201202 | 9.878500938 | |
| 743 | 107.9855728 | 9.877530098 | |
| 745 | 107.9864731 | 9.86863327 |
Publisher’s Note: MDPI stays neutral with regard to jurisdictional claims in published maps and institutional affiliations. |
© 2021 by the authors. Licensee MDPI, Basel, Switzerland. This article is an open access article distributed under the terms and conditions of the Creative Commons Attribution (CC BY) license (https://creativecommons.org/licenses/by/4.0/).
Share and Cite
Ngo, K.D.; Nghiem, S.V.; Lechner, A.M.; Vu, T.T. Building Structure Mapping on Level Terrains and Sea Surfaces in Vietnam. Remote Sens. 2021, 13, 2439. https://doi.org/10.3390/rs13132439
Ngo KD, Nghiem SV, Lechner AM, Vu TT. Building Structure Mapping on Level Terrains and Sea Surfaces in Vietnam. Remote Sensing. 2021; 13(13):2439. https://doi.org/10.3390/rs13132439
Chicago/Turabian StyleNgo, Khanh D., Son V. Nghiem, Alex M. Lechner, and Tuong T. Vu. 2021. "Building Structure Mapping on Level Terrains and Sea Surfaces in Vietnam" Remote Sensing 13, no. 13: 2439. https://doi.org/10.3390/rs13132439
APA StyleNgo, K. D., Nghiem, S. V., Lechner, A. M., & Vu, T. T. (2021). Building Structure Mapping on Level Terrains and Sea Surfaces in Vietnam. Remote Sensing, 13(13), 2439. https://doi.org/10.3390/rs13132439