Article

Monitoring Spatiotemporal Changes of Impervious Surfaces in Beijing City Using Random Forest Algorithm and Textural Features

1
College of Geoexploration Science and Technology, Jilin University, Changchun 130026, China
2
Institute of National Development and Security Studies, Jilin University, Changchun 130026, China
3
Key Laboratory of Lunar and Deep-Space Exploration, National Astronomical Observatories, Chinese Academy of Sciences, Beijing 100101, China
4
Institute of Integrated Information for Mineral Resources Prediction, Jilin University, Changchun 130061, China
5
College of Physics, Jilin University, Changchun 130026, China
*
Author to whom correspondence should be addressed.
Remote Sens. 2021, 13(1), 153; https://doi.org/10.3390/rs13010153
Submission received: 2 December 2020 / Revised: 31 December 2020 / Accepted: 3 January 2021 / Published: 5 January 2021
(This article belongs to the Special Issue Optical Remote Sensing Applications in Urban Areas)

Abstract

:
As the capital city of China, Beijing has experienced unprecedented economic and population growth and dramatic impervious surface changes during the last few decades. An application of the classification method combining the spectral and textural features based on Random Forest was conducted to monitor the spatial and temporal changes of Beijing’s impervious surfaces. This classification strategy achieved excellent performance in the impervious surface extraction in complex urban areas, as the Kappa coefficient reached 0.850. Based on this strategy, the impervious surfaces inside Beijing’s sixth ring road in 1997, 2002, 2007, 2013, and 2017 were extracted. As the development of Beijing has a special regional feature, the changes of impervious surfaces within the sixth ring road were assessed. The findings are as follows: (1) the textural features can significantly improve the classification accuracy of land cover in urban areas, especially for the impervious surface with high albedo. (2) Impervious surfaces within the sixth ring road expanded dramatically from 1997 to 2017, had three expanding periods: 1997–2002, 2002–2007, and 2013–2017, and only shrank in 2007–2013. There are different possible major driving factors for each period. (3) The region between the fifth and sixth ring roads in Beijing underwent the most significant changes in the two decades. (4) The inner three regions are relatively highly urbanized areas compared to the outer two regions. Urbanization processes in the interior regions tend to be completed compared to the exterior regions.

Graphical Abstract

1. Introduction

It is estimated that the world’s population will reach 9.6 billion in 2050, and 66 percent of people are projected to be living in urban areas [1]. The surging population is driving the acceleration of urbanization. The accelerating urbanization will result in the emergence of more megacities, which will also bring about a series of challenges, including the increase of impervious surfaces. Impervious surfaces can be generally defined as any material that prevents the infiltration of water into soil, such as roads, parking lots, sidewalks, and rooftops [2]. Impervious surfaces have been considered an efficient indicator to monitor the urban changes and analyze the environmental impact analysis [2,3,4,5,6]. Therefore, as it is an important megacity, studying the impervious surfaces in Beijing will provide some essential clues for future urbanization.
Remote sensing has proven its value in mapping the impervious surfaces in urban areas. Until now, many approaches have been suggested to estimate impervious surfaces from remote sensing data, particularly Landsat imagery, due to its easy availability. Ridd [7] explored a V-I-S (vegetation–impervious surface–soil) model for urban change detection, which provided a new method to estimate impervious surfaces through remote sensing data. However, the limitation of the V-I-S model is reflected in impervious surface estimation due to the complexity of urban ecosystems [8]. Based on the V-I-S conceptual model, several modified models were proposed. Wu and Murray applied the V-H-L-S model through a fully constrained linear mixture model, and four endmembers were selected, including low albedo, high albedo, vegetation, and soil [9]. Xu studied the electromagnetic spectrum characteristics of impervious surfaces and firstly proposed normalized difference impervious surface index (NDISI), which can be used in a fast extraction of impervious surfaces in a large region [10]. However, the selection for the endmember is a critical factor in the classification accuracy in these models that only consider the spectral information in the remote sensing images.
Texture is an important characteristic of the objects in the remote sensing images. Classification performed on Sentinel-1A imagery indicated that the textural features reduced the confusion between impervious surfaces and water [11]. Zhang et al. [12] added the texture extracted from SAR images to improve the impervious surface estimation. However, the texture of Landsat images with the coarse resolution was rarely considered in the impervious surface extraction. Thus, it is essential to validate the serviceability of texture derived from Landsat images in extracting impervious surfaces. As the textural features are introduced into the image classification, the datasets for classification tend to have more dimensions. Thus, an optimal algorithm that can handle the high dimensional data should be taken into consideration.
In recent decades, the Random Forest (RF) algorithm has caused widespread concern on image classification, as the method can deal with a large number of input variables and overcomes the overfitting problem [13]. Notably, several previous studies [14,15,16,17] have proven that RF classifiers have excellent performance comparable to that of other classifiers, including Support Vector Machine and Maximum Likelihood Classification methods. Given this, the RF algorithm was used to estimate the impervious surfaces in this study.
As the political, educational, cultural, and scientific center of the country, the development of Beijing city has been more than 600 years in the making, which is a unique microcosm of the rise of the cities in the world. In view of the inevitability of urbanization in Beijing over the last two decades, extracting and assessing impervious surfaces due to urbanization are of particular importance.
In this paper, the spatiotemporal changes of impervious surfaces within the sixth ring road in Beijing from 1997–2017 were analyzed, combining the spectral and textural information with a classification method based on the RF algorithm. The dataset and the study area are briefly described in Section 2. Section 3 presents feature extraction, the RF algorithm, and the classification strategy. The spatial and temporal changes of both the total and regional changes in the study area are analyzed in Section 4. Section 5 discusses the possible major driving factors of changes in each period and assesses the urbanization level and process in each region. Section 6 is conclusions.

2. Study Area and Datasets

2.1. Study Area

Beijing, one of the most famous cosmopolitan megacities, is the capital of the People’s Republic of China (PRC), covering 16 administrative districts. The city is located at the northwest edge of North China Plain and extends from 39°26′N to 41°03′N and 115°25′E to 117°30′E, with 16,808 km2 of total area. The elevation is high in the northwest and low in the southeast, with an average elevation of 44 m. Beijing has a climate with four distinct seasons, and the Köppen–Geiger climate classification is Dwa (monsoon-influenced hot-summer humid continental climate) [18]. The average temperature is around 13.1 °C, and precipitation is about 430.9 mm annually.
Beijing has been expanding significantly in the past two decades. The great increase of the population and economy and the holding of the Olympic Games in 2008 all possibly prompted the increase in impervious surfaces in the city. The following occurrence of an urban heat island and some other environmental problems have aroused a wide range of concerns. For instance, an analysis of long-term rainfall data conducted in Beijing revealed that urban expansion has a negative impact on the summer and annual precipitation [19]. Moreover, Lin et al. [20] concluded that the increasing intensity of the urban heat island effect in Beijing is closely related to urbanization. Based on the grey correlation analysis, Zhang et al. [21] suggested that the growth rates of housing construction areas have significant impacts on the quality of drinking water in the rural areas of Beijing.
As an indicator of urban development and a tool for environmental impact analysis, Beijing’s impervious surfaces are of great significance in revealing the urbanization process of Beijing. Worthy of note is that the city spreads out in concentric ring roads. The ring roads from inside out are the second, third, fourth, fifth, and sixth ring roads. These five ring roads connect Beijing in all directions, dividing the city into five regions at different stages of development. Given this, the area with a total area of 2267 km2 inside the sixth ring road was selected in this study (Figure 1), including land cover types such as vegetation, water, farmlands, commercial centers, and industrial areas.

2.2. Datasets

In this study, we focus on the spatial and temporal changes of impervious surfaces in Beijing. Therefore, the comparative analysis of the data sets with a long span of time may directly reflect such variations. Meanwhile, the seasonal variations of land covers need to be considered to estimate the impervious surface accurately, as the high albedo impervious surface tends to be confused with bare soil in winter. Beyond that, lush vegetation will block the impervious surface in summer, to some extent, and affect the estimation of impervious surfaces at the very least. As the previous literature pointed out [22], remote sensing images in spring, which have obvious impervious surface information, can increase the separability between the impervious surface and other land cover types.
To this end, two Landsat TM5 images acquired on 16 May 1997 and 28 May 2007, a Landsat 7 ETM+ scene acquired on 22 May 2002, and two scenes of Landsat 8 OLI images acquired on 12 May 2013 and 23 May 2017, were collected (Table 1). All images were downloaded from the United States Geological Survey (USGS) global visualization viewer (http://glovis.usgs.gov/), with Path 123, Row 32 with reference to WRS-2 (Worldwide Reference System). The six multispectral bands (Blue, Green, Red, NIR, SWIR1, and SWIR2) of Landsat images with a spatial resolution of 30 m were used in this study. The coastal aerosol band of the Landsat 8 imagery was removed to increase the contrast between different data sets. Then, the preprocessing procedure was conducted. The digital numbers (DNs) of the image were converted to normalized exoatmospheric reflectance measures following the methods proposed by Markham and Barker [23]. As the images of the study area were all of good quality and were free of clouds, we assumed the images were under homogeneous atmospheric conditions, so no atmospheric correction was performed.

3. Methods

3.1. Auxiliary Features Extraction

Although the multispectral bands can be used as the foundation of the remote sensing image classification, the method of solely using these original spectral bands cannot perform a good distinction between different land categories [24]. In particular, the noise in remote sensing images makes it difficult for information extraction. Accordingly, two image enhancement methods were conducted in this paper to improve the signal-to-noise ratio (SNR) of images and increase the discrimination between different land cover types: principal component analysis (PCA) and minimum noise fraction rotation (MNF).
Principal component analysis (PCA) is a simple, nonparametric method of extracting relevant information from confusing data sets. It has been proven to be an effective method to reduce the dimensionality of original data under the prerequisite that the main information of the original data is not lost [25,26]. The front few components extracted from PCA contain the main information from the images, which can better reflect the discrimination between different land cover types than multispectral bands. Therefore, the first two components, PC1 and PC2, which account for approximately 97% of the original information, were calculated.
Minimum noise fraction rotation (MNF) is a linear transform that is widely applied for noise removal and image enhancement [27]. It can be considered the cascaded principal components transformation [9]. The new components are ordered in terms of image quality. In this study, the first three MNF components, MNF1, MNF2, and MNF3, were used. The five components calculated through PCA and MNF were served as the auxiliary spectral features and were employed in the extraction of the impervious surfaces combined with the original multispectral bands.

3.2. Textural Features Extraction

Texture is an essential characteristic for the analysis of satellite images [28,29]. Several studies [12,21,30,31] have proven that the image texture can provide an important complement for remotely sensed data classification.
Up until now, a variety of methods have been proposed to measure textural properties. These can be categorized into structural, statistical, model-based, and transform methods [32]. A statistical method based on the gray-level co-occurrence matrix (GLCM) is widely used in many texture analysis applications among the previous approaches. The GLCM can be defined as a square matrix, the elements of which represent the occurrence frequency between pairs of gray level values of pixels separated by a particular distance and direction.
In this study, the textural features based on the GLCM are introduced in the impervious surface estimation. Haralick et al. [28] defined a set of 14 second-order statistics easily computable to measure the textural features. However, many of the texture measures are highly correlated with each other. Consequently, eight second-order statistics, mean, variance, homogeneity, contrast, dissimilarity, entropy, angular second moment, and correlation, were used in this paper. These texture measures were extracted pixel by pixel based on the first two PCA components, generating 16 textural features as the input to be used in the classification process. The 16 textural features are named PC1_Mea, PC1_Var, PC1_Hom, PC1_Con, PC1_Dis, PC1_Ent, PC1_Sec, PC1_Cor, PC2_Mea, PC2_Var, PC2_Hom, PC2_Con, PC2_Dis, PC2_Ent, PC2_Sec, and PC2_Cor, respectively. The two principal components contain more than 97 percent of the spectral information in the images. Therefore, they can exhibit a better contrast between different land cover types.
As for the application of GLCM, there are four main parameters to be noted: the grayscale level of the image, the size and the orientation of the moving window, and the distance between the pair of pixels in the GLCM. The moving window size is a key parameter affecting texture extraction [24]. When the window is small, it can better reflect the slight changes in the image. When the window is large, the contours of most land covers are well described. Thus, an ideal moving window size is necessary to set for improving the classification accuracy. The previous research [12] suggested that 7 × 7 pixels are suitable for the texture extraction in medium spatial resolution remote sensing images, such as Landsat images. Given this, the window size of 7 × 7 pixels was also used in this study. The number of grayscale quantization levels has a small effect on classification accuracy [24]. A large grayscale range included in computing the GLCM usually leads to the high computational cost of the texture statistics. In this study, the greyscale quantization level was set as 64. The selection of the moving window orientation is another issue taken into account. Generally, four main orientations (0°, 45°, 90°, and 135°) were commonly used in previous literature, though the time consumption is high in this way, and the results tend to contain a high correlation. An assumption was proposed in this paper that the textural features of land cover use are not directional. The orientation was set as 45°, and the distance between pixels in the GLCM was set to one in this paper.

3.3. The Random Forest Algorithm

The Random Forest (RF) is an ensemble learning algorithm developed by aggregating decision trees. Each decision tree is based on a randomly selected subset from the training samples, and random features selection is conducted to split each node for tree growing [13]. Supposing there are N samples in the training set with M features in each sample, and the size of the subset is n (n ≤ N). The steps to growing each decision tree can be concisely described as below [33]:
Firstly, based on the bootstrap method (randomly pick one sample at a time, with replacement), a subset (also called bootstrap samples) is selected from the original N training samples for growing each decision tree.
Secondly, m variables are selected at random from a total of M input features (m << M) to split each node of the decision tree.
Lastly, each tree is grown to the largest extent possible. The trees are not pruned.
The steps above are iterated T times, and T represents the number of trees needed for this RF. After the decision trees are built, the RF is formed. Each decision tree is used to predict the class of the input data and vote for that class. The class with the majority of tree votes is taken as the classification result. RF also gives internal estimates that help understand classification accuracy and how to improve it [13]. Every time an individual tree is grown, a different bootstrap sample set was selected from the original training samples. About one-third of the samples, usually called out-of-bag (OOB) data, are left out of the bootstrap samples and are not used to construct the decision tree. The OOB data is formed for each tree, which can be used to derive the validated classification accuracy from the tree.
The randomness injected reduces the dependence between each decision tree and thus makes RF an accurate and efficient classifier. Several advantages of RF have been noted in previous research. RF can deal with many features and avoid overfitting when there is an increasing number of trees. It is relatively robust to outliers and noise and is user-friendly as there are only two free parameters to input. Moreover, it provides useful internal estimates of error, strength, correlation, and variable importance. To this end, RF is applied in this study.
RF needs only two free parameters to input: the number of trees to be grown and the number of variables to split each node of the decision trees. The previous study pointed out that the number of features was considered a user-defined parameter. Several studies suggested the number to be the square root of the total number of features [15,34,35]. As for the number of trees, it was reported that the larger number of decision trees tend to make the RF perform better [32]. However, the larger number of trees grown can be quite time-consuming in the training process. In earlier studies, the number was usually set to be the default value of 500 [36,37]. Therefore, in this study, a total of 500 trees were grown, and the number of split variables was set to be the square root of the number of input features. The training samples were selected from the Landsat image by the units of the pixel, and 27 features, which comprise six spectral bands, five components, and 16 texture measures, are ready to be the input features in the RF. The name and type of the 27 features are listed in Table 2.

3.4. Classification Strategy

It is a challenge to map impervious surfaces due to the ecosystem complexity in urban areas. Impervious surfaces consist of diverse land cover categories such as rooftops, roads, and airports. However, the coarse resolution of Landsat images with 30 m makes it impossible to distinguish each category precisely. In order to accurately estimate the impervious surfaces in the study area, an investigation was conducted to study the characteristics of various land cover types. The results showed that the impervious surface tends to have high albedo, mainly in the low-density residential areas and airports, and low albedo in the high-density commercial areas. The estimation of impervious surfaces can be considered the combination of high albedo and low albedo [9,12]. Given this, the land covers are divided into five types—vegetation, water, bare soil, high albedo impervious surface (HIS), and low albedo impervious surface (LIS). Then, the estimation of impervious surfaces in this study can be obtained from the combination of the HIS and LIS, while the vegetation, water, and bare soil are combined as nonimpervious surfaces.
Concerning the pixel-based classification, the training sample selection is a critical step for the subsequent classification. Hence, high-resolution images obtained from Google Earth, combined with visual interpretation, were used for training sample selection. If the number of training samples for a particular type is larger than others, the classification results tend to deviate. Therefore, the number of training samples for each type should be kept approximately equal. In this way, about 700 sample pixels were selected for the five land cover types. The RF model was trained by these 700 samples. Then, the trained RF model was used to classify pixels in the study area. The land cover type of each pixel was decided by the voting from the trees in the RF. The land cover type that obtained the majority of the votes was appointed to the pixel. After classification, each pixel was given a new greyscale value to represent the land cover type it belongs to.
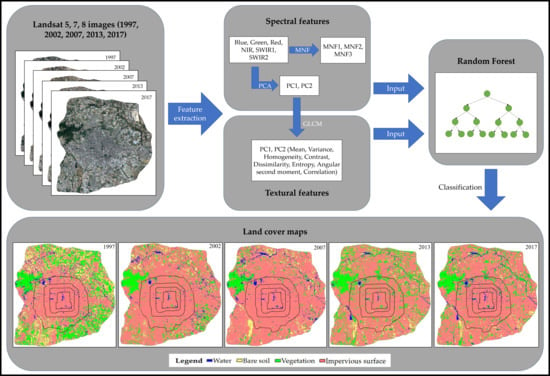
Our motivation is to find an effective method to improve the impervious surface estimation. An experiment was implemented by introducing the textural features into the image classification. At first, the classification for the Landsat 8 data acquired on 23 May 2017 (Figure 2) was conducted based on the spectral features alone and the combination of spectral and textural features. Then, the classification performances with these two strategies were briefly discussed, and the superior one was given through the comparison. Finally, the extraction of the impervious surfaces was performed based on the superior strategy for other Landsat datasets.

4. Results and Analyses

4.1. Effect of Textural Features on Classification Accuracy

Accuracy assessment was conducted to investigate the effect of textural features on classification. Zhang et al. noted that the OOB error built in the RF algorithm is insufficient for classification accuracy assessment [12]. Therefore, a random sampling method was employed in this study. High-resolution satellite images from Google Earth at the same phase by reference to the classification images were used. Then a total of about 700 samples were randomly selected based on the high-resolution image. The number of samples of each land cover category was approximately equal. Finally, using the confusion matrix and the Kappa coefficient, the accuracy of the classification result was evaluated.
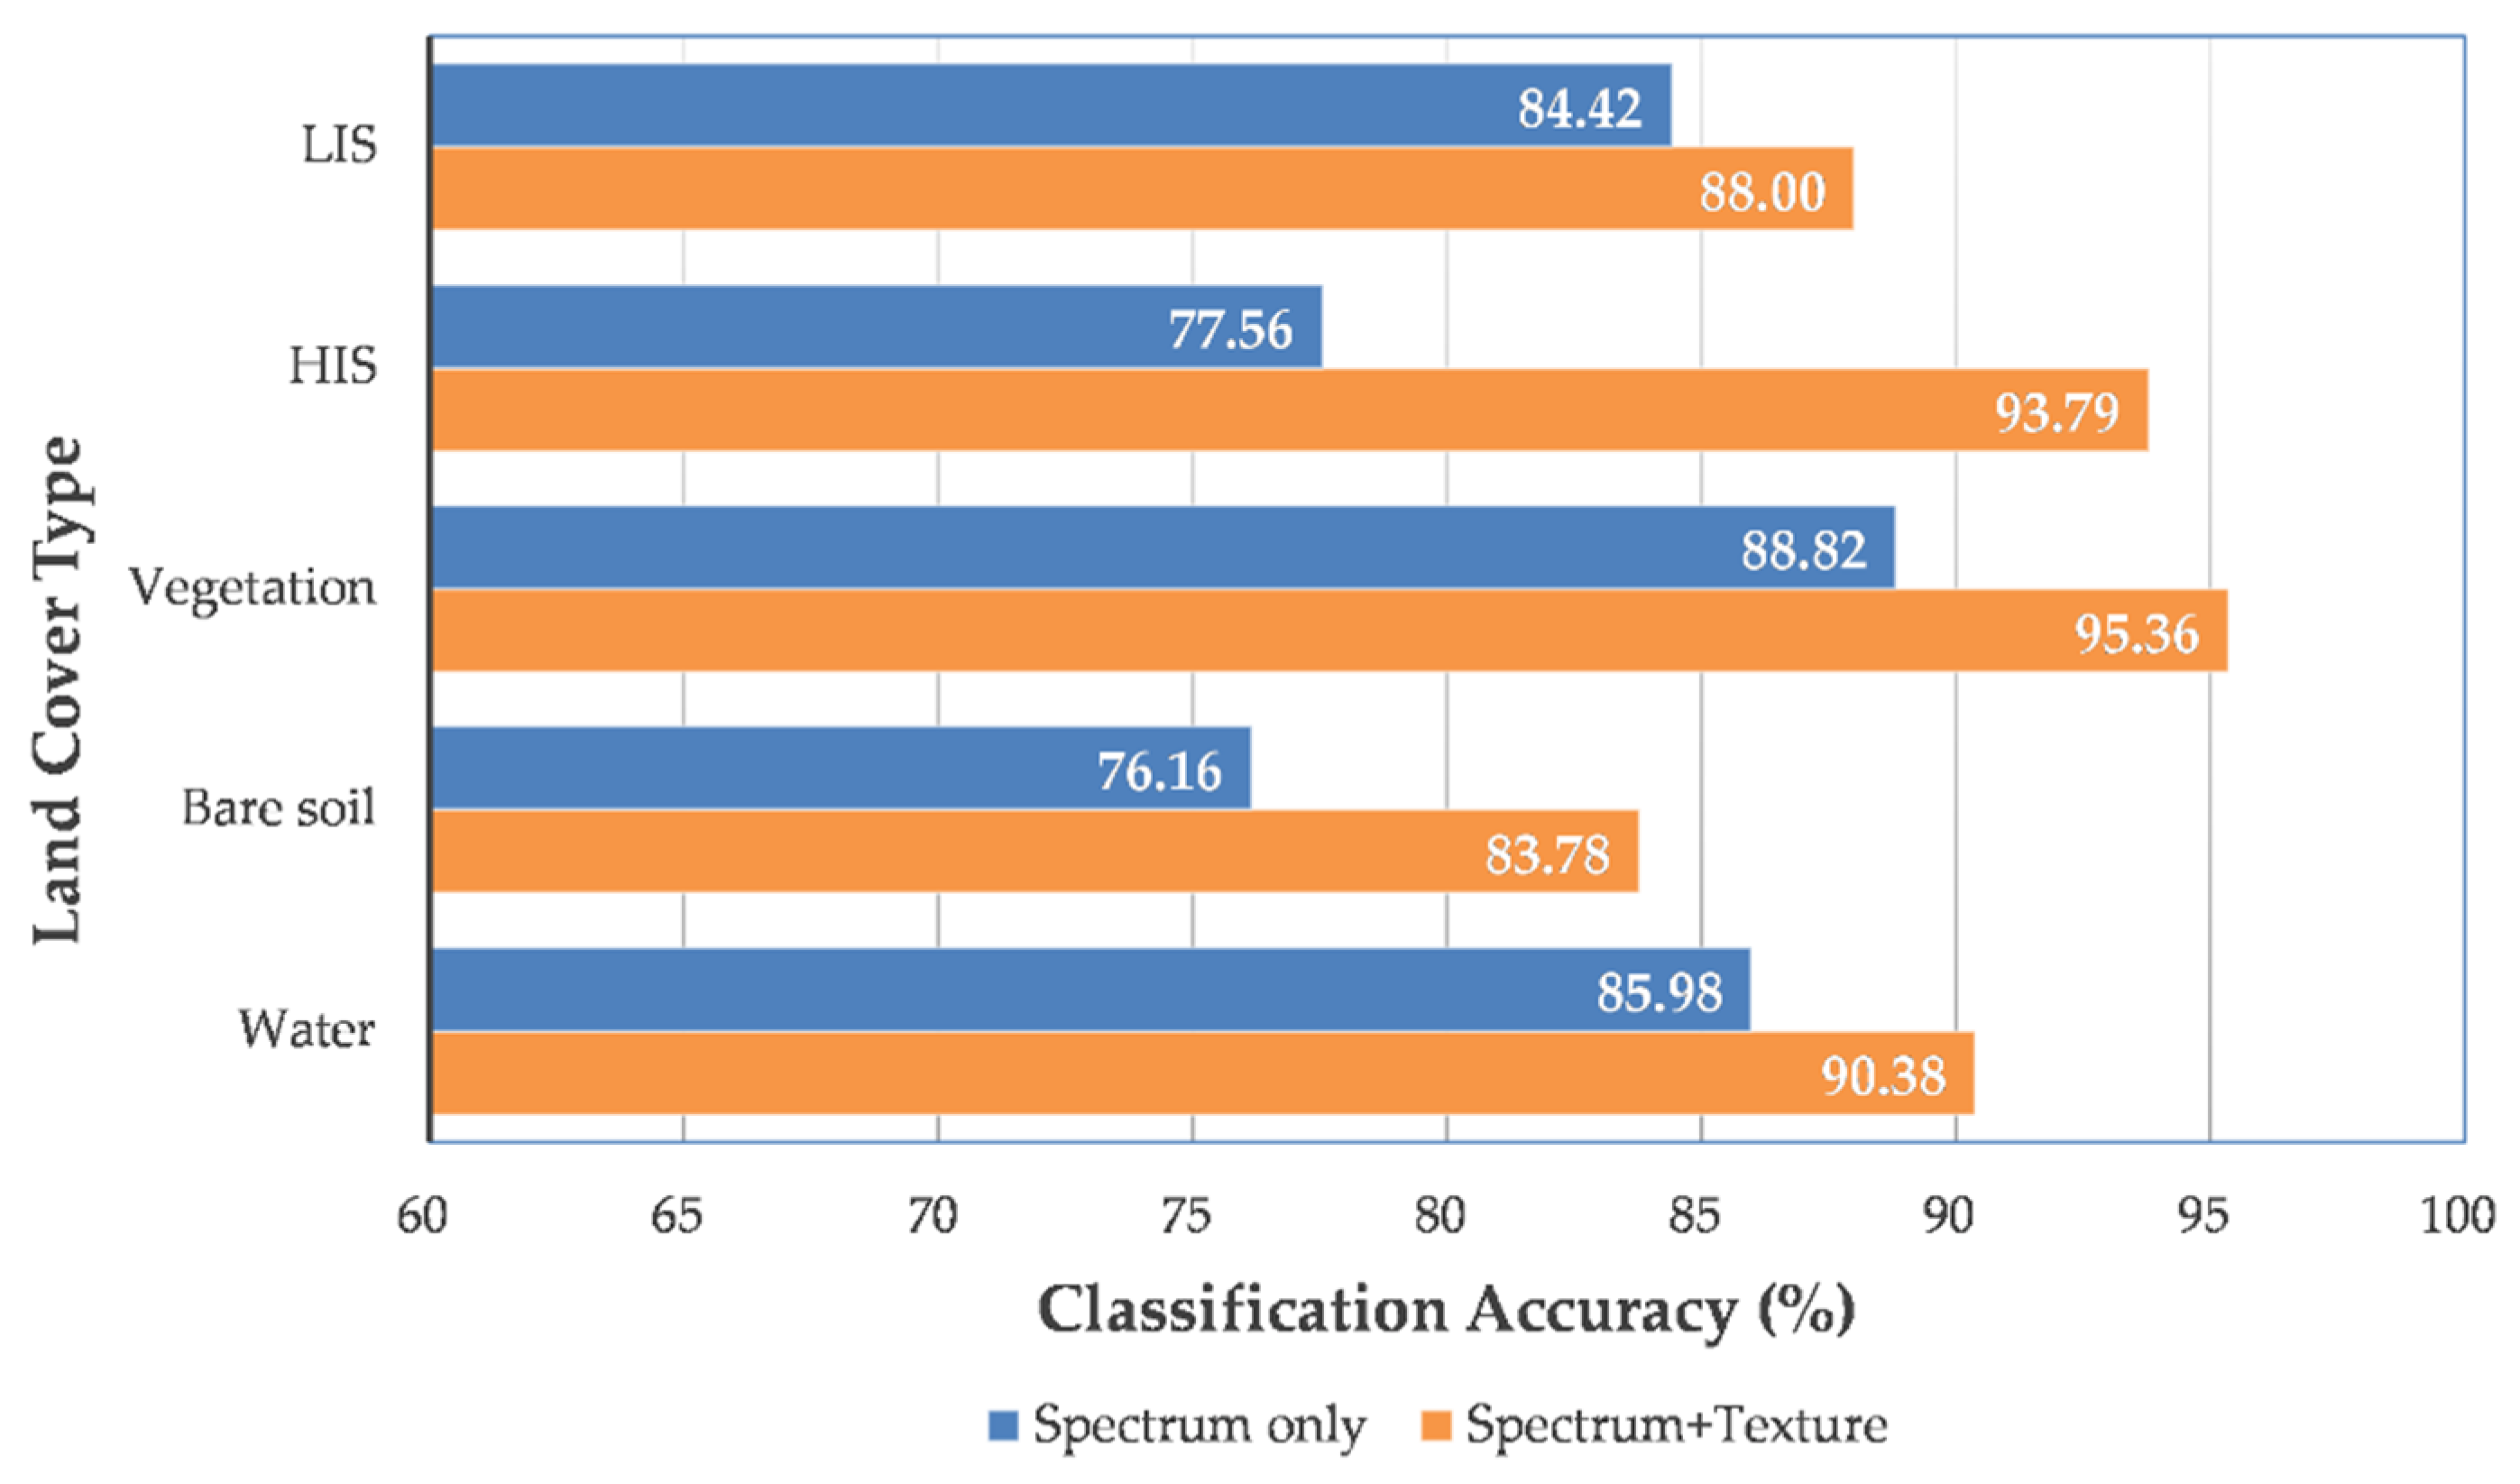
Figure 3 shows the classification accuracy of land cover based on the spectral features only and using the spectral and textural features simultaneously. Based on the spectral features, the highest accuracy is for vegetation at 88.82%, while the lowest accuracy is for bare soil with only about 76.16%. When introducing the textural features, the classification accuracy was improved for all the land cover types. The accuracies of the vegetation and bare soil are up to 95.36% and 83.78%, which is an increase of 6.54% and 7.62%, respectively. The most significant improvement was obtained in the accuracy of HIS, which is an increase of 16.23% from 77.56% to 93.79%, and the improvement of bare soil ranked second highest. On the other hand, the accuracy of LIS classification only increases by 3.58%, from 84.42% to 88%, which is lower than the 4.4% of water. Compared to the classification strategy using the spectral features only, the Kappa coefficient evaluated based on the strategy combining the spectral and textural features increased from 0.694 to 0.850. This result proved that the spatial information reflected by the textural features plays an important role in extracting the surface information. Moreover, the improvement in the accuracy after introducing textural features is the most significant for the HIS.
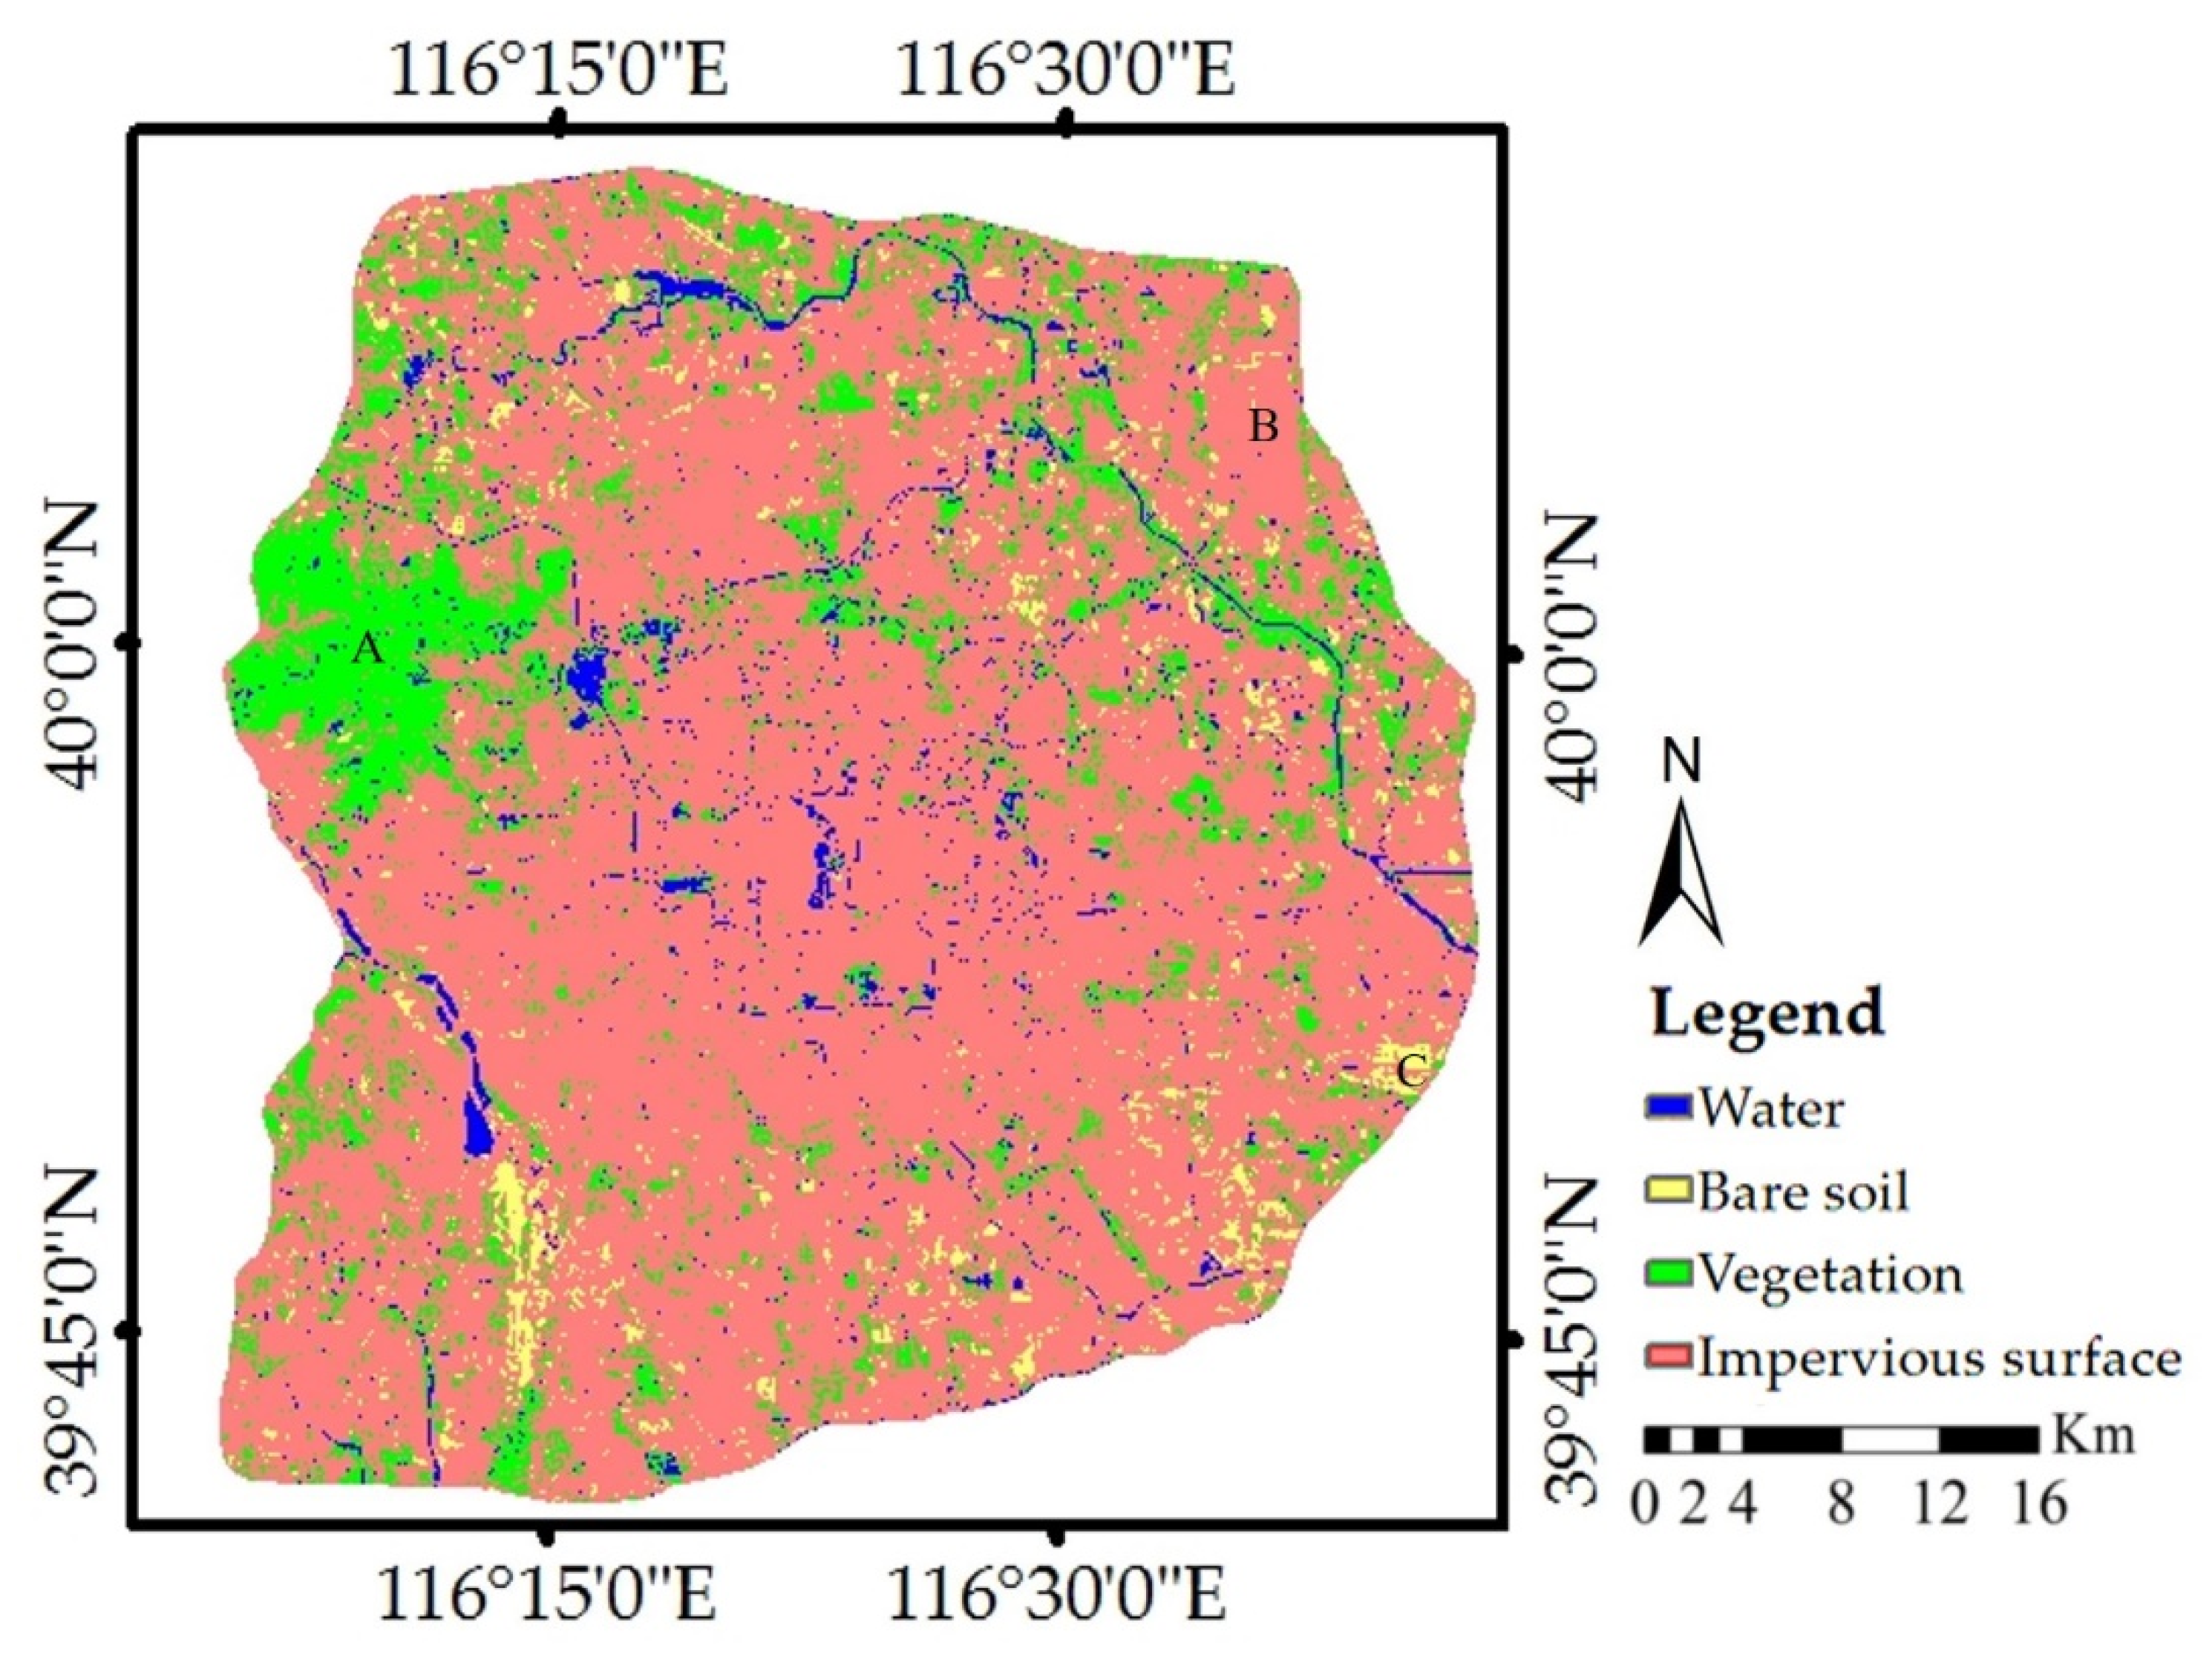
Figure 4 presents the Landsat 8 OLI image classification result in the year 2017 using the RF algorithm and both spectral and textural features. The HIS and LIS were combined as one type. Figure 4 shows the distributions of the four land cover types fit well with the satellite image in Figure 2. The outline and location of typical land cover generally correspond with actual land objects. For instance, three typical land objects were recognized with reference to the high-resolution images obtained from Google Earth, which is Western Hills in the northwest of the study area (Object A in Figure 2), Beijing Capital International Airport that is in the northeast of the study area (Object B in Figure 2), and a large patch of bare soil (Object C in Figure 2). Figure 4 shows that Object A is shown correctly as vegetation, Object B is indicated as the impervious surface, and Object C is appropriately classified as well.
Generally, the landcover map generated is rational, and it is precise enough to be used in the extraction of impervious surfaces. Therefore, the classification strategy combining spectral and textural features based on the RF algorithm was employed in the other four Landsat images to extract impervious surfaces in Beijing, and the results are presented in Figure 5.
The ranges of the five ring roads are overlaid in Figure 5. Generally, the impervious surface had always been the primary land cover type in the regions within the fourth ring road. In the region between the fourth and fifth ring roads, the outstanding phenomenon is the fast declination of the vegetation and bare soil from 1997 to 2002. The most significant phenomenon is in the region between the fifth and sixth ring roads, where abundant vegetation and bare soil were transformed into impervious surfaces from 1997 to 2007. Moreover, the vegetation cover in the whole was recovered from the year 2007, which is particularly apparent in the region between the fifth and sixth ring roads. These phenomena should be paid more attention to in the following analysis.
Even so, two features should be mentioned.
First, the impervious surfaces within the second ring road and between the second and third ring roads are almost constant in the five panels in Figure 5.
Second, the water cover within the fourth ring road and the vegetation cover in the Western Hills remained relatively constant in the five panels.
These features coincide well with the actual land covers in Beijing, indicating the rationality of the extraction.

4.2. Impervious Surface Changes

The five ring roads split the study area into five separated regions. In order to analyze the impervious surfaces quantitatively, the impervious surface area (ISA) was calculated for the five separated regions and the study area in the five specific years (Table 3). For simplicity, the second to sixth ring roads are denoted by numbers 2 to 6. Further, we calculated the area percentage of impervious surfaces for the five separated regions and the study area in these five years. Lastly, based on the area percentages, the area change percentages in the five separated regions and the study area between every two adjacent years (Table 4) were calculated to compare the magnitude of changes. By interpreting the land cover maps, and the analysis of ISA, the spatial and temporal changes were studied in the following Section 4.2.1 and Section 4.2.2.

4.2.1. Spatial Changes

Figure 5a demonstrates that, in 1997, the impervious surfaces were concentrated within the fifth ring road, and they were comparatively dispersed between the fifth and sixth ring roads. The majority of vegetation spread around the impervious surfaces and were outside the fifth ring road, with the bare soil distributed among vegetation in patches. In this time, the impervious surfaces were mainly located in the central part of the city, and the suburban was mainly covered by vegetation and bare soil.
Figure 5b demonstrates that, in 2002, the distribution of the impervious surfaces remained almost constant within the fourth ring road compared to that of 1997. Between the fourth and fifth ring roads, abundant impervious surfaces were converted from bare soil and vegetation. A great change occurred between the fifth and sixth ring roads, where the majority of the bare soil and vegetation were replaced by impervious surfaces except a small quantity of bare soil in the northwestern part and vegetation in the southeastern part. The impervious surfaces expanded dramatically in three directions, including the north, east, and south. As a result, bare soil and especially vegetation there were greatly replaced, and the remaining bare soil and vegetation covers existed in small patches.
Figure 5c demonstrates that, in 2007, the distribution of the impervious surfaces kept almost constant within the fifth ring road compared to that of 2002. The expansion of impervious surfaces was apparent in the southwestern and southeastern parts beyond the fifth ring road, where the vegetation patches in Figure 5b were replaced by impervious surfaces and bare soil.
Figure 5d demonstrates that there was an interesting phenomenon in 2013 that the distribution of impervious surfaces shrunk evidently in the northern, northeastern, southwestern, and northwestern parts of the study area where most impervious surfaces were replaced with vegetation. Moreover, compared to Figure 5c, there occurred abundant small patches of vegetation within the fifth ring road, which are transformed from the impervious surfaces. Several typical patches of vegetation that appeared in 2013 are marked in red circles in Figure 5d.
Figure 5e demonstrates that, in 2017, the distribution of the impervious surfaces kept mostly constant within the fifth ring road compared to that of 2013. An apparent change occurred in the southwestern part between the fifth and sixth ring roads, where abundant impervious surfaces were converted from vegetation.

4.2.2. Temporal Changes

From 1997 to 2002, the total ISA increased steeply from 1342.06 km2 to 1839.67 km2, and the total area percentage increased considerably by 21.95%. Compared to the other time scale, the impervious surface expansion is most significant in this period. Most of the expansion of impervious surfaces happened in the region between the fifth and sixth ring roads during this period, as the increased area percentage of impervious surfaces in this region was as high as 19.65%. Simultaneously, the expansion of impervious surfaces in the region between the fourth and fifth ring roads is also evident, with the increased area percentage being 2.25%.
From 2002 to 2007, there was a continued increase of impervious surfaces in the study area. The total ISA increased from 1839.67 km2 to the peak value of 1904.28 km2, and the total area percentage increased by 2.85%. The total area percentage increase is much lower than 21.95% of the period between 1992 and 2002. Considering that Beijing was preparing for the Olympic Games in this period, this decelerating increase gave some interesting information about the causes of the impervious surface changes. The area percentage increased in the region between the fifth and sixth ring roads is as high as 2.17%, which indicates this region to be the focus of urban construction in this period.
From 2007 to 2013, the impervious surfaces shrank both generally and regionally, as indicated in Table 4. The total ISA fell from 1904.28 km2 to 1708.41 km2, and the total area percentage presented a considerable decrease of 8.64%. It was the first and only period that the total ISA decreased, which indicates that the causes of the impervious surface changes might change in this period. The decrease is apparent in the regions between the fifth and sixth ring roads and between the fourth and fifth ring roads, with the area percentage dropping by 5.88% and 1.92%.
From 2013 to 2017, having been through the general and regional decrease, the impervious surfaces grew again. The total ISA jumped from 1708.41 km2 to 1790.93 km2, and the total area percentage had a slight increase of 3.64%. The total ISA is higher than that in 2013 but evidently lower than that in 2002 and 2007. This result reveals that the impervious surface expansion resulting from urbanization was still going on during this period, but the expansion was limited. Moreover, the growing area percentage of impervious surfaces between the fifth and sixth ring roads accounts for 2.92%, so the expansion of impervious surfaces still centralized on the region between the fifth ring and sixth ring road as before.
Generally, it can be summarized from the analysis above that the total impervious surfaces in the study area have three expanding periods—1997–2002, 2002–2007, and 2013–2017—and only shrank in the period from 2007–2013. Among the three expanding periods, the total impervious surfaces increased the most in 1997–2002, followed by 2013–2017 and 2002–2007. Besides, it can also be found that the impervious surface changes are slight within the fourth ring road. The impervious surface changes are relatively significant in the region between the fourth and fifth ring roads, where impervious surfaces increased from 1997 to 2002 and decreased from 2007 to 2013. The most significant changes of the impervious surfaces existed between the fifth and sixth ring roads, where the impervious surfaces expanded incredibly from 1997 to 2007, declined significantly from 2007 to 2013, and grew again from 2013 to 2017. Such changes of the impervious surfaces will bring some interesting clues for the expansion of the megacity.

4.2.3. Regional Changes

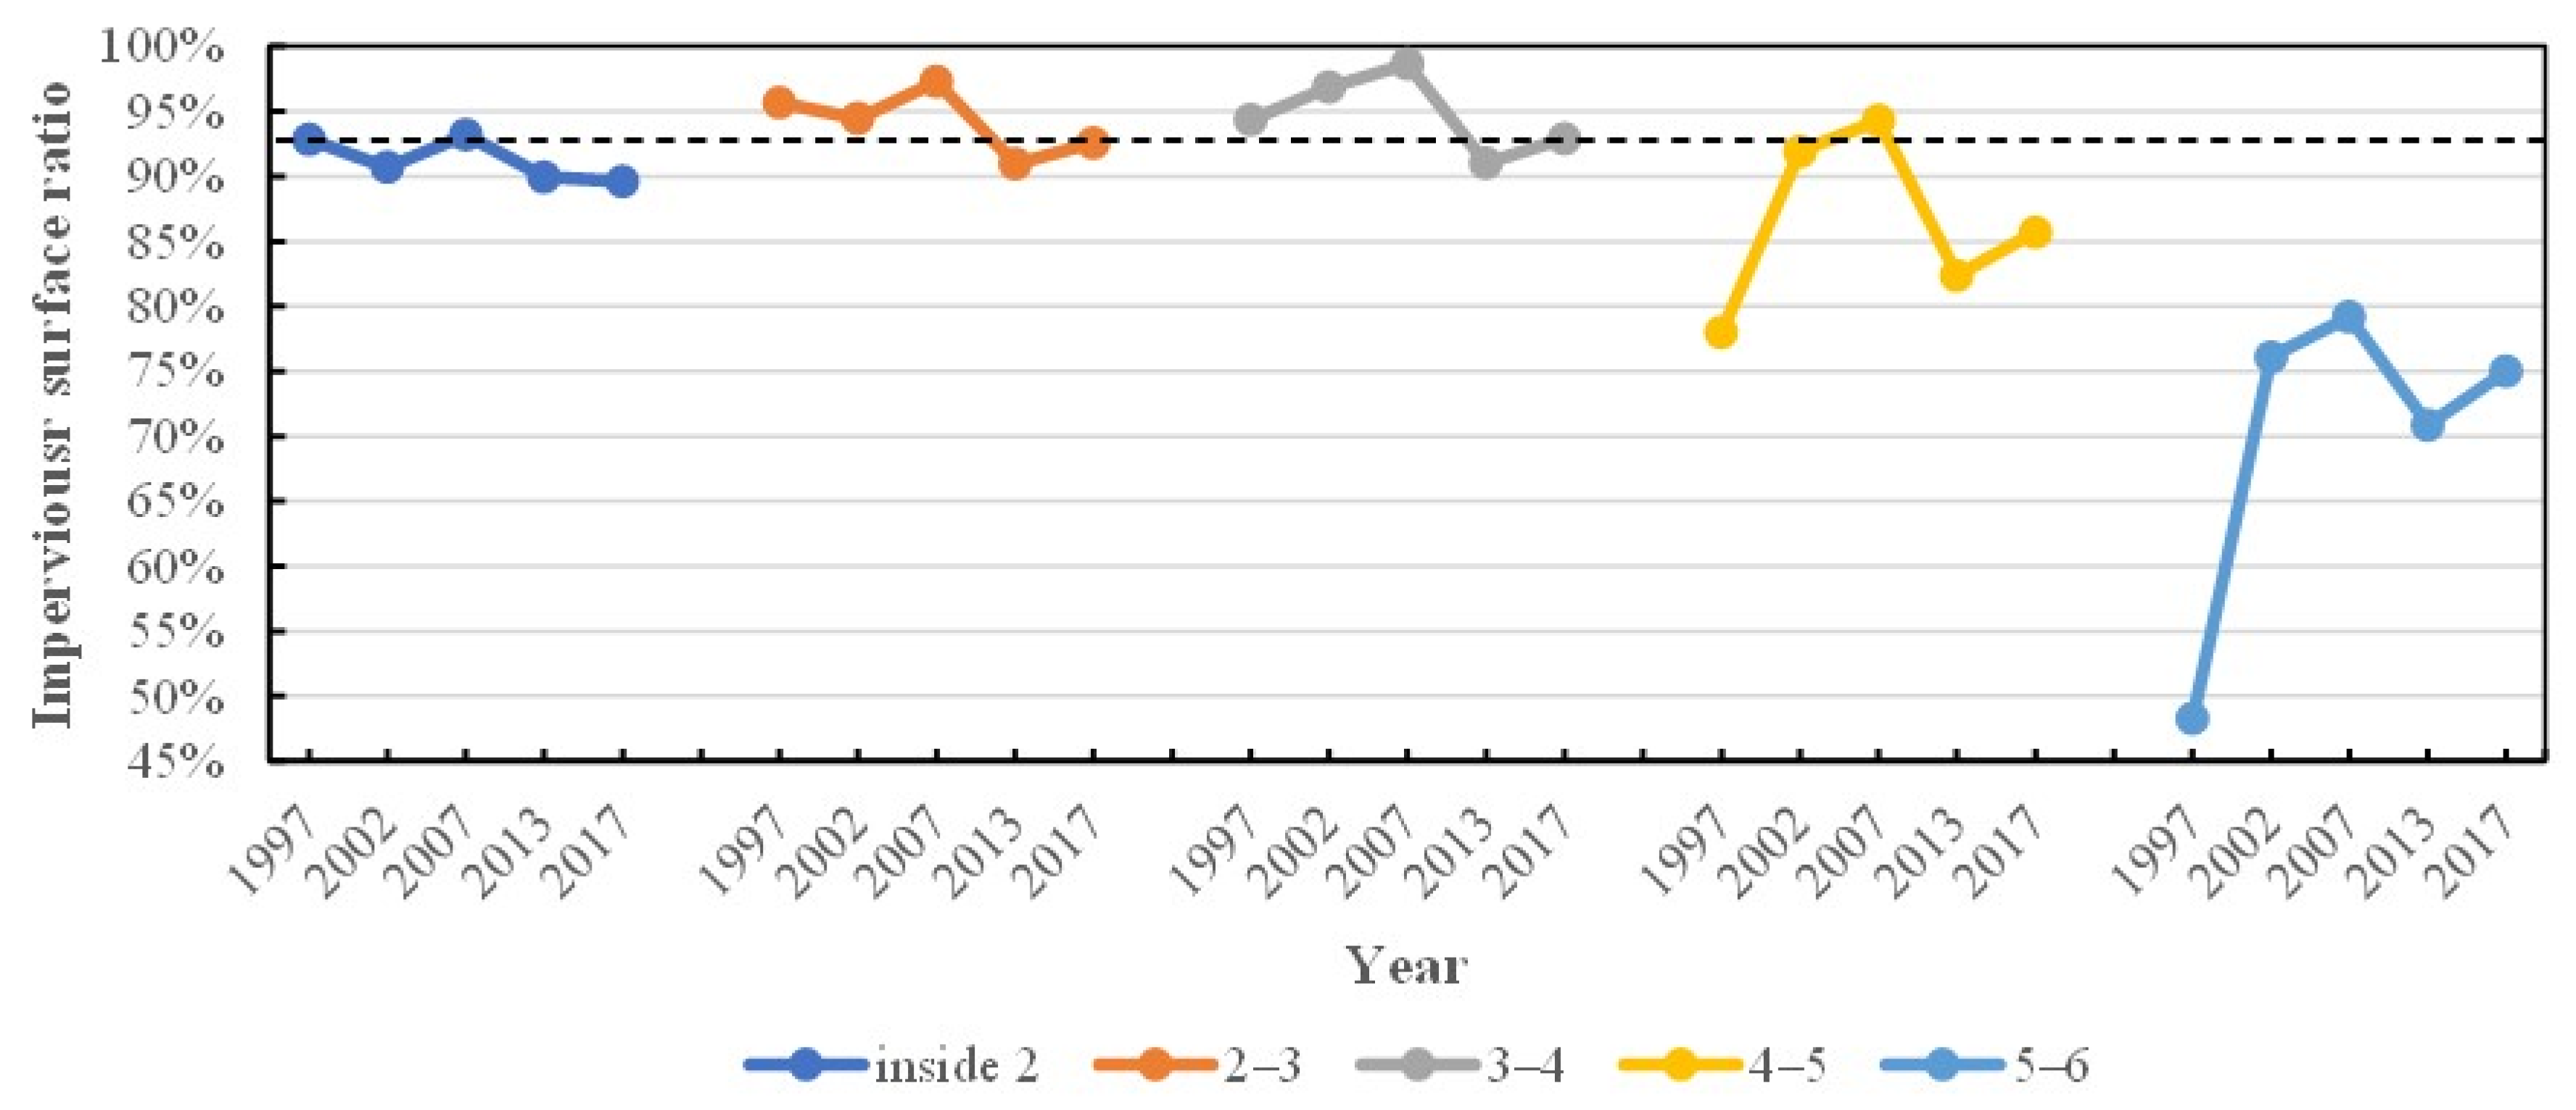
Table 4 shows that the regional impervious surface changes are not always consistent with the total variation trends, and the changes differ significantly from region to region. The regional impervious surface changes are closely related to the area of the region. To eliminate the effect of the regional area and also compare the impervious surface coverage in each region, the impervious surface ratio (ISR), defined as the ISA in a region divided by the area of the corresponding region, was calculated for the five regions in the five specific years and the results were shown in Table 5. Table 5 also presents the mean ISR in each region. Moreover, the variation trends of regional ISRs were plotted in Figure 6.
Table 5 also presents that the mean values of ISRs in different regions are quite diverse. Figure 6 denotes that fluctuations of ISRs during the 20 years in the region between the outer ring roads are significantly more dramatic than those of the region between the inner ring roads. To compare the fluctuation of regional changes quantitively, the coefficient of variation (CV), which is a dimensionless number and allows the comparison of variation for populations with significantly different mean values, was introduced and presented in Table 5. The CV for each separated region is calculated as follows:
CV = σ μ × 100 % ,
where σ is the standard deviation of ISR in each region, and μ is the mean ISR in each region of the five years.
Within the second ring road, the maximum ISR occurred in 2007. After that, the ISR continuously declined. The fluctuation of impervious surfaces is slight, with the CV being 1.81%. Such slight fluctuation of the impervious surfaces in the urban core areas indicates the rationality of the extraction results in this study.
In the region between the second and third ring roads, the maximum ISR also occurred in 2007, and there was an abrupt decline in the period from 2007 to 2013. From 2013 to 2017, the ISR slightly recovered. Generally, the fluctuation of impervious surfaces is also slight, with the CV being 2.66%, which also proves extraction results are rational.
In the region between the third and fourth ring roads, the ISR gradually increased from 1997 to 2007, while it had an abrupt decrease from 2007 to 2013. After that, the ISR increased again. Generally, the fluctuation of impervious surfaces is small, with the CV being 3.21%.
In the region between the fourth and fifth ring roads, the ISR increased considerably from 1997 to 2002, and the ISR became the highest in 2007. However, from 2007 to 2013, the ISR had an apparent decrease. After that, it was slightly recovered. Generally, the fluctuation of the impervious surfaces is relatively large, with the CV being 7.78%.
In the region between the fifth and sixth ring roads, the ISR had the largest increase from 1997 to 2002, and the ISR became the largest in 2007. From 2007 to 2013, the ISR had a significant decline. After that, it was also recovered slightly. Generally, the fluctuation of the impervious surfaces in this region is huge, with the CV being 17.81%.

5. Discussion

5.1. Driving Factors of the Impervious Surface Changes

The change of impervious surface can result from many factors, such as economy, population, governmental plans and regulations, and some big events. These factors interact with each other, and one of the comprehensive results is the increase or decrease of impervious surfaces. Here, we only provide the possible major driving factors in each period.
From 1997 to 2002, the impervious surfaces sprawled without limits, and the increase of impervious surfaces is faster than any other period. The increase of impervious surfaces was incredibly immense in the region between the fifth and sixth ring roads, where a considerable number of impervious surfaces were converted from vegetation and bare soil. Meanwhile, in this period, the Chinese economic reform was going on and took effect instantly. China joined the World Trade Organization (WTO) in 2001. Since then, China has experienced long term economic take-off. As the capital and the economic center of China, Beijing’s economy boomed considerably, as reflected in the statistics [38], which led to an increase in immigrants and corresponding population expansion with no doubt. More residential areas, commercial areas, and infrastructures were constructed on the unutilized land between the fifth and sixth ring roads covered with vegetation and bare soil to provide essential living resources for the new immigrates. Therefore, we speculate that the economy might be the major driving factor.
From 2002 to 2007, the impervious surfaces continued to sprawl, but the growth of the impervious surfaces decelerated because the increased area percentage was much lower than that between 1997 and 2002. The economic rise might still contribute to the increase in this period as China joined the WTO. Additionally, Beijing was actively preparing for the 2008 Beijing Olympics Games, and the government invested heavily in the construction of new facilities and transport systems. Twelve venues within Beijing were newly built specifically for the 2008 Games [39], most of which are located between the fourth and sixth ring roads. Interestingly, the increase of the impervious surfaces between the fourth and sixth ring roads in this period is much lower than that from 1997 to 2002, indicating that the 2008 Games contributed little to the increasing of the impervious surfaces. As shown in the Beijing Master Plan (2004–2020), controlling the scale of land used for urban construction was emphasized. Therefore, the deceleration of the impervious surface growth might be due to the regulations of the government. Therefore, economy and government regulations were possible key factors resulting in the impervious surface changes in this period.
From 2007 to 2013, both total and regional impervious surface shrank, and there suddenly occurred abundant vegetation patches in the outer two regions, the larger ones of which are marked in red circles in Figure 5d. Combined with the interpretation of the high-resolution images obtained from Google Earth, it is known that Patch A is the Dongba Country Park, Patch B is a 2 km long green belt, Patch C is Beijing World Park, and Patch D is the Olympic Forest Park. All these are manmade natural parks finished during this period. As the impervious surfaces expanded, environmental problems were also emerging. For instance, extremely hot weather in Beijing’s summer frequently occurred [40]. One of the measures to reduce the environmental problem is to increase green space per capita. Toward this goal, the Beijing government conducted a series of greening programs, including Street Greening Projects, the Country Park Ring Program, the Green Olympics Program. The three parks and the green belt mentioned were constructed under these programs. Another event that occurred in this period is that Beijing renovated the shanty towns in the nearby suburbs (the region between the fifth and sixth ring roads) to improve the living conditions and achieve city beautification [41]. As a result, old bungalows in the shanty towns were demolished, and the people living in these areas were relocated to new settlement housing that is commonly flats. Therefore, government greening programs and urban renewal might also be a key factor leading to the decreased of impervious surfaces.
From 2013 to 2017, impervious surfaces expanded again. The ISA in 2017 is lower than those in 2002 and 2007, and the vegetation patches that emerged in 2013 were generally kept constant during the period as the patches marked in red circles in Figure 5e. Therefore, it can be concluded that the impervious surfaces grew rationally in this period, which is on the premise of maintaining the scales of the urban greening spaces. As in the Beijing Master Plan (2004–2020), economic construction and environmental protection were emphasized to develop Beijing into an eco-friendly city. Therefore, both the economy and government regulations were possible major factors resulting in the impervious changes in this period.

5.2. Regional Urbanization Level and Process

In the previous studies, the ISA is considered an indicator representing how much a place has been urbanized [42,43]. Compared to ISA, ISR can illustrate the regional urbanization level better since the effect of the regional area is eliminated. A relatively high ISR can be interpreted as the place being highly urbanized. According to Table 5, the mean ISRs in the regions between the inner ring roads are higher than those in the regions between the outer ring roads. This result proves that the urbanization levels of the inner three regions are higher than those of the outer two regions.
Thus, the inner three regions inside the fourth ring road can be considered highly urbanized areas compared to the outer two regions. The mean ISRs for the three regions from the inside out are 91.26%, 94.18%, and 94.74% (Table 5). The ISRs in the three regions all generally present a declining trend during the 20 years of development (Figure 6). Interestingly, the ISRs of the regions between the second and third ring roads and between the third and fourth ring roads finally declined to the initial ratio of the region within the second ring road in 2017, as shown by the dotted line in Figure 6. These results suggest that after the ISR reached a certain degree in the highly urbanized areas, the ratio starts to decline. A possible explanation for this result is that the citizens in the region pay more attention to improving landscapes as the urbanization finishes. For example, a series of greening projects have been conducted to the streets, community gardens, walls, and rooftops of buildings in Beijing since 2012 [44,45].
The CV reflects the fluctuation of the impervious surfaces in each region and can also reflect the urbanization process in which the region is. When the value of CV is small, the impervious surfaces in this region tend to be stable, and the changes of impervious surfaces with time are slight, which means the urbanization process in this region tend to be finished. Whereas, when the value of the CV is big, the impervious surface ratio in this region tends to be unstable, the changes of impervious surfaces with time are significant, which means the urbanization process in this region is still going on.
The CV increases from the inner regions to the outer regions, which implies that the urbanization processes in the interior regions tend to be completed compared to the exterior regions. Thus, it can be inferred that the urbanization process has been completed in the regions within the second ring road and between the second and third ring roads, approximately completed in the region between the third and fourth ring roads, on the right track to be completed in the region between the fourth and fifth ring roads, and far from being completed in the region between the fifth and sixth ring roads.

5.3. Limitations and Future Work

In this paper, the textural features were introduced into the impervious surface extraction, which was a variable neglected in most previous research. The results showed that the classification accuracy was significantly improved by adding textural features. The Kappa coefficient of the classification image increased from 0.694 to 0.850. It is evident that the textural feature is an essential factor for an accurate evaluation of impervious surfaces. However, the impacts on texture extraction based on GLCM need to be further studied. An empirical value of 7 × 7 for the moving window size is adopted in this study, and the optimal value needs further experimental verification. Beyond that, 27 features were used for image classification, but not all the features play important roles in the classification. To some extent, there may be redundant information. Though an ideal classification result was obtained based on these features, with the Kappa coefficient reaching 0.850, the best combination of these features still awaits discovery.
This study adopted the VIS, NIR, and SWIR bands of Landsat 5, 7, and 8 images. Some recent studies are denoting that the thermal bands of Landsat 8 [46].and Luojia-1 nighttime light data [47] help classify urban land covers. Thus, these data can be considered as the input features to improve the classification of RF in further work.
The estimation of the impervious surfaces was regarded as the combination of high and low albedo impervious surfaces in this study. Five land cover types, vegetation, bare soil, high albedo, and low albedo impervious surfaces, were primarily identified. However, the shadows accompanying mountains and high buildings were ignored in the image classification. Also, the shadows were easily confused with LIS and water [48]. Meanwhile, the confusion between bare soil and HIS also leads to a decline in impervious surface estimation accuracy [49]. To further improve the estimation of impervious surfaces, these problems can be solved in a future study.

6. Conclusions

In this study, the Random Forest (RF) algorithm was used to extract the impervious surfaces in Beijing from Landsat satellite images. In addition to the original multispectral bands, the first two components obtained from principal components analysis (PCA) and the first three components from minimum noise fraction rotation were also introduced in the classification as auxiliary spectral features. Meanwhile, a total of 16 textural features based on GLCM were extracted from the first two components of PCA. These features altogether were used as input variables of the RF. The accuracy assessment shows that the classification strategy combining spectral and textural features based on RF has an ideal performance in the complex urban areas, with the Kappa coefficient being 0.850. Moreover, it has also been proven that textural features can provide an essential supplement for improving the classification of land covers, especially for high albedo impervious surfaces, with the accuracy increasing by 16.23%. Therefore, the classification strategy combining spectral and textural features based on the RF algorithm was employed to generate the land cover maps within the sixth ring road in Beijing in 1997, 2002, 2007, 2013, and 2017.
An analysis was conducted to study the spatiotemporal changes of impervious surfaces. The result shows that the overall impervious surfaces within the sixth ring road in Beijing have three expanding periods—1997–2002, 2002–2007, and 2013–2017—and only shrank during 2007–2013. The overall impervious surface area increased the most in 1997–2002, followed by 2013–2017 and 2002–2007. The possible major driving factors to the changes of impervious surfaces were speculated to be the economy in 1997–2002, economy and government regulations in 2002–2007, the government greening programs and urban renewal in 2007–2013, and both economy and the government regulations in 2013–2017.
During 1997–2017, the impervious surfaces changed slightly within the fourth ring road, relatively significantly in the region between the fourth and fifth ring roads, and the most significantly in the region between the fifth and sixth ring roads. The regional impervious surface ratio (ISR) demonstrates that the inner three regions within the fourth ring road are relatively highly urbanized areas compared to the outer two regions. After ISR reached a certain degree in the highly urbanized areas, the ratio starts to decline. Additionally, according to the analysis of the coefficient of variation in each region, the urbanization processes in the interior regions tend to be completed compared to the exterior regions.
This study provides a detailed analysis of the spatiotemporal changes of the impervious surfaces within the sixth ring road in Beijing from 1997–2017 when the urbanization was rapidly proceeding. Furthermore, this study lays the groundwork for future research into predicting the process of urban expansion. Such an analysis is also critical for further environmental regulations to be put into place.

Author Contributions

Conceptualization, Z.M.; methodology, X.D. and Z.M.; software, X.D. and Y.W.; validation, Z.M. and Y.Z.; formal analysis, Z.M. and Y.Z.; investigation, X.D. and H.S.; resources, Z.M. and Y.Z.; data curation, Y.Z. and Y.W.; writing—original draft preparation, X.D. and Z.M.; writing—review and editing, Y.Z. and Y.W.; visualization, X.D. and Q.W.; supervision, Z.M. and Y.Z.; project administration, Y.Z. and Y.W.; funding acquisition, Z.M. All authors have read and agreed to the published version of the manuscript.

Funding

This research has been jointly supported by the National Key R & D Program of China (2016YFC0600501) and the National Natural Science Foundation of China (No. 42071309).

Data Availability Statement

The data presented in this study are available on request from the corresponding author.

Acknowledgments

The authors express their thanks to the people who helped with this work and acknowledge the valuable suggestions from the peer reviewers. In this study, the Landsat 5, 7, and 8 images were downloaded from the United States Geological Survey (USGS) global visualization viewer (http://glovis.usgs.gov/). We are grateful to them for allowing us to use their data.

Conflicts of Interest

The authors declare no conflict of interest.

References

  1. United Nations, Department of Economic and Social Affairs, Population Division. World Urbanization Prospects: The 2014 Revision Highlights, (ST/ESA/SER.A/352); UN: New York, NY, USA, 2014. [Google Scholar]
  2. Arnold, C.L.; Gibbons, C.J. Impervious surface coverage: The emergence of a key environmental indicator. J. Am. Plan. Assoc. 1996, 62, 243–258. [Google Scholar] [CrossRef]
  3. Yuan, F.; Bauer, M.E. Comparison of impervious surface area and normalized difference vegetation index as indicators of surface urban heat island effects in Landsat imagery. Remote Sens. Environ. 2007, 106, 375–386. [Google Scholar] [CrossRef]
  4. Dams, J.; Dujardin, J.; Reggers, R.; Bashir, I.; Canters, F.; Batelaan, O. Mapping impervious surface change from remote sensing for hydrological modeling. J. Hydrol. 2013, 485, 84–95. [Google Scholar] [CrossRef]
  5. Lu, D.S.; Li, G.Y.; Kuang, W.H.; Moran, E. Methods to extract impervious surface areas from satellite images. Int. J. Digit. Earth 2014, 7, 93–112. [Google Scholar] [CrossRef]
  6. Pappas, E.A.; Smith, D.R.; Huang, C.; Shuster, W.D.; Bonta, J.V. Impervious surface impacts to runoff and sediment discharge under laboratory rainfall simulation. Catena 2008, 72, 146–152. [Google Scholar] [CrossRef]
  7. Ridd, M.K. Exploring a V-I-S (vegetation-impervious surface-soil) model for urban ecosystem analysis through remote sensing: Comparative anatomy for cities. Int. J. Remote Sens. 1995, 16, 2165–2185. [Google Scholar] [CrossRef]
  8. Madhavan, B.B.; Kubo, S.; Kurisaki, N.; Sivakumar, T.V.L.N. Appraising the anatomy and spatial growth of the Bangkok Metropolitan area using a vegetation-impervious-soil model through remote sensing. Int. J. Remote Sens. 2001, 22, 789–806. [Google Scholar] [CrossRef]
  9. Wu, C.S.; Murray, A.T. Estimating impervious surface distribution by spectral mixture analysis. Remote Sens. Environ. 2003, 84, 493–505. [Google Scholar] [CrossRef]
  10. Xu, H.Q. A new remote sensing index for fastly extracting impervious surface information. Geomat. Inf. Sci. Wuhan Univ. 2008, 33, 1150–1154. [Google Scholar]
  11. Shao, Z.; Fu, H.; Fu, P.; Yin, L. Mapping urban impervious surface by fusing optical and SAR data at the decision level. Remote Sens. 2016, 8, 945. [Google Scholar] [CrossRef] [Green Version]
  12. Zhang, Y.Z.; Zhang, H.S.; Lin, H. Improving the impervious surface estimation with combined use of optical and SAR remote sensing images. Remote Sens. Environ. 2014, 141, 155–167. [Google Scholar] [CrossRef]
  13. Breiman, L. Random forests. Mach. Learn. 2001, 45, 5–32. [Google Scholar] [CrossRef] [Green Version]
  14. Rodriguez-Galiano, V.F.; Ghimire, B.; Rogan, J.; Chica-Olmo, M.; Rigol-Sanchez, J.P. An assessment of the effectiveness of a random forest classifier for land-cover classification. ISPRS J. Photogramm. 2012, 67, 93–104. [Google Scholar] [CrossRef]
  15. Gislason, P.O.; Benediktsson, J.A.; Sveinsson, J.R. Random Forests for land cover classification. Pattern Recognit. Lett. 2006, 27, 294–300. [Google Scholar] [CrossRef]
  16. Fawagreh, K.; Gaber, M.M.; Elyan, E. Random Forests: From Early Developments to Recent Advancements. Syst. Sci. Control Eng. 2014, 2, 602–609. [Google Scholar] [CrossRef] [Green Version]
  17. Rokach, L. Ensemble-based classifiers. Artif. Intell. Rev. 2010, 33, 1–39. [Google Scholar] [CrossRef]
  18. Kottek, M.; Grieser, J.; Beck, C.; Rudolf, B.; Rubel, F. World map of the Köppen-Geiger climate classification updated. Meteorol. Z. 2006, 15, 259–263. [Google Scholar] [CrossRef]
  19. Zhang, C.L.; Chen, F.; Miao, S.G.; Li, Q.C.; Xia, X.A.; Xuan, C.Y. Impacts of urban expansion and future green planting on summer precipitation in the Beijing metropolitan area. J. Geophys. Res. 2009, 114, D02116. [Google Scholar] [CrossRef]
  20. Lin, X.C.; Yu, S.Q. Interdecadal changes of temperature in the Beijing region and its heat island effect. Chin. J. Geophys. 2005, 48, 39–45. [Google Scholar] [CrossRef]
  21. Zhang, L.; Gao, S.; Wei, B.; Li, Y.; Li, H.; Wang, L.; Ye, B. Effects of urbanization on rural drinking water quality in Beijing, China. Sustainability 2017, 9, 461. [Google Scholar] [CrossRef] [Green Version]
  22. Rodriguez-Galiano, V.F.; Chica-Olmo, M.; Abarca-Hernández, F.; Atkinson, P.M.; Jeganathan, C. Random Forest classification of Mediterranean land cover using multi-seasonal imagery and multi-seasonal texture. Remote Sens. Environ. 2012, 121, 93–107. [Google Scholar] [CrossRef]
  23. Markham, B.L.; Barker, J.L. Thematic Mapper bandpass solar exoatmospheric irradiances. Int. J. Remote Sens. 1987, 8, 517–523. [Google Scholar] [CrossRef]
  24. Marceau, D.J.; Howarth, P.J.; Dubois, J.M.; Gratton, D.J. Evaluation of The Grey-level Co-occurrence Matrix Method for Land-cover Classification Using Spot Imagery. IEEE Trans. Geosci. Remote Sens. 1990, 28, 513–519. [Google Scholar] [CrossRef]
  25. Eklundh, L.; Singh, A. A comparative analysis of standardised and unstandardised Principal Components Analysis in remote sensing. Int. J. Remote Sens. 1993, 14, 1359–1370. [Google Scholar] [CrossRef]
  26. Xia, J.S.; Chanussot, J.; Du, P.J.; He, X.Y. (Semi-) supervised probabilistic principal component analysis for hyperspectral remote sensing image classification. IEEE J. Sel. Top. Appl. Earth Observ. Remote Sens. 2014, 7, 2224–2236. [Google Scholar] [CrossRef] [Green Version]
  27. Green, A.A.; Berman, M.; Switzer, P.; Craig, M.D. A transformation for ordering multispectral data in terms of image quality with implications for noise removal. IEEE Trans. Geosci. Remote Sens. 1988, 26, 65–74. [Google Scholar] [CrossRef] [Green Version]
  28. Haralick, R.M.; Shanmugam, K.; Dinstein, I. Textural features for image classification. IEEE Trans. Syst. Man Cybern. 1973, 6, 610–621. [Google Scholar] [CrossRef] [Green Version]
  29. Haralick, R.M. Statistical and structural approaches to texture. Proc. IEEE 1979, 67, 786–804. [Google Scholar] [CrossRef]
  30. Chica-Olmo, M.; Abarca-Hernández, F. Computing geostatistical image texture for remotely sensed data classification. Comput. Geosci. 2000, 26, 373–383. [Google Scholar] [CrossRef] [Green Version]
  31. Akar, Ö.; Güngör, O. Integrating multiple texture methods and NDVI to the Random Forest classification algorithm to detect tea and hazelnut plantation areas in northeast Turkey. Int. J. Remote Sens. 2015, 36, 442–464. [Google Scholar] [CrossRef]
  32. Bharati, M.H.; Liu, J.J.; MacGregor, J.F. Image texture analysis: Methods and comparisons. Chemom. Intell. Lab. Syst. 2004, 72, 57–71. [Google Scholar] [CrossRef]
  33. Ali, J.; Khan, R.; Ahmad, N.; Maqsood, I. Random Forests and Decision Trees. Int. J. Comput. Sci. Issues. 2012, 9, 272–278. [Google Scholar]
  34. Stumpf, A.; Kerle, N. Object-oriented mapping of landslides using Random Forests. Remote Sens. Environ. 2011, 115, 2564–2577. [Google Scholar] [CrossRef]
  35. Zhu, Z.; Woodcock, C.E.; Rogan, J.; Kellndorfer, J. Assessment of spectral, polarimetric, temporal, and spatial dimensions for urban and peri-urban land cover classification using Landsat and SAR data. Remote Sens. Environ. 2012, 117, 72–82. [Google Scholar] [CrossRef]
  36. Ghosh, A.; Joshi, P.K. A comparison of selected classification algorithms for mapping bamboo patches in lower Gangetic plains using very high resolution WorldView 2 imagery. Int. J. Appl. Earth Obs. Geoinform. 2014, 26, 298–311. [Google Scholar] [CrossRef]
  37. Belgiu, M.; Drăguţ, L. Random forest in remote sensing: A review of applications and future directions. ISPRS J. Photogramm. Remote Sens. 2016, 114, 24–31. [Google Scholar] [CrossRef]
  38. Beijing Statistical Year Book 2019. Available online: http://nj.tjj.beijing.gov.cn/nj/main/2019-tjnj/zk/indexee.htm (accessed on 1 December 2020).
  39. Gold, J.R.; Gold, M.M. Olympic Cities: City Agendas, Planning, and the World’s Games, 1896–2020, 3rd ed.; Routledge: London, UK, 2016. [Google Scholar]
  40. Li, S.; Yang, S. Changes of extreme temperature events in Beijing during 1960–2014. Sci. Geogr. Sin. 2015, 35, 1640–1647. [Google Scholar]
  41. CCTV.com. Available online: http://www.cctv.com/english/special/excl/20090703/108728.shtml (accessed on 24 December 2020).
  42. Chao, Z.; Wang, L.; Che, M.; Hou, S. Effects of Different Urbanization Levels on Land Surface Temperature Change: Taking Tokyo and Shanghai for Example. Remote Sens. 2020, 12, 2022. [Google Scholar] [CrossRef]
  43. Liu, Z.; He, C.; Zhou, Y.; Wu, J. How much of the world’s land has been urbanized, really? A hierarchical framework for avoiding confusion. Landsc. Ecol. 2014, 29, 763–771. [Google Scholar] [CrossRef]
  44. China.org.cn. Available online: http://www.china.org.cn/environment/2012-04/02/content_25052715.htm (accessed on 27 November 2020).
  45. Wu, D.; Gong, J.; Liang, J.; Sun, J.; Zhang, G. Analyzing the Influence of Urban Street Greening and Street Buildings on Summertime Air Pollution Based on Street View Image Data. ISPRS Int. J. Geo-Inf. 2020, 9, 500. [Google Scholar] [CrossRef]
  46. Sun, Z.; Wang, C.; Guo, H.; Shang, R. A Modified Normalized Difference Impervious Surface Index (MNDISI) for Automatic Urban Mapping from Landsat Imagery. Remote Sens. 2017, 9, 942. [Google Scholar] [CrossRef] [Green Version]
  47. Chang, S.; Wang, Z.; Mao, D.; Guan, K.; Jia, M.; Chen, C. Mapping the Essential Urban Land Use in Changchun by Applying Random Forest and Multi-Source Geospatial Data. Remote Sens. 2020, 12, 2488. [Google Scholar] [CrossRef]
  48. Pilant, A.; Endres, K.; Rosenbaum, D.; Gundersen, G. US EPA EnviroAtlas Meter-Scale Urban Land Cover (MULC): 1-m Pixel Land Cover Class Definitions and Guidance. Remote Sens. 2020, 12, 1909. [Google Scholar] [CrossRef]
  49. Lin, Y.; Zhang, H.; Lin, H.; Gamba, P.E.; Liu, X. Incorporating synthetic aperture radar and optical images to investigate the annual dynamics of anthropogenic impervious surface at large scale. Remote Sens. Environ. 2020, 242, 111757. [Google Scholar] [CrossRef]
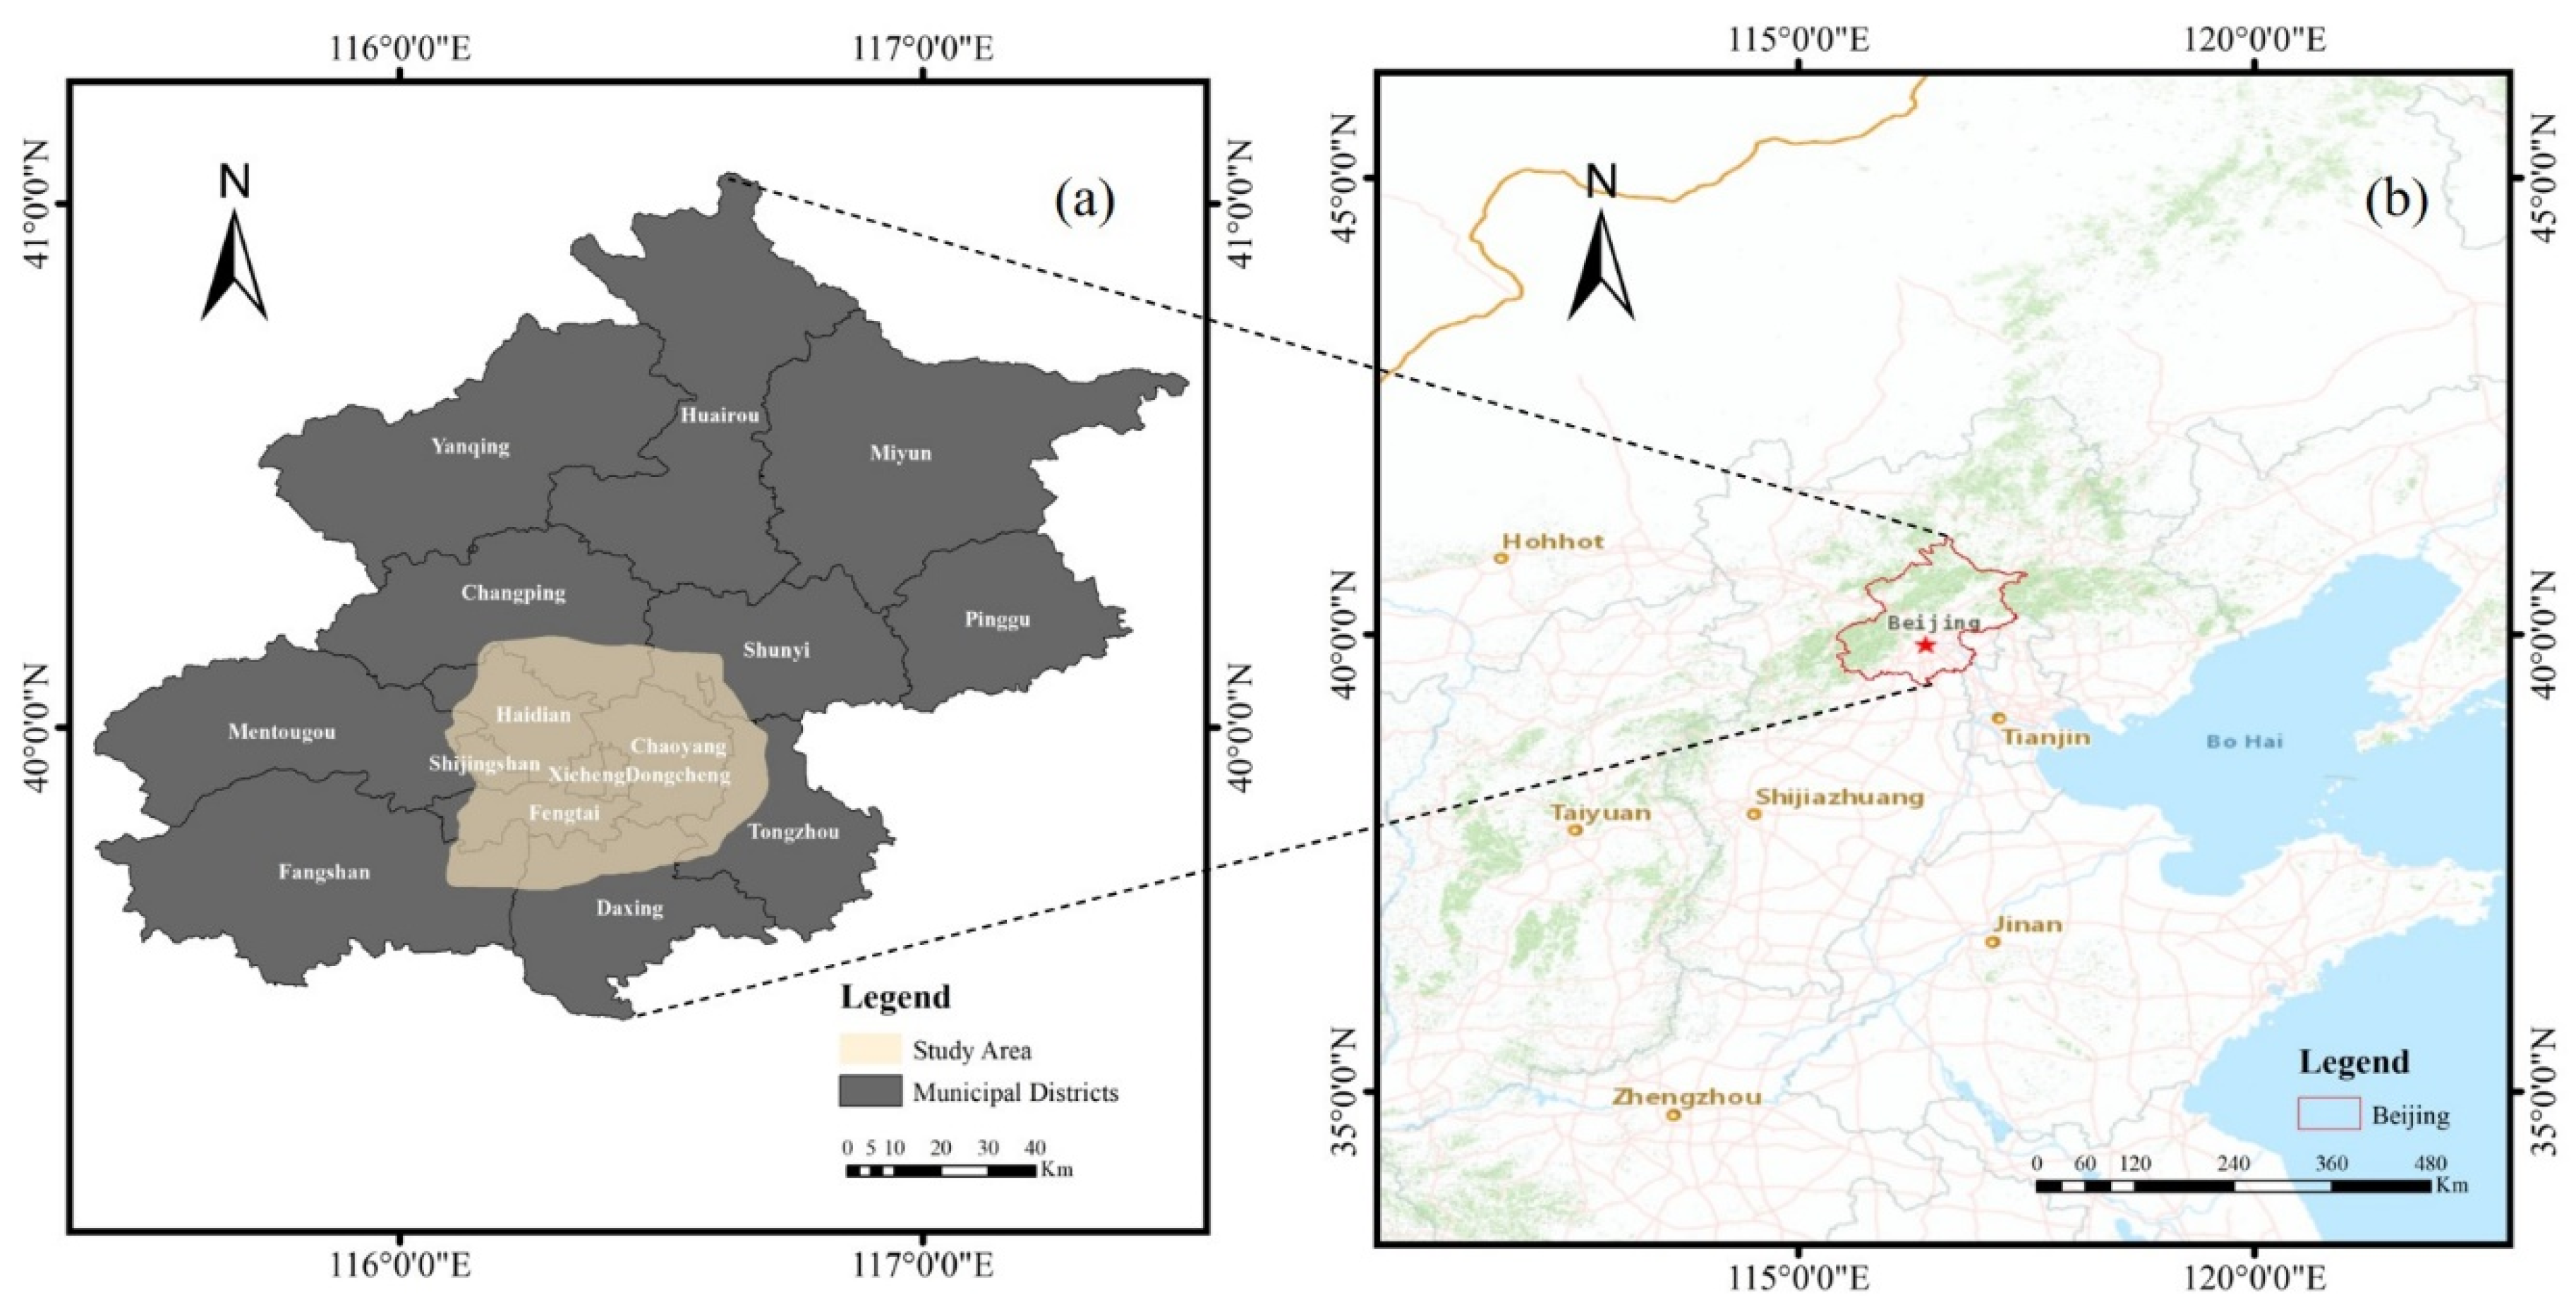
Figure 1. (a) Location of the study area and the municipal districts of Beijing. (b)The location of Beijing in China. The base map is from ChinaOnlineCommunityENG (MapServer).
Remotesensing 13 00153 g001
Figure 2. Landsat 8 image (Acquisition date: 23 May 2017) clipped to the study area and displayed in true color composite with the five ring roads overlaid on the image. The ring roads were vectorized based on the visual interpretation of high-resolution images obtained from Google Earth.
Remotesensing 13 00153 g002
Figure 3. Comparison of classification accuracy between different classification strategies (blue: classification based on spectrum only; orange: classification based on spectrum and texture).
Remotesensing 13 00153 g003
Figure 4. The classification result of the study area in the year 2017, with water, bare soil, vegetation, and high and low albedo impervious surfaces (HIS and LIS) being denoted in the blue, light yellow, green, and light coral colors.
Remotesensing 13 00153 g004
Figure 5. Land cover maps inside the sixth ring road of Beijing city in the years of (a) 1997; (b) 2002; (c) 2007; (d) 2013; (e) 2017. All maps are overlaid with the extent of the ring roads. Several typical patches of vegetation that appeared in 2013 and were generally kept constant in 2017 are marked in red circles.
Remotesensing 13 00153 g005
Figure 6. The variation trends of the regional ISRs. The dotted line connects the start point of the ISR inside the second ring road, the endpoint of the ISR between the second and third ring roads, and the endpoint of the ISR between the third and fourth ring roads.
Remotesensing 13 00153 g006
Table 1. Landsat images that utilized for impervious surface mapping.
Acquisition DateSatelliteSensorsPath/Row
16 May 1997Landsat-5TM123/32
22 May 2002Landsat-7ETM+123/32
28 May 2007Landsat-5TM123/32
12 May 2013Landsat-8OLI123/32
23 May 2017Landsat-8OLI123/32
Table 2. Features used in the classification.
TypeNameNumber
Spectral featuresBlue, Green, Red, NIR, SWIR1, SWIR2, PC1, PC2, MNF1, MNF2, MNF311
Textural featuresPC1_Mea, PC1_Var, PC1_Hom, PC1_Co, PC1_Dis, PC1_Ent, PC1_Sec, PC1_Cor; PC2_Mea, PC2_Var, PC2_Hom, PC2_Con, PC2_Dis, PC2_Ent, PC2_Sec, PC2_Cor16
Table 3. The impervious surface area (ISA) in each separated region and the study area (unit: km2).
RegionsDate
19972002200720132017
Within 258.4957.1358.7256.6856.45
2–391.8190.6893.4087.2888.87
3–4134.89138.51141.01130.13132.85
4–5284.51335.52344.13300.60312.85
5–6772.371217.831267.031133.731199.92
Total1342.061839.671904.28 1708.411790.93
Table 4. The area changepercentage of impervious surfaces in each separated region and the study area.
RegionsPeriod
1997–20022002–20072007–20132013–2017
Within 2−0.060.07−0.09−0.01
2–3−0.050.12−0.270.07
3–40.160.11−0.480.12
4–52.250.38−1.920.54
5–619.652.17−5.882.92
Total21.952.85−8.643.64
Table 5. Each year’s impervious surface ratio (ISR) in each separated region, and their mean and coefficient of variation (as a percentage).
RegionsDateMeanCoefficient of Variation
19972002200720132017
292.8490.6893.2089.9689.6091.261.82
2–395.6494.4697.2990.9292.5794.182.66
3–494.3396.8698.6191.0092.9094.743.21
4–577.9591.9294.2882.3685.7186.447.78
5–648.2776.1179.1970.8675.0069.8917.81
Publisher’s Note: MDPI stays neutral with regard to jurisdictional claims in published maps and institutional affiliations.