Abstract
In recent years, the use of image fusion method has received increasing attention in remote sensing, vegetation cover changes, vegetation indices (VIs) mapping, etc. For making high-resolution and good quality (with low-cost) VI mapping from a fused image, its quality and underlying factors need to be identified properly. For example, same-sensor image fusion generally has a higher spatial resolution ratio (SRR) (1:3 to 1:5) but multi-sensor fusion has a lower SRR (1:8 to 1:10). In addition to SRR, there might be other factors affecting the fused vegetation index (FVI) result which have not been investigated in detail before. In this research, we used a strategy on image fusion and quality assessment to find the effect of image fusion for VI quality using Gaofen-1 (GF1), Gaofen-2 (GF2), Gaofen-4 (GF4), Landsat-8 OLI, and MODIS imagery with their panchromatic (PAN) and multispectral (MS) bands in low SRR (1:6 to 1:15). For this research, we acquired a total of nine images (4 PAN+5 MS) on the same (almost) date (GF1, GF2, GF4 and MODIS images were acquired on 2017/07/13 and the Landsat-8 OLI image was acquired on 2017/07/17). The results show that image fusion has the least impact on Green Normalized Vegetation Index (GNDVI) and Atmospherically Resistant Vegetation Index (ARVI) compared to other VIs. The quality of VI is mostly insensitive with image fusion except for the high-pass filter (HPF) algorithm. The subjective and objective quality evaluation shows that Gram-Schmidt (GS) fusion has the least impact on FVI quality, and with decreasing SRR, the FVI quality is decreasing at a slow rate. FVI quality varies with types image fusion algorithms and SRR along with spectral response function (SRF) and signal-to-noise ratio (SNR). However, the FVI quality seems good even for small SRR (1:6 to 1:15 or lower) as long as they have good SNR and minimum SRF effect. The findings of this study could be cost-effective and highly applicable for high-quality VI mapping even in small SRR (1:15 or even lower).
1. Introduction
Image fusion has received increasing attention as simultaneous purchase of a PAN and MS image from a high-resolution satellite is usually very costly [1]. It is also necessary as many sensors acquire information about the Earth in either only PAN (EROS-A, EROS-B, Worldview-1) or only MS (Rapid Eye) mode [2]. Image fusion has many applications in different fields like remote sensing [3], urban sprawl monitoring, coastal mapping [4], land cover change detection [5], land use classification [6], crop monitoring [7], land use classification on flood areas [8], changes in vegetation cover [9], and vegetation indices [10,11]. A high-resolution and good-quality VI mapping is necessary [1] for monitoring the earth’s vegetative cover as a precise radiometric measure of green vegetation [12]. Such high-resolution VIs derived from satellite images area useful data source for many agricultural, environmental, and climate studies [13]. An image with high quality is preferred for analysis and other applications [3]. However, it is important to assess the quality of the fused image before using it for various applications of remote sensing like VI mapping [14].
Recently, many image fusion algorithms have been developed; for example, the sparse images fusion algorithm (named as Sparse FI, pronounced as “sparsify”) has super-resolution capability and robustness of sparse signal reconstruction algorithms, which gives a higher spatial resolution and, in most cases, less spectral distortion compared with the conventional methods [15]. Similarly, Liu et al. [16] proposed a convolutional sparse representation (CSR)-based image fusion framework, in which each source image is decomposed into a base layer and a detail layer, for multi-focus image fusion and multi-modal image fusion which outperform the SR-based methods in terms of both objective assessment and visual quality. To recover the original information covered by the clouds and the accompanying shadows, a nonnegative matrix factorization (NMF) and error correction method (S-NMF-EC) is proposed [17]. Li et al. [18] also proposed a new algorithm, applied to a reflectance product and a land surface temperature product, in which a qualitative visual effect and the quantitative objectives are effective. However, there are several popular image fusion algorithms which also have good spectral characteristics preservation, and are frequently used in many image fusion applications like GS [6,19,20], Ehlers [21], Principal Component (PC) [6,22,23,24], Modified Intensity Hue Saturation (MIHS) [25,26] and HPF [22,23].
Commonly used image fusion techniques generally produce good results with a standard SRR (ratio of PAN resolution to MS resolution) of 1:4 for images obtained from the same sensor [27]. Ehlers, 2008 [28] showed that SRR can get worse if data from different satellites are used; for example, SRR between IKONOS and SPOT 5 (multispectral mode) is 1:10. Ling et al. [29]’s experimental results indicated that SRR of 1: 10 or higher is desired for optimal multisensory image fusion and also indicated that with decreasing SRR, the fused image quality decreases. However, they were focused on fused image quality, not FVI quality. VIs involve further image transformations of the fused image bands, which can have additional impacts on their spectral and spatial quality, so it is necessary to evaluate the effects that these further transformations have on the fused imagery [13]. Image quality must be inferred from measurements of spatial resolution, calibration accuracy, SNR, contrast, bit error rate, sensor stability, and other factors [30]. This indicates that in addition to SRR, there are other factors which need to be identified to study the effect of image fusion on VI quality properly and to evaluate the relationship between SRR and FVI quality. Only a few studies have evaluated the effects of image fusion methods on VIs quality. For example, Rahaman et al. [31] calculated vegetation greenness and canopy moisture indices at 15 m spatial resolution and validated using their equivalent-values at a spatial resolution of 30 m. Similarly, Brain J. 2014 [13] performed four pansharpening methods and two VIs, Normalized Difference Vegetation Index (NDVI) and Simple Ratio (SR) to analyze the effect. Both researchers were limited to the same sensor fusion (with large SRR); they used Landsat PAN and MS bands to derive 15 m FVI and evaluated their result briefly without considering multi-sensor fusion with different SRF, SNR.
Some past studies have used image fusion methods for VI mappings, like Landsat imagery to spatially downscale 250 m resolution MODIS VI data [32,33]. It has become more significant for researchers to have higher resolution imageries to calculate several vegetation indices since the spectral resolution of the PAN band spans 0.503–0.676 µm with clearly no overlap with the blue, and NIR spectral bands in Landsat-8 OLI satellite platform (operating since February 2013) [31]. The daily surface reflectance products (MOD09GA) at a spatial resolution of 500 m, captured from the MODIS sensor, were used along with the Landsat-8 OLI data to generate a 30-m resolution synthetic image [34]. A new index defined by El-mezouar et al. [1] proposed high-resolution NDVI = (Fused NIR-Fused R)/(Fused NIR + Fused R) which was a good solution in introducing the spatial resolution in computation of the NDVI and showed less confusion in the vegetation detection tested in IKONAS imagery. Similarly, the vegetation changes in the Zayandeh-rud river basin in the period 2001 to 2016 have been investigated based on the combination of the 15 different vegetation indices [9].
It can be seen that many image fusion algorithms and satellite images are used for VI mapping in different application areas. Most of them were focused on making a high-resolution FVI map using same-sensor fusion or multi-sensor fusion using Landsat and MODIS imagery, but not focused on many satellite images (like GF1, GF2, GF4, Landsat-8 OLI, MODIS etc.) and could not explain what happens to the quality when SRR is lower than 1:10 (SRR between GF2 to GF4 is 1:12, IKONAS to SPOT 4 is 1:20), also missing the sensitivity analysis of VI with image fusion and different factors affecting FVI quality. To address this research gap, our main objective was to study the effect of image fusion for the quality of VI mapping. To meet the main objective, we were focused on 1) analyzing the sensitivity of VI with image fusion 2) selecting fusion method with least impact on FVI quality 3) finding out factors of FVI quality and 4) evaluating how SRR and FVI are inter-related. We made a strategy on image fusion and quality assessment for different satellite images; GF1, GF2, GF4, Landsat-8 OLI and MODIS using their PAN and MS bands in different SRR (1:6 to 1:15) using both same-sensor and multi-sensor fusion. Five popular image fusion methods and six VIs were used with subjective and objective quality indices to analyze the result properly.
2. Materials and Methods
2.1. Study Area
We chose the research area located in Hebei province, China. It is located in the western part of Beijing and covers some area of the Guanting reservoir. The reservoir was created by building a dam on Yongding river (drainage area 43402 sq. km) near the town of Guanting and covers areas in the Inner Mongolia Autonomous Region, Beijing, and the provinces of Shanxi and Hebei [35]. However, we used the extent of the study area ranging from 40°15’54"N to 40°30’55"N latitude and 115°26’13’’E to 115°47’13"E longitude with a total area of approximately 155 sq. km which covers mostly forest areas along with river, roads and built-up areas (Figure 1).
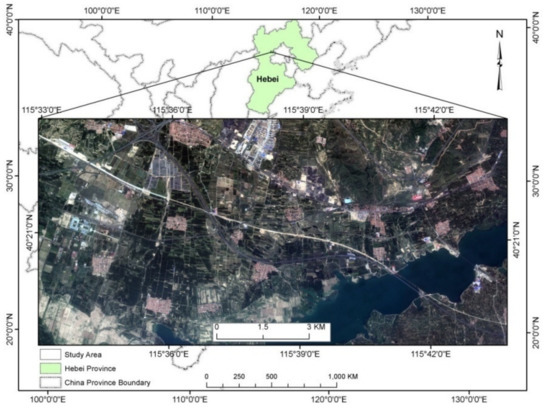
Figure 1.
Location of study area.
2.2. Methodology
This research methodology can be described in three sections: first, image registration, second, FVI calculation and third, quality assessment. The overall methodology involves image acquisition, pre-processing, bringing into a same coordinate system, image registration, image fusion algorithms selection, VI selection, quality assessment and comparative fusion result and analysis. The details are described after the methodology chart (Figure 2).
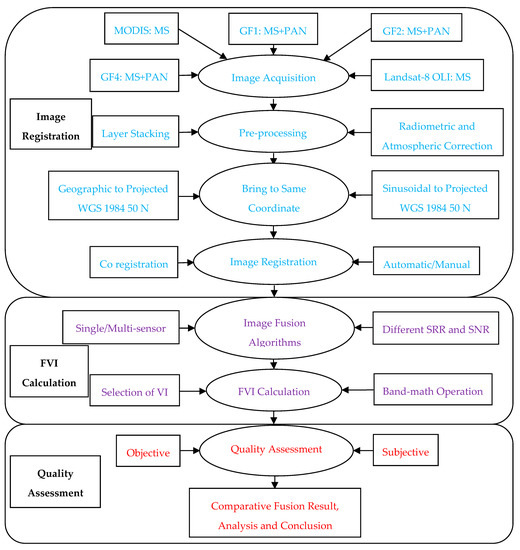
Figure 2.
Methodological flow chart of research.
2.2.1. Image Acquisition
We used a total of 9 (PAN images 4 and MS images 5) scenes from different satellite images. We downloaded the Landsat-8 OLI MS, PAN and Moderate Resolution Imaging Spectroradiometer (MODIS) MS images from the United States Geological Survey’s (USGS) web portal (https://earthexplorer.usgs.gov/). The GF1, GF2 and GF4 MS and PAN images were downloaded from Earth Observation Portal (EOP) (https://directory.eoportal.org/web/eoportal/). As long as the time-lag is small with respect to the time scale of the variations in small-size features, its influence upon the quality of the transformation of the spectral content when enhancing the spatial resolution is low or negligible [36]. Thus, GF1, GF2, GF4 and MODIS images were acquired on the same date, 13 July 2017, but Landsat-8 OLI images were not available on the same date so they were acquired on 17 July 2017 (after four days). All the images were selected carefully (cloud and snow-free) to ensure better image quality. The details of different resolutions, imager types, selected MS and PAN bands with their corresponding spectral ranges are listed in Table 1.

Table 1.
Different images used for the research.
2.2.2. Pre-processing
The MOD09GA Version 6 product provides an estimate of the surface spectral reflectance of Terra MODIS Bands 1 through 7, corrected for the atmospheric condition such as gases, aerosols, and rayleigh scattering [37]. However, we only used four bands (Table 1) with the 500 m surface reflectance observation [38]. Hence, no more correction is necessary for MODIS multispectral product. The GF1, GF2, GF4 and Landsat-8 OLI images were atmospherically corrected using Fast Line-of-sight Atmospheric Analysis of Hypercube (FLAASH) module in ENVI 5.3 software to obtain surface reflectance [39].
2.2.3. Same Coordinate System
As the MODIS image was in a sinusoidal projection system, Landsat-8 OLI was in the projected coordinate system and GF1, GF2, GF4 were in geographic coordinate system WGS 1984 50N (latitude/longitude format). For fusion purposes, all imagery were brought into the same coordinate system, i.e., WGS 1984 50N in projected format.
2.2.4. Image Registration
Image registration is a crucial and fundamental problem in image processing and computer vision, which aims to align two or more images of the same scene acquired from different views or at different times [40]. Precise image registration is essential for image fusion; especially for pixel-based image fusion, the impact of image registration is very high. Feng et al. [41] developed a two-step algorithm combining and localizing the feature and area-based methods to align remote sensing images. Automatic image registration is the process of aligning two or more images of approximately the same scene with minimal human assistance [42]. The steps were first, selecting files for image registration, second, generating tie points automatically and third, reviewing tie points and exporting image registration results [43].Considering all these ideas, automatic tie points were generated and manually added in between warp image and base image carefully to get precise registration before fusion activities started.
2.2.5. Selection of Image Fusion Algorithms
For the image fusion experiments, five popular image fusion algorithms were selected based on their relative advantages found in different types of literature, as listed in Table 2. Interestingly, they are also available in commercial software packages like ENVI and ERDAS Imagine. Thus, they can be used easily for many applications.
Table 2.
Different image fusion algorithms for the research.
2.2.6. Selection of VI
Some popular VIs selected in this research are presented in Table 3. Four bands were selected for image fusion to check the quality of image fusion, including Blue (459-479 nm), Green (530–590 nm), Red (640–670 nm) and Near Infrared (850–880 nm), for all MS satellite images. These spectral bands were used in this study as their combinations are good for calculating different VIs. These bands are also commonly used to calculate VIs such as ARVI, Enhanced Vegetation Index (EVI), GNDVI, NDVI, Optimized Soil Adjusted Vegetation Index (OSAVI ) and Soil Adjusted Vegetation Index (SAVI). They are chosen in such a way that they will contain different bands in their VI equation (Table 3). For example, some vegetation indices like NDVI, OSAVI and SAVI have mainly R and NIR bands in their equations. However, EVI and ARVI have NIR, R and B bands in VI equations, and GNDVI has NIR and G bands in VI equation. In our strategy, RVI and FVI are calculated through band math operation from reference MS and fused MS images using the following VI equations (Table 3).
Table 3.
Different VI for the research.
2.2.7. Strategy on Image Fusion and Quality Assessment
Only the selection of image fusion algorithms, VIs and quality indices is not sufficient to analyze the effect of image fusion on VIs properly, so one strategy was made, as shown in Table 4. In this strategy, we included both same-sensor and multi-sensor image fusion with different SRF, SRR and SNR to analyze the result in detail. Different resolutions PAN and MS images were strategically fused, making the same SRR and different SRR, same SRF and different SRF, good SNR and poor SNR to analyze their effects properly. RVI was calculated using band math operation in different resolutions 1 m, 4 m, 8 m and 50 m from respective original or resampled reference MS images (Table 4).
Table 4.
Strategy for image fusion and quality assessment.
In same-sensor fusion (GF2 to GF2), as GF2 has 1 m PAN and 4 m MS images, we resampled 4 m MS image into 1 m, 6 m, 8 m, 10 m and 12 m resolutions. Then, we fused a 1 m PAN image with 6 m, 8 m, 10 m and 12 m MS images to get a fused MS image in 1 m resolution, making 1:6, 1:8, 1:10 and 1:12 SRR, respectively. Then, we calculated different FVI (1 m) from fused MS images (1 m) and RVI (1 m) from resampled MS image (1 m) to evaluate the quality. In multi-sensor fusion, for example, in GF1 to GF4, we have GF1 (PAN 2 m and MS 8 m) and GF4 (MS 50 m). Thus, we resampled 2 m PAN into 8 m PAN to make the same resolution for MS and PAN images, fused the image, calculated FVI (8 m) and evaluated the quality with RVI (8 m calculated from original 8 m MS image). Similarly, we made a detailed strategy for all RVI and FVI, as mentioned in Table 4. To evaluate the result, we need quality indices like root mean square error (RMSE), which is a square root of MSE [25]; it is a standard measure of the difference between the reference image and the fused image. The greater the RMSE, the higher the difference between reference and the fused image will be [24,50]. RMSE calculates the amount of change per pixel due to processing. Similarly, the value of correlation coefficient (CC) should be close to +1, which indicates that the reference and fused images are the same. Variation increases when the value of CC is lower [14]. Assessment of objective quality (CC and RMSE) [48] and a variety of visual inspections [26] is necessary for analyzing the effect of image fusion properly.
3. Results
3.1. Single Sensor FVI Quality (Using Resampling)
Single-sensor (GF2 PAN+GF2 MS) FVI quality was tested according to the strategy in Table 4. The original GF2 has a 1 m PAN and a 4 m MS image, so we resampled the 4 m MS image into 6 m, 8 m, 10 m and 12 m MS images so that our SRR became 1:6, 1:8, 1:10 and 1:12 respectively. We fused the 1 m PAN image with 6 m, 8 m, 10 m and 12 m MS images, and calculated FVIs. To evaluate the quality of FVIs, we need RVI in same resolution (i.e., 1 m), but we have an original 4 m MS image. To get 1 m RVI, we again resampled the original 4 m MS image into a 1 m MS image and calculated the RVI, then we compared and evaluated the quality of FVI with respect to RVI using quality indices. All the FVI quality results are expressed in % so that its precise numeric value can be listed. The result for GS fusion has CC (98.85 to 99.05%), RMSE (10.06 to 13.50%) for SRR 1:6, CC (98.93 to 99.08%), RMSE (12.00 to 13.54%) for SRR 1:8, CC (97.39 to 98.73%), RMSE (10.81 to 14.66%) for SRR 1:10 and CC (98.17 to 98.59%), RMSE (12.77 to 15.78%) for SRR 1:12. Similarly, the detailed result of GS, Ehlers, PC, MIHS and the HPF fusion result for different VIs are listed in Table 5. In GF2-GF2 fusion, for most of the VIs like EVI, NDVI, OSAVI and SAVI; GS fusion has a lower effect on FVI quality (high CC and low RMSE values). However, in SRR, 1:6 and 1:8, for ARVI and GNDVI, MIHS fusion is good. However, for GNDVI and ARVI, GS fusion has a better position after MIHS (Table 5). It also shows the range of CC and RMSE values in different SRR and different fusion algorithms (Table 5).
Table 5.
Quality of FVI result in single-sensor fusion (values in bold font indicate good quality).
3.2. Multi-Sensor FVI Quality (Using Real Image)
Different types of image and feature fusion exist like multi-sensor, multi-resolution, multi-temporal, multi-angular, and model-based feature fusion [51]. Image fusion can be applied both to data collected from different sensors (inter-sensor), or from the same sensor (intra-sensor), as well as to data collected at the same time under the same conditions (single-dated) or at different dates (multi-date) [26]. We have already found a single-sensor fusion result in Table 5; our result of multi-sensor fusion are calculated and listed in Table 6.
Table 6.
Quality of FVI result in multi-sensor fusion (values in bold font indicate good quality).
For GF1 (PAN) to GF4 (MS) fusion with SRR 1:6, in ARVI objective quality (CC, RMSE) is 84.27%, 33.97% for GS fusion which is better (higher CC and lower RMSE) than other fusion methods. For EVI, GNDVI, NDVI, OSAVI and SAVI, Ehlers fusion has higher CC but GS has lower RMSE but the value of CC for GS is very close to the Ehlers method. The result for GS fusion has CC (89.57 to 92.56%), RMSE (21.35 to 29.56%) for SRR 1:8, CC (79.46 to 89.93%), RMSE (22.86 to 33.74%) for SRR 1:10 and CC (88.24 to 91.75%), RMSE (24.86 to 34.67%) for SRR 1:12. Similarly, the detailed result of GF1 (PAN)+GF4 (MS), GF2 (PAN)+Landsat-8 OLI (MS), GF4 (PAN)+MODIS (MS) for GS, Ehlers, PC, MIHS and HPF algorithms for FVI is listed in Table 6. In multi-sensor fusion, most of the VIs in SRR 1:6 (GF1+GF4) and 1:10 (GF4+MODIS), the quality of FVI result is inconsistent with fusion algorithms.
3.3. Multi-Sensor FVI Quality (Resampled)
One further experiment was made by fusing GF2 PAN (4 m) with Landsat-8 OLI MS (30 m, 40 m, 48 m and 60 m) using resampling technique to get 1:8, 1:10, 1:12 and 1:15 SRR respectively. The corresponding FVI was compared with RVI (4 m) from the GF2 MS image (calculated from its 4 m original MS bands) and the result is listed in Table 7.
Table 7.
Quality of FVI result in multi-sensor fusion (values in bold font indicate good quality).
We found the result of GF2 (PAN 4 m) fusion with Landsat-8 OLI MS (30 m) in SRR 1:8 in the previous section (Table 6). Thus, from this new fusion, we analyzed continuous FVI quality with different SRR. The result for GS fusion has CC (88.92 to 92.11%), RMSE (21.84 to 30.58%) for SRR 1:10, CC (88.59 to 92.54%), RMSE (22.10 to 30.79%) for SRR 1:12 and CC (88.19 to 92.40%), RMSE (22.30 to 31.32%) for SRR 1:15. Similarly, the detail fusion result for GS, Ehlers, PC, MIHS and HPF algorithms for FVI is listed in Table 7. It shows that both CC and RMSE values are consistent and uniform for all image fusion algorithms in SRR 1:8 to 1:15 but HPF has a lower quality (Table 7).
3.4. Visual Quality Evaluation
Subjective evaluation is evaluating the quality of the images with the naked eyes and making judgments according to the subjective feelings of image quality [22]. In this analysis, a team of observers compared the fused image with the input images and valued the quality of the fused image by employing various optical parameters such as spatial details, geometric pattern, size of objects, and color [14]. The subjective evaluation method is simple and intuitive, and it can make a quick and convenient evaluation of the images [22]. For visual quality evaluation, we need a good RVI with the same spatial resolution of FVI, which would only give proper judgment, as we already calculated FVI and RVI in different resolutions during objective quality evaluation in previous section. Then, we compared them with their visual quality for different features in different parts of the images.
A total of 384 VI maps were prepared, including 360 FVI (6 VIs @ 5 fusion algorithms @ 4 SRR @ 3 types of image fusion) maps and 24 RVI maps (6 GF2 (1 m) + 6 GF1 (8 m) + 6 GF2 (4 m) +6 GF4 (50 m)). Due to such large numbers, individually, it is difficult to show their visual quality, so subjective quality was analyzed in different parts of the images selectively. To analyze the FVI quality more clearly, water area, forest areas, built-up areas, lakes, roads, etc., were compared with their respective RVI. Different image fusion algorithms showed different influences on different VIs. Some image fusion algorithms had a good performance at the edges and some had good results in vegetation areas, rivers, etc. The following table (Table 8) shows the visual quality of FVI results from same-sensor, multi-sensor and multi-sensor resampled abbreviated as Same-Sen., Multi-Sen. and Multi-Sen(R), respectively.
Table 8.
Visual quality of FVI result in single/multi-sensor fusion.
The visual quality analysis was based on a selective way to include different FVI maps for all types of image fusion. For example, the same-sensor FVI result is shown for ARVI, NDVI and OSAVI for SRR 1:6 and 1:8 and multi-sensor FVI results are shown for EVI, GNDVI and SAVI in GF1 PAN (8 m) with GF4 MS (50 m) in SRR 1:6, GF2 PAN (4 m) with Landsat-8 OLI (30 m) in SRR 1:8. In SRR 1:6, the same-sensor FVI results are very similar in color, texture and shape. The roads, rivers, built-up, forest areas in FVI are very similar to RVI. For the images acquired at the same time by the same sensor, most algorithms for pan-sharpening provide very good results, i.e., they retain the high spatial resolution of the panchromatic image and the spectral information from the multispectral image (single-sensor, single-date fusion) [2]. For multi-sensor fusion in SRR 1:6, EVI shows the river area well but not the built-up areas. Moreover, GNDVI shows that some fusion algorithms have good results for edge detection like PC but not good for built-up areas. Ehlers does not have a good result for road detection. However, the GS method has a better visual quality than the other methods for these features (Table 8).
Some VIs (ARVI, NDVI and OSAVI) have a very similar visual quality with their corresponding RVI in single-sensor fusion with SRR 1:8. However, other VIs (EVI, GNDVI and SAVI) have a better quality for all features in multi-sensor fusion with SRR 1:8. Same-sensor fusion still has a good visual quality in SRR 1:10 like in SRR 1:6 and SRR 1:8. However, in multi-sensor fusion, for GF4 PAN(50 m) with MODIS MS (500 m) fusion, the visual quality is degraded. In EVI and OSAVI, the size and boundary of the river are not properly mapped and other details are also very poor. Thus, we made other multi-sensor fusion by resampling the Landsat-8 OLI image. NDVI and SAVI have a better visual quality for built-up, road, river and forest areas. In SRR 1:12, the same-sensor FVI has a good visual result. In SRR1:12, for multi-sensor fusion, GF2 PAN (4 m) with GF4 MS (50 m), the quality slightly improved compared to SRR 1:10. EVI and OSAVI showed a better visual quality for the GS and PC methods (Table 8).
4. Discussion
4.1. Quality Assessment
Ren et al. [52] indicated that sometimes, the visual effect and the objective result can be different. To assess this, we made qualitative and quantitative evaluations in our research. Ehlers, 2008, showed that SRR can get worse [28] if data from different satellites are used; for example, SRR between IKONOS and SPOT 5 (multispectral mode) is 1:10, for SPOT 4 even 1:20, as mentioned in the Section 1. The SRR varies with different multi-sensor fusions and their quality assessment is always important to find out. As image fusion has proven to be a potential tool in remote sensing applications which integrates the information from combinations of panchromatic, multispectral and hyperspectral images; this is intended to result in a composite image having both higher spatial and higher spectral resolutions [53]. We show the FVI quality results (subjective and objective) from different satellite images GF1, GF2, GF4, Landsat-8 OLI and MODIS in the previous Section 3. The fusion quality often depends on the user’s experience, the fusion method, and on the dataset being fused [54]. Thus, our fusion strategy (Table 8) was very carefully prepared, including different resolutions, SRF, SNR and SRR and also carefully performed. Almost the same date images (Landsat-8 OLI on 2017/07/17 and others on 2017/07/13) were used on a clear-sky day with favorable weather conditions during the dry season to get a better fusion result [34].
4.2. Influence of SRR (with Same SRF and Good SNR)
In Section 3, we found that single-sensor fusion has a good visual quality for VI. For objective quality, the pattern was almost uniform for CC for all fusions, and RMSE was quite different for different image fusions and VIs. However, the general trend is that by increasing SRR, the CC graph is falling slowly and the RMSE graph is increasing slowly (Figure 3). This good quality might be due to the high-resolution PAN (1 m) and MS (6,8,10,12 m) images, the good SNR and the same SRF. The CC and RMSE values are almost the same for all image fusion methods, which indicates that image fusion is insensitive with VI. However, the HPF has a scattered graph and seems to be sensitive. ARVI and GNDVI have quite low RMSE values and are well separated in all image fusion algorithms and all SRR. However, CC seems to be almost the same for all VI and are almost overlapped. Vibhute et al. [55] found that the GS spectral sharpening algorithm gives better results than PC spectral sharpening, according to the classification results. Similarly, in our result, the GS fusion has a good quality (low RMSE and high CC) for all VIs in all SRR (1:6 to 1:12) (Figure 3). In reality, such same-sensor fusion does not exist in such large SRR (1:6 to 1:12). We did this arbitrary image fusion to analyze how much SRF and SRR could affect the fusion result as long as there is good SNR between PAN and MS images. In general, the FVI quality is decreasing with decreasing SRR very slowly as long as there is a good SNR and a minimum SRF effect (Figure 3).
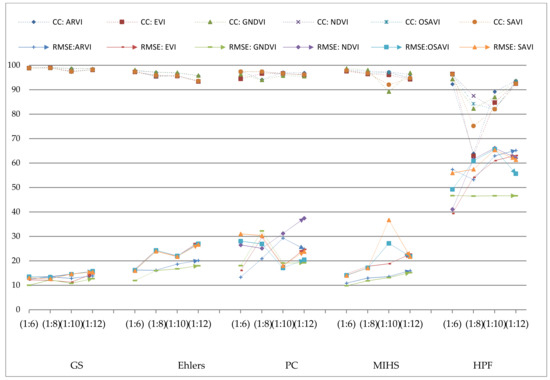
Figure 3.
Trend of FVI quality with Image Fusion and SRR (same SRF and good SNR).
4.3. Influence of SRR (with different SRF and SNR (Good to Poor))
Multi-sensor fusion showed different visual quality for different algorithms for different VI (Table 4). Some image fusion algorithms had a good visual result in preserving all types of details and some algorithms did not. In the objective quality results, the pattern was fluctuating (both CC and RMSE) (Figure 4) depending on SRR, SRF and SNR. For SRR 1:6 in GS fusion, for ARVI CC is 84.27% and RMSE is 33.97% but when the SRR is 1:8, for ARVI CC is 92.56% and RMSE is 22.59% (Table 6), remaining VI has a similar trend (Figure 4). With decreased SRR, the image fusion accuracy was assumed to be decreased but the result showed an increased accuracy(better quality). This might be due to two reasons: one is the difference in SRF and the other is the resolution of the MS image. Belgiu and Stein [56] indicated that for fusing spatiotemporal images, spectral responses of input images have to be unified, so the difference in SRF between two sensors has an impact on the quality of FVI. In SRR 1:8; the MS image has a 30 m resolution and PAN image has a 4 m resolution which is a better resolution than SRR 1:6 (PAN (8 m) with MS (50 m)). SRR 1:10 fusion is the result of a low-resolution PAN (50 m) image and a very low-resolution MS (500 m) images. The SNR is a measure of the purity of a signal, the ratio between the information and noise of the fused image [57]. MODIS (500 m) and GF4 (50 m) has very low resolution; both of them have poor SNR, so FVI quality is poor for them. The influence of SRF is also prominent along with SNR for multi-sensor FVI. However, the SRR effect is not very high. The visual analysis showed that FVI has a different quality depending on its SRF, SNR and SRR (Table 8). Not only does GS have a good result but also Ehlers has a good result for ARVI and their quality indices are very close. This shows that very low-resolution image fusion has inconsistent results due to poor SNR. For SRR 1:12 in GS fusion; for ARVI CC is 91.59% and RMSE is 25.25% (Table 6) which is a better result than SRR 1:6, although it has a higher SRR than 1:8 and 1:10. The reason might be the same, due to the high-resolution (4 m) PAN image used in SRR 1:12, although it has lower SRR. Not only does GS fusion have this trend for VI mappings but all the remaining fusion methods have the same pattern for all FVI (Figure 4). We changed the fusion algorithms (keeping same VI) but the CC values are very close to each other. Similarly, the change in image fusion algorithms did not make a large difference in RMSE values. This indicates that image fusion is insensitive to VI (i.e., change in image fusion algorithms did not make a large difference in VI quality). However, the HPF has a scattered graph and seems to be sensitive. ARVI and GNDVI have quite lower RMSE, high CC values so they are well separated in all image fusion and in all SRR (Figure 4). However, for other VI (except ARVI and GNDVI), CC and RMSE, the graph is almost same and overlapped. The GS pan-sharpen method has become one of the most widely used high-quality methods since its publication [20]. In multi-sensor FVI, also the GS fusion has a good quality (low RMSE and high CC) for all VI and in all SRR. In general, the quality of FVI is decreasing with decreasing SRR (1:6 to 1:12). However, the higher effect on FVI quality is due to SNR and SRF rather than SRR (Figure 4).
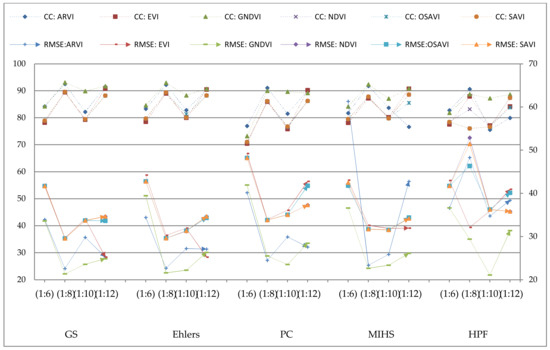
Figure 4.
Trend of FVI quality with Image Fusion and SRR(Different SRF and SNR (Good to Poor)).
4.4. Influence of SRR (with constant SRF and Good SNR)
One further experiment was made to check the pattern of FVI properly. GF2 PAN (4 m) is fused with Landsat-8 OLI MS (30 m, 40 m, 48 m and 60 m). In GF2 to Landsat-8 OLI (30 m, 40 m, 48 m and 60 m) fusion, there is a uniform relationship between SRR and FVI quality (CC and RMSE) for ARVI (92.56%, 22.59%), (92.11%, 23.05%), (91.88% and 23.43%) and (91.17% and 23.45%) in SRR 1:8, 1:10, 1:12 and 1:15 respectively (Table 7). By increasing SRR from 1:8 to 1:15; all image fusion techniques showed a uniform result (Figure 5). This uniformity could be due to the constant SRF (Landsat-8 OLI and GF2) and better SNR than the previous multi-sensor fusion. However, the HPF still has a lower quality and seems to be sensitive. ARVI and GNDVI have quite lower RMSE, high CC so they are well separated in all image fusion and all SRR (Figure 5). However, for other VI (except ARVI and GNDVI), the CC and RMSE graph is almost same and overlapped (except for HPF). The quantitative evaluation results show that the brightness and information retention of GS fusion image was the best [52]. In the fusion of the near-infrared band, the GS method can be considered as the best [58]. All VI equations contain at least one NIR band and GS fusion has a good result in NIR band which might be the result behind the good quality (low RMSE and high CC) in all FVI and for all SRR. In general, the quality of FVI is decreasing with decreasing SRR (1:8 to 1:15) (Figure 5).
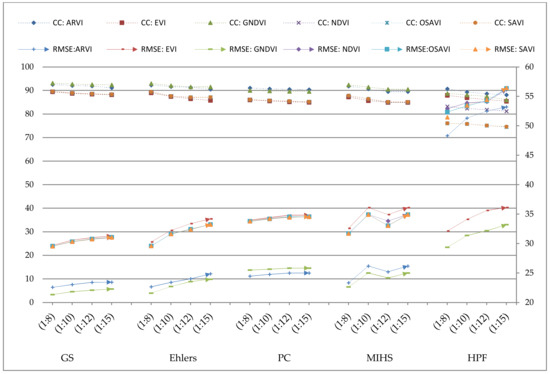
Figure 5.
Trend of FVI quality with Image Fusion and SRR (Constant SRF and Good SNR).
However, if we compare all three figures (Figure 3, Figure 4 and Figure 5) together, we find that the higher effect on FVI quality is due to SNR and SRF rather than SRR. With decreasing SRR (keeping the effect of SRF and SNR minimum), the quality decreases at a very slow rate. The VI having R and NIR bands in their VI equations has a similar pattern. Their CC and RMSE are almost identical (NDVI, OSAVI, SAVI, EVI) with a similar pattern (Figure 5). The remaining VI, including other bands in their VI equation (B and G bands), has also a similar pattern. The CC and RMSE values have a similar pattern for ARVI and GNDVI but different from NDVI, OSAVI, SAVI and EVI. In short, ARVI and GNDVI have the least impact in all cases with all fusion methods. In general, image fusion seems to be insensitive with VI and SRR. The HPF seems to be sensitive with VI and SRR. However, this indicates that the influence of SRF and SNR is higher than SRR.
4.5. Limitations and Possible Future Study
We used GF1, GF2, GF4, Landsat-8 OLI and MODIS satellite images for our research, but still, it could be better if more satellite images like Sentinel-2, World View-4, IKONAS, SPOT were used for strategic image fusion. Our fusion result was focused on one season, that is, 2017 July 13 (for GF1, GF2, GF4 and MODIS imagery) and 2017 July 17 (for Landsat-8 OLI image) to compare and analyze the result, but it would be much better if we had used different satellite images in different seasons. Similarly, further investigation of FVI quality using more VI like AFRI, GLI, NGRDI, RVI, TVI etc. [9] could give more detail results. We were limited to five (GS, Ehlers, PC, MIHS and HPF) image fusion algorithms but NNDiffuse [59] and other algorithms could be used to investigate the result in a better way. Besides CC and RMSE, there are other quality indices like PSNR [50], entropy [14], and SSIM [60] which can give more quality results and a more robust conclusion. Similarly, in the future, we can use combined bands from different fusion methods (NIR from GS and R, G, B bands from PC or Ehlers and MIHS fusion) depending on their degree of goodness for each band to get a better FVI quality.
5. Conclusions
Many image fusion techniques have developed and applied in various field but the quality assessment is always a key factor before their application. As a preliminary work towards image fusion, different satellite images (GF2, GF1, Landsat-8 OLI, GF4 and MODIS) with PAN and MS bands were acquired, preprocessed and precisely registered. The main objective of this research was to study the effect of image fusion for the quality of VI mapping. Using a strategy of image fusion and quality assessment (in different SRR, SRF and SNR) we came to a robust conclusion. First, image fusion has the least impact on GNDVI and ARVI compared to other VI. The quality of FVI is mostly insensitive to image fusion. However, for HPF, the quality of FVI is sensitive. Second, the value of CC and RMSE shows that the GS method has the least impact on FVI quality. For example, ARVI in GF1-GF4 with CC and RMSE (84.27%, 33.97%), GF2-Landsat-8 OLI (92.56%, 22.59%), GF4-MODIS (82.20%, 28.94%) and GF2-GF4 (91.59%, 25.25%) proves that GS has a better quality in FVI. Third, some factors affect FVI results; they are SRF, SRR and SNR. For example, in GF1-GF4 (SRR 1:6), the influence of image fusion is higher than GF2-Lansat-8 OLI (SRR 1:8) and GF2-GF4 (SRR 1:12) due to the SNR factor. Moreover, GF4-MODIS (SRR 1:10) fusion has a quite different result due to the poor SNR. Fourth, with decreasing SRR, the FVI quality is decreasing at a slow rate. For example, in GF2 to Landsat-8 OLI (30 m, 40 m, 48 m and 60 m) fusion, there is a uniform relationship between SRR and FVI quality (CC and RMSE) for ARVI (92.56%, 22.59%), (92.11%, 23.05%), (91.88% and 23.43%) and (91.17% and 23.45%) in SRR 1:8, 1:10, 1:12 and 1:15, respectively.
Hence, this research shows how image fusion influences VI quality with a critical analysis. The research confirms that the quality of FVI is good even for small SRR (1:6 to 1:15) as long as they have a minimum SRF effect and a good SNR. It would be very helpful for making high-resolution VI map using a lower SRR (not limited to SRR 1:8 or higher) in different applications like agricultural, environmental, and climate studies. Even in small SRR, VI mapping has a good quality, which means we can use high-resolution PAN with low-resolution MS band for image fusion to get high-resolution MS bands to calculate FVI. Although the PAN band should have a high resolution, we can use low-resolution MS bands to get high-resolution MS band and FVI, which will minimize the cost for data acquisition. However, the use of a higher number of fusion algorithms, more VI and more quality indices could give a better result for a comparative FVI quality analysis. Similarly, testing the result in different images like Sentinel-2, World View-4, IKO NAS, SPOT and making a decision could have a better result. In the future, minimizing these limitations, and the developing image fusion algorithms with the least effect on SRR, SRF and SNR for band–band fusion and FVI could be new research topics to gain a better quality FVI.
Author Contributions
P.G. and D.L. designed and developed the research idea. N.J. downloaded the data (GF1, GF2 and GF4) and pre-processed. P.G. downloaded and processed all remaining data and wrote the manuscript. P.G. and D.L. contributed to result and data interpretation, discussion and revision of the manuscript. All the authors revised and approved the manuscript. All authors have read and agreed to the published version of the manuscript.
Funding
This research was funded by the National Key Research & Development Program of China (no.2018YFC0706004).
Acknowledgments
The authors are very thankful for Ms Zou Han Yue and Ms Qiao Dan Yu for their valuable support.
Conflicts of Interest
The authors declare no conflict of interest. The funders had no role in the design of the study; in the collection, analyses, or interpretation of data; in the writing of the manuscript, or in the decision to publish the results.
References
- El-mezouar, M.C.; Taleb, N.; Kpalma, K.; Ronsin, J. A high-resolution index for vegetation extraction in IKONOS images. In Proceedings of the SPIE on Remote Sensing for Agriculture, Ecosystems, and Hydrology, Toulouse, France, 22 October 2010; Volume 78242, pp. 1–9. [Google Scholar]
- Ehlers, M.; Klonus, S.; Astrand, P.J.; Rosso, P. Multi-sensor image fusion for pansharpening in remote sensing. Int. J. Image Data Fusion 2010, 1, 25–45. [Google Scholar] [CrossRef]
- Swathika, R.; Sharmila, T.S. Image fusion for MODIS and Landsat images using top hat based moving technique with FIS. Clust. Comput. 2019, 22, 12939–12947. [Google Scholar] [CrossRef]
- Jiang, D.; Zhuang, D.; Huang, Y. Investigation of Image Fusion for Remote Sensing Application. Available online: www.intechopen.com/books/new-advances-in-image-fusion/investigation-of-image-fusion-for-remote-sensing-application (accessed on 2 May 2020).
- Zeng, Y.; Zhang, J.; Genderen, J.L.; Zhang, Y. Image fusion for land cover change detection. Int. J. Image Data Fusion 2010, 1, 193–215. [Google Scholar] [CrossRef]
- Sarp, G. Spectral and spatial quality analysis of pan-sharpening algorithms: A case study in Istanbul. Eur. J. Remote Sens. 2014, 47, 19–28. [Google Scholar] [CrossRef]
- Sagan, V.; Maimaitijiang, M.; Sidike, P.; Maimaitiyiming, M.; Erkbol, H.; Hartling, S.; Peterson, K.T.; Peterson, J.; Burken, J.; Fritschi, F. Uav/satellite multiscale data fusion for crop monitoring and early stress detection. In Proceedings of the The International Archives of the Photogrammetry, Remote Sensing and Spatial Information Sciences, Enschede, The Netherlands, 10–14 June 2019; Volume XLII, pp. 715–722. [Google Scholar]
- Ghimire, P.; Deng, L. Image Fusion Technique: Algorithm to Application. Nepal. J. Geoinform. 2019, 18, 27–34. [Google Scholar]
- Gholinejad, S.; Fatemi, S.B. Optimum indices for vegetation cover change detection in the Zayandeh-rud river basin: A fusion approach. Int. J. Image Data Fusion 2019, 10, 199–216. [Google Scholar] [CrossRef]
- Roy, D.P.; Kovalskyy, V.; Zhang, H.K.; Vermote, E.F.; Yan, L.; Kumar, S.S.; Egorov, A. Characterization of Landsat-7 to Landsat-8 reflective wavelength and normalized difference vegetation index continuity. Remote Sens. Environ. 2016, 185, 57–70. [Google Scholar] [CrossRef]
- Xue, J.; Su, B. Significant Remote Sensing Vegetation Indices: A Review of Developments and Applications. J. Sens. 2017, 2017, 1–17. [Google Scholar] [CrossRef]
- Ahmad, F. Spectral vegetation indices performance evaluated for Cholistan Desert. J. Geogr. Reg. Plan. 2012, 5, 165–172. [Google Scholar]
- Johnson, B. Effects of pansharpening on vegetation indices. ISPRS Int. J. Geo-Inf. 2014, 3, 507–522. [Google Scholar] [CrossRef]
- Jagalingam, P.; Hegde, A.V. A Review of Quality Metrics for Fused Image. In Proceedings of the International Conference on Water Resources, Coastal and Ocean Engineering (ICWRCOE 2015), Mangalore, India, 12–14 March 2015; Elsevier: Amsterdam, The Netherlands, 2015; Volume 4, pp. 133–142. [Google Scholar]
- Zhu, X.X.; Bamler, R. A Sparse Image Fusion Algorithm With Application to Pan-Sharpening. IEEE Trans. Geosci. Remote Sens. 2013, 51, 2827–2836. [Google Scholar] [CrossRef]
- Liu, Y.; Chen, X.; Ward, R.K.; Wang, Z.J. Image Fusion With Convolutional Sparse Representation. IEEE Signal. Process. Lett. 2016, 23, 1882–1886. [Google Scholar] [CrossRef]
- Li, X.; Wang, L.; Cheng, Q.; Wu, P.; Gan, W.; Fang, L. Cloud removal in remote sensing images using nonnegative matrix factorization and error correction. ISPRS J. Photogramm. Remote Sens. 2019, 148, 103–113. [Google Scholar] [CrossRef]
- Li, X.; Shen, H.; Zhang, L.; Zhang, H.; Yuan, Q.; Yang, G. Recovering Quantitative Remote Sensing Products Contaminated by Thick Clouds and Shadows Using Multitemporal Dictionary Learning. IEEE Trans. Geosci. Remote Sens. 2014, 52, 7086–7098. [Google Scholar]
- Laben, C.A.; Brower, B.V. Process for Enhancing the Spatial Resolution of Multispectral Imagery using Pan-Sharpening. U.S. Patent 6011875, 4 January 2000. [Google Scholar]
- Klonus, S.; Ehlers, M. Performance of evaluation methods in image fusion. In Proceedings of the 12th International Conference on Information Fusion, Seattle, WA, USA, 6–9 July 2009; IEEE: Piscataway, NJ, USA, 2009; pp. 1409–1416. [Google Scholar]
- Klonus, S.; Ehlers, M. Image fusion using the Ehlers spectral characteristics preservation algorithm. Giscience Remote Sens. 2007, 44, 93–116. [Google Scholar] [CrossRef]
- Kang, T.; Zhang, X.; Wang, H. Assessment of the fused image of multispectral and panchromatic images of SPOT5 in the investigation of geological hazards. Sci. China Ser. E Technol. Sci. 2008, 51, 144–153. [Google Scholar] [CrossRef]
- Wu, J.; Jiang, P. A complete no-reference image quality assessment method based on local feature. Int. J. Image Data Fusion 2019, 10, 165–176. [Google Scholar] [CrossRef]
- Sahu, D.K.; Parsai, M.P. Different Image Fusion Techniques-A Critical Review. Int. J. Mod. Eng. Res. 2012, 2, 4298–4301. [Google Scholar]
- Jawak, S.D.; Luis, A.J. A Comprehensive Evaluation of PAN-Sharpening Algorithms Coupled with Resampling Methods for Image Synthesis of Very High Resolution Remotely Sensed Satellite Data. Adv. Remote Sens. 2013, 2, 332–344. [Google Scholar] [CrossRef]
- Nikolakopoulos, K.; Oikonomidis, D. Quality assessment of ten fusion techniques applied on Worldview-2. Eur. J. Remote Sens. 2015, 48, 141–167. [Google Scholar] [CrossRef]
- Sekrecka, A.; Kedzierski, M. Integration of Satellite Data with High Resolution Ratio: Improvement of Spectral Quality with Preserving Spatial Details. Sensors 2018, 18, 4418. [Google Scholar] [CrossRef] [PubMed]
- Ehlers, M. Multi-image Fusionin Remote Sensing: Spatial Enhancementvs. Spectral Characteristics Preservation. In Advances in Visual Computing, Proceedings of the 4th International Symposium, ISVC 2008,Part II, Las Vegas, NV, USA, 1–3 December 2008; Bebis, G., Parvin, B., Koracin, D., Boyle, R., Porikli, F., Peters, J., Klosowski, J., Rhyne, T.-M., Ams, L., Chun, Y.K., et al., Eds.; Springer: Berlin/Heidelberg, Germany, 2008; pp. 75–84. [Google Scholar]
- Ling, Y.; Ehlers, M.; Usery, E.L.; Madden, M. Effects of spatial resolution ratio in image fusion. Int. J. Remote Sens. 2008, 29, 2157–2167. [Google Scholar] [CrossRef]
- Zhou, J.; Civco, D.L.; Silander, J.A. A wavelet transform method to merge Landsat TM and SPOT panchromatic data. Int. J. Remote Sens. 1998, 19, 743–757. [Google Scholar] [CrossRef]
- Rahaman, K.R.; Hassan, Q.K.; Ahmed, M.R. Pan-Sharpening of Landsat-8 Images and Its Application in Calculating Vegetation Greenness and Canopy Water Contents. ISPRS Int. J. Geo-Inf. 2017, 6, 168. [Google Scholar] [CrossRef]
- Hwang, T.; Song, C.; Bolstad, P.V.; Band, L.E. Downscaling real-time vegetation dynamics by fusing multi-temporal MODIS and Landsat NDVI in topographically complex terrain. Remote Sens. Environ. 2011, 115, 2499–2512. [Google Scholar] [CrossRef]
- Hassan, Q.K.; Bourque, C.P.-A.; Meng, F.-R. Application of Landsat-7 ETM+ and MODIS products in mapping seasonal accumulation of growing degree days at an enhanced resolution. J. Appl. Remote Sens. 2007, 1, 013539. [Google Scholar] [CrossRef]
- Dao, P.D.; Mong, N.T.; Chan, H.-P. Landsat-MODIS image fusion and object-based image analysis for observing flood inundation in a heterogeneous vegetated scene. Giscience Remote Sens. 2019, 56, 1148–1169. [Google Scholar] [CrossRef]
- He, G.; Fang, H.; Bai, S.; Liu, X.; Chen, M.; Bai, J. Application of a three-dimensional eutrophication model for the Beijing Guanting Reservoir, China. Ecol. Model. 2011, 222, 1491–1501. [Google Scholar] [CrossRef]
- Wald, L.; Ranchin, T.; Mangolini, M. Fusion of satellite images of different spatial resolutions: Assessing the quality of resulting images. Photogramm. Eng. Remote Sens. 1997, 63, 691–699. [Google Scholar]
- Vermote, E.F.; Roger, J.C.; Ray, J.P. MODIS Surface Reflectance User’s Guide. Available online: https://lpdaac.usgs.gov/documents/306/MOD09_User_Guide_V6.pdf (accessed on 5 April 2020).
- Che, X.; Feng, M.; Sexton, J.O.; Channan, S.; Yang, Y.; Sun, Q. Assessment of MODIS BRDF/Albedo Model Parameters (MCD43A1 Collection 6) for Directional Reflectance Retrieval. Remote Sens. 2017, 9, 1123. [Google Scholar] [CrossRef]
- ENVI Atmospheric Correction Module: QUAC and FLAASH User’s Guide. Available online: http://www.harrisgeospatial.com/portals/0/pdfs/envi/flaash_module.pdf (accessed on 2 May 2020).
- Zhang, Z.; Han, D.; Dezert, J.; Yang, Y. A New Image Registration Algorithm Based on Evidential Reasoning. Sensors 2019, 19, 1091. [Google Scholar] [CrossRef] [PubMed]
- Feng, R.; Du, Q.; Li, X.; Shen, H. Robust registration for remote sensing images by combining and localizing feature- and area-based methods. ISPRS J. Photogramm. Remote Sens. 2019, 151, 15–26. [Google Scholar] [CrossRef]
- Murphy, J.M.; Moigne, J.; Le Harding, D.J.; Space, G. Automatic Image Registration of Multi-Modal Remotely Sensed Data with Global Shearlet Features. IEEE Trans. Geosci. Remote Sens. 2017, 54, 1685–1704. [Google Scholar] [CrossRef] [PubMed]
- Jin, X. ENVI Automated Image Registration Solutions. Available online: https://www.harrisgeospatial.com/portals/0/pdfs/ENVI_Image_Registration_Whitepaper.pdf (accessed on 5 April 2020).
- Kaufman, Y.J.; Tanre, D. Atmospherically Resistant Vegetation Index (ARVI) for EOS-MODIS. IEEE Trans. Geosci. Remote Sens. 1992, 30, 260–271. [Google Scholar] [CrossRef]
- Huete, A.; Didan, K.; Miura, T.; Rodriguez, E.P.; Gao, X.; Ferreira, L.G. Overview of the radiometric and biophysical performance of the MODIS vegetation indices. Remote Sens. Environ. 2002, 83, 195–213. [Google Scholar] [CrossRef]
- Gitelson, A.A.; Kaufman, Y.J.; Merzlyak, M.N. Use of a Green Channel in Remote Sensing of Global Vegetation from EOS-MODIS. Remote Sens. Environ. 1996, 58, 289–298. [Google Scholar] [CrossRef]
- Cheng, W.-C.; Chang, J.-C.; Chang, C.-P.; Su, Y.; Tu, T.-M. A Fixed-Threshold Approach to Generate High-Resolution Vegetation Maps for IKONOS Imagery. Sensors 2008, 8, 4308–4317. [Google Scholar] [CrossRef]
- Aiazzi, B.; Alparone, L.; Baronti, S.; Garzelli, A. Context-Driven Fusion of High Spatial and Spectral Resolution Images Based on Oversampled Multiresolution Analysis. IEEE Trans. Geosci. Remote Sens. 2002, 40, 2300–2312. [Google Scholar] [CrossRef]
- Huete, A.R. A Soil-Adjusted Vegetation Index (SAVI). Remote Sens. Environ. 1988, 25, 295–309. [Google Scholar] [CrossRef]
- Budhewar, S.T. Wavelet and Curvelet Transform based Image Fusion Algorithm. Int. J. Comput. Sci. Inf. Technol. 2014, 5, 3703–3707. [Google Scholar]
- Gamba, P. Image and data fusion in remote sensing of urban areas: Status issues and research trends. Int. J. Image Data Fusion 2014, 5, 2–12. [Google Scholar] [CrossRef]
- Ren, J.; Yang, W.; Yang, X.; Deng, X.; Zhao, H.; Wang, F.; Wang, L. Optimization of Fusion Method for GF-2 Satellite Remote Sensing Images based on the Classification Effect. Earth Sci. Res. J. 2019, 23, 163–169. [Google Scholar] [CrossRef]
- Pandit, V.R.; Bhiwani, R.J. Image Fusion in Remote Sensing Applications: A Review. Int. J. Comput. Appl. 2015, 120, 22–32. [Google Scholar]
- Fonseca, L.; Namikawa, L.; Castejon, E.; Carvalho, L.; Pinho, C.; Pagamisse, A. Image Fusion for Remote Sensing Applications. Available online: http://www.intechopen.com/books/image-fusion-and-its-applications/image-fusion-for-remote-sensing-applications (accessed on 2 May 2020).
- Vibhute, A.D.; Dhumal, R.; Nagne, A.; Gaikwad, S.; Kale, K.V.; Mehrotra, S.C. Multi-Sensor, Multi-Resolution and Multi-Temporal Satellite Data Fusion for Soil Type Classification. In Proceedings of the International Conference on Cognitive Knowledge Engineering, Aurangabad, India, 21–23 December 2016; pp. 27–32. [Google Scholar]
- Belgiu, M.; Stein, A. Spatiotemporal Image Fusion in Remote Sensing. Remote Sens. 2019, 11, 818. [Google Scholar] [CrossRef]
- Al-Wassai, F.A.; Kalyankar, N.V.; Al-Zaky, A.A. Spatial and Spectral Quality Evaluation Based on Edges Regions of Satellite Image fusion. In Proceedings of the 2012 Second International Conference on Advanced Computing and Communication Technologies (ACCT), Haryana, India, 7–8 January 2012; IEEE: Piscataway, NJ, USA, 2012; pp. 265–275. [Google Scholar]
- Zhang, D.; Xie, F.; Zhang, L. Preprocessing and fusion analysis of GF-2 satellite Remote-sensed spatial data. In Proceedings of the 2018 International Conference on Information Systems and Computer Aided Education (ICISCAE), Changchun, China, 6–8 July 2018; IEEE: Piscataway, NJ, USA, 2018; pp. 24–29. [Google Scholar]
- Sun, W.; Chen, B.; Messinger, D.W. Nearest-neighbor diffusion-based pan-sharpening algorithm for spectral images. Opt. Eng. 2014, 53, 013107. [Google Scholar] [CrossRef]
- Wang, Z.; Bovik, A.C.; Sheikh, H.R.; Simoncelli, E.P. Image Quality Assessment: From Error Visibility to Structural Similarity. IEEE Trans. Image Process. 2004, 13, 600–612. [Google Scholar] [CrossRef]


© 2020 by the authors. Licensee MDPI, Basel, Switzerland. This article is an open access article distributed under the terms and conditions of the Creative Commons Attribution (CC BY) license (http://creativecommons.org/licenses/by/4.0/).