Technical Note

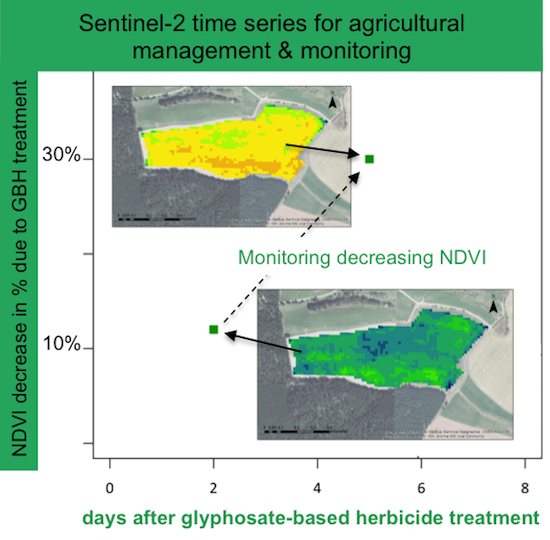
Monitoring Glyphosate-Based Herbicide Treatment Using Sentinel-2 Time Series—A Proof-of-Principle

Faculty of Environmental Sciences, Technical University Dresden, 01062 Dresden, Germany
*
Author to whom correspondence should be addressed.
Remote Sens. 2019, 11(21), 2541; https://doi.org/10.3390/rs11212541
Submission received: 16 October 2019 / Revised: 26 October 2019 / Accepted: 28 October 2019 / Published: 29 October 2019
(This article belongs to the Special Issue Remote Sensing for Sustainable Agriculture and Smart Farming)

Abstract

:
In this paper we aim to show a proof-of-principle approach to detect and monitor weed management using glyphosate-based herbicides in agricultural practices. In a case study in Germany, we demonstrate the application of Sentinel-2 multispectral time-series data. Spectral broadband vegetation indices were analysed to observe vegetation traits and weed damage arising from herbicide-based management. The approach has been validated with stakeholder information about herbicide treatment using commercial products. As a result, broadband NDVI calculated from Sentinel-2 data showed explicit feedback after the glyphosate-based herbicide treatment. Vegetation damage could be detected after just two days following of glyphosate-based herbicide treatment. This trend was observed in three different application scenarios, i.e., during growing stage, before harvest and after harvest. The findings of the study demonstrate the feasibility of satellite based broadband NDVI data for the detection of glyphosate-based herbicide treatment and, e.g., the monitoring of latency to harvesting. The presented results can be used to implement monitoring concepts to provide the necessary transparency about weed treatment in agricultural practices and to support environmental monitoring.

Graphical Abstract

1. Introduction

Food security, precision farming and sustainable treatment of soil and water as natural resources are of major importance for human, animal and environmental health. Glyphosate-based herbicides (GBHs) are the most widely used application in agricultural weed management to increase crop production [1]. Recent public and political discussions highlight controversial aspects of glyphosate application within the food chain, e.g., the transparency for the end consumer. Furthermore, we still have a limited understanding about the effects of herbicides and pesticides to the complex responses of soil microbial communities [2] and their long-term effects on soils. To study GBH based effects on soil and vegetation, a time-series of spatially explicit GBH treatment (intensity) can be provided by satellite remote sensing [3].
Earth observation programs, such as ESA’s Copernicus and NASA’s Landsat, already provide and further increase the amount and quality (e.g., spectral and spatial resolution) of observations from orbit, applicable for agricultural management. Scientific experimental studies using hyper- and multispectral imaging spectroscopy are available to show proof-of-principle to observe vegetation traits and processes [4,5]. Sentinel-2 broadband Normalized Difference Vegetation Index (NDVI) [6] shows promising results for soil moisture monitoring providing significant improvements over Landsat [7]. Increasing temporal availability of satellite-based multispectral data allows the implementation of time-series based methods for the differentiation of plant species, physiological and phenological properties [8,9]. Agricultural management and monitoring may be supported by new information products as provides by EOS company [10]. In [11] the benefits of hyperspectral remote sensing data are summarised for agricultural application; retrieval methods and challenges for operational implementation are also discussed. A comprehensive and up-to-date summary to assess vegetation properties and function with remote sensing-based imaging spectroscopy are provided in [12].
Furthermore, sensor innovations to detect chlorophyll fluorescence from orbit like ESA FLEX mission [13] will further enhance the quality and application of satellite-based vegetation monitoring in the near future [14]. Monitoring and spatial mapping of plant photosynthetic activity might link plant metabolism to man-made factors, e.g., the application of herbicides, pesticides and fungicides [15]. Linked open data concepts will facilitate multi-variate spatial maps incorporating satellite observations, citizen science (providing data through mobile Apps), agriculture vehicle data streams and meteorological data.
Moreover, remote sensing based agricultural monitoring provides independent solutions of increasing transparency, its implementation in public App based services is promising for start-ups and a new product generation as supported by Europe’s Copernicus program [16]. Recently made available multispectral time series, e.g., Sentinel-2 and Landsat, provide time-series of two to three scenes per week depending on geographic latitude and atmospheric conditions and pave the way for new applications in agricultural management including herbicide treatment and monitoring.
Thus, the objective of this study was to evaluate the performance of broadband and satellite based vegetation indices to identify GBH based weed treatment in agriculture. Therefore, Sentinel-2 multispectral time-series were analysed. Available local site information allowed the analysis of different GBH treatments under real-time environmental conditions. Different spectral broadband vegetation indices were temporally analysed to identify change after GBH weed treatment.

2. Materials and Methods

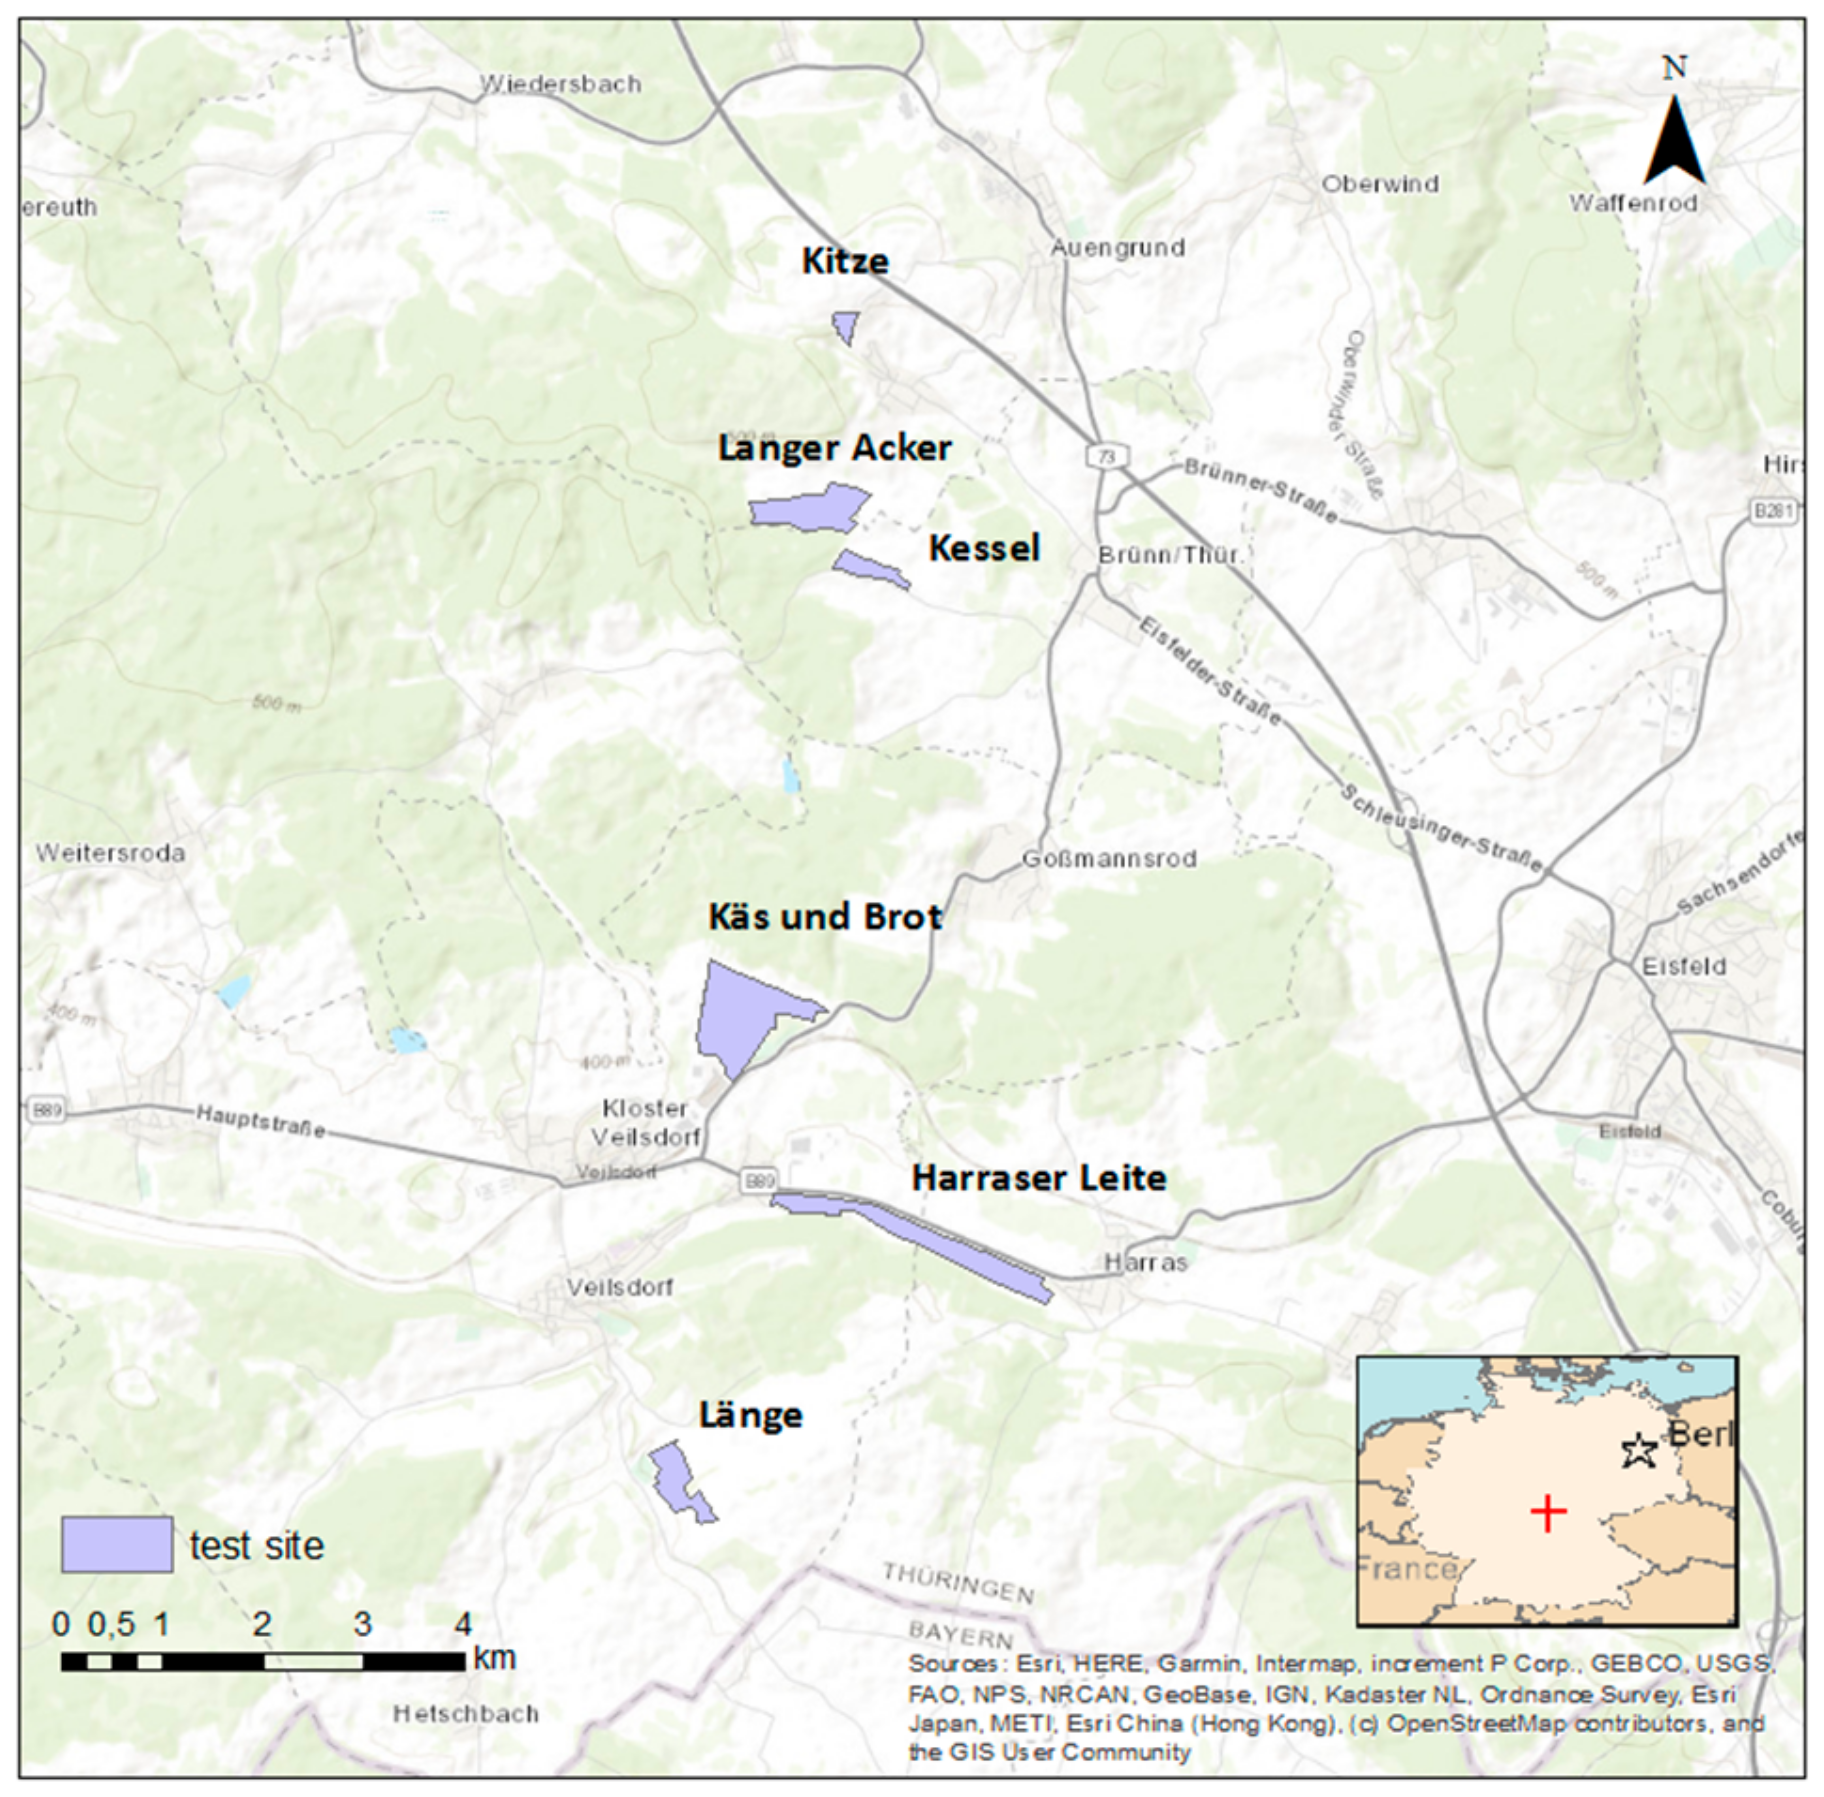
2.1. Study Site and GBH Treatment

The study region is located in the middle of Germany and consisting of five agricultural sites used as test sites. Location and layout of the individual sites is provided in Figure 1. The names of the test sites are in-house specific and used throughout in this study. The collaborating agricultural company providing ground truth information is kept anonymous in this research. Ground truth information about the individual herbicide treatments, GBH products applied and their doses (see Table 1), soil types and texture (no maps) and crop management was given. Three different GBH products commonly sold under the trade name of Roundup® were applied to reduce weed before or after harvest. Roundup® PowerFlex contains 480 g glyphosate per litre, Roundup® ULTRA MAX contains 450 g glyphosate per litre and Roundup® REKORD contains approximately 720g glyphosate per kilogram. Details about product compositions are not published by the manufacturer. Information about dosing and treatment scenario per test site is provided in Table 1.
Three common weed treatment scenarios where GBH is applied are examined in this research; they consist of the following: (i) pre-sowing, (ii) before harvest and (iii) after harvest weed reduction. A species classification of the weed itself was not available nor required to address the research questions in this study. The amount of weed biomass and its spatial variability is visualised using the appropriate Sentinel-2 data (see Section 2.2). Information about soil treatment during the observation period is provided in Section 2.2 within an overview of the Sentinel-2 time-series.
For four GBH test sites (Harraser Leite, Käs and Brot, Länge, Kitze) reference sites are available without GBH application. The reference sites are located in vicinity of the test site itself and have similar weed cover. This information provides the possibility to compare weed management practices and discuss the effect of GBH. The amount of weed biomass at the reference sites is visualised using the Sentinel-2 data (see Section 3.2).

2.2. Sentinel-2 Multispectral Data and Pre-Processing

Freely available Sentinel-2 multispectral satellite observations were applied in this study. Data sets were acquired through Copernicus Open Access Hub [17]. In Table 2, an overview of selected data products for the test sites and relevant metadata, e.g., processing level is provided. Two data products were available in Level 1C TOA reflectance (Top-of-Atmosphere) format and processed into BOA reflectance (Bottom-of-Atmosphere) using SNAP-ESA Sentinel Application Platform [18] and Sen2Cor processor. Applied Sentinel-2 pixels covering the test sites were completely cloud free. However, general information about cloud cover is given in Table 2. All spectral observations were collected around 12:20/12:30 local time, which enabled good radiation characteristics and comparability. Furthermore, dew effect on vegetation reflectance can be ignored due to evaporation processes in the morning.
Using polygons, we extracted a time series from the Sentinel-2 data for all sites listed in Table 1. The polygons fitted inside the individual test sites to avoid mixed signatures around the edges. The pixel size of all indices images was 10 m × 10 m as band 3, 4, and 8 from Sentinel-2 were used (see Table 3).

2.3. Spectral Indices and Statistics

The selection of spectral indices was guided by two criteria, namely, (i) the spectral index was already discussed in scientific literature regarding monitoring herbicide based weed management and (ii) the technical applicability concerning available broadband multispectral reflectance data (e.g., narrow-band indices for hyperspectral data analyses are not considered). Consequently, four spectral indices were selected from scientific literature and analysed in the context of this research. Selected spectral input bands from Sentinel-2 are given in Table 3.
The Normalized Difference Vegetation Index (NVDI) [6] is the most popular spectral vegetation index with a robust sensitivity to changes in green vegetation due to chlorophyll content. It quantifies the normalised difference between near infrared (NIR) and red reflectance and can be calculated using broad and narrow-band reflectance data (see equation 1). NDVI provides decades of proven performance in many vegetation studies, e.g., classification, biomass mapping, leaf area index estimation. Vegetation traits related to herbicide-based weed management was detected by NDVI in several case studies [19,20,21].
NDVI = NIR red NIR + red
The Green Normalized Difference Vegetation Index (GNDVI) is observing the reflectance changes in the near infrared and green portion of the electromagnetic spectrum and is given in Equation (2). A high correlation to field-based crop injury measurements was found in [22] warranting its analysis within this study. Furthermore, in [23] a decrease in near infrared and green reflectance is observed due to weed treatment using glyphosate products. Therefore, it could be assumed that GNDVI and NDVI information complement each other.
GNDVI = NIR green NIR + green
Chlorophyll Vegetation Index (CVI) is utilising three different reflectance signals and is proposed to indicate photosynthesis activity within green vegetation canopy. In [22] CVI was proposed to indicate vegetation damage.
CVI = NIR green * red green
The Soil Adjusted Vegetation Index (SAVI) [24] is observing the reflectance differences between NIR and red spectrum by considering soil influence within (assumed) mixed signatures. Soil effect is considered by the correction factor L and varies between 0 and 1. The value of L increases with increasing soil influence within the mixed signature and was chosen following the findings in [24]. L was set to 0.5 for Käs and Brot, Länge, Harraser Leite and L = 0.25 was applied to Kitze, Langer Acker and Kessel. As SAVI is applicable to broadband multispectral satellite data, and the test scenarios (see Table 1) indicate varying soil influence on reflectance observations, its performance will be evaluated within this study.
SAVI = NIR red NIR + red + L * 1 + L
NDVI was used to select bare soil pixels in the first image of each time series and applying a threshold of 0.2, also considered as bare soil in [25,26]. Therefore, all pixel with NDVI values below 0.2 were masked out in all scenes and are not included in the statistical analyses. This was performed to maximise the focus of the statistical analyses to the vegetation pixels and to avoid bias though bare soil/ soil dominant pixels within the time series.
Statistical analyses were performed using RStudio [27] including the GDAL package [28]. For each test site (see Table 1) and each vegetation index, the following statistical parameters were calculated: mean, median, quantile at 25% and 75%. The temporal behaviour of the statistical parameters is visualised in the results section using diagrams for each test site and probability density functions according to each index image. For the reference sites (see Table 1), NDVI and appropriate statistics were calculated for later comparison and discussion of the weed treatment (reference sites = without glyphosate, test sites = with glyphosate).

3. Results

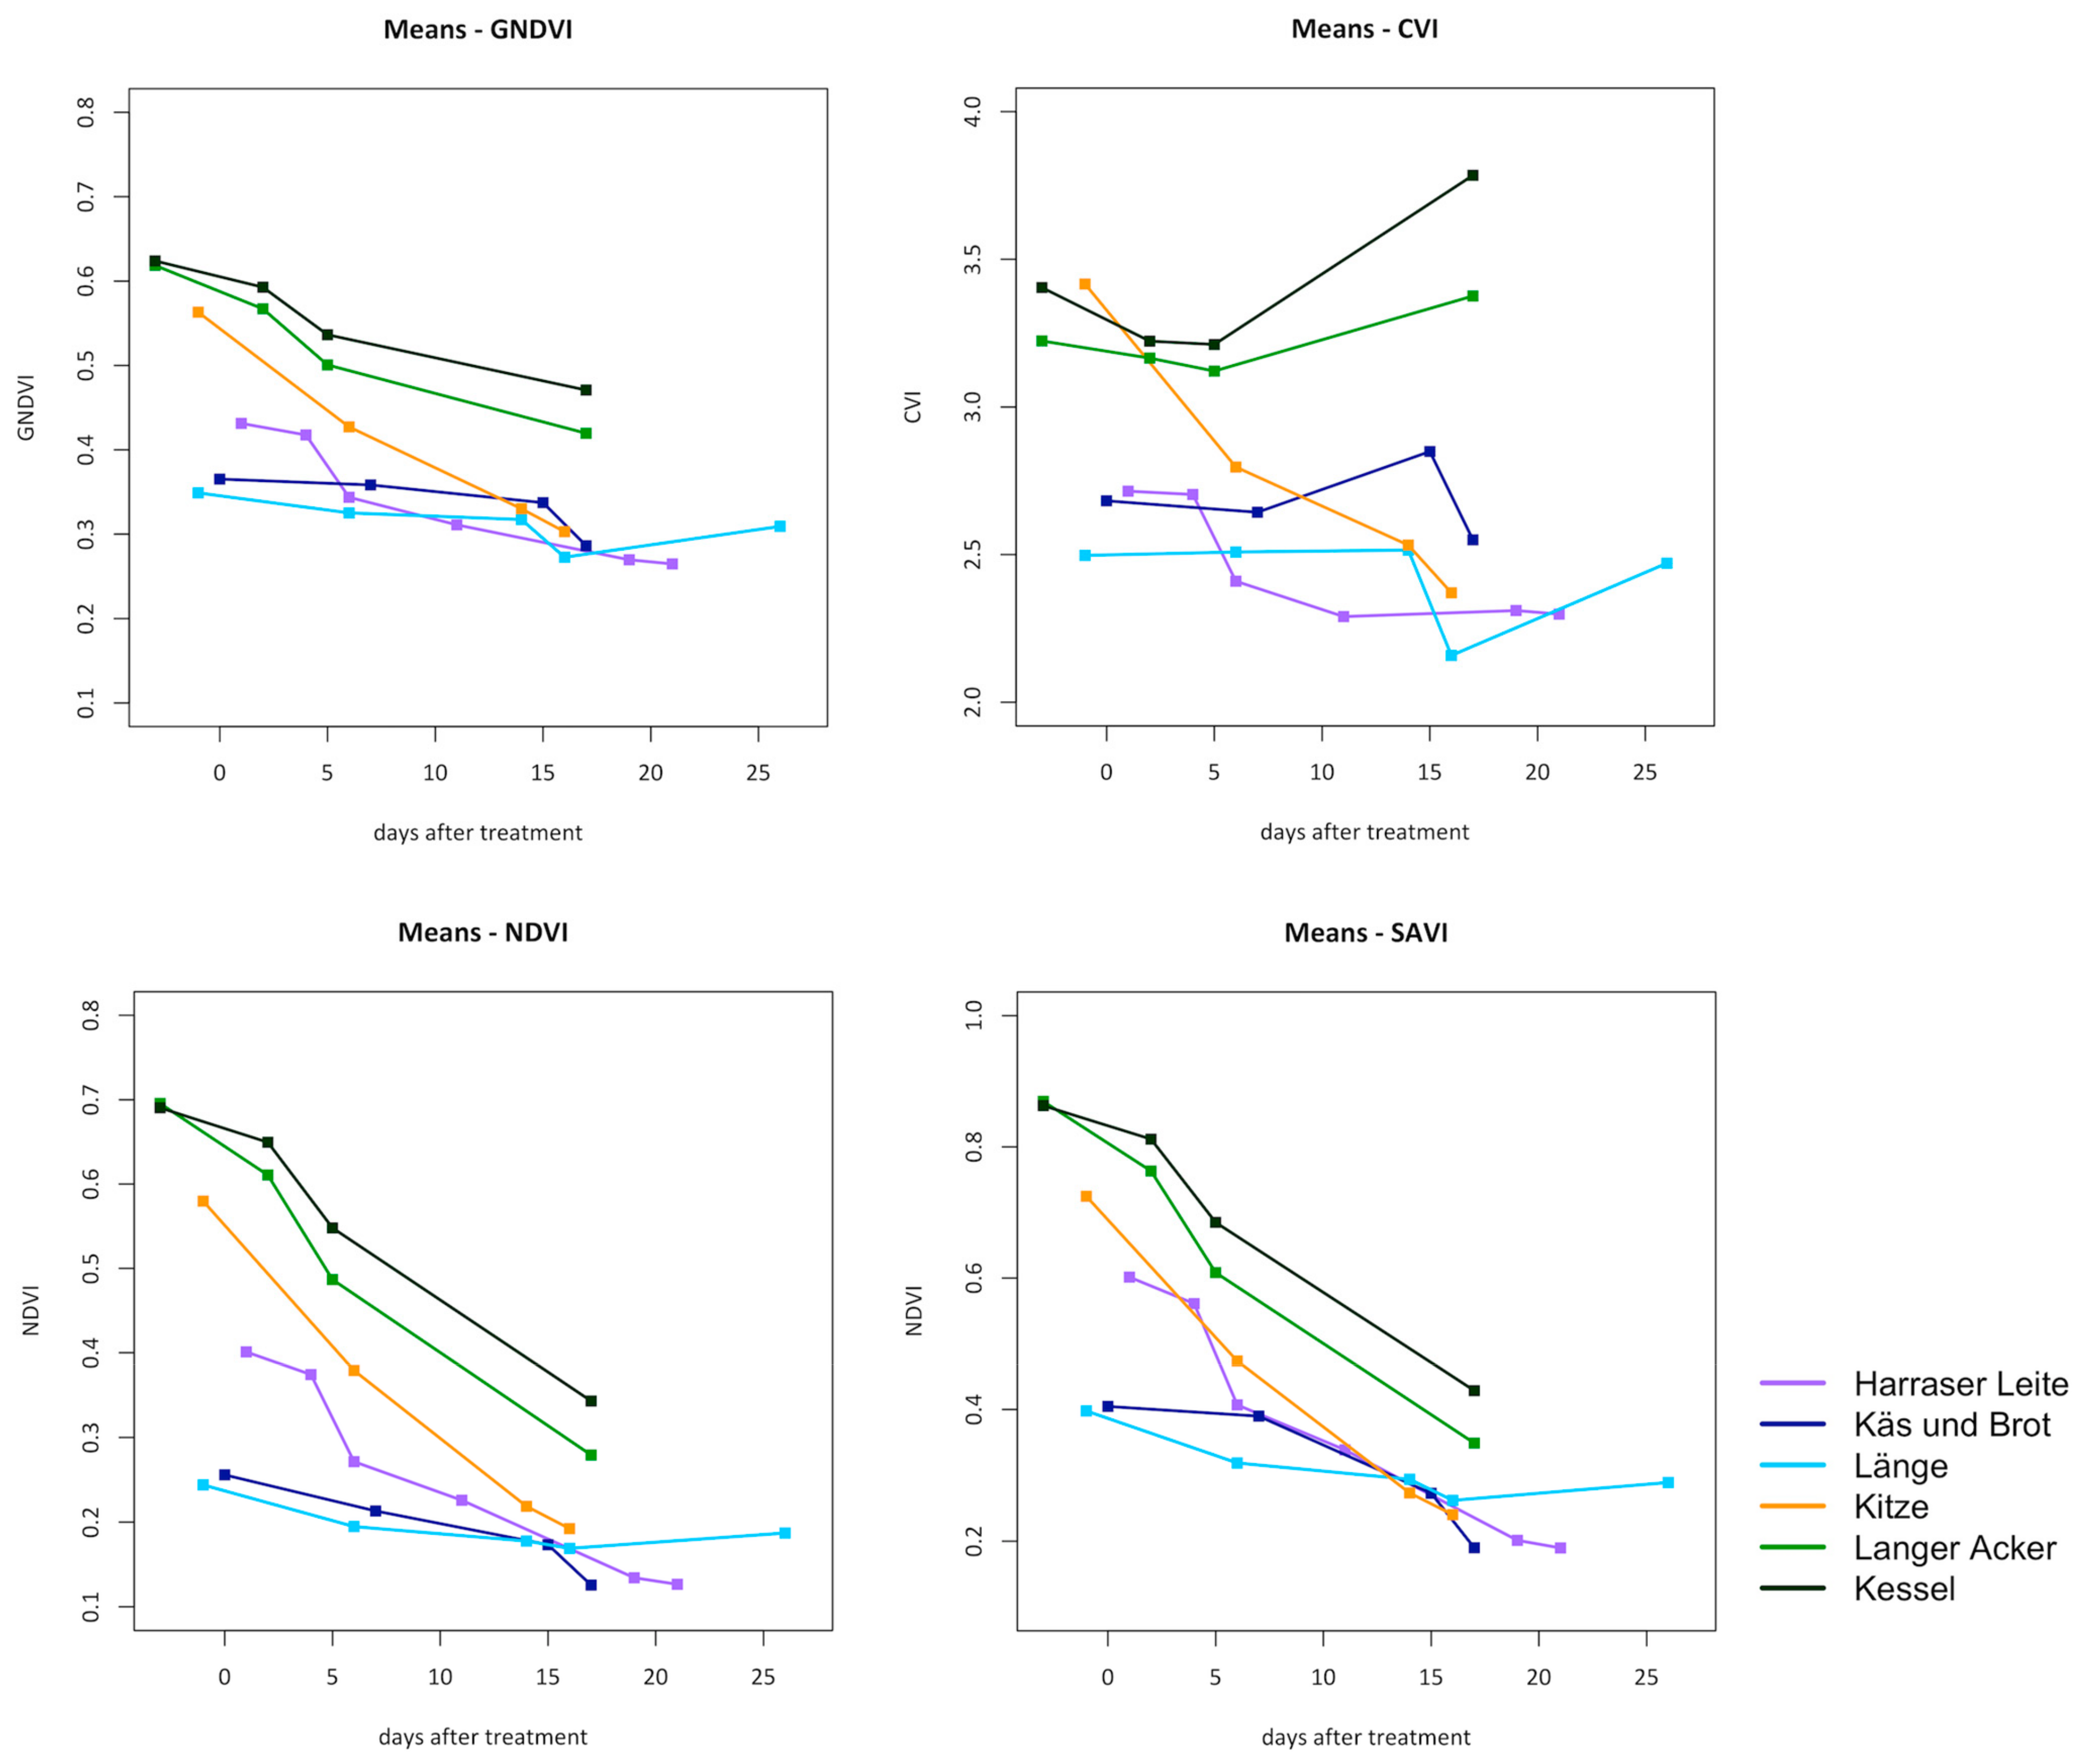
3.1. Spectral Indices Responses for All Test Sites

For each test site, the spectral vegetation indices were calculated for the available Sentinel-2 time-series. Average values of each spectral indices for the time-series are provided in Table 4 and visualised in Figure 2. For the time-series, the day of Sentinel-2 multispectral observation varies between three days before GBH treatment (see Table 4, Langer Acker) and 21 days after GBH treatment (see Table 4, Harraser Leite). The most comprehensive time-series regarding before and after GBH treatment and before any agricultural soil treatment is provided by test site Harraser Leite. Here, for one, four and six days after GBH treatment Sentinel-2 data is available providing additional information compared to the analysed time series in [22], which provides the first images some seven days after GBH treatment. Only one Sentinel-2 observation after GBH treatment and before any agricultural soil treatment is provided for Käs and Brot, Länge and Kitze.
As a main result, we show that all spectral indices decrease consequently over time after weed treatment using GBH. Just two days after the treatment, a decrease in indices values could be observed (Table 4, test site Langer Acker). NDVI, SAVI and GNDVI show similar trends compared to CVI, which provides random values for sites with very low vegetation (e.g., Käs and Brot, Länge). Spatial heterogeneity in NDVI responses within the time-series is visualised for Harraser Leite (Figure 3 and Langer Acker (Figure 4). A quantified decrease of NDVI values up to seven days after GBH treatment is presented in Figure 5 and calculated using the values presented in Table 4.

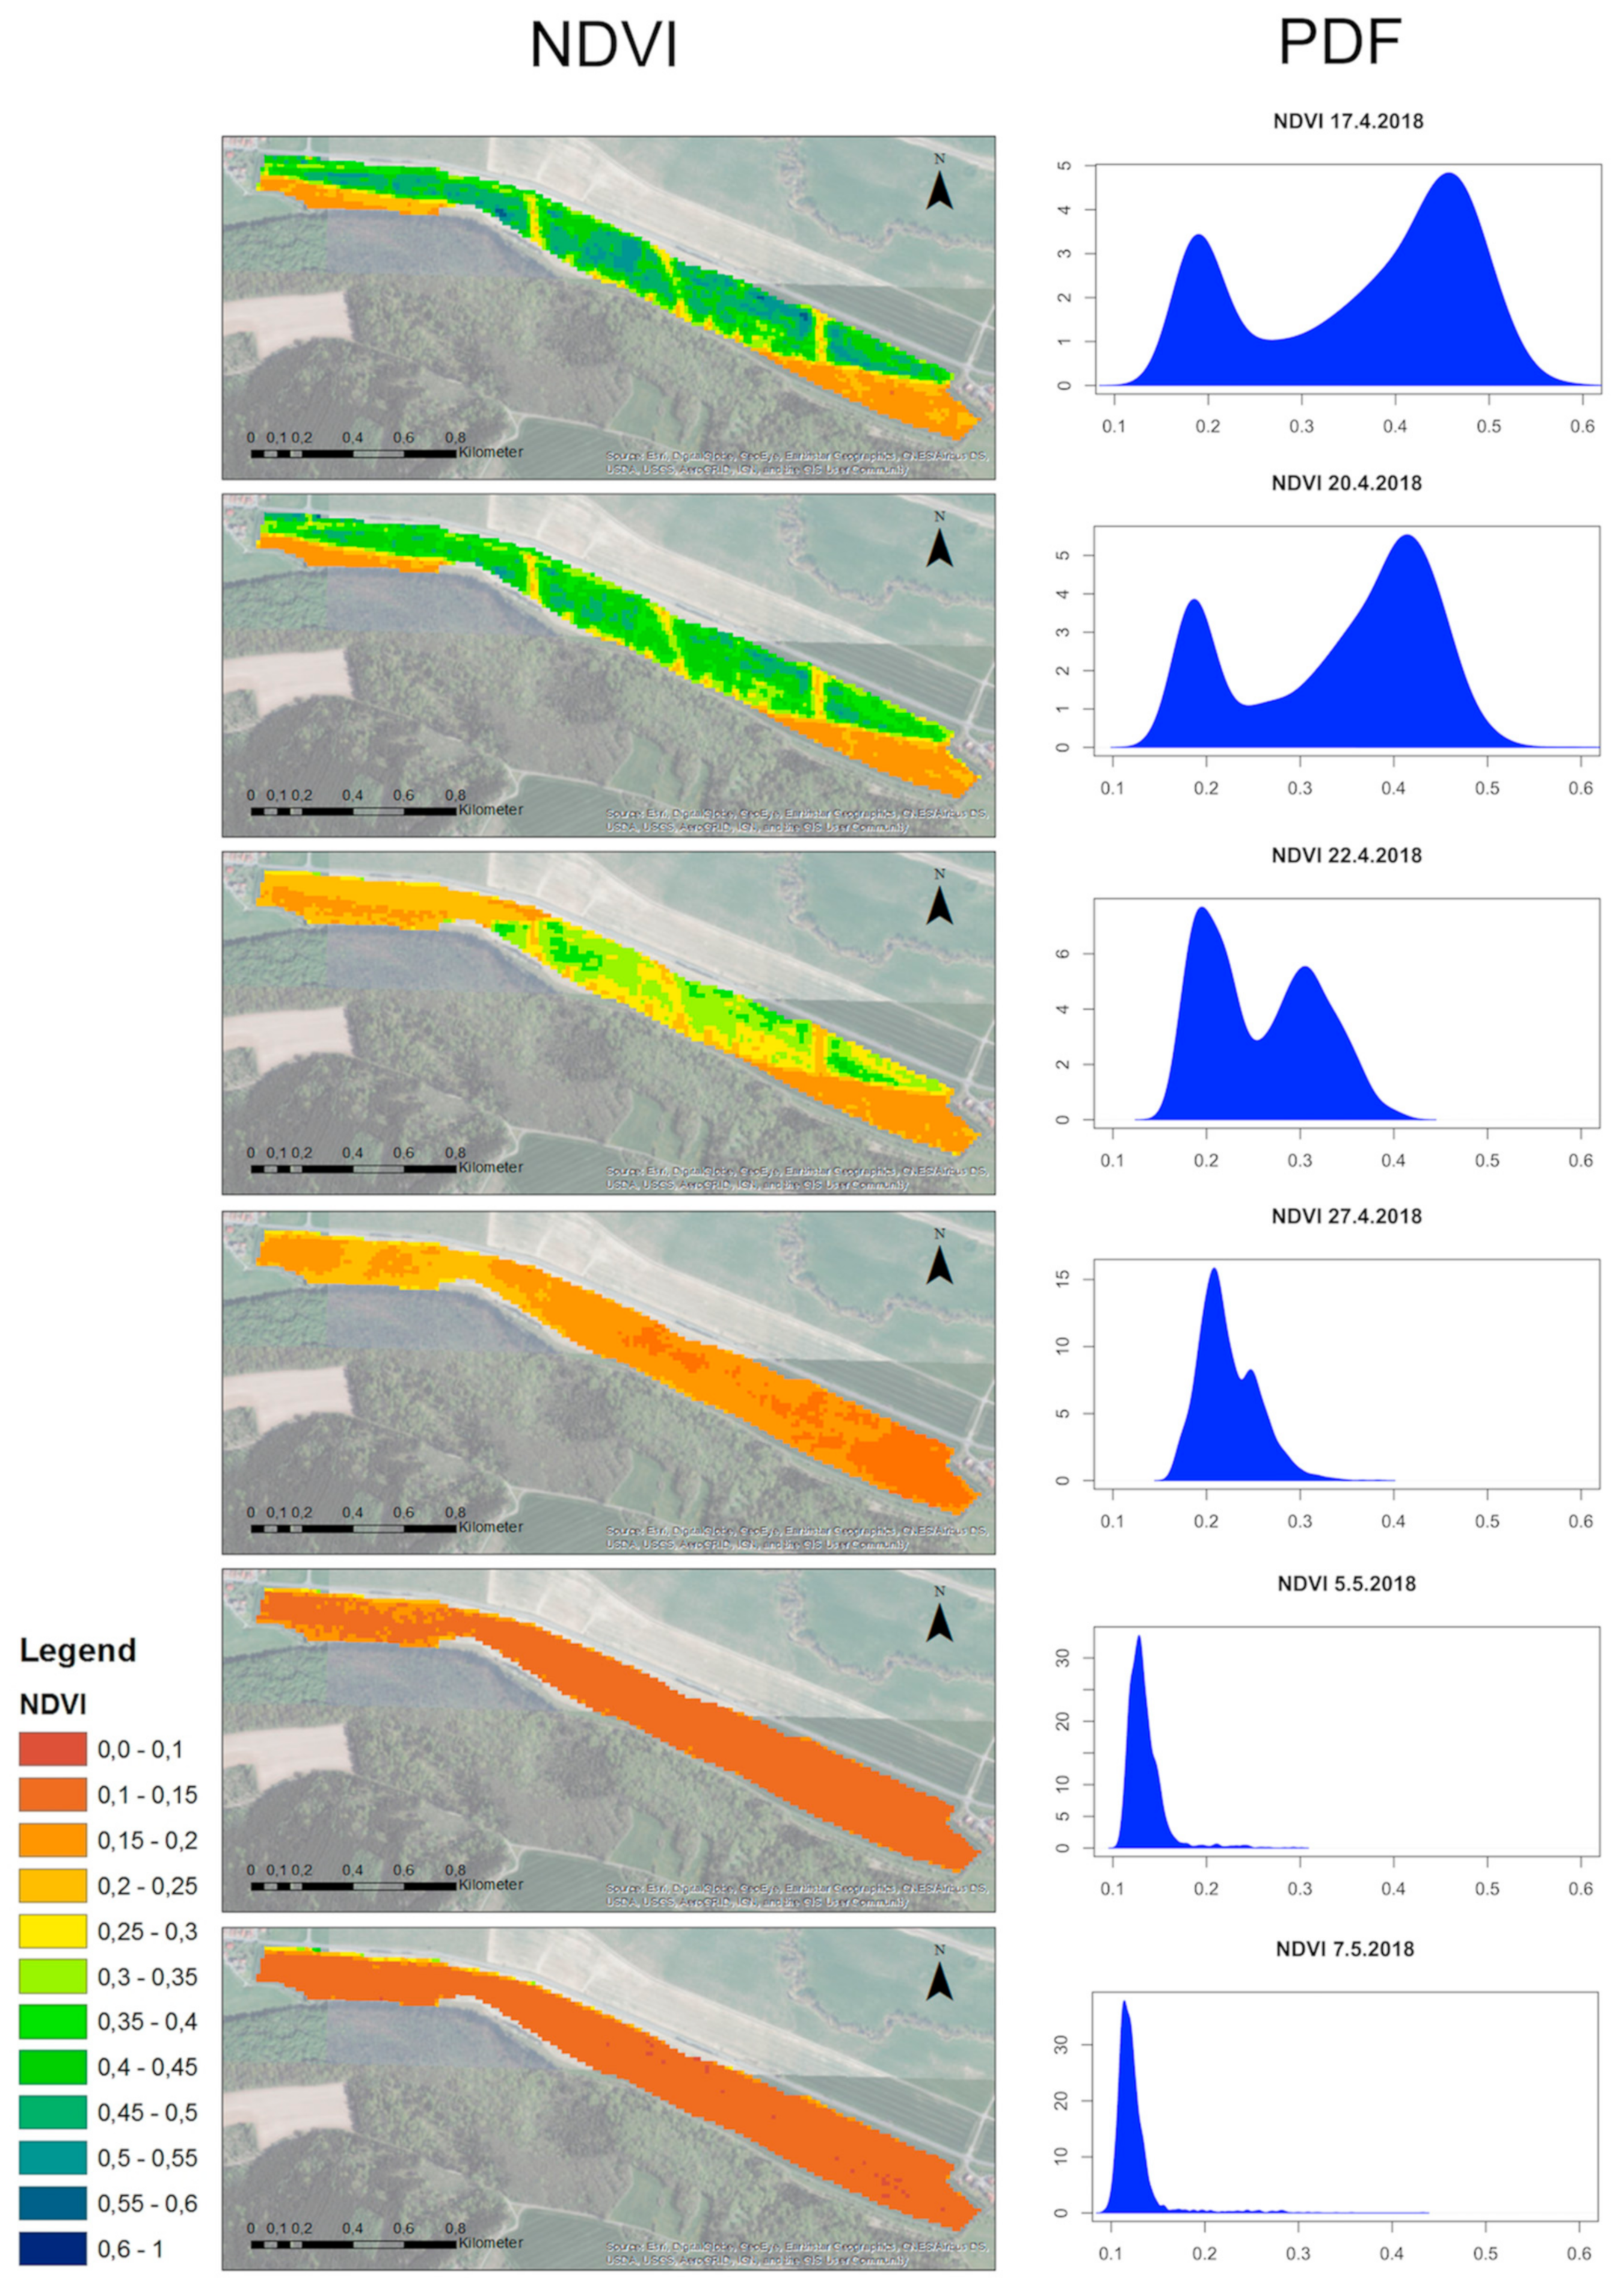
3.2. NDVI Time-Series: Test Sites vs. Reference Sites

To address and visualise the effect of GBH treatment, NDVI is compared to the NDVI of sites without GBH treatment. NDVI is applied for comparison as a sensitivity to herbicide application clearly exists (compare Section 3.1). The reference sites provide similar biomass characteristics (generally weed cover) but without herbicide treatment. In Figure 6, the temporal behaviour of NDVI for the sites is opposed using mean and median NDVI per site and date and providing information about quantile at 25% and 75%. For interpretation of herbicide effect, the individual soil treatments need to be considered.
The Käs and Brot site shows a slight decrease in NDVI (see Figure 6), which might be caused by herbicide treatment. The appropriate reference site shows increasing NDVI values. Compared to the reference site, a higher NDVI due to weed is observable at Kitze test site (compare day 0). A decrease in NDVI after GBH treatment could be detected by day six for Kitze. Even after ploughing, the Kitze site displays slightly higher NDVI values compared to the reference site. Interestingly, even after ploughing, a decrease of NDVI is observable (compare day 7, 14 to 16) after GBH treatment.

4. Discussion

In the study, we present a systematic behaviour of satellite based spectral broadband vegetation indices due to vegetation changes that are induced by GBH treatment.
In general, it was found that satellite based multispectral time series data (e.g., those available from Sentinel-2) are suitable to monitor GBH treatment in agriculture management. We show decreasing values of NDVI, GNDVI, SAVI for different operational scenarios, for example, pre and after harvest GBH treatment. CVI response is random and without clear response compared to the other indices. New insights are (i) that satellite based broadband spectral indices are able to represent the impact of GBH on vegetation and (ii) fast vegetation response to treatment and its detection by time-series analysis. In comparison to available scientific experiments using high resolution (geometric/ pixel size) airborne or ground based radiometer data [20,29], it is shown that satellite based 10 m × 10 m pixel data also provide gradual information.
For Harraser Leite, a strong decrease in NDVI values was detected (see Table 4 and Figure 3 and Figure 5). As the reference site (no GBH treatment) shows similar decrease, it might be assumed that decreasing vegetation response is caused by another environmental influence, e.g., the extreme regional drought in 2018 (see Figure 6). However, the last two observation dates show a greater decrease of NDVI at Harraser Leite, which leads to the assumption that the effect of GBH treatment is detectable even after grubbing. Another observed phenomenon is the spatially varying temporal delay of the vegetation response of Harraser Leiter. The decrease in NDVI of the western part appears already in the first three days after GBH treatment. As the western part has higher clay content, it may be assumed that decreasing NDVI is caused by overlaying effects from GBH and drought. At day 11 and 19 after GBH application, the western part shows slightly higher NDVI values. This might be explained by slower plant metabolism caused by higher clay content. Therefore, the GBH based plant damage is temporally delayed.
A limitation of the study is missing in situ data of the vegetation species (e.g., detailed phenological and physiological data), for example, to validate and discuss spatio-temporal pattern due to GBH response. Causes for crop/weed growth could be due to nutrient deficiencies, insects, soil texture and type, wind damage, pesticide spray drift. However, in [29], the correlation of NDVI, SAVI, GNDVI with biological response and yield is systematically analysed and proved successfully. The aim of this study was to show the application of satellite based multispectral data in real environments to support future applications and motivate further research in satellite based research on agricultural treatment.

5. Conclusions and Perspectives

The present study provides proof-of-principle that broadband spectral vegetation indices provided by ESA Sentinel-2 missions are applicable to monitor GBH based weed management in agricultural landscapes. Different spectral vegetation indices can easily be calculated from available satellite data and independently used for monitoring issues and application. The core of the approach is the availability of satellite based multi-spectral time-series that allows the detection of changes and gradients within an agricultural vegetation canopy.
For the interpretation of gradual changes, available data and expertise about agricultural cropping can easily be implemented in rules and thresholds for autonomous algorithms. For example, a strong decrease in green biomass within 6 days and detected in different spectral vegetation indices may indicate the application of GBH (if no further extreme events like flooding or pests are documented). This information could help to enforce regulations on harvesting, buffer zones for organic agriculture and the selection of home ranges for bees for honey production. Organic farmers and beekeepers can benefit from an indirect monitoring tool to identify crop and weed damage due to GBH application. In addition to this, monitoring for glyphosate tolerance weeds may also be possible. The presented results provide motivation for application and proof-of-principle for further research to define vegetation indices based thresholds and incorporate further biotic and abiotic factors.
As agricultural vehicles become better equipped with environmental sensors and cloud-based data links, a valuable database including information about time, product type and dosage for weed and crop treatment practice is becoming available. As soil and groundwater quality are directly affected by agricultural management, information might be published comparable to data about air contamination, e.g., by private cars and/or industry, as the public interest in sustainable natural resource management is increasing (in our case soil, water and food). On the basis of a database within a linked open data concept [30], satellite observations already provide the tool for indirect and areawide mapping of GBH treatment and effect. The applications are manifold and might benefit stakeholders from agriculture, biodiversity and environmental protection, land use and land management authorities and food chain management.
The time-series monitoring approach can be advanced using imaging hyperspectral satellite observations (e.g., EnMap) and increasing early damage detection using chlorophyll-fluorescence observations from the upcoming FLEX mission. Monitoring GBH based weed and crop stress using Chlorophyll Fluorescence observations [14] to assess photosynthetic activity promises a shift of the detectable response day closer to the day of treatment and will support the reduction of ambiguities (e.g., differences in metabolism due to different soils or species).
Furthermore, in [31], it is concluded that research on the effects of herbicides and pesticides on soil microorganism and soil health does not receive appropriate attention. To address long-term and areawide assessment of soil health, the presented approach might be easily implemented.

Author Contributions

Conceptualization, methodology, writing—original draft preparation, M.P.; software, validation, formal analysis, F.R.; visualization, M.P. and F.R., writing-review and editing, C.M., E.C., M.P.

Funding

This research received no external funding.

Acknowledgments

Great thanks goes to the agricultural company kept anonymous in this study and providing us valuable insight into common agricultural weed treatment in Germany.

Conflicts of Interest

The authors declare no conflict of interest.

References

  1. Schütte, G.; Eckerstorfer, M.; Rastelli, V.; Reichenbecher, W.; Restrepo-Vassalli, S.; Ruohonen-Lehto, M.; Saucy, A.G.W.; Mertens, M. Herbicide resistance and biodiversity: Agronomic and environmental aspects of genetically modified herbicide-resistant plants. Environ. Sci. Eur. 2017, 29, 5. [Google Scholar] [CrossRef] [PubMed]
  2. Lupatini, M.; Korthals, G.W.; de Hollander, M.; Janssens, T.K.S.; Kuramae, E.E. Soil microbiome is more heterogeneous in organic than in conventional farming system. Front. Microbiol. 2017, 7, 1–13. [Google Scholar] [CrossRef] [PubMed]
  3. Huang, Y.; Zhong-xin, C.; Tao, Y.; Xiang-zhi, H.; Xing-fa, G. Agricultural remote sensing big data: Management and applications. J. Integr. Agric. 2018, 17, 1915–1931. [Google Scholar] [CrossRef]
  4. Suarez, L.A.; Apan, A.; Werth, J. Hyperspectral sensing to detect the impact of herbicide drift on cotton growth and yield. ISPRS J. Photogramm. Remote Sens. 2016, 120, 65–76. [Google Scholar] [CrossRef]
  5. Henry, W.B.; Shaw, D.R.; Reddy, K.R.; Bruce, L.M.; Tamhankar, H.D. Remote sensing to detect herbicide drift on crops. Weed Technol. 2004, 18, 358–368. [Google Scholar] [CrossRef]
  6. Tucker, C.J. Red and photographic infrared linear combinations for monitoring vegetation. Remote Sens. Environ. 1979, 8, 127–150. [Google Scholar] [CrossRef] [Green Version]
  7. West, H.; Quinn, N.; Horswell, M.; White, P. Assessing vegetation response to soil moisture fluctuation under extreme drought using sentinel-2. Water 2018, 10, 838. [Google Scholar] [CrossRef]
  8. Grabska, E.; Hostert, P.; Pflugmacher, D.; Ostapowicz, K.; Grabska, E.; Hostert, P.; Pflugmacher, D.; Ostapowicz, K. Forest stand species mapping using the sentinel-2 time series. Remote Sens. 2019, 11, 1197. [Google Scholar] [CrossRef]
  9. Lausch, A.; Bannehr, L.; Beckmann, M.; Boehm, C.; Feilhauer, H.; Hacker, J.M.; Heurich, M.; Jung, A.; Klenke, R.; Neumann, C.; et al. Linking Earth Observation and taxonomic, structural and functional biodiversity: Local to ecosystem perspectives. Ecol. Indic. 2016, 70, 317–339. [Google Scholar] [CrossRef]
  10. EOS Earth Observing System. Available online: https://eos.com/ (accessed on 10 September 2019).
  11. Hank, T.B.; Berger, K.; Bach, H.; Clevers, J.G.P.W.; Gitelson, A.; Zarco-Tejada, P.; Mauser, W. Spaceborne imaging spectroscopy for sustainable agriculture: Contributions and challenges. Surv. Geophys. 2019, 40, 515–551. [Google Scholar] [CrossRef]
  12. Gamon, J.A.; Somers, B.; Malenovský, Z.; Middleton, E.M.; Rascher, U.; Schaepman, M.E. Assessing vegetation function with imaging spectroscopy. Surv. Geophys. 2019, 40, 489–513. [Google Scholar] [CrossRef]
  13. Kraft, S.; Bello, U.D.; Bouvet, M.; Drusch, M. FLEX: ESA’S Earth Explorer 8 Candidate Mission. In Proceedings of the 2012 IEEE International Geoscience and Remote Sensing Symposium, Munich, Germany, 22–27 July 2012; pp. 7125–7128. [Google Scholar]
  14. Raji, S.N.; Aparna, G.N.; Mohanan, C.N.; Subhash, N. Proximal remote sensing of herbicide and drought stress in field grown colocasia and sweet potato plants by sunlight-induced chlorophyll fluorescence Imaging. J. INDIAN Soc. Remote Sens. 2017, 45, 463–475. [Google Scholar] [CrossRef]
  15. Huang, Y.; Yao, H.; Zhao, F.; Reddy, K. Detection of crop herbicide injury through plant hyperspectral remote sensing of chlorophyll fluorescence. In Proceedings of the 2017 IEEE International Geoscience and Remote Sensing Symposium (IGARSS), Fort Worth, TX, USA, 23–28 July 2017; pp. 5069–5072. [Google Scholar]
  16. Copernicus Incubation. Available online: https://copernicus-incubation.eu (accessed on 10 September 2019).
  17. Copernicus Open Access Hub. Available online: https://scihub.copernicus.eu/ (accessed on 5 April 2019).
  18. SNAP-ESA Sentinel Application Platform. Available online: https://step.esa.int/main/toolboxes/snap/ (accessed on 20 March 2019).
  19. Zhao, F.; Huang, Y.; Guo, Y.; Reddy, K.N.; Lee, M.A.; Fletcher, R.S.; Thomson, S.J. Early detection of crop injury from glyphosate on soybean and cotton using plant leaf hyperspectral data. Remote Sens. 2014, 6, 1538–1563. [Google Scholar] [CrossRef]
  20. Thelen, K.D.; Kravchenko, A.N.; Lee, C.D. Use of optical remote sensing for detecting herbicide injury in soybean. WEED Technol. 2004, 18, 292–297. [Google Scholar] [CrossRef]
  21. Dicke, D.; Jacobi, J.; Büchse, A. Quantifying herbicide injuries in maize by use of remote sensing Quantifizierung von Herbizidschäden in Mais mit Hilfe von Fernerkundung. In Proceedings of the 25th German conference on weed biology and weed control, Braunschweig, Germany, 13–15 March 2012; pp. 199–205. [Google Scholar]
  22. Ortiz, B.V.; Thomson, S.J.; Huang, Y.; Reddy, K.N.; Ding, W. Determination of differences in crop injury from aerial application of glyphosate using vegetation indices. Comput. Electron. Agric. 2011, 77, 204–213. [Google Scholar] [CrossRef]
  23. Yao, H.; Huang, Y.; Hruska, Z.; Thomson, S.J.; Reddy, K.N. Using vegetation index and modified derivative for early detection of soybean plant injury from glyphosate. Comput. Electron. Agric. 2012, 89, 145–157. [Google Scholar] [CrossRef]
  24. Huete, A.R. A soil-adjusted vegetation index (SAVI). Remote Sens. Environ. 1988, 25, 295–309. [Google Scholar] [CrossRef]
  25. Sobrino, J.A.; Raissouni, N.; Li, Z.L. A comparative study of land surface emissivity retrieval from NOAA data. Remote Sens. Environ. 2001, 75, 256–266. [Google Scholar] [CrossRef]
  26. Tang, B.-H.; Shao, K.; Li, Z.-L.; Wu, H.; Tang, R. An improved NDVI-based threshold method for estimating land surface emissivity using MODIS satellite data. Int. J. Remote Sens. 2015, 36, 4864–4878. [Google Scholar] [CrossRef]
  27. RStudio. Available online: https://rstudio.com (accessed on 10 April 2019).
  28. GDAL. Available online: https://gdal.org (accessed on 10 April 2019).
  29. Huang, Y.; Reddy, K.N.; Thomson, S.J.; Yao, H. Assessment of soybean injury from glyphosate using airborne multispectral remote sensing. PEST Manag. Sci. 2015, 71, 545–552. [Google Scholar] [CrossRef]
  30. Lausch, A.; Schmidt, A.; Tischendorf, L. Data mining and linked open data–New perspectives for data analysis in environmental research. Ecol. Model. 2015, 295, 5–17. [Google Scholar] [CrossRef]
  31. Cuhra, M. Evolution of glyphosate resistance is the rhizosphere microbiome a key factor? J. Biol. Phys. Chem. 2019, 18, 78–93. [Google Scholar] [CrossRef]
Figure 1. Study area and test sites in Germany. Kitze = 2.5 ha, Langer Acker = 17 ha, Kessel = 6 ha, Käs und Brot = 32 ha, Harraser Leite = 28 ha, Länge = 13 ha.
Remotesensing 11 02541 g001
Figure 2. Temporal dynamic of spectral vegetation indices for the test sites. The x-axes represent the number of days after GBH treatment. Day 0 is the day of GBH treatment. The y-axes represent the mean value of the spectral vegetation index of the appropriate study site, i.e., Green Normalized Difference Vegetation Index (GNDVI), Chlorophyll Vegetation Index (CVI), Normalized Difference Vegetation Index (NVDI), Soil Adjusted Vegetation Index (SAVI).
Remotesensing 11 02541 g002
Figure 3. Visualisation of spatio-temporal dynamic of NDVI values for test site Harraser Leite and appropriate probability density function.
Remotesensing 11 02541 g003
Figure 4. Visualization of spatio-temporal dynamic of NDVI values for test site Langer Acker and appropriate probability density function.
Remotesensing 11 02541 g004
Figure 5. Decreasing NDVI values in percent (%) for all test sites up to seven days after GBH treatment.
Remotesensing 11 02541 g005
Figure 6. Temporal dynamic of NDVI values for the sites treated with herbicide and appropriate reference sites without herbicide treatment. Day 0 indicates the day of herbicide treatment in the case of the test sites (x-axes).
Remotesensing 11 02541 g006
Table 1. Overview of agricultural test sites and scenario characteristics due to herbicide treatment and cultivation.
Site NameSite Size (ha)CropTreatmentProduct Applied Dosage (kg per ha)Treatment DateFurther Crop Management
Harraser Leite28 weedpre-sowingRound-up ULTRA MAX1.35 April 16, 2018maize sowing after 13 days
Käs and Brot32 weedpre-sowingRound-up PowerFlex1.44 August 8, 2017winter rape sowing after 13 days
Länge13 weedpre-sowingRound-up PowerFlex1.44August 9, 2017winter rape sowing after 8 days
Kitze2.5weed and harvest remainsafter-harvestRound-up PowerFlex1.8 August 9, 2017unknown
Langer Acker and Kessel17+6lupinusbefore harvestRound-up REKORD1.44 August 18, 2017harvest 10 days after glyphosate treatment
Table 2. Overview of applied Sentinel-2 data sets for the test sites in 2017 and 2018.
Satellite LevelDataTime (UTC)Cloud CoverBOA Reflectance
Sentinel-2A2A2017-08-0810:3010%2A
Sentinel-2A2A2017-08-1510:200%2A
Sentinel-2B1C2017-08-2310:300%Sen2Cor
Sentinel-2A2A2017-08-2510:2030%2A
Sentinel-2A2A2017-09-0410:2030%2A
Sentinel-2B1C2018-04-1710:2050%Sen2Cor
Sentinel-2B2A2018-04-2010:305%2A
Sentinel-2A2A2018-04-2210:2030%2A
Sentinel-2B2A2018-04-2710:2010%2A
Sentinel-2A2A2018-05-0510:300%2A
Sentinel-2B2A2018-05-0710:200%2A
Table 3. Centre wavelength and bandwidths of the applied Sentinel-2 reflectance data and input for spectral indices calculation.
Portion of Electromagnetic SpectrumSentinel-2 Band NumberSentinel-2A
Centre Wavelength/Bandwidth [nm]
Sentinel-2B
Centre Wavelength/Bandwidth [nm]
green3559.8/36 559.0/36
red4664.6/31664.9/31
NIR8832.8/106 832.9/ 106
Table 4. Mean values of calculated spectral indices (CVI, GNDVI, NDVI, SAVI) using Sentinel-2 BOA reflectance. The numbers in the table header indicate the temporal shift of the observation day related to GBH treatment (DRTT, numbers in bold). 0 = day of GBH treatment, e.g., −3 = three days before GBH treatment, 4 = four days after GBH treatment.
Test Site: Harraser Leite, Pre-Sowing
DRTT01468111921
CVIGBH2.702.702.40grubbing2.292.312.30
GNDVI0.430.420.340.310.270.26
NDVI0.400.370.270.230.130.13
SAVI0.600.560.410.340.200.20
Test Site: Käs and Brot, Pre-Sowing
DRTT00781315
CVI2.68GBH2.64ploughsowing
of rape
2.85
GNDVI0.370.360.34
NDVI0.260.210.17
SAVI0.410.390.27
Test Site: Länge, Pre-Sowing
DRTT−106681416
CVI2.50GBH2.51ploughsowing
of rape
2.522.16
GNDVI0.350.330.320.27
NDVI0.240.190.180.17
SAVI0.400.320.290.26
Test Site: Kitze, after Harvest
DRTT−10671416
CVI3.42GBH2.80plough2.532.37
GNDVI0.560.430.330.30
NDVI0.580.380.220.19
SAVI0.720.470.270.24
Test Site: Langer Acker, Pre-Harvest
DRTT−30251017
CVI3.22GBH3.173.12harvest3.38
GNDVI0.620.560.500.42
NDVI0.700.610.490.28
SAVI0.870.760.610.35

