Abstract
As Internet access grows at different rates across regions, the Internet has had variable effects on regional economies through agglomeration and spillover effects. This paper uses province-level panel data from 2000 to 2013 to study inequality in Internet access, its spatial effect on regional economies in China and the channels through which the spillover effects are most evident. We find that the Internet has dispersed quickly from core cities, such as Beijing and Shanghai, to coastal provinces; and has had increasingly significant effects on neighboring regions. However, the Internet speed is still comparatively low outside the core cities. We then use endogenous growth models to quantify the effect of Internet access on regional economies. Our results show that, while Internet dispersion is positively associated with economic growth, the spillover effect varies significantly by region and is more pronounced in developed regions. So is the effect of the science and technology environment. Developed regions have benefited the most in the process. The three channels of spillover are listed here in order of relative significance: economy, proximity and urbanization. The spillover effect of the Internet may lead to the divergence of regional economies, working against the national goal of reducing regional inequality.
1. Introduction
Over the past two decades, Internet technology has become a powerful driving force for regional development and greatly changed people’s daily lives. While the Internet has contributed to economic growth, it is unclear the extent to which the effect varies by regions. Some studies have shown that Internet penetration has fueled the growth of indigenous economies in less developed areas [1,2,3]. However, other studies have revealed that Internet adoption may have had either a negligible effect on the economy of less-developed countries [4] or even a negative impact on countries with high levels of inequality [5]. Little research exists on how Internet dispersion has affected regional economies within a country over time.
Researchers have begun to document large regional disparities in Internet access, differences in people’s Internet usage, and the effect of such digital divides on Chinese economy [6,7]. Not surprisingly, economically-developed areas, such as the coastal provinces, have better access to the Internet. However, it is unclear how Internet dispersion has affected regional inequality and the spatial organization of the economy in China.
Internet dispersion has coincided with rapid economic development in China since the 1990s, making the relationship between the two an important topic of study in economic geography and regional science. China has expanded Internet access quickly; the number of Internet users reached 618 million in 2013 with an Internet penetration rate of 46.1% [8].
The Internet has boosted China’s economy, by helping create new industries and broadening the market. Research shows that the Internet has facilitated information delivery, attracted more factors of production and boosted the regional economy [1,2,9,10]. Moreover, the Internet has allowed manufacturers and retailers to significantly reduce the cost of transactions and quickly respond to market changes, profoundly affecting the spatial organization of the economy [11,12,13]. Finally, the Internet has democratized access to information, helped integrate underutilized human resources into production chains and increased productivity in some remote areas and traditional industries [14,15]. The Internet is likely to have affected how the economy has spilled over to neighboring regions. (The spillover effect refers to an activity in one region that produces unexpected effects on neighboring regions. Regional economic growth is dependent not only on internal factors, but increasingly on the economic growth of neighboring regions.) Researchers have explored the spillover effects of various factors on the Chinese economy, such as foreign direct investment (FDI) [16], international trade [17], infrastructure development [18] and public capital investment [19]. These factors have influenced the flow of capital, knowledge, technology and labor, resulting in regional economic convergence. However, the literature has overlooked the spillover effect of the Internet on regional development and the channels through which the effect has dispersed in China.
The spillover effect of the Internet on regional economies is likely to be large and complex. The effect may have manifested through three distinct channels: First, Internet dispersion and economic growth may be mutually reinforcing. We hypothesize this as the spillover through the economy. Second, the Internet may have served as a conduit through which new technology flows to neighboring regions. Through the channel of geographic proximity, adjacent regions can quickly adopt the new technology to promote economic development [20,21]. Third, urban areas are an important driver of economic growth, having a greater capacity to generate new knowledge and facilitate the exchange of knowledge [22]. We hypothesize that the spillover effect is more evident in urban areas: the spillover through urbanization. We will test these three possible channels of spillover.
The Internet will likely play an increasingly important role in China where the government is shifting the focus of economic growth from infrastructure and manufacturing toward services and consumer spending. In March 2015, Chinese Premier Li Keqiang put forward the “Internet Plus” plan in his government report, aiming to expand Internet access, rejuvenate traditional industries and further improve productivity [23]. Therefore, it is important to know how the Internet has contributed to economic growth and affected regional inequalities in China.
Given the importance of the Internet in the Chinese economy and the rapid dispersion of the Internet in China, we aim to examine three research questions: (1) How has the spillover effect of the Internet changed over time? (2) To what extent has increasing Internet access affected China’s regional inequality? (3) Through which channels has the Internet facilitated the spillover effect? We will use endogenous growth models to address these questions in a longitudinal framework.
In the following section, we briefly review the literature. In Section 3, we discuss the data and methodology used in this study, while the spatial pattern of Internet access in China is reported in Section 4. In Section 5, we examine the role of the Internet in economic development in China as a whole and study the extent to which the role is different in the three regions of China. We then explore the spillover effect of the Internet in Section 6, followed by our conclusion at the end.
2. Literature Review
2.1. Internet Access and Regional Inequality
As the Internet gains widespread usage, it has become an important contributor to economic growth and a major determinant of inequality [24]. The relative importance of Internet access seems to vary between income groups, and those of high-income have benefited the most from Internet dispersion [25]. Concerns over the digital divide have attracted much attention, because the Internet has become an important tool for social development [6].
China is the largest developing country in the world, facing increasing economic inequality and a growing divide in Internet access and entrepreneurial resources. There is a substantial and persistent regional imbalance in China’s rapidly growing economy [26]. Regional inequalities have threatened the national security and unity of China [27]. As a result, the national government has adopted a development goal to reduce regional inequality [28]. One unanswered question is to what extent Internet dispersion has affected regional inequalities in China.
Research findings are inconsistent on the overall effect of Internet dispersion on regional economies [29]. On the one hand, some have argued that it would stimulate the economy of remote regions and reduce regional inequality. First, less developed regions often have a smaller base economy to begin with. As the Internet disperses to more places, these regions can make greater gains in economic development [1]. Second, Choi [30] has shown that Internet dispersion has effectively shortened the “distance” of remote areas to the marketplace and facilitated trade and foreign direct investment in those areas [31]. Finally, Internet dispersion has coupled with the penetration of information technology and allowed less developed regions to catch up more quickly [29].
On the other hand, some scholars find that Internet dispersion has aggravated regional inequality. Evidently, the Internet has helped regions with a strong economy to grow even more quickly, by increasing the value of locally accessible information and overall content demand, attracting production factors and enhancing locational advantages [7,32,33]. The areas with the best Internet access seem to have had stronger economic growth and formed new cores. They have also had larger capital formation, greater advancement in science and technology and stronger institutions than less developed regions, which may in turn further enhance their advantages.
Research has shown that, in rare cases, Internet dispersion has retarded the regional economies of the least developed regions, triggering the Matthew effect of accumulative advantage and reinforcing the “center–periphery” phenomenon [34]. That is to say, Internet dispersion can have a polarizing effect on regional economies. On the one hand, Internet dispersion may promote the economic development of the core regions. In turn, economic development may accelerate Internet dispersion, creating a cycle of positive reinforcement. On the other hand, the Internet may have little effect on the economy of underdeveloped regions, due to the low rate of Internet penetration. Noh and Yoo [5] and Zhang [26] report that Internet adoption has had a negative effect on the economy of highly unequal countries.
2.2. Internet Spillover and Its Complexity
The advent of the Internet does not necessarily reduce the relevance of geography [35]. Evidently, there appears to be a strong spatial autocorrelation and network effects over the Internet [7]. Like other technological innovations, the Internet has facilitated knowledge spillovers [36]. Thus, Internet dispersion may have changed the relative importance of geographical proximity in production. The spillover through the Internet is complex; we hypothesize the following three channels for the spillover effect: economy, proximity and urbanization.
Economy: Internet penetration may be path-dependent. Regions with a strong economy are likely to attract initial investment for Internet infrastructure. With a large initial investment, regions can quickly expand Internet access, attract more Internet providers and increase the number of Internet users. Increased competition among Internet service providers will likely further improve the access to the Internet and, in turn, strengthen regional economies. Furthermore, regions are both the sender and the receiver of knowledge. The absorptive capacity of a region is a critical factor in interregional knowledge spillover [37]. In other words, the receiving region must be properly equipped in order to benefit from the spillover effect [38]. Therefore, we hypothesize that regions with a similarly high level of economic development are the most likely to benefit from the spillover of the Internet.
Proximity (spatial distance): Starrs [39] suggests that geographic distance is an important factor in the spillover process. Scholars such as Funke and Niebuhr [40] and Rodríguez-Pose and Crescenzi [41] confirm the importance of geographic proximity for spillover. The Internet has promoted social interactions and knowledge dissemination to other areas. While the Internet has helped increase the overall level of communication, the volume of Internet communications has increased much more quickly at the local level. Because of the spatial diffusion effect, the level of Internet access in one region is influenced by that of its adjacent regions [32,42]. Such an effect is most evident at the local level and in places where the distance is between 250 km and 500 km [43]. Finally, it is easier and less expensive for Internet providers to expand Internet access to neighboring regions, because they can rely largely on existing infrastructure. While the Internet has helped people that are far from each other communicate, geographic proximity may still be an important factor in knowledge spillover in the Internet age [12].
Urbanization: Urban areas may be key to the spillover of the Internet [44]. The level of knowledge spillover is dependent on the level of human capital and the openness of the host region. The long-term economic growth is hinged on the improvement in the absorptive capability and in human capital [45,46]. Urban areas, which tend to have a larger capacity to create new knowledge and absorb new technology, have seen stronger economic growth [47,48]. Urban residents tend to have higher levels of human capital than non-urban residents [22]. The concepts of the smart city [49] and the wireless city [50], which emphasize that information and communication technologies will play an essential role in city management and public services, have recently attracted considerable attention from scholars and policymakers.
3. Data and Methodology
3.1. Model Specification
According to the neoclassical theory of economic growth, labor and capital stock are two major inputs in production. More recent studies have recognized the importance of human capital stock and incorporated it as an additional factor in the production function [51]. In the traditional model, technological progress was regarded as an exogenous factor that could not be properly measured. However, with the advent of the new economic growth theory in the 1980s, researchers have treated technological progress as an endogenous factor. The level of human capital has been used as an indicator of technological progress. Romer [52] and Lucas [51] argue that human capital is an important factor for economic growth.
The literature has also recognized the crucial role of science and technology in economic development [53]. Meanwhile, the Internet, as a production factor [3], has helped change the production structure and improve market competitiveness. The benefit of Internet access may accrue the most in areas where there is a high level of science and technology. Therefore, we hypothesize that a better science and technology environment will make the Internet a more effective production factor.
We consider the Internet as one additional factor of production in this analysis. We can establish an endogenous economic growth model in which production factors include not only labor, capital stock and human capital stock, but also Internet access and the science and technology environment. We assume that Internet access is associated with output, and the production function is defined as follows:
where Y is the real GDP, K is the capital stock, L is the labor input, H is the human capital stock, I is the level of Internet access and S is the science and technology environment. Taking the log-linear form of Equation (1), we obtain the following equation:
where yt is the time virtual variable and f is the cross-section virtual variable. α1, α2, α3, α4, α5 are the output coefficients of various factors.
Y = f (K, L, H, I, S)
Ln(Yit) = α0 + α1ln(Kit) + α2ln(Lit) + α3ln(Iit) + α4ln(Hit) + α5ln(Sit) + uit + yt + f
3.2. Data Collection
The model includes 31 provincial-level administrative units in China (hereafter, provinces). They include 4 direct-controlled municipalities, 22 provinces and 5 autonomous regions. Hong Kong, Macau and Taiwan are excluded here due to data availability. The unit of analysis in this study is province-year. These administrative units are grouped into three regions, based on their level of socioeconomic development. (See Appendix.) We collect our socioeconomic data for the period of 2000 to 2013 from the China Statistical Yearbook [54]. We obtain the Internet user data from CNNIC—the China Internet Network Information Center [8]. The following is a discussion of the dependent and independent variables used in the analysis.
1. Aggregate output (Y): Y is the real GDP, which is widely used to represent the level of regional development. We have adjusted for inflation and standardized the GDP data to the level of the year 2000.
2. Capital stock (K): Capital stock reflects economic growth. The perpetual inventory method is employed to estimate the infrastructure investment of China from 2000 to 2013.
Kit = Kit−1(1 − δit) + Iit, t = 2,…, 61
The formula above shows the capital stock of province i in year t. We follow the standard practice and estimate the initial stock by 10% of the whole society fixed capital in 1952 [55]. In addition, we use the price index of investment in fixed assets for the base year 2000 and adjust this to the real whole society fixed capital. The depreciation (δ) of gross fixed capital is set at 9.6% [55].
3. Labor input (L): China is still a developing country with a large population. Even though China’s economy has grown rapidly in recent decades, it is still relatively small on a per capita basis. Labor has been a vital contributor to economic growth [51]. We use the number of workers by province to reflect regional labor input.
4. Human capital stock (H): Human capital, as an input factor of production, is an important part of the economic production process. An increase in the human capital stock often elevates labor productivity and eventually increases regional output and GDP. The average education level of the population is taken as the core measure of human capital stock. H reflects the relative share of the population in each province that has graduated from primary school, middle school, high school or college. We then assign the years of schooling to the population. The larger the value of H, the higher the level of human capital stock.
5. Internet access (I): We use the number of Internet users to account for regional Internet access. According to CNNIC, Internet users are referred to as those who are more than 6 years old and who have used the Internet in the past 6 months [8].
6. Science and technology environment (S): The number of patent applications filed is used to measure the level of science and technology in the current year, reflecting the ability of a region to create new knowledge and absorb new technology.
3.3. Measuring the Spatial Spillover Effects of the Internet
A regression model considering spatial spillover is specified as the following: it examines whether the Internet promotes the economy of neighboring regions through spillover effects. A spatial weight matrix is drawn into the endogenous growth model as Equation (4):
Ln(Yit) = α0 + α1ln(Kit) + α2ln(Lit) + α3ln(Iit) + α4ln(Hit) + α5ln(Sit) + α6ln(SIit) + uit + yt + f
The spillover effects of the Internet (SI) can be calculated by:
α6 is the parameter measuring the degree of spillover. If α6 > 0, there is a positive spillover of the Internet: the Internet has helped stimulate the economy of neighboring regions. We use the spatial weight matrix (Wn×n) to represent the spatial neighborhood relation.
Three possible channels of Internet spillover are examined here: (1) economy: we use the differences in the economies of neighboring regions to reflect their “economic distance”, which can be calculated by:
where G is per capita GDP at the provincial level. The smaller the difference between two provinces, the more similar the two economies with respect to the overall level of economic development. (2) Proximity: the degree of “adjacency” between two provinces is measured by the inverse distance between the two provincial capitals using Google Earth. (3) Urbanization: we calculate the level of urbanization using Equation (7), whereas U denotes the urbanization rate at the provincial level.
4. Patterns of Internet Penetration in China
The Internet in China has spread rapidly in recent years. Table 1 shows that China’s Internet penetration rate (Internet penetration rate is defined as the percent of permanent residents (six years and older) who used the Internet in the last six months) increased from 2.5% in 2000 to 46.1% in 2013, with an annual growth rate of 25.1%, much higher than the growth rate of GDP per capita during the same period (13.1%). There are large differences among the three regions of China. The growth rate of GDP per capita, adjusted for inflation to the year 2000, is higher in the central (318.8%) and western (329.4%) regions than in the eastern region (240.6%), the most developed region in China.

Table 1.
Internet penetration and GDP per capita in China and in the three regions, 2000 and 2013.
Table 2 demonstrates that regional differences in Internet penetration have shrunk, with the coefficient of variation (CV) value dropping from 1.6 in 2000 to 0.25 in 2013. All three regions have low CV values in 2013. Meanwhile, the regional differences in GDP per capita have become smaller, with the CV value decreasing from 0.69 in 2000 to 0.44 in 2013. The differences have narrowed considerably in the eastern region. The opposite is true for the central and western regions; there are still large differences in GDP within the central and western regions.
Table 2.
The CV values of Internet penetration and GDP per capita in China and in the three regions, 2000 and 2013.
Figure 1 shows how the inequality of China’s Internet penetration and economy has changed in each year from 2000 to 2013. The CV value of Internet penetration has decreased steadily, indicating that regional inequality in Internet penetration was very large at the beginning of the study period and then gradually decreased over time. The CV value of GDP per capita has also decreased, reflecting that regional economies have become more equal over time. When Internet penetration is low, access is often dominated by the privileged. With the growing penetration of the Internet, less developed regions have caught up, and the digital divide seems to have narrowed over time.
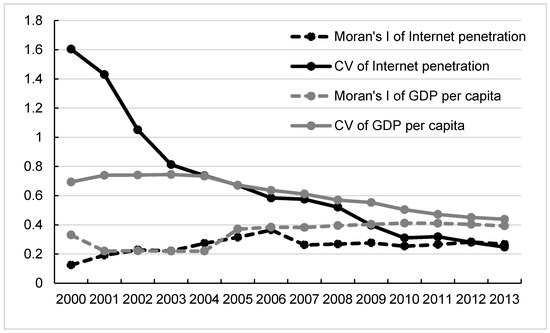
Figure 1.
Changing inequality in Internet penetration and regional economies in China, from 2000 to 2013.
To explore the spatial agglomeration effects between Internet penetration and GDP per capita, we calculate the global Moran’s I of the two factors in China from 2000 to 2013. The results show that all of the Moran’s I values are positive and statistically significant, revealing that there is spatial autocorrelation at the provincial level. We can also see in the figure that China has had three distinct periods of Internet dispersion. The first period was the initial build-up. Internet access spread quickly in coastal provinces in the beginning. Then, their neighboring provinces quickly caught up with them, leading to a rapid decline in the CV value from 2000 to 2004. The second period was slow convergence. The pace of decline in the CV value slowed down from 2004 to 2007. The third period was policy support. The CV value decreased quickly again from 2008 to 2010 when the central government invested heavily into Internet infrastructure as part of the 11th five-year plan for national economic and social development and as a counteract to the 2009 global recession.
There is a clear agglomeration effect in China’s Internet penetration: provinces with a similar level of Internet penetration have agglomerated and formed new cores. Our spatial analysis shows two different patterns. On the one hand, we find that the CV value is decreasing, and the Internet has become more widely available across regions. On the other hand, the global Moran’s I shows a trend of spatial concentration suggesting that adjacent provinces have become more alike with respect to Internet access.
Figure 2 shows the results of hot spot analyses (using the Getis–Ord Gi * statistic) on Internet penetration at the provincial level in 2000 and in 2013, respectively. Hot spot analyses are performed over the entire country to identify provinces with a similar level of Internet penetration.
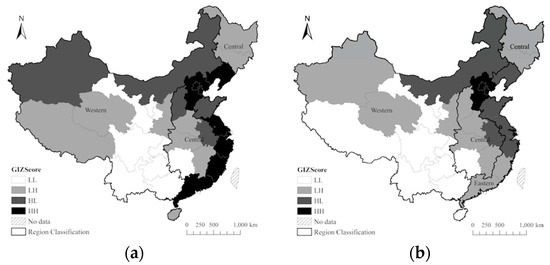
Figure 2.
Hotspot analysis of Internet penetration in China: (a) 2000 and (b) 2013.
We can clearly identify two hotspots, which are in the Beijing-Tianjin-Hebei region and in Shanghai, followed by neighboring provinces. This is expected because both Beijing and Shanghai have been the forerunners in China’s Internet development, and the Internet has spread to neighboring regions through contagious diffusion. In addition, Figure 2b shows that there is a higher degree of agglomeration in 2013. The Internet has spread from the “hotspots”, such as Beijing and Shanghai, to the coastal provinces nearby and then dispersed to neighboring inland provinces. The diffusion path is consistent with that of urban innovation diffusion in China [56].
Even though the gap in Internet penetration is narrowing, there are still large regional differences in the speed of the Internet. According to the Broadband Development Alliance [57], the average Internet speed reached 3.53 Mbit/s in 2013. As shown in Figure 3, the Internet speed in eight provinces exceeded the national average in 2013: Shanghai and Beijing had the highest speed (5.01 Mbit/s in Shanghai and 4.39 Mbit/s in Beijing). However, the Internet speed of the western and central regions was significantly lower than that of the eastern region (3.73 Mbit/s). While the regional inequality in Internet penetration has been reduced in recent years and the Internet has become more widely available, there is an increasing difference in the speed of the Internet and the quality of Internet access. Internet speed, as another measure of Internet access, deserves more attention in future studies.
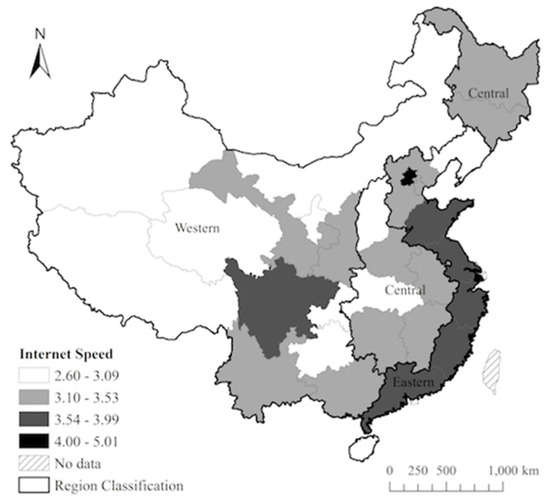
Figure 3.
Average Internet speed by province in China, 2013.
The study above reveals that there is a similar spatial pattern between Internet penetration and economic development. While regional inequalities in Internet penetration and in the economy have been falling, there are still regional differences in economy and in the quality of Internet access. Our result is consistent with findings from a recent European Union report [32]. Scientific and technological innovation has been concentrated in the most developed regions, and these regions have become more agglomerated [50,58,59].
5. The Role of Internet Access in Regional Development
We implement models to separately examine the roles of the Internet in the eastern, central and western regions of China. They are considered as developed, developing and underdeveloped regions, respectively.
We estimate the models with a panel data consisting of 31 provinces. The data are reported annually for 2000 to 2013. The overall sample size is N = 434. Table 3 reports the summary statistics of the variables used in the analysis. They are separated by region, with the summary for China as the reference on the left. There are large regional differences in real GDP, infrastructure investment (inflation adjusted), and the number of patent applications. The eastern region has the largest real GDP, infrastructure investment, number of Internet users and number of patent applications. Those in the eastern region are also the best educated. In contrast, the central region has the largest number of workers. The western region ranks at the bottom on all of these measures. While Table 3 reports the summary of the pooled data, the following table shows changes over time.
Table 3.
Summary statistics by region, 2000–2013.
Table 4 shows the mean values for both 2000 and 2013 and the percent changes over the period. Rapid economic growth is evident. Shown in the first section, the real GDP of China increased by more than three times over the 13-year period, while infrastructure investment and the number of patent applications grew by more than eight and 13 times, respectively. The number of Internet users jumped by more than 26 times. The number of workers and the level of education also increased, albeit on a more moderate scale. However, there are large regional differences. The western region had the largest percent increase in real GDP, infrastructure investment and the number of Internet users. This should not come as a surprise, since the region started from a smaller base in 2000. While some gaps between the eastern and western regions have narrowed, others have persisted and, in some cases, even widened. Evidently, the eastern region witnessed the largest percent increase in the number of patent applications and workers.
Table 4.
Summary statistics and percent changes by region, from 2000 to 2013.
As discussed in the previous section, the spatial autocorrelation of the Internet is positive and statistically significant. If we use the ordinary least squares (OLS) method, the presence of spatial autocorrelation will lead to systematic errors in our estimation result. Therefore, we use the maximum likelihood method to estimate the regression models. The results are reported in Table 5.
Table 5.
Parameter estimates for the growth model by region.
Results from Model 1, which covers the whole country, indicate that the coefficients of capital stock, labor, human capital, Internet access and the science and technology environment are positive and statistically significant. Specifically, the coefficient of Internet access is 0.10, which means that the Internet has been an important factor for economic development.
5.1. Heterogeneity
In Models 2 to 4, we examine the role of Internet access separately in the developed (eastern), the developing (central) and the underdeveloped (western) regions. As shown in Table 5, Internet dispersion is positively and significantly associated with the economy, whereas the elasticity of the Internet varies considerably among regions. The coefficient values are 0.13, 0.14 and 0.07 for the eastern, central and western regions, respectively. That is to say, Internet access has been conducive to economic development in the eastern and central regions. The Internet has served as a conduit for economic, scientific and technological exchanges. Rapid dispersion of the Internet has resulted in better access to the market and promoted regional economies.
For the western region, the level of Internet access is only weakly, albeit significantly, associated with the economy (the coefficient is 0.07) for the period of 2000 to 2013. The western region has been underdeveloped and highly dependent on the transfer payments from the central government. The coefficient of fixed asset investment (0.54) shows that the infrastructure spending has had a strongly positive effect on economic development in this region. Because of its relatively weak economy, the western region would has seen a greater increase in per capita GDP than the eastern and the central regions with the same level of investment.
The result also echoes the finding of Malecki [15], which shows the importance of infrastructure and demonstrates that infrastructure investment is likely to lead to greater economic growth in underdeveloped regions than in more developed regions. Meanwhile, Dewan and Min [14] reveal that, in underdeveloped regions, investment in communication infrastructure alone cannot bring sustained economic growth. Regions have to be properly equipped in order to benefit fully from Internet dispersion. The western region covers a vast geographic area and makes it difficult to develop communication infrastructure. Moreover, the western region is sparsely populated, making it less profitable for private enterprises to build infrastructure and to expand Internet access. Therefore, in the absence of policy intervention, the western region may continue to lag behind other regions; and regional inequality is likely to persist between the western region and the rest of the country.
5.2. Potential
We assess the relationship between the level of the science and technology and Internet access. Table 5 shows that the coefficient is 0.08 for the eastern region. That is to say, the Internet has been a production factor and helped boost the economy. Although the level of Internet access is significantly associated with the economy of the central region, the coefficient on the science and technology environment is not statistically significant. In the central region, the science and technology environment has had little effect on the economy, and the Internet has yet to become a production factor in economic development.
There is a large amount of science and technology resource in the eastern region, which has amplified the effects of the Internet and promoted regional development. In 2013, the eastern region had 1,756,750 full-time equivalent of R&D personnel (70.4% of the national total). Major enterprises spent 96.56 billion USD (72.0% of the national total) on R&D, which was substantially higher than that of the central region (18.3%) and the western region (9.7%). The intensity of the R&D expenditure is also higher in the eastern region than in the central and western regions. Therefore, the eastern region has benefited greatly from Internet dispersion. In contrast, the western region has lagged far behind due to limited science and technology resource. Furthermore, government policy has contributed to technological spillover in the selected cities of the eastern region [60]. Technological, structural, spatial and institutional ‘‘mismatches’’ may hinder the “global pipelines” of knowledge exchange [61].
The Internet has become an important channel of capital and technology flow in the knowledge economy. The digital divide has become a key factor that separates regional economies, making it difficult for the Chinese economy to grow in “a balanced and sustainable way” [6].
6. Spillover Effect of the Internet
In this section, we examine how the economy spills over to the neighboring regions through the Internet and whether the spillover has increased or reduced regional inequality. As discussed before, we hypothesize that there are three channels of spatial spillover: economy, proximity and urbanization. Thus, we construct three spatial weight matrices to examine the relative importance of the three channels. The level of Internet access in neighboring regions is introduced into the endogenous economic growth model, and the estimated results are reported in Table 6.
Table 6.
Parameter estimates for the spillover effect of the Internet.
Table 6 reports positive and significant spillovers of the Internet through the three channels: economy (0.10), proximity (0.09) and urbanization (0.07). Results also show that the level of Internet access is associated not only with local economic growth, but also with the economies of neighboring regions that belong to the same network. Similarly, Table 6 shows that the coefficients for Internet access are 0.04, 0.04 and 0.04. The sum is 0.12, which is higher than the coefficient (0.10) of Internet access in Model 1, which assumes no spillover. Therefore, we have to consider the spillover effect of the Internet in order to properly evaluate the effect of Internet access on regional economies.
The result demonstrates that the spillover effects of the Internet are potent and statistically significant. The results also imply that the spillover effect of the Internet is strongest through the economy channel, followed by geographic proximity and urbanization.
6.1. Economy as a Channel of Internet Spillover
In this section, we consider economy as a channel for spillover. Model 5 demonstrates that the coefficient of the spillover variable has reached 0.10, which is larger than that of the other two channels. There is the evidence for a hierarchical diffusion process that transcends geographical boundaries. In China, the Internet became available in developed provinces first. The spillover effect of the Internet is most evident in developed provinces, probably because there are frequent economic and trade activities.
Generally, developed provinces have invested heavily in human capital and information technology. They are in the process of upgrading their industry from labor- and capital-intensive to technology-intensive. Meanwhile, interregional knowledge spillovers have taken place between adjacent regions and between regions having similar technological capacity [62,63].
Provinces with a strong economy often have a higher capacity to absorb new technology and a higher propensity for infrastructure investment. They are also more capable of implementing large-scale research and development activities, making the Internet a more productive factor in economic growth. The spillover effect of the Internet seems to have expanded the gap between developed and underdeveloped regions.
6.2. Geographical Proximity as a Channel of Internet Spillover
We investigate the spillover effect of the Internet with geographic proximity as the main variable. The results are shown in Model 6. The coefficient of the spillover effect is 0.09, which confirms the positive spillover effect of the Internet. In other words, while the Internet has facilitated communications over long distances, geographic proximity still matters.
There is a strong spatial autocorrelation in Internet access. Beijing and Shanghai, two growth hotspots, have affected their neighboring regions. Geographic proximity has facilitated the regional integration of talent, knowledge and technology.
The dispersion of the Internet has promoted the economic development of neighboring regions. However, there is the evidence of distance decay effects: the central and western regions seem to have suffered from “information poverty”. One possible way to mitigate this problem is to develop information-hub cities in the central and western regions in order to create the potential for a ripple effect and help spread information to other inland provinces.
6.3. Urbanization as a Channel of Internet Spillover
Finally, we investigate the spillover effect through urbanization in Model 7; the coefficient of spillover is 0.07. The result reflects the hierarchical nature of Internet dispersion, as well, namely, the spillover effect of the Internet is evident in highly urbanized regions.
The Internet has amplified the spillover effects in regions that have a high level of human capital stock. Audretsch and Feldman [64] emphasize the importance of human capital in the knowledge spillover theory. Henderson and Wang [65] find that democratization and technological sophistication are associated with city growth. In particular, technological advancement has helped large cities more than small ones. Regions can stimulate innovation and boost economic growth by improving their ability to learn new knowledge and absorb new technology.
Social networks and social capital have also affected the efficiency of the Internet spillovers. According to the CNNIC, only 28.6% of China’s Internet users live in the rural areas of China. In contrast, 46.3% of all residents in China live in rural areas. Internet speed remains slow in rural areas. Urban areas have benefited disproportionately from Internet dispersion and the spillover effect.
7. Conclusions
We have studied regional inequality in Internet access and in economic development. We have examined the extent to which the Internet has affected regional economies in China, by analyzing province-level panel data and by examining the spillover effects of the Internet and the channels through which the effects are most evident.
We have examined Internet access. Regional differences in Internet penetration have narrowed over time; Internet access has become more widely available across the country. There is significant spatial autocorrelation in Internet penetration. The hotspot analysis shows that Internet access has extended from core cities to neighboring coastal provinces, indicating the importance of the spillover effect and the agglomeration effect of the Internet. However, there are still large differences in the speed of the Internet, which deserves more attention in future studies.
Our results show that regional economic inequality has been significantly lessened from 2000 to 2013. The economy has grown rapidly in China; the western region has had the highest growth rate, helped in a part by capital investment and transfer payments from the central government. The western region also started from a very low base in 2000, the beginning of the study period.
The Internet has become a significant production factor throughout China. Controlling for other factors, the number of Internet users (the measure of Internet access) is positively and significantly associated with economic development. This is true for both developed and underdeveloped regions. Interestingly, the spillover effect is strong and significant in the central region, even though it is less developed than the eastern region. In contrast, the Internet has played a relatively weak role in the western region, where the spillover effect is about half of that in the other regions. In other words, the economy of the western region would have grown even faster had the Internet been a more important production factor.
Not surprisingly, the level of science and technology is positively associated with economic development for the whole country. That is, the economy tends to prosper where there is a strong science and technology environment. However, the association is not statistically significant in the central and western regions. In other words, investment in science and technology may have had limited impact on the economies of these two regions. Meanwhile, the level of human capital is negatively, albeit only slightly, associated with economic development in the western region. This counter-intuitive finding suggests that the western region may not have followed the traditional model of economic development. The central government has played an outsized role in the economic development of the western region, which may have distorted the role of human capital as a production factor. If the current trend persists, those in the western region may be discouraged from investing in human capital as a way to improve the economy.
Furthermore, we have improved the traditional growth model by incorporating the Internet as a production factor, by examining the spillover effect of the Internet with province-level panel data from 2000 to 2013 and by incorporating a spatial weight matrix. We have found that there is a positive spillover effect of the Internet, suggesting that Internet dispersion has supported economic growth. This result also shows that the agglomeration effect and the spillover effect of the Internet are important to the study of regional development. Unfortunately, in the absence of policy intervention, Internet dispersion is likely to increase regional inequalities in China. This is due to the unequal access to the Internet and the spillover effect of the Internet.
Our results have also demonstrated that the spillover effect of the Internet has come through three major channels: economy, proximity and urbanization. Internet dispersion and economic development are mutually reinforcing. The Internet promotes the economy of neighboring regions through spillover effects. The spillover effects of the Internet are most evident in urban areas.
While the inequality in China’s Internet access has been gradually narrowed, the Internet has yet to become a major factor in the economic development of the western region. Underdeveloped regions tend to have limited Internet infrastructure and a relatively low level of science and technology. Moreover, the western region has little to benefit from the spillover effect of the Internet, probably because of its remote location, low population density, relative weak economy and lower level of urbanization. If the current trend persists, the central government has to continuously provide capital investment and income transfer to the western region in order to maintain its economic growth and reduce regional inequality. Such investment may continuously distort the market.
It is China’s national policy to reduce the regional inequality between the western and eastern regions. To accomplish this goal, the central government has invested heavily in the western region. However, such investment may not be sustainable in the long run. If the goal is to have the best return on investment, the development policy should focus on three main areas. First, the central and western regions should perhaps focus on the development of Internet infrastructure, so that they can fully exploit the Internet as a production factor. Second, since the spillover effect of the Internet is strongest in urban areas, public policy should support mobility and facilitate labor migration from rural to urban areas. Third, public policy should support the key cities of the western region, including Chongqing, Xi’an and Chengdu. Our research shows that, even though it has the potential to increase inequality within the western region, investment in these key cities is likely to yield more bang for the buck.
There are limitations to this study. First, we have made specific assumptions and ignored certain factors such as local government policy and migration. Second, we have separately identified and examined the three channels of spillover, which are perhaps interconnected. Third, Internet penetration is one of many factors that have affected economic development. The causal relationship is more complex than we posit in our analysis. Fourth, it is necessary to extend our study to a longer period of time, to study the speed of Internet access, examine the emergence of mobile technology and understand the relationship between high-speed Internet and regional economic development.
Acknowledgments
The authors would like to acknowledge funding from the Natural Science Foundation of China (41329001; 41371175), the Project of Key Research Institute of Humanities and Social Sciences at Universities (13JJD840010) funded by Ministry of Education of China, and the Ford Foundation of the USA (0155–0883).
Author Contributions
Juan Lin and Yehua Dennis Wei contributed to research design and data analysis. Juan Lin, Zhou Yu, Yehua Dennis Wei and Mingfeng Wang wrote the paper. All authors have read and approved the final manuscript.
Conflicts of Interest
The authors declare no conflict of interest.
Appendix A
In this study, China is separated into three regions: the eastern region includes 11 provinces and direct-controlled cities: Beijing, Tianjin, Hebei, Liaoning, Shanghai, Jiangsu, Zhejiang, Fujian, Shandong, Guangdong and Hainan; the central region includes eight provinces: Shanxi, Jilin, Heilongjiang, Anhui, Jiangxi, Henan, Hubei and Hunan; the western region includes 12 provinces, a direct-controlled city and autonomous regions: Inner Mongolia, Guangxi; Chongqing, Sichuan, Guizhou, Yunnan, Tibet, Shaanxi, Gansu, Qinghai, Ningxia and Xinjiang.
References
- Choi, C.; Yi, M.H. The effect of the internet on economic growth: Evidence from cross-country panel data. Econ. Lett. 2009, 105, 39–41. [Google Scholar] [CrossRef]
- Czernich, N.; Falck, O.; Kretschmer, T.; Woessmann, L. Broadband infrastructure and economic growth. Econ. J. 2011, 121, 505–532. [Google Scholar] [CrossRef]
- Vu, K.M. ICT as a source of economic growth in the information age: Empirical evidence from the 1996–2005 period. Telecommun. Policy 2011, 35, 357–372. [Google Scholar] [CrossRef]
- Kenny, C. The Internet and economic growth in less-developed Countries: A case of managing expectations? Oxf. Dev. Stud. 2003, 31, 99–113. [Google Scholar] [CrossRef]
- Noh, Y.-H.; Yoo, K. Internet, inequality and growth. J. Policy Model. 2008, 30, 1005–1016. [Google Scholar] [CrossRef]
- Harwit, E. Spreading telecommunications to developing areas in China: Telephones, the Internet and the digital divide. China Q. 2004, 180, 1010–1030. [Google Scholar] [CrossRef]
- Li, R.; Shiu, A. Internet diffusion in China: A dynamic panel data analysis. Telecommun. Policy 2012, 36, 872–887. [Google Scholar] [CrossRef]
- CNNIC. The 33rd Statistical Report on Internet Development in China; Internet Network Information Center: Beijing, China, 2014. [Google Scholar]
- Hwang, J.-S. Digital divide in internet use within the urban hierarchy: The case of South Korea. Urban Geogr. 2004, 25, 372–389. [Google Scholar] [CrossRef]
- Wheeler, D.C.; O’Kelly, M.E. Network topology and city accessibility of the commercial Internet. Prof. Geogr. 1999, 51, 327–339. [Google Scholar] [CrossRef]
- Zook, M.A. Grounded capital: Venture financing and the geography of the Internet industry, 1994–2000. J. Econ. Geogr. 2002, 2, 151–177. [Google Scholar] [CrossRef]
- Leamer, E.E.; Storper, M. The economic geography of the internet age. J. Int. Bus. Stud. 2001, 32, 641–665. [Google Scholar] [CrossRef]
- Sinai, T.; Waldfogel, J. Geography and the Internet: Is the Internet a Substitute or a Complement for Cities? J. Urban Econ. 2004, 56, 1–24. [Google Scholar] [CrossRef]
- Dewan, S.; Min, C.-K. The substitution of information technology for other factors of production: A firm level analysis. Manag. Sci. 1997, 43, 1660–1675. [Google Scholar] [CrossRef]
- Malecki, E.J. The economic geography of the Internet’s infrastructure. Econ. Geogr. 2002, 78, 399–424. [Google Scholar] [CrossRef]
- Huang, L.; Liu, X.; Xu, L. Regional innovation and spillover effects of foreign direct investment in China: A threshold approach. Reg. Stud. 2012, 46, 583–596. [Google Scholar] [CrossRef]
- Parrado, R.; De Cian, E. Technology spillovers embodied in international trade: Intertemporal, regional and sectoral effects in a global CGE framework. Energy Econ. 2014, 41, 76–89. [Google Scholar] [CrossRef]
- Yu, N.; De Jong, M.; Storm, S.; Mi, J. Spatial spillover effects of transport infrastructure: Evidence from Chinese regions. J. Trans. Geogr. 2013, 28, 56–66. [Google Scholar] [CrossRef]
- Wang, Y.-C. Evidence of public capital spillovers and endogenous growth in Taiwan. Econ. Model. 2014, 39, 314–321. [Google Scholar] [CrossRef]
- Ying, L.G. Measuring the spillover effects: Some Chinese evidence. Pap. Reg. Sci. 2000, 79, 75–89. [Google Scholar] [CrossRef]
- Rho, S.; Moon, I.J. Innovation and spillovers in China: Spatial econometric approach. Seoul J. Econ. 2014, 27, 149–170. [Google Scholar]
- Glaeser, E.L. Learning in cities. J. Urban Econ. 1999, 46, 254–277. [Google Scholar] [CrossRef]
- Li, K. 2015 Government Work Report; The State Council of the People’s Republic of China: Beijing, China, 2015.
- Romm, J. The internet and the new energy economy. Resour. Conserv. Recycl. 2002, 36, 197–210. [Google Scholar] [CrossRef]
- Močnik, D.; Širec, K. The determinants of Internet use controlling for income level: Cross-country empirical evidence. Inf. Econ. Policy 2010, 22, 243–256. [Google Scholar] [CrossRef]
- Zhang, J. China’s dynamic industrial sector: The internet industry. Eurasian Geogr. Econ. 2008, 49, 549–568. [Google Scholar] [CrossRef]
- Wei, Y.D. Regional Development in China: States, Globalization and Inequality; Routledge: London, UK, 2013. [Google Scholar]
- Wei, Y.H.D.; Zhou, Y.; Sun, Y.; Lin, G.C.S. Production and R&D networks of foreign ventures in China: Implications for technological dynamism and regional development. Appl. Geogr. 2012, 32, 106–118. [Google Scholar]
- Sun, C.; Jiao, H.; Ren, Y. Regional Informatization and Economic Growth in Japan: An Empirical Study Based on Spatial Econometric Analysis. Sustainability 2014, 6, 7121–7141. [Google Scholar] [CrossRef]
- Choi, C. Does the Internet stimulate inward foreign direct investment? J. Policy Model. 2003, 25, 319–326. [Google Scholar] [CrossRef]
- Doong, S.H.; Ho, S.-C. The impact of ICT development on the global digital divide. Electron. Commer. Res. Appl. 2012, 11, 518–533. [Google Scholar] [CrossRef]
- Billón, M.; Ezcurra, R.; Lera-López, F. The spatial distribution of the internet in the European Union: Does geographical proximity matter? Eur. Plan. Stud. 2008, 16, 119–142. [Google Scholar] [CrossRef]
- Vicente, M.R.; López, A.J. Assessing the regional digital divide across the European Union-27. Telecommun. Policy 2011, 35, 220–237. [Google Scholar] [CrossRef]
- Chen, W.; Wellman, B. The global digital divide—Within and between countries. IT Soc. 2004, 1, 39–45. [Google Scholar]
- Morgan, K. The exaggerated death of geography: Learning, proximity and territorial innovation systems. J. Econ. Geogr. 2004, 4, 3–21. [Google Scholar] [CrossRef]
- Bekkerman, A.; Gilpin, G. High-speed Internet growth and the demand for locally accessible information content. J. Urban Econ. 2013, 77, 1–10. [Google Scholar] [CrossRef]
- Caragliu, A.; Del Bo, C. Determinants of spatial knowledge spillovers in Italian provinces. Socio Econ. Plan. Sci. 2011, 45, 28–37. [Google Scholar] [CrossRef]
- Sawada, N. Technology gap matters on spillover. Rev. Dev. Econ. 2010, 14, 103–120. [Google Scholar] [CrossRef]
- Starrs, P.F. The sacred, the regional, and the digital. Geogr. Rev. 1997, 87, 193–218. [Google Scholar] [CrossRef]
- Funke, M.; Niebuhr, A. Regional geographic research and development spillovers and economic growth: Evidence from West Germany. Reg. Stud. 2005, 39, 143–153. [Google Scholar] [CrossRef]
- Rodríguez-Pose, A.; Crescenzi, R. Research and development, spillovers, innovation systems, and the genesis of regional growth in Europe. Reg. Stud. 2008, 42, 51–67. [Google Scholar] [CrossRef]
- Pick, J.; Nishida, T.; Zhang, X. Determinants of China’s Technology Availability and Utilization 2006–2009: A Spatial Analysis. Inf. Soc. 2013, 29, 26–48. [Google Scholar] [CrossRef]
- Moreno, R.; Paci, R.; Usai, S. Spatial spillovers and innovation activity in European regions. Environ. Plan. A 2005, 37, 1793–1812. [Google Scholar] [CrossRef]
- Birba, O.; Diagne, A. Determinants of adoption of Internet in Africa: Case of 17 sub-Saharan countries. Struct. Chang. Econ. Dyn. 2012, 23, 463–472. [Google Scholar] [CrossRef]
- Liefner, I.; Wei, Y.D.; Zeng, G. The Innovativeness and Heterogeneity of Foreign-Invested High-Tech Companies in Shanghai. Growth Chang. 2013, 44, 522–549. [Google Scholar] [CrossRef]
- Qian, H.; Acs, Z.J. An absorptive capacity theory of knowledge spillover entrepreneurship. Small Bus. Econ. 2013, 40, 185–197. [Google Scholar] [CrossRef]
- Kolenda, R.; Liu, C.Y. Are central cities more creative? The intrametropolitan geography of creative industries. J. Urban Aff. 2012, 34, 487–512. [Google Scholar] [CrossRef]
- Liu, C.Y.; Xie, W. Creativity and Inequality: The Dual Path of China’s Urban Economy? Growth Chang. 2013, 44, 608–630. [Google Scholar] [CrossRef]
- Hara, M.; Nagao, T.; Hannoe, S.; Nakamura, J. New Key Performance Indicators for a Smart Sustainable City. Sustainability 2016, 8, 206. [Google Scholar] [CrossRef]
- Wang, M.; Liao, F.H.; Lin, J.; Huang, L.; Gu, C.; Wei, Y.D. The Making of a Sustainable Wireless City? Mapping Public Wi-Fi Access in Shanghai. Sustainability 2016, 8, 111. [Google Scholar] [CrossRef]
- Lucas, R.E. On the mechanics of economic development. J. Monet. Econ. 1988, 22, 3–42. [Google Scholar] [CrossRef]
- Romer, P.M. Increasing returns and long-run growth. J. Political Econ. 1986, 94, 1002–1037. [Google Scholar] [CrossRef]
- Sassi, S.; Goaied, M. Financial development, ICT diffusion and economic growth: Lessons from MENA region. Telecommun. Policy 2013, 37, 252–261. [Google Scholar] [CrossRef]
- National Bureau of Statistics of China. China Statistical Yearbook; National Bureau of Statistics of China: Beijing, China, 2014.
- Zhang, J.; Wu, G.; Zhang, J. The estimation of China’s provincial capital stock: 1952–2000. Econ. Res. J. 2004, 10, 35–44. [Google Scholar]
- Li, D.; Wei, Y.D.; Wang, T. Spatial and temporal evolution of urban innovation network in China. Habitat Int. 2015, 49, 484–496. [Google Scholar] [CrossRef]
- BDA. Report on China Broadband Speed (Second Half of 2013); Broadband Development Alliance: Beijing, China, 2013. [Google Scholar]
- Wang, Z.; Cheng, Y.; Ye, X.; Wei, Y. Analyzing the space-time dynamics of innovation in China: ESDA and spatial panel approaches. Growth Chang. 2015, 47, 111–129. [Google Scholar] [CrossRef]
- Liefner, I.; Wei, Y.D. Innovation and Regional Development in China; Routledge: Abingdon, UK, 2013. [Google Scholar]
- Yang, C. Government policy change and evolution of regional innovation systems in China: Evidence from strategic emerging industries in Shenzhen. Environ. Plan. C Gov. Policy 2015, 33, 661–682. [Google Scholar] [CrossRef]
- Wei, Y.H.D.; Liefner, I.; Miao, C.-H. Network configurations and R&D activities of the ICT industry in Suzhou municipality, China. Geoforum 2011, 42, 484–495. [Google Scholar]
- Greunz, L. Geographically and technologically mediated knowledge spillovers between European regions. Ann. Reg. Sci. 2003, 37, 657–680. [Google Scholar] [CrossRef]
- Fischer, M.M.; Scherngell, T.; Jansenberger, E. Geographic localisation of knowledge spillovers: Evidence from high-tech patent citations in Europe. Ann. Reg. Sci. 2009, 43, 839–858. [Google Scholar] [CrossRef]
- Audretsch, D.B.; Feldman, M.P. Knowledge spillovers and the geography of innovation. Handb. Reg. Urban Econ. 2004, 4, 2713–2739. [Google Scholar]
- Henderson, J.V.; Wang, H.G. Urbanization and city growth: The role of institutions. Reg. Sci. Urban Econ. 2007, 37, 283–313. [Google Scholar] [CrossRef]
© 2017 by the authors. Licensee MDPI, Basel, Switzerland. This article is an open access article distributed under the terms and conditions of the Creative Commons Attribution (CC BY) license (http://creativecommons.org/licenses/by/4.0/).