Article

The Role of Sustainability Resources of Large Greenhouse Gas Emitters: The Case of Corporations in Alberta, Canada

1
Faculty of Environmental Design, University of Calgary, 2500 University Drive NW, Calgary, AB T2N 1N4, Canada
2
Faculty of Environmental Design, Athena Chair in Life Cycle Assessment in Design, University of Calgary, 2500 University Drive NW, Calgary, AB T2N 1N4, Canada
*
Author to whom correspondence should be addressed.
Sustainability 2017, 9(2), 182; https://doi.org/10.3390/su9020182
Submission received: 11 November 2016 / Revised: 17 January 2017 / Accepted: 20 January 2017 / Published: 26 January 2017
(This article belongs to the Section Economic and Business Aspects of Sustainability)

Abstract

:
With the global challenge of climate change, it becomes crucial to understand the factors that can guide carbon intensive companies to comply with environmental regulations through significant reductions in greenhouse gas (GHG) emissions. Using the natural-resource-based view, the argument in this paper is that focusing on sustainability-driven resources by companies is a way to meet environmental compliance and reduce GHG emissions while gaining differential competitive benefits. A specific analysis on Alberta case has discussed large GHG emitters’ environmental compliance mechanisms in the context of their sustainability resources. The aim is examining if large GHG emitters in Alberta related to corporations having sustainability resources are complying with the Specified Gas Emitters Regulation (SGER) reduction requirement through cleaner-production driven internal mechanisms. The paper examines the existence of the sustainability resources in the reporting companies related to large GHG emitters responsible for 86% of total GHG reported by facilities with emissions above the threshold of 100 kilotonnes of GHG per year under SGER in Alberta. Corporations are found not using their sustainability resource potential to achieve internal reductions in GHG emissions throughout their facilities. Thus, some recommendations are presented for Alberta case as well as for environmental regulations in other jurisdictions that can potentially help policy makers improve their climate change regulations and achieve their global targets and enable companies to gain competitive advantage while meeting GHG reduction compliance.

1. Introduction

The role of companies in addressing the global challenge of climate change is indispensable. This is very true specifically for carbon-intensive corporations as meaningful actual reductions in greenhouse gas (GHG) (GHG emissions contain carbon dioxide (CO2), methane (CH4), nitrous oxide (N2O) and other gases [1]) emissions in such companies helps significantly in meeting national and global mitigation targets. The hitherto performance of the corporate world is mixed [2]. There are companies that have made a significant reduction and went beyond environmental compliance while we have companies in carbon intensive sectors that are yet to commit to any meaningful reduction that matches the magnitude of the problem. These differences in corporate behavior have been previously discussed in the literature while focusing on legal factors, social controls, economic factors and individual characteristics in management [2,3,4,5,6,7].
It is crucial to understand how to work around this lack of effective regulatory and/or voluntary commitment and absence of consequential reduction in large GHG emitting corporations. Unless the carbon-intensive industries are onboard, global to local agreements of curbing climate change will fall short of bringing about any momentous progress. Companies as providers of a fertile ground for innovation including environmental innovation have the potential to lead in technological advancements for mitigating climate change and associated impacts. To understand the enabling condition for this kind of advancement, reflecting on the connection between sustainability strategies and climate change measures of corporations as well as the analysis of their internal resource and capability that potentially lead to such innovations becomes important.
The first point of connection helps in creating a synergy between the general sustainability strategies of companies and their specific climate change mitigation goals. Several authors have discussed the need of linking sustainable development and climate change strategies by countries to successfully reduce GHG emissions into safe levels (e.g., Beg et al.; Cohen et al.; and Munasinghe and Swart) [8,9,10]. Increasing sustainability-driven activities in the development path of countries can guide more effective reductions in GHG emissions [11]. Examples of sustainable development strategies and measures such as greater efficiency in electricity consumption, energy efficiency in low-cost housing and poverty tariff, have been presented by Winkler et al. [12]. These previous cases have demonstrated that most sustainable development strategies have succeeded to achieve effective reductions in GHG emissions with strong sustainable benefits [12].
The second point on internal resource and capability of corporations, which is the core of this paper, is the subject of the natural-resource-based view (NRBV) [13]. The definition of valuable resources of a corporation as inspired by the NRBV is broad. Valuable resources are “rare, unique, non-substitutable and inimitable resources” [14] that are deployed to creating a differential competitive advantage. Based on the NRBV, there is a positive relationship between companies being environmentally proactive and possessing resources that could be deployed into innovative capabilities to gain competitive advantage.
An analysis by Hart [13] has discussed companies’ innovations in the environmental challenge and damage we live in with the NRBV. Several authors have built on the concept of NRBV to analyze the different strategies, actions and responses of companies in terms of being proactive and innovative in the environmental arena [13,15,16]. The term “valuable resources” in creating competitive advantage has taken a long discussion in the literature. In line with Hart’s [13] NRBV analysis, several studies have presented some examples of internal valuable resources and capabilities that could lead companies to environmental innovations and reduce their environmental impacts such as the organizational capabilities of stakeholder management through for example shared vision or continuous dialogue and learning (e.g., Hart; Sharma and Vredenburg; and Rueda-Manzanares et al.) [13,16,17]. An empirical paper by Buysse and Verbeke [15] has identified five specific internal resources that can guide companies’ environmental innovations: “strategic planning in environmental issues, formal routine-based environmental management, organizational competencies in environmental management, employees’ environmental skills and training and conventional green competences and technologies”. Building upon Buysse and Verbeke’s [15] empirical work for analyzing corporate environmental strategies using the RBV, a recent study by Backman et al. [18] has developed a RBV conceptual model to discuss companies’ climate change mitigation strategies. Backman and coworkers’ [18] model is based on four main resources: “governance capabilities, information management capabilities, systems capabilities, and technology related investments”. Based on this model, deploying these resources can lead companies to develop climate change mitigation strategies and meet environmental compliance. These environmental strategies and innovations may become a significant source of differential competitive advantage for companies [19].
Regulatory GHG reduction compliance by corporations through mechanisms other than own internal emission reduction such as offset purchasing falls short of becoming a source of competitive advantage as the same mechanisms are available for competitors as well and are easy to replicate. The internal emission reduction mechanism should be uniquely home-grown specific to in-house circumstances in such a way that it is superior to what can be done by the competitors. Competitive advantage is a function of internal and external factors. The internal factors manifest itself in the form of resources and capabilities that deal with the external threats and leverage on externally offered opportunities. Climate change can be seen as an external threat if left undealt with, while acting on climate change causing emissions through internally developed mechanism offers a unique position for companies to gain differential competitive advantage.
An empirical study by Aragon-Correa and Leyva-de la Hiz [20] has concluded that internal resources and capabilities of companies may generate non-environmental innovations as well as environmental innovations. Additionally, they have argued for the existence of a positive relationship between the two types of innovations. In this sense, even companies with non-exclusively internal environmental resources or capabilities and experience can generate environmental innovations that lead to meaningful reductions and increase their competitive benefits.
In the same context, a follow up on Hart [13] after 15 years by Hart and Dowell [21] have discussed the increased interconnection between environmental, economic and social issues, which is called “sustainability challenge”. In this sense, companies’ innovative capabilities and their commitment to sustainability are considered valuable resources that can generate environmental innovations while gaining competitive benefits. Therefore, since climate change is an important part of sustainability challenge, companies with some level of experience of even working with non-climate change sustainability issues can leverage on their knowhow, organizational learning and routine to advance internal resource and capability that can be deployed to achieve meaningful reductions. Sustainable development strategies will not only reduce the environmental burden but also increase the economic and social benefits [21].
Building on the literature discussed above, the term sustainability resource or sustainability-driven resource is used throughout this paper to refer to company strategy and activities in relation to environmental, social and economic sustainability that existed prior to or co-exist with any climate change mitigation activities proactively or in response to a regulatory requirement. This usage is related to an underlying conviction that such sustainability resources, as valuable resources, can be deployed to launch new or significantly improve ongoing internal GHG reduction efforts. Internal GHG reduction mechanism or cleaner production requires strategy, technology, knowhow, manpower, finances, networking and exposure as well as assessment and monitoring. All these can be cultivated through the development and utilization of sustainability resources.
The hypothesis in this paper is that as internal climate change mitigation mechanism benefits from pre-existing or newly developed sustainability-driven resources (sustainability strategies and deployed activities) that are capable of generating reputations leading to differential competitive advantage, large emitters with such resources will tend to use internal mechanism instead of other mechanisms such as offset purchasing and carbon levy [22] in complying with reduction targets. The analysis and discussion in this paper is based on data for large GHG emitting companies in the province of Alberta, western Canada. Canada while making only 0.5% of the global population, its per capita carbon dioxide emissions is close to three times higher than the global carbon dioxide emissions per capita average (calculated using data from The World Bank) [23]. In terms of carbon dioxide equivalent (CO2e) per capita, Canada ranks 15th out of 17 OECD countries with 21 tonnes CO2e per capita in 2013 (only the US and Australia are worse with, respectively, 21.01 and 23.43 tonnes CO2e per capita) [24]. In addition, the province of Alberta has the second highest per-capita level (64 tonnes CO2e /capita) of emissions in Canada, after Saskatchewan [25]. Despite being the first jurisdiction in North America to regulate its GHG emissions with the Specified Gas Emitters Regulation (SGER), Alberta is currently not on track to achieve its own 2020 target of limiting emission increase to 18% above 2005 levels [26]. Accordingly, in this paper, large GHG emitters’ environmental compliance mechanisms in the context of sustainability-driven resources are analyzed.
With this background, the questions posed here are:
Are the companies in Alberta that have sustainability-driven resources complying with the SGER in a different way than the non-resourceful companies?
Do these companies having sustainability resources comply with the SGER’s reduction requirement through internal mechanism of cleaner production?
Considering the infamous role Alberta plays in the overall GHG of Canada, the lessons to be learned from understanding of the factors that can positively contribute to real GHG reductions will have far-reaching implications in other countries that are yet to adopt long-term cost-effective GHG reduction strategies that target corporations and industrial facilities.
In answering the aforementioned questions, this paper examines the existence of the sustainability-driven resources in the reporting companies related to large GHG emitting facilities responsible for 86% of total GHG reported by facilities with emissions above the threshold (i.e., 100,000 tonnes) under SGER in Alberta, focusing on the reporting of parent corporations and using some indicators for the social, environmental and economic dimensions of sustainability. The discussion of these three pillars will help identify the companies having sustainability-driven resources that could be deployed to meet compliance through internal mechanisms of cleaner production. More analysis is conducted to check if the facilities related to parent corporations with sustainability resources are complying with the SGER using internal mechanism. Additional comparative analysis is conducted to check if there is any difference in the compliance mechanisms used between resourceful and non-resourceful corporations. Finally, based on this study results, some recommendations for the Alberta case as well as for other environmental regulations in other jurisdictions that can potentially help policy makers to improve their climate change regulations and achieve their global targets are proposed. In addition, more recommendations are presented to help companies in Alberta and in any other jurisdiction in the world gain a differential competitive advantage while achieving environmental compliance.

2. Materials and Methods

The methods section presents important aspects of the provincial climate change regulation, SGER followed by the presentation of companies analyzed and a description of how the sustainability-driven resources are represented.

2.1. Specified Gas Emitters Regulation (SGER)

The SGER under the provincial Climate Change and Emissions Management Act requires facilities in Alberta that emit more than 100,000 tonnes of direct GHG a year to report their emissions and take actions to reduce their GHG emissions intensity by 15% annually with different emissions intensity baseline for new facilities [22,27]. This carbon intensity reduction has increased from 12% to 15% starting from 2016 and will increase to 20% in 2017 as part of some minor changes to the SGER announced recently by the Government of Alberta [27]. A facility’s direct emissions include all GHG emissions sources on site. The legislation urges companies to make improvements to their production operations, such as the installation of new technology for cleaner production, in order to meet the target of reducing GHG emissions [22]. However, three other alternative mechanisms are allowed by the legislation for emitters who cannot achieve this target through onsite internal reduction. First, companies may purchase offset credits. These offset projects can be generated by facilities in Alberta that are not subject to any regulation and that have voluntarily reduced their GHG emissions [22]. One tonne reduction in CO2e from a non-regulated facility constitutes one unit of offset credit. Second, companies may contribute to the Climate Change and Emissions Management (CCEM) Fund by paying $20 CAD for each tonne of GHG emitted above the threshold [22,27]. This money is collected to invest in research and development, and deploying technology for the future [22]. This carbon levy has increased from $15 per tonne to $20 per tonne starting from 2016 and will increase to $30 per tonne in 2017 as part of the same changes recently announced to the SGER [27]. Third, companies can purchase or use Emission Performance Credits (EPCs). These credits can be generated by regulated entities in Alberta that are able to exceed their emissions reduction target [22]. The EPCs can be banked by regulated facilities for future use or sold for other regulated facilities in Alberta that have not met their emissions reduction target [22]. Major revisions are still to be considered to the SGER in the coming years (2018 and beyond) based on the advisory panel’s report led by the economist Andrew Leach [28].
During 2007–2012, compliance with the SGER expressed in amount of emission reductions was mostly accomplished through payments into the CCEM fund and offset credits [29]. As noted by a report for Pembina Institute in 2013, the way most of these emitters are responding by other mechanisms instead of reducing GHG emissions through internal mechanism is not helping in achieving Alberta’s 2020 target [30].
Therefore, using the background presented in the introduction, we discuss the environmental compliance mechanisms used by large GHG emitters in Alberta in the context of their sustainability-driven resources.

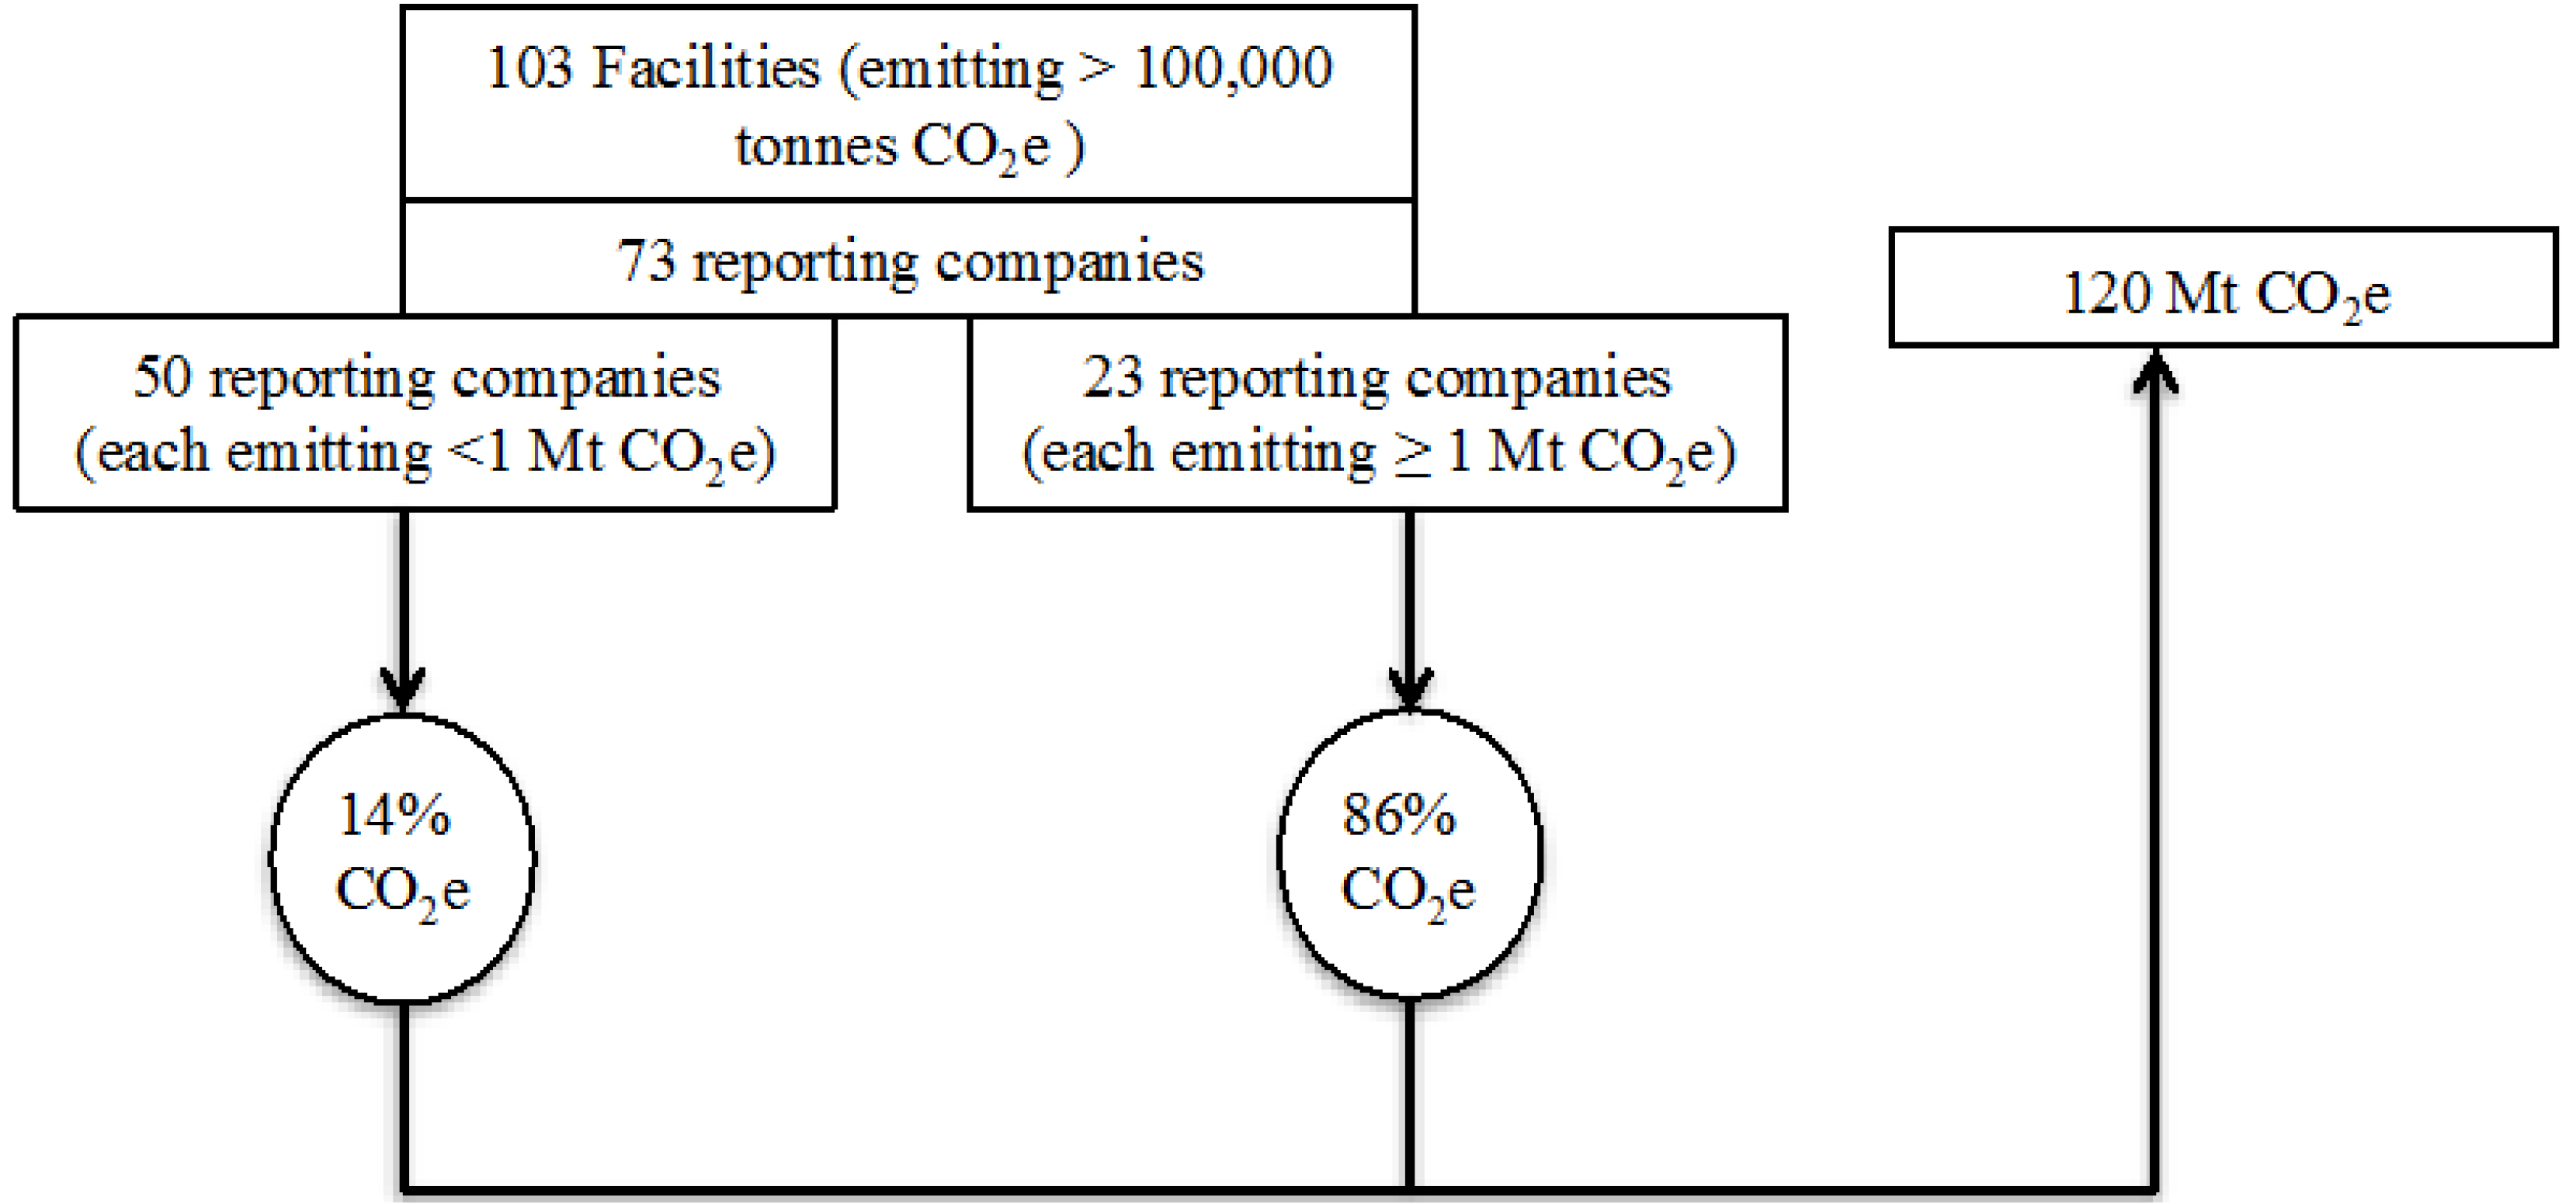
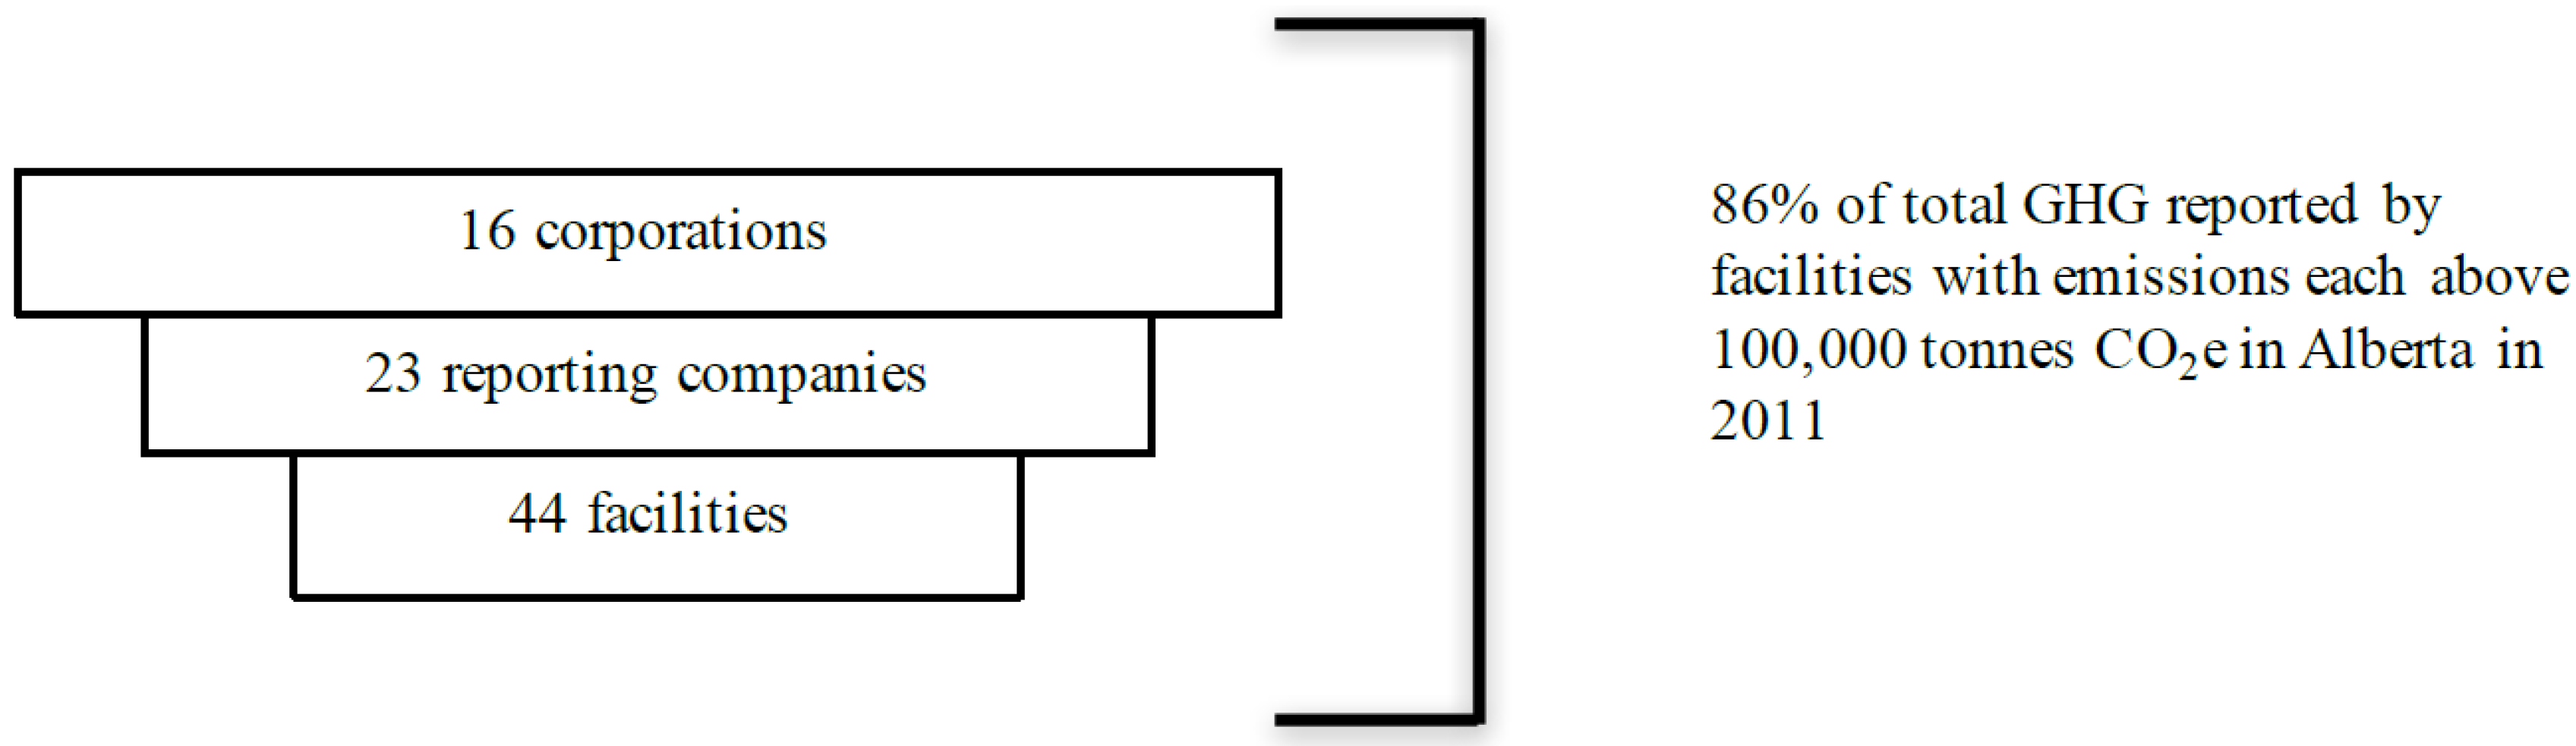
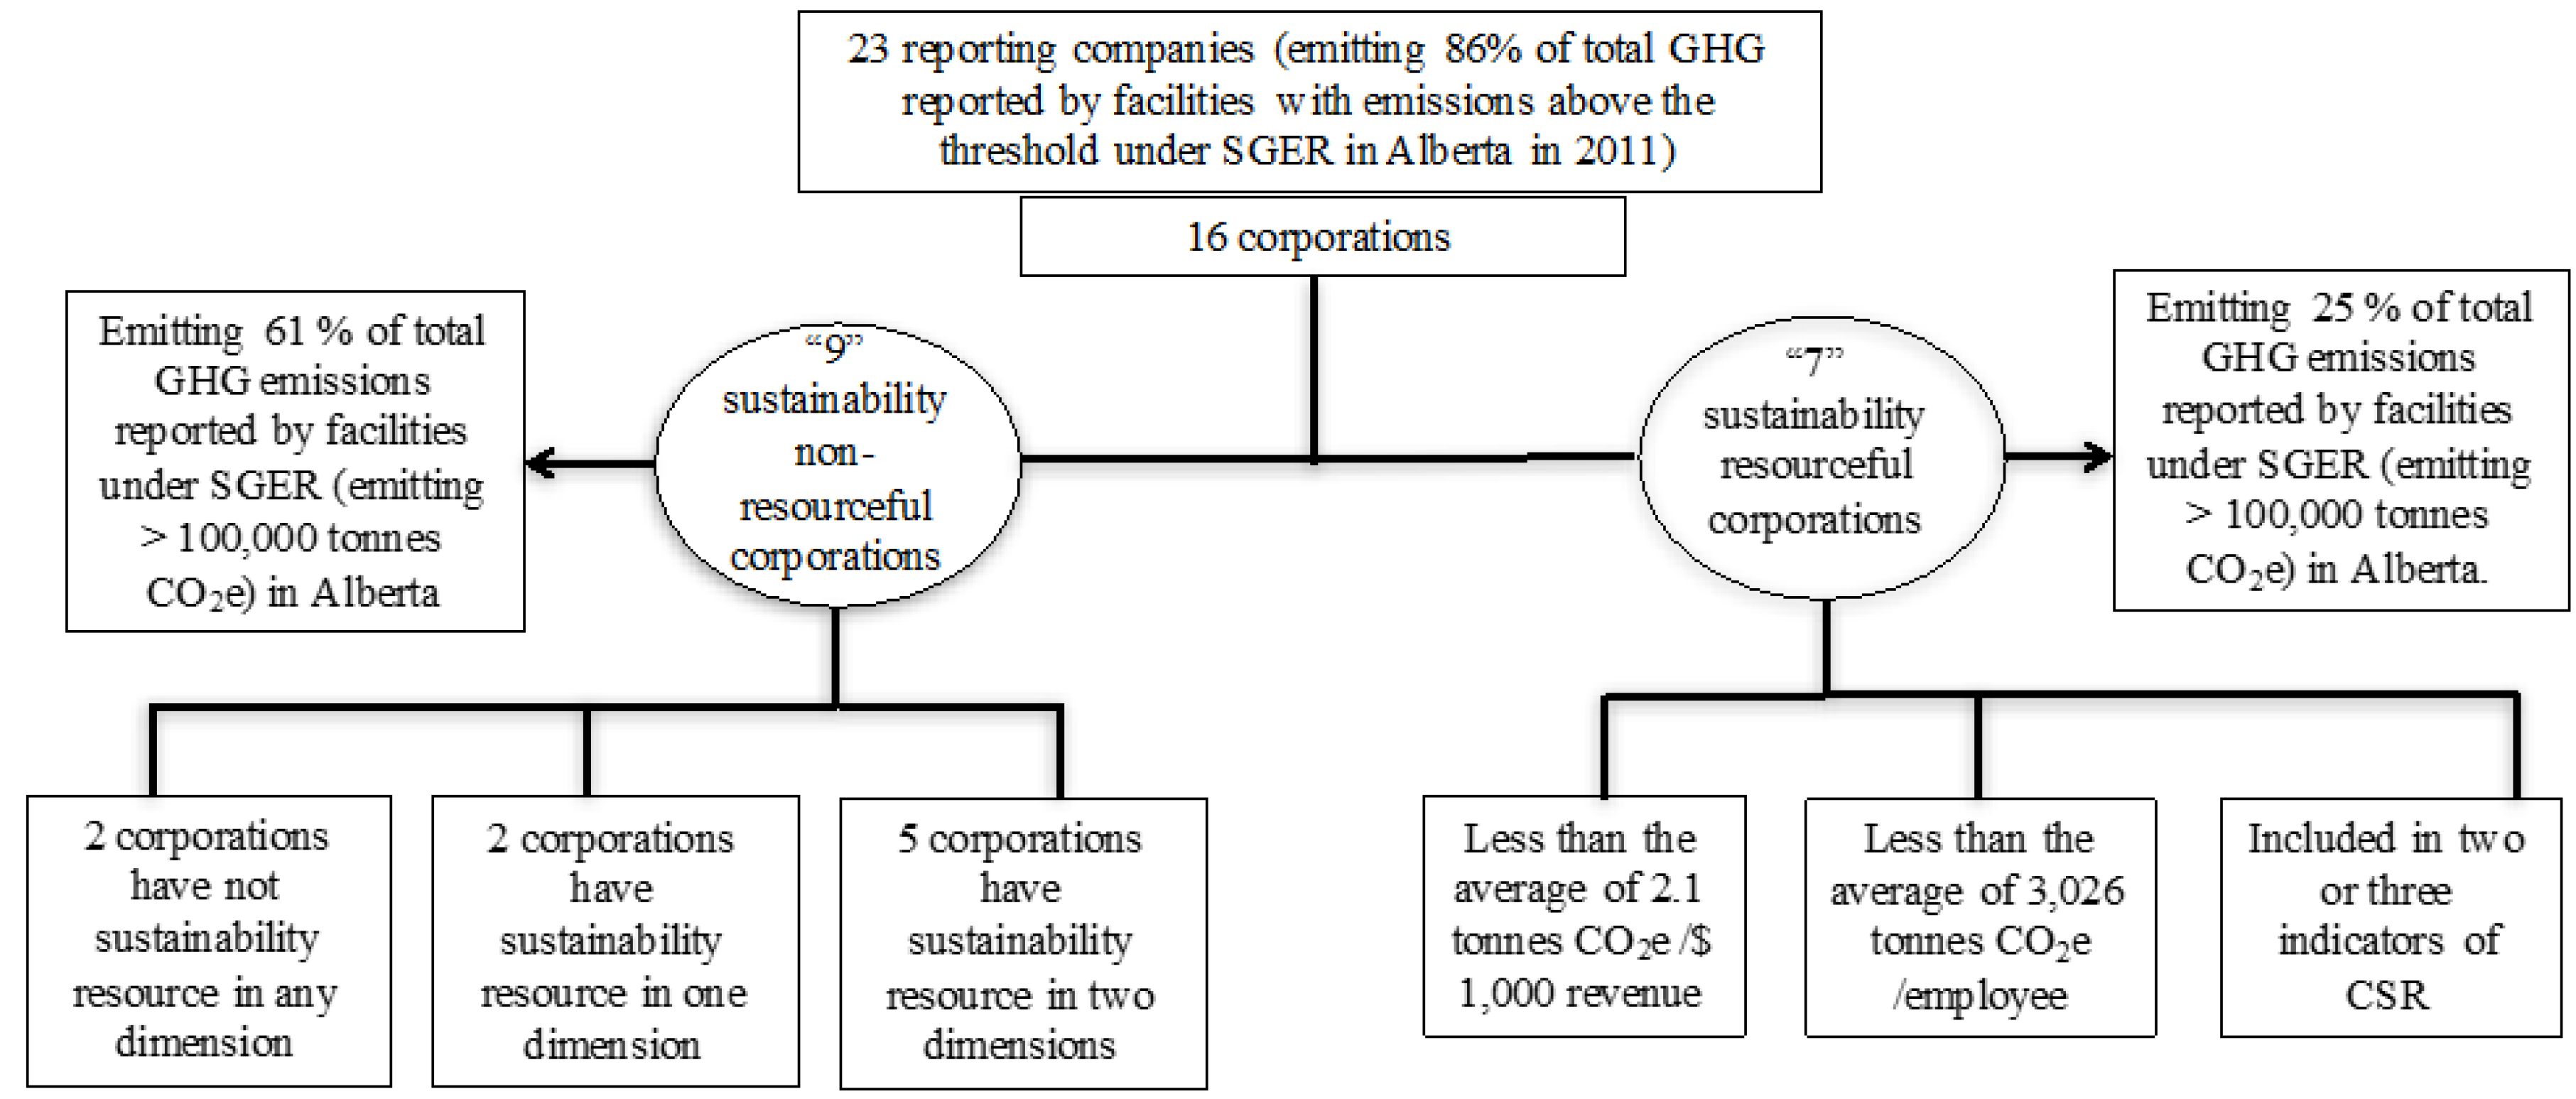
2.2. Companies Analyzed

The first step of the study is the analysis of the large GHG emitters responsible for the largest amount of GHG emissions in Alberta based on the latest published list from Alberta Environment and Sustainable Resource Development for 2011 with reported GHG emissions in CO2e [31]. To focus on these large emitters responsible for the largest amount of GHG emissions, all facilities in the list (103 facilities) emitting more than 100,000 tonnes of CO2e are analyzed. This list used in the analysis is presented in Supplementary Material 1 as part of the dataset used in this study. Facilities are first grouped by reporting company, to calculate the total emissions for facilities related to the same reporting company, which is for the facility under consideration (i.e., the owner of the facility, the holder of the approval or registration) [1]. Seventy-three reporting companies are found responsible for 103 facilities emitting approximately 120 Mt CO2e (see Figure 1). The 73 reporting companies are divided between those responsible each for 1 Mt CO2e and more and those emitting less than 1 Mt CO2e each. In this list, 23 reporting companies, each responsible for 1 Mt CO2e or more, are found emitting approximately 86% of total GHG reported by facilities with emissions above the threshold in Alberta, while 50 reporting companies each responsible for less than 1 Mt CO2e emit just 14% of total GHG reported by large GHG emitters under SGER in Alberta (see Figure 1). Thus, it is assumed that the 23 companies emitting the greatest amount of GHG emissions will have the largest impact by taking part in effective programs to reduce GHG and, thus, in helping Alberta achieve its 2020 target.
The 23 reporting companies represent different sectors (i.e., oil sands, oil and gas, electric power generation, chemical and fertilizer manufacturing, petroleum and coal products and pipeline transportation). This classification of the sectors is using the SGER classification of the large GHG emitters in Alberta from the published list of Alberta Environment and Sustainable Resource Development for 2011 with reported GHG emissions in CO2e [31].
Detailed analysis of the 23 reporting companies is the second step of this study. The strategic decisions to allocate resources on making improvements in the production operations of facilities are normally made at the parent corporation level within the corporate level strategy [32]. Therefore, an analysis of the profile of the corporations responsible for the 23 reporting companies is conducted.
The 23 reporting companies are thus grouped by parent corporation to calculate the total GHG emissions by corporation. Sixteen corporations are found responsible for the 23 reporting companies including 44 facilities emitting 86% of total GHG reported by facilities with emissions above the threshold (100,000 tonnes of GHG) in Alberta in 2011 (see Figure 2). A presentation of these corporations with their associated reporting companies, facilities with sectors and total emissions is set out in Supplementary Material 2 (Table S2).

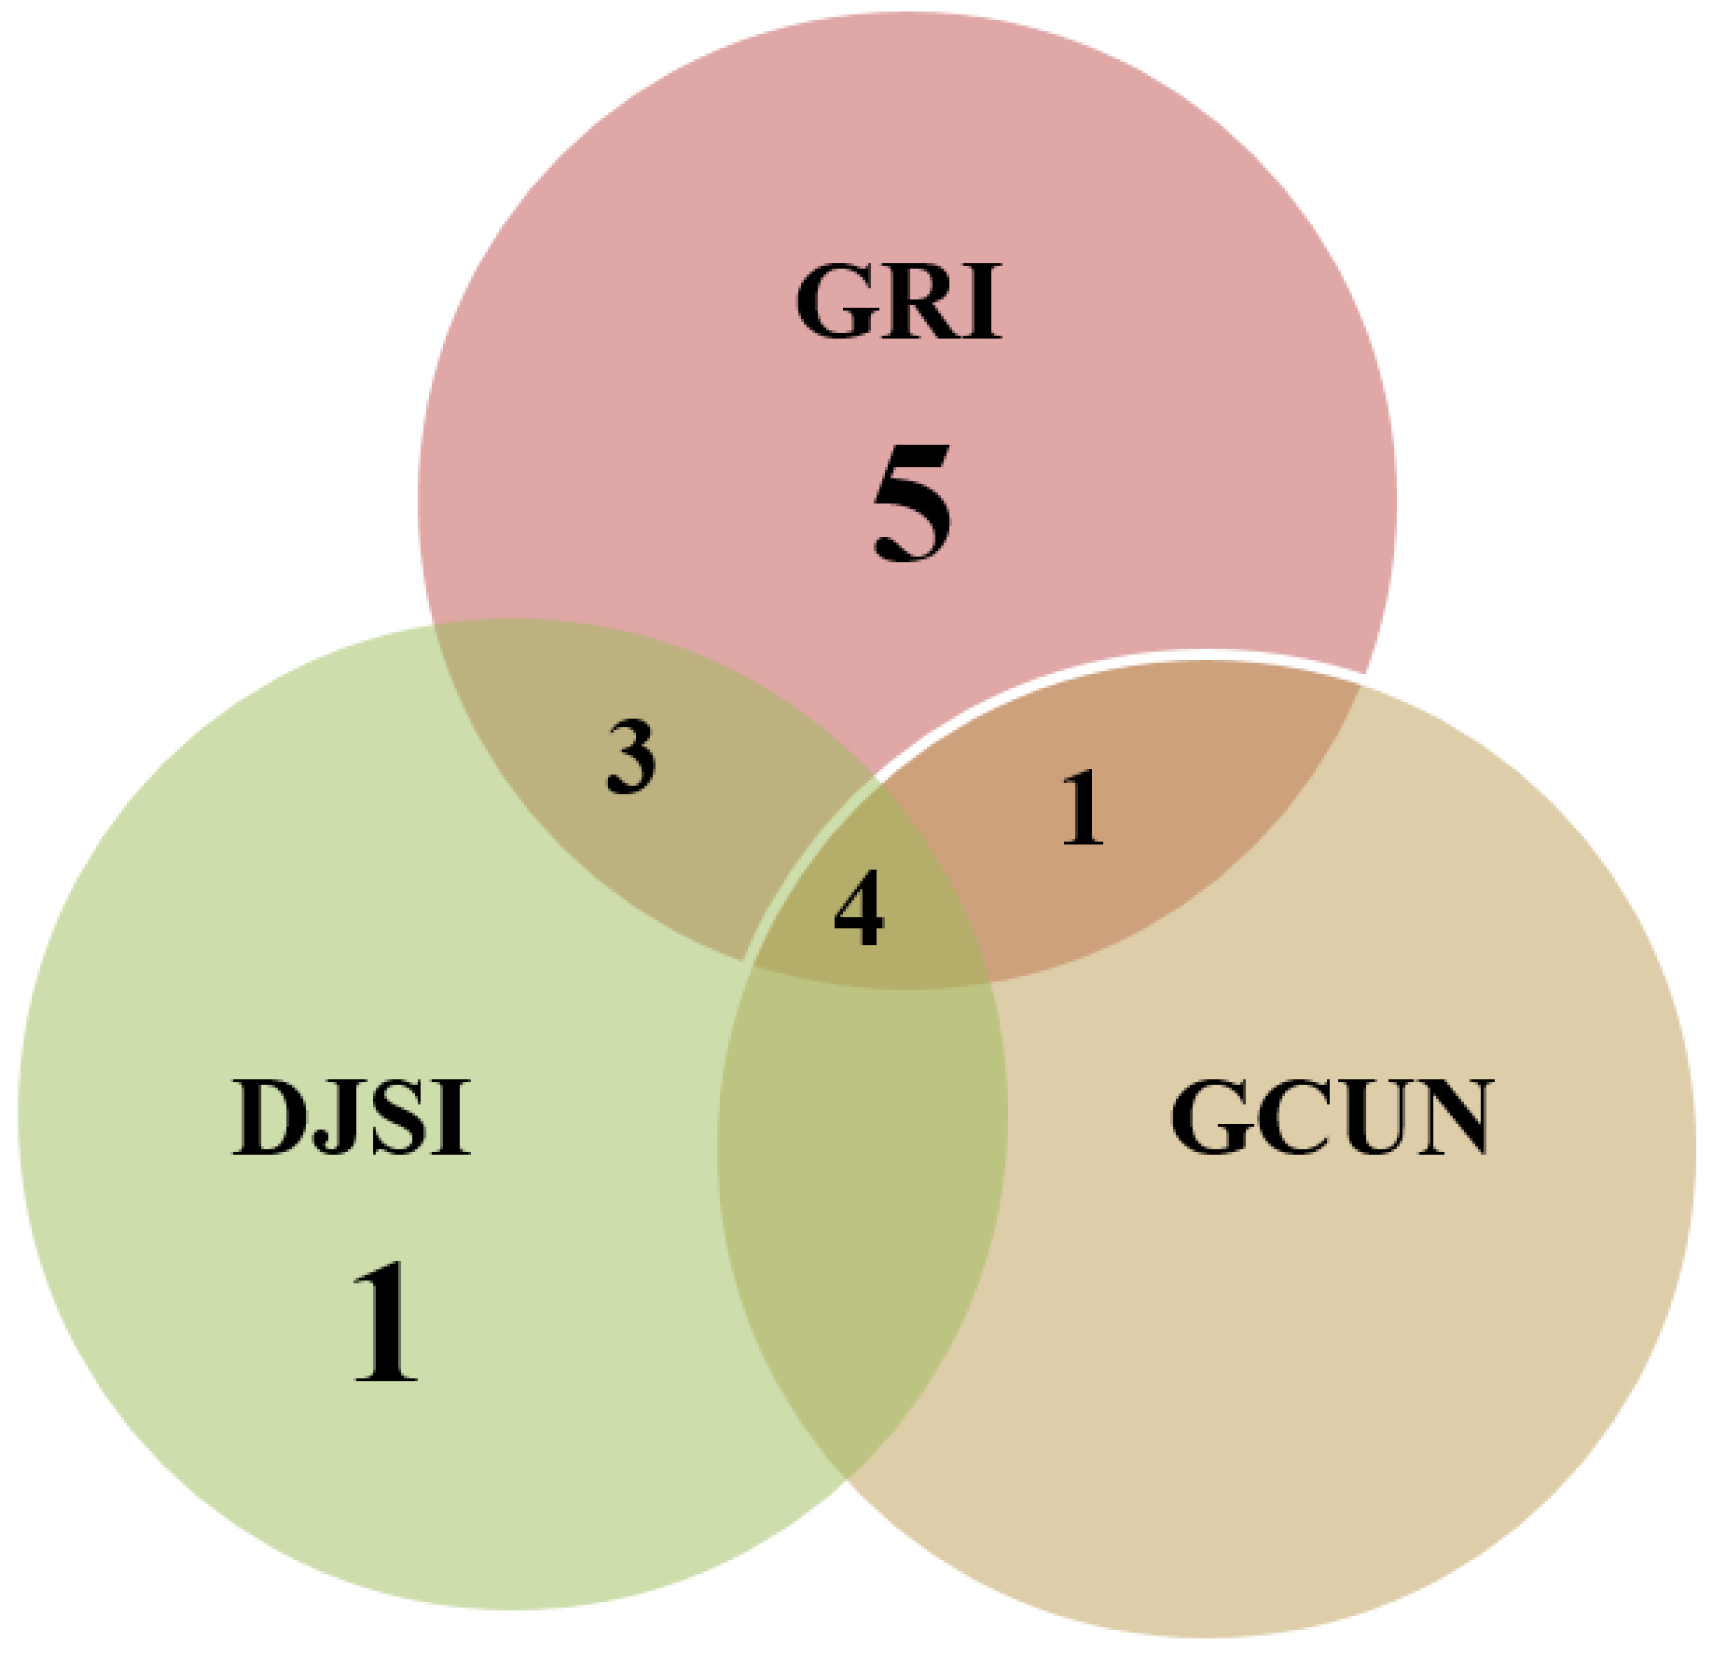
2.3. Sustainability-Driven Resources

To analyze the sustainability-driven resources of these 16 corporations, the environmental, economic and social dimensions of sustainability were examined. As mentioned earlier, the existence of sustainability resource is represented by companies’ environmental, social and economic sustainability activities with the help of indicators. To keep it simple and to start with, for each of the three dimensions of sustainability, one indicator was considered. Three additional overarching indicators that cover environmental, economic and social aspects were considered. As the 16 corporations analyzed are related to different sectors, such as oil and gas, and chemical, sustainability indicators for the three dimensions were chosen based on their applicability to all sectors.
Environmental dimension: The amount of GHG emissions in tonnes of CO2e emitted by each of the 16 corporations for the 2011 was determined.
Economic dimension: The revenue achieved by each corporation during the same year was identified.
Social dimension: The number of employees for each corporation was collected.
Instead of using absolute indicator values or general data to compare companies, relative ratios that connect the information from the three dimensions are utilized to evaluate the sustainability resources of these 16 corporations.
With the amount of CO2e emitted per thousand-dollars revenue calculated for each corporation, we identified the corporations achieving more revenue with less GHG emissions, linking environmental-economic dimensions. Corporations having larger number of employees with less GHG emissions are also highlighted by calculating the amount of CO2e emitted per employee for each corporation, linking environmental-social dimensions. Conventional way of looking at productivity considers it as a measure of “how few people are working” [33]. In this study, however, number of employees as an indicator is paired with environmental performance, to show that higher number of employees implies socially positive. It also implies environmentally desirable when comparing impact per employee basis for the same environmental impact.
In addition, to reflect the strong linkages between the concepts of sustainability and broader definition of corporate social responsibility (CSR), three overarching activities were considered as additional indicators:
(1)
Working with the Global Reporting Initiative (GRI) and using the third generation guidelines in sustainability reporting. The GRI is a leading organization in the sustainability field, which has developed sustainability reporting guidelines as a way to increase the social, environmental and economic performance of companies. Companies working with GRI use the sustainability reporting guidelines to communicate their sustainable performance [34].
(2)
Being listed on the Global and/or North American Dow Jones Sustainability Index (DJSI). These are a family of indexes that evaluate the sustainability performance of the largest 2500 companies listed on the Dow Jones Global Total Stock Market Index. To be included in this index, companies are assessed based on their long-term environmental, economic and social management plans [35,36].
(3)
Participation in the Global Compact United Nations (GCUN) and reporting in line with its principles. This is a global agreement or compact developed by the United Nations with businesses to align their operations with ten universally accepted principles in the areas of human rights, labor, the environment and anti-corruption. Members companies in this network support the compact and report in line with its principles [37].
The information related to these indicators has been collected for the 16 corporations responsible for the 23 reporting companies.
All data related to the three dimensions and additional activities have been collected from the sustainability reports of the 16 corporations and analyzed in Microsoft Excel. Please refer to Supplementary Material 1 for the full data collected on the sustainability indicators and additional activities of the 16 corporations.
The ratios used to link the data collected between indicators (CO2e emitted per thousand dollars revenue and CO2e emitted per employee) are considered the best to use to compare the performance between companies from different sectors [38,39,40].
In this study, it is established that being a resourceful corporation from a sustainability-driven resource perspective implies showing three features: larger revenue with less GHG emissions (environmental-economic), larger number of employees with less GHG emissions (environmental-social) and involving in at least two of the overarching three CSR indicators. As has been mentioned earlier, sustainability resources play an important role in the development of internal climate change mitigation activities. Therefore, in this study, it is considered that those corporations, with greater standing in the aforementioned three features of sustainability resources compared to the average standing of corporations analyzed, would have the potential to deploy these resources to launch effective internal GHG reduction or cleaner production in their facilities.

3. Results

The results of the calculations conducted previously to link the data collected are presented in the following tables and figures.
Table 1 presents the division of all 16 corporations into two groups based on the average of all corporations’ CO2e emitted per thousand dollars revenue achieved. The amounts of CO2e range between 0.2 tonnes and 10.4 tonnes per thousand dollars revenue. As the average of all 16 corporations is 2.1 tonnes CO2e per thousand dollars revenue, it is assumed that the corporations having an amount of CO2e per thousand dollars less than the average (2.1 tonnes CO2e) are in good standing in this dimension, while the remaining corporations having an amount of CO2e higher than the average are assumed to be performing insufficiently.
Table 2 presents the division of all 16 corporations into two groups based on the average of all corporations’ CO2e emissions per employee. The amounts of CO2e vary between 232 tonnes and 12,693 tonnes per-employee in each corporation. The average for all 16 corporations is 3026 tonnes CO2e per employee. Thus, it is assumed for this study that corporations having an amount of emissions less than the average are in good standing in this dimension, while corporations having an amount higher than the average are assumed to have a weak performance.
To check the effectiveness of the average value, the same division of corporations for the amounts of CO2e per revenue and per employee has been done again using the median instead of the average. The median of all 16 corporations is 1.04 tonnes CO2e per thousand dollars revenue and 1821 tonnes CO2e per employee. Therefore, the median is less than the average for both results. These differences between the average and median results have shown that there are few corporations with significantly higher emissions per revenue and per employee that increased the average value.
Figure 3 presents the number of corporations included in one, two or three of the indicators of CSR previously mentioned. Accordingly, four corporations are included in the three indicators of CSR and four corporations are included in two of these indicators. However, six corporations are included in just one indicator of CSR. Note that two corporations out of the 16 corporations are not included in any indicator of CSR.
It is assumed in this study that corporations included in at least two indicators of CSR are in a good position while the ones included in one or no indicators are considered not taking action or the action taken is not enough compared to other corporations.
To analyze the results in a combined fashion, the corporations considered in good position relative to other corporations in the list in terms of the three sustainability resources dimensions taken into account in this study are identified. The identification of these corporations was done using the average and the median results.
Further analysis using the average results has shown that out of the 12 corporations achieving more revenue with less GHG emissions (less than the average of 2.1 tonnes CO2e per thousand dollars revenue), 11 have achieved an amount of emissions per employee less than the average of 3026 tonnes CO2e/employee. In addition, out of these 11 corporations, seven are included in at least two of the three CSR indicators.
Using the median results, out of eight corporations achieving more revenue with less GHG emissions (less than the median of 1.04 tonnes CO2e per thousand dollars revenue), six have achieved an amount of emissions per employee less than the median of 1821 tonnes CO2e per employee. In addition, out of these six corporations, five are included in at least two of the CSR indicators.
After looking at the median and average, as well as standard deviation, and 97.5th and 2.5th percentiles values, in the following, we decided to continue our discussion using the average results as the average is considered a conservative estimate for performance evaluation which we think is good in terms of pushing companies to strive for deep cuts in emissions.
Based on the assumptions considered in this study, seven corporations have good standing in the three sustainability resources dimensions taken into account (see Figure 4).
However, the remaining nine corporations have good position in zero, one or two sustainability resources dimensions (see Figure 4).
This implies that seven corporations among the 16 corporations responsible for the 23 reporting companies emitting 86% of total GHG reported by facilities with emissions above the threshold under the SGER in Alberta in 2011 have all sustainability resources considered in this study at the parent corporation level. Therefore, as assumed in this study, those seven corporations would be able to deploy these resources to help their facilities launch internal GHG reduction efforts and comply with the SGER through internal mechanisms of realizing cleaner production.
To check whether these seven resourceful corporations are using their sustainability resources for SGER compliance through internal mechanisms of cleaner production, it was supposed to look at the way 20 out of 23 facilities related to six out of seven corporations (responsible for 22% out of 25% of total GHG reported by facilities under SGER in Alberta) have responded to the regulation in 2011 due to the lack of compliance data for one corporation and two facilities. The result of this analysis is shown in Table 3 below.
Two important findings could be found:
At corporation level: Facilities related to the same corporation are responding to the SGER using a combination of mechanisms. Corporations are not using their sustainability resources to comply with the SGER through exclusive in-house cleaner production mechanism throughout their facilities. Each facility is choosing a mechanism to comply taking into account its own situation and the availability of credit supply in the market, which includes both offset credits and EPCs available. Despite the competitive advantage associated with using their sustainability resources to reduce GHG emissions internally, companies are not taking advantage of these untapped resources.
At facility level: 30% of the facilities have achieved and exceeded the 12% reduction target and generated EPCs (see Table 3). However, these emission reductions have been mostly achieved through recognition of cogeneration and not facility internal improvements. According to a recent report from the International Institute for Sustainable Development (IISD), 25% of compliance with SGER in Alberta has come from cogeneration credits from 2007 to 2012 [41]. However, according to the same source, only 9% of compliance has come from facility reductions through internal improvements. For instance, around 82% of EPCs generated in 2011 are based on cogeneration credits [29]. The remaining (70%) of the 20 facilities is responding to the SGER using other mechanisms and specifically the offset credits mechanism (more than 35%) (see Table 3).
The remaining nine of the 16 corporations responsible for the 23 reporting companies emitting 86% of total GHG emissions reported under SGER in Alberta were found to have good position in zero, one or two sustainability resources dimensions taken into account. Comparative analysis has been conducted to check if there is a difference in the way these nine non-resourceful corporations are complying with the SGER. Table 4 shows the compliance results of 18 out of 21 facilities related to seven out of nine corporations (responsible for 55% out of 61% of total GHG reported by large GHG emitters under SGER in Alberta in 2011) due to the lack of compliance data for two corporations and associated facilities.
Further analysis and a close look at Table 3 and Table 4 depict that the results at corporation level for the seven non-resourceful corporations are the same as that of the six resourceful corporations:
At corporation level: Facilities related to the same corporation are responding to the SGER using a combination of mechanisms. No corporation was found complying with the SGER through exclusive internal reduction mechanism throughout its facilities.
At facility level: Some differences in the percentage of facilities complying with different mechanisms exist between the two groups. Twenty-eight percent of facilities related to the seven non-resourceful corporations have achieved and exceeded the 12% reduction target and generated EPCs (see Table 4). However, as mentioned earlier, these emission reductions are mostly achieved through recognition of cogeneration. In addition, respectively, 45% and 22% of the 18 facilities are complying with the SGER through a combination of mechanisms and purchasing fund credits (see Table 4).
It should be noted here that the main difference in the number of facilities using the compliance mechanisms between the two groups of resourceful and non-resourceful corporations is related to the amount of emission reductions covered, the situation of the facility and the availability of credit supply (EPCs and offset credits) in the market. For example, 45% of facilities (8) among the 18 belonging to non-resourceful corporations are complying using a combination of mechanisms, as they are required to comply for a larger amount of emission reductions, being responsible for 55% of total GHG (see Table 4). However, looking at Table 3, 35% of facilities (7) among the 20 under the resourceful corporations are complying exclusively using the offset credits mechanism, as the credit supply was enough to cover their smaller amount of emission reductions required (responsible for 22% of total GHG) compared to the other group.

4. Discussion

The results presented above show no difference at corporation level between resourceful and non-resourceful corporations as facilities related to the same corporation are complying with SGER using different mechanisms. Not taking advantage of the available untapped resources of companies in meeting compliance through cleaner production mechanism and complying with the regulation by a combination of other mechanisms have implications on two different aspects: costs to large emitters and incenting in-house cleaner production. These implications are discussed in some detail as follows.

4.1. Costs to Large Emitters

The existence of mechanisms easy to implement does not incent facilities and corporations to make actual and effective reductions in their production processes internally. As was already recognized in relation to the European Emissions Trading System, companies tend to comply with the regulation by the short-term less costly option [42]. However, without internal effective reductions in GHG emissions, companies will be impacted by the economic long-term costs of climate change. Stern [43] in his review on the Economics of Climate Change has presented the long-term impacts of climate change on the global economy and community at large. If no actions are taken to effectively reduce GHG emissions, global warming could shrink the global economy by 20% [43]. Thus, companies will be affected by this economic slowdown if no effective measure is taken now to reduce GHG emissions in their production processes. Stern [43] argues that: “Investment now will pay us back many times in the future, not just environmentally but economically as well. For every £1 invested now we can save £5, or possibly more, by acting now.” Therefore, the cost associated with the benefits of effective action against climate change taken now is much less than the long-term costs of no action. Thus, as companies will be affected by the economic long-term costs of climate change, their effective internal investments and improvements to reduce GHG emissions will be less costly in the long term than complying with the SGER by paying $15/tonne (or $20 and $30 per tonne with the latest changes of SGER) or buying offset credits.
By continuing to comply with the SGER through other mechanisms instead of making internal effective reductions in GHG, companies are expected to confront a larger cost of GHG in the future. Therefore, large GHG emitters need to change the way they are complying with the SGER in order to reduce or avoid the long-term costs of their actions. To achieve this objective without hurting the companies’ economy, internal reductions in emissions are needed while increasing the companies’ competitive benefits.
As mentioned earlier, based on the role the sustainability resources play in developing climate change mitigation activities, the sustainability resources analysis conducted in this study has found that opportunities are available for large GHG emitters to make long-term cost-effective internal reductions in emissions. Taking advantage of the available untapped sustainability resources of the seven corporations founded in the study can help their facilities comply with the SGER through exclusive in-house cleaner production mechanism, while gaining differential competitive advantage and a higher performance. In addition, the nine non-resourceful corporations can improve their sustainability standing in some dimensions and deploy these resources to launch internal GHG reduction efforts throughout their facilities.

4.2. Incentivizing In-House Cleaner Production

Facilities related to the six resourceful corporations are complying with the SGER using other mechanisms instead of using the sustainability resources of their corporations to make internal improvements. In addition, the same other mechanisms are mostly used by facilities related to the seven non-resourceful corporations. These mechanisms mostly used by companies to comply were always criticized by their non-ability to achieve effective reductions in emissions and thus not helping Alberta achieve its 2020 GHG target.
  • Cogeneration credits were criticized as business-as-usual reductions and their non-ability to create additional emission reductions, which, in this case, is not benefiting Alberta’s 2020 reduction plan [41,44].
  • Offset credits are not achieving real reductions in emissions from the largest GHG emitters in Alberta; facilities using this option can continue their business-as-usual operations while generating their usual emissions and simply buy offset credits. In addition, according to a report from Pembina Institute, 82% of offset credits used for compliance with the SGER during 2008–2010 came from projects that started before the policy was announced [45]. Since January 2012, however, the Government of Alberta has removed this allowance for historic reductions to generate offset credits from the recent version of the Climate Change and Emissions Management Act [46]. In addition, projects can start generating offset credits from the time they got approved even before they start operating and achieving actual emission reductions. Therefore, this will not benefit Alberta’s 2020 target if the actual emission reductions from projects will start after 2020. Moreover, since 2011, the efficiency of the offset system has become worse with the allowance for double-counting of offset credits for one tonne of emission reductions associated with Carbon Capture and Storage projects [47]. As observed by Bramley et al. [47], this will introduce offset credits used by other companies to comply with the SGER that are not related to real reductions in emissions.
Thus, all these reasons can demonstrate that most offset credits are non-effective and not actual reductions in emissions.
  • Money paid to obtain fund credits and collected by the CCEM fund is oriented to deliver long-term emission reductions, which may not benefit Alberta’s 2020 target [48].
The aforementioned three mechanisms mostly used by companies in Alberta and especially by the 20 facilities related to the six resourceful corporations and the 18 facilities related to the seven non-resourceful corporations discussed in this study, have demonstrated that they pull large GHG emitters to comply using short term less costly but emission-wise ineffective pathway. These options do not enable the achievement of short-term and real reductions in emissions that can help Alberta reach its 2020 goal. Some studies have pointed out the need for a program that provides higher incentive for companies to improve their emissions performance by internally implemented cleaner production rather than using other mechanisms. Two options were mostly and recently discussed in the literature to increase the incentive for facilities to make internal reductions:
-
Some studies have suggested increasing the carbon levy of $15/tonne in order to create an incentive for large emitters to reduce emissions through internal improvements [47,48]. This scenario has been recently discussed by the IISD, with an increase of emissions intensity to 24% [41]. The modeling used by the IISD report has shown that most compliance options used by companies with this scenario will stay the same: cogeneration, offsets and fund credits. This model covers only oil and gas sector emissions, which is approximately 45% of the SGER emissions. In this case, the increase in emissions intensity will put pressure on offset market to satisfy demand. When there is no offset credit supply available in the market, facilities would choose the fund credit. Moreover, in addition to the long-term emission reductions that the fund credit can only achieve, 40% of this money would go to royalty and tax interaction for the province and federal government [41]. Therefore, doubling the fund credit or even increasing the emissions intensity will not create an incentive for large GHG emitters in Alberta to make internal emission reductions. However, this increase would be a good incentive if it is high enough to make cleaner production mechanisms competitive. However, determining the amount of this increase needs further research and is out of the scope of this paper.
-
On the other hand, some environmentalists have criticized the weak incentive provided by the SGER carbon pricing as it is based on emissions intensity targets [45,47,49]. They have suggested that a carbon tax charged on every tonne of emissions, irrespective of whether it is less or more than the 100,000 tonne per year, increases the incentive for large GHG emitters to make internal emission reductions. This comparison between the two carbon pricing approaches and the emissions reduction incentive they provide was the main discussion of an article by Leach [50]. The results of the analysis undertaken by Leach [50] have shown that the average cost of emissions with the SGER is weak compared to a carbon tax on all emissions. However, the SGER carbon price still provides a strong incentive for facilities in some ways. For example, the SGER provides a stronger incentive for improving productivity per unit of emissions than a carbon tax [50]. According to Leach [50], there is no big difference in the value of emissions cost between the two scenarios as other groups assume. Therefore, even this change will not create a stronger incentive for facilities than the current one to make internal improvements in their production processes.
However, these internal reductions in emissions become competitive when companies recognize the differential competitive advantage associated with using the internal sustainability resources to reduce GHG emissions. As previously mentioned, sustainability resources can be employed to launch internal GHG reduction efforts while benefiting from the positive relationship that exist between using these sustainability resources and gaining competitive advantage. Using internal sustainability resources to reduce GHG emissions and generate real EPCs will provide companies a competitive advantage in the market; help reduce their long-term costs and assist in Alberta’s journey of reaching its 2020 target. As previously mentioned in Section 1, internal capability to achieve reductions in GHG requires internal technology, manpower, knowhow and networking development as well as assessment and monitoring that can be cultivated through the utilization and development of companies’ sustainability resources. As mentioned earlier in the paper, the existence of sustainability resources is represented in this study by companies’ environmental, social and economic sustainability activities with the help of indicators considered for each dimension.

5. Conclusions

With the global challenge of climate change affecting our social and economic life, it becomes crucial to understand the factors that can guide carbon intensive companies to comply with environmental regulations through significant reductions in GHG emissions. Using the NRBV, the argument used in this paper is that focusing on sustainability-driven resources by companies is a way to meet environmental compliance and reduce GHG emissions while gaining competitive benefits. The specific analysis conducted in this study on Alberta case has discussed large GHG emitters’ environmental compliance mechanisms used in the context of their sustainability resources. This discussion has shown that large GHG emitting corporations with opportunities for in-house cleaner production and long-term cost-effective reductions in GHG emissions while gaining differential competitive advantage are not using their potential. Seven corporations out of the 16 which are responsible for 86% of total GHG emissions reported by facilities with emissions above the threshold (100,000 tonnes GHG) in Alberta in 2011, have sustainability resources that could be used to launch internal long-term cost-effective reductions in their associated facilities. However, SGER compliance data available for the facilities related to the six corporations out of seven have shown that they were not using their sustainability resources to comply with the SGER through internal mechanisms of cleaner production. In addition, SGER compliance data for the remaining nine non-resourceful corporations have shown no difference at corporation level in the compliance mechanisms used between resourceful and non-resourceful corporations. Companies need to recognize the long-term reduction of costs and the benefit of harnessing the differential competitive advantage associated with using their sustainability-driven resources to reduce GHG emissions internally now. Mechanisms applied by most companies to comply with the regulation have not demonstrated their possibility to achieve real, effective and immediate reductions in emissions that will help Alberta reach its 2020 goal. Taking advantage of the available untapped resources will not only benefit companies economically by providing a differential competitive advantage and reduce their long-term costs but also help Alberta and Canada achieve more effective reductions in emissions.
Therefore, based on Alberta case analysis presented in this paper, we do recommend any new carbon regulation to account for incentivizing this opportunity that can guide corporations for actual reductions in GHG emissions and thus, achieve the global climate change mitigation targets. The next iteration of SGER in Alberta and of any other environmental regulation in other jurisdictions should account for ways of supporting internal reductions mechanisms. The sustainability-driven resources should be used to cultivate internal reduction mechanisms. Both policy-makers and companies should work together to take advantage of the untapped sustainability resources available in large GHG emitters. If policy makers can work on making the economic gain of leaning towards internal mechanisms more clearer and tangible, companies will see the incentive of tapping into their sustainability. In addition, programs that could guide and educate companies to use their internal sustainability potential to reduce GHG emissions need to be developed. Moreover, it is recommended that companies employ their untapped sustainability resources in making internal improvements in their emissions to avoid the long-term costs of not taking effective action while benefiting economically from the differential competitive advantage associated with the internal reductions in emissions.
This study provides an opening analysis and discussion of the sustainability resources of the 16 corporations responsible for the largest amount of GHG emissions in Alberta, which is a critical part of Canada’s economy and responsible for much of the national GHG emissions. Though the number of companies included in the analysis seems small at first glance, they are responsible for 86% of the total GHG emissions of the federally major contributor province of Alberta. At the corporation level, the seven that were analyzed in this study in terms of the relation between their sustainability-driven resources and the way their associated facilities comply are responsible for 23 facilities that emit 25% of total GHG reported by facilities with emissions above the threshold under SGER in Alberta. The other nine sustainability non-resourceful corporations considered are responsible for 61% of total GHG reported in Alberta under SGER, thereby covering 86% of the total provincial GHG reported by facilities above the threshold. Non-resourceful corporations with above average GHG per revenue and GHG per employee and less than two CSR activity indicators, can focus on improving their sustainability standing by kicking off new sustainability activities that build and enrich their sustainability resource. Development and utilization of the sustainability resources provides corporations and facilities the opportunity to meet environmental compliance through exclusive in-house cleaner production mechanism while achieving differential competitive advantage.
The study was predominantly based on publicly available data in the sustainability reports of corporations, in addition to some confidential data (specifically, information regarding the compliance mechanisms used by facilities under SGER was confidential information). The entire data set used in the study and the non-confidential data used are presented in Supplementary Material 1. In addition, the SGER-oriented literature part of our study was mostly based on reports discussing the SGER in Alberta due to the lack of published peer-reviewed articles on the subject. More accurate results can be achieved by considering more indicators for the three dimensions of sustainability and by collecting primary data from corporations in refining the sustainability-driven resources.

Supplementary Materials

The following are available online at www.mdpi.com/2071-1050/9/2/182/s1, SM1: The entire data set used in the study including the list of larges emitters based on SGER and the sustainability indicators and additional activities information for the 16 corporations. SM2 (Table S2): Grouping the 23 reporting companies with their associated facilities (under SGER), responsible for 86% of total GHG reported by facilities with emissions above the threshold in Alberta under SGER in 2011, into parent corporations.

Acknowledgments

The authors are grateful to Alberta Innovates Bio Solutions for financially supporting this research.

Author Contributions

Marwa Hannouf collected and analyzed the data and drafted the paper. Getachew Assefa provided professional and continuous guidance, editing and reviewing for the paper.

Conflicts of Interest

The authors declare no conflict of interest. The funding sponsors had no role in the design of the study; in the collection, analysis, or interpretation of data; in the writing of the manuscript, and in the decision to publish the results.

References

  1. Government of Alberta. Climate Change and Emissions Management Act: Specified Gas Emitters Regulation; Alberta Regulation 139/2007; Alberta’s Queen’s Printer: Edmonton, AB, Canada, 2007. Available online: http://www.qp.alberta.ca/documents/Regs/2007_139.pdf (accessed on 5 September 2014).
  2. Rorie, M. An integrated theory of corporate environmental compliance and overcompliance. Crime Law Soc. Chang. 2015, 64, 65–101. [Google Scholar] [CrossRef]
  3. Thornton, D.; Kagan, R.A.; Gunningham, N. When social norms and pressures are not enough: Environmental performance in the trucking industry. Law Soc. Rev. 2009, 43, 405–437. [Google Scholar] [CrossRef]
  4. Kagan, R.A.; Thornton, D.; Gunningham, N. Explaining corporate environmental performance: How does regulation matter? Law Soc. Rev. 2003, 37, 51–90. [Google Scholar] [CrossRef]
  5. Gunningham, N.; Kagan, R.A.; Thornton, D. Social License and Environment Protection: Why Businesses Go beyond Compliance; Center for the Study of Law and Society Jurisprudence and Social Policy Program: Berkeley, CA, USA, 2002; Available online: http://www.escholarship.org/uc/item/35j962b3 (accessed on 11 January 2017).
  6. Gunningham, N.; Kagan, R.A.; Thornton, D. Social license and environmental protection: Why businesses go beyond compliance. Law Soc. Inq. 2004, 29, 307–342. [Google Scholar] [CrossRef]
  7. Gunningham, N.; Thornton, D.; Kagan, R.A. Motivating management: Corporate compliance in environmental protection. Law Policy 2005, 27, 289–316. [Google Scholar] [CrossRef]
  8. Beg, N.; Morlot, J.C.; Davidson, O.; Afrane-Okesse, Y.; Tyani, L.; Denton, F.; Sokona, Y.; Thomas, J.P.; La Rovere, E.L.; Parikh, J.K.; et al. Linkages between climate change and sustainable development. Clim. Policy 2002, 2, 129–144. [Google Scholar] [CrossRef]
  9. Cohen, S.; Demeritt, R.J.; Rothman, D. Climate change and sustainable development: Towards dialogue. Glob. Environ. Chang. 1998, 8, 341–371. [Google Scholar] [CrossRef]
  10. Munasinghe, M.; Swart, R. Primer on Climate Change and Sustainable Development: Facts, Policy and Analysis Applications; Cambridge University Press: Cambridge, UK; New York, NY, USA, 2005. [Google Scholar]
  11. Swart, R.; Robinson, J.; Cohen, S. Climate change and sustainable development: Expanding the options. Clim. Policy 2003, 3, 19–40. [Google Scholar] [CrossRef]
  12. Winkler, H.; Spalding-Fecher, R.; Mwakasonda, S.; Davidson, O. Sustainable development policies and measures: Starting from development to tackle climate change. In Building on the Kyoto Protocol: Options for Protecting the Climate; Baumert, K.A., Blanchard, O., Llosa, S., Perkaus, J.P., Eds.; World Resources Institute: Washington, DC, USA, 2002; pp. 61–88. [Google Scholar]
  13. Hart, S.L. A natural-resource-based view of the firm. Acad. Manag. Rev. 1995, 20, 986–1014. [Google Scholar]
  14. Barney, J. Firm resources and sustained competitive advantage. J. Manag. 1991, 17, 99–120. [Google Scholar] [CrossRef]
  15. Buysse, K.; Verbeke, A. Proactive environmental strategies: A stakeholder management perspective. Strateg. Manag. J. 2003, 24, 453–470. [Google Scholar] [CrossRef]
  16. Sharma, S.; Vredenburg, H. Proactive corporate environmental strategy and the development of competitively valuable organizational capabilities. Strateg. Manag. J. 1998, 19, 729–753. [Google Scholar] [CrossRef]
  17. Rueda-Manzanares, A.; Aragon-Correa, J.A.; Sharma, S. The influence of stakeholders on environmental strategy of service firms: The moderating effects of complexity, uncertainty and munificence. Br. J. Manag. 2008, 19, 185–203. [Google Scholar] [CrossRef]
  18. Backman, C.A.; Verbeke, A.; Schulz, R.A. The drivers of corporate climate change strategies and public policy: A new resource-based view perspective. Bus. Soc. 2015. [Google Scholar] [CrossRef]
  19. Russo, M.V.; Fouts, P.A. A resource-based perspective on corporate environmental performance and profitability. Acad. Manag. J. 1997, 40, 534–559. [Google Scholar] [CrossRef]
  20. Aragon-Correa, J.A.; Leyva-de la Hiz, D.I. The influence of technology differences on corporate environmental patents: A resource-based versus an institutional view of green innovations. Bus. Strategy Environ. 2016, 25, 421–434. [Google Scholar] [CrossRef]
  21. Hart, S.L.; Dowell, G. A natural-resource-based view of the firm: Fifteen years after. J. Manag. 2011, 37, 1464–1479. [Google Scholar]
  22. Alberta Environment and Sustainable Resource Development (AESRD). Technical Guidance for Completing Specified Gas Compliance Reports; AESRD, Government of Alberta: Edmonton, AB, Canada, 2014. Available online: http://aep.alberta.ca/climate-change/guidelines-legislation/specified-gas-emitters-regulation/documents/TechGuidanceCompletingSpecGasComplianceRpts-Feb2014.pdf (accessed on 1 September 2014).
  23. The World Bank. CO2 Emissions (Metric Tons per Capita). 2016. Available online: http://data.worldbank.org/indicator/EN.ATM.CO2E.PC/countries/1W-CA?display=graph (accessed on 16 March 2016).
  24. The Conference Board of Canada. How Canada Performs, Provincial and Territorial Ranking, Environment, Greenhouse Gas (GHG) Emissions. 2017. Available online: http://www.conferenceboard.ca/hcp/provincial/environment/ghg-emissions.aspx (accessed on 3 January 2017).
  25. Environment Canada. Canada’s Emissions Trends. 2014. Available online: http://ec.gc.ca/ges-ghg/E0533893-A985-4640-B3A2-008D8083D17D/ETR_E%202014.pdf (accessed on 21 January 2015). [Google Scholar]
  26. National Round Table on the Environment and the Economy (NRT). Reality Check: The State of Climate Progress in Canada; 2020 Climate Change Plans; NRT: Ottawa, ON, Canada, 2012. Available online: http://publications.gc.ca/collections/collection_2012/trnee-nrtee/En134-57-2012-eng.pdf (accessed on 5 September 2014).
  27. McCrank, N.; Ross, A.L. Temperature Check: Alberta Makes Big Move on Carbon Emissions, Financial Post. 2015. Available online: http://business.financialpost.com/fp-comment/temperature-check-alberta-makes-big-move-on-carbon-emissions (accessed on 7 September 2015).
  28. Leach, A.; Adams, A.; Cairns, S.; Coady, L.; Lambert, G. Climate Leadership Report to Minister. 2015. Available online: http://alberta.ca/documents/climate/climate-leadership-report-to-minister.pdf (accessed on 23 December 2015).
  29. Wheler, J.; Storey, B.J. 2013 Large Final Emitter Update. Air and Climate Change Policy Branch, Environment and Sustainable Resource Development. 2014. Available online: http://esrd.alberta.ca/focus/alberta-and-climate-change/regulating-greenhouse-gas-emissions/alberta-based-offset-credit-system/offset-credit-system-protocols/documents/FinalEmitterUpdate-Presentation-2013.pdf (accessed on 27 December 2015).
  30. Partington, P.J.; Demerse, C. Context for Climate Action in Canada; Pembina Institute: Drayton Valley, AB, Canada, 2013; Available online: http://www.pembina.org/reports/climate-context-20131009.pdf (accessed on 5 January 2015).
  31. Alberta Environment and Sustainable Resource Development (AESRD). Information Centre, 2011 Facility Table; AESRD, Government of Alberta: Edmonton, AB, Canada, 2012. Available online: http://environment.gov.ab.ca/info/posting.asp?assetid=8851&subcategoryid=53 (accessed on 1 September 2014).
  32. Furrer, O. Corporate Level Strategy: Theory and Applications; Routledge: New York, NY, USA, 2011. [Google Scholar]
  33. McDonough, W.; Braungart, M. Cradle to Cradle: Remaking the Way We Make Things; MacMillan: New York, NY, USA, 2010; p. 18. [Google Scholar]
  34. Fernandez-Feijoo, B.; Romero, S.; Ruiz, S. Commitment to corporate social responsibility measured through global reporting initiative reporting: Factors affecting the behavior of companies. J. Clean. Prod. 2014, 81, 244–254. [Google Scholar] [CrossRef]
  35. Karius, O. Dow Jones Sustainability Indexes. In Corporate Governance of Sustainability: A Co-Evolutionary View on Resource Management; Bleischwitz, R., Ed.; Edward Elgar Publishing: Cheltenham, UK, 2007; pp. 209–227. [Google Scholar]
  36. Searcy, C.; Elkhawas, D. Corporate sustainability ratings: An investigation into how corporations use the Dow Jones Sustainability Index. J. Clean. Prod. 2012, 35, 79–92. [Google Scholar] [CrossRef]
  37. Sethi, S.P.; Schepers, D.H. United Nations Global Compact: The promise-performance gap. J. Bus. Ethnics 2014, 122, 193–208. [Google Scholar] [CrossRef]
  38. United States Environmental Protection Agency (EPA). Design Principles, United States Environmental Protection Agency (EPA), Climate Leaders Greenhouse Gas Inventory Protocol. 2005. Available online: http://www.epa.gov/climateleadership/documents/resources/design-principles.pdf (accessed on 6 April 2015). [Google Scholar]
  39. WRI/WBCSD. The Greenhouse Gas Protocol: A Corporate Accounting and Reporting Standard; WRI (World Resources Institute)/WBCSD (World Business Council for Sustainable Development): Washington, DC, USA, 2004. Available online: http://www.ghgprotocol.org/files/ghgp/public/ghg-protocol-revised.pdf (accessed on 6 April 2015).
  40. Department for Environment, Food and Rural Affairs (DEFRA). Guidance on How to Measure and Report Your Greenhouse Gas Emissions; DEFRA: London, UK, 2009. Available online: https://www.gov.uk/government/uploads/system/uploads/attachment_data/file/69282/pb13309-ghg-guidance-0909011.pdf (accessed on 6 April 2015).
  41. Sawyer, D. Regulating Carbon Emissions in Canada: A Timbit with That Double-Double? Costs and Emissions Reductions of Renewed Carbon Policy in Alberta; Policy Brief; The International Institute for Sustainable Development: Winnipeg, MB, Canada, 2014; Available online: http://www.iisd.org/sites/default/files/publications/costs_emission_reductions_renewed_carbon_policy_alberta.pdf (accessed on 15 December 2014).
  42. European Union (EU). The EU Emissions Trading System (EU ETS). 2013. Available online: http://ec.europa.eu/clima/publications/docs/factsheet_ets_en.pdf (accessed on 6 April 2015).
  43. Stern, N. Stern Review: The Economics of Climate Change. 2006. Available online: http://mudancasclimaticas.cptec.inpe.br/~rmclima/pdfs/destaques/sternreview_report_complete.pdf (accessed on 29 March 2015).
  44. McGariggle, P. Cogeneration and Carbon Management: Key Issues in the Design of Carbon Management Policies and Regulations in Alberta. 2014. Available online: http://cmcghg.com/wp-content/uploads/2014/01/Cogeneration-Carbon-Presentation_FINAL-copy.pdf (accessed on 20 January 2015).
  45. Huot, M.; Fischer, L.; Lemphers, N. Oil Sands and Climate Change: How Canada’s Oil Sands Are Standing in the Way of Effective Climate Action; Pembina Institute: Drayton Valley, AB, Canada, 2011; Available online: http://www.pembina.org/reports/us-oilsands-and-climate-briefing-note-201109b.pdf (accessed on 23 November 2014).
  46. Alberta Environment. Technical Guidance for Offset Projects Developers; Specified Gas Emitters Regulation; Government of Alberta: Edmonton, AB, Canada, 2011. Available online: http://environment.gov.ab.ca/info/library/7915.pdf (accessed on 29 January 2015).
  47. Bramley, M.; Huot, M.; Dyer, S.; Horne, M. Responsible Action? An Assessment of Alberta’s Greenhouse Gas Policies; Pembina Institute: Drayton Valley, AB, Canada, 2011; Available online: http://www.pembina.org/reports/responsible-action.pdf (accessed on 1 February 2015).
  48. Partington, P.J.; Horne, M.; Demerse, C. Getting on Track for 2020: Recommendations for Greenhouse Gas Regulations in Canada’s Oil and Gas Sector; Pembina Institute: Drayton Valley, AB, Canada, 2013; Available online: http://www.pembina.org/reports/getting-on-track-to-2020.pdf (accessed on 31 January 2015).
  49. Demersey, C.; Bramley, M. Choosing Greenhouse Gas Emission Reductions Policies in Canada; Pembina Institute: Drayton Valley, AB, Canada, 2008; Available online: http://www.pembina.org/reports/pembina-td-final.pdf (accessed on 5 January 2015).
  50. Leach, A. Policy Forum: Alberta’s Specified Gas Emitters Regulation. Can. Tax J. 2012, 60, 881–898. [Google Scholar]
Figure 1. Process used in the study to focus on the large GHG emitters in Alberta responsible for the largest amount (86%) of GHG emissions reported under SGER.
Sustainability 09 00182 g001
Figure 2. Grouping the 23 reporting companies into parent corporations.
Sustainability 09 00182 g002
Figure 3. Number of corporations included in one, two or three of the indicators of corporate social responsibility (CSR) (Global reporting initiative (GRI), Dow Jones Sustainability index (DJSI) and Global Compact United Nations (GCUN)).
Sustainability 09 00182 g003
Figure 4. Approach used to differentiate between sustainability resourceful and non-resourceful corporations.
Sustainability 09 00182 g004
Table 1. Distribution of all 16 corporations based on the average of CO2e emitted per thousand dollars revenue.
Tonnes of CO2e per Thousand Dollars Revenue<2.1
(Good Standing)
>2.1
(Weak Performance)
Number of corporations124
Table 2. Distribution of all 16 corporations based on the average of CO2e emitted per-employee.
Tonnes of CO2e Emitted Per-Employee<3026
(Good Standing)
>3026
(Weak Performance)
Number of corporations133
Table 3. Percentage of the 20 facilities belonging to six sustainability resourceful corporations complying with the SGER by different mechanisms in 2011.
Compliance MechanismsPercentage of Facilities Complying (Number of Facilities)
Achieving and exceeding the 12% reduction through internal improvements or recognition of cogeneration (and generating EPCs)30% (6)
EPCs Submitted10% (2)
Offset Credits Submitted35% (7)
Funds Credits Purchased ($15/Tonne)5% (1)
EPCs submitted + Offset Credits Submitted5% (1)
Funds Credits Purchased + Offset Credits Submitted5% (1)
Fund Credits + Offset Credits + EPCs submitted10% (2)
Table 4. Percentage of the 18 facilities belonging to seven sustainability non-resourceful corporations complying with the SGER by different mechanisms in 2011.
Compliance MechanismsPercentage of Facilities Complying (Number of Facilities)
Achieving and exceeding the 12% reduction through internal improvements or recognition of cogeneration (and generating EPCs)28% (5)
Offset Credits Submitted6% (1)
Funds Credits Purchased ($15/Tonne)22% (4)
EPCs submitted + Offset Credits Submitted17% (3)
Funds Credits Purchased + Offset Credits Submitted11% (2)
Fund Credits + Offset Credits + EPCs submitted17% (3)

