Abstract
China has now become the largest country in carbon emissions all over the world. Furthermore, with transportation accounting for an increasing proportion of CO2 emissions year by year, the transportation sector has turned out to be one of the main sectors which possesses a high growth speed in CO2 emissions. To accurately analyze potentially influencing factors which accelerate the process of CO2 emissions of transportation sector in China, based on carbon accounting by the checklists method of Intergovernmental Panel on Climate Change’s (IPCC), in this paper, we propose a decomposition model using Logarithmic Mean Divisia Index (LMDI) decomposition analysis technology and modified fixed growth rate method. Then effects of six influencing factors including energy structure, energy efficiency, transport form, transportation development, economic development and population size from 2001 to 2014 were quantitatively analyzed. Consequently, the results indicate that: (1) economic development accounts most for driving CO2 emissions growth of the transportation sector, while energy efficiency accounts most for suppressing CO2 emissions growth; (2) the pulling effects of natural gas, electricity and other clean energy consumption on CO2 emissions growth offset the inhibitory effects of traditional fossil fuels, making energy structure play a significant role in promoting CO2 emissions growth; (3) the inhibitory effects of railways and highways lead to inhibitory effects of transport form on CO2 emissions growth; (4) transportation development plays an obvious role in promoting CO2 emissions, while the effects of population size is relatively weaker compared with those of transportation development. Furthermore, the decomposition model of CO2 emissions factors in transport industry constructed in this paper can also be applied to other countries so as to provide guidance and reference for CO2 emissions analysis of transportation industry.
1. Introduction
Climatic change, such as global warming and climatic anomalies caused by the emission of greenhouse gases, have generated much interest in recent years. From the worldwide perspective, the energy consumption related to transportation shares one-third of total energy consumption in the world, making transportation sector the second largest energy consumer after industry [1]. For China, because of reformation and opening-up, Chinese economy has gained great developments. In the meantime, China has jumped to the forefront of carbon emissions, pushing itself to be the focus of emission-reduction [2]. The transportation sector, only containing the actual transportation services, is very significant for entire national economy, but it is also one of the main three sources of energy consumption and carbon emission, together with industry and power system [3]. The transportation sector of China has always had the characteristics of high energy consumption and high pollution. For instance, energy consumption related to transportation in 2014 was 36.3 million tons of standard coal, making transportation one of the few sectors whose average annual energy consumption growth rate exceeded 8% [4]. It can be seen that transportation has turned to be a key role to achieve goals of energy conservation and emission reduction. If factors of CO2 emission changes in transportation are found out, the government can determine the appropriate way to control the CO2 emission of the transport sector. Therefore, efforts of studying energy consumption characteristics, measuring CO2 emissions, and analyzing factors of CO2 emission changes in transportation is of great significance for China to make its international commitments fulfilled and achieve its targets of energy conservation and emission reduction.
At present, the studies on CO2 emissions both at China and other countries are basically completed, which can be roughly divided into two branches: CO2 emissions accounting and analysis of factors that affect CO2 emissions decomposition. For CO2 emissions accounting, there are two main CO2 accounting systems. The first one is the bottom-up carbon emissions accounting system, which is based on the accounting system of enterprise products and projects, and is a system transferred from the general public to the government. This system is represented by a series of standardizations such as ISO14064 Verified Greenhouse Gas Standardization [5] issued by International Organization for Standardization (ISO), Greenhouse Gas (GHG) Protocol [6] issued by World Resources Institute (WRI) together with World Business Council on Sustainable Development (WBCSD), and Public applicable specification [7] issued by British Standards Institution (BSI). However, this accounting system focuses more on specific products and enterprises, leading to some weakness because of the lacking consideration on all economic dimensions and the incomplete information about products and enterprises in whole carbon accounting. Another carbon emissions accounting system, which follows the idea of ‘top-down’, is presently represented by the 2006 IPCC Guidelines for National Greenhouse Gas Inventories [8]. This system classifies the main carbon emissions sources of the country, builds sub categories in each category, and decomposes the carbon emissions sources at various levels to carry out accounting. Meanwhile, it is more authoritative and comparable because of referring to the methods and data proposed in IPCC Guidelines for National Greenhouse Gas Inventories. For factors affecting CO2 emissions decomposition analysis, two commonly used methods have been developed: Structural Decomposition Analysis (SDA) and Index Decomposition Analysis (IDA). In fact, the SDA and IDA both work by decomposing the factors with principles of multiplication. However, the SDA, who is based on the input-output table, requires enormous and complex data [9,10]. Compared with the SDA, the IDA is used more widely in energy industries because there is no need to prepare the input-output table and what should be done is to aggregate and analyze the data of all sectors [11]. Specifically, the principle of so-called IDA is to employ the exponent method in the decomposition process of the model, and multiply the total amount with each decomposition factor and index in order to determine the impact degree of various factors on total amount. In terms of differences in weights of factors, the IDA method can be divided into three types, including the Laspey Index (LI) [12], the Simple Average Division (SAD) [13] and the Adaptive Weighting Divination (AWD) [14]. In more detail, the SAD method sets the average value of a certain index in a certain period as the weight of this certain index. Furthermore, many decomposition methods based on different average value calculation methods can be obtained. Compared to the LI method, Boyd [15] proposed a relatively simpler and more widely-used method which sets the average value in the beginning year and the end year as a factor’s weight, and then calculates the factor’s increments by logarithmic method. However, because of using logarithm, this method proposed by Boyd is invalid when there is a zero in the basic data. To avoid this problem, on the basis of SAD, Ang et al. [16] put forwards an algorithm called Logarithmic Mean Divisia Index algorithm, hereafter referred to as LMDI, which would not be influenced by zero or residual value to calculate the weights of factors directly by logarithmic method instead of using base data or the arithmetic mean of the various factors. The LMDI takes advantages in following aspects [17]: (1) for decomposed factors, there will be no residual values or phenomenon that can’t be explained; (2) the LMDI can be divided into Multiplicative Decomposition method and Additive Decomposition method, and the calculation results of these two methods are interconnected and consistent; (3) the overall calculation result is in concert with the aggregation result of decomposed factors. Subsequently, Liu and Ang [18] continued to improve the LMDI decomposition analysis by effectively dealing with a 0 and negative values in basic data to overcome the problem in the application of LMDI. The improved LMDI decomposition analysis has been recognized as a more accurate decomposition analysis method at present.
Overall, studies mentioned above mainly regard one country as the object of study and they have not penetrated into analysis in specific industries. Even though there are few studies set specific industries as their objects, they usually focuses on high-emission industries such as industrial sector and electric power sector [19,20,21,22], and analysis of carbon emissions of transportation sector is not as mature as the studies on other sectors or the studies at the national level, especially in China and other developing countries. In addition, to adapt to the characteristics of the highways and waterways markets, in 2008 and 2013, the Ministry of Transport of China respectively carried out the national highways and waterways traffic volume survey [23] and the national economic statistics of transportation sector survey [24], which changed the scope of statistics and brought difficulties in analyzing the impacts of carbon emissions of transportation sector. Therefore, it is necessary to revise the scope of relevant statistical data. On the basis of the studies above, in this paper, the transportation sector of China is divided into four parts, including railways, highways, waterways and civil aviation. Then the checklist method of IPCC is used to measure CO2 emissions of transportation sector during 2001 to 2014 in China. In addition, this paper adopts the fixed growth rate theory, aiming to modify the data of highways and waterways. Finally, the LMDI decomposition analysis is utilized to decompose the influencing factors into seven categories including carbon intensity, energy structure, energy efficiency, transport form, transportation development, economic development and population size, and then we explores the impact of various factors on carbon emissions of the transportation sector, thus to provide support for government to develop CO2 emission reduction policies of transportation sector. The rest of the paper is structured as follows: Section 2 introduces the methodologies of CO2 accounting in transportation sector and method of factor decomposition; Section 3 elaborates data sources and data processing; Section 4 evaluates CO2 emissions of transportation sector and performs decomposition analysis; in Section 5, the decomposition results of seven factors which influence CO2 emissions are analyzed; at last, Section 6 summarizes the research results.
2. Methodology
2.1. CO2 Emissions Accounting of Transportation Sector
Transportation sector refers to the social production sector specializing in the transportation of goods and passengers, including railways, highways, waterways, civil aviation and others. In this paper, the checklist method of IPCC is utilized to calculate carbon emissions in Chinese transportation sector [8]. This method is also called the direct CO2 emissions coefficient method, in that we can obtain the carbon emissions by multiplying energy consumption of one product in its productive process and its carbon emissions coefficient. The IPCC assumes that a certain energy carbon emission factor is constant [8], based on this assumption, CO2 emissions of the transportation sector is calculated as follows:
where is the total CO2 emissions of transportation sector; is the consumption amount of the ith energy; is the standard coal coefficient of the ith energy; is the carbon emission factor; is the mean net calorific value; is the carbon content per unit calorific value; is the carbon oxidation rate; is the molecular weight of CO2; is the ith energy sources.
2.2. Decomposition Analysis Model of CO2 Emissions of Transportation Sector
In order to analyze the potential influencing factors of CO2 emissions growth, the LMDI method is used to construct the decomposition analysis model of CO2 emissions of transportation sector. According to the Kaya identity [25], the Formula (1) can be further rewritten as:
where represents the ith energy source type; represents the jth transport form, including railways, highways, waterways and civil aviation; represents years; represents the amount of energy consumption; represents the transport comprehensive turnover volume, and represents the gross domestic product (GDP). The Formula (2) can be further expressed as:
In this paper, the factors affecting CO2 emissions of transportation sector are divided into seven categories: (1) represents the factor of carbon intensity, i.e., it indicates CO2 emissions from the consumption of per unit of the ith energy source; (2) represents the factor of energy structure, which reveals how much proportion energy source i related to transportation sector share in the total energy consumption; (3) is the factor of energy efficiency, i.e., it indicates energy consumption from per unit comprehensive turnover volume of transport; (4) is the factor of transport form, which indicates how much percentage that the comprehensive turnover volume of a certain transport form share in the total comprehensive turnover volume of transportation sector; (5) represents the factor of transport development, and it is measured by comprehensive turnover volume of transportation of per unit of GDP; (6) is the factor of economic development, in detail, it is represented by the per capita GDP; (7) is the factor of population size.
The LMDI is divided into two types: multiplicative decomposition and additive decomposition, and results of the two methods are consistent and homogeneous [26]. Accordingly, in this paper, additive decomposition is chosen to measure how much that each factor contributes to CO2 emissions of transportation sector, that is to say, the changes of CO2 emissions from base year to current year are expressed by the sum of the contribution changes of seven influencing factors; the formula is as follows:
where is CO2 emissions of the target year t ; is CO2 emissions of the base year 0; ,, , , , and reflect influence levels of seven factors which are calculated as follows:
where .
To obtain CO2 emissions contribution rates of seven factors, the two sides of Formula (4) are divided by to get the Formula (12):
where each component in the right side of the equal represents the contribution rate of each factor.
3. Data Sources and Data Processing
In this paper, data is obtained from the “transport, storage and postal industry” parts of the China Energy Statistical Yearbook [27], including nine energy consumption types as coal, coke, crude oil, gasoline, kerosene, diesel oil, fuel oil, natural gas and electricity, and four transport forms as railways, highways, waterways and civil aviation from 2000 to 2014. In 2000, China completed the ‘Ninth Five-Year Plan”, thus this year can be used as the base year; 2014 is the year when we can get the latest data from the China Energy Statistical Yearbook. The data processing is as follows.
3.1. CO2 Emissions Accounting Parameters
CO2 emissions accounting parameters mentioned in the Formula (1) are shown in Table A1. Specifically, the data of and comes from The General Principles for Calculation of Total Production Energy Consumption [28], and the data of and comes from The Guidelines for the Preparation of Provincial Greenhouse Gas Inventories [29].
What should be noted is that electricity power is secondary energy. For the whole electric industry, the CO2 generated from electricity is too small to be ignored, i.e., the carbon dioxide emission coefficient of the electricity can be considered as 0. However, the power plants who generate electricity consume energy. Considering that the thermal power plants account for the majority of power plants compared with hydroelectric power plants, wind power plants and nuclear power plants in China, in this paper, it is defined that the carbon dioxide emissions related to transportation from electric power consumption are caused by the coal combustion of thermal power plants. Referring to the statistics of average CO2 emissions per unit of power supply of regional power grid in The Guidelines for the Preparation of Provincial Greenhouse Gas Inventories [28], as is shown in Table A2, the average value of CO2 emissions per unit of power supply is set as the carbon dioxide emission coefficient of electricity.
3.2. The Comprehensive Turnover Volume
By means of the conversion method in Table A3, the passenger turnover volume and freight turnover volume of the railways, highways, waterways and civil aviation are converted into the comprehensive turnover volume. Specially, the data of passenger turnover volume and freight turnover volume are from the China Statistical yearbook.
In order to adapt to the characteristics of highways and waterways markets, and to overcome the problems such as aggregate data distortion, statistical caliber disagreement, and structural and regional traffic data loss, the ministry of transport of China in 2008 and 2013 respectively carried out the survey of national highways and waterways traffic volume and the survey of national economic statistics of transportation sector which adjusted the scope of the statistics caliber, leading to the incommensurability of the data in 2008 and 2013. As a result, the correctness of the results would be affected if we directly take use of the statistics. Therefore, it is necessary to revise the comprehensive turnover volume data of highways and waterways. Normally, for one indicator, because the statistic caliber changes only affects a small part of survey objects instead of the overall trend of all the survey objects, we hold the view that though the scope of the statistics caliber changes lead to the turnover volume changes, the growth rate of turnover volume varies slightly, even can be ignored. Based on this assumption, in this paper, the fixed growth rate is used to modify the data of highways and waterways. By setting the latest survey data as the base period data, and taking use of the annual growth rate to modify previous data, the modified formulas are as follows:
where represents the growth rate of turnover volume of highways (or waterways) in year t; and respectively represent the initial turnover volume of highways (or waterways) in the light of the original scope of the statistics caliber in year t and t − 1 ; and respectively represent the revised turnover volume data of highways (or waterways) in the light of the later scope of the statistics caliber in year t and t − 1. The statistic caliber in 2013 is adopted to correct the data from 2000 to 2012, and the results are shown as Figure 1.
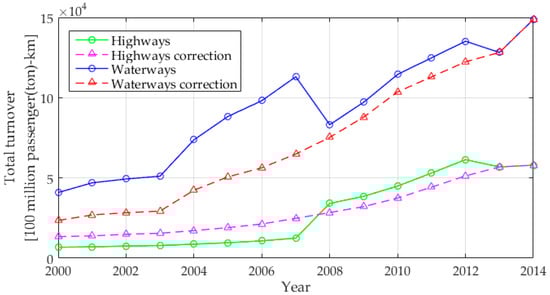
Figure 1.
Corrected data of highways and waterways.
From Figure 1, the line graph showed a steady increasing trend and there were no obvious inflection points in 2008 and 2013. In addition, the variation tendency of data in other years were consistent with the original data trend, thus the incommensurability and inconsistency problems due to statistics caliber changes were effectively solved. The converted and revised turnover volume data are shown in Table A4.
3.3. GDP and Population Size
The GDP data are from the China Statistical Yearbook, and they are adjusted according to the price in 2000 to eliminate the impact of price fluctuations. Population size data are counted at the end of the year, and they are obtained from the China Statistical Yearbook. The detailed data are shown in Table A5.
4. CO2 Emissions Accounting and Decomposition Analysis
4.1. CO2 Emissions Accounting
Firstly, the consumption amount of nine energy forms are converted according to the standard coal, the results are shown in Table A6.
Then, the CO2 emissions of various types of energy sources of transportation sector in China from 2000 to 2014 are calculated according to the Formula (1). The results are shown in Table A7.
4.2. Decomposition Analysis of Factors Affecting CO2 Emissions
In this paper, the carbon emissions intensity factors reflect CO2 emissions of per unit energy consumption, which is expressed by carbon emissions coefficient or carbon emission factor in academia. According to IPCC researches, the carbon intensity does not change in recent years, hence carbon intensity factor is assumed to be fixed as well, i.e., the contribution rate of carbon intensity can be set as 0 value. Consequently, the influencing factors affecting CO2 emissions mainly includes six categories: energy structure, energy efficiency, transport form, transportation development, economic development and population size. According to the formulas mentioned above, setting year 2000 as the base year to analyze the data from 2001 to 2014, decomposition results of six influencing factors are shown in Table A8.
5. Results and Discussion
5.1. CO2 Emissions
To make a clearer and more intuitive analysis of the changing trend of CO2 emissions related to transportation sector, calculation results of Table A7 are illustrated in Figure 2. It can be seen that, though the growth rate fluctuated sharply, CO2 emissions of transportation sector in China overall showed an upward trend over 2000–2014. Compared with the amount in 2000, the total CO2 emissions increased by 71111.34 ten thousand tons in 2014, with an average annual growth rate of 8.7%. It is because that during 2000 to 2004, China’s economy developed dramatically, leading to the great CO2 emissions growth rate of transportation sector; in 2005, the Kyoto Protocol was forced to take effect [30], at the same time, China’s energy conservation and emissions reduction policy implementation achieved remarkable results. As a result, the growth rate decreased gradually until 2008; in 2009, under the background of global financial crisis, the policy of expanding domestic demand was implemented, and a large number of public infrastructure was constructed to stimulate domestic economic development, leading to rapid development of transportation and increase of CO2 emissions; In 2012, the State Council issued The Energy saving and emission reduction planning in 12th Five-Year [31], which made a more stringent emission reduction target for the transportation sector that the comprehensive energy consumption of all kinds of transport forms should be reduced by more than 5%. From then on, the growth rate of CO2 emissions tended to decline.
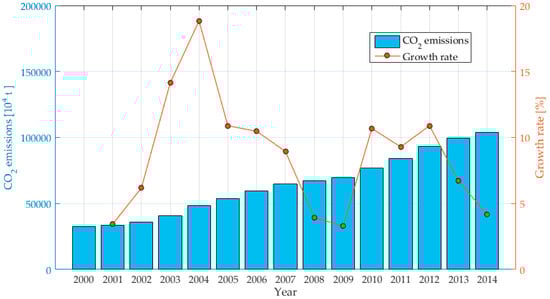
Figure 2.
CO2 emissions and the growth rate in China.
From Figure 3, during 2000 to 2014, overall, CO2 emissions of various energy sources related to transportation demonstrated an increasing trend. Specifically, CO2 emissions generated by natural gas, kerosene and electricity climbed up significantly. For natural gas, the contribution value went up from 253.35 ten thousand tons in 2000 to 6166.13 ten thousand tons in 2014 with an annual average growth rate of 26.48%, whose total growth rate exceeded more than 371%. CO2 emissions due to kerosene consumption rose from 2379.68 ten thousand tons in 2000 to 9840.37 ten thousand tons in 2014 with an average growth rate of10.94%. As for the CO2 emissions due to electricity consumption, it soared up from 2683.93 ten thousand tons in 2000 to 10106.21 ten thousand tons in 2014, whose average growth rate reached 10.28%. It is acknowledged that coal, coke and crude oil are main energy sources of China, however, with the upgrading of China’s industrial structure as well as new alternative energy development and utilization, the consumption of these three energy sources has been gradually decreased. Enormous CO2 emissions due to coal, coke and crude oil consumption from 2000 to 2003 were, after 2003, with the decrease of coal, coke and crude oil consumption, CO2 emissions related to transportation had been reduced significantly. In 2014, 958.39 ten thousand tons of CO2 caused by coal, coke and crude oil consumption were emitted, which decreased by 1012.34 ten thousand tons compared with that in year 2003 when the emissions reached 1970.73 ten thousand tons, and the total reduction rate outnumbered 50%. Diesel oil, gasoline and fuel oil are main sources of CO2 emissions followed by natural gas, kerosene and electricity. In detail, the average growth rates of gasoline and diesel oil were 9.17% and 8.59% respectively. For fuel oil, in 2008, CO2 emissions due to fuel oil compared to the emissions in 2007 decreased by 2795.44 ten thousand tons, and in 2009, it was only 488.58 ten thousand tons more than the amount in 2008 because of the reduction of freight volume caused by financial crisis.
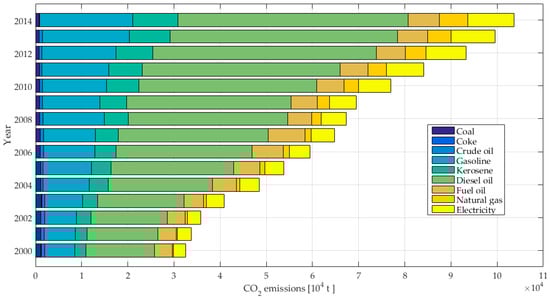
Figure 3.
CO2 emissions of nine energy sources of the transport sector in China.
Overall, traditional energy sources consumed by the transportation sector such as gasoline and diesel oil still play a predominant role in CO2 emissions, but the growth trend has slowed down. On the one hand, with the quick updates of transportation facilities, high-speed railways which consume electric power energy have rapid developed in recent years. On the other hand, the introduction of new energy technologies and the government’s active support policies have led to the rapid rise for natural gas vehicles and hybrid electric vehicles. As a result, though the growth rate of CO2 emissions from natural gas and electricity is increasing year by year, as compared with traditional energy sources, these clean energy sources can effectively alleviate the enormous pressure of CO2 emissions in China.
5.2. Decomposition Analysis of Factors Affecting CO2 Emissions
To make a more clear and intuitive analysis of the contribution effect of factors affecting CO2 emissions, the calculation results of Table A8 are illustrated in Figure 4. It can be seen that, overall, CO2 emissions related to transportation showed a growing trend over the study period. Among six kinds of influencing factors, economic development, transportation development, population size and energy structure significantly drove the growth of CO2 emissions. Specially, economic development was the key contributor to stimulate CO2 emissions growth. In contrast, energy efficiency and transport form played an inhibitory role in CO2 emissions. Energy efficiency suppressed CO2 emissions growth dramatically. Detailed analysis are represented in the following paragraphs.
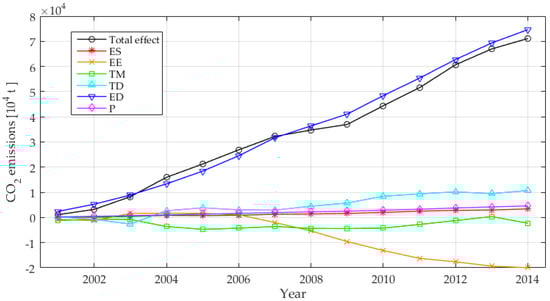
Figure 4.
CO2 emission contribution effects of six influencing factors from 2001 to 2014.
(1) Effect of energy structure on CO2 emissions growth
Figure 5 shows the contribution effect of energy structure on CO2 emissions growth.
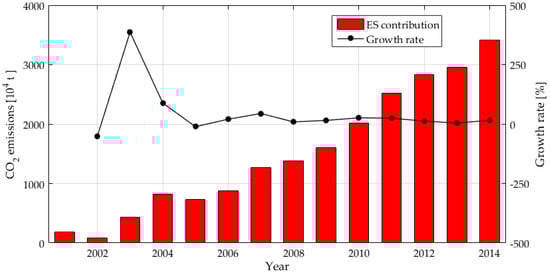
Figure 5.
Contribution effect of energy structure on CO2 emissions growth.
As shown in Figure 5, setting year 2000 as the base year, from 2001 to 2014, the energy structure still had a positive effect on CO2 emissions whose overall trend was upward. In 2002 and 2005, the contribution effect declined slightly compared to the previous year and the reduction reached 90.82 ten thousand tons and 89.56 ten thousand tons respectively. In 2003 and 2004, CO2 emissions shot up sharply with the growth rate of 386.76% and 88.50%. In other years, the data showed a slight upward trend with an average growth rate of 19.21%. Further, decomposing the energy structure factor into coal, coke, crude oil, gasoline, kerosene, diesel oil, fuel oil, natural gas and electricity, their contribution effects are shown in Table A9 and Figure 6.
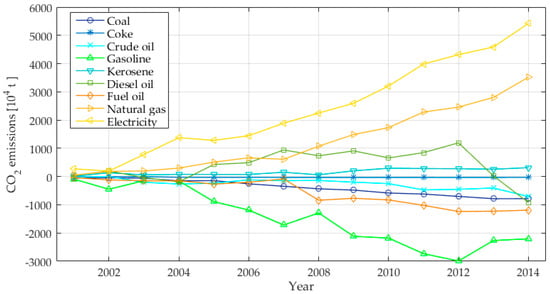
Figure 6.
Contribution effects of nine energy sources on CO2 emissions.
As can be seen from Table A9 and Figure 6, from 2001 to 2014, the differences between energy consumption and energy structure led to the fluctuation of CO2 emissions. Three energy sources-containing coal, coke and crude oil, whose average contribution rates respectively were −27.18%, −1.68% and −18.07%, had a negative inhibitive effect on CO2 emissions as a result declining dependence of the transportation on these three energy sources. Obviously, natural gas and electricity consumption contributed a lot on CO2 emissions growth. Among them, CO2 emissions due to natural gas consumption rose from 51.34 thousand tons in 2001 to 3519.8 thousand tons in 2014, with an average growth rate of 47.45%; for electricity, the amount of CO2 emissions surged from 272.29 ten thousand tons in 2001 to 5426.13 ten thousand tons in 2014, with the average growth rate of 38.72%. It is worth noting that, taking the CO2 emitted by thermal power generation into account made the electricity a major contributor for CO2 emissions growth. As a matter of fact, for equal traffic volume, CO2 emissions generated by electricity consumption are much lower than that generated by fossil fuels. Therefore, the contribution effects of natural gas and electricity consumption to CO2 emissions shows that the use of clean energy in transportation of China is gradually increasing, and its proportion of energy consumption structure is expanding as well. At the same time, this phenomenon inhibited the growth trend of gasoline consumption, making the contribution effect of gasoline to CO2 emissions be a negative value which reached −2206.00 ten thousand tons in 2014, with the average contribution rate of −120.59%. As a main energy source of traditional waterways transportation, fuel oil played an inhibitory role in CO2 emissions growth, whose decrement attained 1155.85 ten thousand tons from −35.43 ten thousand tons in 2001 to −1191.28 ten thousand tons in 2014,with the average contribution rate of −41.54%. The maximum inhibition effect of fuel oil appeared in 2002 with the contribution rate of −132.28%. Diesel and kerosene consumption accelerated CO2 emissions growth on the whole. Among them, the contribution effect of diesel oil fluctuated dramatically with negative values in 2003, 2004 and 2014 and an average value of 587.58 ten thousand tons in other years. The contribution effect of kerosene is relatively small who approximately remained at 162.88 ten thousand tons. Overall, even though the proportion of clean energy consumption has climbed up, there is still much room for improvement, so optimizing energy structure is still the main direction of suppressing CO2 emissions growth. Therefore, the governments are supposed to vigorously carry out clean energy advocacy, collaborate strongly with trade associations and enterprises, supply transportation enterprises with more national policy support and incentives, and continue to strengthen the use of natural gas, electricity and other clean energy to gradually get rid of the dependence on diesel consumption.
(2) Effect of energy efficiency on CO2 emissions growth
Figure 7 shows the contribution effect of energy efficiency on CO2 emissions growth.
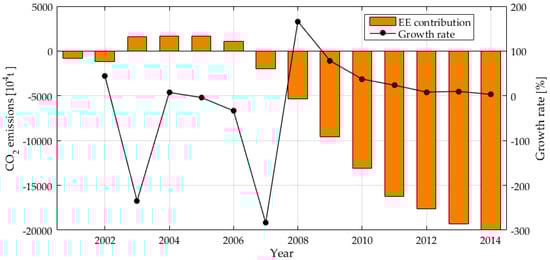
Figure 7.
Contribution effect of energy efficiency on CO2 emissions growth.
As can be seen from Figure 7, energy efficiency factor restrained the growth trend of CO2 emissions on the whole. In detail, the dynamic changing process can be divided into three stages: in 2001 and 2002, energy efficiency inhibited CO2 emissions growth with a gradually enhanced effect and the average contribution value reached −1001.02 ten thousand tons; during 2003–2006, energy efficiency promoted CO2 emissions growth with an average contribution value of 1509.51 ten thousand tons , and its contribution effect increased at first and then decreased, which reached the peak of 1709.31 ten thousand tons in 2004. Rapid development of transportation sector, and implement of high-energy consumption and high-emission development model in most enterprises were supposed to be responsible for this phenomenon; during 2007–2014, it can be found that energy efficiency demonstrated a growing ability in inhibiting CO2 emissions whose contribution value fell down from −2013.66 ten thousand tons in 2007 to −19975.64 ten thousand tons in 2014 with an average value of −12903.54 ten thousand tons. Moreover, the negative effect at this stage far overwhelmed the promoting effect at the previous stage. Viewing the situation from a whole, the improvement of energy efficiency of transportation sector contributed a lot to restrain the growth of CO2 emissions, which brought enlightenments for China to promote economic restructuring, improve the ecological environment and protect non- renewable resources.
(3) Effect of transport form on CO2 emissions growth
Figure 8 shows the contribution effect of transport forms on CO2 emissions growth.
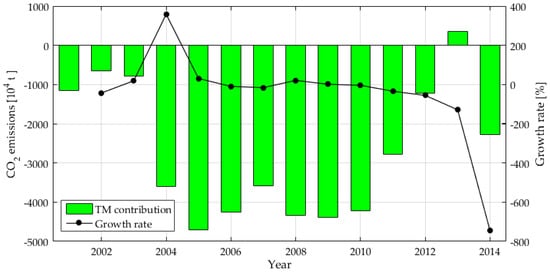
Figure 8.
Contribution effect of transport form on CO2 emissions growth.
It can be seen from Figure 8 that transport form showed a strong inhibitory effect on CO2 emissions. Specifically, the whole analysis period can be divided into three stages: from 2001 to 2003, the contribution effect of transport form, whose average contribution value equaled to −867.16 ten thousand tons, was relatively weak and showed a decreasing trend year by year; during 2004–2010, the factor of transport form maintained a strong effect on inhibiting CO2 emissions when the average contribution value reached −4154.67 ten thousand tons, specially, in 2005, the inhibitive effect reached its peak with the contribution value of −4698.34 ten thousand tons; during 2011–2014, the inhibitive effect of transport form demonstrated a tendency to rebound, especially in 2013, the contribution value turned to be positive from negative, and the inhibitory effect turned to be promoting effect. Further, decomposing transport form factor into railways, highways, waterways and civil aviation respectively, the contribution values of the four transport forms are shown in Table A10 and Figure 9.
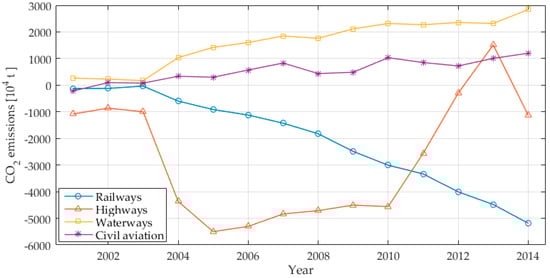
Figure 9.
Contribution effects of four transport forms on CO2 emissions.
From Table A10 and Figure 9, it is evident that waterways and civil aviation played an important role in driving CO2 emissions growth. Among them, the contribution value of waterways whose pulling effect was obvious and significant increased from 267.65 ten thousand tons in 2001 to 2843.86 ten thousand tons in 2014, with an average contribution value of 1610.92 ten thousand tons; the contribution value of civil aviation whose pulling effect was not obvious increased from −217.8 ten thousand tons in 2001 to 1200.67 ten thousand tons in 2014, with an average contribution value of 551.89 ten thousand tons; in contrast, railways and highways inhibited CO2 emissions. Inhibition value of railways changed from −126.92 ten thousand tons in 2001 to −5186.92 ten thousand tons in 2014, with an average contribution value of −2048.35 ten thousand tons, and this inhibitive effect exceeded the pulling effects of waterways and civil aviation, thus explaining the reason why transport form restrained CO2 emissions growth. As for highways, its contribution effect fluctuated dramatically especially in 2005 when the inhibitive effect reached its peak with the contribution value of −5500.88 ten thousand tons. In 2013, the inhibitive effect of highways turned to be pulling effect with the contribution value of 1511.57 ten thousand tons, causing the pulling effect of transport form factor; however, overall, the highways still played a strong inhibition role in CO2 emissions. The study [32] showed that under the premise of the same traffic volume, the energy consumption ratio of railways, highways and civil aviation is equal to 1:9.3:18.6. From the perspective of passenger transport, CO2 emissions per kilometer per passenger generated by railways is 1/2 times that of highways and is 1/4 times that of civil aviation. From the perspective of freight transport, CO2 emissions per ton per kilometer generated by railways is 1/10 times that of highways. It follows that railways has unparalleled advantages in promoting energy efficiency and environment protection compared to other transport forms. It can be concluded that with the rapid development of high-speed railways and the introduction of new energy vehicles, to a certain extent, China’s transportation structure has improved. However, for the total effect of CO2 emissions, the suppressing effect of transport form is still not evident enough, and it is necessary to take transport distance, cost, duration and other factors into consideration and choose reasonable modes of transport to avoid empty driving, repeat, detour and other unreasonable transport phenomenon.
(4) Effect of transportation development on CO2 emissions growth
Figure 10 shows the contribution effect of transportation development on CO2 emissions growth.
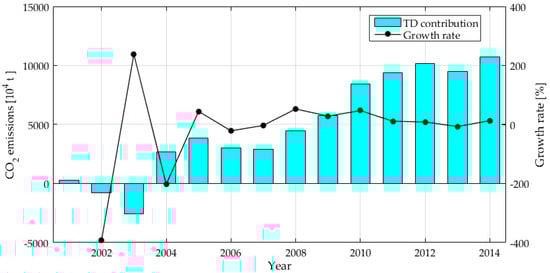
Figure 10.
Contribution effect of transportation development on CO2 emissions growth.
As can be seen from Figure 10, transportation development stimulated CO2 emissions growth on the whole. Specifically, it can be divided into two stages: from 2001 to 2003, the contribution values turned from positive to negative, and in 2003, the contribution value was −2589.5 ten thousand tons, obviously inhibiting the growth of CO2 emissions; during 2004–2014, the effect of transport development showed an increasing trend with some fluctuations with an average contribution value of 6440.60 ten thousand tons. The factor of transportation development is measured by ratio of comprehensive turnover volume to GDP. From Table A6 and Table A7, the growth rate of comprehensive turnover volume was less than the growth rate of GDP in 2001–2003, while during 2004–2014, the growth rate of comprehensive turnover volume which increased after decrement in the study period, turned greater than that of GDP adversely, indicating that with the improvement of transportation structure, the comprehensive transportation volume brought by unit GDP continuously went up gradually. Along with this changing process, the energy consumed by transportation sector climbed up and that led to the effect of driving CO2 emissions related to transportation development.
(5) Effects of economic development and population size on CO2 emissions growth
Figure 11 and Figure 12 respectively show the contribution effects of economic development and population size on CO2 emissions growth.
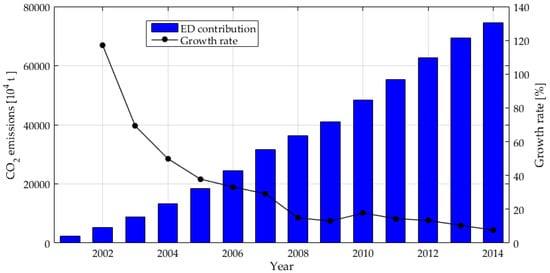
Figure 11.
Contribution effect of economic development on CO2 emissions growth.
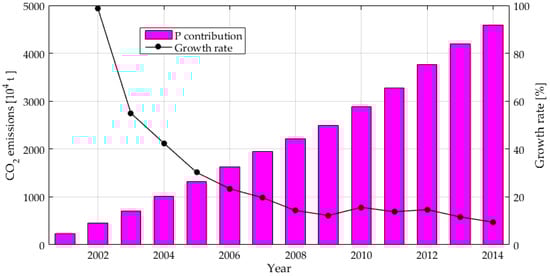
Figure 12.
Contribution effect of population size on CO2 emissions growth.
As seen from Figure 11, economic development played a significant role in promoting CO2 emissions growth. During the study period, economic development showed an exponential growth trend, whose contribution value soared up from 2424.02 ten thousand tons in 2001 to 74634.24 ten thousand tons in 2014, increasing by 72210.22 ten thousand tons with an average contribution rate of 113.80%. There may be two main reasons: first, the improvement of people’s income level and the increase in travel demand made the demand for vehicles climb up. Along with the increasing demand for public transport, a large number of families purchased private cars, which led to the significant pulling effect of economic development level on CO2 emissions of transportation sector. Another reason is that, with the development of electronic commerce, electronic business has become a new business mode and express delivery get a rapid development. Meanwhile, the disorderly development of lots of express companies and city distribution logistics had led to CO2 emissions growth of transportation sector to a certain extent. According to Figure 4, it demonstrated that economic development trend was consistent with the development trend of total effect, reflecting that economic development was the most important driving force for CO2 emissions. From Figure 12, the factor of population size also had a stimulating effect on CO2 emissions growth whose contribution value increased from 230.3 ten thousand tons in 2001 to 4592.24 ten thousand tons in 2014 with an average contribution rate of 8.07%. Besides, the contribution effect of population size was relatively weaker than that of economic development.
6. Conclusions
China has now become the largest country in CO2 emissions all over the world. With the CO2 emission proportion related to transportation increasing year by year, the transportation sector in China has turned to be one of the sectors which have a high growth speed in CO2 emission. To accurately analyze the potentially influencing factors which accelerate the process of CO2 emission of transportation sector, in this paper, a decomposition model based on the measurement of CO2 emission of transportation sector by the checklists method of Intergovernmental Panel on Climate Change’s (IPCC) was established. In more detail, Logarithmic Mean Divisia Index (LMDI) decomposition analysis technology and modified fixed growth rate method were employed in this model. Then the effects of six influencing factors including energy structure, energy efficiency, transport form, transportation development, economic development and population size from 2001 to 2014 were quantitatively analyzed. Consequently, conclusions can be draw as follows:
- (1)
- In the perspective of energy structure, the pulling effects of natural energy, electricity and other clean energy consumption on CO2 emissions offset the inhibitory effects of traditional fossil fuels, making the energy structure play a significant role in driving CO2 emissions growth. However, the promoting effect was not significant enough. Therefore, the energy structure is not the key factor that the government should think seriously.
- (2)
- In 2001 and 2002, energy efficiency was an effective factor in inhibiting CO2 emissions; during 2003–2006, it turned to give weak impetus to CO2 emissions growth; over the 2007–2014 period, it played a significant inhabitation effect on CO2 emissions. Therefore, throughout the study period, energy efficiency had effectively restricted CO2 emissions and was the main factor who inhibited CO2 emissions growth. It is therefore clear that the government should improve the energy efficiency so as to control the CO2 emission of transport sector.
- (3)
- In the perspective of transport form, the inhibitive effects of railways and highways on CO2 emissions growth overwhelmed the pulling effects of waterways and civil aviation, making transport form factor play an inhibitive role in CO2 emissions growth though the inhibitive effect was not apparent. As a result, the government should attach importance to the development of railways.
- (4)
- The contribution effect on CO2 emissions growth generated by transportation development decreased at the beginning then climbed up, indicating that the comprehensive transportation volume brought by unit GDP continuously went up with the improvement of transportation structure. Along with this changing process, the energy consumed by transportation sector increased and that led to the significant role in promoting transportation development on CO2 emissions. Hence the government should attach significance to the transportation development, including the improvement of transportation means and the improvement of transportation infrastructure.
- (5)
- Economic development was the most important driving force for CO2 emissions. Consistent with the development trend of total effect, in the study period, economic development showed a trend of exponential growth. Population size drove CO2 emissions growth as well, however, the contribution effect of population size was relatively weaker than that of economic development.
Overall, during 2000–2014, CO2 emissions caused by transportation sector increased gradually, in detail, economic development, transportation development, population size and energy structure together played a pulling effect. Among them, economic development was the main driving force who accounted most on CO2 emissions growth. In contrast, energy efficiency and transport form were main factors who inhibited the growth of CO2 emissions with significant effects. In conclusion, the government is supposed to further improve the energy efficiency and promote the development of low-carbon transport form, especially the railways. Meanwhile, the government should attach significance to the transportation development, including the improvement of transportation means and the improvement of transportation infrastructure. Furthermore, the method and model proposed in this paper don’t involve Chinese characteristics and it is universal, so that this method and model can be utilized to analyze the carbon emissions of the transportation sector in other countries. Here, this paper takes China as the research object, so as to provide guidance and reference for the carbon emission analysis of the transportation sector in the other countries.
Acknowledgments
This work is supported by the Natural Science Foundation of China (Project No. 71471059) and the Fundamental Research Funds for the Central Universities (Project No. 2017XS103).
Author Contributions
Yi Liang designed this research and wrote this paper; Dongxiao Niu provided professional guidance; Haichao Wang and Yan Li collected all the data and revised this paper.
Conflicts of Interest
The authors declare no conflict of interest.
Appendix A

Table A1.
Indicators data of energy sources.
Table A1.
Indicators data of energy sources.
| Energy Source | SCC [kgce/kg] | NCV [kJ/kg] | CCV [tC/TJ] | COR | Carbon Emissions Coefficient [kg-CO2/kg] |
|---|---|---|---|---|---|
| Coal | 0.7143 | 20,908 | 26.4 | 0.94 | 1.9003 |
| Coke | 0.9714 | 28,435 | 29.5 | 0.93 | 2.8604 |
| Crude oil | 1.4286 | 41,816 | 20.1 | 0.98 | 3.0202 |
| Gasoline | 1.4714 | 43,070 | 18.9 | 0.98 | 2.9251 |
| Kerosene | 1.4714 | 43,070 | 19.5 | 0.98 | 3.0179 |
| Diesel oil | 1.4571 | 42,652 | 20.2 | 0.98 | 3.0959 |
| Fuel oil | 1.4286 | 41,816 | 21.1 | 0.98 | 3.1705 |
| Natural gas | 1.3300 | 38,931 | 15.3 | 0.99 | 2.1622 |
Table A2.
Average CO2 emissions per unit of power supply of regional power grid.
Table A2.
Average CO2 emissions per unit of power supply of regional power grid.
| Regional Power Grid | Provinces | CO2 Emissions [kg-CO2/kW·h] |
|---|---|---|
| North region | Beijing, Tianjin, Hebei, Shanxi, Shandong, West Inner Mongoria | 1.246 |
| Northeast region | Liaoning, Jilin, Heilongjiang, East Inner Mongoria | 1.096 |
| East region | Shanghai, Jiangsu, Zhejiang, Anhui, Fujian | 0.928 |
| Central region | Henan, Hubei, Hunan, Jiangxi, Sichuan, Chongqing | 0.801 |
| Northwest region | Shaanxi, Gansu, Qinghai, Ningxia, Xinjiang | 0.977 |
| Southern region | Guangdong, Guangxi, Yunnan, Guizhou | 0.714 |
| Hainan | Hainan | 0.917 |
| Average value | 0.954 | |
Table A3.
The conversion method of comprehensive turnover volume.
Table A3.
The conversion method of comprehensive turnover volume.
| Transport form | Passenger Turnover Volume [100 Million Person-km] | Freight Turnover Volume [100 Million ton-km] | Comprehensive Turnover Volume [100 Million ton-km] |
|---|---|---|---|
| Railways | P | F | T = P + F |
| Highways | P | F | T = 0.1 × P + F |
| Waterways | P | F | T = P + F |
| Civil aviation | P | F | T = 0.072 × P + F |
Table A4.
The converted and revised turnover volume data (100 million ton-km).
Table A4.
The converted and revised turnover volume data (100 million ton-km).
| Year | Railways | Highways | Waterways | Civil Aviation |
|---|---|---|---|---|
| 2000 | 18,303.08 | 13,406.98 | 23,479.11 | 120.15 |
| 2001 | 19,460.92 | 13,866.17 | 26,947.82 | 122.30 |
| 2002 | 20,627.80 | 14,861.41 | 28,310.01 | 142.90 |
| 2003 | 22,035.31 | 15,527.95 | 29,319.06 | 148.85 |
| 2004 | 25,001.00 | 17164.27 | 42327.75 | 200.13 |
| 2005 | 26,787.96 | 19,006.00 | 50,673.83 | 226.13 |
| 2006 | 28,576.53 | 21,308.37 | 56,323.77 | 264.97 |
| 2007 | 31,013.31 | 24,787.69 | 64,882.36 | 317.39 |
| 2008 | 32,884.88 | 28,425.26 | 75,261.48 | 327.16 |
| 2009 | 33,118.06 | 32,125.38 | 87,909.13 | 369.25 |
| 2010 | 36,406.31 | 37,437.10 | 103,608.12 | 469.71 |
| 2011 | 39,078.08 | 44,264.90 | 112,978.01 | 500.57 |
| 2012 | 38999.42 | 51,238.13 | 122,338.02 | 525.74 |
| 2013 | 39,769.51 | 56,863.17 | 128,208.98 | 577.58 |
| 2014 | 38,772.04 | 57,946.58 | 148,783.90 | 643.83 |
Table A5.
The data of GDP and population size.
Table A5.
The data of GDP and population size.
| Year | GDP(100 Million Euro) | Population Size (Ten Thousand People) |
|---|---|---|
| 2000 | 13,116.91 | 126,743 |
| 2001 | 14,210.85 | 127,627 |
| 2002 | 15,508.39 | 128,453 |
| 2003 | 17,064.75 | 129,227 |
| 2004 | 18,790.21 | 129,988 |
| 2005 | 20,931.50 | 130,756 |
| 2006 | 23,593.87 | 131,448 |
| 2007 | 26,951.62 | 132,129 |
| 2008 | 29,553.60 | 132,802 |
| 2009 | 32,331.58 | 133,450 |
| 2010 | 35,770.42 | 134,091 |
| 2011 | 39,181.65 | 134,735 |
| 2012 | 42,259.85 | 135,404 |
| 2013 | 45,538.21 | 136,072 |
| 2014 | 48,861.44 | 136,782 |
Table A6.
Energy consumption of the transportation sector (ten thousand tons of standard coal).
Table A6.
Energy consumption of the transportation sector (ten thousand tons of standard coal).
| Year | Coal | Coke | Crude Oil | Gasoline | Kerosene | Diesel Oil | Fuel Oil | Natural Gas | Electricity |
|---|---|---|---|---|---|---|---|---|---|
| 2000 | 630.18 | 10.92 | 250.08 | 2247.98 | 788.52 | 4799.41 | 1214.31 | 117.17 | 345.59 |
| 2001 | 600.93 | 11.35 | 242.59 | 2301.81 | 825.00 | 4984.74 | 1221.45 | 145.77 | 380.15 |
| 2002 | 608.56 | 11.11 | 251.35 | 2359.39 | 1054.63 | 5339.99 | 1217.31 | 217.72 | 372.39 |
| 2003 | 684.54 | 10.48 | 211.88 | 2817.94 | 1091.31 | 6025.40 | 1343.30 | 250.31 | 500.13 |
| 2004 | 591.43 | 1.74 | 176.89 | 3434.92 | 1353.26 | 7263.99 | 1643.53 | 347.93 | 552.62 |
| 2005 | 579.42 | 1.04 | 181.25 | 3575.58 | 1401.39 | 8582.92 | 1801.49 | 505.53 | 528.89 |
| 2006 | 549.97 | 0.83 | 233.80 | 3814.40 | 1486.91 | 9540.10 | 2115.20 | 628.29 | 574.40 |
| 2007 | 525.65 | 0.53 | 233.80 | 3845.05 | 1662.65 | 10,468.35 | 2514.26 | 623.50 | 653.72 |
| 2008 | 475.30 | 0.28 | 236.66 | 4547.26 | 1728.29 | 11,145.81 | 1632.56 | 951.62 | 702.77 |
| 2009 | 457.79 | 0.14 | 219.18 | 4239.97 | 1933.79 | 11,499.37 | 1786.66 | 1211.23 | 758.31 |
| 2010 | 456.60 | 0.12 | 225.72 | 4715.73 | 2355.83 | 12,412.39 | 1895.25 | 1419.11 | 902.74 |
| 2011 | 461.33 | 0.09 | 150.57 | 4963.80 | 2422.44 | 13,820.88 | 1921.70 | 1840.06 | 1042.71 |
| 2012 | 438.77 | 0.09 | 170.57 | 5522.21 | 2629.52 | 15,630.36 | 1977.10 | 2054.98 | 1124.99 |
| 2013 | 439.59 | 2.15 | 212.48 | 6447.38 | 2940.12 | 15,912.30 | 2041.46 | 2337.87 | 1230.13 |
| 2014 | 398.56 | 2.62 | 64.07 | 6864.10 | 3260.67 | 16,090.46 | 2123.43 | 2851.79 | 1301.81 |
Table A7.
CO2 emissions of transportation sector from 2000 to 2014 (ten thousand tons).
Table A7.
CO2 emissions of transportation sector from 2000 to 2014 (ten thousand tons).
| Year | Coal | Coke | Crude Oil | Gasoline | Kerosene | Diesel Oil | Fuel Oil | Natural Gas | Electricity | Sum |
|---|---|---|---|---|---|---|---|---|---|---|
| 2000 | 1197.54 | 31.23 | 755.28 | 6575.55 | 2379.68 | 14,858.50 | 3849.97 | 253.35 | 2682.93 | 32,584.03 |
| 2001 | 1141.94 | 32.45 | 732.67 | 6732.81 | 2489.77 | 15,432.25 | 3872.62 | 315.18 | 2951.22 | 33,700.91 |
| 2002 | 1156.44 | 31.79 | 759.12 | 6901.22 | 3182.76 | 16,532.09 | 3859.48 | 470.76 | 2890.92 | 35,784.57 |
| 2003 | 1300.84 | 29.98 | 639.91 | 8242.47 | 3293.46 | 18,654.04 | 4258.93 | 541.21 | 3882.61 | 40,843.44 |
| 2004 | 1123.90 | 4.97 | 534.24 | 10,047.15 | 4084.01 | 22,488.60 | 5210.82 | 752.29 | 4290.11 | 48,536.09 |
| 2005 | 1101.07 | 2.97 | 547.40 | 10,458.56 | 4229.26 | 26,571.85 | 5711.63 | 1093.06 | 4105.87 | 53,821.68 |
| 2006 | 1045.10 | 2.36 | 706.14 | 11,157.12 | 4487.34 | 29,535.20 | 6706.24 | 1358.49 | 4459.18 | 59,457.17 |
| 2007 | 998.89 | 1.53 | 706.14 | 11,246.76 | 5017.72 | 32,408.95 | 7971.48 | 1348.14 | 5074.95 | 64,774.55 |
| 2008 | 903.22 | 0.81 | 714.77 | 13,300.73 | 5215.81 | 34,506.31 | 5176.04 | 2057.58 | 5455.73 | 67,331.00 |
| 2009 | 869.93 | 0.39 | 661.95 | 12,401.92 | 5835.98 | 35,600.91 | 5664.62 | 2618.92 | 5886.89 | 69,541.52 |
| 2010 | 867.68 | 0.33 | 681.72 | 13,793.52 | 7109.66 | 38,427.53 | 6008.90 | 3068.40 | 7008.15 | 76,965.89 |
| 2011 | 876.67 | 0.25 | 454.76 | 14,519.11 | 7310.68 | 42,788.08 | 6092.74 | 3978.57 | 8094.78 | 84,115.62 |
| 2012 | 833.79 | 0.25 | 515.17 | 16,152.46 | 7935.64 | 48,390.02 | 6268.39 | 4443.28 | 8733.55 | 93,272.54 |
| 2013 | 835.35 | 6.14 | 641.72 | 18,858.59 | 8872.99 | 49,262.90 | 6472.43 | 5054.95 | 9549.78 | 99,554.86 |
| 2014 | 757.38 | 7.50 | 193.51 | 20,077.48 | 9840.37 | 49,814.47 | 6732.33 | 6166.13 | 10,106.21 | 103,695.38 |
Table A8.
The CO2 emission contribution effects of six influencing factors of the transportation sector from 2001 to 2014 (ten thousand tons).
Table A8.
The CO2 emission contribution effects of six influencing factors of the transportation sector from 2001 to 2014 (ten thousand tons).
| Year | Energy Structure | Energy Efficiency | Transportation Form | Transportation Development | Economic Development | Population Size | Total Effect |
|---|---|---|---|---|---|---|---|
| 2001 | 180.16 | −820.92 | −1158.18 | 261.71 | 2424.02 | 230.32 | 1117.11 |
| 2002 | 89.34 | −1181.12 | −658.45 | −766.09 | 5259.6 | 457.48 | 3200.76 |
| 2003 | 434.81 | 1588.98 | −784.86 | −2589.5 | 8901.31 | 708.92 | 8259.66 |
| 2004 | 819.65 | 1709.31 | −3597.69 | 2662.85 | 13,348.34 | 1009.88 | 15,952.34 |
| 2005 | 730.09 | 1644.41 | −4698.34 | 3849.13 | 18,397.84 | 1314.8 | 21,237.93 |
| 2006 | 878.78 | 1095.34 | −4255.09 | 3021.19 | 24,510.7 | 1622.51 | 26,873.43 |
| 2007 | 1269.46 | −2013.66 | −3585.2 | 2925.64 | 31,653.13 | 1941.45 | 32,190.82 |
| 2008 | 1384.84 | −5361.41 | −4338.73 | 4466.25 | 36,377.5 | 2218.84 | 34,747.29 |
| 2009 | 1598.25 | −9560.94 | −4391.54 | 5736.36 | 41,084.94 | 2490.74 | 36,957.81 |
| 2010 | 2019.47 | −13126.62 | −4216.11 | 8440.77 | 48,384.81 | 2879.87 | 44,382.19 |
| 2011 | 2519.49 | −16246.38 | −2772.11 | 9381.79 | 55,371.9 | 3277.24 | 51,531.93 |
| 2012 | 2830.68 | −17605.88 | −1227.22 | 10,171.35 | 62,761.55 | 3758.38 | 60,688.86 |
| 2013 | 2955.39 | −19337.79 | 352.41 | 9473.87 | 69,331.69 | 4195.65 | 66,971.22 |
| 2014 | 3418.77 | −19975.64 | −2275.23 | 10,717.38 | 74,634.24 | 4592.24 | 71,111.76 |
Table A9.
Contribution effects of nine energy sources to CO2 emissions of the transport sector (ten thousand tons).
Table A9.
Contribution effects of nine energy sources to CO2 emissions of the transport sector (ten thousand tons).
| Year | Coal | Coke | Crude Oil | Gasoline | Kerosene | Diesel Oil | Fuel Oil | Natural Gas | Electricity |
|---|---|---|---|---|---|---|---|---|---|
| 2001 | −53.94 | 1.27 | −21.55 | −91.35 | 11.54 | 45.98 | −35.43 | 51.34 | 272.29 |
| 2002 | −47.39 | 0.39 | −0.21 | −450.14 | 135.14 | 194.69 | −118.17 | 181.92 | 193.10 |
| 2003 | −57.72 | −5.20 | −205.14 | −148.36 | 59.42 | −34.29 | −151.91 | 196.97 | 781.05 |
| 2004 | −151.56 | −27.22 | −263.91 | −153.89 | 77.71 | −190.26 | −148.14 | 299.67 | 1377.25 |
| 2005 | −145.40 | −28.77 | −235.39 | −887.43 | 75.83 | 426.68 | −266.97 | 511.04 | 1280.50 |
| 2006 | −257.94 | −29.92 | −117.98 | −1187.94 | 74.67 | 489.9 | −201.78 | 663.02 | 1446.77 |
| 2007 | −345.09 | −31.02 | −146.81 | −1717.28 | 151.31 | 941.37 | −85.08 | 611.8 | 1890.26 |
| 2008 | −434.81 | −31.55 | −139.45 | −1288.48 | 62.35 | 735.09 | −839.38 | 1074.22 | 2246.84 |
| 2009 | −480.27 | −31.89 | −198.72 | −2116.12 | 202.6 | 908.58 | −769.88 | 1487.25 | 2596.70 |
| 2010 | −583.95 | −32.58 | −251.73 | −2180.28 | 295.43 | 659.15 | −827.77 | 1733.98 | 3207.22 |
| 2011 | −620.36 | −32.85 | −472.96 | −2732.81 | 283.03 | 846.35 | −1020.15 | 2284.05 | 3985.20 |
| 2012 | −703.51 | −33.15 | −452.34 | −2990.64 | 277.70 | 1194.30 | −1237.70 | 2459.02 | 4317.01 |
| 2013 | −785.62 | −31.59 | −407.03 | −2265.04 | 259.32 | 21.29 | −1227.94 | 2802.57 | 4589.43 |
| 2014 | −782.95 | −29.67 | −708.97 | −2206.00 | 314.2 | −922.5 | −1191.28 | 3519.8 | 5426.13 |
Table A10.
Contribution effect of four transport forms to CO2 emissions of the transport sector (ten thousand tons).
Table A10.
Contribution effect of four transport forms to CO2 emissions of the transport sector (ten thousand tons).
| Year | Railways | Highways | Waterways | Civil Aviation |
|---|---|---|---|---|
| 2001 | −126.92 | −1081.11 | 267.65 | −217.8 |
| 2002 | −121.00 | −863.03 | 228.12 | 97.46 |
| 2003 | −34.66 | −999.29 | 171.07 | 78.03 |
| 2004 | −598.30 | −4368.25 | 1034.48 | 334.38 |
| 2005 | −915.38 | −5500.88 | 1418.96 | 298.95 |
| 2006 | −1122.05 | −5305.08 | 1602.62 | 569.42 |
| 2007 | −1427.84 | −4836.79 | 1848.64 | 830.78 |
| 2008 | −1823.89 | −4712.09 | 1761.35 | 435.9 |
| 2009 | −2489 | −4505.24 | 2116.85 | 485.85 |
| 2010 | −3006.04 | −4559.7 | 2317.06 | 1032.57 |
| 2011 | −3335.03 | −2558.73 | 2270.94 | 850.72 |
| 2012 | −4007.37 | −297.21 | 2354.81 | 722.55 |
| 2013 | −4482.56 | 1511.57 | 2316.42 | 1006.98 |
| 2014 | −5186.92 | −1132.85 | 2843.86 | 1200.67 |
| Total contribution | −28676.96 | −39208.68 | 22552.83 | 7726.46 |
References
- Lin, B.Q.; Xie, C.P. Reduction Potential of CO2 Emissions in China’s Transport Industry. Renew. Sustain. Energy Rev. 2014, 33, 689–700. [Google Scholar] [CrossRef]
- Sun, W.; Xu, Y. Using a back propagation neural network based on improved particle swarm optimization to study the influential factors of carbon dioxide emissions in Hebei Province, China. J. Clean. Prod. 2016, 112, 1282–1291. [Google Scholar] [CrossRef]
- Timilsina, G.R.; Shrestha, A. Transport Sector CO2 Emissions Growth in Asia: Underlying Factors and Policy Options. Energy Polocy 2009, 37, 4523–4539. [Google Scholar] [CrossRef]
- National Bureau of Statistics of China. China Statistical Yearbook 2016; China Statistics Press: Beijing, China, 2016.
- International Organization for Standardization. Available online: https://www.iso.org/standard/38381.html (accessed on 25 September 2017).
- World Resources Institute, World Business Council on Sustainable Development. Available online: http://www.ghgprotocol.org/ (accessed on 25 September 2017).
- British Standards Institution. Available online: https://www.bsigroup.com/en-GB/PAS-2060-Carbon-Neutrality/ (accessed on 25 September 2017).
- IPCC. 2006 IPCC Guidelines for National Greenhouse Gas Inventories; IGES: Kanagawa Prefecture, Japan, 2006. [Google Scholar]
- Wang, C.J.; Wang, F.; Zhang, X.L.; Zhang, H.G. Influencing mechanism of energy-related carbon emissions in Xinjiang based on the input-output and structural decomposition analysis. J. Geogr. Sci. 2017, 27, 365–384. [Google Scholar] [CrossRef]
- Nie, H.; Kemp, R.; Vivanco, D.F.; Vasseur, V. Structural decomposition analysis of energy-related CO2 emissions in China from 1997 to 2010. Energy Effic. 2016, 9, 1351–1367. [Google Scholar] [CrossRef]
- Gao, C.C.; Liu, Y.H.; Jin, J.; Wei, T.; Zhang, J.; Zhu, L. Driving forces in energy-related carbon dioxide emissions in east and south coastal China: Commonality and variations. J. Clean. Prod. 2016, 135, 240–250. [Google Scholar] [CrossRef]
- Mishina, Y.; Muromachi, Y. Revisiting Decomposition Analysis for Carbon Dioxide Emissions from Car Travel Introduction of Modified Laspeyres Index Method. Transp. Res. Rec. 2012, 2270, 171–179. [Google Scholar] [CrossRef]
- Boyd, G. Separating the changing composition of US manufacturing production form energy efficiency improvements: A Divisia index approach. Energy 1987, 8, 77–96. [Google Scholar]
- Liu, X.Q.; Ang, B.W.; Ong, H.L. The application of Divisia index to the decomposition of changes in industrial energy consumption. Energy J. 1992, 13, 161–177. [Google Scholar] [CrossRef]
- Boyd, G.A.; Hanson, D.A.; Sterner, T. Decomposition of changes in energy intensity: A comparison of the Divisia index and other methods. Energy Econ. 1988, 10, 309–312. [Google Scholar] [CrossRef]
- Ang, B.W. Decomposition analysis for policy making in energy: What is preferred method. Energy Policy 2004, 32, 1131–1139. [Google Scholar] [CrossRef]
- Ang, B.W. The LMDI approach to decomposition analysis: A practical guide. Energy Policy 2005, 33, 867–871. [Google Scholar] [CrossRef]
- Liu, N.; Ang, B.W. Factors shaping aggregate energy intensity trend for industry: Energy intensity versus product mix. Energy Econ. 2007, 29, 609–635. [Google Scholar] [CrossRef]
- Su, B.; Ang, B.W.; Li, Y.Z. Input-output and structural decomposition analysis of Singapore’s carbon emissions. Energy Policy 2017, 105, 484–492. [Google Scholar] [CrossRef]
- Wang, M.; Feng, C. Decomposition of energy-related CO2 emissions in China: An empirical analysis based on provincial panel data of three sectors. Appl. Energy 2017, 190, 772–787. [Google Scholar] [CrossRef]
- Zhao, Y.H.; Li, H.; Zhang, Z.H.; Zhang, Y.F.; Wang, S.; Liu, Y. Decomposition and scenario analysis of CO2 emissions in China’s power industry: Based on LMDI method. Nat. Hazards 2017, 86, 645–668. [Google Scholar] [CrossRef]
- Sun, W.; He, Y.J.; Chang, H. Regional characteristics of CO2 emissions from China’s power generation: Affinity propagation and refined Laspeyres decomposition. Int. J. Glob. Warm. 2017, 11, 38–66. [Google Scholar] [CrossRef]
- Ministry of transport of the People’s Republic of China. Compilation of Special Survey Data of National Highways and Waterways Transportation Volume; China Economic Publishing House: Beijing, China, 2010.
- Ministry of transport of the People’s Republic of China. Trial Scheme for Highway and Waterway Traffic Statistics; China Economic Publishing House: Beijing, China, 2014.
- Henriques, S.T.; Borowiecki, K.J. The drivers of long-run CO2 emissions in Europe, North America and Japan since 1800. Energy Policy 2017, 101, 537–549. [Google Scholar] [CrossRef]
- Ang, B.W.; Liu, N. Handling zero values in the logarithmic mean Divisia index decomposition approach. Energy Policy 2007, 35, 238–246. [Google Scholar] [CrossRef]
- Department of Energy Statistics of China, National Bureau of Statistics of China. China Energy Statistical Yearbook, 2001–2014; Department of Energy Statistics of China, National Bureau of Statistics of China: Beijing, China, 2001–2014.
- National Development and Reform Commission of China. General Principles for Calculation of Total Production Energy Consumption; National Development and Reform Commission of China: Beijing, China, 2008.
- National Development and Reform Commission of China. Guidelines for the Preparation of Provincial Greenhouse Gas Inventories; National Development and Reform Commission of China: Beijing, China, 2011.
- Kyoto Protocol to the United Nations Framework Convention on Climate Change; United Nations: Kyoto, Japan, 1997.
- The Sate Council of China. Energy Saving and Emission Reduction Planning in 12th Five-Year; The Sate Council of China: Beijing, China, 2012.
- Ma, Y.Y.; Wang, W.G. Character of carbon emission of logistics industry in China and its affecting factors decomposition analysis: Based on LMDI technique. Math. Pract. Theory 2013, 43, 31–42. [Google Scholar]
© 2017 by the authors. Licensee MDPI, Basel, Switzerland. This article is an open access article distributed under the terms and conditions of the Creative Commons Attribution (CC BY) license (http://creativecommons.org/licenses/by/4.0/).