Abstract
Haze has caused the deterioration of air quality and has ultimately affected the ecological environment. The contingent valuation method (CVM) is an important assessment method that is widely used in ecological economics. The public’s willingness to pay (WTP) for haze management and prevention can be analyzed using dichotomous choices. Here, the method is applied to study the valuation of haze management and prevention. Taking Jiangsu Province as an example, the non-market value is calculated by constructing the binary logistic model from questionnaire data, combined with a data-processing method: the sure independence screening (SIS) algorithm. The conclusions are as follows: (1) The public’s WTP for haze management and prevention is closely related to the monthly income of families and transport modality; (2) According to the CVM, the non-market value for haze management and prevention in Jiangsu is 7.645 billion yuan; (3) By the average estimate method (AEM), this value is 12.529 billion yuan, about 1.64 times the estimate from the CVM. This is because the AEM ignores the correlation among the influence factors and, therefore, overestimates the valuation of the services; (4) The CVM, combined with the SIS algorithm, does a better job in estimating the valuation of the services.
1. Introduction
Haze has become one of the worst disaster weathers in recent years and it has drawn much attention. Nowadays, air quality forecasting and early haze warnings have become common in all the major cities. Fine (smaller than 2.5 micrometers) particular matter, PM2.5, is the most important indicator for monitoring air quality. Haze, which arises mainly from industrial waste gas, exhaust, smoke dust, raise dust, etc., causes deterioration of air quality and ultimately affects ecosystems. Due to rapid urbanization, the haze phenomenon has become increasingly frequent, affecting larger areas for longer periods of time. As a result, it seriously damages people’s health. In addition, haze has a major influence on transportation, power supply system, crops, etc., and brings huge economic losses. Therefore, researching the economic impact of haze is important for resolving the conflict between development and environment.
Most studies about haze in existing literature focus on the cause of haze. Zhang et al. [1] analyzed the role of meteorological conditions in persistently strong haze weather, specifically air circulation background and the evolution of haze weather. Li et al. [2] collected PM2.5 and PM10 samples. Song et al. [3] highlighted that regulatory controls of gaseous emissions from industry and transportation are the key steps to reducing the urban PM level in China. The main pollutants include volatile organic compounds and nitrogen oxides from local transportation, and sulfur dioxide from regional industrial sources. Currently, there are only a few studies that attempt to quantify the economic impacts of haze. Davis [4] showed that economic activities contributing to human exposure to air pollution had a significant impact on human health. Based on a case study in Beijing, Zhang et al. [5] estimated the potential impacts of haze pollution on the tourism industry.
From these and other studies it is clear that haze causes economic loss. However, the loss is difficult to quantify. The contingent valuation method (CVM), which was first applied by Davis [6] to a forest camp in Maine to value hunting and recreation, is now widely used in environmental health areas for assessing the value of environmental services [7]. The method involves a survey in which a group of people are asked to answer a number of questions. Using the survey data, the respondents’ willingness to pay (WTP) can be calculated to represent the service value. In contrast to direct market methods, CVM can solve practical problems using environmental valuation analysis. Open-ended questions, bidding games, and dichotomous choices are three common preference elicitation formats of CVM. Research has shown that among the three formats, dichotomous choices reflect the respondents’ WTP most accurately [8].
With air pollution and economic growth serving as competing factors, the use of CVM can improve the understanding of the amount of money the city could potentially raise to combat the growing problem of haze [9]. The current paper studies the factors that influence WTP for haze-related services from the point of view of service effectiveness, and provides quantitative assessment for these services. In order to determine the haze-related public’s WTP, we first designed dichotomous choices that ask survey respondents to trade off income for improved air quality [10,11]. Then, we applied the sure independence screening (SIS) algorithm to reduce the dimension of the large dataset and to effectively screen the influence factors. For quantitative analysis of the economic effect of haze and the valuation of haze management and prevention, the CVM is applied. Compared to the average estimate method (AEM), the integration of the SIS algorithm and the CVM is more useful. It lays the foundation for the improvement of haze management and prevention in the future.
2. Evaluation Methods of Haze Management and Prevention
2.1. Binary Logistic Model
In this study, the survey question, “Do you support the haze management program”, is defined as the dependent variable , which is also a qualitative variable. The answer to the question by a survey respondent assigns a value to the variable. When the qualitative variables only have “yes” or “no” (or “to accept” or “not to accept”) as an answer, binary variables are usually considered for multiple linear regression. Therefore, the binary logistic regression model as given in Wang et al. [12] is used.
The individual indirect utility function is assumed as follows:
where is the state variable of haze, such as the number of haze occurrences in a year, the duration of the haze occurrence, whether or not it affects traffic and so on; , in this study, is the monthly income of the respondent’s family; is the respondent’s other socio-economic characteristics; and , as the unobservable part of the utility function, can be regarded as random components, and it is assumed to obey the Weibull distribution with mean 0.
Under the assumption that haze pollution will be effectively reduced after the respondents’ payments, this article defines as the current haze situation and as the situation after the payments. The indirect utility functions under the two conditions are as follows:
The mean of the respondents’ maximum and minimum WTP is used as the bid, i.e., . Based on the theory of benefit-cost analysis, respondents’ choices of behavior satisfy the utility maximization condition, i.e.
Then, the probability of the respondents’ WTP is as follows:
The probability of unwillingness to pay is . Denoting and as the cumulative distribution function of random variable , Equation (5) can be written as
Since and obey the Weibull distribution, obeys the logistic distribution and is a logistic cumulative distribution function. Therefore,
For convenience, the utility functions are assumed to be linear, i.e., , then .
When the haze status changes, the utility also changes. Let
Then , where , . Equation (7) also can be written as
Taking Logit transformation in Equation (9), we obtain
Integrating the above Equation (9) over , with the maximum bid of as the upper bound and the minimum bid of as the lower bound , the mean value of WTP can be computed. The formula is as follows.
2.2. SIS Algorithm
For a better understanding of the public’s WTP for services that reduce haze, a survey based on dichotomous choices was conducted. In order to accurately estimate the public’s WTP for haze management and prevention (a continuous variable), the survey data must have a high number of dimensions [13]. However, this high-dimensional data always contains redundant information and needs to be pre-processed. The SIS algorithm [14,15,16] is a dimension-reduction procedure which is based on the independence condition of the independent variables. The SIS algorithm screens variables according to the principle that the correlation with the dependent variable for irrelevant independent variables is less than that for the relevant variables.
In this algorithm, a series of random variables is generated and the correlation coefficients of these variables with the dependent variable are calculated. Among these correlation coefficients, the maximum is defined as a threshold. Then, these random variables are added to the survey data and the correlation coefficients are calculated again. Finally, variables whose correlation coefficients are larger than the threshold are chosen as the relevant variables. Assuming the original data dimension is , the algorithm can be represented in detail as follows:
- Step 1:
- Randomly generate 10 sets of variables , with , where represents two-point distribution with probability 0.5.
- Step 2:
- Calculate and sort the correlation coefficients of these random variables with the dependent variable, and define the maximum correlation coefficient as a threshold.
- Step 3:
- Add the random variables to the survey data as the independent variables and update the data. Then, calculate the correlation coefficients for all the independent variables.
- Step 4
- Do the screening: select all the correlation coefficients that are larger than , and the corresponding independent variables are put into set as the relevant variables.
Next, the flow chart of the SIS algorithm is given in Figure 1. Notice that after adding the random variables to the survey data, the correlation coefficient of the independent variable with the dependent variable is denoted as . Then, .
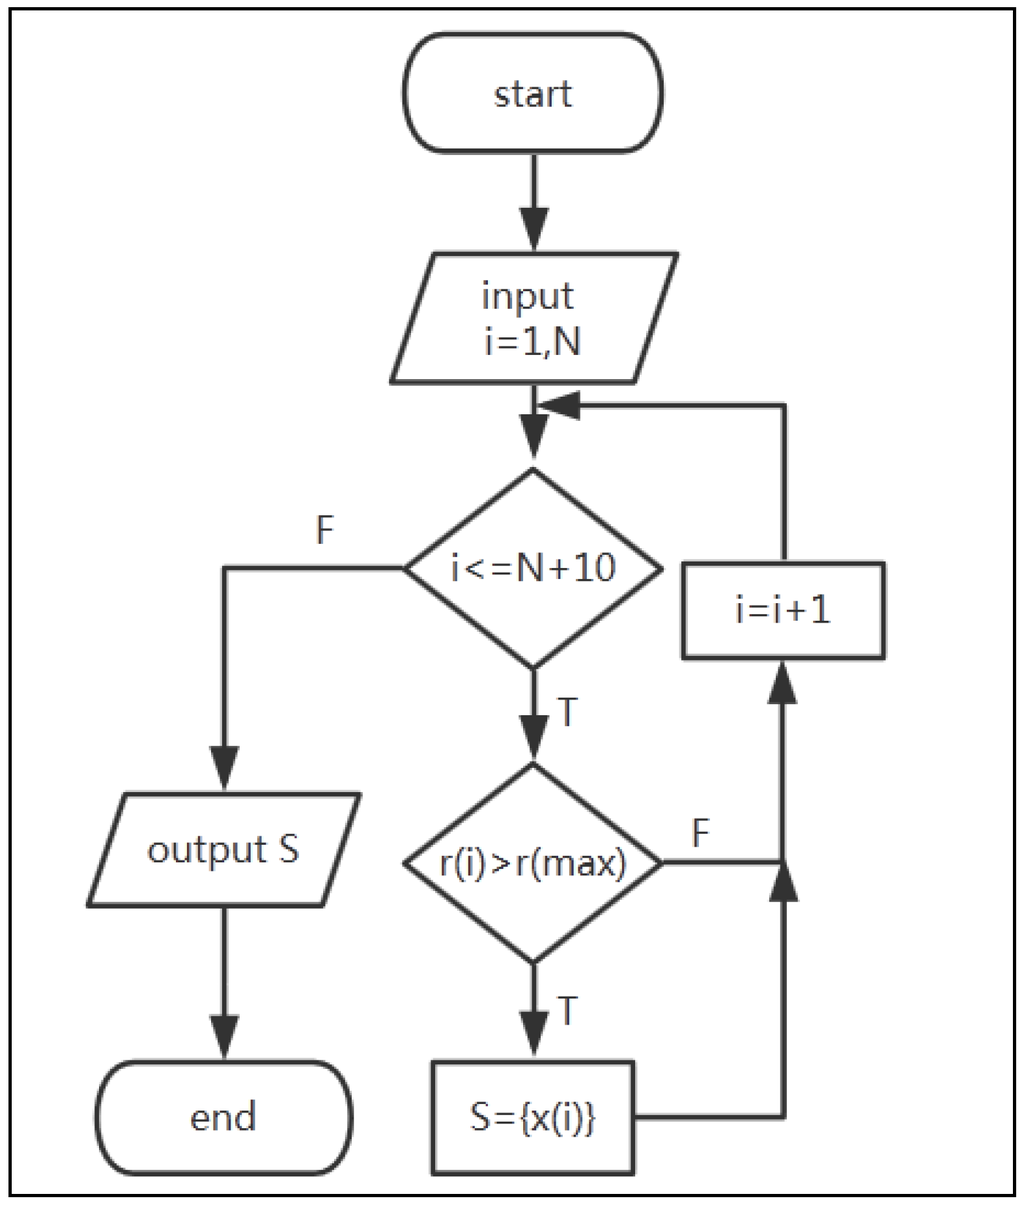
Figure 1.
Flow chart of SIS algorithm. Note: , , .
According to the right-hand side of Equation (10), independent variables not only involve all elements in set , but also . Therefore, variable is added into set . By using the binary logistic model, the final independent variables and corresponding coefficients are determined and the public’s WTP can be calculated.
3. Results
3.1. Data Sources
The questionnaire survey named “Assessment Questionnaire on Economic Loss due to Haze” was designed to comprehensively understand haze’s impact on public life. The first part of the questionnaire asks for basic information, including the participant’s sex, age, education level, career, marital status, and monthly family income. Other questions asked include: “How often do you pay attention to haze?”; “Do you smoke?”; “Do you have any diseases?”; “What region do you live in?”; and “How long have you lived there?”. The second section concerns knowledge of haze, asking questions such as “Do you understand PM2.5?”; “What is the difference between fog and haze?”; “How did you learn about haze?”; “How many times have you experienced haze in the last year?”; “How long did the haze occurrences typically last?”; “What are the causes of haze in your local region?”; “How many measures do citizens take to reduce haze?”; and “How many measures does the government take to reduce haze?”. The third segment is about the influence of haze, asking people “How much of an influence does haze have on your daily life?”; “Has haze had an influence on any diseases you might have?”; “How many measures do you take to protect yourself in haze weather?”; and “Does haze affect your travel plans?” (more specifically, by plane or car or both). The final section contains the contingent valuation survey, asking “Does the public participate in haze management and prevention?”; “Is the government capable of controlling haze?”; “What is the highest degree of support for the haze management and prevention program?”; “How much is your maximum WTP?”; “What is the lowest degree of non-support for the haze management and prevention program?”; “How much is your minimum WTP?”; and “Do you support the haze management and prevention program?”. For mathematical analysis, we define variables in the questionnaire as shown in Table 1. In particular, the total number of the independent variables is N = 27.

Table 1.
Variables in haze management and prevention questionnaire.
A total number of 3000 questionnaires were distributed to residents from different places in China and 2874 effective questionnaires were returned, giving a return rate of 95.93%. The public’s self-assessed understanding of haze is shown in Figure 2:
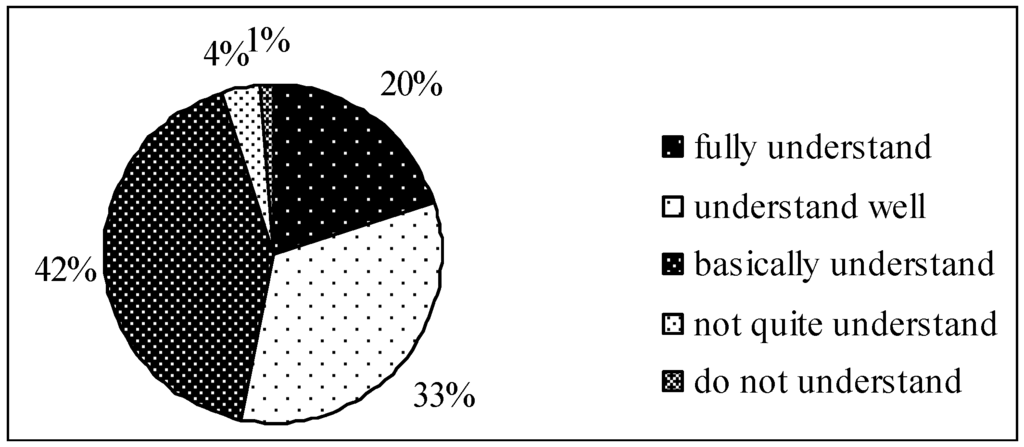
Figure 2.
Levels of public understanding of haze.
Figure 2 shows that 20% of respondents report that they fully understand the question, 33% understand it well, 42% basically understand it, 4% did not quite understand it and 1% did not understand it at all. This implies that most respondents (95%) understand the questionnaire well enough to responsibly fill out the survey. This paper focused on 550 questionnaires from Jiangsu Province.
3.2. Calculation of Non-Market Value of Haze Management and Prevention
The CVM is an effective and popular method [17,18,19,20] for estimating non-market values of environmental impact assessments [21], which computes respondents’ WTP through questionnaire data. However, as indicated in Section 2.1, the original data cannot be analyzed directly, since there are too many influencing factors, which not only make the analysis inefficiency, but also give false correlation among variables. In order to improve the accuracy of the model, a data-processing method, the SIS algorithm, was introduced to reduce the dimension of the data. The steps of the SIS algorithm were listed earlier in Section 2.2. In particular, from Steps 1 and 2, we find that the maximum correlation coefficient between the random variables and the dependent variable is 0.0434, i.e., . For Step 3, the correlation coefficients of variables are calculated via Matlab software and are shown in Table 2.
Table 2.
Coefficients.
For Step 4, variables (in Table 2) whose absolute correlation coefficients are larger than the threshold were selected and included in set :
There are N = 27 independent variables in Table 2. The SIS algorithm eliminates 14 relatively irrelevant variables so that the size of the set in Equation (12) is 13. The definitions of these 13 independent variables are listed in Table 1. This effectively reduces the dimension of the original data and improves the computing speed and model accuracy.
From Table 2, the correlation coefficients of and are positive. More specifically, our findings indicate that compared to women, men are more willing to support the haze management and prevention program; compared to other professions, civil servants and employees of firms and enterprises are more willing to support the program; compared to rural residents, urban residents are more willing to support the program. Meanwhile, the correlation coefficients of and are negative. This shows that respondents whose travel is greatly affected by haze are more willing to pay for the program. In addition, those who have a longer residence period, residing longer in the haze over the course of a year, are more aware of haze, have a higher demand for protection methods, have more trust in the government and are also more willing to pay for haze reduction.
Next, CVM is used to quantitatively analyze the non-market value of haze management and prevention in Jiangsu. From the set given in Equation (12) above, the variables in the individual indirect utility function in Equation (1) in Section 2.1 are grouped as follows:
Considering maximum WTP and minimum WTP , the mean of and , variable , is added into set . In combination with the binary logistic model, the public’s WTP is fitted with the updated data. Under the condition of significance level , independent variables are selected using a p-value test. Finally, , , . Results are shown in Table 3:
Table 3.
Parameter results.
These results indicate that the public’s WTP is mostly related to the monthly income of family and transport modality, which agrees with the actual situation. The coefficient of is negative because denotes “supporting the haze management and prevention program”, i.e., “willing to pay”, and denotes “not supporting the haze management and prevention program”, i.e., “unwilling to pay”. Therefore, the higher the monthly income of the family is, the stronger the public’s WTP. The coefficient of is positive, which indicates that the more haze effects transport modality, the stronger the public’s WTP.
The average value of monthly family income and that of transport modality are, respectively, 2.497 and 1.503. Also, the maximum and minimum bids of are 100 and 0, respectively. After substituting these and the coefficients of the variables in Table 3 into Equation (11), the mean value of WTP, , can be obtained:
This is the public’s WTP per person for the non-market value of haze management and prevention and is calculated as 96.53 yuan. Thus, the total public’s WTP can be computed by multiplying the public’s WTP per person by the population in Jiangsu (79.1998 million). Hence, the people of Jiangsu attach a value of 7.645 billion yuan to clear air in their region, which is an indication of the overall costs a reduction plan may entail.
3.3. Average Estimate Method (AEM)
Neglecting the influence of relevant variables, the average WTP can be expressed in terms of the bid value and its probability using the following formula [22]:
where is the bid value chosen by a respondent and is the probability of bid value . According to dichotomous choices data, the public voluntary payments are counted with each bid value and its probability given in Table 4.
Table 4.
Public voluntary payments.
Here is the average WTP computed by the AEM:
This is the public’s WTP per person for the non-market value of haze management and prevention and it is calculated as 158.20 yuan by AEM. As a result, the non-market value of haze management and prevention in Jiangsu is 12.529 billion yuan. Hence, the people of Jiangsu attach a value of 12.529 billion yuan to clear air in their region, which is an indication of the overall costs a reduction plan may entail.
4. Conclusions and Discussions
With rapid urbanization and economic development, the number of serious air pollution incidents, such as haze, has increased sharply. Indeed, haze has become an important factor, affecting the quality of our environment. Moreover, these incidents directly affect the normal operation of the transportation system, causing huge economic losses. Thus, haze management and prevention seems particularly urgent and important.
Since questionnaire survey data is an important foundation of assessing values in haze-related management services, this paper first confirmed the authenticity of the data. Then, due to the fact that there are lots of influencing factors contributing to the public’s WTP in the original data, the SIS algorithm, one of the big-data processing methods, was introduced to eliminate irrelevant variables, reduce the number of dimensions of the data, and improve the accuracy of the model. Combined with the binary logistic model, the most irrelevant variables were removed. Our findings indicated that haze management WTP is most closely related to family income and transport modality, assuming a significance level of . Moreover, the public’s WTP is higher for those with a higher monthly family income and who experience a greater effect on transport modality.
In order to demonstrate the reasonableness, objectivity, and accuracy of the haze management and prevention evaluation, a comparison analysis between CVM and AEM was carried out. Neglecting the influence of relevant variables, a non-market value of haze management and prevention in Jiangsu of 12.529 billion yuan was obtained by AEM. This is about 1.64 times the value computed by CVM. The discrepancy is due to the fact that the AEM model is too idealistic and it ignores the influence between independent and dependent variables. In fact, the public’s WTP for the haze management and prevention program does not exist alone and it is influenced by factors such as monthly family income and transport modality. Therefore, the CVM combined with the SIS algorithm does a better job of evaluating haze management and prevention, giving a more accurate value of 7.645 billion yuan.
Acknowledgments
This research was supported by the National Social Sciences Foundation of China (NO.15BTJ019), the Special Scientific Research Fund of Public Welfare Profession (GYHY 201506051), the National Natural Science Foundation of China (NO.71373131) and the open project (2014) of Institute of Climate Change and Public Policy, Nanjing University of Information Science and Technology (14QHA020).
Author Contributions
Design of the questionnaire and data analysis was done by Guizhi Wang and Jibo Chen. Data analysis and writing of the article were done by Yingxi Song, with some guidance from Guizhi Wang and Jun Yu. All authors have read and approved the final manuscript.
Conflicts of Interest
The authors declare no conflict of interest.
References
- Zhang, R.H.; Qiang, L.I.; Zhang, R.N. Meteorological conditions for the persistent severe fog and haze event over eastern China in January 2013. Sci. China Earth Sci. 2014, 57, 26–35. [Google Scholar]
- Li, B.; Zhang, J.; Zhao, Y.; Yuan, S.; Zhao, Q.; Shen, G.; Wu, H. Seasonal variation of urban carbonaceous aerosols in a typical city Nanjing in Yangtze River Delta, China. Atmos. Environ. 2015, 106, 223–231. [Google Scholar] [CrossRef]
- Song, G.; Min, H.; Zamora, M.L.; Jianfei, P.; Dongjie, S.; Jing, Z.; Zhuofei, D.; Zhijun, W.; Min, S.; Limin, Z.; et al. Elucidating severe urban haze formation in China. Proc. Natl. Acad. Sci. USA 2014, 111, 17373–17378. [Google Scholar]
- Davis, M.E. Recessions and Health: The Impact of Economic Trends on Air Pollution in California. Am. J. Public Health 2012, 102, 1951–1956. [Google Scholar] [CrossRef] [PubMed]
- Zhang, A.P.; Zhong, L.S.; Yong, X.; Hui, W.; Dang, L.J. Tourists’ Perception of Haze Pollution and the Potential Impacts on Travel: Reshaping the Features of Tourism Seasonality in Beijing, China. Sustainability 2015, 7, 2397–2414. [Google Scholar] [CrossRef]
- Davis, R.K. Recreation planning as an economic problem. Nat. Res. J. 1963, 3, 239–249. [Google Scholar]
- Kairu-Wanyoike, S.W.; Simeon, K.; Claire, H.; Taylor, N.M.; Gitau, G.K.; Henry, K.; Declan, M. Willingness to pay for contagious bovine pleuropneumonia vaccination in narok south district of kenya. Preve. Vet. Med. 2014, 115, 130–142. [Google Scholar] [CrossRef] [PubMed]
- Cai, C.G.; Chen, G.; Qiao, X.C. Application of contingent valuation method to estimate health economic loss caused by environmental pollution. J. Environ. Health 2007, 4, 265–267. [Google Scholar]
- Wang, K.; Wu, J.; Wang, R.; Yang, Y.; Chen, R.; Maddock, J.E.; Lu, Y. Analysis of residents’ willingness to pay to reduce air pollution to improve children’s health in community and hospital settings in Shanghai, China. Sci. Total Environ. 2015, 533, 283–289. [Google Scholar] [CrossRef] [PubMed]
- Huang, C.H.; Wang, C.H. Estimating the total economic value of cultivated flower land in Taiwan. Sustainability 2015, 7, 4764–4782. [Google Scholar] [CrossRef]
- Carson, R.T.; Flores, N.E.; Meade, N.F. Contingent valuation: Controversies and evidence. Environ. Res. Econ. 2001, 19, 173–210. [Google Scholar] [CrossRef]
- Wang, G.; Li, L.; Huang, X.; Xia, P.; Li, J. A Study on the Application of Contingent Valuation Method in Public Weather Service. Meteorol. Mon. 2011, 37, 1309–1313. [Google Scholar]
- Carson, R.T. Contingent valuation: A user’s guide. Environ. Sci. Technol. 2000, 34, 1413–1418. [Google Scholar] [CrossRef]
- Fan, J.; Lv, J. Sure independence screening for ultra-high dimensional feature space (with discussion). J. R. Stat. Soc. Soc. B. 2008, 70, 849–911. [Google Scholar] [CrossRef] [PubMed]
- Fan, J.; Lv, J. A selective overview of variable selection in high dimensional feature space (invited review article). Stat. Sin. 2009, 20, 101–148. [Google Scholar]
- Fan, J.; Song, R. Sure independence screening in generalized linear models with NP-dimensionality. Ann. Stat. 2009, 38, 3567–3604. [Google Scholar] [CrossRef]
- Ferreira, S.; Rui, C.M. Contingent valuation method applied to waste management. Res. Conserv. Recycl. 2015, 99, 111–117. [Google Scholar] [CrossRef]
- Li, C.N.; Lo, C.W.; Su, W.C.; Lai, T.Y. A study on Soil and Groundwater Pollution Remediation of the Surrounding Real Estate Prices and Tax Revenue Impact. Sustainability 2015, 7, 14618–14630. [Google Scholar] [CrossRef]
- Sun, C.; Nan, L.; Ouyang, X. Chinese Public Willingness to Pay to Avoid Having Nuclear Power Plants in the Neighborhood. Sustainability 2014, 6, 7197–7223. [Google Scholar] [CrossRef]
- Ke, H.E.; Zhang, J.B.; Feng, J.H. Non-market value of prevention and control of agricultural waste pollution based on contingent valuation method. Res. Environ. Yangtze Basin 2014, 23, 213–219. [Google Scholar]
- Venkatachalam, L. The contingent valuation method: A review. Environ. Impact Assess. Rev. 2004, 24, 89–124. [Google Scholar] [CrossRef]
- Liu, Y.P.; Gang, L.I.; Chen, X.; Jin, J.X.; Zhou, W.S.; Yang, Y.D. Monetary Valuation of the Non-Use Value of Recreational Resources in Huangguoshan Scenical Resort based on WTP and WTA Methods. Res. Sci. 2008, 30, 431–439. [Google Scholar]


© 2016 by the authors; licensee MDPI, Basel, Switzerland. This article is an open access article distributed under the terms and conditions of the Creative Commons by Attribution (CC-BY) license (http://creativecommons.org/licenses/by/4.0/).