Article

Influence of Printing Orientation on the Mechanical Performance and Environmental Footprint of PLA/TPU Heterogeneous Composites

1
School of Automotive Engineering, Wuhan University of Technology, Wuhan 430070, China
2
Key Laboratory of Catalysis and Energy Materials Chemistry of Ministry of Education, College of Chemistry and Materials Science, South-Central University for Nationalities, Wuhan 430074, China
3
School of Art and Design, Wuhan Institute of Technology, Wuhan 430205, China
*
Author to whom correspondence should be addressed.
These authors contributed equally to this work.
Sustainability 2026, 18(8), 3786; https://doi.org/10.3390/su18083786
Submission received: 1 March 2026 / Revised: 7 April 2026 / Accepted: 8 April 2026 / Published: 10 April 2026
(This article belongs to the Special Issue 3D Printing for Multifunctional Applications and Sustainability)

Abstract

This study examines how 3D-printing orientation affects the mechanical behavior and environmental impact of polymer materials and heterogeneous PLA/TPU composites. Tensile properties of PLA, TPU, and PLA/TPU heterogeneous samples were systematically compared in horizontal and vertical printing orientations. Results show that printing orientation governs mechanical performance: vertical printing generally reduces ductility and exhibits unstable post-peak behavior, with heterogeneous samples performing worse than their single-material counterparts. In contrast, horizontal printing enhances strength, ductility, and energy absorption due to continuous load transfer along the filament path, improved interlayer adhesion, and larger effective contact areas. Specifically, TPU demonstrates higher ductility and energy absorption in the horizontal orientation, while PLA achieves higher strength but lower ductility; both materials degrade substantially in the vertical orientation. For heterogeneous composites, vertical printing yields the poorest outcomes due to load transfer across multiple perpendicular interfaces and thermal shrinkage mismatch, which promote crack initiation and propagation. Horizontal printing delivers an optimal balance of strength and toughness via stronger interface bonding. Life cycle assessment (LCA) indicates that horizontal printing reduces environmental burdens by lowering energy consumption and waste, whereas vertical printing amplifies these impacts, particularly for TPU and composite systems. Based on these findings, we recommend employing horizontally printed PLA/TPU heterogeneous composites to achieve favorable load paths and interface integrity while prioritizing bio-based PLA to enhance sustainability.

1. Introduction

With the rapid development of additive manufacturing technology, material extrusion 3D printing (MEX) is widely used for the fabrication of engineering structures and functional components due to its simple process, low cost, and good adaptability to a variety of thermoplastic materials [1,2]. Commonly used materials include rigid bio-based polymers such as poly lactic acid (PLA) [3,4] and flexible elastomers such as thermoplastic polyurethane (TPU) [5,6], which exhibit markedly different mechanical responses and environmental profiles. In recent years, these materials have not only been used individually but also combined to form heterogeneous structures, enabling performance complementarity and functional integration [7,8]. However, compared with conventional manufacturing processes, 3D printing constructs components in a layer-by-layer manner, leading to pronounced anisotropy and making the final properties highly dependent on process parameters [9].
Among various process variables, printing orientation is one of the most fundamental and critical factors [10,11]. It governs interlayer bonding quality and structural continuity, while also influencing interfacial compatibility and load transfer between different materials during deposition. In single-material systems, printing orientation primarily affects mechanical performance by altering interlayer stress distribution. In contrast, in heterogeneous structures, this effect becomes more complex, as interfacial adhesion, thermal expansion mismatch, and deposition sequence interact with printing orientation, thereby collectively influencing the overall mechanical behavior [12].
Polylactic acid (PLA) and thermoplastic polyurethane (TPU) are widely used in material extrusion-based additive manufacturing due to their good printability and favorable mechanical properties. As a typical rigid bio-based polymer, PLA offers high specific strength and excellent formability; however, its intrinsic brittleness limits structural toughness. To improve both sustainability and performance, prior studies have systematically explored material modification and process optimization. Arockiam et al. [3] and Tümer and Erbil [13] reviewed strategies to enhance the stability and durability of PLA, while Hasan et al. [4] assessed the application potential of recycled PLA in additive manufacturing. In addition, Jayanth et al. [14] demonstrated that heat treatment can significantly improve mechanical performance, whereas Khosravani et al. [15] and Marșavina et al. [16] quantified the effects of deposition angle and printing speed on tensile and fracture behavior, proposing transferable optimization approaches.
In contrast, TPU exhibits superior ductility and energy dissipation capacity, making it particularly suitable for vibration damping and energy-absorbing structures. Bruère et al. [5] revealed the strong sensitivity of TPU’s elastic response to printing parameters, while Rodríguez Parada et al. [7] highlighted the trade-off between material parameters and structural performance in functional design. Furthermore, Desai et al. [6] and Kechagias et al. [17] confirmed the printing stability and formability of TPU across different application scenarios. Despite these advances at the material and macroscopic structural levels, systematic investigations of process-induced microstructural anisotropy—particularly the roles of printing orientation and interlayer stacking strategies—remain limited, and are rarely evaluated from a sustainability perspective.
Existing studies have shown that printing orientation, as a key process parameter, markedly influences tensile strength, fracture modes, and deformation behavior. In general, horizontally printed specimens exhibit superior mechanical performance due to load transfer along continuous material paths, whereas vertically printed counterparts are more prone to interlayer delamination and interfacial failure, resulting in reduced strength and ductility. However, such investigations are largely confined to single-material systems, with limited attention given to more complex multi-material or heterogeneous structures. In recent years, multi-material additive manufacturing combining rigid PLA and flexible TPU has attracted increasing interest, as spatial material distribution enables complementary properties and the realization of structures with both strength and toughness. Nevertheless, in material extrusion processes, multi-material printing inevitably introduces interfacial challenges, including insufficient bonding, mismatches in thermal expansion and shrinkage, and process instability during material switching. These factors exhibit pronounced dependence on printing orientation, leading to more intricate interactions among orientation, interfacial behavior, and mechanical performance, which remain insufficiently understood and lack systematic investigation.
Meanwhile, with the deepening emphasis on sustainable manufacturing, evaluating additively manufactured structures solely in terms of mechanical performance is no longer sufficient to meet both engineering requirements and environmental constraints. Life cycle assessment (LCA), as a core methodology for quantifying environmental burdens, has been increasingly adopted in the field of 3D printing to systematically assess energy consumption, resource use, and ecological impacts across multiple indicators. In existing studies, LCA has been employed to characterize the environmental impacts of additive manufacturing throughout the entire life cycle, from raw material acquisition and processing to component fabrication [18]. Review-based analyses indicate that environmental burdens vary significantly across life cycle stages, with material composition and process pathways playing decisive roles in determining carbon emissions [19]. Process-level investigations further demonstrate that toolpath planning, equipment energy consumption, and process parameter settings substantially influence overall environmental performance [20]. Building on this, studies integrating parametric LCA with data-driven approaches show that multi-objective optimization enables a coordinated balance between mechanical performance and carbon footprint, providing quantitative guidance for process design [21]. In parallel, research on localized material utilization and circular manufacturing highlights the critical role of material sourcing and supply chain configurations in reducing environmental impacts [22]. However, current LCA studies remain largely focused on specific material systems, with comparatively limited attention to polymer-based material extrusion processes. Most existing studies are conducted at the macroscopic level of material selection or overall process design, with limited attention being paid to the systematic coupling between specific process parameters, particularly printing orientation, and structural performance. This gap is particularly pronounced in multi-material or heterogeneous structures, where the interplay and trade-offs between mechanical behavior and environmental impact remain insufficiently understood.
More importantly, existing studies on 3D printing tend to treat mechanical performance and environmental impact separately: one stream focuses on structural optimization, while the other emphasizes environmental assessment, with limited systematic analysis of their intrinsic linkage. In practice, process parameters govern not only structural integrity and mechanical performance, but also directly affect carbon footprint and multiple environmental indicators by influencing printing time, energy consumption, and material utilization efficiency. In multi-material printing, these process effects are further amplified, as material switching, increased path complexity, and potential waste generation contribute to higher energy demand and environmental burdens. Therefore, an integrated perspective that links process, performance, and environment is required to systematically elucidate the role of key process variables in both performance formation and environmental impact, thereby enabling coordinated optimization toward achieving good performance and sustainability in additive manufacturing.
Based on this background, this study focuses on PLA, TPU, and their heterogeneous composites, with particular emphasis on the role of printing orientation (horizontal and vertical) as a key process parameter. The effects of printing orientation on both mechanical performance and environmental impact are systematically investigated. Specimens of different material systems are first fabricated using material extrusion-based 3D printing, and PLA/TPU heterogeneous structures are constructed through an alternating deposition strategy. Tensile tests are then conducted to characterize strength and ductility under different printing orientations. On this basis, the CML-IA method is employed to perform life cycle assessment and quantify variations across multiple environmental indicators. Finally, from a process-oriented perspective, the synergistic effects and trade-offs associated with printing orientation in terms of mechanical performance and environmental burden are comprehensively evaluated, providing insights into optimization strategies for multi-material additive manufacturing.

2. Equipment Introduction and Parameter Settings

2.1. Equipment Introduction

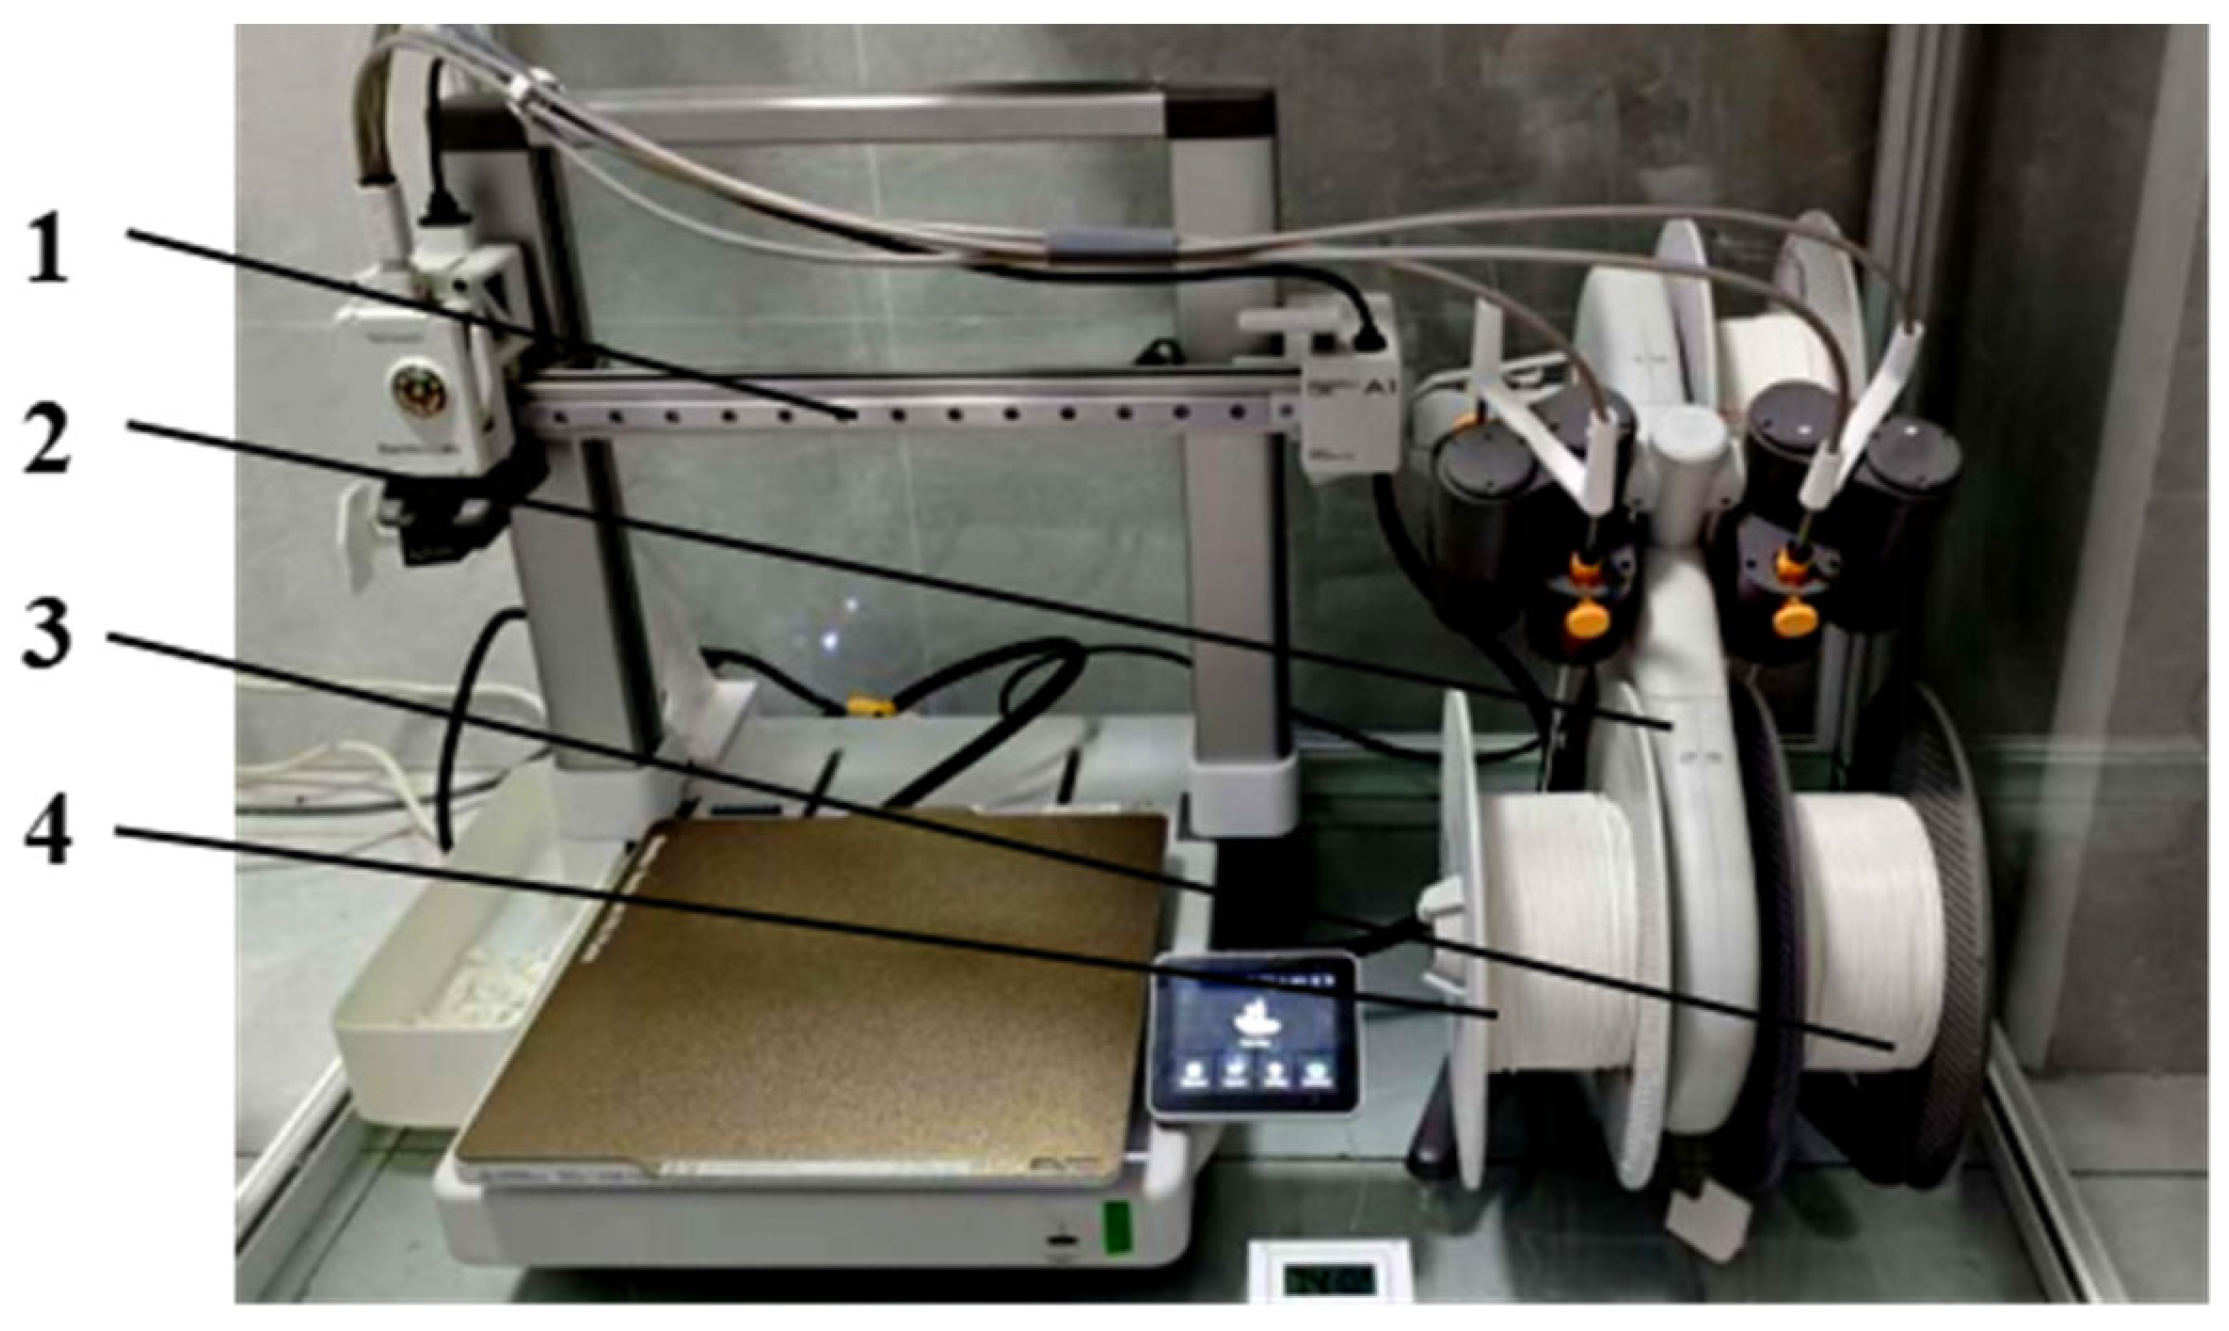
This experiment utilizes the Bambu Lab A1 series 3D printer (Bambu Lab A1 Series, Bambu Lab Co., Ltd., Shanghai, China), equipped with the latest generation AMS (Automatic Material System) for automatic multi-material switching and efficient material feeding. To ensure the comparability of experimental data and the stability of results, all filaments used were Bambu Lab’s original PLA and TPU. The technical data sheets for the two materials are shown in Table 1 [23,24]. The filaments were stored in standard spools, allowing for accurate identification and smooth feeding by the AMS system, as shown in Figure 1.
To further enhance printing stability and filament performance, the entire device was sealed within a dedicated glass enclosure, creating a controlled, constant-temperature environment. Equipped with a high-precision thermometer, the enclosure monitors the ambient temperature in real-time and dynamically adjusts the internal temperature via an automatic heating system, preventing printing inaccuracies caused by environmental fluctuations. Simultaneously, the constant-temperature environment helped prevent the filament from absorbing moisture, ensuring the material remained dry during printing, thereby optimizing the print quality and reducing material defects due to humidity.

2.2. Parameter Settings

2.2.1. Sample Parameter Description

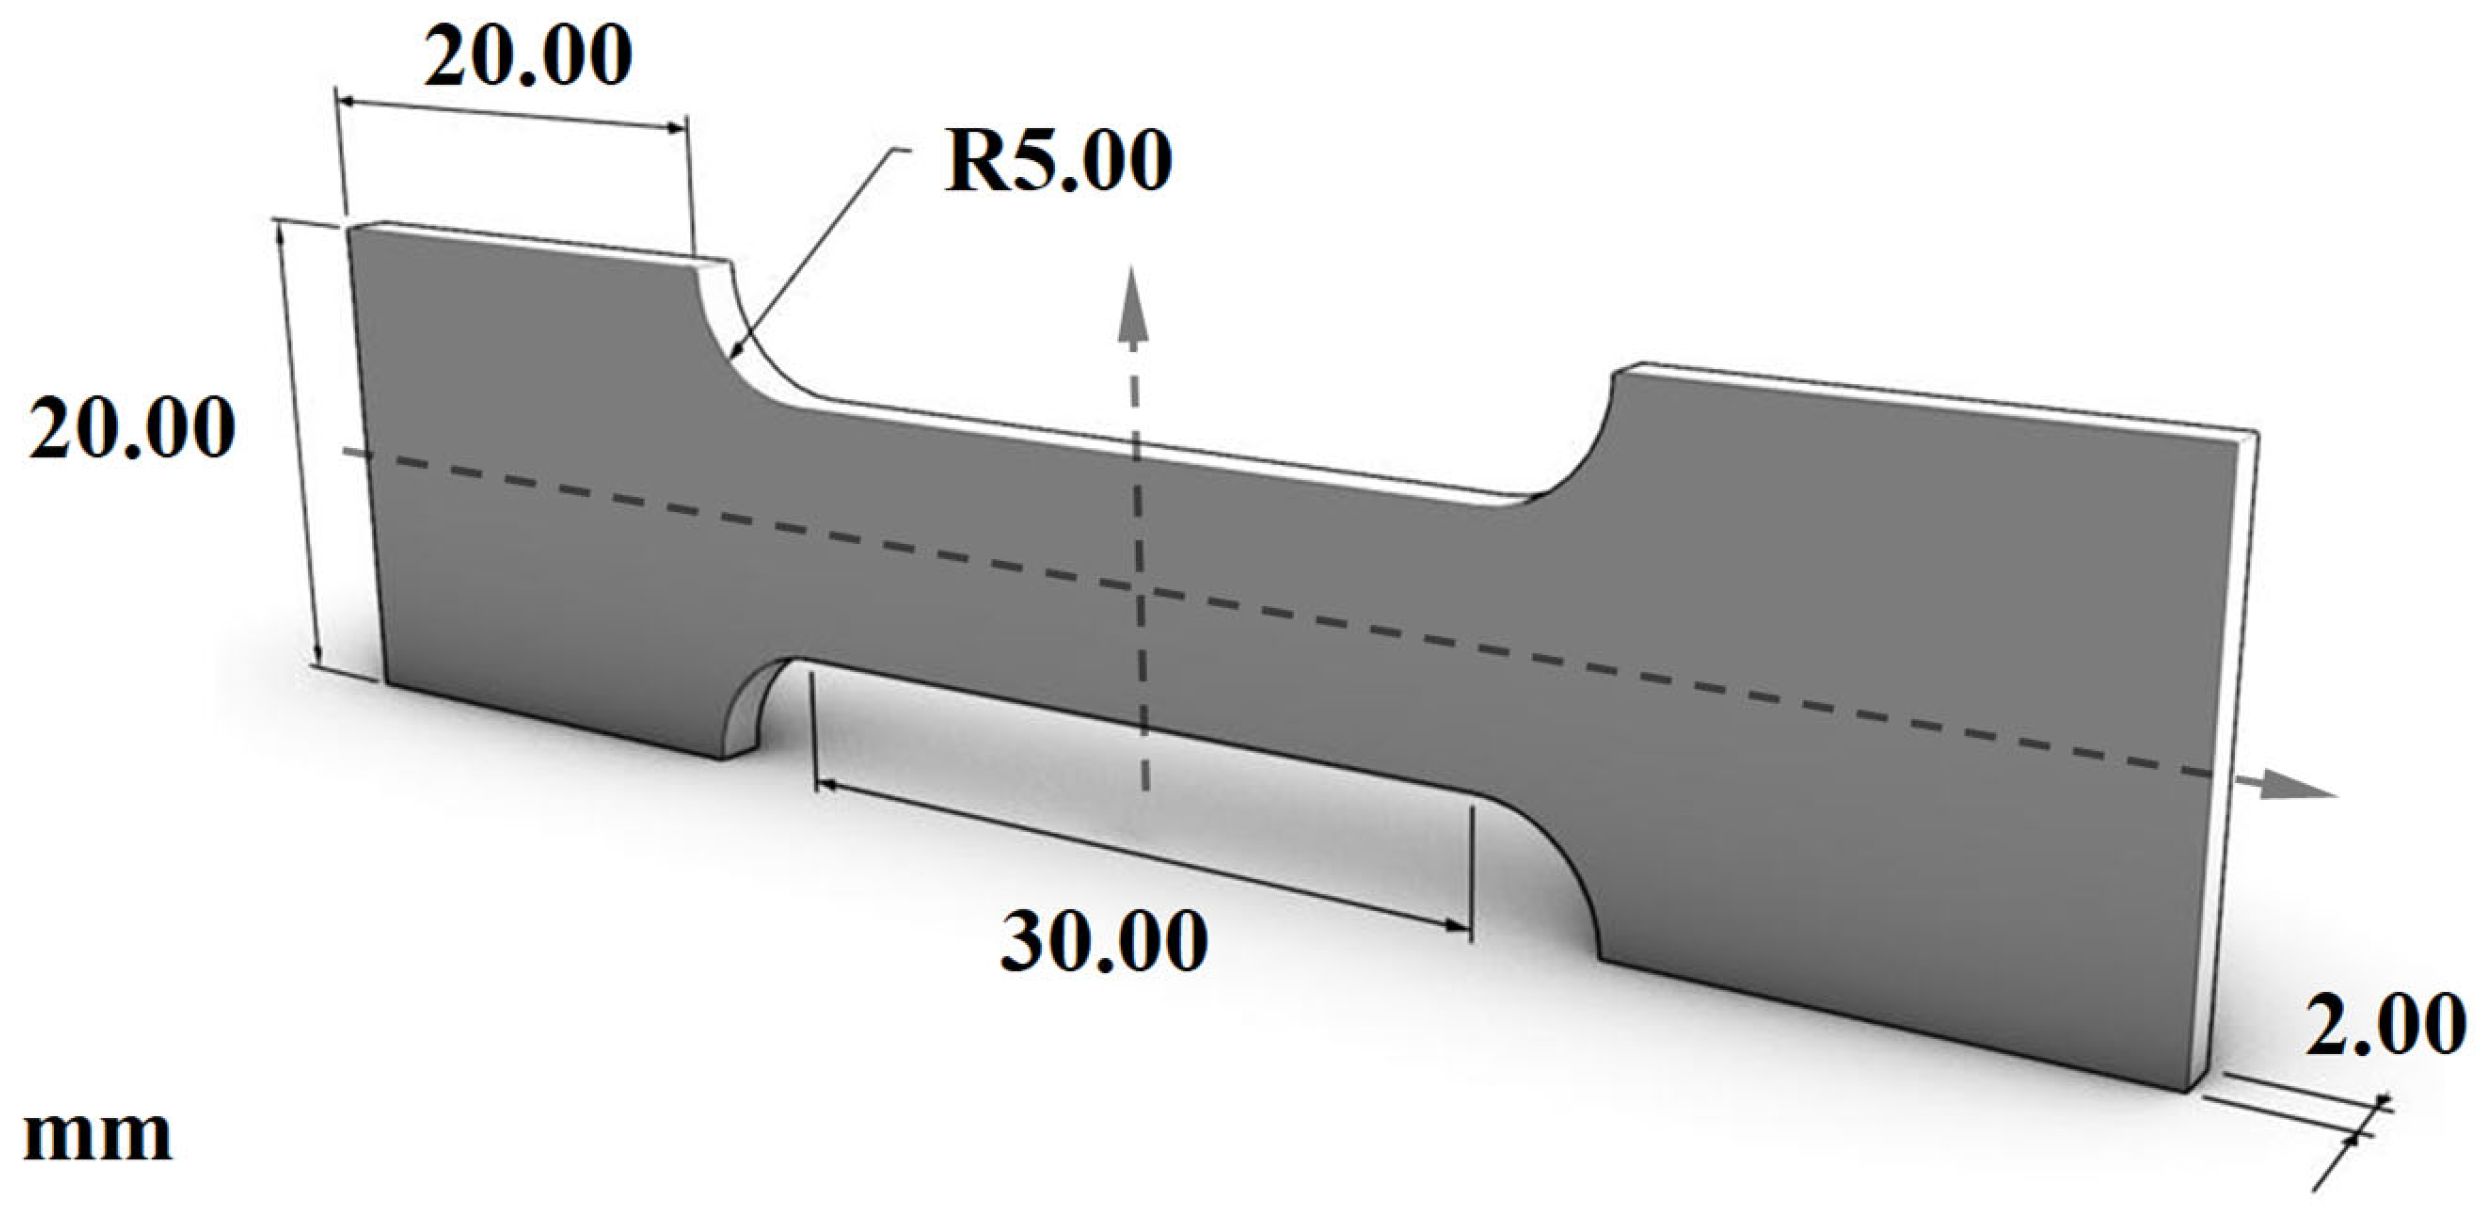
According to Figure 2, the designed and printed specimen is a rectangular thin plate with a special recessed-groove structure. The specimen has an overall length of 80.00 mm, a width of 20.00 mm, and a thickness (depth) of 2.00 mm. The two ends of the specimen are rectangular sections, with the middle portion connected by inward-rounded corners; the corner radius is R5.00 mm. The length of the central rectangular segment is 30.00 mm, and it connects to the end sections via semicircular recesses on both sides, forming an overall “dumbbell”-shaped structure. This structural design is conducive to subsequent material property testing or process comparison experiments.

2.2.2. Software Parameter Configuration

This study employed Bambu Studio, a slicing software highly compatible with the printing system used, for model processing and parameter configuration. The slicing software version was Bambu Studio V2.2.0.86. Bambu Studio leverages the hardware capabilities of the printer and the AMS (Automatic Material System), offering robust support for multi-material management, fine-grained parameter tuning, and efficient slicing visualization. These features collectively ensure a reliable, high-quality fabrication of the specimens.
The detailed baseline parameter settings are summarized in Table 2. For the foundational settings, both the first-layer height and subsequent layer height were set to 0.20 mm to promote reliable first-layer adhesion and overall dimensional accuracy. The nozzle extrusion line width was set to 0.42 mm to enhance the mechanical strength of the printed parts. Regarding print speed, the first layer was printed at 100 mm/s to ensure robust adhesion to the build surface, while the speed for subsequent layers was increased to 200 mm/s to balance throughput and print quality. In addition, a brim width of 15 mm was applied to improve build platform stability and mitigate the risk of first-layer edge lifting.
During the actual printing process, the print speed varied significantly across different structural regions, with the printer automatically adjusting speeds based on structural characteristics to ensure print quality. The first layer speed was set to 50 mm/s with a first layer infill speed of 105 mm/s, ensuring sufficient contact between the molten material and the build platform to achieve adequate bed adhesion. The bridging speed was reduced to 50 mm/s, while the overhang regions were further automatically decelerated according to the overhang ratio, dropping to 10 mm/s at a 100% overhang ratio, effectively suppressing the sagging deformation of TPU material caused by self-weight during unsupported spanning. All of the aforementioned zone-specific speed settings are software default parameters optimized by the Bambu A1C for flexible materials, and no additional modifications were made in this study. Although the outer wall speed of 200 mm/s was relatively high for TPU materials, all specimens underwent rigorous visual inspection and dimensional measurement upon the completion of printing, with no observable layer separation, under-extrusion, or geometric deviation detected, confirming the feasibility of this speed configuration for the equipment (Bambu A1C) and material combination used in this study. The detailed printing speed parameters are presented in Table 3.
As shown Table 4, in the material-specific printing parameter configuration, PLA, and TPU were individually optimized. For PLA, the nozzle temperature was set within the range of 190–240 °C, while TPU was configured at a range of 220–240 °C. During steady-state printing, a common setpoint of 220 °C was used for both materials. The material densities—1.32 g/cm3 for PLA and 1.26 g/cm3 for TPU—were applied primarily for theoretical mass calculations. The build platform temperature was set to 65 °C for both materials to enhance bed adhesion and mitigate warping. To prevent cross-contamination and reduce the risk of nozzle clogging during multi-material transitions, a purge length of 10 mm was employed for both materials. Softening temperatures were specified as 45 °C for PLA and 30 °C for TPU, providing the slicer with guidance for cooling rates and interlayer bonding strategies. Collectively, these settings ensured stable multi-material printing and consistent part quality.
As shown in Table 5, from the perspective of padding-related parameters, a default width of 0.42 mm was applied to the outer wall, top surface, internal solid infill, and support structures, while the first layer was set to a slightly wider 0.5 mm to improve bed adhesion. The inner wall and sparse infill line widths were set to 0.45 mm. For seam control, the seam position was set to aligned, with smart scarf seam enabled at an angle threshold of 155° across 10 scarf steps, applied to both outer and inner walls.

2.2.3. Experimental Sample Group Setup

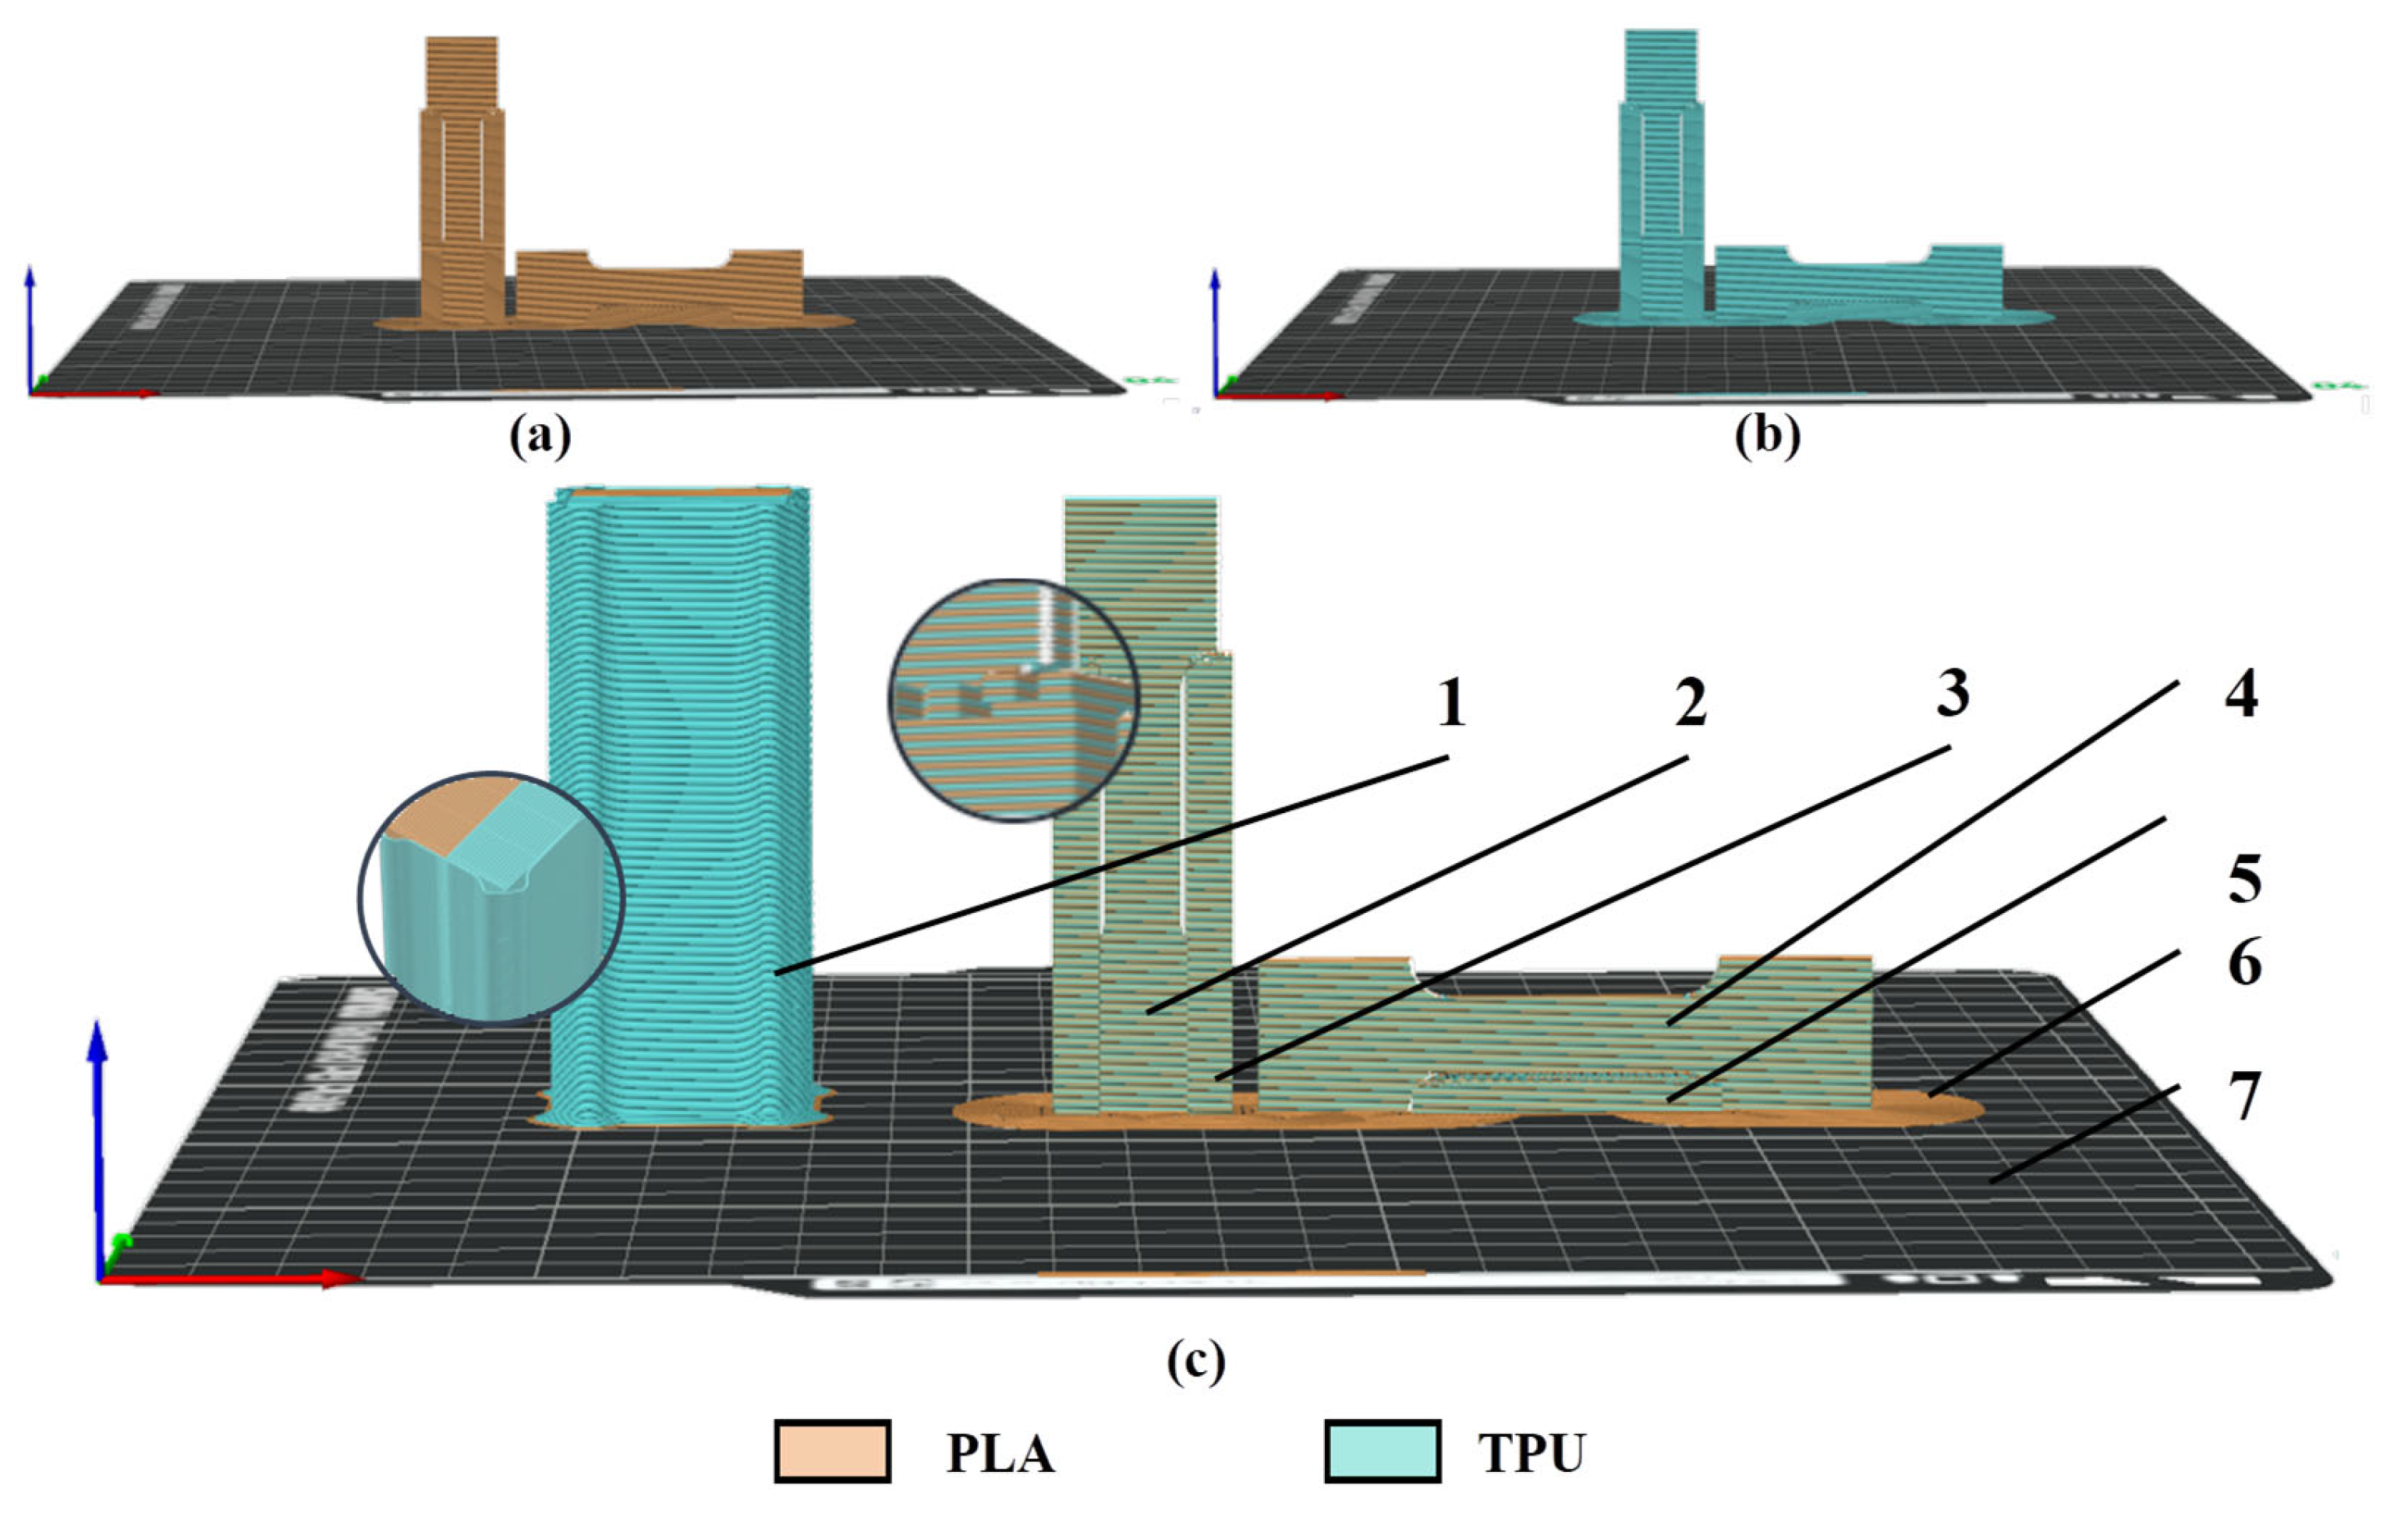
As shown in Figure 3, the slices of 3D-printed parts made from different materials are displayed, reflecting differences in process details and material forming. (a) is the slice for PLA material, indicated in orange; (b) is the slice for TPU material, indicated in light blue; and (c) is the slice for PLA and TPU mixed layered printing, with load-bearing and critical structural parts also printed in layers. Figure 4 also shows the use of auxiliary structures, such as a wipe tower and brim, which help with cleaning during material changes and with stable adhesion during printing. Differences in support and material arrangement for mixed printing demonstrate considerations for the reasonable use of materials with different properties and for structural optimization in multi-material processes.

2.3. Print Process Settings

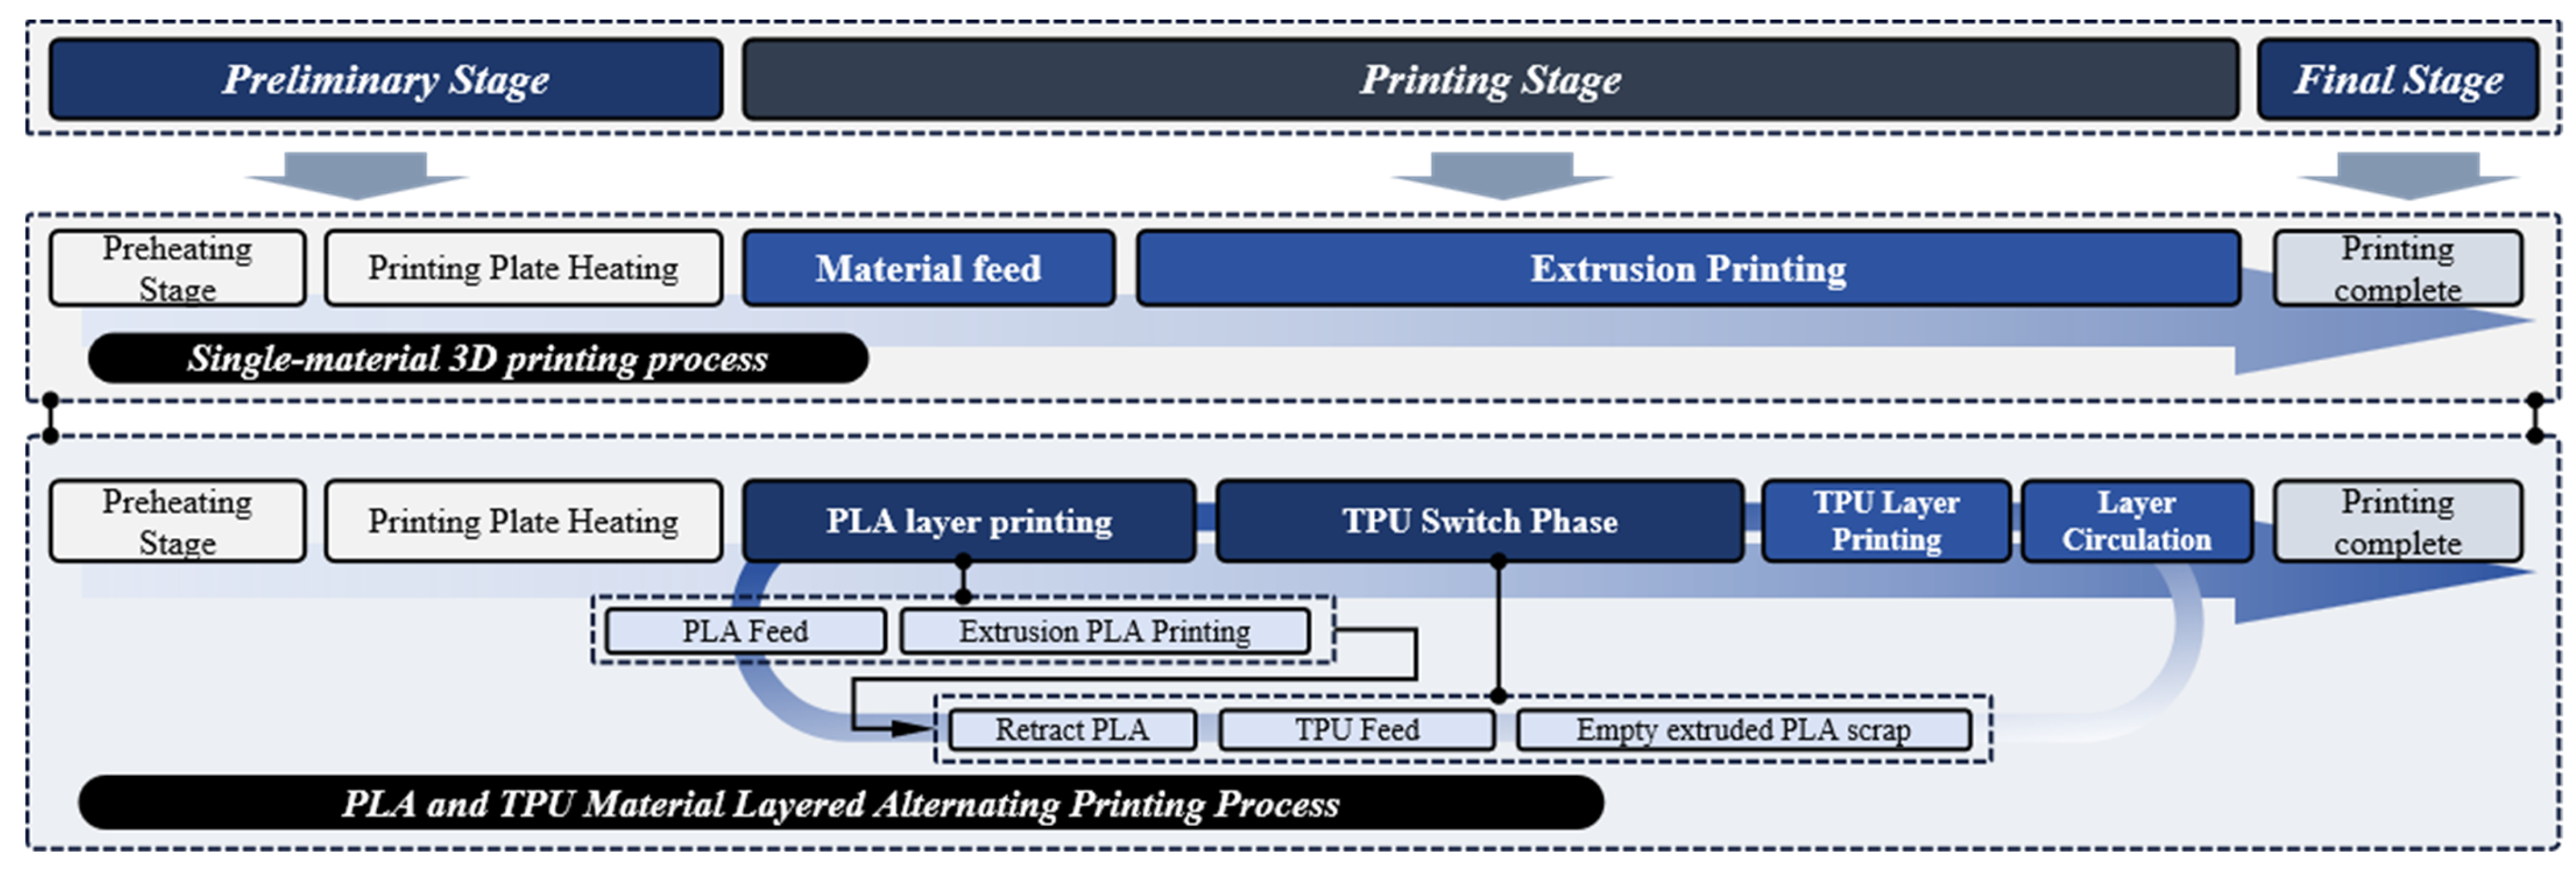
As illustrated in Figure 4, the conventional single-material printing process for PLA or TPU begins by preheating the nozzle to the material-specific processing temperature and heating the build platform to enhance first-layer adhesion and mitigate warpage. The corresponding filament is then fed into the extrusion system, melted in the heating zone, and extruded through the nozzle. Following the predefined toolpath, the material is deposited layer by layer to build the intended three-dimensional geometry. After printing is completed, the machine stops, and the part is removed from the build platform after sufficient cooling and stabilization. If needed, minor deburring or surface cleaning is performed to finalize the printed component.
For the PLA/TPU alternating layer-by-layer printing process, the workflow likewise starts with preheating the nozzle and the build platform, but the temperature settings and processing window must accommodate the forming requirements of both materials to ensure interlayer bonding and print stability. Printing typically begins with PLA extrusion and deposition to complete the designated PLA layers. The system then retracts the PLA filament and switches the feed to TPU. To prevent residual PLA in the nozzle from impairing TPU extrusion continuity and interfacial quality, purging and cleaning steps are conducted before TPU deposition to enable a cleaner and more stable material transition. TPU layers are subsequently extruded and printed. This cycle of PLA deposition, retraction with purging and cleaning, and TPU deposition is repeated according to the prescribed layering strategy until the entire model is completed. Compared with single-material printing, the critical control points of this method include transition stability during material switching, purge-related material losses, increased printing time, and their consequent effects on interfacial integrity and overall build consistency.
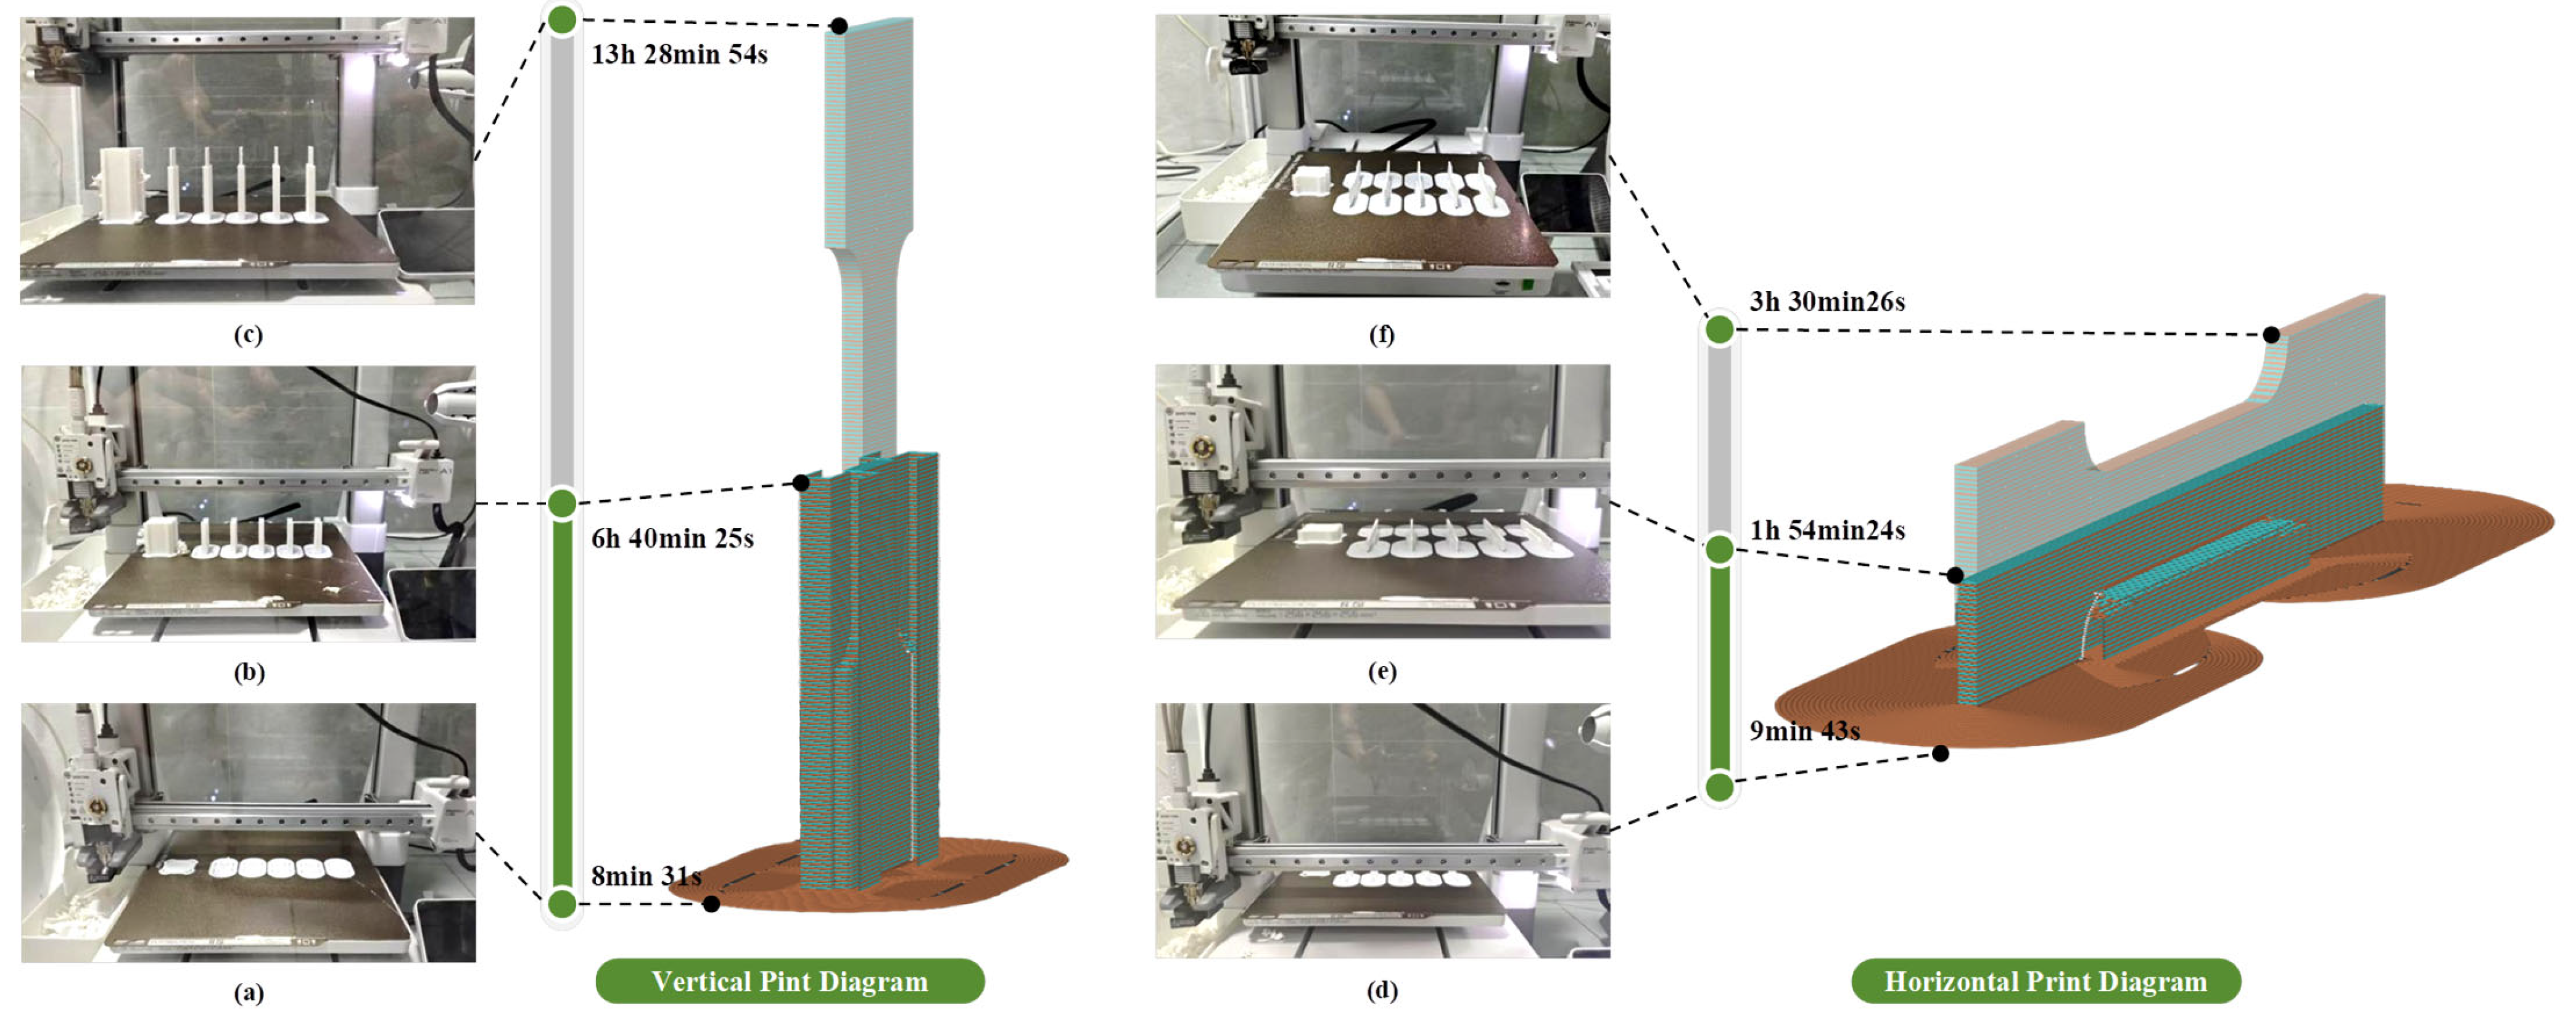
As shown in Table 6, during the vertical printing of mixed PLA and TPU materials, multi-material switching introduces significant material consumption and time costs. According to the slicing data, the number of switching cycles throughout the vertical printing process reached up to 399. Regarding the mass of purged waste, the flushing waste generated during material switching was 163.56 g, and the wipe tower consumption was 36.57 g; reparation phase and material switching processes reached 13 h and 29 min.
As shown in Table 7, during the horizontal printing of mixed PLA and TPU materials, the continuity of material partitioning is superior, leading to a substantial reduction in the frequency of multi-material switching. Slicing results indicate that the number of switching cycles for horizontal printing decreased to 98. Correspondingly, the mass of purged waste decreased significantly, with flushing waste at 40.16 g and wipe tower consumption at 9.48 g, yielding a total switching waste mass of 49.64 g. Regarding time overhead, owing to the significant reduction in material changes, the total printing time was reduced to 3 h and 30 min. This quantitative comparison demonstrates that reducing the number of switching cycles can effectively minimize both waste mass and time costs in multi-material printing.
Figure 5 showcases the forming results of both vertical and horizontal printing methods at different stages during the 3D-printing process. In vertical printing (a–c), the first layer reveals a regular rounded rectangular or columnar base, firmly attached to the platform. Subsequently, the printing height gradually increases, the layer texture progressively appears, and finally, a tall columnar structure with a smooth surface and clear edges is formed, demonstrating good vertical consistency. In contrast, horizontal printing (d–f) is characterized by the simultaneous formation of multiple samples side by side. The first-layer bottom includes separated circular or blocky structures, some with supports. The models simultaneously build upwards as the printing progresses, and the model morphology gradually becomes complex. Upon completion, the overall arrangement is neat, and the details and outlines of each printed part are clear.
Furthermore, it is important to acknowledge that while these forming processes demonstrate ideal layering for relatively small or light objects, the model’s weight becomes a critical determining parameter for larger, larger parts. In such cases, the cumulative weight of the upper layers can exert significant pressure on the lower, still-cooling layers, potentially causing the deformation or even collapse of the entire structure. Therefore, for massive objects, the choice of print orientation often prioritizes reducing this load to maintain structural integrity, rather than solely optimizing for mechanical strength or surface finish. This aspect, although less pronounced in our current dog bone samples, is a vital consideration for complex and heavy components in practical additive manufacturing.

3. Results and Discussions

3.1. Printing Effect

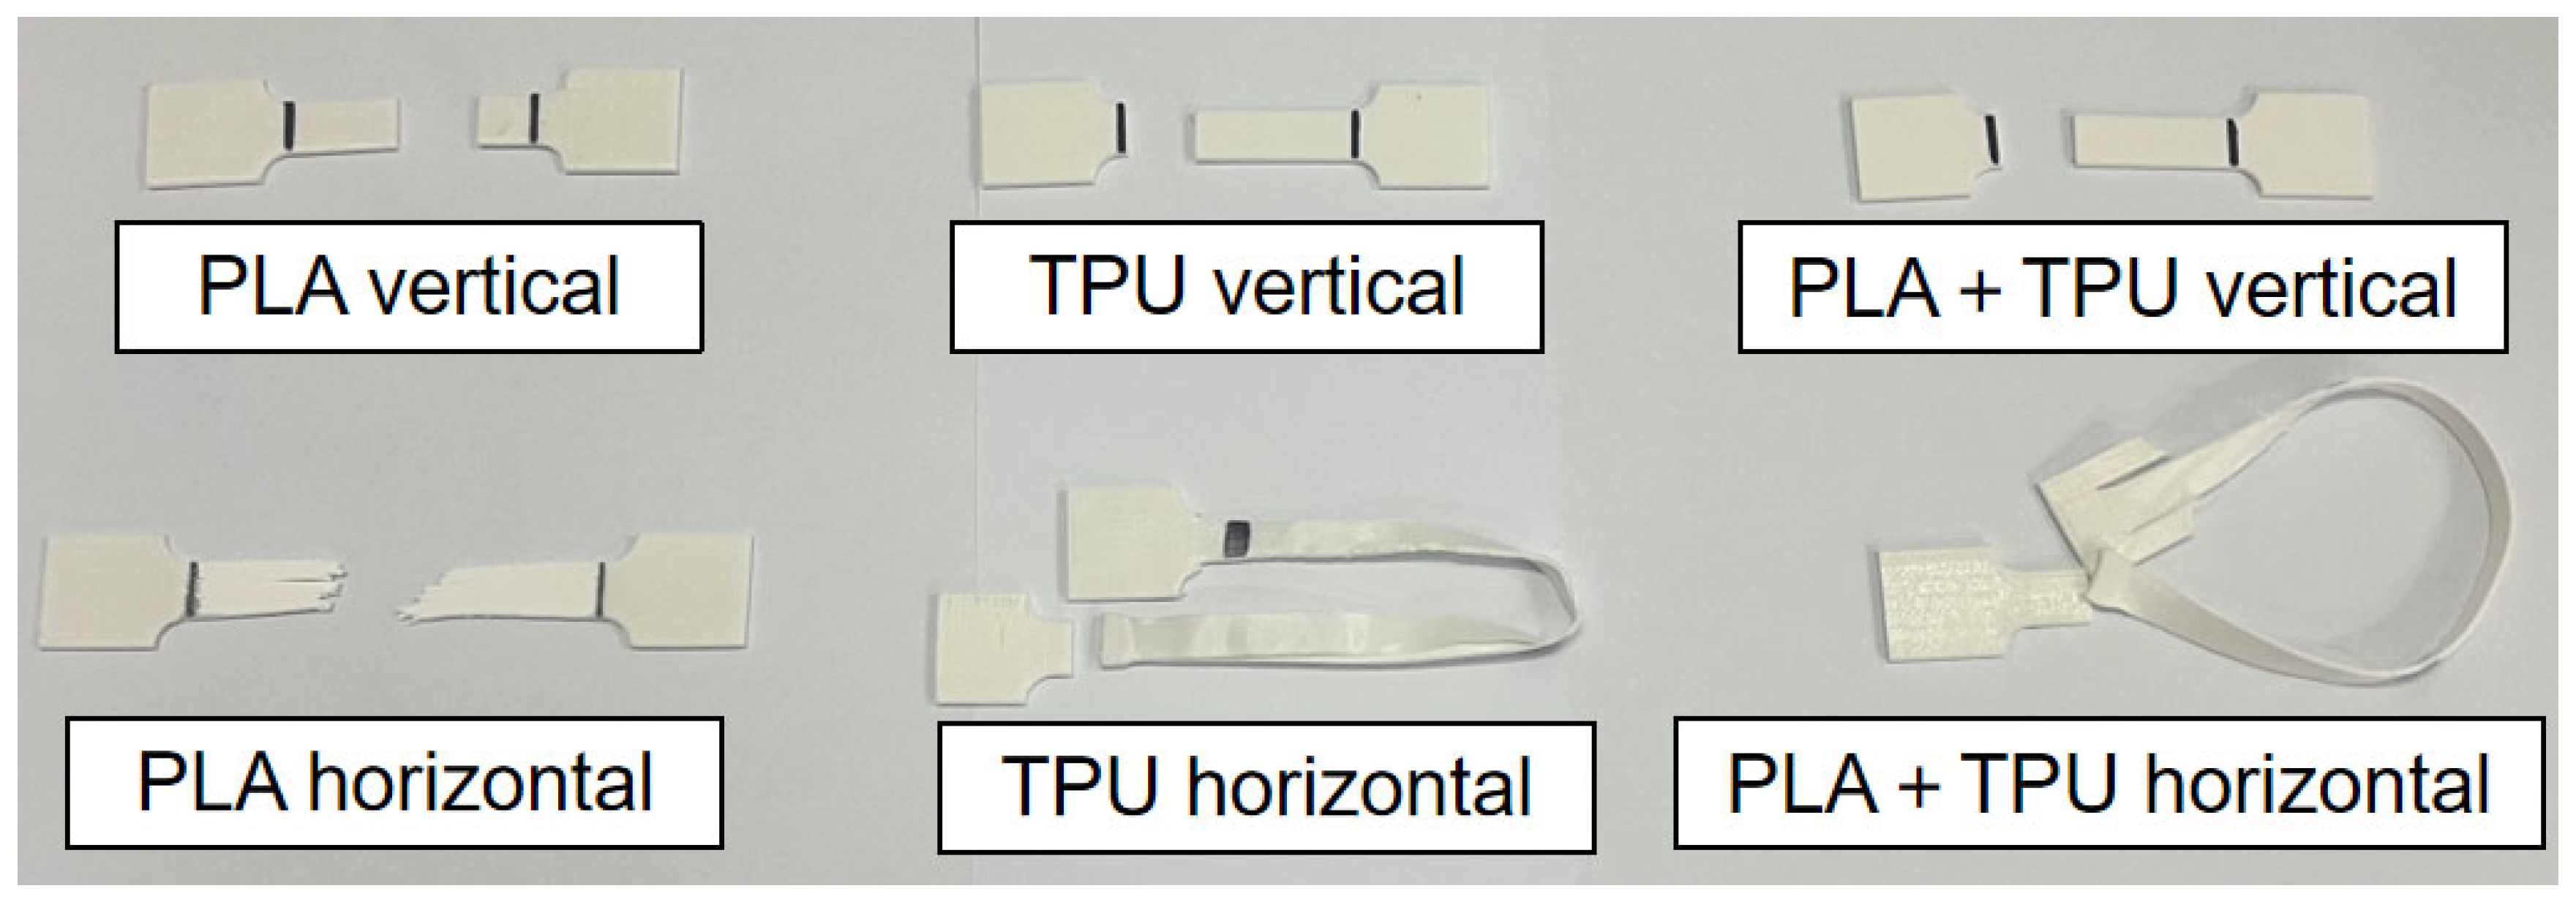
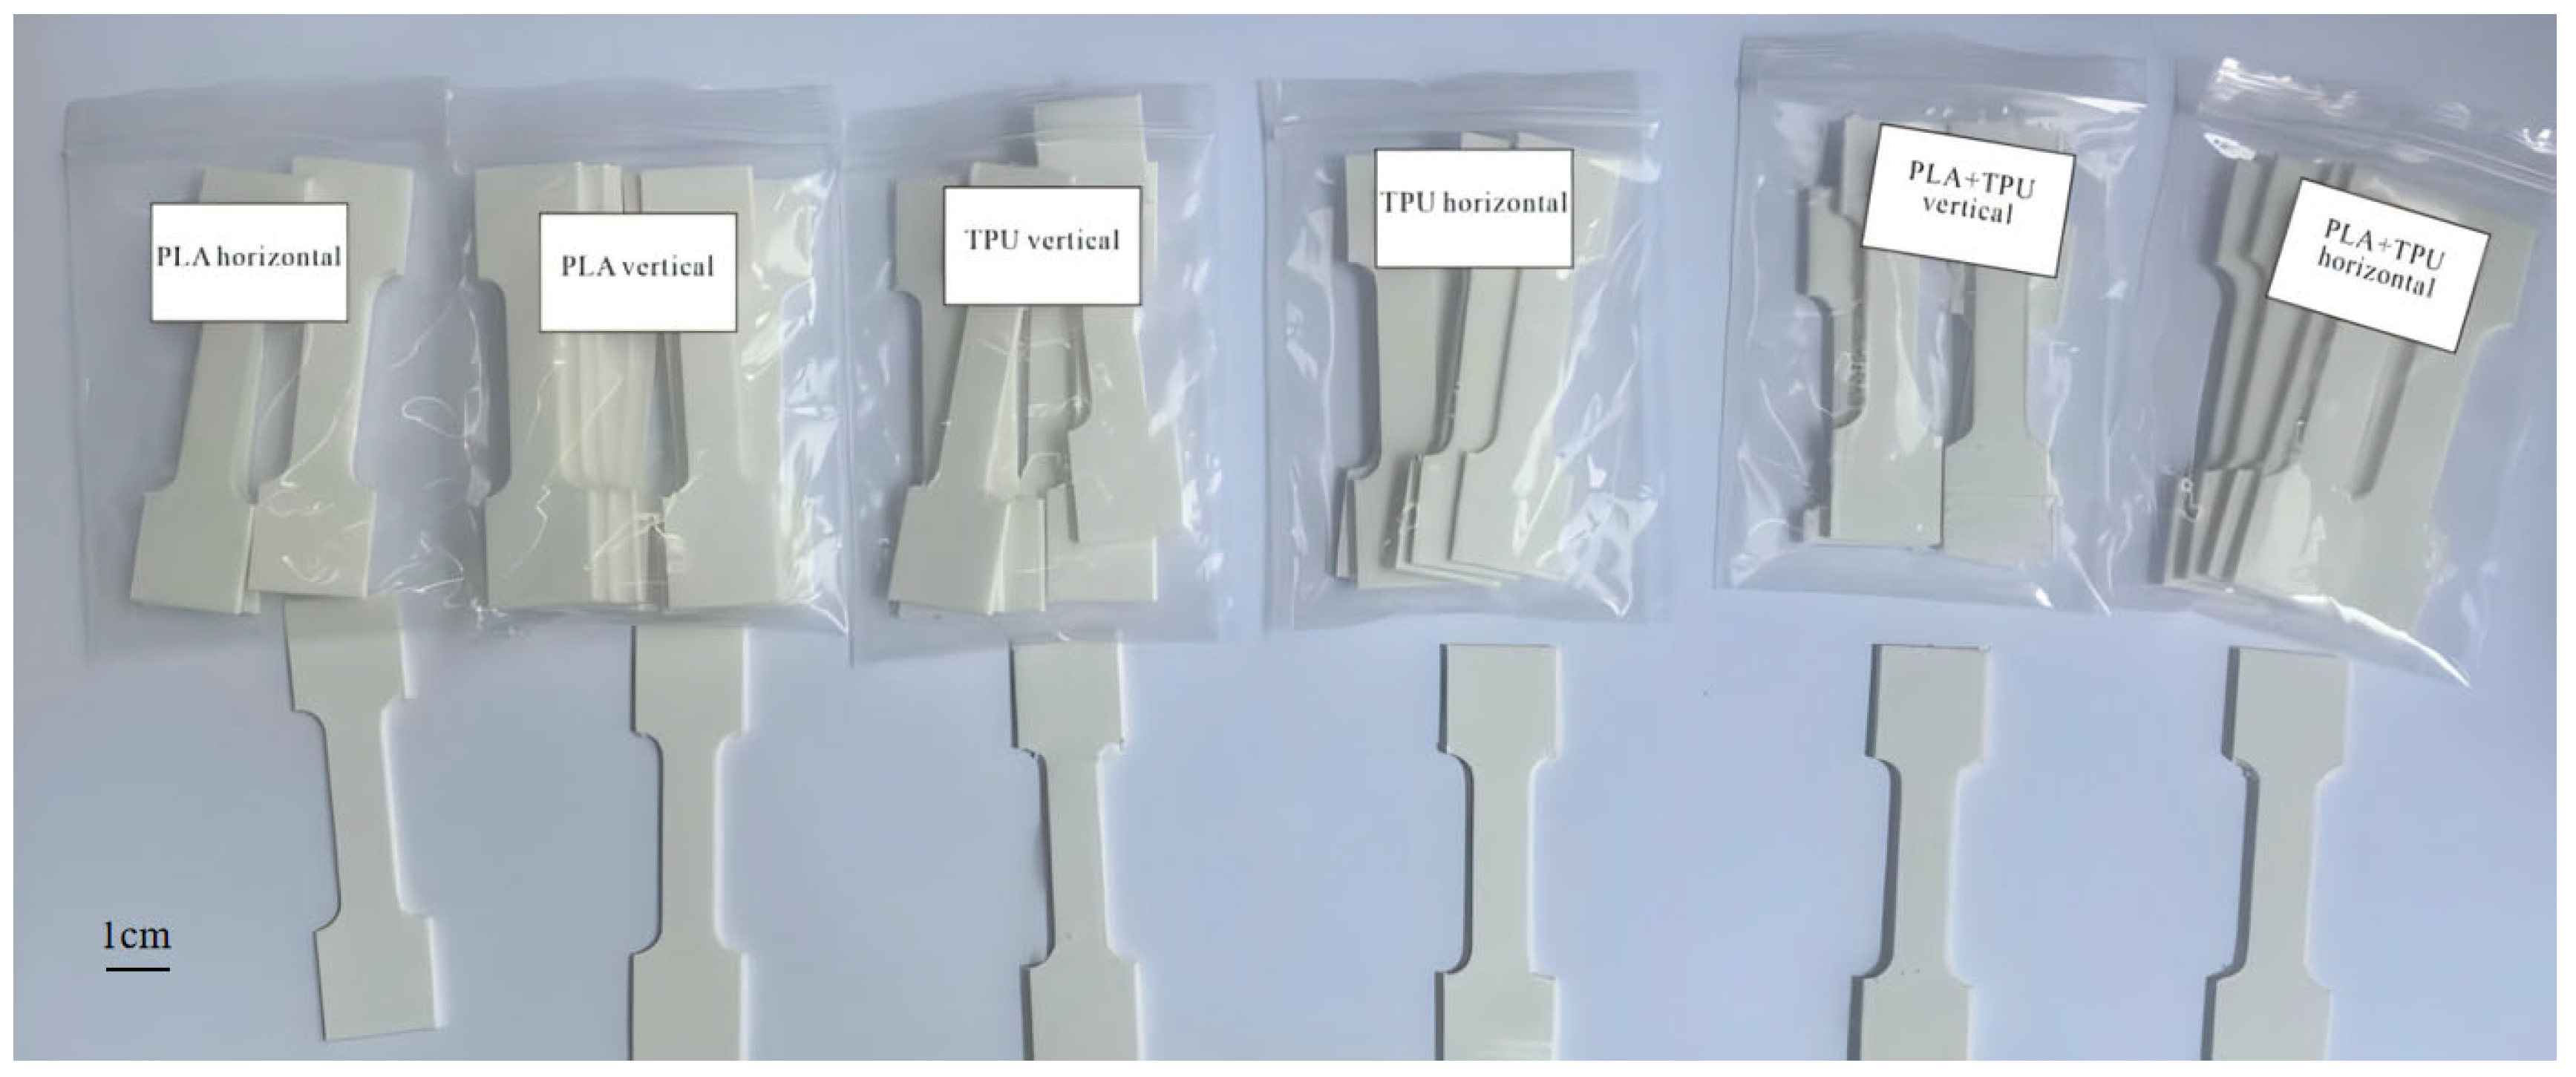
To systematically evaluate how material type and printing parameters affect the build quality and consistency of tensile test specimens, multiple sets of standardized dog-bone samples were fabricated via 3D printing. The materials included neat PLA, neat TPU, and a PLA/TPU heterogeneous composite system. For each material system, specimens were printed in two orientations: horizontal and vertical. Figure 6 presents photographs of the as-printed specimens across all groups.
As shown, all specimens display clean edges, well-defined contours, uniform dimensions, and smooth surfaces, with no visible bubbles, warpage, or delamination. These observations indicate effective parameter selection and process control, ensuring morphological consistency and reliability. Across materials and build strategies, the external appearance of the PLA, TPU, and PLA/TPU heterogeneous specimens satisfies the requirements for subsequent mechanical testing, demonstrating good preparation reproducibility. No discernible structural differences are observed between horizontally and vertically printed specimens at the macroscopic level, suggesting a stable fabrication process; the build orientation is expected to primarily influence the internal microstructure and interlayer bonding. For the PLA/TPU heterogeneous specimens, the interfaces appear intact in both orientations, with no observable delamination, misalignment, or interfacial discontinuities, evidencing appropriate multi-material printing control and a robust basis for interfacial integrity. In addition, grouped bagging during storage and handling effectively prevented moisture uptake and deformation, further supporting the accuracy and reproducibility of the tensile tests.

3.2. Tensile Properties

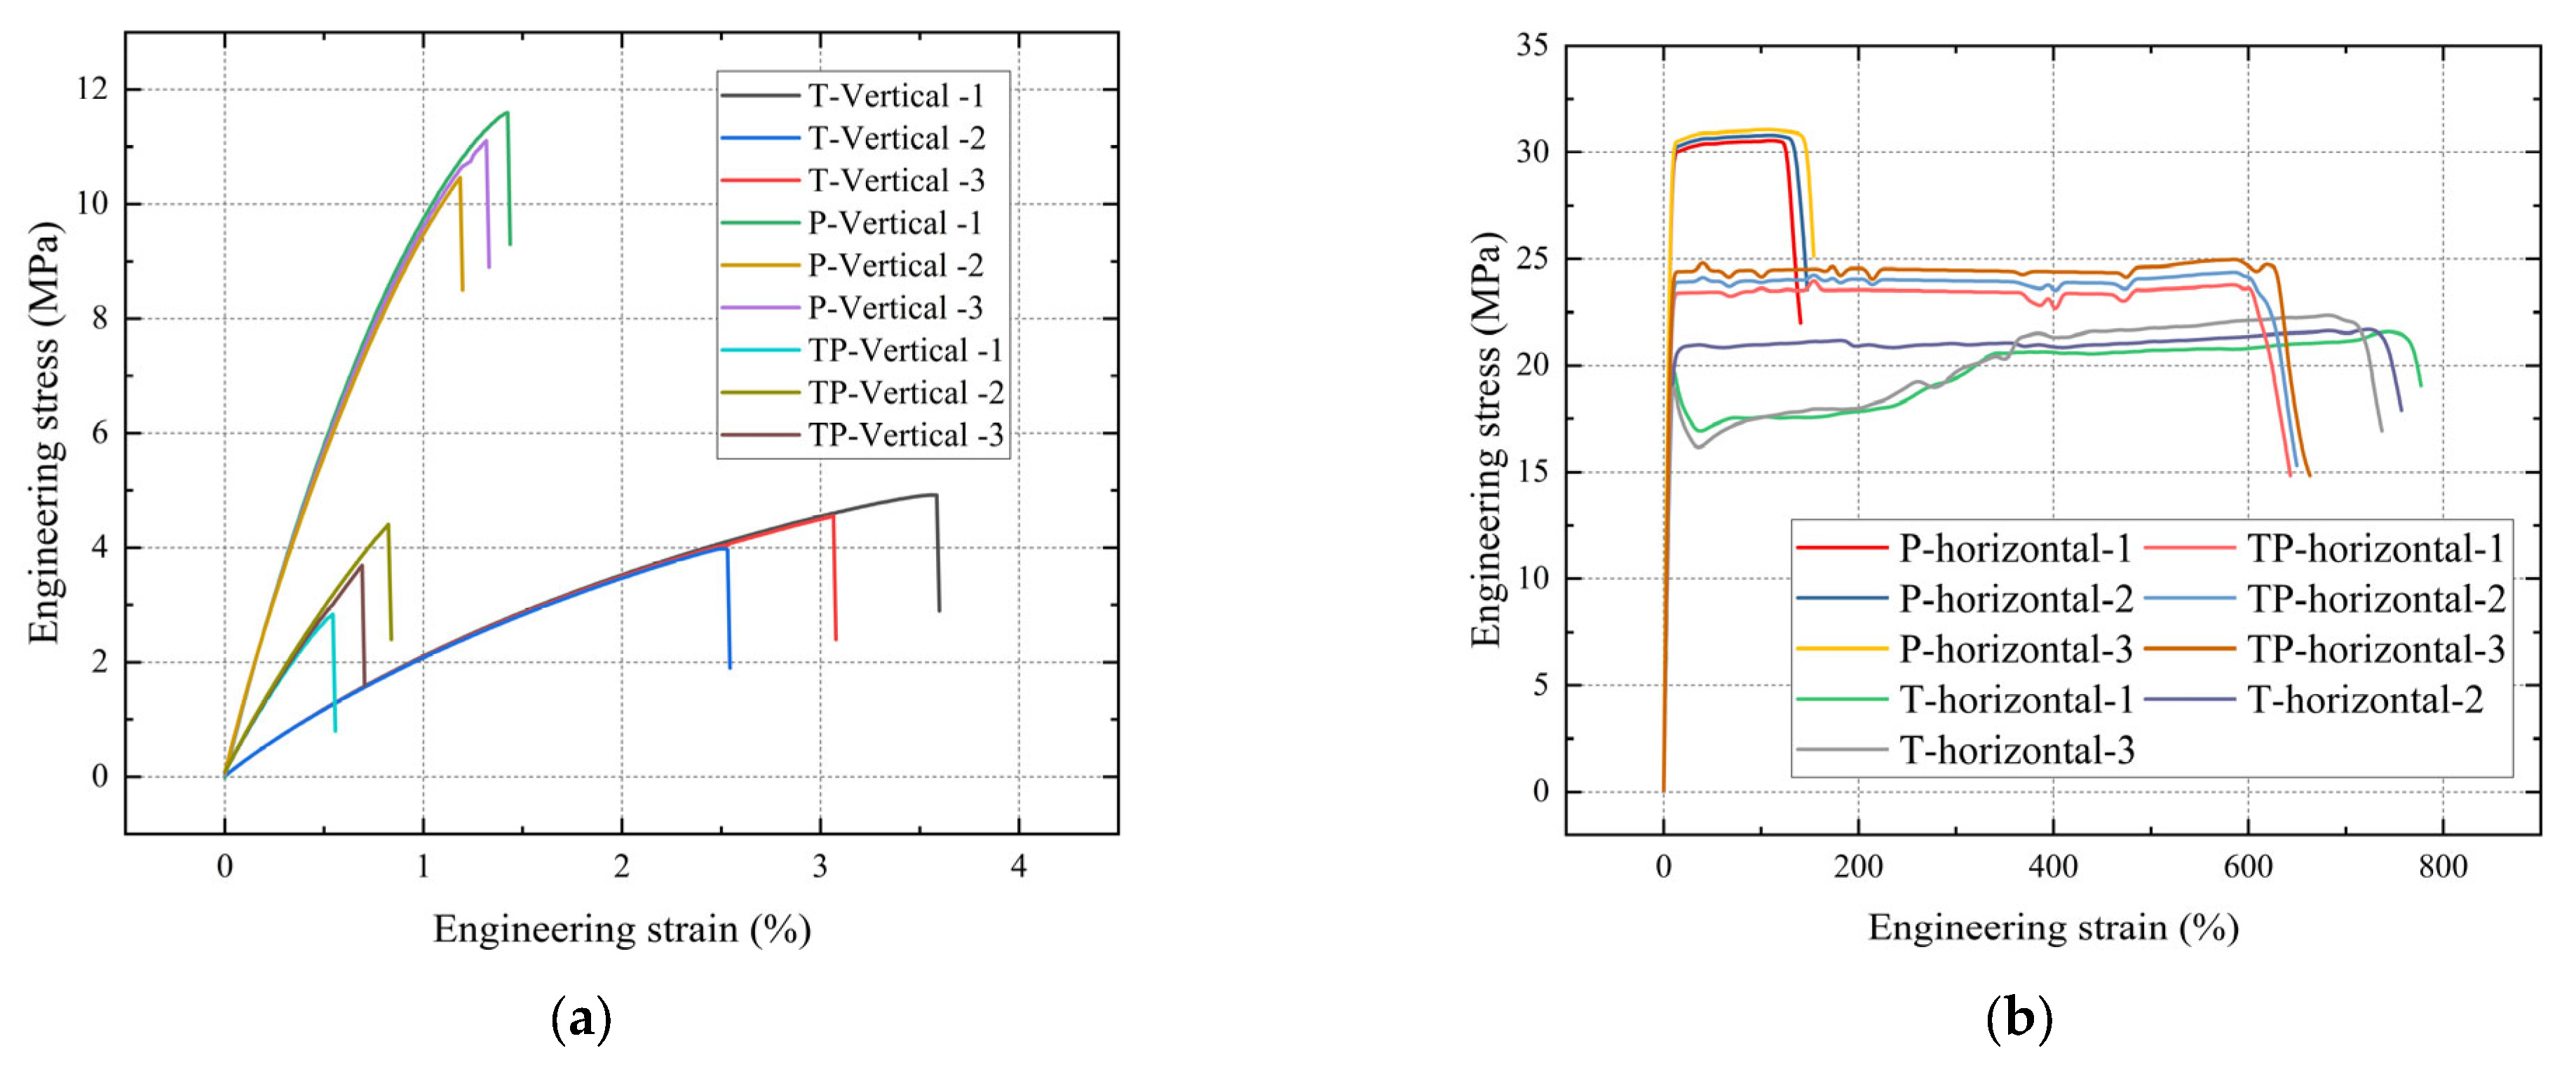
To systematically evaluate the mechanical performance of different material systems under vertical and horizontal printing conditions in 3D printing, this section presents tensile property tests conducted on TPU, PLA, and PLA/TPU heterogeneous structure samples. For each tensile test condition, three specimens (n = 3) were tested; the specific specimen-level test data and detailed results are reported in Table 8. Tensile tests were performed using an Instron 5967 testing machine to ensure consistent loading conditions across all specimens. The resulting engineering stress–strain curves are shown in Figure 7.
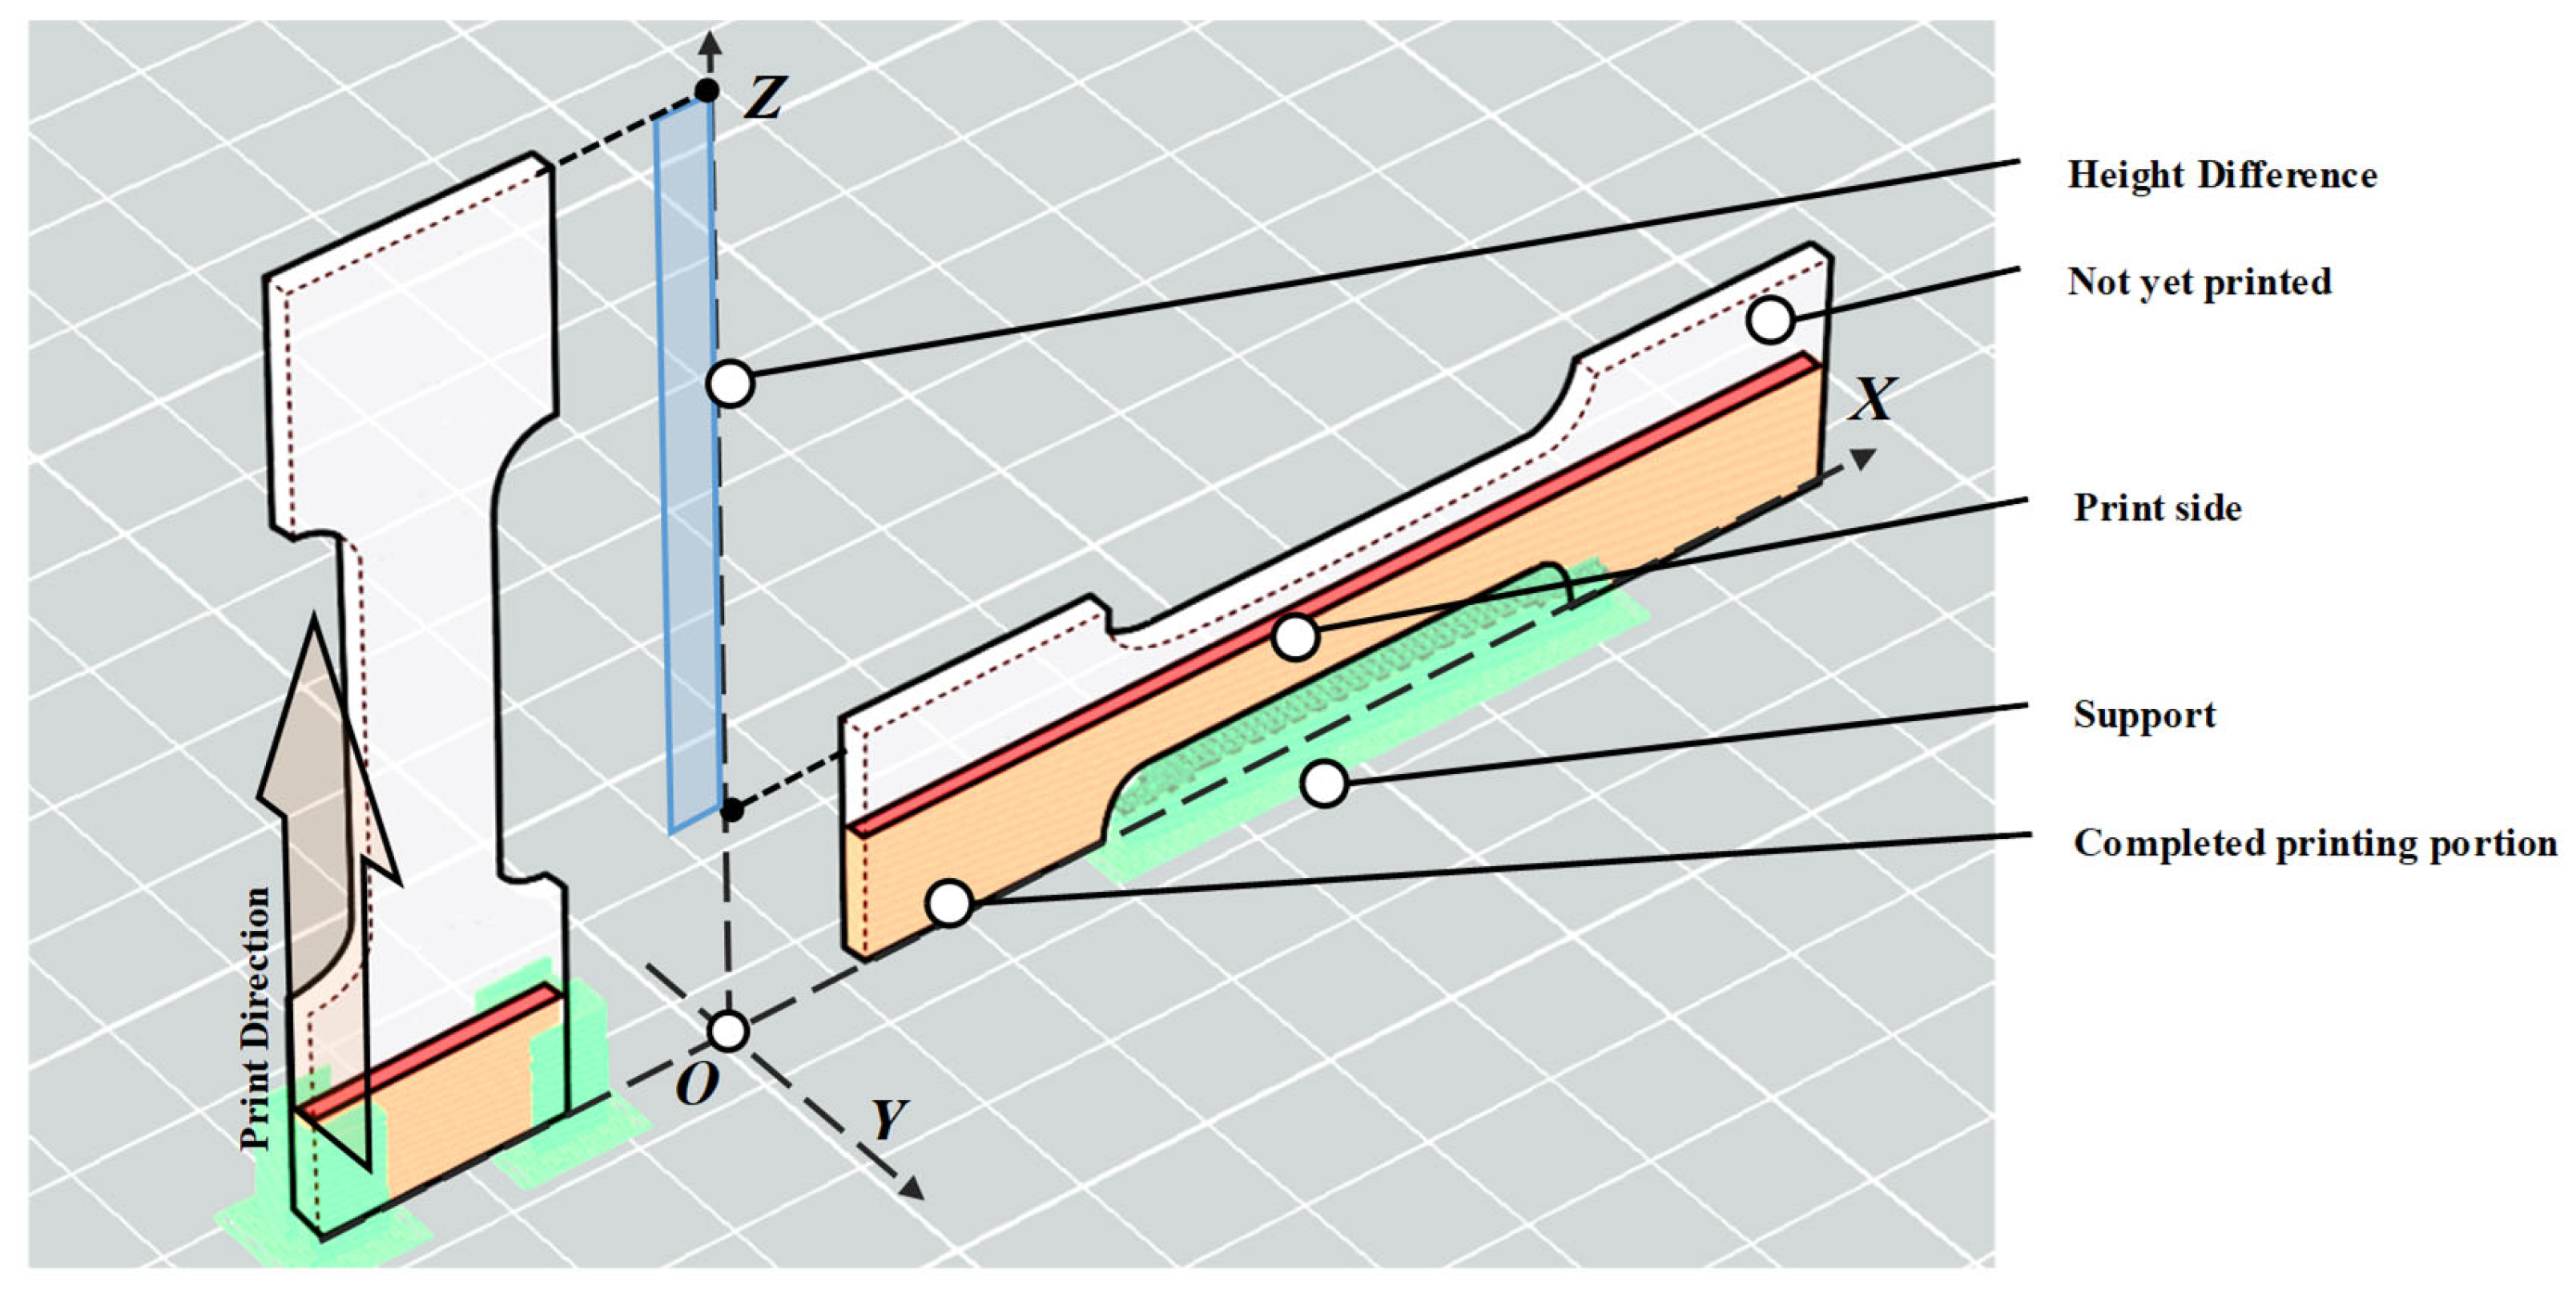
Under vertical printing conditions (Figure 7a), the tensile behavior of all three materials was unsatisfactory and showed significant differences. TPU (T-Vertical) exhibited a maximum engineering stress of approximately 4 MPa and a fracture strain of approximately 3%, appearing relatively “soft” but fracturing quickly. PLA (P-Vertical) was stronger, with a maximum engineering stress of approximately 11 MPa, but a fracture strain of only approximately 1%, exhibiting typical “high strength but brittle” characteristics. Notably, the PLA/TPU heterogeneous sample (TP-Vertical) performed the worst, with a maximum engineering stress of approximately 3 MPa and a fracture strain of approximately 0.8%. This indicates that the heterogeneous combination did not provide any advantage during vertical printing. The main reason is straightforward: vertical loading requires crossing layer-by-layer interfaces, akin to connecting many “weak links” in series, where any small defect can be directly pulled apart. Simultaneously, PLA and TPU have different thermal shrinkage and deformation behaviors, making it more difficult for the interface to adhere firmly, and cracks tend to propagate rapidly along the interface. As illustrated in Figure 8, the horizontally printed specimens exhibit a more continuous filament arrangement along the loading direction, together with improved inter-road contact, which further supports the above observations regarding fracture surface characteristics and interfacial failure mechanisms.
In contrast, the overall performance is significantly improved under horizontal printing conditions (Figure 7b). TPU (T-horizontal) exhibits a maximum engineering stress of approximately 20 MPa and an engineering strain exceeding 800%, demonstrating strong ductility and energy absorption capabilities. PLA (P-horizontal) achieves a maximum engineering stress of about 30 MPa and an engineering strain of approximately 150%, maintaining its characteristic of “high strength, moderate ductility,” but both are much better than in the vertical direction. Crucially, the PLA/TPU heterogeneous sample (TP-horizontal) achieves a good balance between strength and toughness: maximum engineering stress of approximately 25 MPa and an engineering strain of about 700%.
As illustrated in Figure 9, during horizontal printing, the material filaments are continuous along the loading direction, the overlap between layers and roads is more sufficient, the contact is tighter, the interface is easier to adhere to, and the load transfer is smoother. Based on this, TPU provides “cushioning” and energy dissipation, while PLA is responsible for load bearing. The combination of the two makes it difficult for cracks to propagate directly through, instability is delayed, resulting in high strength and good ductility. This interpretation was also supported by the fracture features of the horizontally printed specimens, which showed a rougher fracture surface and more tortuous crack paths, suggesting improved interfacial bonding and more effective stress transfer between PLA and TPU regions. The absence of obvious large-scale interfacial delamination further indicates that horizontal deposition favors stronger inter-road and inter-material adhesion.
Furthermore, a comparison between the experimental results and the official Technical Data Sheet values further highlights the significant impact of printing orientation on mechanical performance. For instance, the tensile strength obtained for the horizontally printed PLA samples is highly consistent with the supplier’s TDS data. This indicates that horizontal printing allows the polymer chains to align with the load-bearing axis, achieving optimal material strength. In contrast, the notably lower tensile values observed in the vertically printed samples can be reasonably attributed to the inherent anisotropy of the material extrusion process and weaker interlayer adhesion. In the vertical orientation, the tensile load is applied directly perpendicular to the deposited layers, making the inter-layer interfaces—rather than the continuous polymer filaments—the primary points of failure.
Overall, the printing direction is closely related to the material combination: vertical printing amplifies the weaknesses of the weak interlayer interface, which limits heterogeneous combinations; horizontal printing can optimize the load path and enhance interfacial adhesion, enabling the advantages of stiffness and flexibility synergy to be realized. Combined with the fracture surface observations, these results confirm that printing orientation governs not only the tensile response but also the dominant failure path in heterogeneous PLA/TPU structures. For process-guided heterogeneous material design, the heterogeneous strategy should be implemented together with a favorable printing direction to markedly enhance fracture toughness and energy absorption capacity, despite a slight compromise in strength.

4. Life Cycle Assessment Environmental Impact Analysis

To strengthen the engineering relevance and sustainability implications of this study, we applied life cycle assessment (LCA) to quantify the carbon footprint associated with the manufacturing stage of MEX-printed PLA, TPU, and heterogeneous PLA/TPU specimens. Unlike a comparison based solely on mechanical performance under different build orientations, LCA provides an integrated accounting that includes material consumption, printer electricity use, and the additional energy demand and waste induced by multi-material switching. We developed a parameterized life cycle inventory model and compared greenhouse gas emissions across material and build-orientation combinations under a defined functional unit.
The LCA results are sensitive to material-specific differences in raw material composition and the associated manufacturing energy and emissions inventories, which lead to distinct energy flows and inventory inputs within each material’s process boundary. These parameter disparities, as summarized in Table 9 and Table 10, indicate that the environmental outcomes are driven not only by build orientation, but also by the intrinsic material characteristics and their corresponding manufacturing pathways. The assessment covers eleven impact categories, including Global Warming Potential (GWP), Ozone Depletion Potential (ODP), acidification potential (AP), and eutrophication potential (EP).

4.1. Comparative Analysis of Printing Orientations on Environmental Impacts

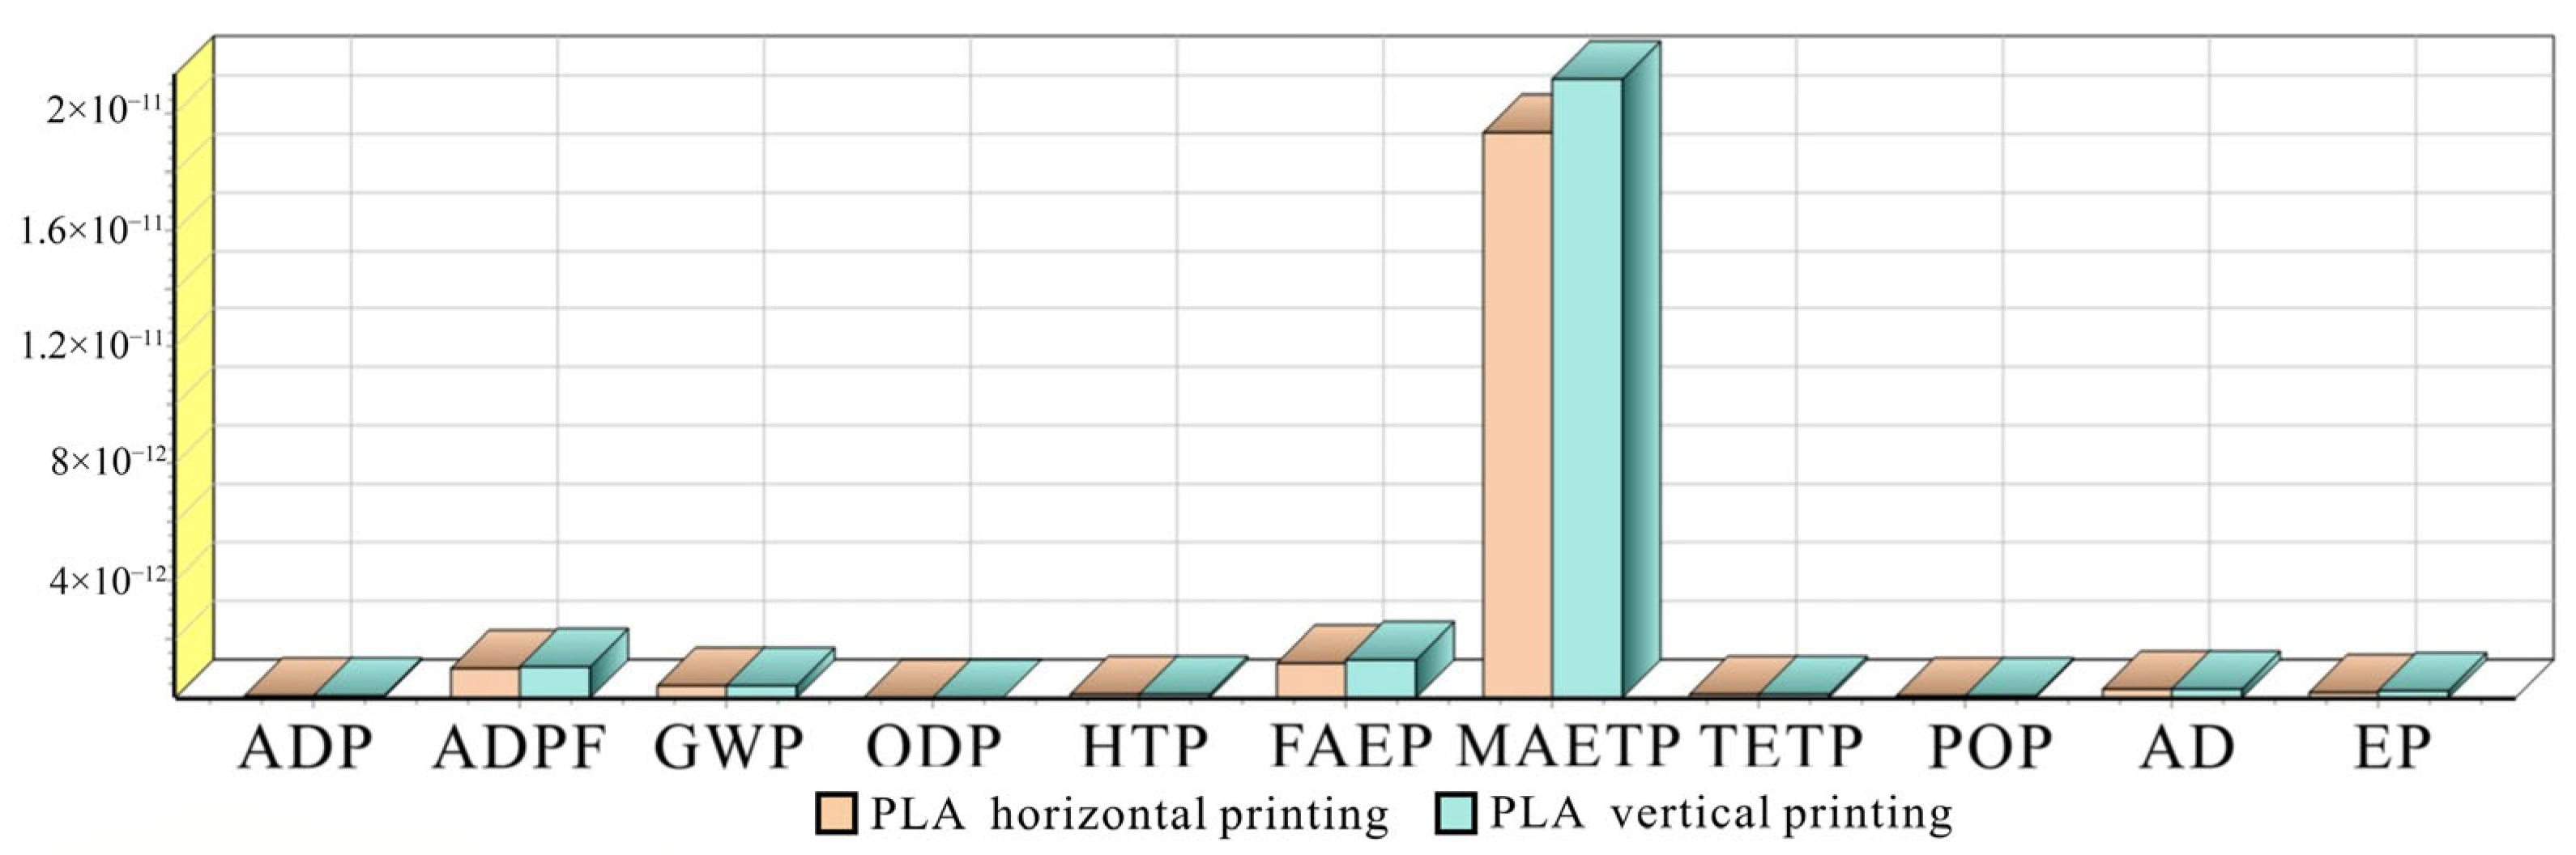
Based on the LCA results using the CML-IA baseline method, the environmental impact comparison for PLA specimens between horizontal and vertical printing processes reveals certain differences, as shown in Figure 10. Overall, the two printing orientations exhibit very similar distribution patterns across most impact categories, indicating that the upstream PLA material supply chain remains the dominant driver of the overall profile and that changing the build orientation does not fundamentally shift which life cycle stages contribute the most. Nevertheless, a clear divergence appears in MAETP, where vertical printing presents a noticeably higher impact than horizontal printing. From the figure, the MAETP value for horizontal printing is approximately 1.6 × 10⁻¹¹ while the vertical printing value is about 1.8 × 10⁻¹¹, showing an evident increase for the vertical orientation. This difference is consistent with process-related burdens rather than material-related changes, because vertical printing generally requires longer machine operating time, greater electricity demand, and more frequent use of support structures to ensure geometric stability. The additional supports increase filament consumption and lead to more offcuts and discarded material during removal, and the longer operation extends the period of emissions associated with electricity generation, which together amplify the manufacturing-stage contribution and are reflected most strongly in aquatic ecotoxicity.
For the remaining categories, including ADP, GWP, and AP, vertical printing is only slightly higher than horizontal printing, and the gaps are comparatively small in absolute terms. The bars in these categories remain close to the lower end of the axis scale, suggesting that the orientation effect is marginal relative to the dominant impacts already embedded in raw material production and preprocessing. In practical terms, this means that orientation mainly influences environmental performance indirectly through manufacturing efficiency, such as print duration, support demand, and material utilization, rather than by altering the inherent environmental characteristics of PLA itself. Accordingly, measures that reduce printing time and minimize supports, for example through optimized part placement, support-light design, or improved slicing strategies, are likely to be the most effective pathway to narrowing the MAETP gap while leaving other impact categories largely unchanged.
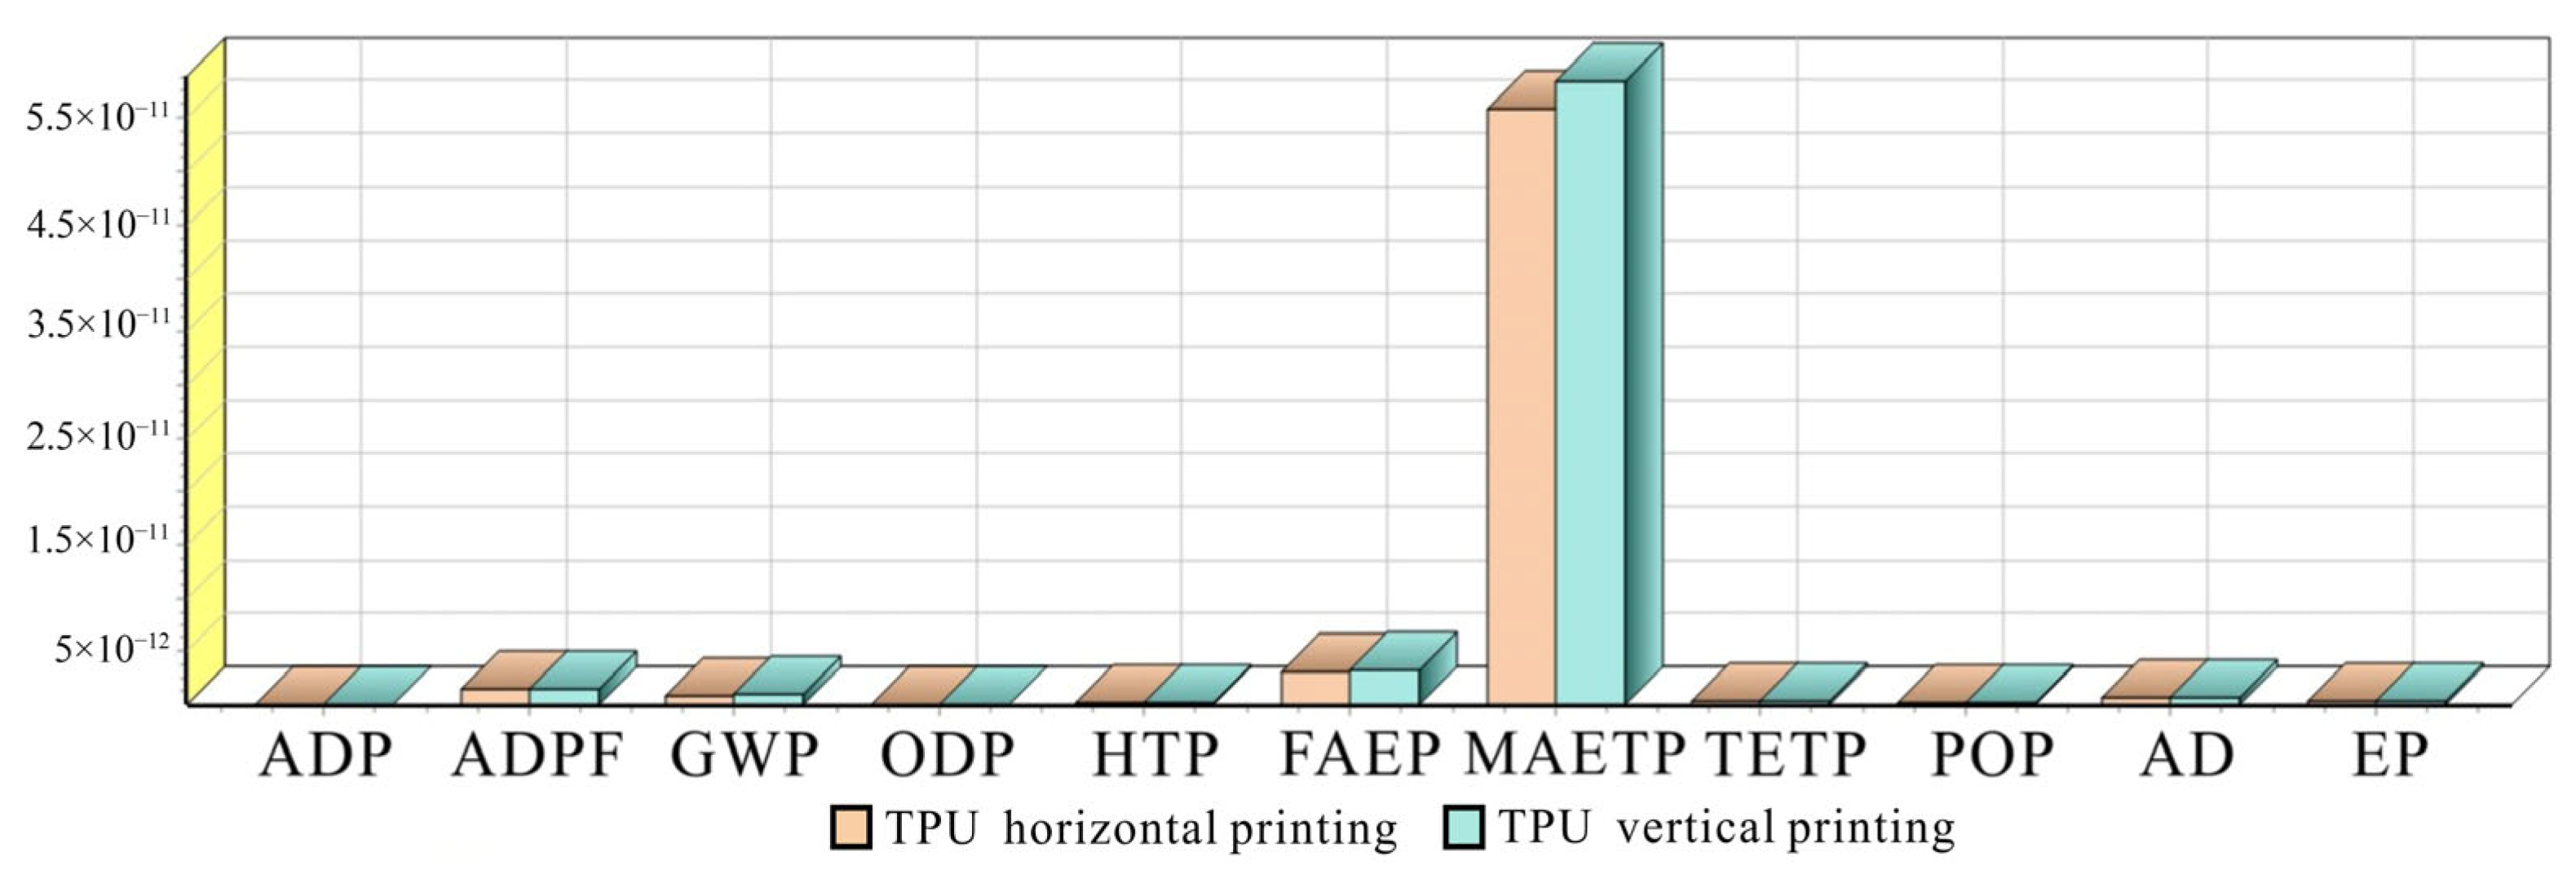
Similarly, the LCA results based on the CML-IA baseline method indicate that the environmental impact comparison for TPU specimens between horizontal and vertical printing processes follows an overall pattern akin to that of PLA, but with more pronounced differences, as shown in Figure 11. Across most impact categories, the two orientations remain close in magnitude and show consistent distribution trends, which suggests that the upstream TPU production route remains the principal contributor to the overall environmental profile and that orientation changes mainly influence the manufacturing stage rather than the material supply chain structure. A clear exception appears in MAETP, where vertical printing shows a markedly higher value than horizontal printing. According to the figure, horizontal printing in MAETP is approximately 4.5 × 10⁻¹¹, while vertical printing reaches about 5.0 × 10⁻¹¹, indicating a distinct increase for the vertical process. This difference can be linked to the process characteristics of TPU printing, since TPU is flexible and more prone to deformation during deposition, which typically encourages a higher reliance on supports and more conservative printing settings in vertical builds. As a result, printing duration increases, machine electricity consumption accumulates, and additional support material must be produced and later removed, which increases material waste and increases the manufacturing-related emissions burden, ultimately being reflected most strongly in aquatic ecotoxicity.
For other indicators such as ADPF, GWP, and ODP, vertical printing also remains slightly higher than horizontal printing, but the absolute differences are small relative to MAETP and remain near the lower end of the axis scale. This pattern is consistent with the fact that TPU is commonly derived from petroleum-based feedstocks, so fossil resource depletion and climate-related indicators are intrinsically sensitive to energy use and upstream processing intensity. Even so, the orientation-driven increment is mainly attributable to marginal increases in electricity demand and auxiliary material use during printing rather than a fundamental shift in upstream impacts. Overall, the results imply that reducing the support requirement and shortening effective print time are the most direct levers for lowering TPU impacts in vertical builds, for example by optimizing part orientation to minimize overhangs, adjusting slicing strategies to reduce support density, and improving print stability to avoid conservative low-speed settings that extend machine operation time.
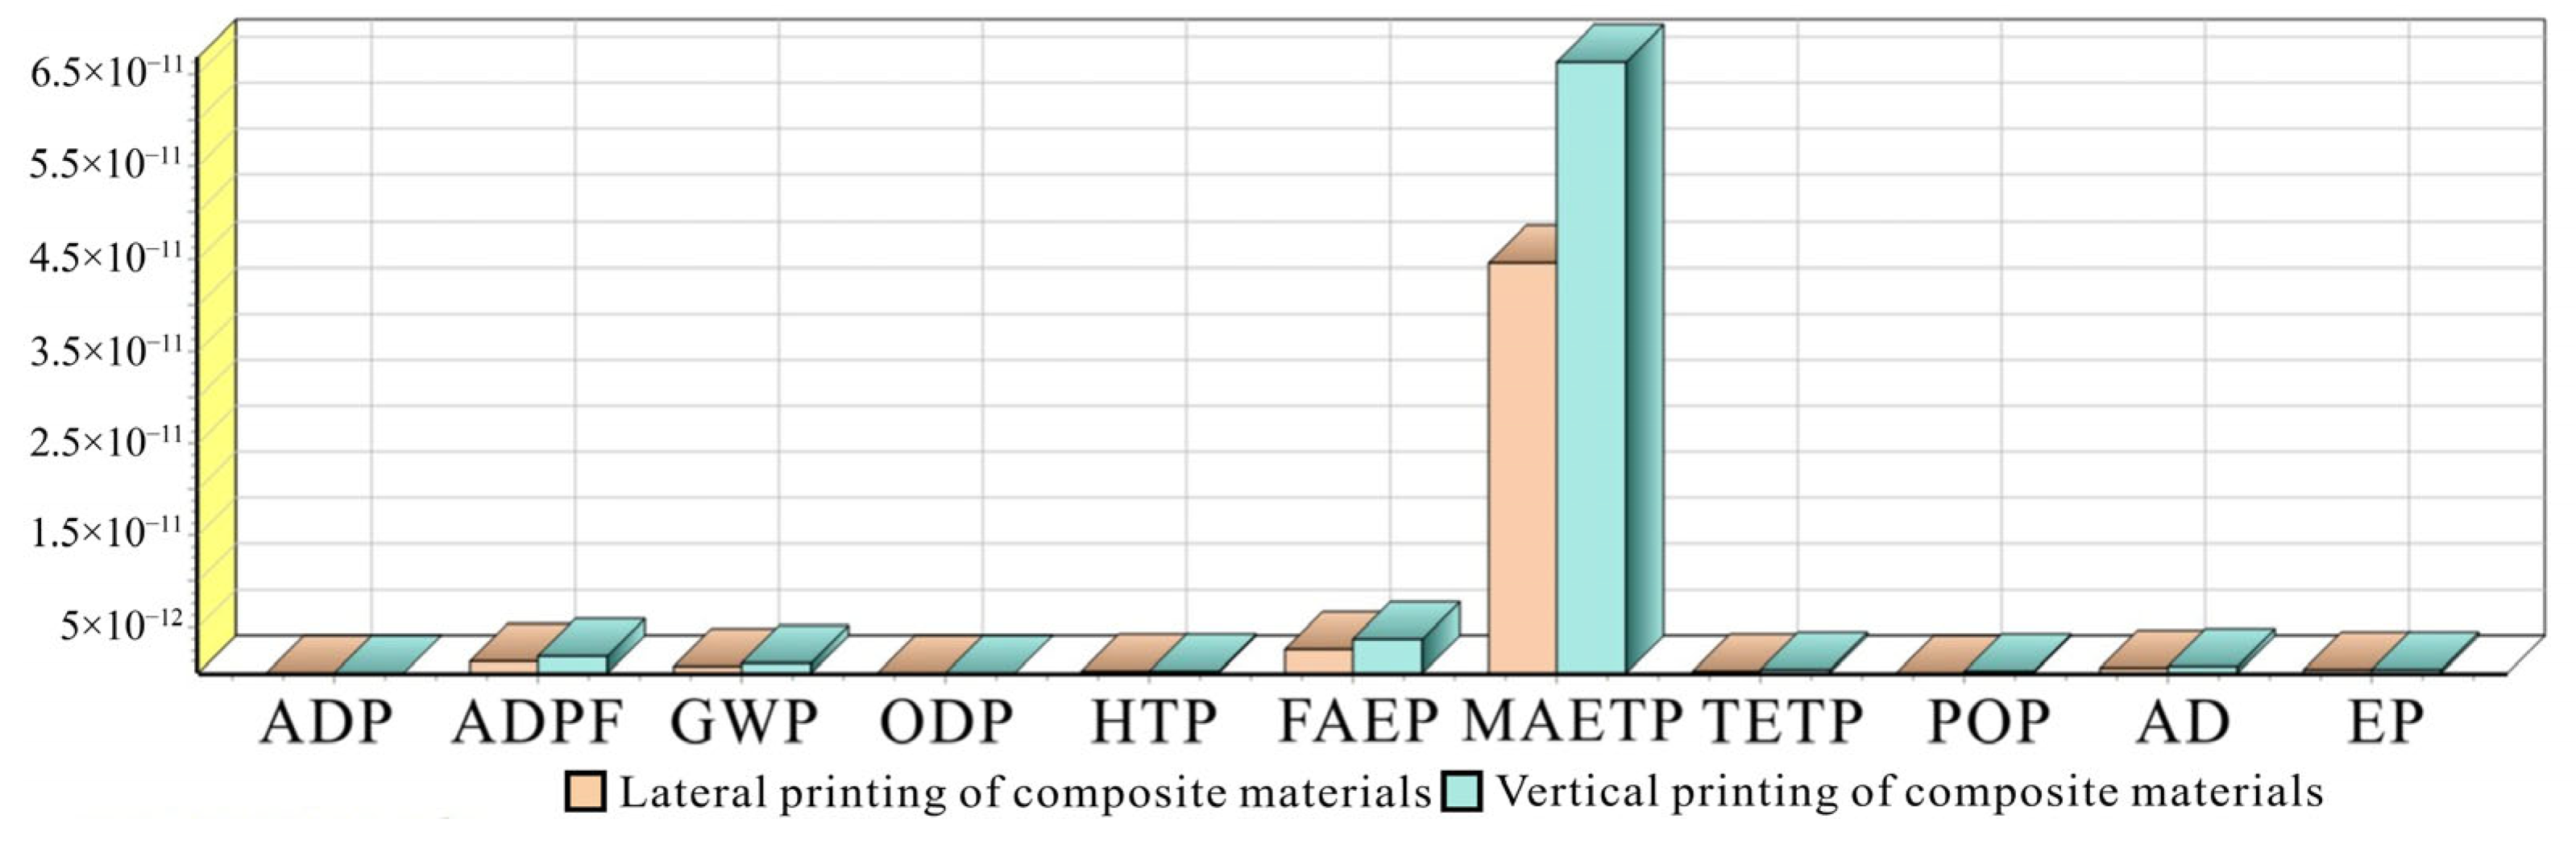
For the comparison of horizontal and vertical printing processes in PLA/TPU composite materials, the LCA results using the CML-IA baseline method reveal an impact distribution intermediate between pure PLA and pure TPU, as shown in Figure 12. In general, the differences between the two orientations are limited across most categories, but vertical printing demonstrates notably higher values in MAETP. This incorporates PLA’s bio-based characteristics and TPU’s petroleum-based components, possibly because the composite structure requires more interface processing in the vertical process, increasing printing complexity and waste generation, thus amplifying ecotoxicity contributions. In other categories such as GWP, EP, and AP, the impacts of vertical printing are marginally higher than those of horizontal printing, suggesting that the process sensitivity of composite materials stems from the combined effects of inter-material interactions and manufacturing efficiency.
In summary, the environmental impact comparisons between horizontal and vertical printing processes across the three materials reveal a consistent pattern, wherein vertical printing generally results in higher environmental loads, particularly prominent in the MAETP category, while horizontal printing proves relatively more favorable. This disparity is primarily manifested in the vertical process’s extension of printing time, escalation of energy consumption, and production of support structure waste, thereby magnifying emissions contributions during manufacturing. Specifically, vertical printing requires additional handling of model stability, such as adding supports, which not only boosts electricity demands but also potentially increases waste management burdens, leading to a marked rise in ecotoxicity indicators like MAETP. In contrast, horizontal printing, with its inherently more stable model orientation, minimizes these extra steps and yields lower overall environmental impacts. In other impact categories such as GWP, ADPF, and EP, vertical printing exhibits slightly greater effects than horizontal printing, though the differences are comparatively limited. This underscores that the primary mechanism of printing orientation involves indirectly influencing environmental loads through adjustments in manufacturing efficiency, such as electricity usage and duration, rather than directly intervening in the material supply chain. This process sensitivity highlights the potential benefits of prioritizing horizontal layouts in 3D-printing design, while recommending parameter optimizations, such as layer thickness, printing speed, and support minimization, to mitigate the environmental burdens of vertical printing. Ultimately, these differences in carbon emissions between horizontal and vertical orientations stem mainly from variations in process duration, such as the prolonged manufacturing time and heightened energy consumption in vertical printing. This aligns with the system parameters and material energy flow heterogeneities within the manufacturing process boundaries outlined in the preceding LCA framework.

4.2. Comparative Analysis of Material Types on Environmental Impacts

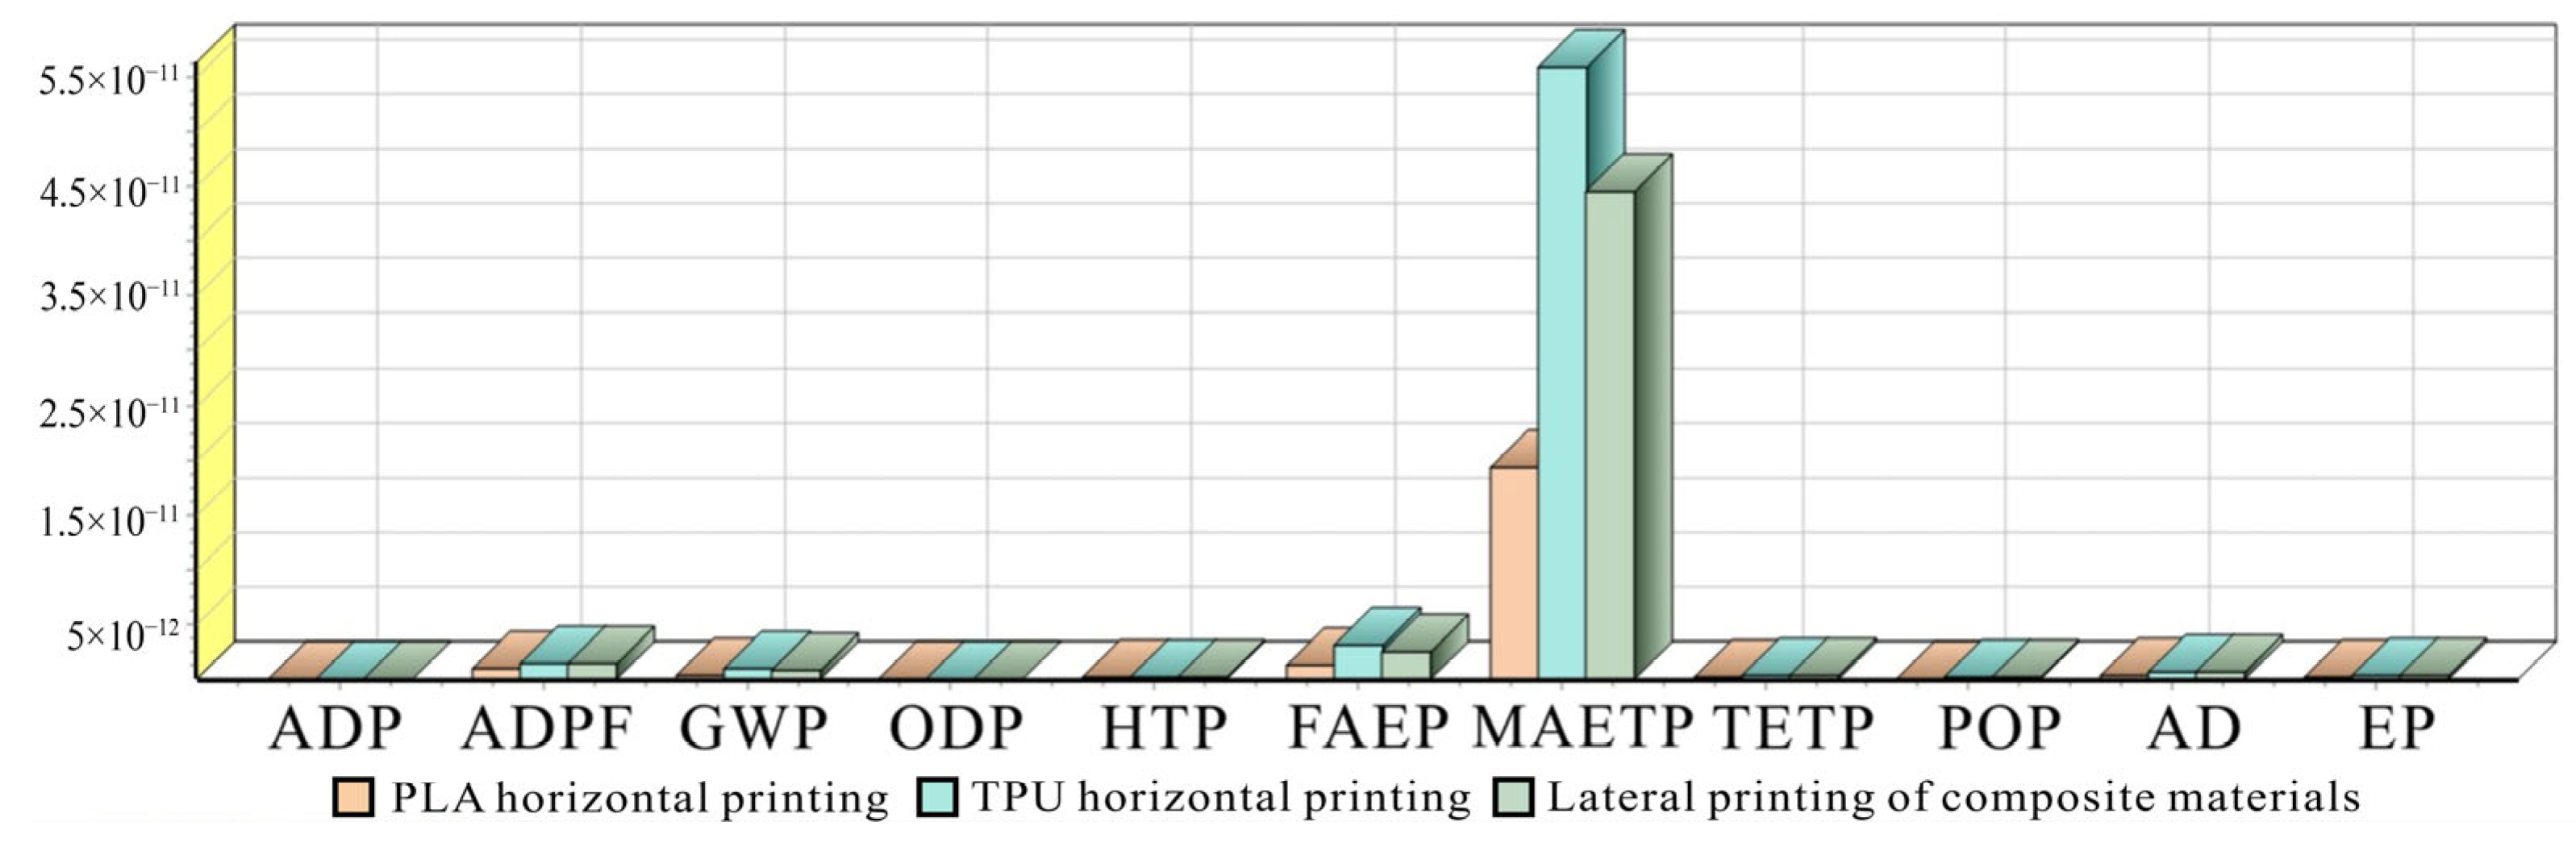
Based on the LCA results using the CML-IA baseline method, the environmental impact comparison among PLA, TPU, and PLA–TPU composite materials under horizontal printing shows clear material-dependent differences, as illustrated in Figure 13. Across most impact categories such as ADP, ADPF, GWP, ODP, HTP, FAEP, TETP, POP, AD, and EP, the three materials follow broadly similar category-to-category patterns, but their magnitudes differ, indicating that material selection is a stronger determinant of environmental burdens than the printing process itself when the orientation is held constant. TPU generally exhibits higher impacts than PLA in several fossil- and energy-linked categories, which is consistent with its petroleum-based feedstock and more energy-intensive upstream synthesis route, and this is most apparent in ADPF and GWP, where TPU’s bars are visibly above PLA’s.
The composite typically falls between PLA and TPU for many indicators, reflecting the combined contribution of PLA and TPU, with a mixing effect in which PLA can dilute TPU’s fossil-resource intensity while TPU can raise impacts relative to pure PLA. A notable exception is MAETP, which dominates the scale and shows the largest separation among the three materials in Figure 13; the composite presents the highest MAETP, exceeding both PLA and TPU under the same horizontal printing condition. This suggests that, beyond upstream material production, composite-specific manufacturing and handling factors such as multi-material compatibility, interfacial behavior, parameter tuning, purging or failed segments, and additional waste management may amplify emissions or waste streams that contribute strongly to aquatic ecotoxicity. In contrast, differences in other categories such as ADP and EP appear more moderate, reinforcing that the primary driver of the observed variations is supply chain differences among materials, while the horizontal printing process acts mainly as a secondary modifier through operational energy use and material utilization efficiency.
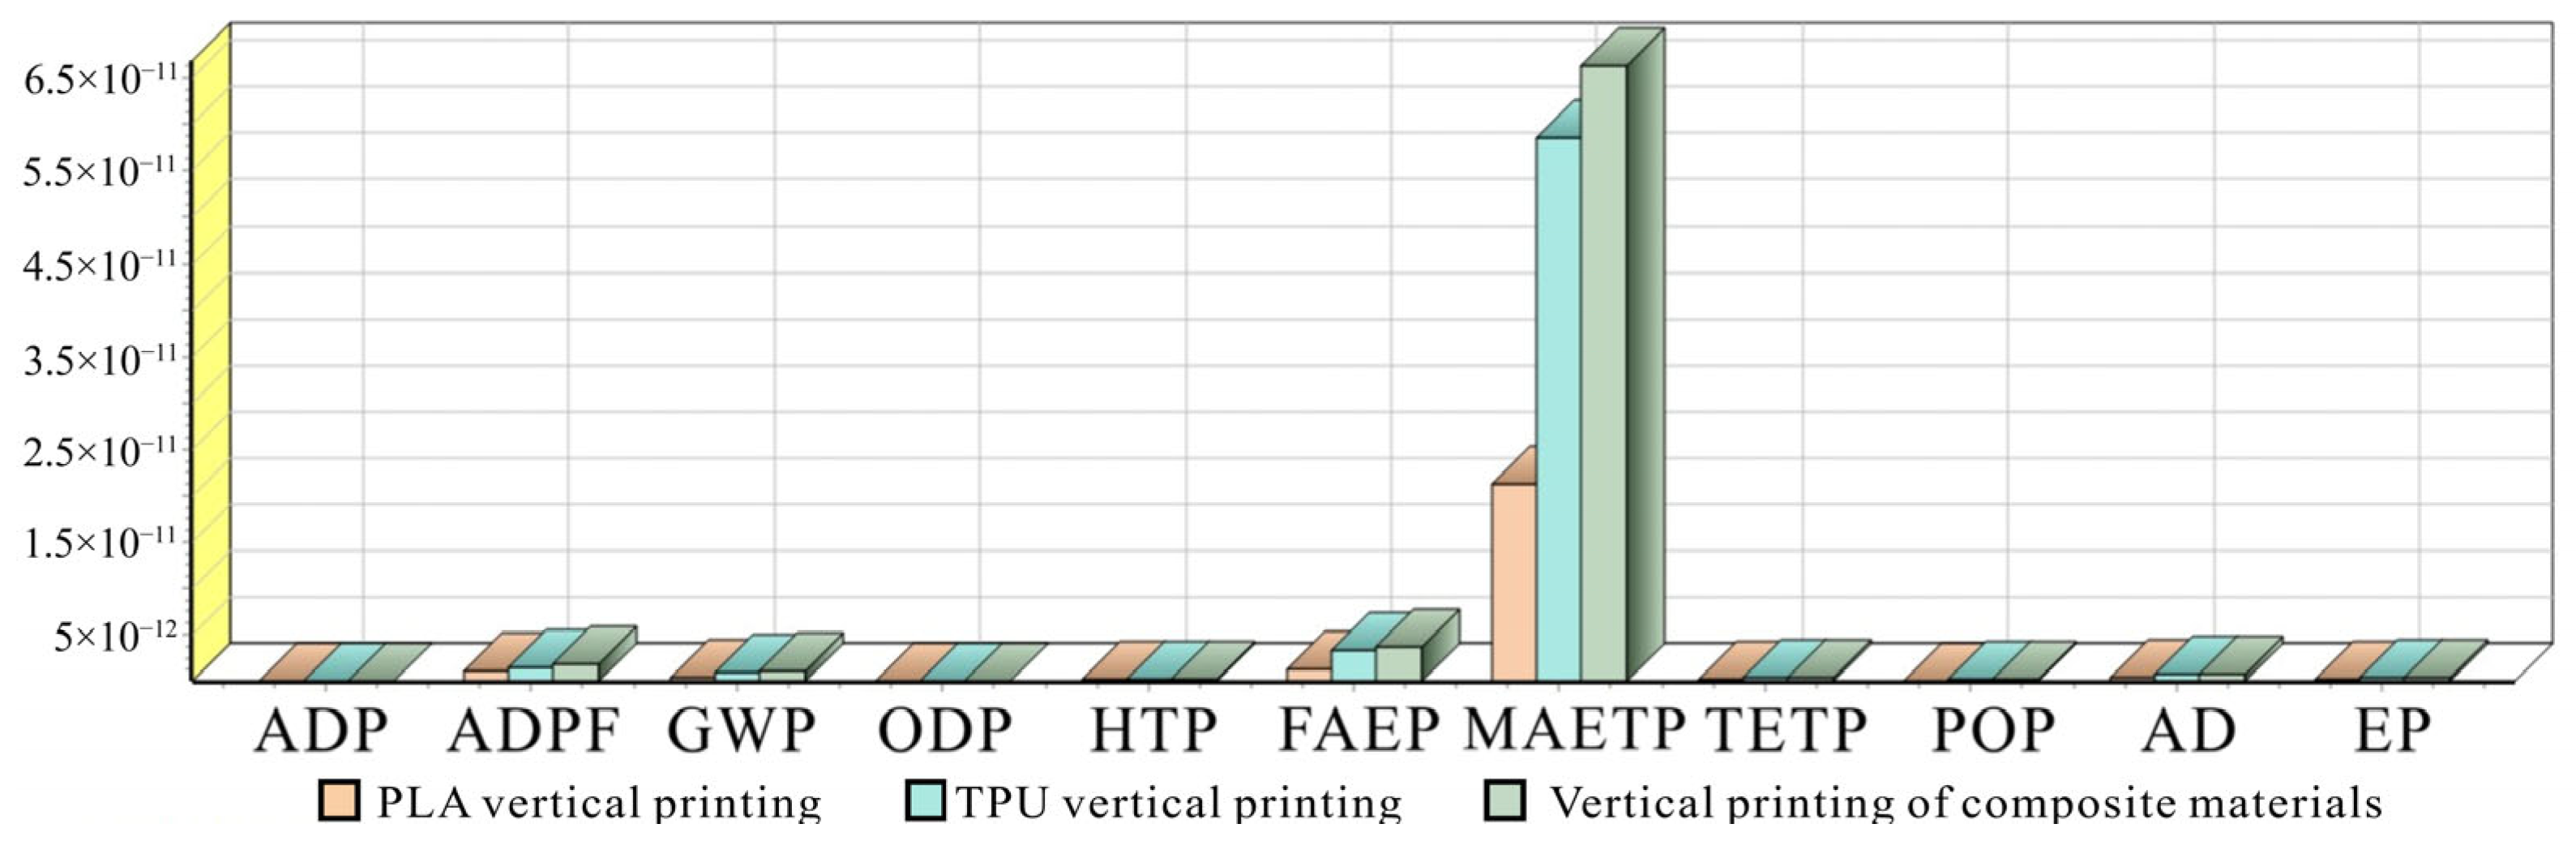
Similarly, the LCA results based on the CML-IA baseline method for vertical printing indicate pronounced environmental impact differences among PLA, TPU, and PLA–TPU composite materials, as shown in Figure 14. Overall, the category distribution trends remain broadly consistent with those observed in horizontal printing, but the contrasts become more evident under vertical orientation. In energy- and fossil-related categories such as ADPF and ODP, TPU shows the highest impacts, which is consistent with its petroleum-derived supply chain and the tendency for vertical TPU builds to require more conservative processing conditions, leading to higher electricity demand and upstream emissions burdens. PLA remains the lowest-impact option across most categories, reflecting the relative advantage of its bio-based feedstock, while the composite generally lies between PLA and TPU, indicating a combined contribution from both constituents rather than a complete shift in the dominant supply chain drivers.
A key feature in Figure 14 is the dominance of MAETP, where values are far higher than other categories and the separation among materials is the most pronounced. The composite exhibits exceptionally high MAETP in vertical printing, exceeding both PLA and TPU, suggesting that composite-specific effects become more critical when orientation increases printing difficulty. Possible drivers include increased support demand, longer print time, greater purge and trimming losses, and more frequent defects or rework associated with multi-material deposition and interfacial behavior, all of which increase manufacturing-stage waste and emissions that contribute strongly to aquatic ecotoxicity. In categories such as HTP and EP, TPU also shows a clearer sensitivity under vertical printing, reinforcing that environmental burdens are jointly shaped by material properties and orientation-dependent manufacturing efficiency rather than by a uniform process effect across all materials.
In summary, environmental impact comparisons among PLA, TPU, and composite materials across both horizontal and vertical printing orientations reveal a consistent hierarchy: TPU generally imposes the highest environmental loads, followed by the composite, with PLA being the most favorable. This ordering is evident in metrics such as ADPF, GWP, and MAETP. The disparity largely stems from intrinsic material characteristics: TPU’s petroleum-based supply chain drives greater fossil fuel depletion and global warming potential, while PLA’s bio-based origin mitigates these impacts; composites fall in between, and can exhibit amplified ecotoxicity under processing complexities. More pronounced differences appear in vertical printing, where TPU requires additional supports and energy, elevating indicators like MAETP and ODP; horizontal printing alleviates some of these demands, though TPU typically remains dominant in resource-intensive categories. In other areas such as ADP and EP, variations are less dramatic but consistently directional, underscoring that material choice directly affects supply chain emissions and processing efficiency, and thus overall environmental performance. These material-driven differences align with the LCA framework’s emphasis on life cycle inventories, where raw material sourcing and energy flows largely determine orientation-related heterogeneity. The findings advocate for bio-based alternatives like PLA in sustainable 3D printing and suggest hybrid composites as a balanced option, with formulation and processing optimizations aimed at minimizing ecotoxicity without compromising performance.

5. Conclusions

This study comprehensively investigated the interplay between printing orientation, material selection (PLA, TPU, and their heterogeneous combinations), and their subsequent impact on both mechanical performance and environmental footprint in 3D printing. Our findings decisively demonstrate that printing orientation is a critical determinant, with horizontal printing consistently yielding superior mechanical properties, including enhanced strength, ductility, and energy absorption, compared to vertical printing. Furthermore, the life cycle assessment revealed that horizontal printing also presents a more environmentally favorable outcome across various impact categories. These insights are crucial for optimizing additive manufacturing processes to achieve desired functional properties while simultaneously addressing sustainability concerns.
  • Horizontal printing significantly improves the strength, ductility, and energy absorption of all materials. Our experimental results exhibit a highly consistent trend with the official Technical Data Sheet (TDS) values. Specifically, the manufacturer’s reported tensile strength in the XY direction is 30 ± 5 MPa for PLA and 22.4 ± 0.6 MPa for TPU for AMS, which closely align with our horizontal results and indicate optimal polymer chain alignment. Conversely, vertical printing leads to substantial degradation. This reduction is reasonably attributed to the intrinsic anisotropy of material extrusion and weak interlayer adhesion, making interfaces the primary failure points. Consequently, heterogeneous samples exhibit the most pronounced instability in vertical orientations due to complex interfacial load transfer.
  • TPU demonstrates exceptional ductility and energy absorption in horizontal orientations, while PLA provides higher strength but limited ductility. Heterogeneous PLA/TPU systems achieve a balanced strength–toughness profile in horizontal printing but suffer from severe performance degradation and brittle fracture in vertical orientations.
  • Horizontal printing consistently results in lower environmental burdens (e.g., MAETP, GWP, and ADPF) across all material types due to reduced processing time, energy consumption, and waste. Vertical printing, especially for TPU and composites, exacerbates these environmental impacts.
For micro-scale component design and environmental sustainability, this study recommends the horizontal printing of heterogeneous PLA/TPU to maximize continuous load paths, toughness, and energy absorption, while reducing strength trade-offs; simultaneously, using bio-based PLA or optimized composites further lowers resource depletion and emissions. Overall, integrating mechanical performance with environmental considerations, and prioritizing horizontal printing, emerges as an effective strategy for functional, eco-friendly 3D-printed components. Future work should advance material formulations and interface engineering to further minimize the ecological footprint across diverse applications.

6. Outlook

First, the next study will further broaden the scope of 3D-printing orientation optimization strategies. While the current work primarily focuses on the anisotropy of material mechanical properties, validated through simple test specimens, the impact of complex geometric features on printability is paramount in real-world engineering applications. Therefore, future research will emphasize the consideration of structural features such as holes (cavities) and complex overhangs as constraints on print orientation selection. We will develop a comprehensive optimization framework that not only evaluates the effect of print orientation on mechanical properties but also integrates printability as a core optimization metric. This will involve a quantitative analysis of support structure requirements, surface quality, geometric accuracy, and material consumption to ensure effective and efficient manufacturing while meeting mechanical performance criteria.
Secondly, the single-extruder printing equipment currently used in this study presents an efficiency bottleneck for integrating multiple materials. This is particularly evident when introducing water-soluble support materials (such as PVA), as the increased material switching and post-processing steps would significantly extend the printing cycle. Given this, and considering the positive environmental impact of biodegradable materials, we plan to introduce dual-extruder or multi-extruder printing equipment in future research. This will greatly optimize the multi-material printing process and improve printing efficiency, especially for components requiring complex support structures.
By upgrading the hardware platform, we will be able to more efficiently explore a wider range of material combinations, including but not limited to novel biodegradable polymers with excellent mechanical properties, biocompatibility, or unique functionalities. Furthermore, we will delve into the interfacial properties, mechanical response, and long-term stability of these materials within multi-material composite structures. This research aims to establish a more efficient, flexible, and environmentally sustainable multi-material 3D-printing technology system through the introduction of advanced equipment and the expansion of the material spectrum, thereby providing innovative solutions for a broader range of engineering applications.
Finally, future research will delve deeper into the role and optimization strategies of support structure design in multi-material 3D printing. A recognized limitation of the current study is the insufficient focus on the critical presence of support structures during the printing process. They are essential for printing complex geometries, ensuring successful part formation, and enhancing the final mechanical performance of the component. However, support structures also lead to additional material consumption, extended print times, and complicated post-processing.
Therefore, future research will also need to focus on developing or evaluating advanced support generation algorithms and design principles. The aim will be to minimize the amount of support material used and the print time, while ensuring part quality and successful formation. This will include exploring the applicability of different support types, optimizing support density and angles, and investigating how to implement smarter and more efficient support strategies within multi-material systems. We will also consider the impact of support structures on the final part’s surface quality and its mechanical properties after removal, seeking a comprehensive optimization solution to achieve the best balance between material efficiency, printing efficiency, and final product performance, thereby driving the further maturation of multi-material additive manufacturing technology in practical engineering applications.


Author Contributions

Conceptualization and writing—original draft preparation, W.W.; data curation, software, and validation, Z.H.; investigation and software, R.Z.; resources and visualization, Y.H.; formal analysis, and methodology and writing—review and editing, Y.W.; supervision and project administration, B.M.; supervision and funding acquisition, M.C. All authors have read and agreed to the published version of the manuscript.

Funding

This work was supported by the National Key R&D Program of China (2022YFB3706903), the Natural Science Foundation of Hubei Province (2023AFB060), the Foundation of National Key Laboratory for Remanufacturing (61420052023D011), and the Major Project of Hubei Province Science and Technology (2023BCA006).

Institutional Review Board Statement

Not applicable.

Informed Consent Statement

Not applicable.

Data Availability Statement

The original contributions presented in this study are included in the article. Further inquiries can be directed to the corresponding author.

Conflicts of Interest

The authors declare no conflict of interest.

References

  1. MacDonald, E.; Wicker, R. Multiprocess 3D Printing for Increasing Component Functionality. Science 2016, 353, aaf2093. [Google Scholar] [CrossRef] [PubMed]
  2. Kwon, S.; Hwang, D. Understanding and Resolving 3D Printing Challenges: A Systematic Literature Review. Processes 2025, 13, 1772. [Google Scholar] [CrossRef]
  3. Arockiam, A.J.; Subramanian, K.; Padmanabhan, R.G.; Selvaraj, R.; Bagal, D.K.; Rajesh, S. A Review on PLA with Different Fillers Used as a Filament in 3D Printing. Mater. Today Proc. 2022, 50, 2057–2064. [Google Scholar] [CrossRef]
  4. Hasan, M.R.; Davies, I.J.; Pramanik, A.; John, M.; Biswas, W.K. Potential of Recycled PLA in 3D Printing: A Review. Sustain. Manuf. Serv. Econ. 2024, 3, 100020. [Google Scholar] [CrossRef]
  5. Bruère, V.M.; Lion, A.; Holtmannspötter, J.; Johlitz, M. The Influence of Printing Parameters on the Mechanical Properties of 3D Printed TPU-Based Elastomers. Prog. Addit. Manuf. 2023, 8, 693–701. [Google Scholar] [CrossRef]
  6. Desai, S.M.; Sonawane, R.Y.; More, A.P. Thermoplastic Polyurethane for Three-dimensional Printing Applications: A Review. Polym. Adv. Technol. 2023, 34, 2061–2082. [Google Scholar] [CrossRef]
  7. Rahmatabadi, D.; Ghasemi, I.; Baniassadi, M.; Abrinia, K.; Baghani, M. 3D Printing of PLA-TPU with Different Component Ratios: Fracture Toughness, Mechanical Properties, and Morphology. J. Mater. Res. Technol. 2022, 21, 3970–3981. [Google Scholar] [CrossRef]
  8. Zu, R.; Chen, W.; Huang, Y.; Chen, Y.; Du, C.; Fan, Q.; Li, H.; Liu, H. Tailor-Made 3D Printing TPU/PLA Composites for Damping and Energy Absorption. Mater. Des. 2025, 252, 113752. [Google Scholar] [CrossRef]
  9. Bănică, C.-F.; Sover, A.; Anghel, D.-C. Printing the Future Layer by Layer: A Comprehensive Exploration of Additive Manufacturing in the Era of Industry 4.0. Appl. Sci. 2024, 14, 9919. [Google Scholar] [CrossRef]
  10. Alghauli, M.A.; Almuzaini, S.A.; Aljohani, R.; Alqutaibi, A.Y. Impact of 3D Printing Orientation on Accuracy, Properties, Cost, and Time Efficiency of Additively Manufactured Dental Models: A Systematic Review. BMC Oral Health 2024, 24, 1550. [Google Scholar] [CrossRef]
  11. Li, Y.; Teng, Z. Effect of Printing Orientation on Mechanical Properties of SLA 3D-printed Photopolymer. Fatigue Fract. Eng. Mater. Struct. 2024, 47, 1531–1545. [Google Scholar] [CrossRef]
  12. Xu, L.; Chen, Y.; Zhang, P.; Tang, J.; Xue, Y.; Luo, H.; Dai, R.; Jin, J.; Liu, J. 3D Printed Heterogeneous Hybrid Hydrogel Scaffolds for Sequential Tumor Photothermal-Chemotherapy and Wound Healing. Biomater. Sci. 2022, 10, 5648–5661. [Google Scholar] [CrossRef] [PubMed]
  13. Tümer, E.H.; Erbil, H.Y. Extrusion-Based 3D Printing Applications of PLA Composites: A Review. Coatings 2021, 11, 390. [Google Scholar] [CrossRef]
  14. Jayanth, N.; Jaswanthraj, K.; Sandeep, S.; Mallaya, N.H.; Siddharth, S.R. Effect of Heat Treatment on Mechanical Properties of 3D Printed PLA. J. Mech. Behav. Biomed. Mater. 2021, 123, 104764. [Google Scholar] [CrossRef]
  15. Khosravani, M.R.; Berto, F.; Ayatollahi, M.R.; Reinicke, T. Characterization of 3D-Printed PLA Parts with Different Raster Orientations and Printing Speeds. Sci. Rep. 2022, 12, 1016. [Google Scholar] [CrossRef]
  16. Marșavina, L.; Vălean, C.; Mărghitaș, M.; Linul, E.; Razavi, N.; Berto, F.; Brighenti, R. Effect of the Manufacturing Parameters on the Tensile and Fracture Properties of FDM 3D-Printed PLA Specimens. Eng. Fract. Mech. 2022, 274, 108766. [Google Scholar] [CrossRef]
  17. Kechagias, J.D.; Chaidas, D.; Spahiu, T. Decorative 3D Printing on Textiles Using Elastomer TPU Filament under Different Printing Conditions. Rapid Prototyp. J. 2024, 30, 2033–2042. [Google Scholar] [CrossRef]
  18. Tinoco, M.P.; de Mendonça, É.M.; Fernandez, L.I.C.; Caldas, L.R.; Reales, O.A.M.; Toledo Filho, R.D. Life Cycle Assessment (LCA) and Environmental Sustainability of Cementitious Materials for 3D Concrete Printing: A Systematic Literature Review. J. Build. Eng. 2022, 52, 104456. [Google Scholar] [CrossRef]
  19. Roux, C.; Kuzmenko, K.; Roussel, N.; Mesnil, R.; Feraille, A. Life Cycle Assessment of a Concrete 3D Printing Process. Int. J. Life Cycle Assess. 2023, 28, 1–15. [Google Scholar] [CrossRef]
  20. Jin, W.; Caron, J.-F.; Ouellet-Plamondon, C.M. Minimizing the Carbon Footprint of 3D Printing Concrete: Leveraging Parametric LCA and Neural Networks through Multiobjective Optimization. Cem. Concr. Compos. 2025, 157, 105853. [Google Scholar] [CrossRef]
  21. Ziemińska-Stolarska, A.; Sobulska, M.; Pietrzak, M.; Zbiciński, I. Application of Life Cycle Assessment to Analysis of Fibre Composite Manufacturing Technologies in Shipyards Industry. Processes 2024, 12, 461. [Google Scholar] [CrossRef]
  22. Curth, A.; Pearl, N.; Castro-Salazar, A.; Mueller, C.; Sass, L. 3D Printing Earth: Local, Circular Material Processing, Fabrication Methods, and Life Cycle Assessment. Constr. Build. Mater. 2024, 421, 135714. [Google Scholar] [CrossRef]
  23. PLA Matte|Bambu Lab Asia Store. Available online: https://asia.store.bambulab.com/products/pla-matte (accessed on 6 April 2026).
  24. TPU for AMS. Available online: https://asia.store.bambulab.com/products/tpu-for-ams (accessed on 6 April 2026).
  25. ISO 1183-1:2019; Plastics—Methods for Determining the Density of Non-Cellular Plastics—Part 1: Immersion Method, Liquid Pycnometer Method and Titration Method. ISO: Geneva, Switzerland, 2019.
  26. ISO 11357-1:2023; Plastics—Differential Scanning Calorimetry (DSC)—Part 1: General Principles. ISO: Geneva, Switzerland, 2023.
  27. ISO 306:2022; Plastics—Thermoplastic Materials—Determination of Vicat Softening Temperature (VST). ISO: Geneva, Switzerland, 2022.
  28. GB/T 1633-2000; Plastics—Thermoplastic Materials—Determination of Vicat Softening Temperature (VST). Standardization Administration of China: Beijing, China, 2000.
  29. ISO 75-2:2013; Plastics—Determination of Temperature of Deflection Under Load—Part 2: Plastics and Ebonite. ISO: Geneva, Switzerland, 2013.
  30. ISO 7619-1:2010; Rubber, Vulcanized or Thermoplastic—Determination of Indentation Hardness—Part 1: Durometer Method (Shore Hardness). ISO: Geneva, Switzerland, 2010.
  31. ISO 527-1:2019; Plastics—Determination of Tensile Properties—Part 1: General Principles. ISO: Geneva, Switzerland, 2019.
  32. GB/T 1040.1-2006; Plastics—Determination of Tensile Properties—Part 1: General Principles. Standardization Administration of China: Beijing, China, 2006.
  33. ISO 178:2019; Plastics—Determination of Flexural Properties. ISO: Geneva, Switzerland, 2019.
  34. GB/T 9341-2008; Plastics—Determination of Flexural Properties. Standardization Administration of China: Beijing, China, 2008.
  35. ISO 179-1:2023; Plastics—Determination of Charpy Impact Properties—Part 1: Non-Instrumented Impact Test. ISO: Geneva, Switzerland, 2023.
  36. GB/T 1043.1-2008; Plastics—Determination of Charpy Impact Properties—Part 1: Non-Instrumented Impact Test. Standardization Administration of China: Beijing, China, 2008.
Figure 1. Experimental equipment and consumables (1. 3D printer, 2. Print material management device AMS, 3. TPU material, and 4. PLA material).
Sustainability 18 03786 g001
Figure 2. Three-dimensional-printed part dimension diagram.
Sustainability 18 03786 g002
Figure 3. Schematic diagrams of 3D-printed slices of 3 different materials: (a) slice diagram of PLA material-printed parts in both vertical and horizontal orientations, (b) slice diagram of TPU material-printed parts in both vertical and horizontal orientations, and (c) slice diagram of PLA/TPU blend material-printed parts in both vertical and horizontal orientations (1. wipe tower, 2. vertical printed part, 3. vertical support structure, 4. horizontal printed part, 5. horizontal support structure, 6. brim, and 7. print bed).
Sustainability 18 03786 g003
Figure 4. Three-dimensional-printing flowchart.
Sustainability 18 03786 g004
Figure 5. Three-dimensional printing at different stages: (a) first layer of vertical printing, (b) halfway through vertical printing, (c) vertical printing completed, (d) first layer of horizontal printing, (e) halfway through horizontal printing, and (f) horizontal printing completed.
Sustainability 18 03786 g005
Figure 6. Three-dimensional-printing results of tensile specimens with different material and printing direction combinations (from left to right: PLA horizontal, PLA vertical, TPU vertical, TPU horizontal, PLA/TPU vertical, and PLA/TPU horizontal).
Sustainability 18 03786 g006
Figure 7. Engineering stress–strain curves from tensile tests: (a) vertical printing direction and (b) horizontal printing direction (1,2 and 3 are replicate test groups).
Sustainability 18 03786 g007
Figure 8. Fracture morphologies of tensile test specimens with different material and printing direction combinations.
Sustainability 18 03786 g008
Figure 9. Difference between landscape and portrait printing.
Sustainability 18 03786 g009
Figure 10. Comparative environmental impact assessment of horizontally and vertically printed PLA specimens across multiple categories.
Sustainability 18 03786 g010
Figure 11. Comparative environmental impact assessment of horizontally and vertically printed TPU specimens across multiple categories.
Sustainability 18 03786 g011
Figure 12. Comparative environmental impact assessment of laterally and vertically printed composite (PLA/TPU) materials across multiple categories.
Sustainability 18 03786 g012
Figure 13. Comparative environmental impacts of horizontally printed PLA, TPU, and PLA/TPU composite specimens across categories.
Sustainability 18 03786 g013
Figure 14. Comparative environmental impacts of vertically printed PLA, TPU, and PLA/TPU composite specimens across categories.
Sustainability 18 03786 g014
Table 1. Three-dimensional-printing experimental materials technical data sheet.
ParameterTest Method Bambu Lab PLA Bambu Lab TPU
DensityISO 1183 [25]1.31 g/cm31.26 g/cm3
Melting TemperatureISO 11357 [26]165 °CN/A
Vicat Softening TemperatureISO 306 [27], GB/T 1633 [28]63 °CN/A
Glass Transition TemperatureISO 11357 61 °CN/A
Heat Deflection TemperatureISO 75 (0.45 MPa) [29]61 °CN/A
Shore HardnessISO 7619 [30]N/A68D
Tensile Strength (XY)ISO 527 [31], GB/T 1040 [32]30 ± 5 MPa22.4 ± 0.6 MPa
Elongation at BreakISO 527, GB/T 104014.8 ± 4.2%>650%
Flexural StrengthISO 178 [33], GB/T 9341 [34]63 ± 4 MPaN/A
Flexural ModulusISO 178, GB/T 93411960 ± 150 MPaN/A
Notched Impact StrengthISO 179 [35], GB/T 1043 [36]29.8 ± 3.1 kJ/m2No Break
Table 2. Three-dimensional-printing basic parameter settings.
ParameterValue
First-layer height0.20 mm
Layer height0.20 mm
Extrusion line width0.42 mm
First-layer print speed100 mm/s
Print speed200 mm/s
Brim width15 mm
Table 3. Three-dimensional-printer print speed parameter table.
ParameterValue
First layer speed50 mm/s
First layer infill speed105 mm/s
Outer wall speed200 mm/s
Inner wall speed300 mm/s
Sparse infill speed270 mm/s
Internal solid infill speed250 mm/s
Top surface speed200 mm/s
Bridging speed50 mm/s
Travel speed700 mm/s
General printing acceleration6000 mm/s2
First layer acceleration500 mm/s2
Outer wall acceleration5000 mm/s2
Table 4. Three-dimensional-printing material parameter settings.
ParameterPLATPU
Nozzle temperature190–240 °C220–240 °C
Density1.32 g/cm31.26 g/cm3
Build platform temperature65 °C65 °C
Purge length (material wipe)10 mm10 mm
Softening temperature45 °C30 °C
Table 5. Parameter settings table.
ParameterValue
Nozzle diameter0.4 mm
Wall count2
Infill/Wall overlap15%
Infill direction45°
Bridging direction
Sparse infill threshold area15 mm2
Top surface patternMonotonic Line
Top shell layers5
Top shell thickness1 mm
Bottom surface patternMonotonic
Bottom shell layers3
Internal solid infill patternRectilinear
Seam positionAligned
Scarf angle threshold155°
Scarf steps10
Table 6. PLA/TPU-blend vertical printing material parameter statistical table.
MaterialsModulesSupportFlushedTowerTotal
PLA1.89 g0.72 g73.31 g21.70 g97.62 g
TPU1.45 g0.64 g90.25 g14.87 g107.22 g
Total3.341.36 g163.56 g36.57 g204.84 g
Number of Material Changes399 times
Print Duration13 h 29 min
Table 7. PLA/TPU-blend horizontal printing material parameter statistical table.
MaterialsModulesSupportFlushedTowerTotal
PLA2.24 g0.26 g18.03 g5.75 g26.28 g
TPU1.42 g0.17 g22.13 g3.73 g27.44 g
Total3.660.43 g40.16 g9.48 g53.72 g
Number of Material Changes98 times
Print Duration3 h 30 min
Table 8. Tensile test results under various stretching conditions.
Print Direction SampleTensile Strength-1 (MPa)Tensile Strength-2 (MPa)Tensile Strength-3 (MPa)Fracture Strain-1 (%)Fracture Strain-2 (%)Fracture Strain-3 (%)
T-Vertical4.40782.83784.17393.58412.53113.0199
P-Vertical11.597710.499110.97221.42401.23701.3672
TP-Vertical4.71842.91803.867570.82360.54420.7025
T-Horizontal21.602721.957122.4632750.2679730.1673713.3792
P-Horizontal30.355030.855331.1027133.8663140.5664148.4470
TP-Horizontal23.278124.078224.9852616.2675622.9674635.3478
Table 9. PLA system parameters and energy flows.
StageI/OParametersQuantityUnit
Raw Material AcquisitionInputLactic acid225g
InputTin compounds0.038g
InputFactory water3000g
InputTransportation180kg km
OutputCadmium5.7ng
OutputBorate208ng
OutputSulfate5.74mg
Production StageInputElectricity2MJ
InputNatural gas0.17m3
OutputCarbon dioxide6.36g
Usage phaseInputElectricity0.37MJ
InputAdditive Manufacturing (Craft)150g
OutputCarbon dioxide3.88g
OutputAcrylonitrile399pg
Table 10. TPU system parameters and energy flows.
StageI/OParametersQuantityUnit
Raw Material AcquisitionInputPolyester polyol105g
InputDiisocyanate45g
InputTransportation120kg km
OutputPotassium394pg
OutputCaprolactam384pg
Outputcobalt299pg
Production StageInputElectricity3.5kWh
OutputCarbon dioxide39.3g
Usage phaseInputElectricity0.38MJ
InputAdditive Manufacturing (Craft)150g
OutputHeat waste5.14J
OutputSulfur dioxide581mg
Disclaimer/Publisher’s Note: The statements, opinions and data contained in all publications are solely those of the individual author(s) and contributor(s) and not of MDPI and/or the editor(s). MDPI and/or the editor(s) disclaim responsibility for any injury to people or property resulting from any ideas, methods, instructions or products referred to in the content.